
Do Irrigation Water Requirements Affect Crops’ Economic Values?


Abstract
1. Introduction
2. Materials and Methods
2.1. Literature
2.2. Data
2.3. Research Scenario
2.4. Methodology
3. Results
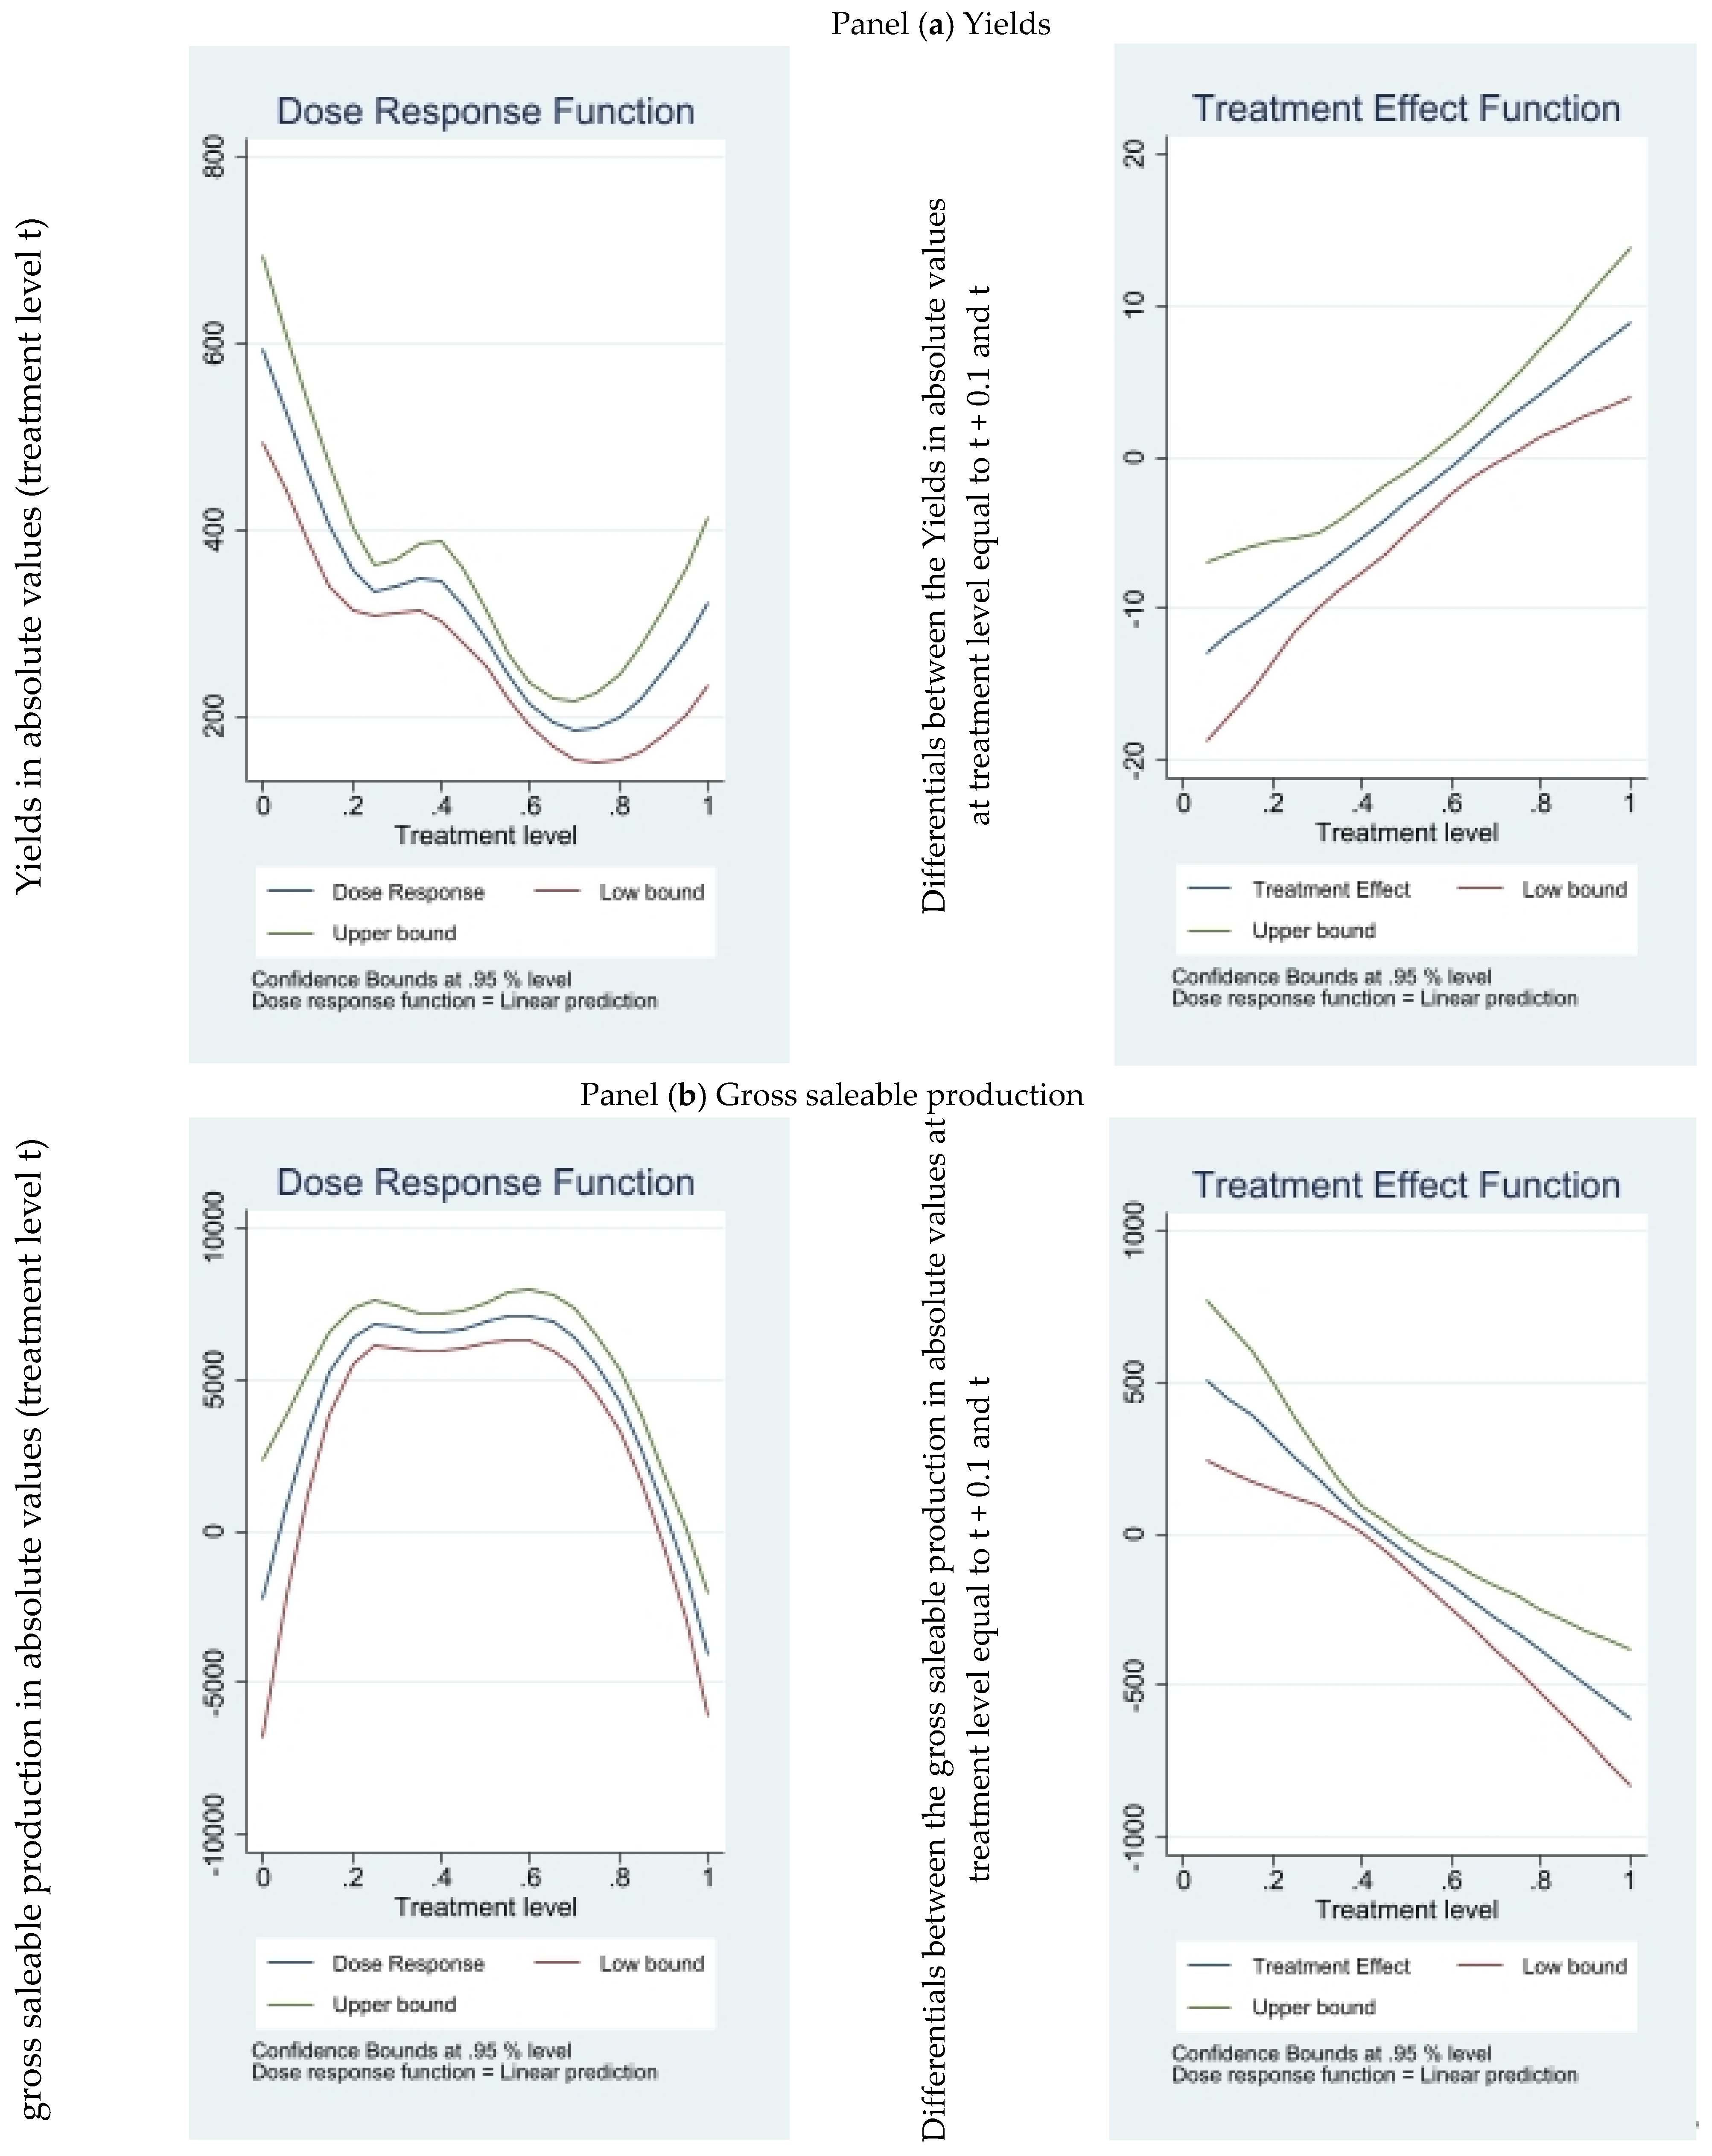
3.1. Main Results
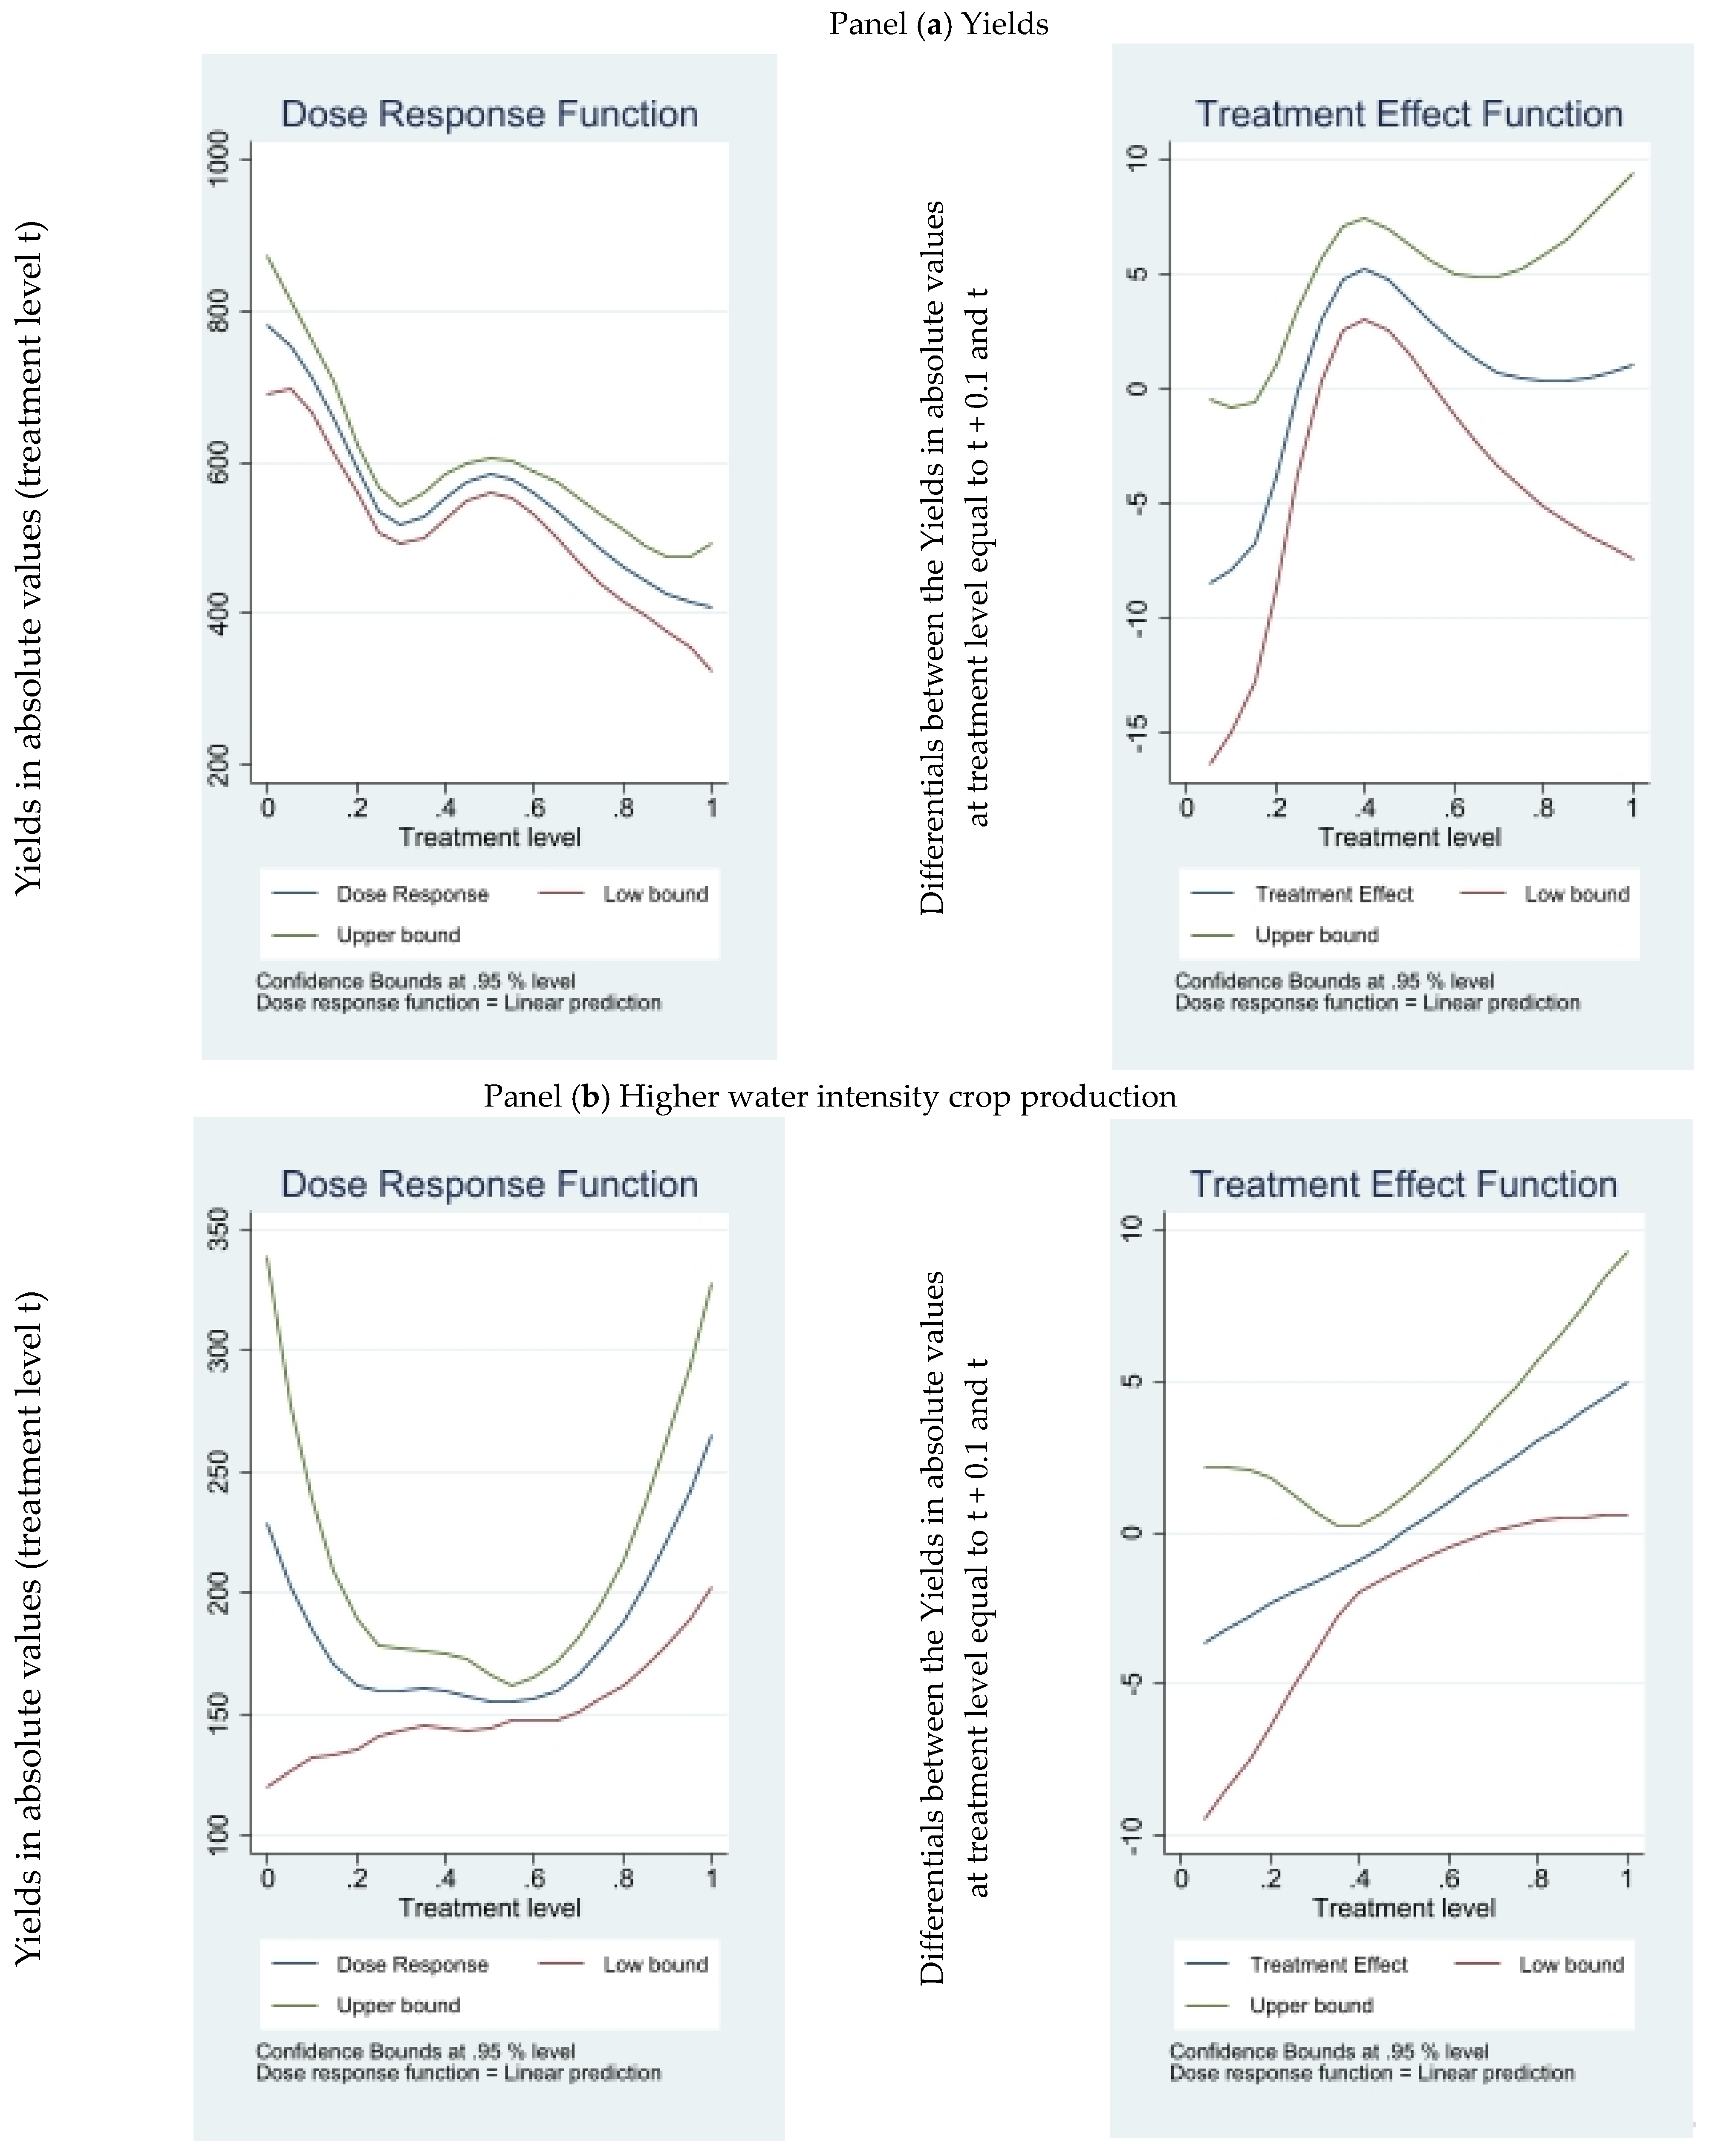
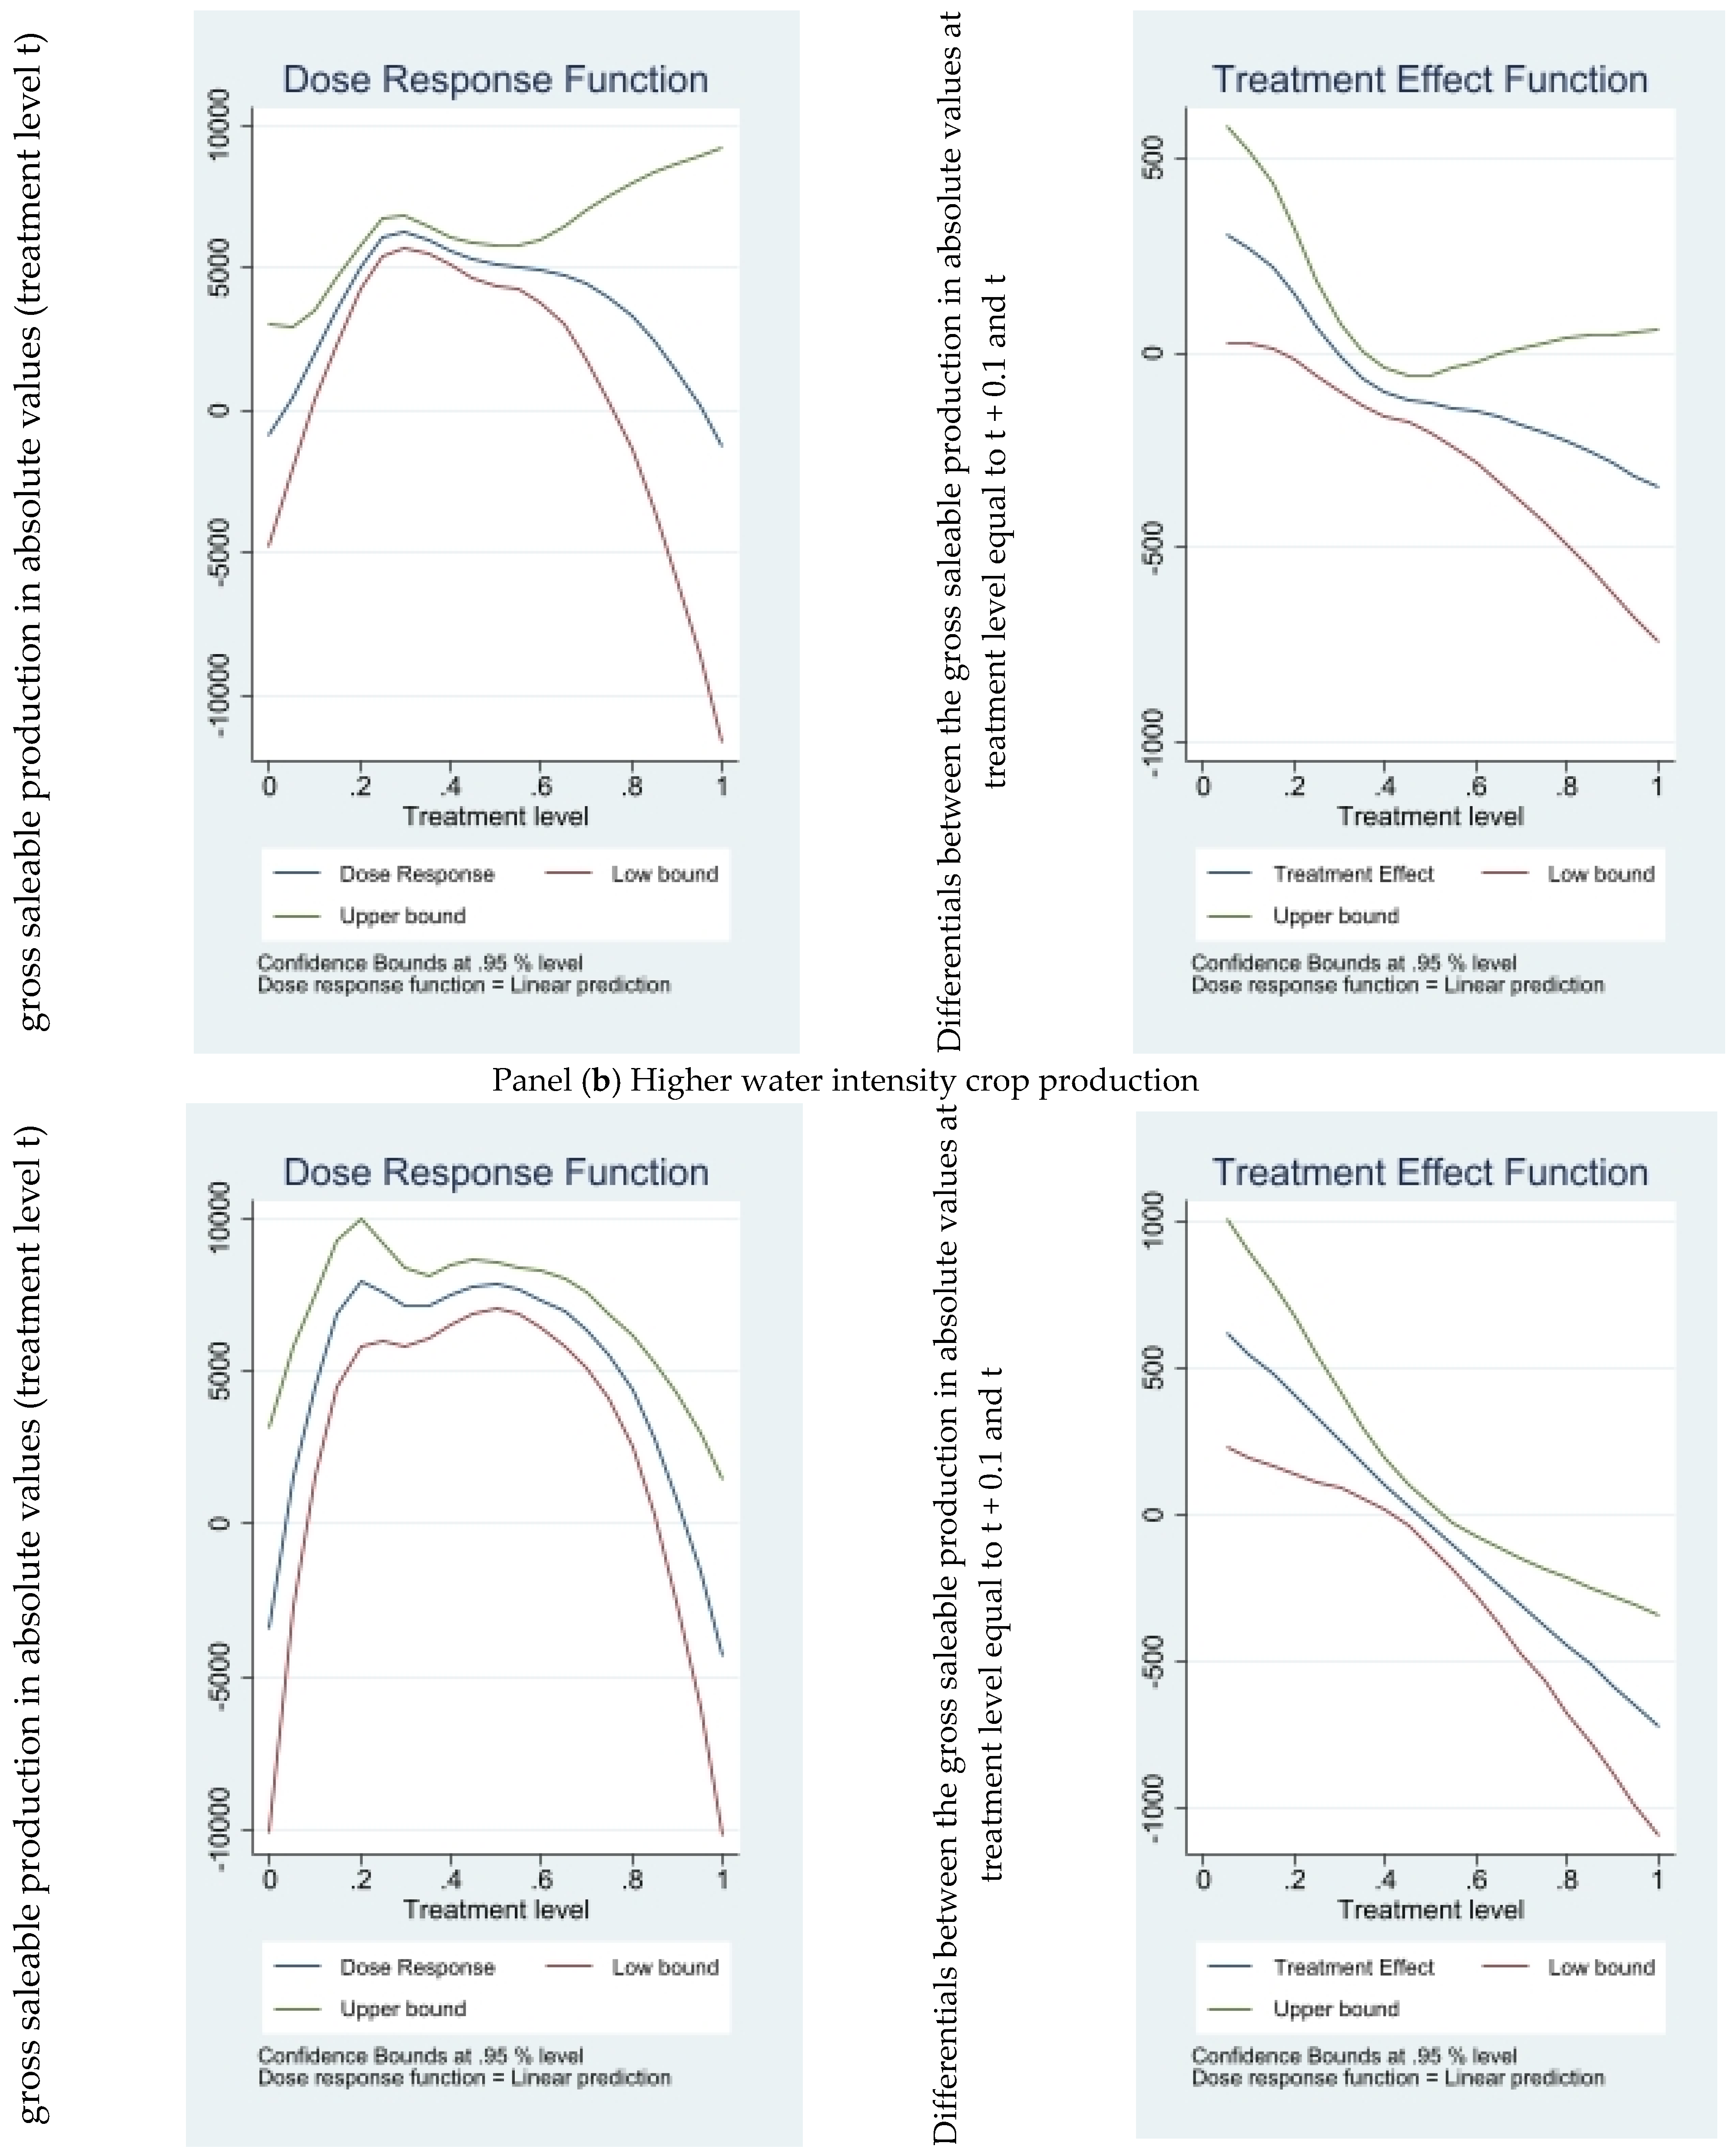
3.2. Heterogeneity Analysis
4. Discussion and Conclusions
- (i)
- a causal effect of irrigation water on economic value, with positive impacts observed for high levels of water irrigation in terms of crop yields (RQ1)
- (ii)
- in terms of yields, it is positive only for a high level of water irrigation, while gross saleable production reacts sharply and positively to a low level of treatment and negatively for a higher level of treatment; in the middle, it remains overall stable, but reaches different values depending on the sample (RQ2)
- (iii)
- the effect is mediated by the specific water requirements of different crops (RQ3).
Author Contributions
Funding
Data Availability Statement
Conflicts of Interest
Appendix A

| Crops | Actinidia, Alfalfa, Corn, Grape, Green bean, Melon, Onion, Peach, Pear, Potato, Soy, Sugar beet, Tomato (Processing) | ||||||||
|---|---|---|---|---|---|---|---|---|---|
| NUTS3-Provinces | ITH51-Piacenza (PC), ITH52-Parma (PR), ITH53-Reggio Emilia (RE), ITH54-Modena (MO), ITH55-Bologna (BO), ITH56-Ferrara (FE), ITH57-Ravenna (RA), ITH58-Forlì-Cesena (FC) | ||||||||
| BO | FC | FE | MO | PC | PR | RA | RE | Total | |
| Actinidia | 10 | 11 | 6 | 0 | 0 | 0 | 11 | 0 | 38 |
| Alfalfa | 3 | 2 | 0 | 6 | 8 | 7 | 1 | 9 | 36 |
| Corn | 11 | 0 | 11 | 11 | 9 | 9 | 11 | 10 | 72 |
| Grape | 11 | 11 | 0 | 11 | 2 | 5 | 11 | 8 | 59 |
| Green bean | 0 | 8 | 0 | 0 | 6 | 0 | 10 | 0 | 24 |
| Melon | 8 | 0 | 11 | 5 | 0 | 0 | 0 | 0 | 24 |
| Onion | 11 | 8 | 0 | 0 | 9 | 0 | 10 | 0 | 38 |
| Peach | 11 | 11 | 11 | 9 | 0 | 0 | 11 | 0 | 53 |
| Pear | 11 | 0 | 11 | 10 | 0 | 0 | 11 | 7 | 50 |
| Potato | 11 | 9 | 7 | 0 | 0 | 0 | 11 | 0 | 38 |
| Soy | 7 | 0 | 8 | 8 | 8 | 0 | 7 | 7 | 45 |
| Sugar beet | 11 | 7 | 11 | 9 | 6 | 8 | 11 | 9 | 72 |
| Tomato (Processing) | 8 | 5 | 10 | 0 | 11 | 9 | 11 | 6 | 60 |
| Total | 113 | 72 | 86 | 69 | 59 | 38 | 116 | 56 | 609 |
| Source | Variable | Definition |
|---|---|---|
| Fadn | Economic Dimension of Farms | Average economic dimension of farms, by year and at NUTS3 level. Values from 1 (small) to 5 (big) |
| Gross Saleable Production | Gross saleable production for irrigated crops (EUR), by year and crop, at NUTS3 level | |
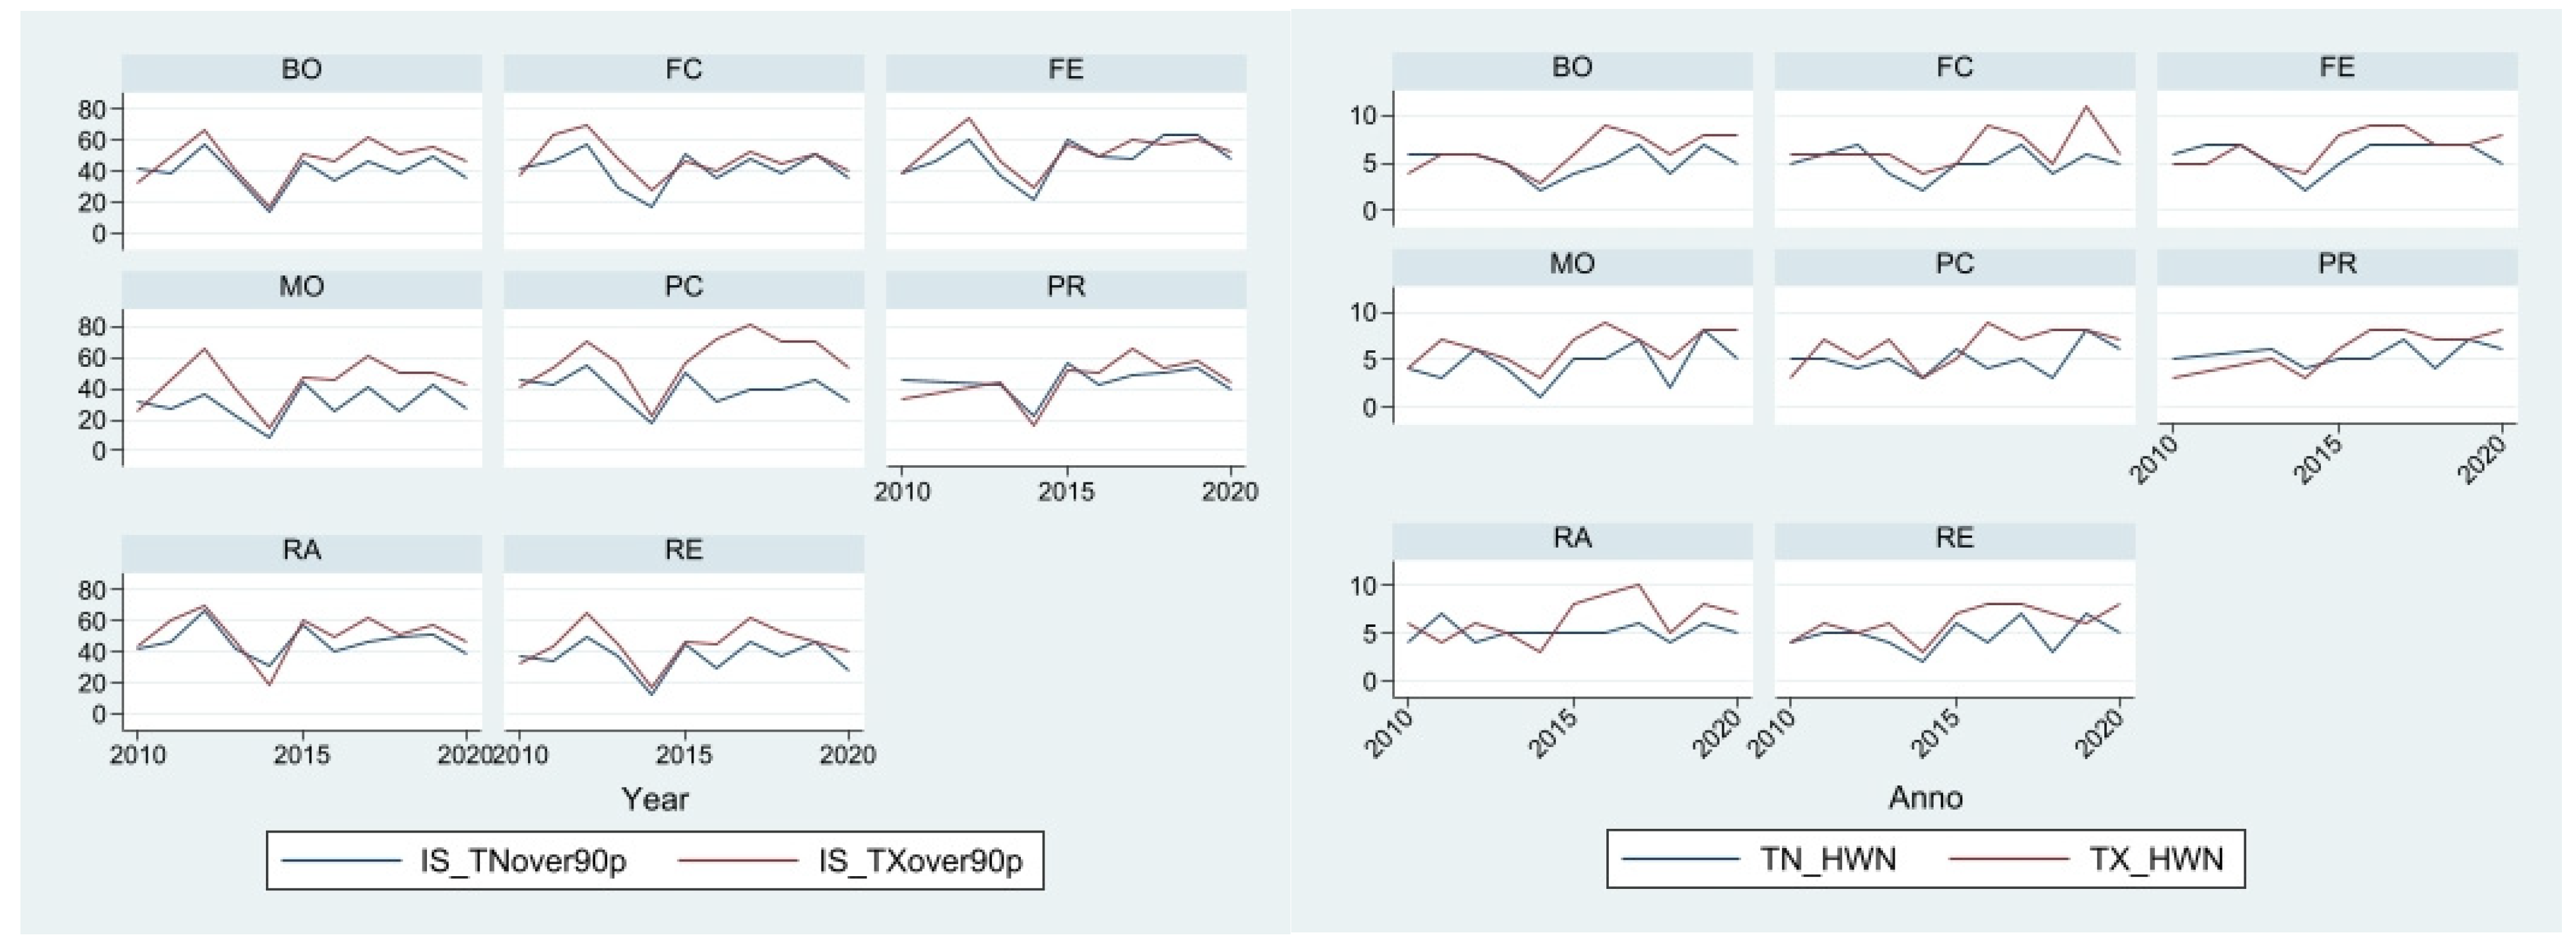
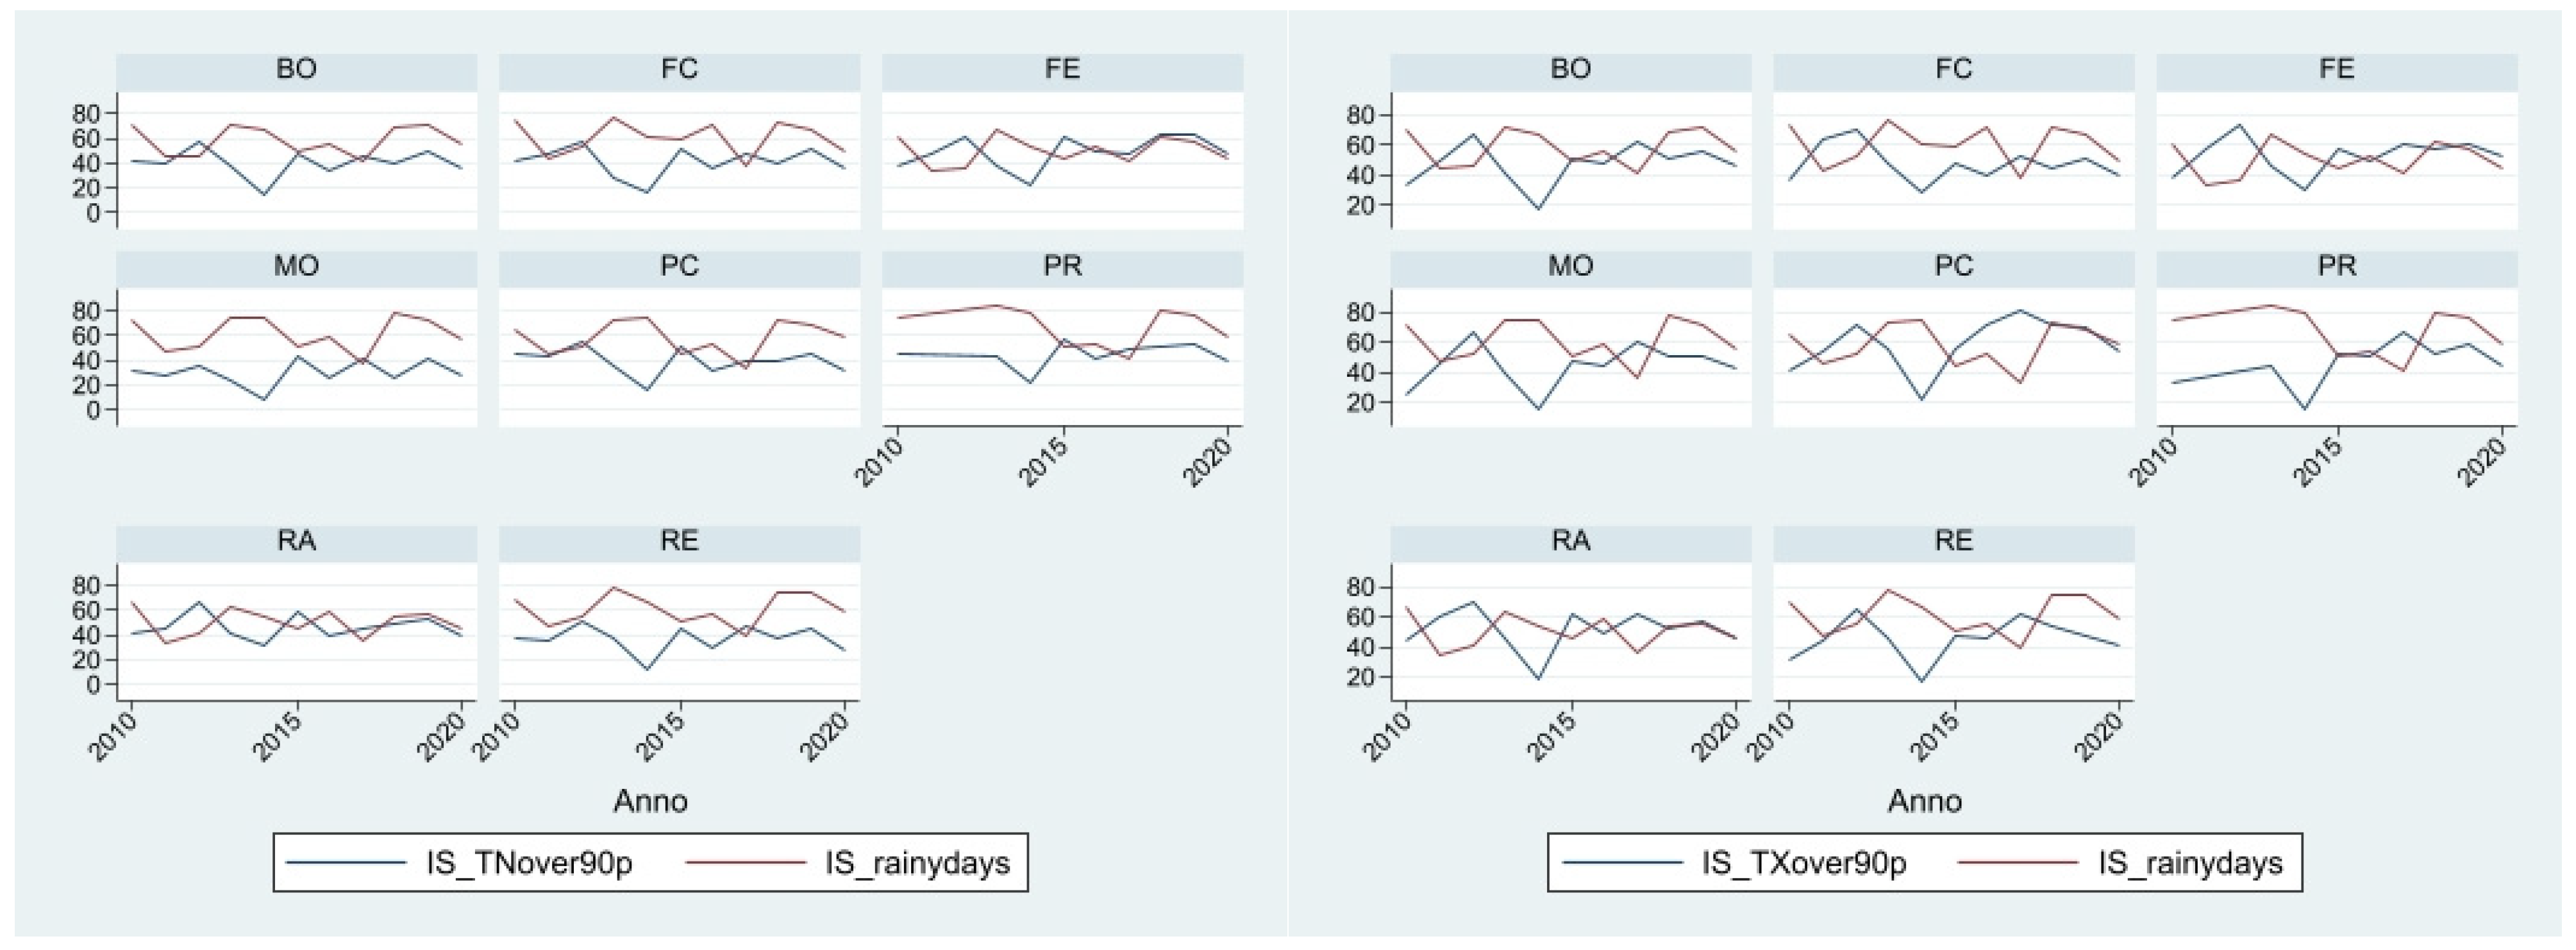
| Arpae | IS_TNover90p | Number of days during IS in which the minimum temperature went above the 90th percentile of its 1961–2020 distribution. |
| IS_TXover90p | Number of days during IS in which the maximum temperature went above the 90th percentile of its 1961–2020 distribution. | |
| TN_HWN | Number of minimum temperature heatwaves during the IS. | |
| TX_HWN | Number of minimum temperature heatwaves during the IS. | |
| IS_rainydays | Number of days with effective rainfall during the IS. | |
| IS_Heavyrainydays | Number of days with heavy rainfall during the IS. | |
| Cer | Yields | Yields of irrigated crops (quintals/ha), by year and crop, at NUTS3 level. |
| Acreage | Acreage of irrigated crops (ha), by year and crop, at NUTS3 level. | |
| Irriframe | IWR | Average irrigation water requirement over the exact period of its irrigation (mm/ha), by year and crop, at NUTS3 level. |
| Eurostat | Percapita_GDP | Per capita Gross Domestic Product at current market prices (EUR), by year, at NUTS3 level. |
| GPS 1-Full Sample | ||||
|---|---|---|---|---|
| IYields (Quintals/Ha) | Gross Saleable Production (EUR /Ha) | |||
| Variable | Coefficients | SE | Coefficients | SE |
| WD | −865.569 | 599.9565 | 57,081.63 *** | 14,732.31 |
| WD (^2) | 656.8621 | 525.6152 | −58,377.29 *** | 13,250.4 |
| GPS | −175.9433 | 190.391 | −3111.61 | 4472.597 |
| GPS^2 | 285.0726 | 153.6744 | −69.52433 | 3595.859 |
| WD *GPS | −154.2393 | 233.6022 | −5216.351 | 5469.356 |
| Observations | 609 | 588 | ||
| GPS2 Lower (a) and Higher (b) Water Intensity Crops | ||||
| A-IYields (Quintals/Ha) | B-IYields (Quintals/Ha) | |||
| Variable | Coefficients | SE | Coefficients | SE |
| WD | −894.4823 * | 513.8982 | −412.9934 | 341.7621 |
| WD (^2) | 471.4249 | 472.1137 | 454.8758 | 288.6213 |
| GPS | −356.091 ** | 167.6097 | 52.81079 | 101.4106 |
| GPS^2 | −29.08193 | 133.5734 | −2.967697 | 78.13132 |
| WD *GPS | 1059.992 *** | 224.9905 | −46.00546 | 116.1592 |
| Observations | 214 | 395 | ||
| GPS3- Lower (a) and Higher (b) Water Intensity Crops | ||||
| A-Gross Saleable Production (EUR/Ha) | B-Gross Saleable Production (EUR/Ha) | |||
| Variable | Coefficients | SE | Coefficients | SE |
| WD | 34,052.73 ** | 14,480.93 | 69,529.67 *** | 22,686.64 |
| WD (^2) | −33,620.69 ** | 13,692.91 | −70,070.87 *** | 19,574.33 |
| GPS | 6062.368 | 4580.525 | −13,683.88 ** | 6411.992 |
| GPS^2 | −697.1769 | 3628.13 | 7233.836 | 4917.609 |
| WD *GPS | −17,208.59 *** | 6118.141 | −2564.918 | 7392.32 |
| Observations | 210 | 378 | ||
References
- Di Paola, A.; Di Giuseppe, E.; Pasqui, M. Climate Stressors’ Interplays Modulating Interannual Olive and Grapevine Yields in Italy: A Composite Index Approach. In Proceedings of the 17th Plinius Conference on Mediterranean Risks, Frascati, Italy, 18–21 October 2022. [Google Scholar]
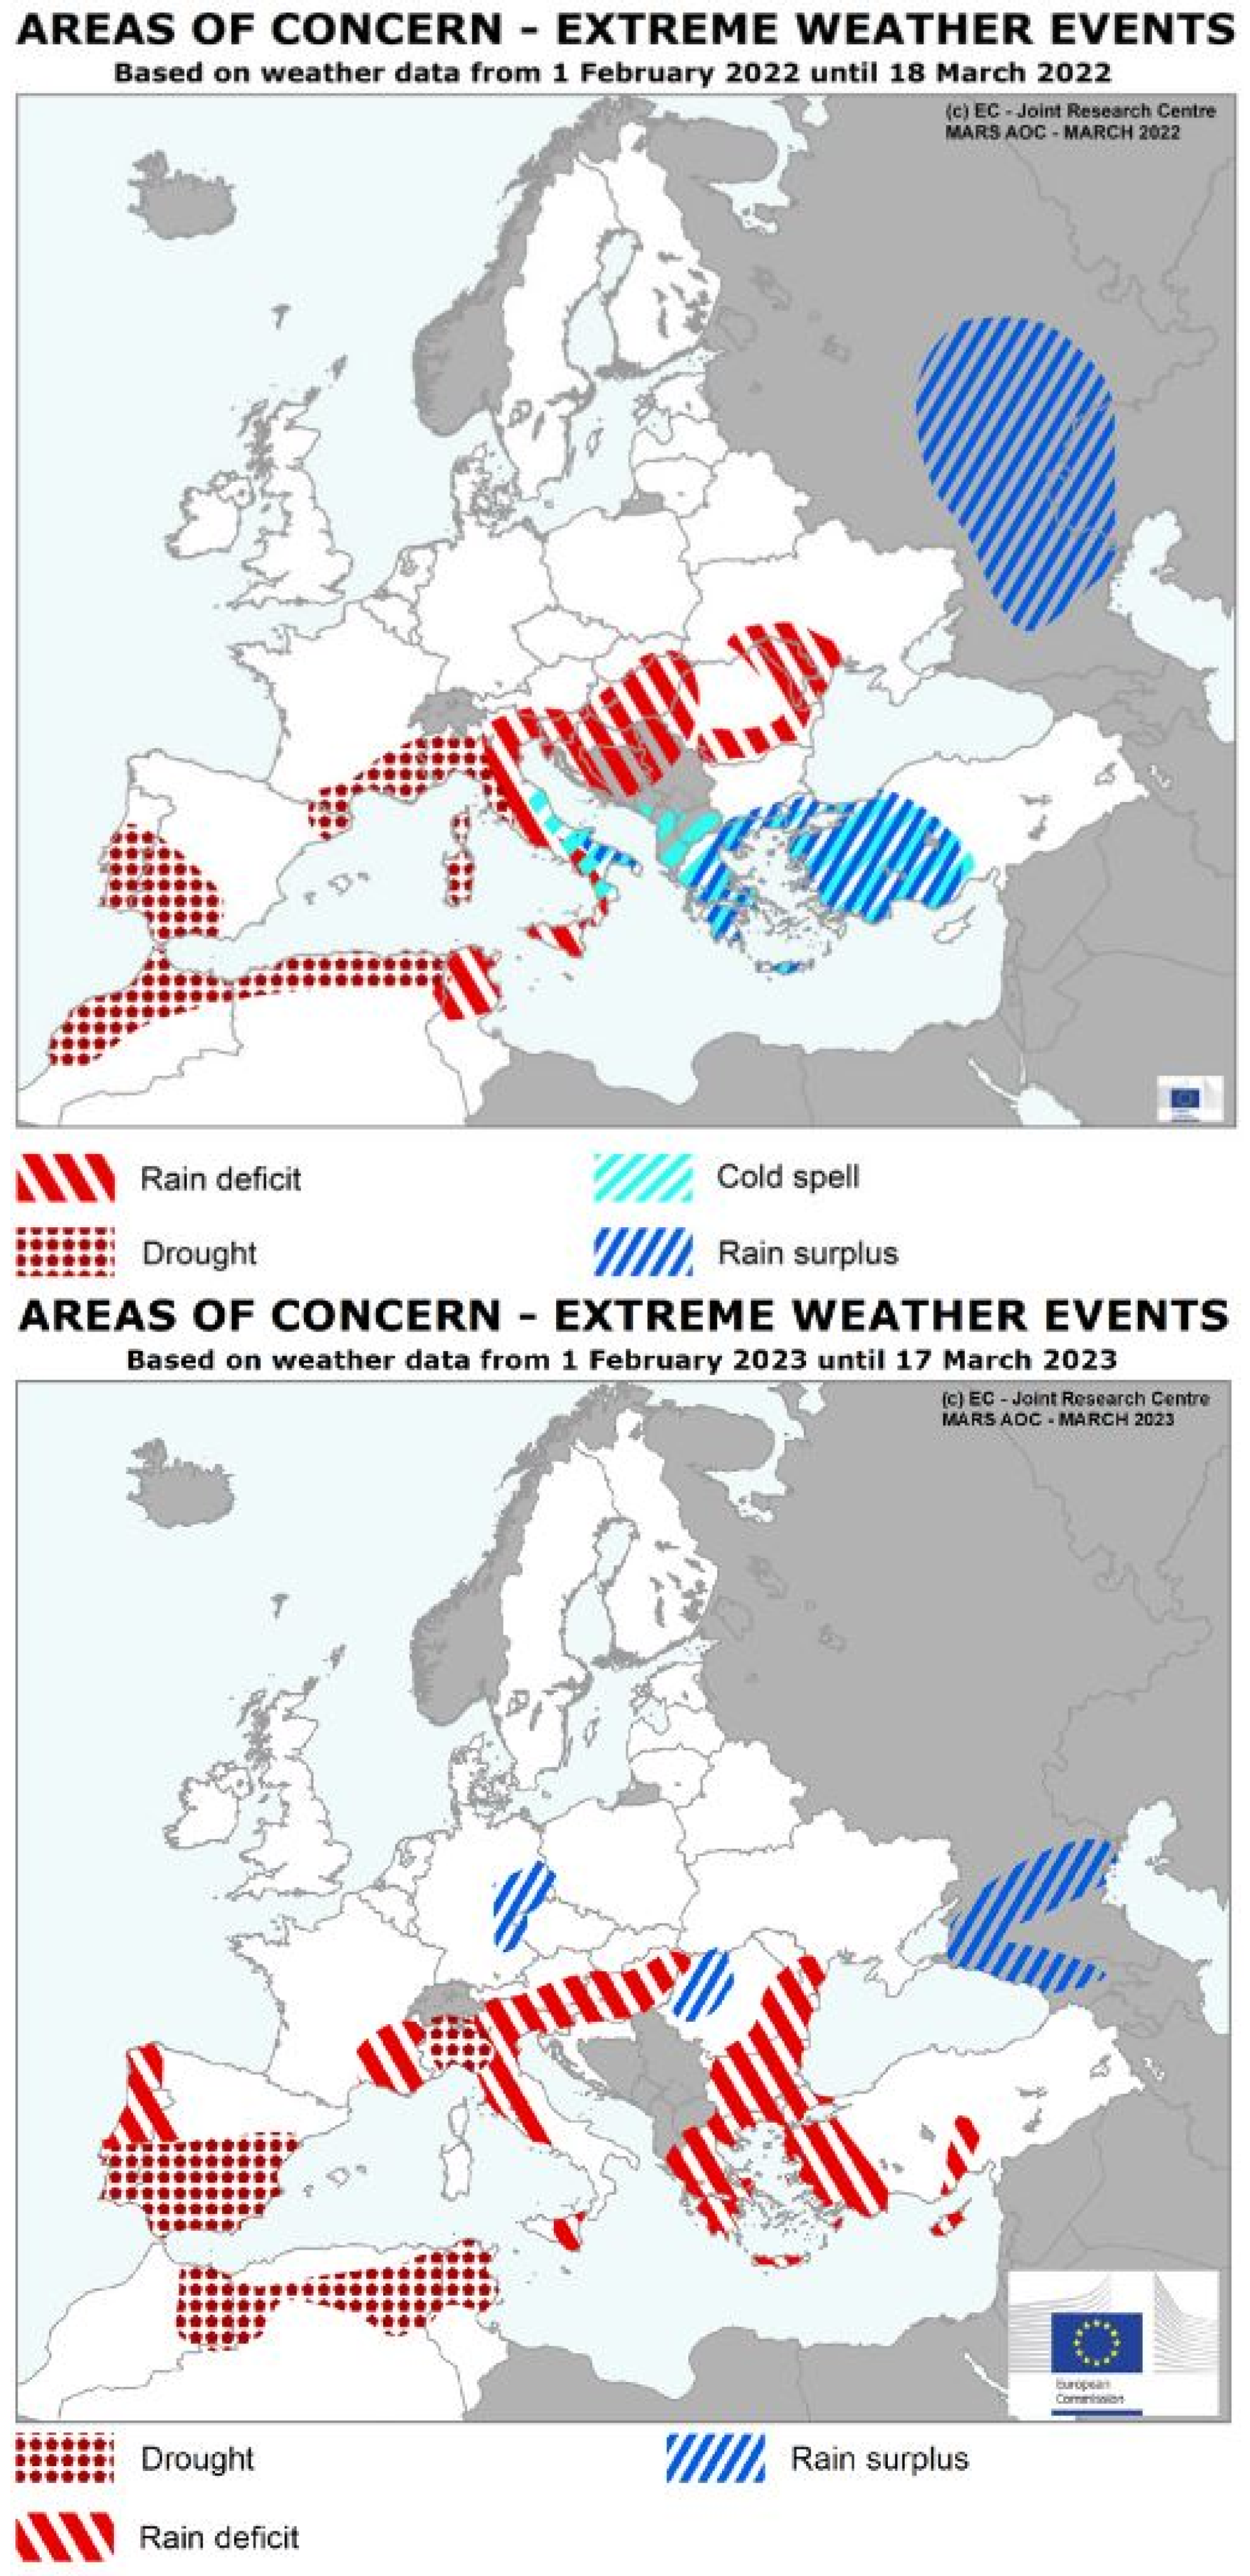
- European Commission. Joint Research Centre. JRC MARS Bulletin: Crop Monitoring in Europe. Vol. 30 No 3, 21 March 2022.; Publications Office: Luxembourg, 2022. [Google Scholar]
- European Commission. Joint Research Centre. JRC MARS Bulletin: Crop Monitoring in Europe. Vol. 31 No 3, March 2023.; Publications Office: Luxembourg, 2023. [Google Scholar]
- Pronti, A.; Auci, S.; Di Paola, A.; Mazzanti, M. What Are the Factors Driving the Adoption of Sustainable Irrigation Technologies in Italy? In Proceedings of the “Tomorrow’s Food: Diet transition and its implications on health and the environment”, Pistoia, Italy, 13 June 2019. [Google Scholar]
- Water Scarcity Conditions in Europe (Water Exploitation Index plus)-8th EAP; European Environment Agency: Copenhagen, Denmark, 2019.
- Eurostat. Agri-Environmental Indicator-Irrigation. 2016. Available online: https://ec.europa.eu/eurostat/statistics-explained/index.php?title=Agri-environmental_indicator_-_irrigation#:~:text=In%202016%2C%208.9%20%25%20of%20utilised,and%20irrigated%20areas%20by%206.1%20%25. (accessed on 19 October 2023).
- European Commission. Joint Research Centre. JRC MARS Bulletin: Crop Monitoring in Europe. Vol. 30, No 7, July 2022.; Publications Office: Luxembourg, 2022. [Google Scholar]
- European Commission. Joint Research Centre. JRC MARS Bulletin: Crop Monitoring in Europe. Vol. 31 No 7, July 2023.; Publications Office: Luxembourg, 2023. [Google Scholar]
- Van Der Velde, M.; Wriedt, G.; Bouraoui, F. Estimating Irrigation Use and Effects on Maize Yield during the 2003 Heatwave in France. Agric. Ecosyst. Environ. 2010, 135, 90–97. [Google Scholar] [CrossRef]
- Martínez-Lüscher, J.; Chen, C.C.L.; Brillante, L.; Kurtural, S.K. Mitigating Heat Wave and Exposure Damage to “Cabernet Sauvignon” Wine Grape With Partial Shading Under Two Irrigation Amounts. Front. Plant Sci. 2020, 11, 579192. [Google Scholar] [CrossRef] [PubMed]
- Schlenker, W.; Hanemann, W.M.; Fisher, A.C. Water Availability, Degree Days, and the Potential Impact of Climate Change on Irrigated Agriculture in California. Clim. Chang. 2007, 81, 19–38. [Google Scholar] [CrossRef]
- Villa-Cox, G.; Cavazza, F.; Jordan, C.; Arias-Hidalgo, M.; Herrera, P.; Espinel, R.; Viaggi, D.; Speelman, S. Understanding Constraints on Private Irrigation Adoption Decisions under Uncertainty in Data Constrained Settings: A Novel Empirical Approach Tested on Ecuadorian Cocoa Cultivations. Agric. Econ. 2021, 52, 985–999. [Google Scholar] [CrossRef]
- Zucaro, R. Atlante Nazionale Dell’irrigazione; INEA: Roma, Italy, 2011; ISBN 978-88-8145-228-6. [Google Scholar]
- Manganiello, V.; Banterle, A.; Canali, G.; Gios, G.; Branca, G.; Galeotti, S.; De Filippis, F.; Zucaro, R. Economic Characterization of Irrigated and Livestock Farms in The Po River Basin District. Econ. Agro-Aliment. 2022, 23, 1–24. [Google Scholar] [CrossRef]
- Ruberto, M.; Catini, A.; Lai, M.; Manganiello, V. The Impact of Irrigation on Agricultural Productivity: The Case of FADN Farms in Veneto. Econ. Agro-Aliment. 2022, 23, 1–20. [Google Scholar] [CrossRef]
- Hirano, K.; Imbens, G.W. The Propensity Score with Continuous Treatments. In Wiley Series in Probability and Statistics; Gelman, A., Meng, X., Eds.; Wiley: Hoboken, NJ, USA, 2004; pp. 73–84. ISBN 978-0-470-09043-5. [Google Scholar]
- Negri, D.H.; Gollehon, N.R.; Aillery, M.P. The Effects of Climatic Variability on US Irrigation Adoption. Clim. Change 2005, 69, 299–323. [Google Scholar] [CrossRef]
- Cunha, D.A.D.; Coelho, A.B.; Féres, J.G.; Braga, M.J. Effects of Climate Change on Irrigation Adoption in Brazil. Acta Sci. Agron. 2014, 36, 1–9. [Google Scholar] [CrossRef][Green Version]
- Seo, S.N. An Analysis of Public Adaptation to Climate Change Using Agricultural Water Schemes in South America. Ecol. Econ. 2011, 70, 825–834. [Google Scholar] [CrossRef]
- Tack, J.; Barkley, A.; Hendricks, N. Irrigation Offsets Wheat Yield Reductions from Warming Temperatures. Environ. Res. Lett. 2017, 12, 114027. [Google Scholar] [CrossRef]
- Zaveri, E.; Lobell, D.B. The Role of Irrigation in Changing Wheat Yields and Heat Sensitivity in India. Nat. Commun. 2019, 10, 4144. [Google Scholar] [CrossRef] [PubMed]
- Li, X.; Troy, T.J. Changes in Rainfed and Irrigated Crop Yield Response to Climate in the Western US. Environ. Res. Lett. 2018, 13, 064031. [Google Scholar] [CrossRef]
- Determining the Economic Value of Water: Concepts and Methods, 2nd ed.; Young, R.A., Ed.; RFF Press: New York, NY, USA, 2014; ISBN 978-0-415-83846-7. [Google Scholar]
- Mesa-Jurado, M.A.; Martin-Ortega, J.; Ruto, E.; Berbel, J. The Economic Value of Guaranteed Water Supply for Irrigation under Scarcity Conditions. Agric. Water Manag. 2012, 113, 10–18. [Google Scholar] [CrossRef]
- Faux, J.; Perry, G.M. Estimating Irrigation Water Value Using Hedonic Price Analysis: A Case Study in Malheur County, Oregon. Land Econ. 1999, 75, 440. [Google Scholar] [CrossRef]
- Antolini, G.; Auteri, L.; Pavan, V.; Tomei, F.; Tomozeiu, R.; Marletto, V. A Daily High-Resolution Gridded Climatic Data Set for Emilia-Romagna, Italy, during 1961-2010: EMILIA-ROMAGNA DAILY GRIDDED CLIMATIC DATA SET. Int. J. Climatol. 2016, 36, 1970–1986. [Google Scholar] [CrossRef]
- Perkins, S.E.; Alexander, L.V. On the Measurement of Heat Waves. J. Clim. 2013, 26, 4500–4517. [Google Scholar] [CrossRef]
- Giannerini, G.; Genovesi, R. The Water Saving with Irriframe Platform for Thousands of Italian Farms. J. Agric. Inform. 2015, 6. [Google Scholar] [CrossRef]
- Cavazza, F.; Galioto, F.; Raggi, M.; Viaggi, D. Ambiguity, Familiarity and Learning Behavior in the Adoption of ICT for Irrigation Management. Water 2022, 14, 3760. [Google Scholar] [CrossRef]
- Rosenbaum, P.R.; Rubin, D.B. The Central Role of the Propensity Score in Observational Studies for Causal Effects. Biometrika 1983, 70, 41–55. [Google Scholar] [CrossRef]
- Stuart, E.A. Matching Methods for Causal Inference: A Review and a Look Forward. Stat. Sci. 2010, 25. [Google Scholar] [CrossRef]
- De Simone, E.; Giua, M.; Vaquero-Piñeiro, C. Eat, Visit, Love. World Heritage List and Geographical Indications: Joint Acknowledgement and Consistency as Drivers of Tourism Attractiveness in Italy. Tour. Econ. 2023. [Google Scholar] [CrossRef]
- Crescenzi, R.; De Filippis, F.; Giua, M.; Salvatici, L.; Vaquero-Piñeiro, C. From Local to Global, and Return: Geographical Indications and FDI in Europe. Pap. Reg. Sci. 2023, 102, 985–1006. [Google Scholar] [CrossRef]
- Imbens, G.W. Nonparametric Estimation of Average Treatment Effects Under Exogeneity: A Review. Rev. Econ. Stat. 2004, 86, 4–29. [Google Scholar] [CrossRef]
- Bia, M.; Mattei, A. A Stata Package for the Estimation of the Dose-Response Function through Adjustment for the Generalized Propensity Score. Stata J. Promot. Commun. Stat. Stata 2008, 8, 354–373. [Google Scholar] [CrossRef]
- Tsur, Y. Economic Aspects of Irrigation Water Pricing. Can. Water Resour. J. 2005, 30, 31–46. [Google Scholar] [CrossRef]
- Zucaro, R. Condizionalità ex ante per le Risorse Idriche: Opportunità e Vincoli per il Mondo Agricolo; INEA, 2014; Available online: https://arts.units.it/retrieve/handle/11368/2836237/29019/Valore_irrigazione.pdf (accessed on 19 October 2023).
- Rising, J.; Devineni, N. Crop Switching Reduces Agricultural Losses from Climate Change in the United States by Half under RCP 8.5. Nat. Commun. 2020, 11, 4991. [Google Scholar] [CrossRef]
- Cervantes-Gaxiola, M.E.; Sosa-Niebla, E.F.; Hernández-Calderón, O.M.; Ponce-Ortega, J.M.; Ortiz-del-Castillo, J.R.; Rubio-Castro, E. Optimal Crop Allocation Including Market Trends and Water Availability. Eur. J. Oper. Res. 2020, 285, 728–739. [Google Scholar] [CrossRef]
- Jaramillo, M.; Restrepo, I. Wastewater Reuse in Agriculture: A Review about Its Limitations and Benefits. Sustainability 2017, 9, 1734. [Google Scholar] [CrossRef]
- Al-Hazmi, H.E.; Mohammadi, A.; Hejna, A.; Majtacz, J.; Esmaeili, A.; Habibzadeh, S.; Saeb, M.R.; Badawi, M.; Lima, E.C.; Mąkinia, J. Wastewater Reuse in Agriculture: Prospects and Challenges. Environ. Res. 2023, 236, 116711. [Google Scholar] [CrossRef]


| Source | Variable | Obs | Mean | Std. Dev. | Min | Max |
|---|---|---|---|---|---|---|
| FADN | Economic Dimension of Farms | 609 | 3.289 | 0.329 | 2.327 | 4.389 |
| Gross Saleable Production (EUR) | 588 | 6427 | 4811 | 379.7 | 28,442 | |
| Arpae | IS_TNover90p (number of days) | 609 | 41.75 | 11.87 | 8 | 67 |
| IS_TXover90p (number of days) | 609 | 49.43 | 13.53 | 15 | 81 | |
| TN_HWN (number of heatwaves) | 609 | 5.156 | 1.457 | 1 | 8 | |
| TX_HWN (number of heatwaves) | 609 | 6.350 | 1.843 | 3 | 11 | |
| IS_rainydays (number of days) | 609 | 56.99 | 12.89 | 33 | 85 | |
| IS_Heavyrainydays (number of days) | 609 | 4.210 | 2.815 | 0 | 16 | |
| Cer-ISTAT | Yields (quintals/ha) | 609 | 301.6 | 214.6 | 22 | 850 |
| Acreage (ha) | 584 | 5919 | 10,055 | 32.96 | 133,905 | |
| Irriframe | IWR (mm/ha) | 609 | 33.95 | 12.48 | 8.048 | 74.47 |
| Eurostat | Percapita_GDP (million EUR) | 609 | 32,942 | 4476 | 23,972 | 42,403 |
| Lower Water Intensity Crops | |||
|---|---|---|---|
| Crop | Freq. | Percent | Cum. |
| Alfalfa | 13 | 6.070 | 6.070 |
| Melon | 1 | 0.470 | 6.540 |
| Onion | 36 | 16.82 | 23.36 |
| Potato | 32 | 14.95 | 38.32 |
| Sugar beet | 72 | 33.64 | 71.96 |
| Tomato (Processing) | 60 | 28.04 | 100 |
| Total | 214 | 100 | |
| Higher Water Intensity Crops | |||
| Actinidia | 38 | 9.620 | 9.620 |
| Alfalfa | 23 | 5.820 | 15.44 |
| Corn | 72 | 18.23 | 33.67 |
| Grapes | 59 | 14.94 | 48.61 |
| Green bean | 24 | 6.080 | 54.68 |
| Melon | 23 | 5.820 | 60.51 |
| Onion | 2 | 0.510 | 61.01 |
| Peach | 53 | 13.42 | 74.43 |
| Pear | 50 | 12.66 | 87.09 |
| Potato | 6 | 1.520 | 88.61 |
| Soy | 45 | 11.39 | 100 |
| Total | 395 | 100 | |
| Lower Water Intensity Crops | |||||
|---|---|---|---|---|---|
| Variable | Obs | Mean | Std. Dev. | Min | Max |
| Gross Saleable Production | 210 | 5280 | 3214 | 624.5 | 20,537 |
| IWR | 214 | 29.25 | 11.09 | 8.048 | 72.95 |
| Higher Water Intensity Crops | |||||
| Gross Saleable Production | 378 | 7065 | 5401 | 379.7 | 28,442 |
| IWR | 395 | 36.49 | 12.47 | 8.933 | 74.47 |
| Variable | Obs | Mean | Std. Dev. | Min | Max |
|---|---|---|---|---|---|
| A_Gross Saleable Production | 159 | 11,552 | 4293 | 6471 | 28,442 |
| H_Gross Saleable Production | 31 | 10,251 | 4141 | 6518 | 26,846 |
| A_IWR | 164 | 36.35 | 10.02 | 9.918 | 57.77 |
| H_IWR | 43 | 33.69 | 16.39 | 8.933 | 74.47 |
| A_Yields | 164 | 202.3 | 62.43 | 58 | 320 |
| H_Yields | 43 | 228.4 | 94.39 | 51.19 | 320 |
Disclaimer/Publisher’s Note: The statements, opinions and data contained in all publications are solely those of the individual author(s) and contributor(s) and not of MDPI and/or the editor(s). MDPI and/or the editor(s) disclaim responsibility for any injury to people or property resulting from any ideas, methods, instructions or products referred to in the content. |
© 2023 by the authors. Licensee MDPI, Basel, Switzerland. This article is an open access article distributed under the terms and conditions of the Creative Commons Attribution (CC BY) license (https://creativecommons.org/licenses/by/4.0/).
Share and Cite
Scatolini, P.; Vaquero-Piñeiro, C.; Cavazza, F.; Zucaro, R. Do Irrigation Water Requirements Affect Crops’ Economic Values? Water 2024, 16, 77. https://doi.org/10.3390/w16010077
Scatolini P, Vaquero-Piñeiro C, Cavazza F, Zucaro R. Do Irrigation Water Requirements Affect Crops’ Economic Values? Water. 2024; 16(1):77. https://doi.org/10.3390/w16010077
Chicago/Turabian StyleScatolini, Paolo, Cristina Vaquero-Piñeiro, Francesco Cavazza, and Raffaella Zucaro. 2024. "Do Irrigation Water Requirements Affect Crops’ Economic Values?" Water 16, no. 1: 77. https://doi.org/10.3390/w16010077
APA StyleScatolini, P., Vaquero-Piñeiro, C., Cavazza, F., & Zucaro, R. (2024). Do Irrigation Water Requirements Affect Crops’ Economic Values? Water, 16(1), 77. https://doi.org/10.3390/w16010077