Article

Adsorption Performance of Different Wetland Substrates for Ammonia Nitrogen: An Experimental Study

1
Key Laboratory of Ministry of Education for Efficient Mining and Safety of Metal Mines, University of Science and Technology Beijing, Beijing 100083, China
2
Institute of Urban Construction, Tianjin College, University of Science and Technology Beijing, Tianjin 301830, China
3
State Key Laboratory of Hydroscience and Engineering, Tsinghua University, Beijing 100084, China
4
Key Laboratory of Clean Utilization Technology for Renewable Energy in Ministry of Agriculture, College of Engineering, China Agricultural University, Beijing 100083, China
*
Author to whom correspondence should be addressed.
Water 2024, 16(1), 174; https://doi.org/10.3390/w16010174
Submission received: 23 November 2023 / Revised: 24 December 2023 / Accepted: 28 December 2023 / Published: 3 January 2024
(This article belongs to the Section Wastewater Treatment and Reuse)

Abstract

:
To investigate the adsorption performance of different substrates for ammonia nitrogen in wastewater, adsorption experiments are conducted on four substrates, namely, zeolite, quartz sand, volcanic rock, and biological ceramsite, and the experimental data are analyzed using adsorption isotherms and three kinetic models. The results show that with the increasing dosage of the substrates, the adsorption capacity gradually decreases, and the removal rate gradually increases. The removal rates all show a rapid increase in the early stage (the first 14 h) and gradually reach a stable state in the later stage (after more than 48 h). The higher the concentration of ammonia nitrogen in the NH4Cl solution, the greater the unit adsorption capacity of ammonia nitrogen by the substrate, the longer the adsorption time required to reach adsorption equilibrium, the lower the total removal rate of ammonia nitrogen, and the longer it takes for the concentration of ammonia nitrogen in the substrate and solution to reach equilibrium. The adsorption capacity of zeolite to ammonia nitrogen is much higher than that of quartz sand, biological ceramsite, and volcanic rock, so zeolite is suitable as the wetland substrate. The adsorption of ammonia nitrogen by the four substrates is principally multi-molecular layer adsorption, and the adsorption phase is heterogeneous.

1. Introduction

Water is one of the important resources for human survival. China is a country with a serious shortage of water resources. In 2020, China’s total water resources were 3.1 trillion cubic meters, with a per capita water resource share of 2214 cubic meters, which is only a quarter of the world average [1]. With the development of social industrialization and the excessive exploitation and utilization of resources by human beings, the water environment pollution is becoming increasingly serious, which not only restricts the development of the social economy but also threatens human survival [2]. Due to the impact of human activities, eutrophication of lakes, rivers and other water bodies is becoming increasingly severe worldwide, with frequent outbreaks of algal blooms and adverse effects on the environment [3]. Eutrophication of water bodies has become a serious global environmental problem. Consequently, we must urgently address the eutrophication of water bodies worldwide, especially in China.
Ammonia nitrogen is the most common nitrogen-containing compound in wastewater, with multiple sources of pollution and large emissions. The excessive discharge of wastewater containing ammonia nitrogen into the water body without treatment or incomplete treatment is the main factor causing eutrophication in water bodies. Exceeding the natural value of ammonia nitrogen in water bodies can lead to the death of a large number of aquatic organisms, posing a threat to human health [4,5]. The phenomenon of ammonia nitrogen exceeding the standard in soil and groundwater is significant, and it has become the main pollutant that needs to be controlled in China. With the increasing improvement of the solution discharge standards, the requirements and demands for removing residual ammonia nitrogen in the solution are becoming increasingly high.
The rapid and efficient removal method of ammonia nitrogen in wastewater has always received a lot of attention. At present, the removal methods of ammonia nitrogen in water mainly include chemical oxidation, physicochemical, and biological methods. Among them, the sodium hypochlorite oxidation method, as the main chemical oxidation method for removing ammonia nitrogen from wastewater, has been widely used and reported. Although this method can effectively remove ammonia nitrogen and other pollutants in wastewater, it is costly and prone to secondary pollution. The constructed wetlands sewage treatment technique [6] is based on the physical, chemical, and biological reactions of internal substrates, microorganisms, and plants to achieve the efficient removal of ammonia nitrogen, with the remarkable advantages of low construction and operation costs, low energy consumption, good treatment effect, and low secondary pollution. Since the 1970s, this technique has been widely applied to sewage treatment in urban areas, industry, and agriculture, as well as water restoration in rivers and lakes [7,8]. Plants, substrates, and microorganisms are important components of artificial wetland wastewater treatment systems and are also the main pathways for nitrogen removal in wetlands [6]. Wetland substrate is the main carrier of microorganisms and aquatic plants, as well as the main site for physical, chemical, and biological reactions. Analyzing and selecting the appropriate substrate can significantly improve the removal efficiency of ammonia nitrogen in wastewater by the wetland system [9,10], and it is of crucial practical significance to conduct research on constructed wetlands as an ecological restoration scheme for treating wastewater.
Previous studies have investigated the ammonia nitrogen adsorption of a large number of different substrates through experiments, largely focusing on using the Langmuir model to calculate the theoretical saturated adsorption capacity of substrates [11,12,13,14], providing a basis for the selection of wetland substrates. However, far less attention has been paid to the microscopic factors affecting the adsorption performance of substrates for ammonia nitrogen, the main factors affecting the adsorption capacity of ammonia nitrogen, and the main adsorption modes of ammonia nitrogen, which cannot provide technical support for further improving the adsorption performance of wetland substrates. To that end, four natural materials with similar densities and appearances, namely, zeolite, quartz sand, bioceramics, and volcanic rock, were selected as wetland substrates for experimental study in this paper. The effects of physicochemical properties, substrate dosage, adsorption time, and initial concentration of ammonia nitrogen on the adsorption performance were analyzed, and the adsorption isothermal curve and kinetic adsorption curve were fitted, and then, the main determinants affecting the adsorption capacity of ammonia nitrogen and the main adsorption modes of ammonia nitrogen were determined, which can provide data support and a theoretical basis for selecting a high adsorption wetland substrate and improving the adsorption performance of substrates.

2. Materials and Methods

2.1. Substrates

To investigate the adsorption characteristics of ammonia nitrogen by different adsorption materials, four kinds of fresh substrates purchased from Beijing Kaibiyuan Trade Co., Ltd., Beijing, China, i.e., zeolite, quartz sand, volcanic rock, and biological ceramsite, with particle sizes of 2–4 mm, 5–8 mm, 2–4 mm, and 3–5 mm, respectively, were used in the parallel experiments. Note that the particle sizes of the four natural irregular substrates used in this study are all too small, and their porosity and hydraulic conductivity are very low. Thus, it is considered that the influence of the slight changes in particle size of these substrates within 10 mm on the adsorption of ammonia nitrogen is negligible [15,16].

2.2. Determination of Physical and Chemical Properties of Substrates

The tests of physical and chemical properties of the substrates included the following: (1) the surface microstructure of zeolite, quartz sand, biological ceramsite, and volcanic rock were observed with the Gemini SEM300 electron microscope (Carl Zeiss Optics (China) Co., Ltd., Guangzhou, China) magnified by 1000 times; (2) the cation exchange capacity of the substrates was determined by BaCl2-MgSO4 (forced exchange) method using the specific surface tester (Beishide instrument-S&T (Beijing) Co., Ltd., Beijing, China); (3) the specific surface area and pore volume of the substrates were measured by the Brunauer-Emmett-Teller (BET) multi-point approach using 3H-2000PS (Beishide instrument-S&T (Beijing) Co., Ltd., Beijing, China); (4) the concentration of ammonia nitrogen was determined using salicylic acid-hypochlorite spectrophotometry [17]; (5) the pH value was determined using the electrode potential (the water-soil ratio was 2.5/1); (6) the concentration of ammonia nitrogen in the solution was determined using Nessler’s reagent spectrophotometry [16]; (7) the unit adsorption capacity Qe of the substrate for ammonia nitrogen can be calculated using Equation (1); and (8) the calculation method of ammonia nitrogen removal rate is given in Equation (2).
Q e = C 0 C e m ,
where C0 is the initial concentration of NH4+-N in the solution, Ce is the concentration of NH4+-N in the solution at equilibrium, and m is the mass of the substrate.
Removal   rate   ( % ) = C 0 C e / C 0 × 100 %

2.3. Adsorption Isothermal Test of Substrates

The adsorption isothermal test of the substrate includes the substrate dosage test, substrate adsorption time test, and the initial concentration test of ammonia nitrogen. To minimize variability in the experiments and fundamentally investigate the influence of substrates on intensified ammonium removal, the ammonium chloride (NH4Cl) solutions with different concentrations were prepared with a certain amount of superior dry pure NH4Cl dissolved in deionized water.
The zeolite, quartz sand, volcanic rock, and biological ceramics of different qualities were placed in a 135 mL white polyethylene bottle according to the test requirements, and 100 mL NH4Cl solutions with different concentrations were, respectively, added. Subsequently, the experiment oscillated at the frequency of 120 rpm using a temperature water bath vibrator (Figure 1) under the indoor constant temperature condition (25 °C), and samples were collected. Finally, the concentration of ammonia nitrogen in filtrate was measured using GB7478-87 salicylic acid-hypochlorite spectrophotometry. To reduce the experimental error and ensure the comparability of the experiments, each group of experiments was repeated three times in parallel. The data were subjected to one-way ANOVA to test the statistically significant differences of determined parameters.

2.3.1. Substrate Dosage Test

In total, 1 g, 2.5 g, 5 g, 10 g, 15 g, 20 g, and 30 g of each substrate were, respectively, weighed and added into NH4Cl solution of 100 mg/L. The sample was measured after vibrating for 96 h.

2.3.2. Substrate Adsorption Time Test

According to the test results of the substrate dosage, 5 g zeolite, 15 g quartz sand, 10 g biological ceramics, and 15 g volcanic rock were weighed and added into NH4Cl solutions with concentrations of 10 mg/L, 100 mg/L, and 250 mg/L, respectively. Afterward, samples were successively taken at 2, 4, 6, 8, 10, 14, 20, 28, 36, 48, 60, and 72 h.

2.3.3. Influence Test of Initial Concentration of Ammonia Nitrogen

In total, 5 g zeolite, 15 g quartz sand, 10 g biological ceramics, and 15 g volcanic rock were weighed and added into 100 mL of NH4Cl solutions with concentrations of 10 mg/L, 50 mg/L, 100 mg/L, 150 mg/L, 200 mg/L, and 250 mg/L, respectively. The sample was measured after vibrating for 48 h.
The experimental data were recorded and preliminarily analyzed by Excel 2021 software, the data diagram was drawn by Origin 2021 software, and the device diagram was drawn by SmartDraw 2020 software.

3. Results

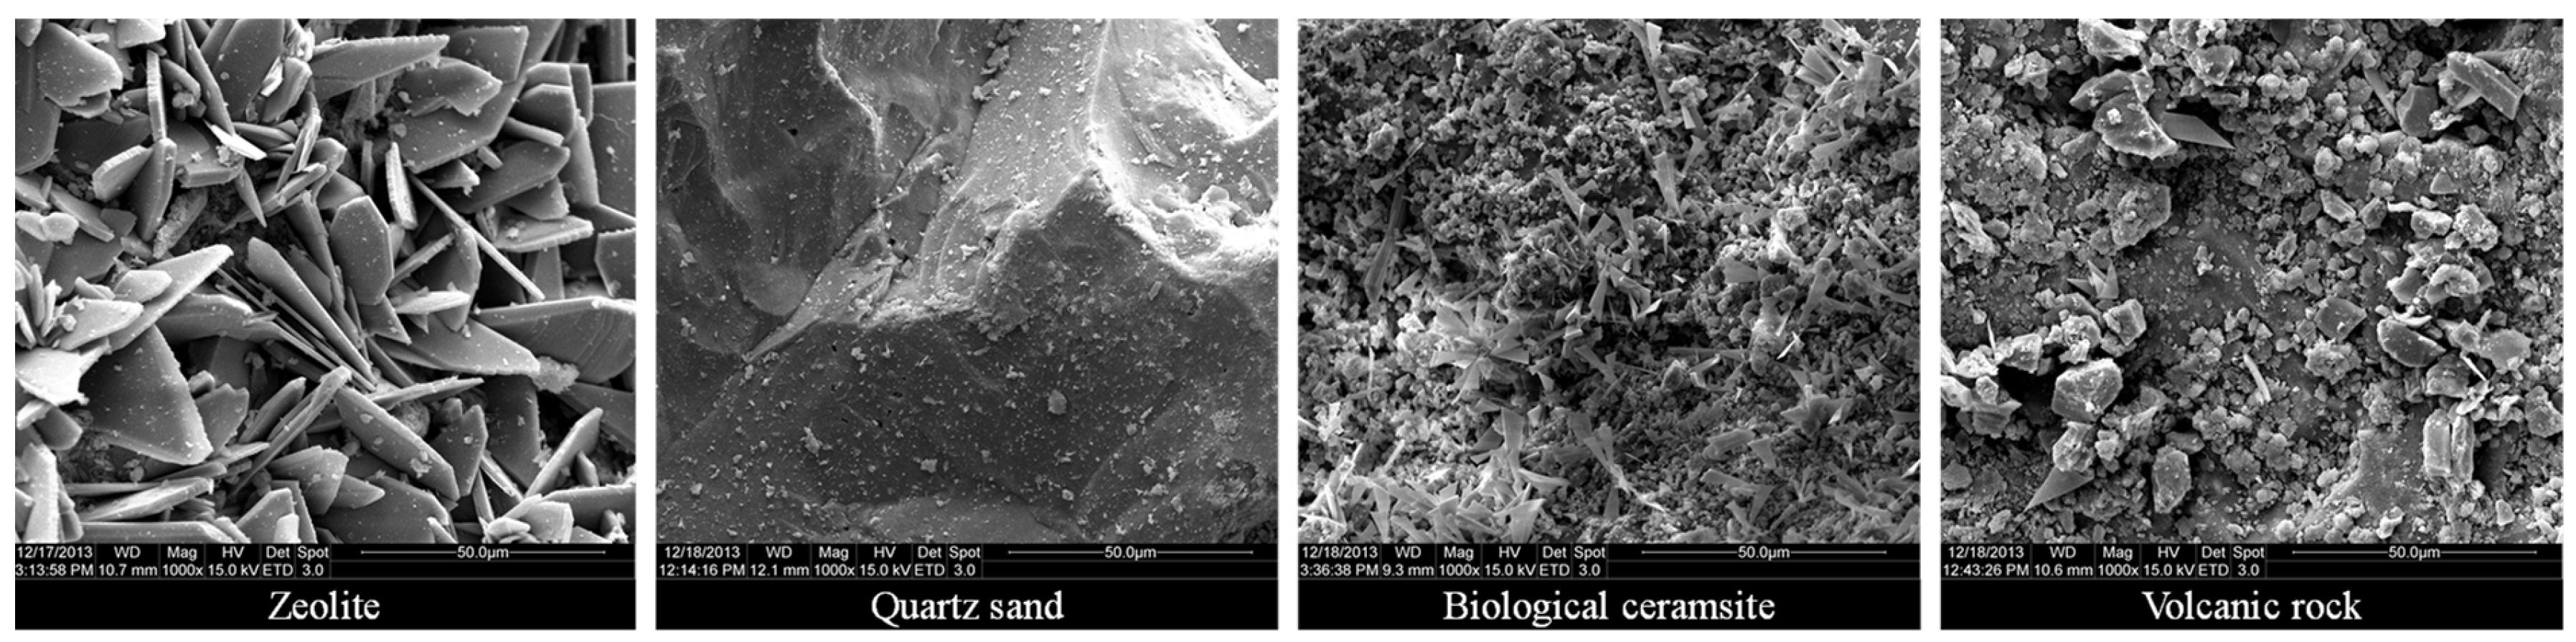
3.1. Physical and Chemical Properties of Substrates

The microstructure parameters of the zeolite, quartz sand, biological ceramsite, and volcanic rock are listed in Table 1, and the scanning images of the surface microstructure characteristics of the substrates under an electron microscope are plotted in Figure 2. The ammonia volatilization process is influenced by various factors, such as NH4+ concentration, pH value, temperature, wind speed, solar radiation, species of aquatic plants, and daily variation of the system, but mainly related to the NH4+ ion concentration and pH value [18,19,20]. In water, the equilibrium transformation between the two existing forms of ammonia nitrogen (NH3 and NH4+) is mainly influenced by the temperature and pH value [21]. For example, at the temperature of 25 °C and pH = 7.0, the mass fraction of NH3 only accounts for about 0.6%, so NH4+ is the main form of ammonia nitrogen in constructed wetland [21]. Ammonia volatilization is a physical and chemical process, and the equilibrium equation of the ammonia nitrogen dissociation in water is
NH 3 ( a q ) + H 2 O NH 4 + + OH
Previous studies [18,22] have indicated that the volatilization rate of ammonia is directly proportional to the concentration of NH4+ ion concentration. That is, when the pH value is below 7.5, there is almost no ammonia volatilization [20,22]; when the pH value is between 7.5 and 8.0, ammonia volatilization is not significant; and when the pH value is higher than 8.0, the ammonia volatilization increases exponentially with increasing pH value. The four substrates used are all weakly alkaline (Table 1), with pH values ranging from approximately 7.09 to 7.37, all lower than 7.5. Thus, it can be considered that the pH value of these substrates has almost no significant effect on ammonia volatilization. Moreover, to prevent the interference of concentration, temperature, wind speed, solar radiation, and other conditions on the test results, 135 mL fine-mouthed polyethylene bottles with inner and outer double covers were selected in this experiment. During the experiment, the stoppers were tightly covered, and the experiment was conducted in a constant temperature water bath shaker at 25 °C. In particular, the experiment was to compare the adsorption effects of different substrates on the same ammonia nitrogen concentration, with three parallel experiments in each group. Based on the above conditions, the ammonia nitrogen volatilization amount could be basically ignored.
Additionally, the adsorption capacity of the substrate for ammonia nitrogen is related to the pH value of the substrate. If the substrate is alkaline, NH4+ is prone to form a hydroxyl complex with OH in the substrate solution, and the stronger the alkaline of the substrate, the stronger the adsorption capacity for ammonium nitrogen [23]. If the substrate is acidic, the H+ in the substrate solution will compete with NH4+ for adsorption, which may lead to a poor adsorption effect on ammonium nitrogen [24]. The weak alkalinity of these four substrates and the small difference in their pH values indicate that the influence of the pH value on the adsorption performance of these four substrates is basically negligible.
Different from the similarity of pH values of these substrates, the specific surface area and the cation exchange capacity of the zeolite are 16.59 m2/g and 4.29 coml/kg, respectively, which are much higher than those of biological ceramsite (0.71 m2/g and 0.63 coml/kg), volcanic rock (0.35 m2/g and 0.46 coml/kg), and quartz sand (0.12 m2/g and 0.35 coml/kg). This strongly indicates that zeolite exhibits good physical and chemical properties and high potential adsorption capacity. The microstructure of the substrate surface was observed using an electron microscope at the scale of 50 µm, and it can be clearly seen from Figure 2 that the surface of zeolite has many lamellar structures, the surface of quartz sand is smooth, and the surface of biological ceramsite possesses a large number of lamellar and granular structures. Many macroporous structures visible to the naked eye exist on the surface of the volcanic rock, but only a few granular structures can be seen on the surface under 50 µm electron microscopy. It can be deduced that the cation exchange capacity and specific surface area of the substrate are determined by the microstructure of the substrate surface and are not closely related to the pH value of the substrate and the pore diameter and pore volume of the substrate surface. Furthermore, the cation exchange capacity and specific surface area of the lamellar structure substrate are excellent, and the granular structure has a certain improvement but less impact on the physical and chemical properties of the substrate compared to the smooth surface of quartz sand. The appearance of the volcanic rock differs from the other three substrates, and there are many visible pores with an average pore diameter of 90.86 nm, which is much higher than that of the other three substrates (3.47–14.76 nm). However, the physical and chemical properties of the volcanic rock, such as specific surface area and cation exchange capacity, are far lower than those of zeolite, indicating that the micro-physical and chemical properties of the substrates are determined by the microstructure of the substrates and are not related to the characterization of the substrates.
Moreover, a large number of crystals are distributed on the surface of zeolite and biological ceramsite, while there are no crystals on the surface of quartz sand and volcanic rock. According to Bhattacharyya and Gupta [25], the adsorption capacity of the substrate for ammonia nitrogen depends on the crystal species on the substrate surface, which determines the species richness and structure of microbial flora on the substrate surface. In addition, the microscopic lamellar and granular structures on the surface of the substrate can provide more attachment points for wetland microorganisms in the later stage of wetland operation, thus improving the removal effect of ammonia nitrogen and other pollutants in the wetland. These results imply that the specific surface area and other physical and chemical properties of the substrate can be significantly improved by increasing the lamellar structure on the substrate surface or selecting materials with more lamellar structures as wetland substrates. Therefore, biological ceramsite with a granular structure tends to have a better adsorption capacity than quartz sand with a smooth surface, and zeolite with a flaky structure appears to have a better adsorption capacity than the other three substrates.

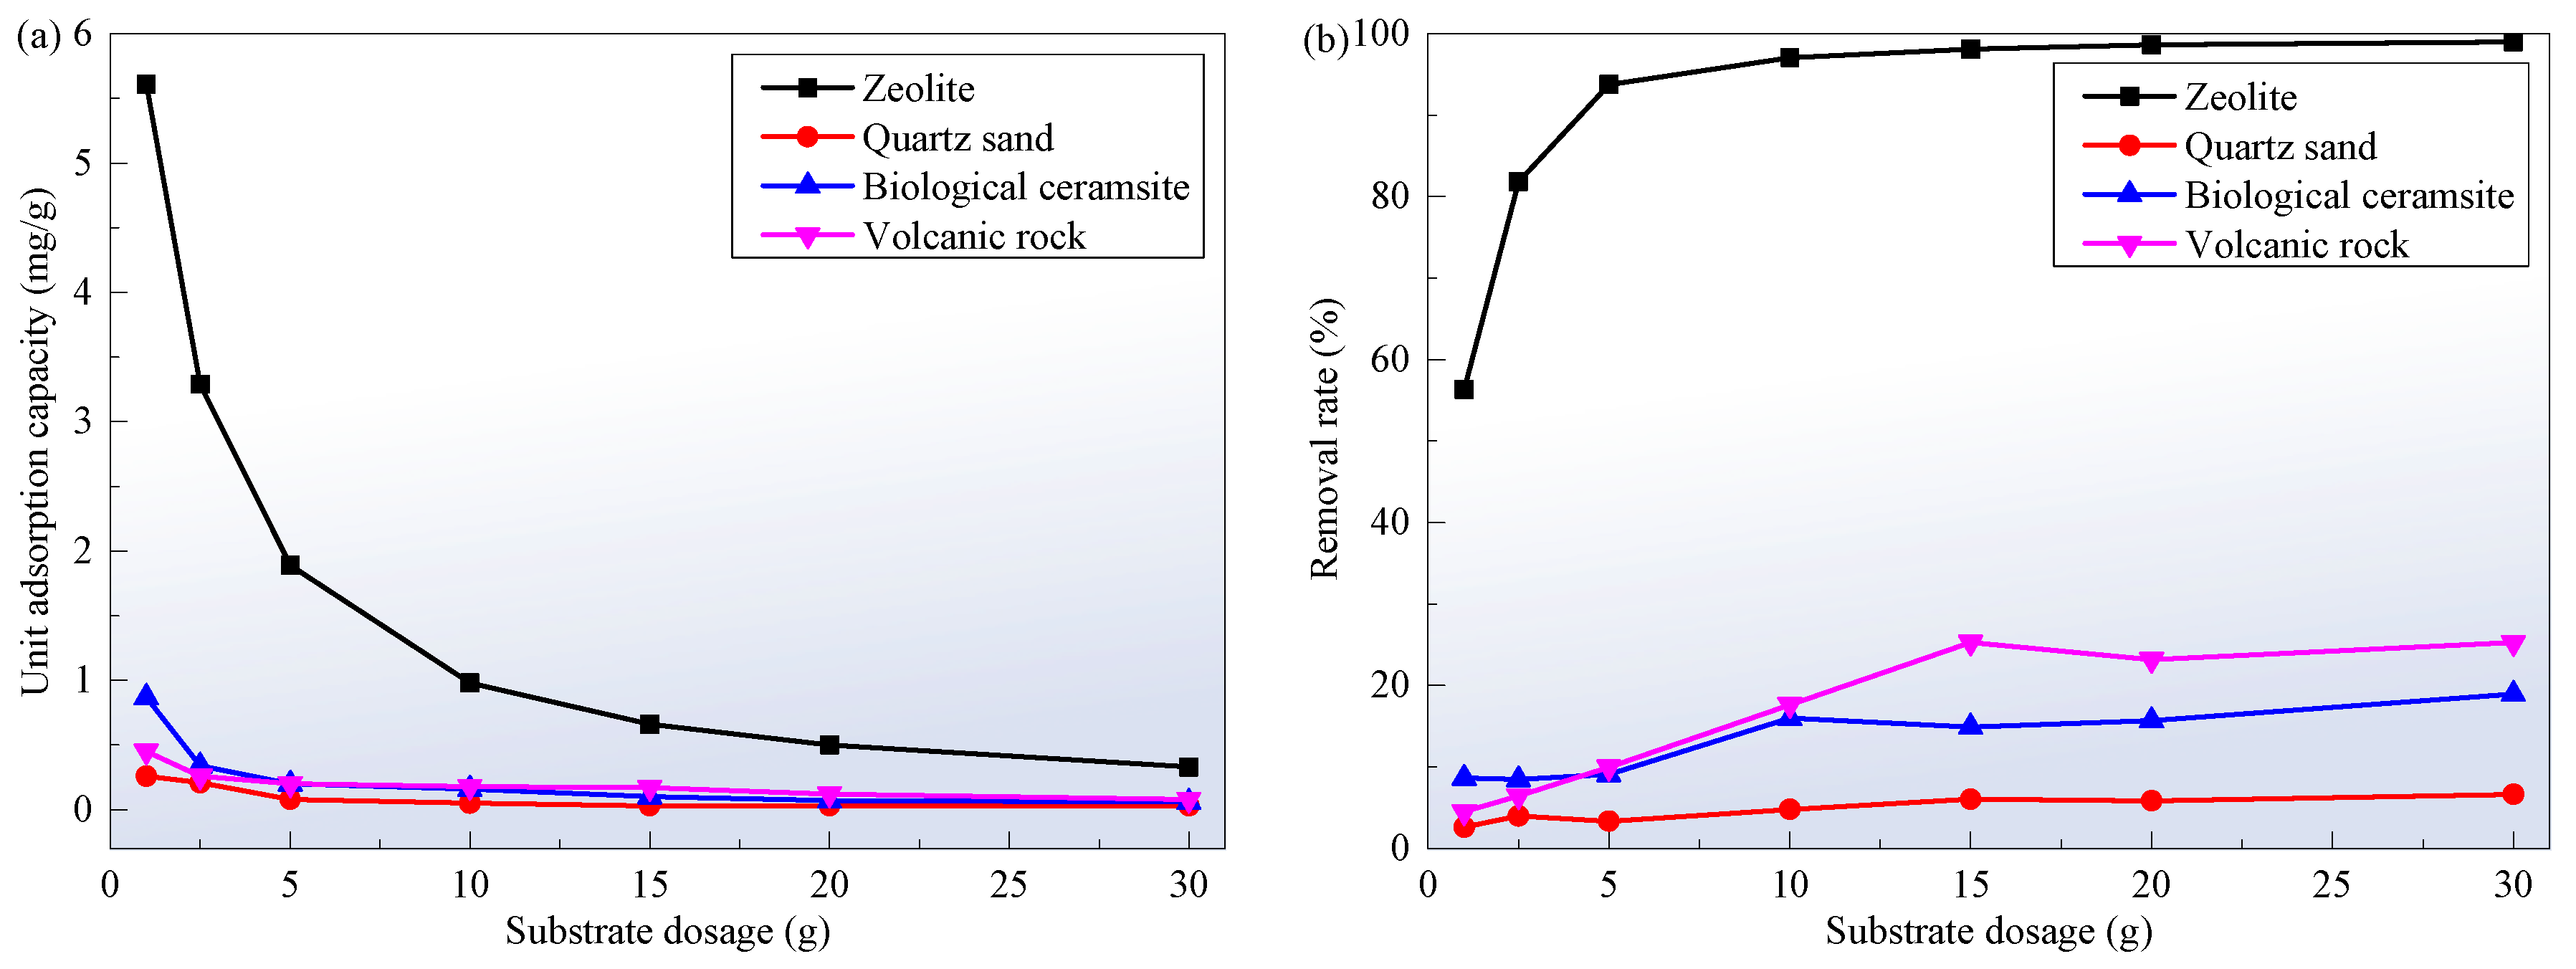
3.2. Substrate Dosage

The influence of the dosage of four substrates on the unit adsorption capacity and removal rate for ammonia nitrogen in the NH4Cl solution is listed in Table 2, and these data are visualized in Figure 3. From the dosage of substrates ranging from 1 g to 30 g, zeolite has the highest unit adsorption capacity for ammonia nitrogen in the entire process of vibrating adsorption, reaching 0.33–5.61 mg/g, and its total removal rate for ammonia nitrogen is also the largest, ranging from 56.32% to 98.99%, which are much greater than those of quartz sand, biological ceramsite, and volcanic rock under the same dosage. The adsorption capacity of the substrate for ammonia nitrogen largely depends on the specific surface area and total pore volume of the substrate, showing a positive correlation, which is fairly identical to the research results provided by Wang et al. [26]. Overall, as the dosage of the four substrates increases, their adsorption capacity for ammonia nitrogen gradually decreases (Figure 3a) and their removal rate gradually increases (Figure 3b). This is because, with the increase in the dosage of the substrate, the adsorption points provided increase correspondingly, so the unit adsorption capacity for ammonia nitrogen gradually decreases, and an increase in the substrate dosage can significantly improve the removal rate of ammonia nitrogen. For zeolite, when the dosage of zeolite is 5 g, the unit adsorption capacity of zeolite is 1.80 mg/g, and the removal rate reaches 93.76%. When the dosage of zeolite increases again, the removal rate for ammonia nitrogen remains basically unchanged. This is principally because when the ammonia nitrogen concentration in the solution drops to a certain level (the residual ammonia nitrogen concentration in the solution is about 10 mg/L after the test), adsorption will not occur again, that is, adsorption equilibrium will appear. At this time, the driving force of the mass transfer provided by the solution is infinitely closer to the resistance when ammonia nitrogen enters the adsorption point of the substrate from the solution. Hence, increasing the dosage of zeolite has little effect on improving the adsorption capacity of zeolite for ammonia nitrogen in the solution, and the unit adsorption capacity and removal rate for ammonia nitrogen by the substrate tend to be stable, demonstrating that the removal of ammonia nitrogen by zeolite is determined by both the dosage of the substrate and the concentration of ammonia nitrogen in the solution. However, for quartz sand, biological ceramsite, and volcanic rock with poor adsorption performance, their dosage has little effect on the removal of ammonia nitrogen in the solution.
In summary, the experimental results show that zeolite exhibits excellent performance in removing ammonia nitrogen from the solution. When selecting zeolite as a wetland substrate for ammonia nitrogen treatment, the solution treatment volume can be determined based on the required dosage of zeolite per liter of the solution, so that ammonia nitrogen in the solution can be effectively removed without wasting wetland resources.

3.3. Substrate Adsorption Time

In NH4Cl solutions with mass concentrations of 10 mg/L, 100 mg/L, and 250 mg/L, the curves of ammonia nitrogen removal rate with adsorption time in the four substrates are illustrated in Figure 4, and the saturated adsorption time and removal rate of the substrates are shown in Table 3. It can be observed that the adsorption trends for ammonia nitrogen by zeolite, quartz sand, biological ceramsite, and volcanic rock are similar in the three concentrations of NH4Cl solution, that is, the removal rates all show a rapid increase in the early stage (the first 14 h) and gradually reach a stable state in the later stage (after more than 48 h). This changing trend indicates that the kinetic curves of ammonia nitrogen adsorption by these four substrates conform to the characteristics of “rapid adsorption and then slow balance”. Accordingly, quartz sand, biological ceramsite, volcanic rock, and zeolite all belong to polar adsorption [27], but the adsorption capacities of quartz sand, biological ceramsite, and volcanic rock are limited because of their small specific surface and cation exchange capacities, which are significantly lower than that of zeolite. Moreover, with an increasing solution concentration, the time required for ammonia nitrogen adsorption saturation becomes longer and the removal rate of ammonia nitrogen decreases (Table 3).
As shown in Figure 4, although quartz sand can quickly reach adsorption equilibrium in the solution with different concentrations, its pollutant removal rate is low, which is not in line with the characteristics of high-efficiency adsorbents. Compared to the other three substrates, zeolite has the characteristics of high load impact resistance, and it still has the characteristics of rapid adsorption and efficient removal of ammonia nitrogen in a high-concentration solution. Taking zeolite as an example, when the concentration is 10 mg/L, after 10 h, the unit adsorption capacity of zeolite for ammonia nitrogen is 0.193 mg/g, and the removal rate is 91.16%. When the concentration is 100 mg/L, after 14 h, the unit adsorption capacity is 1.667 mg/g, and the removal rate is 81.48%. As the concentration is 250 mg/L, after 14 h, the unit adsorption capacity is 3.935 mg/g, and the removal rate is 76.60%. This suggests that when the dosage of the substrate remains constant, the higher the concentration of ammonia nitrogen in the solution, the greater the unit adsorption capacity of ammonia nitrogen by the substrate, the longer the adsorption time required to reach adsorption equilibrium, and the lower the total removal rate of ammonia nitrogen. This can be attributed to the fact that a certain amount of substrate provides a fixed number of adsorption sites, and increasing the concentration of NH4+-N in the solution results in an increase in the number of adsorption sites required for NH4+-N, leading to a longer equilibrium adsorption time. However, when the amount of NH4+-N in the solution drops to a certain value, the attraction of the substrate to NH4+-N is less than the repulsion generated by the already adsorbed NH4+-N on other NH4+-N, resulting in equilibrium adsorption. This also validates the result that the maximum unit adsorption capacity of the substrate is much higher than the saturated adsorption capacity within the substrate adsorption time.
Based on the experimental results, it is believed that the adsorption of ammonia nitrogen by the substrate includes physical adsorption and ion exchange. Physical adsorption is predominantly caused by the electrostatic force and capillary force on the surface of the substrate, and pore filling also plays a role in the adsorption process [28]. Moreover, ion exchange is a chemical process in which cations (such as Si4+, Al3+, Mg2+, and Zn2+) on the surface of the substrate exchange with NH4+-N [29]. At the beginning of adsorption, the four substrates are primarily electrostatically adsorbed, which mostly occurs at the surface active sites, with a faster adsorption rate. As the adsorption time increases, after the surface active sites gradually saturate, the adsorption may be diffusion, thereby slowing down the adsorption rate [30,31,32].
Because the daily solution treatment capacity of the same wetland is determined by the solution concentration and the solution retention time, choosing the optimal solution retention time in the wetland according to the adsorption saturation time required by the substrate in the solution with different concentrations can significantly improve the solution treatment efficiency of the wetland.

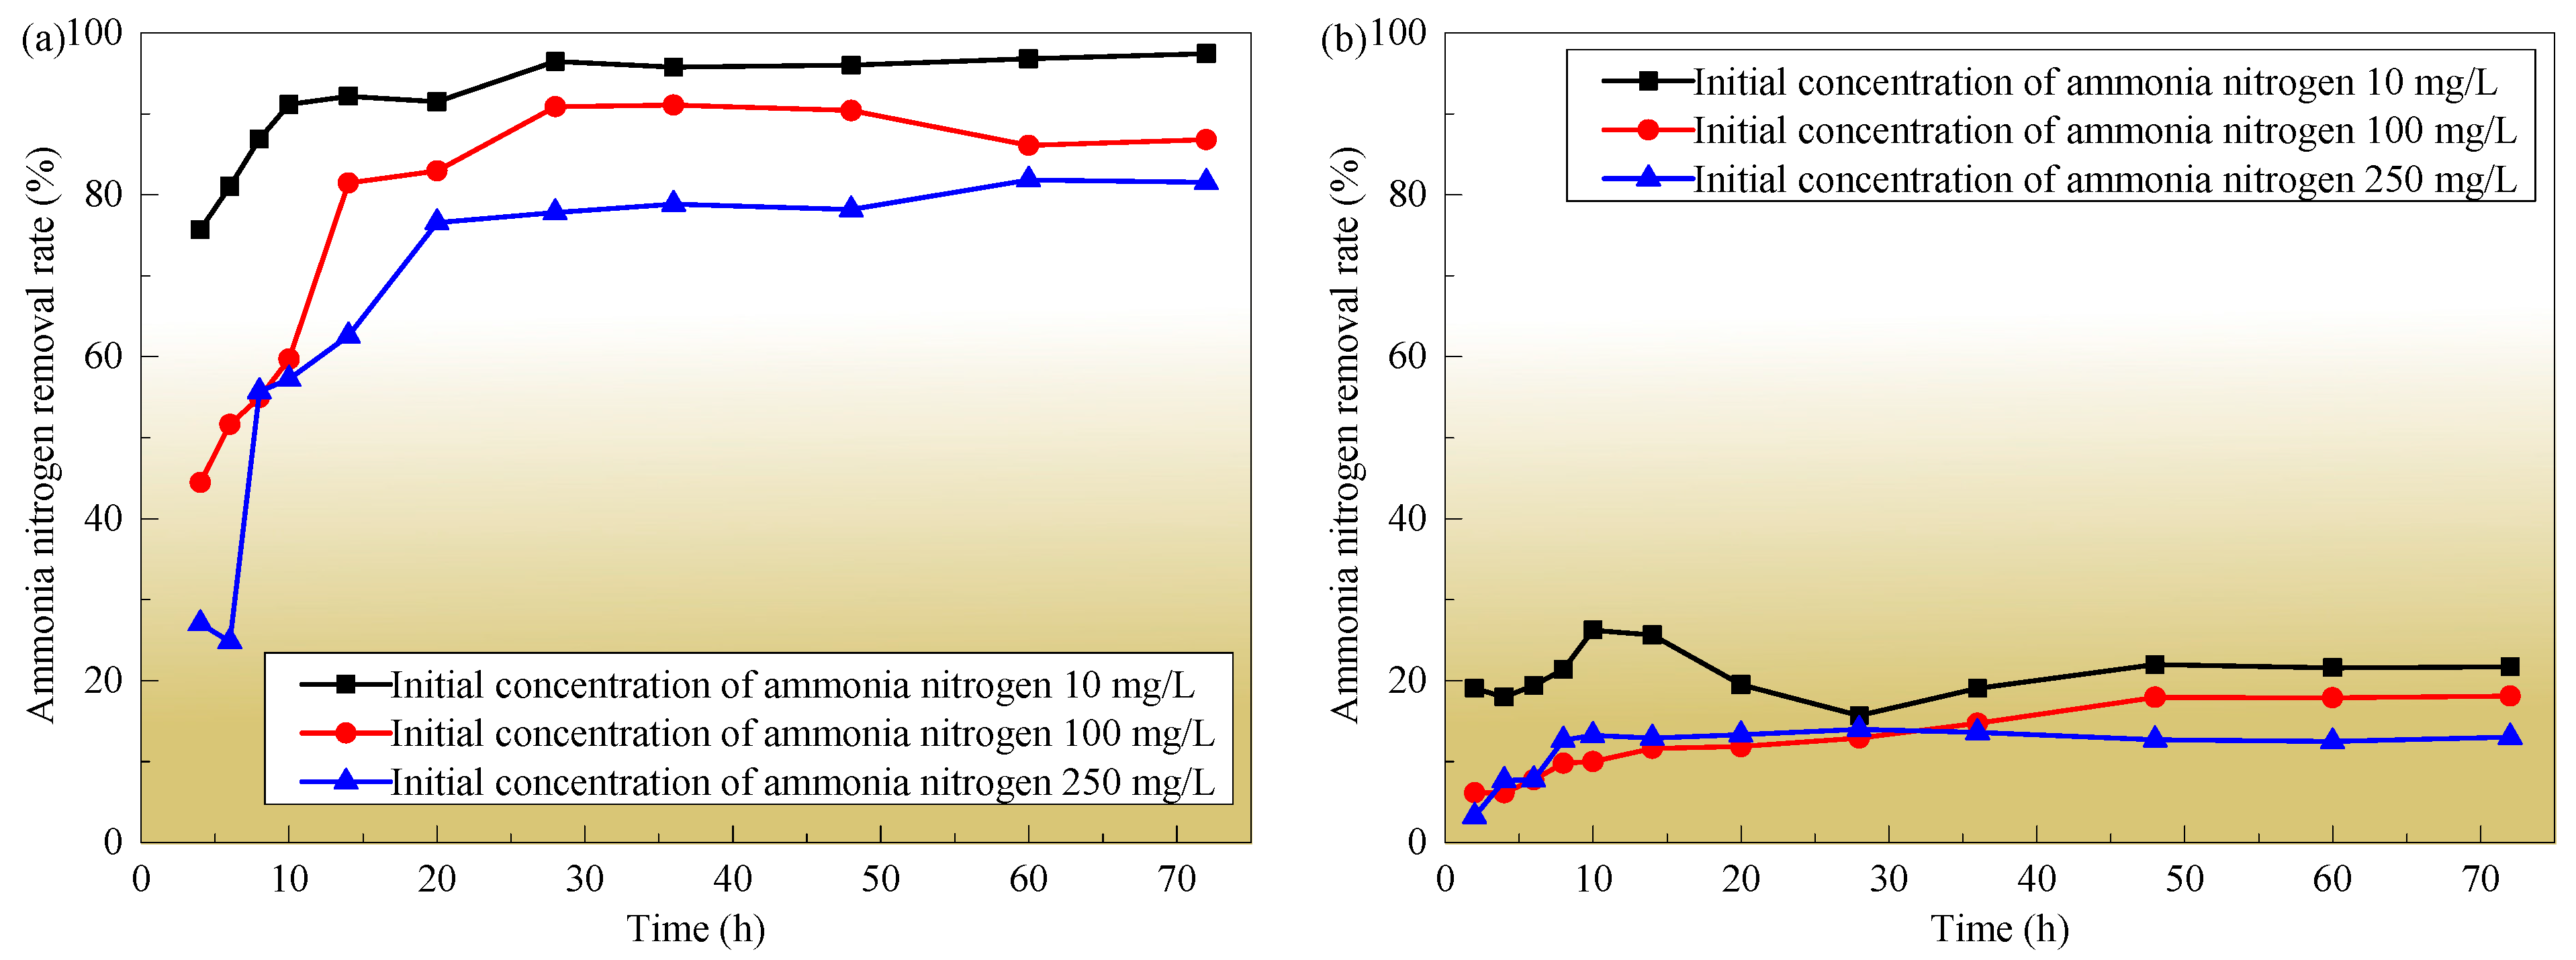
3.4. Initial Concentration of Ammonia Nitrogen

The variation trend of the unit adsorption capacity and removal rate for ammonia nitrogen in the four substrates with respect to the initial concentration of ammonia nitrogen is presented in Figure 5. After oscillating for 48 h to reach adsorption equilibrium, as the initial concentration of ammonia nitrogen solution increases from 10 mg/L to 250 mg/L, the unit adsorption capacity of zeolite, quartz sand, biological ceramsite, and volcanic rock for ammonia nitrogen increases from 0.19 mg/g, 0.01 mg/g, 0.02 mg/g, and 0.02 mg/g to 4.05 mg/g, 0.22 mg/g, 0.52 mg/g, and 0.33 mg/g, respectively, while the removal rate for ammonia nitrogen in the solution decreases from 96.3%, 13.0%, 32.0%, and 14.8% to 70.7%, 3.2%, 11.3%, and 8.5%, respectively. The results indicate that with the increase in the initial concentration of ammonia nitrogen, the equilibrium adsorption capacity of the four substrates for ammonia nitrogen rises, while the removal rate descends. This is because when the initial concentration of ammonia nitrogen increases, the mass transfer driving force provided by the solution increases, which is greater than the resistance when ammonia nitrogen enters the adsorption point of the substrate from the solution. The higher the initial concentration of ammonia nitrogen in the solution, the greater the mass transfer driving force generated and the larger the unit adsorption capacity of the substrate. However, when the amount of substrate is fixed, the adsorption sites provided by the substrate are limited. The higher the initial concentration of ammonia nitrogen, the more adsorption sites are required, and the easier it is for the substrate to reach adsorption saturation. Thus, the removal rate of ammonia nitrogen in the solution decreases with the increase in the initial concentration of ammonia nitrogen.

4. Discussion

4.1. Adsorption Equilibrium

Adsorption isotherms are used to describe the relationship between the solute mass adsorbed by unit mass of adsorbent and the equilibrium concentration of the adsorbate in the solution when adsorption reaches equilibrium [33], which are useful to optimize the use of media as adsorbents and can reflect the adsorption law of the substrate. Consequently, empirical equations (Langmuir and Freundlich isothermal models) are important for the interpretation and prediction of adsorption data. Langmuir postulates that (1) the number of active adsorption sites on the solid surface is fixed, and each adsorption site can only adsorb one molecule at most; (2) each active site is distributed on the surface of the molecule; and (3) the adsorbed molecules are independent of each other. Under the ideal condition that all of the above assumptions are valid, the adsorption isothermal analysis formula (i.e., Langmuir model) is given by
Q e = K C e Q max K C e + 1 ,
where Ce is the concentration of NH4+-N in the solution at equilibrium; Qe and Qmax are the unit adsorption capacity and maximum adsorption capacity of the substrate at equilibrium, respectively; and K is the Langmuir constant.
The constants of the Langmuir isotherm can be determined by plotting 1/Qe versus 1/Ce, and thus, Equation (4) can be expressed in the follwoing linear form:
C e Q e = C e Q max + 1 K Q max
However, some researchers believe that the surface of a solid is uneven, so the distribution and types of adsorption active sites on the solid surface are distinct, and their affinity for molecules is also diverse. There may be cases where multiple active sites adsorb a molecule, and the adsorption capacity increases infinitely with increasing concentration. As such, the Freundlich isothermal model is introduced and is given as the following equation [33]:
Q e = F C e 1 / n ,
where F roughly represents the adsorption capacity; and 1/n stands for the adsorption intensity. The linear form of the Freundlich model yields the constants F and 1/n, that is,
log Q e = log F + 1 n log C e
In this study, both Langmuir and Freundlich models are adopted to evaluate the experimental results using the adsorption data with different initial concentrations of ammonia nitrogen. The fitting results are shown in Figure 6, and the derived parameters are shown in Table 4. The correlation coefficients fitted by the Langmuir equation of zeolite, biological ceramsite, and volcanic rock are 0.924, 0.978, and 0.870, respectively, which are all greater than 0.85, indicating good fitting results, while the correlation coefficient of the quartz sand is 0.758. This indicates that the single-molecule layer adsorption exists in the zeolite, biological ceramsite, and volcanic rock. Due to the low Langmuir correlation coefficient of quartz sand, it is believed that the adsorption isothermal of ammonia nitrogen by quartz sand does not conform to the independent adsorption of an ideal single molecule. As a result, it is speculated that single-molecule layer adsorption can be better achieved by the presence of lamellar structures in the microstructure of the substrate surface, while the smoother the surface structure of the substrate, the less likely it is to achieve single-molecule layer adsorption.
The single-molecule layer adsorption capacities of the four substrates are derived from the fitting equations, which are zeolite 3.85 mg/g, biological ceramsite 0.31 mg/g, volcanic rock 0.21 mg/g, and quartz sand 0.12 mg/g in descending order, all of which are smaller than the actual maximum unit adsorption capacities of 5.61 mg/g, 0.87 mg/g, 0.45 mg/g, and 0.26 mg/g in the matrix dosage experiment. The theoretical monolayer adsorption capacity of the four substrates is consistent with the NH4+-N removal capacity of the four substrates in the substrate dosage test. This indicates that although the adsorption of the zeolite, biological ceramsite, and volcanic rock can be well fitted using the Langmuir model, the adsorption of ammonia nitrogen by the substrate is not a single monolayer adsorption because of the complex microstructure of the substrate surface. In addition, K represents the adsorption strength of the substrate for NH4+-N. The larger the K value, the greater the difference between the adsorption rate and desorption rate of the substrate for NH4+-N, and the closer the adsorption between the substrate and NH4+-N [29,34]. Zeolite has the highest adsorption strength for NH4+-N, followed by volcanic rocks, while the adsorption strength of biological ceramsite and quartz sand for NH4+-N is much lower than that of zeolite and volcanic rocks. NH4+-N is more easily desorbed from the surface of biological ceramsite and quartz sand.
On the other hand, the correlation coefficients fitted by the Freundlich model of these four substrates are all greater than 0.96 (Table 4) and higher than those fitted by the Langmuir model, so it can be considered that the Freundlich model is more suitable to describe the adsorption of NH4+-N by these four substrates [35,36]. The results indicate that the adsorption processes of NH4+-N by the four substrates occur on heterogeneous surfaces, following the adsorption of multiple molecular layers, and the adsorption is the result of the interaction between chemical and physical adsorption [37,38]. In the Freundlich equation, the larger the adsorption coefficient F value, the greater the adsorption capacity of the substrate. The F value of the zeolite is much higher than that of quartz sand, biological ceramsite, and volcanic rock, implying that zeolite has a much better adsorption performance for ammonia nitrogen than the other three substrates, and zeolite has a higher affinity for NH4+-N.
Additionally, the correlation coefficients of the adsorption data of the four substrates fitted by the Freundlich model are all greater than 0.95, indicating a good fitting effect. According to Freundlich’s theory, the magnitude of the exponent 1/n indicates the favorability of adsorption. That is, 1/n > 2 indicates that the adsorption is difficult, and the substrate is easy to adsorb when 0.1 < 1/n < 1; the smaller 1/n, the easier the substrate is to adsorb [2,38,39]. The 1/n values of the four substrates are zeolite 0.56, volcanic rock 0.59, quartz sand 0.68, and biological ceramsite 0.79, all of which are greater than 0.1 and less than 1. Theoretically, these four substrates should be easy to adsorb ammonia nitrogen, but in fact, the adsorption of ammonia nitrogen by quartz sand is not easy, which means that the statement that substrates are easy to adsorb when 0.1 < 1/n < 1 does not comply with the adsorption isothermal of ammonia nitrogen by some substrates. Nevertheless, the fitting results are in accord with the adsorption saturation time in Table 4, indicating when the 1/n value is smaller, the adsorption equilibrium can be reached in a shorter time, and the adsorption capacity of the substrate is determined by the microstructure of the substrate surface.
Through the above analysis, the surface microstructure of the substrate is generally complex, and the fitting results indicate that the adsorption of ammonia nitrogen by zeolite, quartz sand, biological ceramsite, and volcanic rock is mainly multi-molecule layer adsorption, and the adsorption phase is heterogeneous. In addition, the monolayer adsorption capacity of zeolite for ammonia nitrogen is consistently higher than that of the other three substrates, implying that the specific surface area and cation exchange capacity of the substrates as well as the crystal structure of the substrate surface are the most important factors that determine the adsorption capacity of the substrate and the growth state of microorganisms.

4.2. Kinetic Analysis

Generally, the adsorption process is carried out using a multi-step mechanism, such as diffusion on the liquid film around solid particles (process controlled by external mass transfer coefficient), diffusion inside particles by assuming the pore diffusion mechanism (intra-particle diffusion) and physical or chemical adsorption at one site [33,40]. Intra-particle diffusion, pseudo-first-order, and pseudo-second-order kinetic equations are widely used in the analysis of kinetic data.
The linear equation of intra-particle diffusion is
Q t = U t 1 / 2 + C ,
where Qt is the adsorption capacity at time t; U is the intra-particle diffusion rate constant; and C is the intercept. When the constant C is infinitely closer to zero, diffusion control is the only step to control the adsorption rate, otherwise, it means that there are other reactions that form the adsorption control step together with it. Moreover, the graph may exhibit multiple linearity, indicating that three steps occur. Firstly, the more obvious part is attributed to the diffusion of the adsorbate through the solution to the outer surface of the adsorbent or the boundary layer diffusion of solute molecules. The second part describes the gradual adsorption stage, in which the intra-particle diffusion is rate-limited [41].
The pseudo-first-order kinetic model describes the process of substrate surface reaction control and gas film diffusion control. When the reaction rate is linearly related to the concentration of a reactant, the fitting effect is better. The linear equation is
log Q e Q t = log Q e K 1 2.303 t ,
where K1 is the rate constant of the pseudo-first-order model. The graph of log(QeQt) versus t yields the values of K1 and Qe.
The pseudo-second-order kinetic model assumes that the adsorption process is a pseudo-chemical reaction process, and the chemical adsorption mechanism determines the adsorption rate. Its linear form used to analyze the liquid kinetic adsorption is defined as
t Q t = 1 K 2 Q e 2 + 1 Q e t
where K2 is the rate constant of the pseudo-second-order model. The values of K2 and Qe can be given by the plot of t/Qt versus t.
To further determine the adsorption mode of ammonia nitrogen by the substrate, the above three kinetic equations are used to fit and analyze the adsorption time data, and the results are shown in Figure 7 and Table 5. It can be seen that zeolite is more in line with the pseudo-second-order kinetic model, and the correlation coefficient is close to 1.0, which implies that the adsorption of ammonia nitrogen by zeolite predominantly depends on chemical adsorption. This is consistent with the high cation exchange capacity of the zeolite surface. The intra-particle diffusion, pseudo-first-order, and pseudo-second-order kinetic models can be well fitted for quartz sand, indicating that the adsorption of ammonia nitrogen by quartz sand involves a combination of intra-particle diffusion and physical and chemical adsorption. The adsorption time data of biological ceramsite and volcanic rock are fitted by the three models, with correlation coefficients greater than 0.8, and the values of C in the intra-particle diffusion model approach zero, demonstrating that the adsorption of ammonia nitrogen by biological ceramsite and volcanic rock is principally intra-particle diffusion, with both chemical adsorption and physical adsorption. Hence, it can be concluded that the saturated adsorption capacity of the substrate is mainly influenced by the specific surface area and cation exchange capacity of the substrate. These results are helpful in formulating the modification scheme to improve the adsorption performance of the substrate.

5. Conclusions

(1)
The microstructure of the substrate determines the physical and chemical properties of the substrate, such as the cation exchange capacity and specific surface area. The more lamellar structures on the surface of the substrate, the better its physical and chemical properties and adsorption performance. Hence, in the future, the substrate can be modified by chemical methods to increase the lamellar structure on the surface of the substrate or select materials with many lamellar structures as the wetland substrate, which can improve the adsorption performance of the wetland substrate for ammonia nitrogen.
(2)
With the increase in the dosage of the four substrates, their adsorption capacity for ammonia nitrogen gradually decreases and the removal rate gradually increases. The adsorption trends for ammonia nitrogen by zeolite, quartz sand, biological ceramsite, and volcanic rock are similar in the three concentrations of the solution, that is, the removal rates all show a rapid increase in the early stage (the first 14 h) and gradually reach a stable state in the later stage (after more than 48 h). When the dosage of the substrate is constant, the higher the concentration of ammonia nitrogen in the solution, the longer it takes for the concentration of ammonia nitrogen in the substrate and solution to reach equilibrium. The higher the concentration of ammonia nitrogen in the solution, the greater the unit adsorption capacity of ammonia nitrogen by the substrate, the longer the adsorption time required to reach adsorption equilibrium, the lower the total removal rate of ammonia nitrogen, and the longer it takes for the concentration of ammonia nitrogen in the substrate and solution to reach equilibrium. The adsorption capacity of zeolite to ammonia nitrogen is much higher than that of quartz sand, biological ceramsite, and volcanic rock, so zeolite is suitable as the wetland substrate.
(3)
The adsorption data of zeolite, biological ceramsite, and volcanic rock can be well fitted by the Langmuir and Freundlich models, while the Freundlich model is more accurate than the Langmuir model in describing the isothermal characteristics of ammonia nitrogen adsorption by zeolite, quartz sand, biological ceramsite, and volcanic rock, indicating that the adsorption of ammonia nitrogen by the four substrates is principally multi-molecular layer adsorption, and the adsorption phase is heterogeneous.
(4)
The kinetic analyses of ammonia nitrogen adsorption by substrates are carried out by using the intra-particle diffusion model, pseudo-first-order kinetic model, and pseudo-second-order kinetic model. The adsorption of ammonia nitrogen by zeolite primarily depends on chemical adsorption, which is consistent with the high cation exchange capacity of the zeolite surface. The adsorption of ammonia nitrogen by quartz sand is the combined action of intra-particle diffusion and physical and chemical adsorption. The adsorption of ammonia nitrogen by biological ceramsite and volcanic rock is principally intra-particle diffusion, with both chemical adsorption and physical adsorption.

Author Contributions

All the authors contributed to the study conception and design. Material preparation, data collection, and analysis were performed by P.L., M.L., J.Z., L.C. and M.C. The first draft of the manuscript was written by P.L. and M.L. All authors have read and agreed to the published version of the manuscript.

Funding

This work was financially supported by the National Natural Science Foundation of China (Grant No. 52204084), the Interdisciplinary Research Project for Young Teachers of USTB (Fundamental Research Funds for the Central Universities of China) (Grant No. FRF-IDRY-GD22-002), the Fundamental Research Funds for the Central Universities of China and the Youth Teacher International Exchange and Growth Program (Grant No. QNXM20220009), the Fundamental Research Funds for the Central Universities of China (Grant No. FRF-TP-20-041A1), the National Key R&D Program of China (Grant Nos. 2022YFC2905600 and 2022YFC3004601), and the Science, Technology and Innovation Project of Xiongan New Area of China (Grant No. 2023XAGG0061).

Data Availability Statement

Data can be provided upon request, for collaboration purposes.

Acknowledgments

The authors are deeply indebted to the financial supporters.

Conflicts of Interest

The authors declare no conflicts of interest.

References

  1. Gu, D.Z.; Li, J.F.; Cao, Z.G.; Wu, B.Y.; Jiang, B.B.; Yang, Y.; Yang, J.; Chen, Y.P. Technology and Engineering Development Strategy of Water Protection and Utilization of Coal Mine in China. J. China Coal Soc. 2021, 46, 3079–3089. [Google Scholar]
  2. Li, Q.; Zhang, J.S.; Liang, R.H.; Wang, S.L.; Gao, J.Q.; Song, B.Z.; Huang, Z.Z.; Chu, J.H. Novel Ceramsite Substrate of Constructed Wetland: Preparation and Study on Phosphorus Removal. Environ. Sci. Technol. 2021, 44, 13–22. [Google Scholar]
  3. Yu, C.X.; Li, Z.Y.; Xu, Z.H.; Yang, Z.F. Lake Recovery from Eutrophication: Quantitative Response of Trophic States to Anthropogenic Influences. Ecol. Eng. 2020, 143, 105697. [Google Scholar] [CrossRef]
  4. Xu, D.F.; Cao, J.M.; Li, Y.X.; Howard, A.; Yu, K.W. Effect of Pyrolysis Temperature on Characteristics of Biochars Derived from Different Feedstocks: A Case Study on Ammonium Adsorption Capacity. Waste Manag. 2019, 87, 652–660. [Google Scholar] [CrossRef]
  5. Tang, Y.; Alam, M.S.; Konhauser, K.O.; Alessi, D.S.; Xu, S.N.; Tian, W.J.; Liu, Y. Influence of Pyrolysis Temperature on Production of Digested Sludge Biochar and Its Application for Ammonium Removal from Municipal Wastewater. J. Clean. Prod. 2019, 209, 927–936. [Google Scholar] [CrossRef]
  6. Wang, Y.N.; Guo, X.C.; Lu, S.Y.; Liu, X.H.; Wang, X.H. Review of Nitrogen Removal in Low-Polluted Water by Constructed Wetlands: Performance, Mechanism, and Influencing Factors. J. Agric. Resour. Environ. 2021, 38, 722–734. [Google Scholar]
  7. Wang, X.; Zhu, Z.J.; Yin, M.M.; Zhang, Y.Q.; Zhang, Z.X. Application of Hybrid Constructed Wetland in Tail Water Treatment of Municipal Sewage Plant. China Water Wastewater 2020, 36, 97–101. [Google Scholar]
  8. Chen, X.T.; Hao, Q.J.; Xiong, Y.F.; Hu, J.; Jiang, C.S. Effects of Hematite and Biochar Addition on Wastewater Treatment Efficiency, Greenhouse Gas Emission, and Microbial Community in Subsurface Flow Constructed Wetland. Environ. Sci. 2022, 43, 1492–1499. [Google Scholar]
  9. Fu, G.P.; Wu, J.F.; Han, J.Y.; Zhao, L.; Chan, G.; Leong, K.F. Effects of Substrate Type on Denitrification Efficiency and Microbial Community Structure in Constructed Wetlands. Bioresour. Technol. 2020, 307, 123222. [Google Scholar] [CrossRef]
  10. Xu, G.M.; Li, Y.; Hou, W.H.; Wang, S.; Kong, F.L. Effects of Substrate Type on Enhancing Pollutant Removal Performance and Reducing Greenhouse Gas Emission in Vertical Subsurface Flow Constructed Wetland. J. Environ. Manag. 2021, 280, 111674. [Google Scholar] [CrossRef]
  11. Zhou, X.; Liang, C.L.; Jia, L.X.; Feng, L.K.; Wang, R.G.; Wu, H.M. An Innovative Biochar-Amended Substrate Vertical Flow Constructed Wetland for Low C/N Wastewater Treatment: Impact of Influent Strengths. Bioresour. Technol. 2018, 247, 844–850. [Google Scholar] [CrossRef]
  12. Deng, S.J.; Chen, J.Q.; Chang, J.J. Application of Biochar as an Innovative Substrate in Constructed Wetlands/Biofilters for Wastewater Treatment: Performance and Ecological Benefits. J. Clean. Prod. 2021, 293, 126156. [Google Scholar] [CrossRef]
  13. Chen, H.Y.; Duan, Y.L. Contrast of Adsorption Property and Influencing Factors of Different Biochar for Ammonia Nitrogen Removal in Water. Water Purif. Technol. 2022, 41, 71–78. [Google Scholar]
  14. Xiao, Q.L.; Xiao, L.P.; Peng, H.; Zhu, J.; Jian, Y.; Jia, J.L.; Ji, X.H. Nitrogen and Phosphorus Adsorption Capacity of Different Substrate Combinations. Res. Environ. Sci. 2022, 35, 1277–1287. [Google Scholar]
  15. Zhao, D.Y.; Zhang, S.; Zhao, S.N.; Zhao, Y.J.; Tian, W.D.; Liu, J.J. Screening of Ammonia Nitrogen Removal Schemes from Construct Wetland Matrix and Dynamic Analysis of Influencing Factors. J. Water Resour. Water Eng. 2018, 29, 121–126. [Google Scholar]
  16. Hu, S.M. Research on Modified Zeolite Applied in Constructed Wetland to Treat Rural Domestic Sewage; Shenyang Jianzhu University: Shenyang, China, 2023. [Google Scholar]
  17. Lou, H.J.; Liu, W.; Hu, Y.J.; Zhang, G.N.; Wu, H.J.; Zhao, Y.J. Determination of Ammonia Nitrogen in Water by Salicylic Acid Spectrophotometry. Chem. Anal. Meterage 2020, 29, 25–29. [Google Scholar]
  18. Hayashi, K.; Nishimura, S.; Yagi, K. Ammonia Volatilization from a Paddy Field Following Applications of Urea: Rice Plants Are Both an Absorber and an Emitter for Atmospheric Ammonia. Sci. Total Environ. 2008, 390, 485–494. [Google Scholar] [CrossRef]
  19. Shan, W.P.; Song, H. Catalysts for the Selective Catalytic Reduction of NOx with NH3 at Low Temperature. Catal. Sci. Technol. 2015, 5, 4280–4288. [Google Scholar] [CrossRef]
  20. Lu, S.Y.; Jin, X.C.; Yu, G. Nitrogen Removal Mechanism of Constructed Wetland. Acta Ecol. Sin. 2006, 26, 2670–2677. [Google Scholar]
  21. Zhang, J.; Zhou, Q.; He, R. Mechanism of Nitrogen and Phosphorus Removal in Free-Water Surface Constructed Wetland. Ecol. Environ. 2004, 13, 98–101. [Google Scholar]
  22. Vymazal, J.; Brix, H.; Cooper, P.; Haberl, R.; Perfler, R.; Laber, J. Removal Mechanisms and Types of Constructed Wetlands; Backhuys Publishers: Leiden, The Netherlands, 1998; pp. 17–66. [Google Scholar]
  23. Zhang, H.Y.; Huang, Z.H.; Wang, J.; Zhang, J.; Meng, C.R.; Wei, C.Z. Effects of Different Acidifiers on PH and Phosphorus Availability in Calcareous Soil. Soil Fertil. Sci. China 2019, 1, 145–150. [Google Scholar]
  24. Suo, G.F.; Lv, H.H.; Wang, Y.Y.; Liu, Y.X.; He, L.L.; Yang, S.M. Study on the Adsorption Properties of Nitrogen by Different Biochars. J. Agro-Environ. Sci. 2018, 37, 1193–1202. [Google Scholar]
  25. Bhattacharyya, K.G.; Gupta, S.S. Adsorption of a Few Heavy Metals on Natural and Modified Kaolinite and Montmorillonite: A Review. Adv. Colloid Interface Sci. 2008, 140, 114–131. [Google Scholar] [CrossRef] [PubMed]
  26. Wang, Z.C.; Wang, Z.; Li, W.P.; Yu, L.H.; Yang, W.H.; Lv, W.X.; Wang, G.Q. Selection of the Optimum Ratio Matrix for Removal of Ammonia Nitrogen and Phosphorus in Eco-Ditch and Its Influencing Factors in Cold and Arid Areas. J. Soil Water Conserv. 2020, 34, 262–267. [Google Scholar]
  27. Liu, M.H.; Wu, S.B.; Chen, L.; Dong, R.J. How Substrate Influences Nitrogen Transformations in Tidal Flow Constructed Wetlands Treating High Ammonium Wastewater? Ecol. Eng. 2014, 73, 478–486. [Google Scholar] [CrossRef]
  28. Su, J.Z. Study on the Performance of Biochar Adsorption of Nano-Plastic and the Synergistic Removal of Ammonia Nitrogen by Modified Bioretention Cell; Nanchang University: Nanchang, China, 2023. [Google Scholar]
  29. Chen, S.J.; Huang, D.; Gao, Y.N.; Meng, Z.G.; Zhang, G.Q. Study on Nitrogen and Phosphorus Removal Performance of Constructed Wetland Modular Substrate. Technol. Water Treat. 2023. Available online: https://link.cnki.net/urlid/33.1127.P.20231213.1650.004 (accessed on 14 December 2023).
  30. Li, D.; Li, Y. Application of Zeolite in Water Treatment. Water Wastewater Eng. 1998, 24, 60–63. [Google Scholar]
  31. Tang, D.Y.; Zheng, Z.; Lin, Z.R.; Tao, C.L.; Gao, H.; Lu, H. Adsorption of Ammonium-Nitrogen from Low Concentration Wastewater by Natural Zeolite. Environ. Sci. Technol. 2010, 33, 206–209. [Google Scholar]
  32. Liu, L.; Wu, S.B.; Guo, J.B.; Cheng, B.; Dong, R.J.; Pang, C.L. Adsorption of Ammonia Nitrogen in Effluent from Pig Manure Biogas Plant by Zeolite. J. Agro-Environ. Sci. 2011, 30, 2130–2135. [Google Scholar]
  33. Halim, A.A.; Aziz, H.A.; Johari, M.A.M.; Ariffin, K.S. Comparison Study of Ammonia and COD Adsorption on Zeolite, Activated Carbon and Composite Materials in Landfill Leachate Treatment. Desalination 2010, 262, 31–35. [Google Scholar] [CrossRef]
  34. Qiu, F.G.; Sun, Y.; Chen, L.X. Characteristics of Aluminum-Based Water Treatment Residual (WTR) and Its Adsorption Performance on Ammonium and Phosphate. Environ. Eng. 2016, 34, 54–59. [Google Scholar]
  35. Zhu, L.L.; Qiu, L.P.; Zhang, Y.Y.; Cheng, H.T.; Liu, P.P. Ammonia Nitrogen Adsorption onto Volcanic Rocks, Haydites and Zeolites at Low Temperatures. J. Univ. Jinan Sci. Technol. 2016, 30, 287–292. [Google Scholar]
  36. Liu, Y.; Liu, X.H.; Zhang, Y.R.; Wang, W.L. Adsorption Properties of Low Concentration Ammonia Nitrogen Wastewater by Three Constructed Wetland Fillers. Environ. Chem. 2018, 37, 1118–1127. [Google Scholar]
  37. Chen, C.; Luo, H.; Cao, X.Y.; Jing, Z.Q. Mechanism of Enhanced Nitrogen and Phosphorus Removal from Rainwater Runoff by Different Modified Zeolites. Water Purif. Technol. 2020, 39, 141–149. [Google Scholar]
  38. He, L.W.Z.; Chen, Y.; Zhao, Y.T.; Li, Y.J.; Yang, S.S. Adsorption Properties of Ammonia Nitrogen by Alkali-Hydrothermal Water Treatment Sludge Adsorbent. Technol. Water Treat. 2022, 48, 82–87. [Google Scholar]
  39. Liu, J.; Zhu, Z.Q.; Zhu, Y.N.; Yan, Q.M.; He, H.; Zhang, L.H.; Huang, X.N. Adsorption Characteristics of Phosphate in Water by the Porous Biomorph-Genetic Composite of Fe/C with Ginkgo Shell Template. Res. Environ. Sci. 2019, 32, 1239–1249. [Google Scholar]
  40. Chiou, M.S.; Li, H.Y. Equilibrium and Kinetic Modeling of Adsorption of Reactive Dye on Cross-Linked Chitosan Beads. J. Hazard. Mater. 2002, 93, 233–248. [Google Scholar] [CrossRef]
  41. Yeddou, N.; Bensmaili, A. Kinetic Models for the Sorption of Dye from Aqueous Solution by Clay-Wood Sawdust Mixture. Desalination 2005, 185, 499–508. [Google Scholar] [CrossRef]
Figure 1. Schematic diagram of ammonia nitrogen adsorbability test of zeolite, quartz sand, biological ceramsite, and volcanic rock.
Water 16 00174 g001
Figure 2. Scanning of the surface microstructure of zeolite, quartz sand, biological ceramsite, and volcanic rock examined at a scale of 50 μm.
Water 16 00174 g002
Figure 3. Influence of the substrate dosage on the unit adsorption capacity (a) and removal rate (b) for ammonia nitrogen.
Water 16 00174 g003
Figure 4. Effect of adsorption time of different substrates on ammonia nitrogen removal rate: (a) zeolite; (b) quartz sand; (c) biological ceramsite; (d) volcanic rock.
Water 16 00174 g004aWater 16 00174 g004b
Figure 5. Effect of the initial concentration of ammonia nitrogen on the unit adsorption capacity (a) and removal rate (b) for ammonia nitrogen.
Water 16 00174 g005
Figure 6. Adsorption isothermal curves fitted by the Langmuir (a) and Freundlich (b) models. Note that in (a), the vertical axis on the left corresponds to the data of quartz sand, volcanic rock, and biological ceramsite, and the vertical axis on the right corresponds to the data of zeolite.
Water 16 00174 g006
Figure 7. Adsorption data fitted by the intra-particle diffusion (a), pseudo-first-order (b), and pseudo-second-order kinetic (c) models.
Water 16 00174 g007
Table 1. Microstructure parameters of different substrates.
MaterialDensity (m3/g)Cation Exchange Capacity (coml/kg)Specific Surface Area (m2/g)Total Pore Volume (mL/g)Average Pore Diameter (nm)pH
Zeolite2.05–2.214.17–4.4116.590.061214.767.09
Quartz sand2.51–2.750.17–0.530.120.00103.477.30
Biological ceramsite1.64–1.700.57–0.690.710.01616.887.37
Volcanic rock1.94–2.000.17–0.750.350.000690.867.31
Table 2. Unit adsorption capacity and removal rate for ammonia nitrogen of different substrates.
Substrate Dosage (g)ZeoliteQuartz SandBiological CeramsiteVolcanic Rock
Unit Adsorption Capacity (mg/g)Removal Rate (%)Unit Adsorption Capacity (mg/g)Removal Rate (%)Unit Adsorption Capacity (mg/g)Removal Rate (%)Unit Adsorption Capacity (mg/g)Removal Rate (%)
1.05.6156.320.262.620.878.650.454.51
2.53.2981.830.213.990.348.470.266.47
5.01.8993.760.083.340.209.090.209.96
100.9897.050.054.780.1615.990.1817.66
150.6698.100.036.070.1014.900.1725.29
200.5098.660.035.850.0715.670.1223.18
300.3398.990.036.650.0618.940.0825.26
Table 3. Adsorption saturation time and removal rate for ammonia nitrogen of different substrates.
SubstrateIndexAmmonia Nitrogen Concentration (mg/L)
10100250
ZeoliteAdsorption saturation time (h)101414
Quartz sand101010
Biological ceramsite141616
Volcanic rock101414
ZeoliteRemoval rate (%)91.1681.4876.60
Quartz sand26.2211.62413.24
Biological ceramsite32.3219.5319.65
Volcanic rock35.8815.8211.33
Table 4. Fitting parameters in the Langmuir and Freundlich adsorption isotherm models.
IsotheramZeoliteQuartz SandBiological CeramsiteVolcanic Rock
Langmuir
R20.9240.7580.9780.870
Qm (mg/g)3.850.120.310.21
K6.18 × 10−26.11 × 10−35.25 × 10−31.31 × 10⁻²
Equilibrium isotherms Q e = 0.239 C e 6.18   ×   10 2 C e + 1 Q e = 7.33   ×   10 4 C e 6.11   ×   10 3 C e + 1 Q e = 1.63   ×   10 3 C e 5.25   ×   10 3 C e + 1 Q e = 2.76   ×   10 3 C e 1.31   ×   10 2 C e + 1
Freundlich
R20.9970.9920.9970.967
1/n0.5580.6820.7920.592
F0.3431.864 × 10−32.693 × 10−37.439 × 10−3
Equilibrium isothermsQe = 0.343Ce0.558Qe = 1.864 × 10⁻³Ce0.682Qe = 2.693 × 10⁻³Ce0.792Qe = 7.439 × 10⁻³Ce0.592
Table 5. Fitting parameters of different kinetic adsorption models.
Kinetic ModelConstantsAdsorbent
Ammoniacal NitrogenZeoliteQuartz SandBiological CeramicsVolcanic Rocks
intra-particleR20.7400.9630.8950.885
U0.1540.0130.0310.018
C0.7590.026−0.0030.010
1st-order
R20.6570.9450.8130.861
K10.0422.3231.3691.369
Qe (mg/g)0.9590.9600.9821.809
2nd-order
R20.9970.9450.8480.841
K20.140−23.419−442.008−52.952
Qe (mg/g)1.8930.0220.0480.030
experimental Qe (mg/g)1.8630.1230.2370.149
Disclaimer/Publisher’s Note: The statements, opinions and data contained in all publications are solely those of the individual author(s) and contributor(s) and not of MDPI and/or the editor(s). MDPI and/or the editor(s) disclaim responsibility for any injury to people or property resulting from any ideas, methods, instructions or products referred to in the content.

