Article

Numerical Investigation of Inner Flow Characteristics of a Prototype Pump Turbine with a Single Pier in Draft Tube at Part Load Conditions

1
Baishan Storage Power Station, State Grid Xinyuan Co., Ltd., Huadian 132400, China
2
Department of Energy and Power Engineering, Tsinghua University, Beijing 100084, China
*
Author to whom correspondence should be addressed.
Water 2024, 16(1), 13; https://doi.org/10.3390/w16010013
Submission received: 12 November 2023 / Revised: 15 December 2023 / Accepted: 16 December 2023 / Published: 20 December 2023
(This article belongs to the Special Issue Advances in Hydrodynamics of Water Pump Station System)

Abstract

:
Pump turbines operate under various off-design conditions, resulting in complex internal flow patterns. This study employs Reynolds-averaged Navier–Stokes (RANS) numerical methods to investigate the flow characteristics of a prototype pump turbine with a single draft tube pier in turbine mode, and then, the flow characteristics inside the draft tube are discussed with emphasis. Asymmetry between the pier-divided draft tube passage flows is inevitable due to the elbow section’s curvature. Most of the fluid flows out of one passage, while vortex motion dominates the interior of the other one, resulting in completely different pressure fluctuation characteristics for the two flow passages. The large-flow passage is mainly characterized by the wide band in the frequency domain, corresponding to the recirculation zone, while some of the measured points in the low-discharge passage exhibit frequency splitting under kinematic progression. Further analysis demonstrates a low-frequency peak corresponding to the complementary shape between the vortex rope and the recirculation zone. This work elucidates the effects of the pier on the flow behavior and pressure fluctuation characteristics inside the draft tube and fills the research gap on piers in the field of pump turbines.

1. Introduction

With the development of new energy, pumped storage power stations play an important role in peak shaving and valley filling of the power grid, which can make up for the instability of wind and solar power stations [1]. In some offshore pumped storage power stations, it can also solve important problems such as seawater desalination and power supply on isolated islands [2,3].
Compared with typical Francis or Kaplan turbines, pump turbines need to operate under a wider range of off-design conditions in turbine mode, while also being able to switch to pump mode frequently. For this purpose, the internal flow characteristics of pump turbines under different conditions have been extensively studied by means of experiments or numerical simulations. Many studies have confirmed that the region in which strong pressure fluctuations are likely to occur in pump turbines is the vaneless space [4]. When the operating condition of a pump turbine changes, it may enter the “S-region”, in which the pressure fluctuations in the vaneless space rise sharply, which can affect structural components, and this poses a threat to the safe operation of the unit when serious [5]. A detailed PIV model test study elaborated that the S-region characteristic of pump turbines is caused by the blocking of a sub-synchronous stall cell in the guide vane flow passage. The numerical study by Zhu et al. [6] indicated that the intense pressure fluctuation is related to the non-uniform distribution of vortex structures in the vaneless space. The simulation results by Hu et al. [7] found triangular or quadrilateral flow patterns in the upper crown cavity, which is an important reason for the low-frequency components in this region. Asomani et al. [8] reviewed the influence of design parameters on the internal flow characteristics of pump turbines, and the main influence of geometric parameters is the RSI characteristics of different units. Fu et al. [9] considered the clearance flow between the hub and the shroud, and studied the pressure fluctuation and shafting mechanical characteristics during startup. It was found that the influence of the clearance dominated the axial thrust much more than the influence of the runner blades. Yang et al. investigated the transient characteristics of the internal flow of pump turbines during start-up and shutdown by numerical simulation [10], and further studied the influence of flow-induced vibration on the structural stress characteristics of non-rotating components [11].
The flow pattern in the draft tube is also an important research focus on pump turbines. Compared with Francis and Kaplan turbines, pump turbines are influenced by the S-region characteristic, and the pressure fluctuation characteristics are affected by both the rotor–stator interaction and the draft tube vortex rope under some conditions [12]. Kim et al. [13] studied the internal flow in the draft tube of a pump turbine under partial flow rate conditions. By comparing the swirling number and the shape of the vortex rope, it is indicated that the vortex rope phenomenon is more obvious at medium flow rates, but at lower flow rates the swirling intensity is stronger. Tridon et al. [14] obtained an analytical expression for the radial velocity based on the formula of a conical diffuser and the superposition of three Batchelor vortices. The study by Lin et al. [15] showed that the draft tube vortex rope is also significantly affected by leakage flow and the blade vortex. Pang et al. studied the influence of the cavitation number on the draft tube vortex rope [16]. Numerical simulation revealed that, under different cavitation numbers, the vortex rope presents a spiral shape or a torch-like shape, and the torch-like vortex rope under a lower cavitation number has a higher swirling intensity and a lower dominant frequency.
In the above studies, most of the draft tubes are single-channel ones without a pier. The pier can increase the pressure recovery coefficient of the diffuser section [17], thereby improving the overall efficiency of the hydraulic turbine. Since the design of piers aims at improving the power generation efficiency, the current research on piers mainly focuses on Francis [18,19], Kaplan [20,21], and a small number of bulb turbines [22,23], with little attention paid to pump turbines. A well-known study was carried out by Tridon et al. [24,25]. Through LDV tests, they observed that, at a flow rate coefficient of 0.38, secondary flow caused a main vortex and a vertical vortex in the left flow passage of the draft tube, and the flow imbalance between the two passages was an important reason for the unexpected efficiency decrease at low flow rates after the replacement of the impeller with a high-efficiency one. DUPRAT [26] performed large eddy simulation (LES) and also found similar back-flow. Li et al. numerically studied a Francis turbine with a pier in the draft tube [27]. Their results showed that, at low flow rates, the discharge in the draft tube was concentrated in the flow passage on the inside of the pier, while the outer flow passage was dominated by the vortex. As the flow rate increased, the flow in the outer passage also gradually increased. Wang et al. [28] performed numerical simulation on a Francis turbine unit and believed that the draft tube pier can restrain the development of a vortex and reduce pressure fluctuations. In an early study, Paik et al. [29] simulated a draft tube with two piers, in which the vortex rope broke up and transported to three flow passages. Pasche et al. [30] carried out an asymptotic analysis on a Francis turbine with a pier in the draft tube and proposed that the synchronous pressure wave inside the draft tube results from the combined effects of the vortex rope and wall disturbances.
In this study, we performed unsteady numerical simulation on a pump turbine with a single pier in turbine mode. After examining the flow in the guide vane and runner passages, we focused on analyzing the flow patterns and spectral characteristics inside the draft tube under two typical loads. In simple terms, the draft tube pier has some influence on the evolution process of the vortex rope, which has not been considered in previous studies in the field of pump turbines. The influence of the rotor–stator interaction the and draft tube vortex rope on the pressure fluctuation characteristics was preliminarily investigated, filling the research gap on the stability of pump turbines in the presence of a pier.

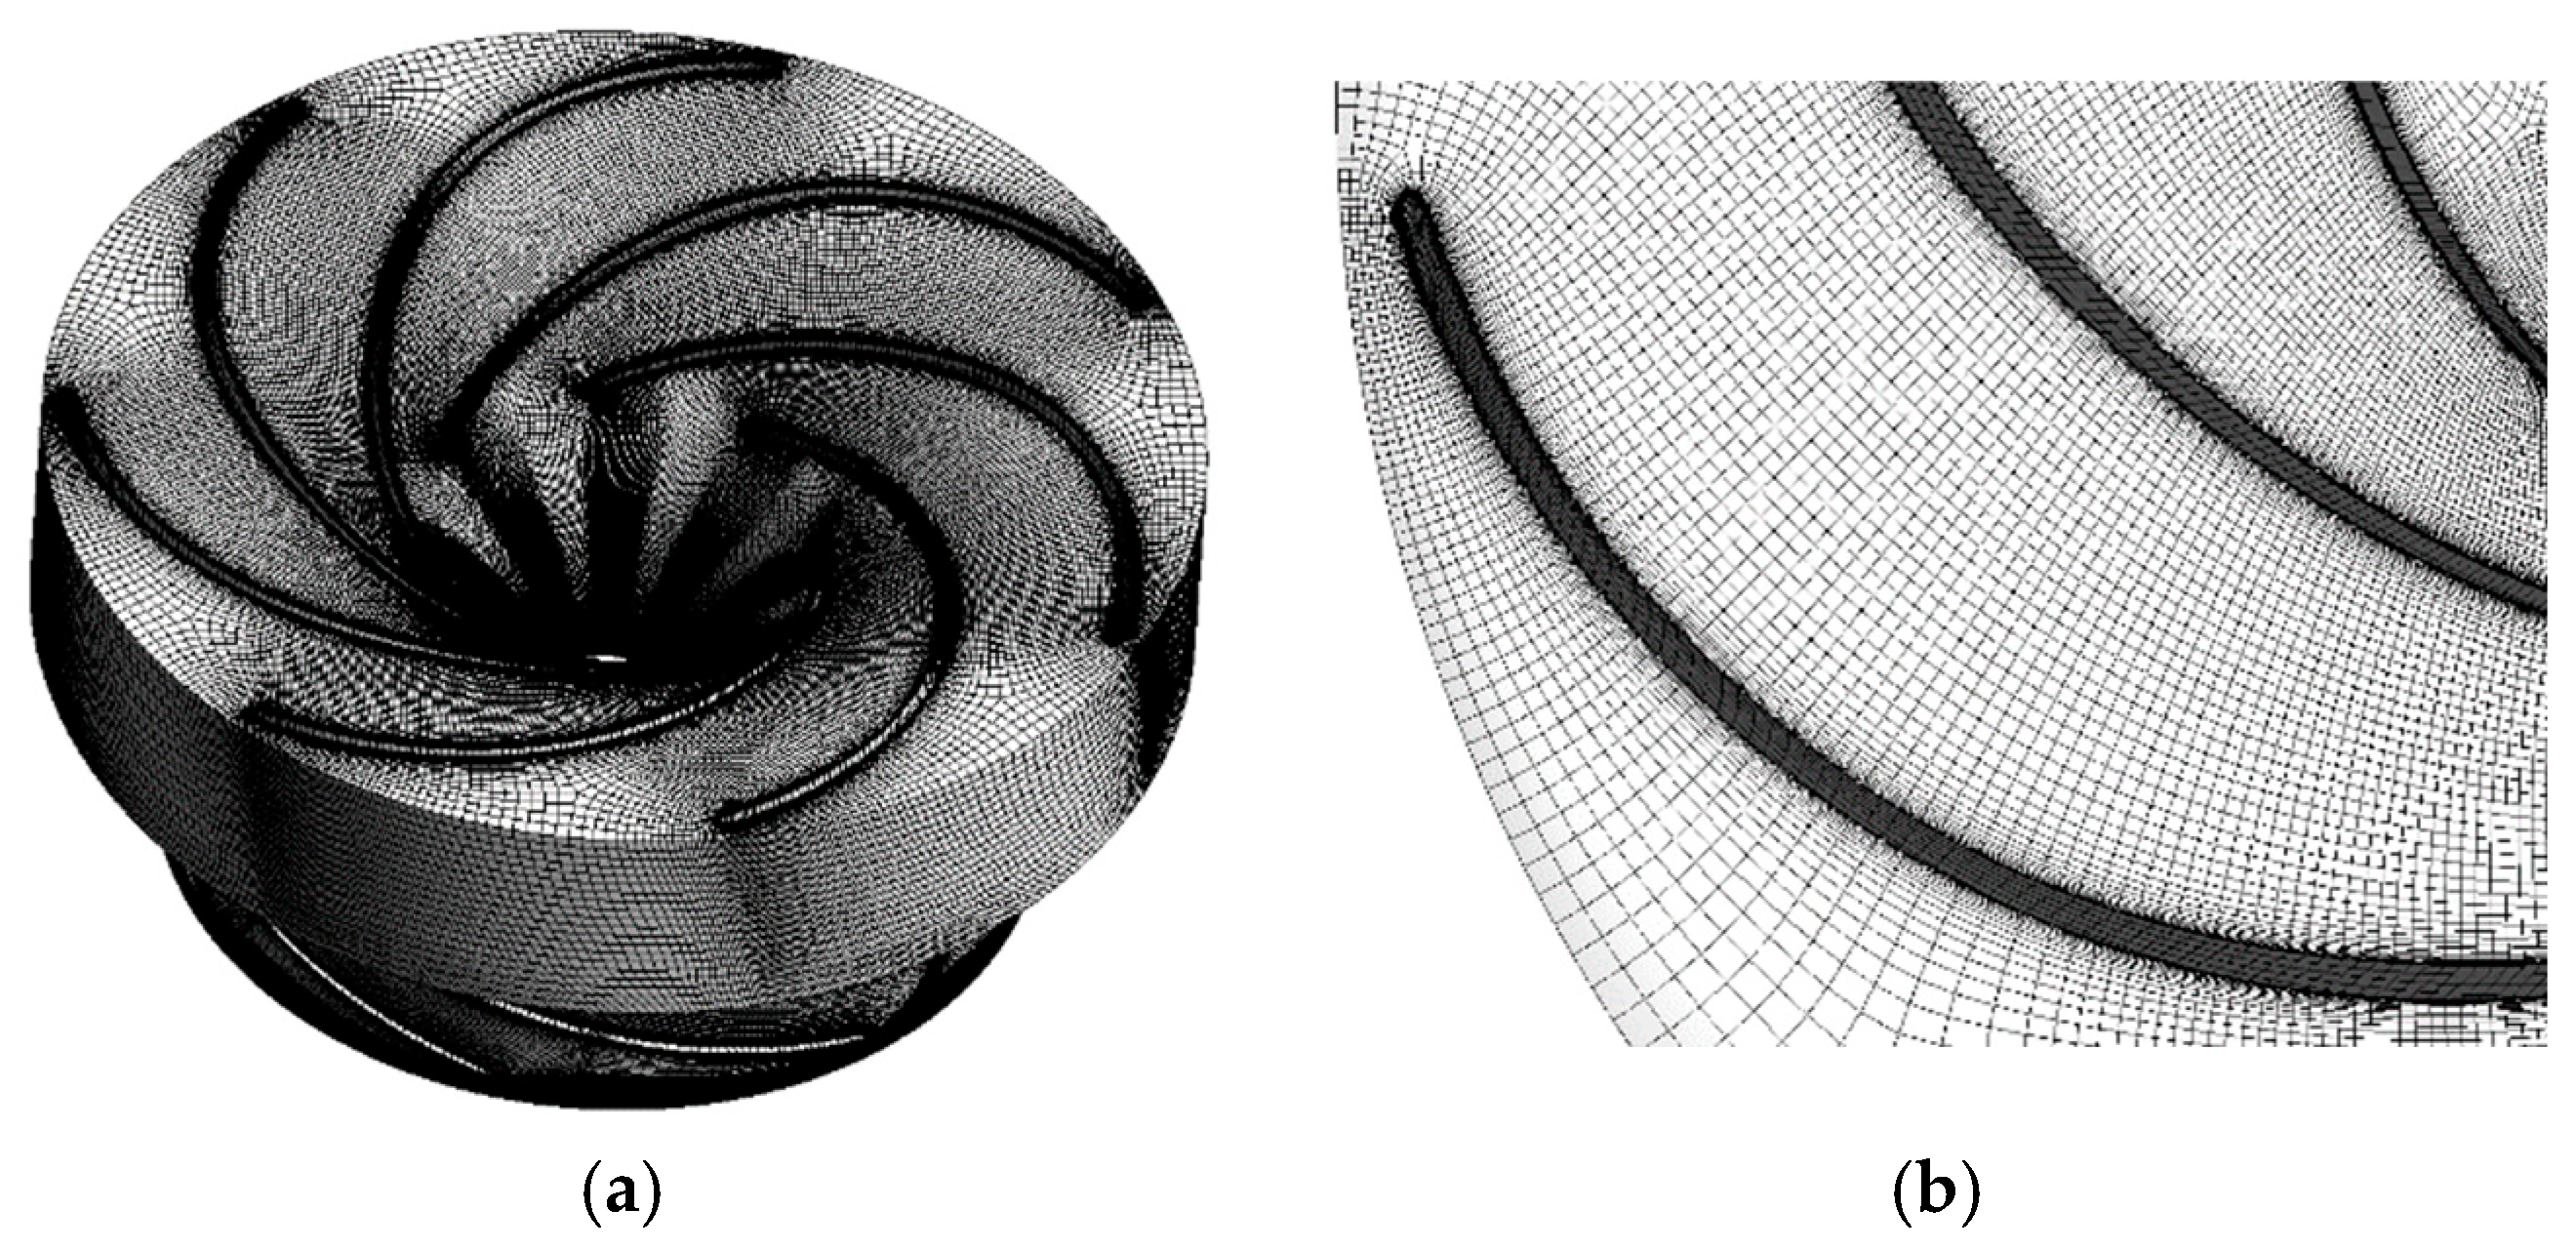
2. Research Object and Numerical Method

The physical model constructed for this paper used a prototype pump turbine with the specific parameters shown in Table 1. According to the definition of the specific speed in Equation (1), the specific speed of the pump turbine was n s = 228.
n s = n P H 5 4
where n is the rated speed, P is the rated power, and H is the rated head.
The overall 3D model is shown in Figure 1. In order to highlight this research’s focus, we separately adopted structured grids in the runner and draft tube parts, as shown in Figure 2 and Figure 3. The Y+ values at the blade surface were less than 300. Since the local Reynolds number was about 108, the encryption of the surface mesh was reasonable for the calculation requirements of the SST k-ω model. The total number of mesh nodes was 2.6 million, and the number of mesh nodes per component is shown in Table 2. Based on the grid independence verification performed in the authors’ previous study [7], this grid density is sufficient to resolve the internal flow patterns within the runner and draft tube.
Numerical simulations were carried out in ANSYS CFX using the Reynolds averaged Navier–Stokes (RANS) equations [31] for the internal flow characteristics of the pump turbine.
ρ t + x j ρ u j = 0
t ρ u i + x j ρ u i u j = p x i + x j μ u i t ρ u i u j ¯ + S M
where ρ is water density, p is the pressure, and u is the flow velocity. The range of indicators for i and j is (1, 2, 3), μ is the dynamic viscosity, S M is the external momentum source term, and τ i j = ρ u i u j ¯ are the Reynolds stresses. The SST k-ω model was used to solve the Reynolds stresses.
Boundary conditions: A pressure inlet and a pressure outlet were employed, since there are large reservoirs upstream and downstream of the pump turbine, specifying pressures is closer to the real case than giving flow rates. In the present case, the inlet pressure was 1.058 MPa and the outlet pressure was atmospheric. No-slip boundary conditions were used on all stationary walls. The rotating and stationary regions were modeled with a frozen rotor boundary and transient rotor–stator boundary for steady and unsteady simulations, respectively. For the unsteady simulations, the results from the steady simulations were used as the initial conditions. Within each runner rotation cycle, 360 time steps were calculated, giving a time step size of 8.33 × 10⁻⁴ s, and 70 rotation cycles were computed in total. Reference [32] presents extensive sensitivity tests on the grid and time step size for a pump turbine similar to that in the present study. It demonstrates that a time step equivalent to 3° of runner rotation per step can capture the flow features of the main working points, while 1.8° per step resolves the finer details under low-flow-rate conditions. Therefore, the selection in this work of 1° runner rotation per time step is good enough.

3. Results and Discussion

3.1. Field Test Results of Pressure Fluctuation

In previous work, we conducted field tests at the studied power plant and obtained pressure data from several measurement points. In turbine mode, we tested the pressure fluctuations at the elbow of the draft tube under various unit loads. The frequency domain results are shown in Figure 4. It can be observed that, at around 50% load, distinct low-frequency components emerged at the draft tube elbow, which were absent at lower or higher loads. We separately examined the operating points at 50% and 100% loads, whose signals and spectrum are shown in Figure 5. The pressure coefficient, C p , here is specified as Equation (4) [33]. The p p ¯ indicates the removal of the DC component from the original pressure signal. For the convenience of comparison, all frequency values below are expressed as the ratio of frequency to rated rotation frequency, that is, f/fn, where fn = 20.94 Hz.
C p = p p ¯ ρ g H
At 50% load, the dominant frequency of pressure fluctuation at the draft tube elbow was 0.23fn, with remarkably high amplitude. Based on our engineering experience, such a dominant frequency generally originates from the vortex rope in the draft tube. However, for the power plant, most pressure sensors are used to monitor the DC component, i.e., the instantaneous mean pressure, and due to the long pressure measuring lines and low sampling rates, the high-frequency components are limited. Therefore, after summarizing the preliminary field test results, more high-frequency contents (including rotor–stator interaction, RSI) still need to be analyzed using the CFD simulation results, especially the working point at 50% load.

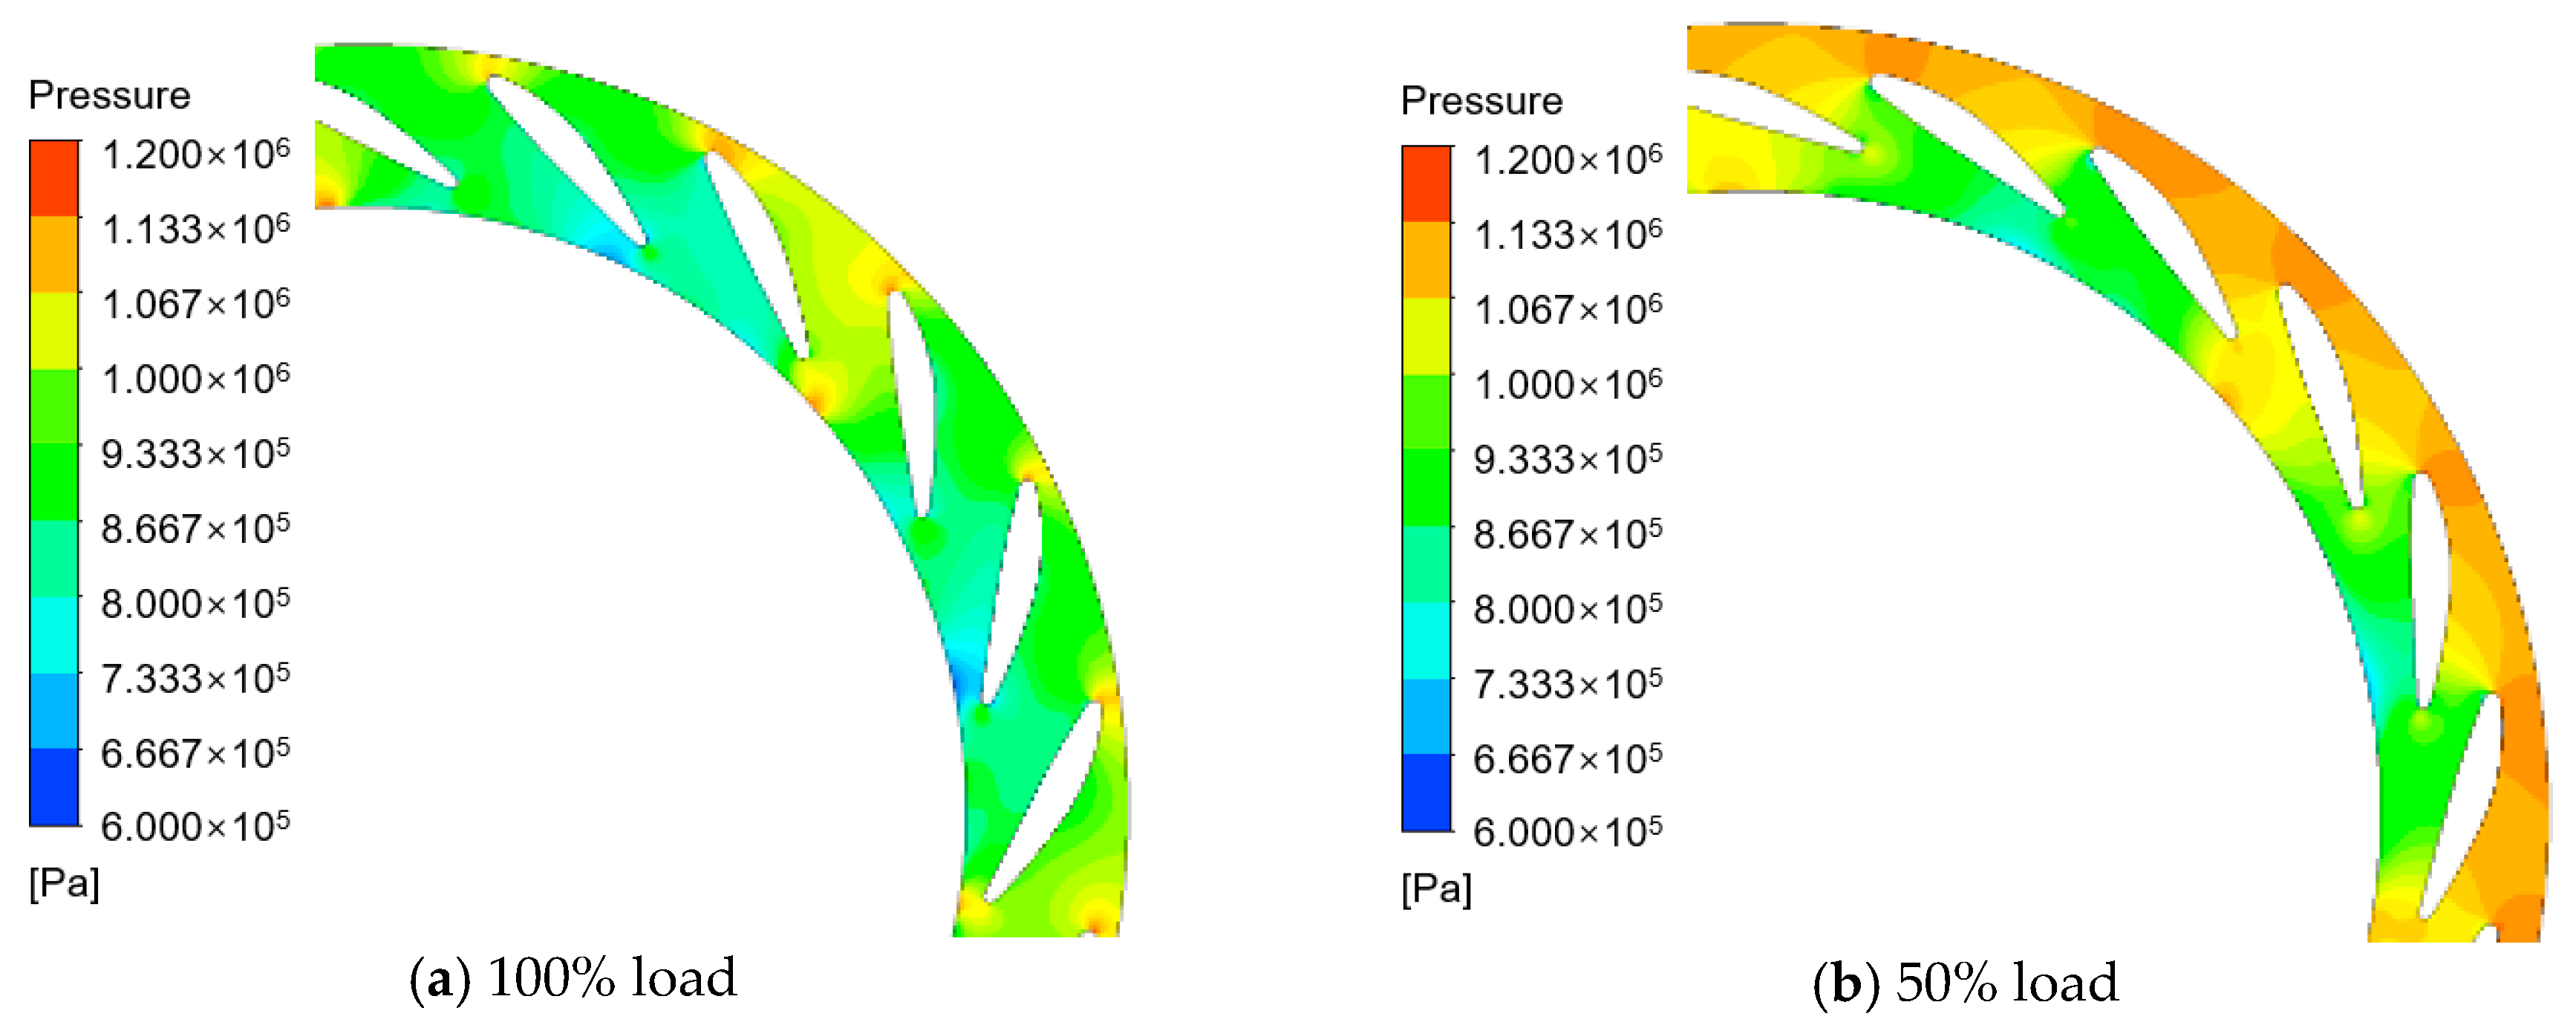
3.2. Internal Flow Characteristic of Ring and Runner

The internal flow characteristics excluding the draft tube should be shown first. Figure 6 shows the pressure distribution on the cross section of spanwise = 0.5 in the guide vane region under 100% and 50% loads. It is evident that the pressure near the outer edge of the guide vane is higher than that near the inner edge, indicating certain pressure loss around the guide vanes. As the load decreases, the pressure near the outer edge increases markedly, leading to a larger pressure difference between the outer and inner edges. This implies an increase in hydraulic loss in the guide vane region at partial load.
Figure 7 and Figure 8 show the streamline distributions in the isometric view and top view of the runner, respectively. At 100% load, the streamlines align well with the runner geometry, whereas at 50% load, the flow becomes turbulent to some extent. Flow separation vortices appear on the suction side near the leading edge of three blades, and an undeveloped vortex occurs on one blade. Since there are seven blades in total, it can be said that vortices exist in half of the flow passages, and the vortices locate at the mid-span of the blade’s leading edge.

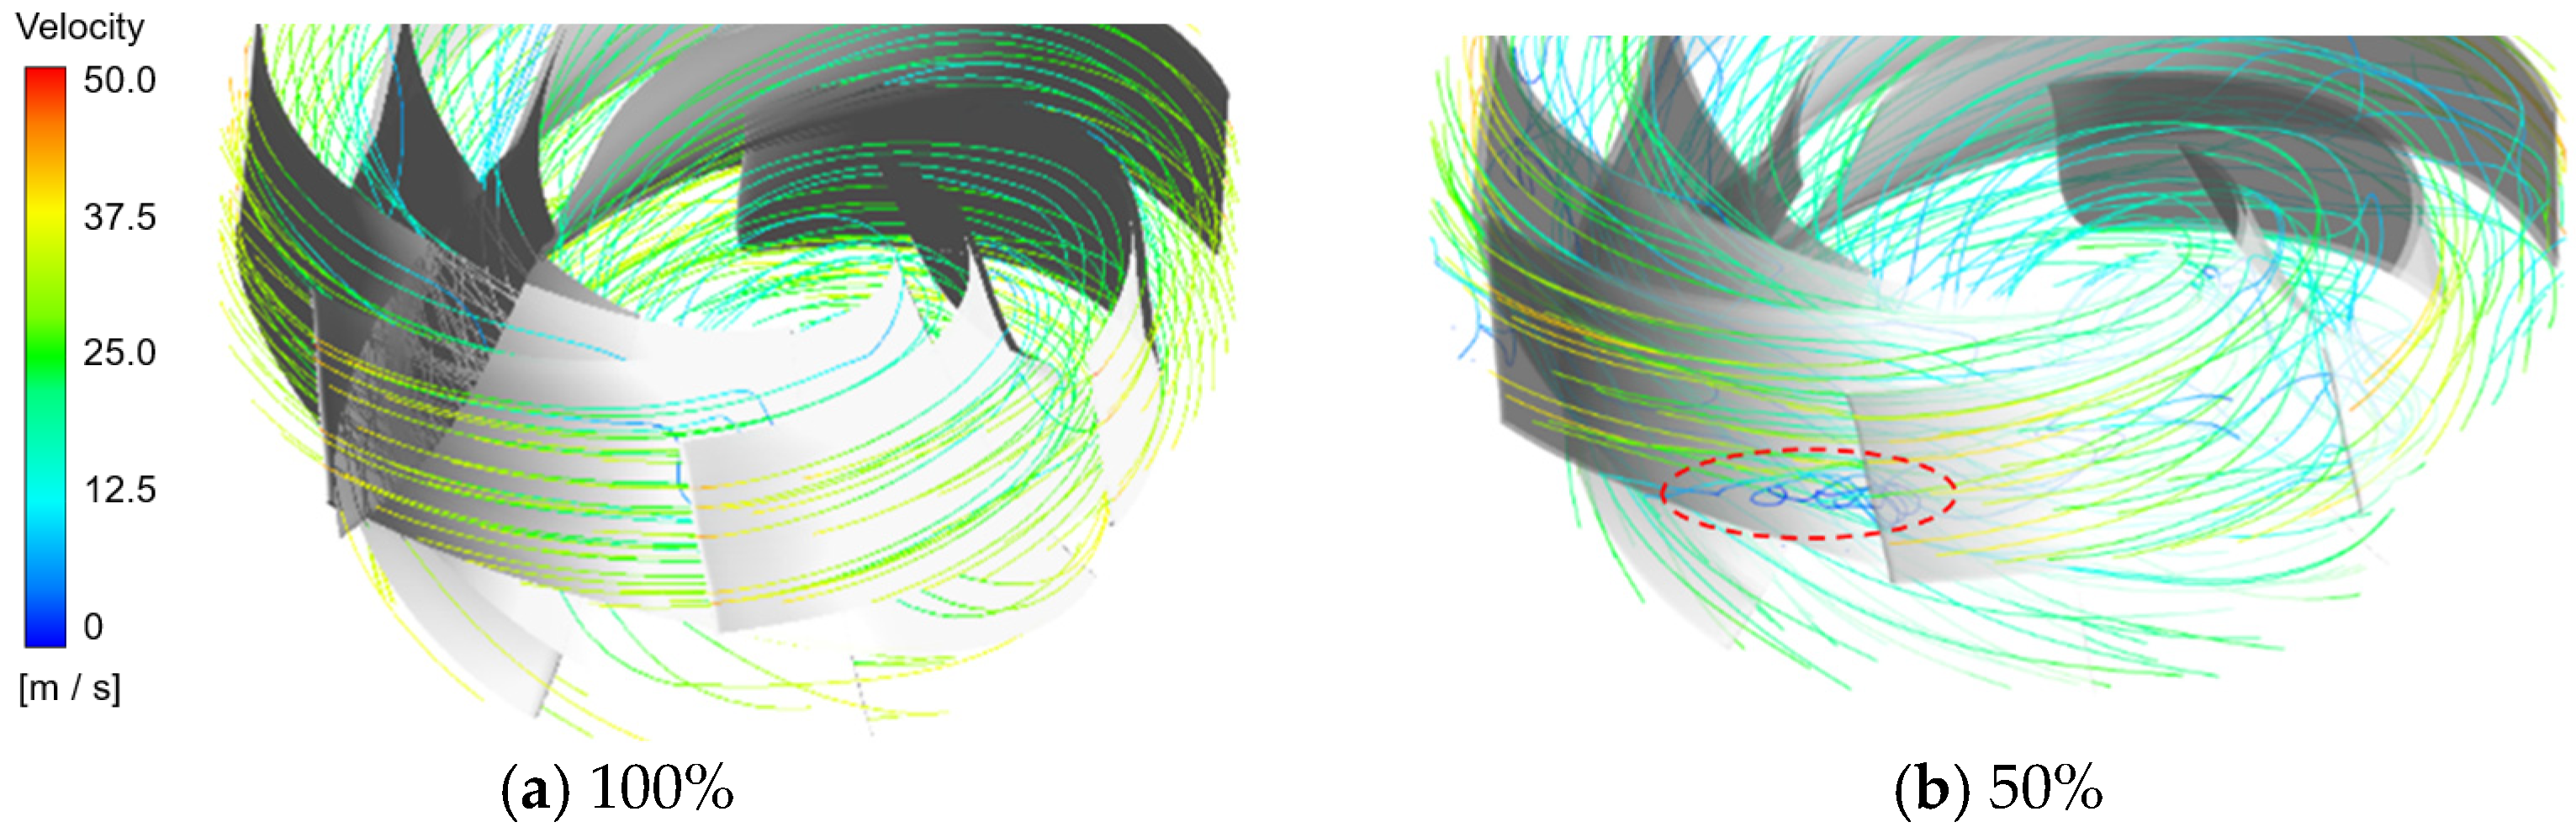
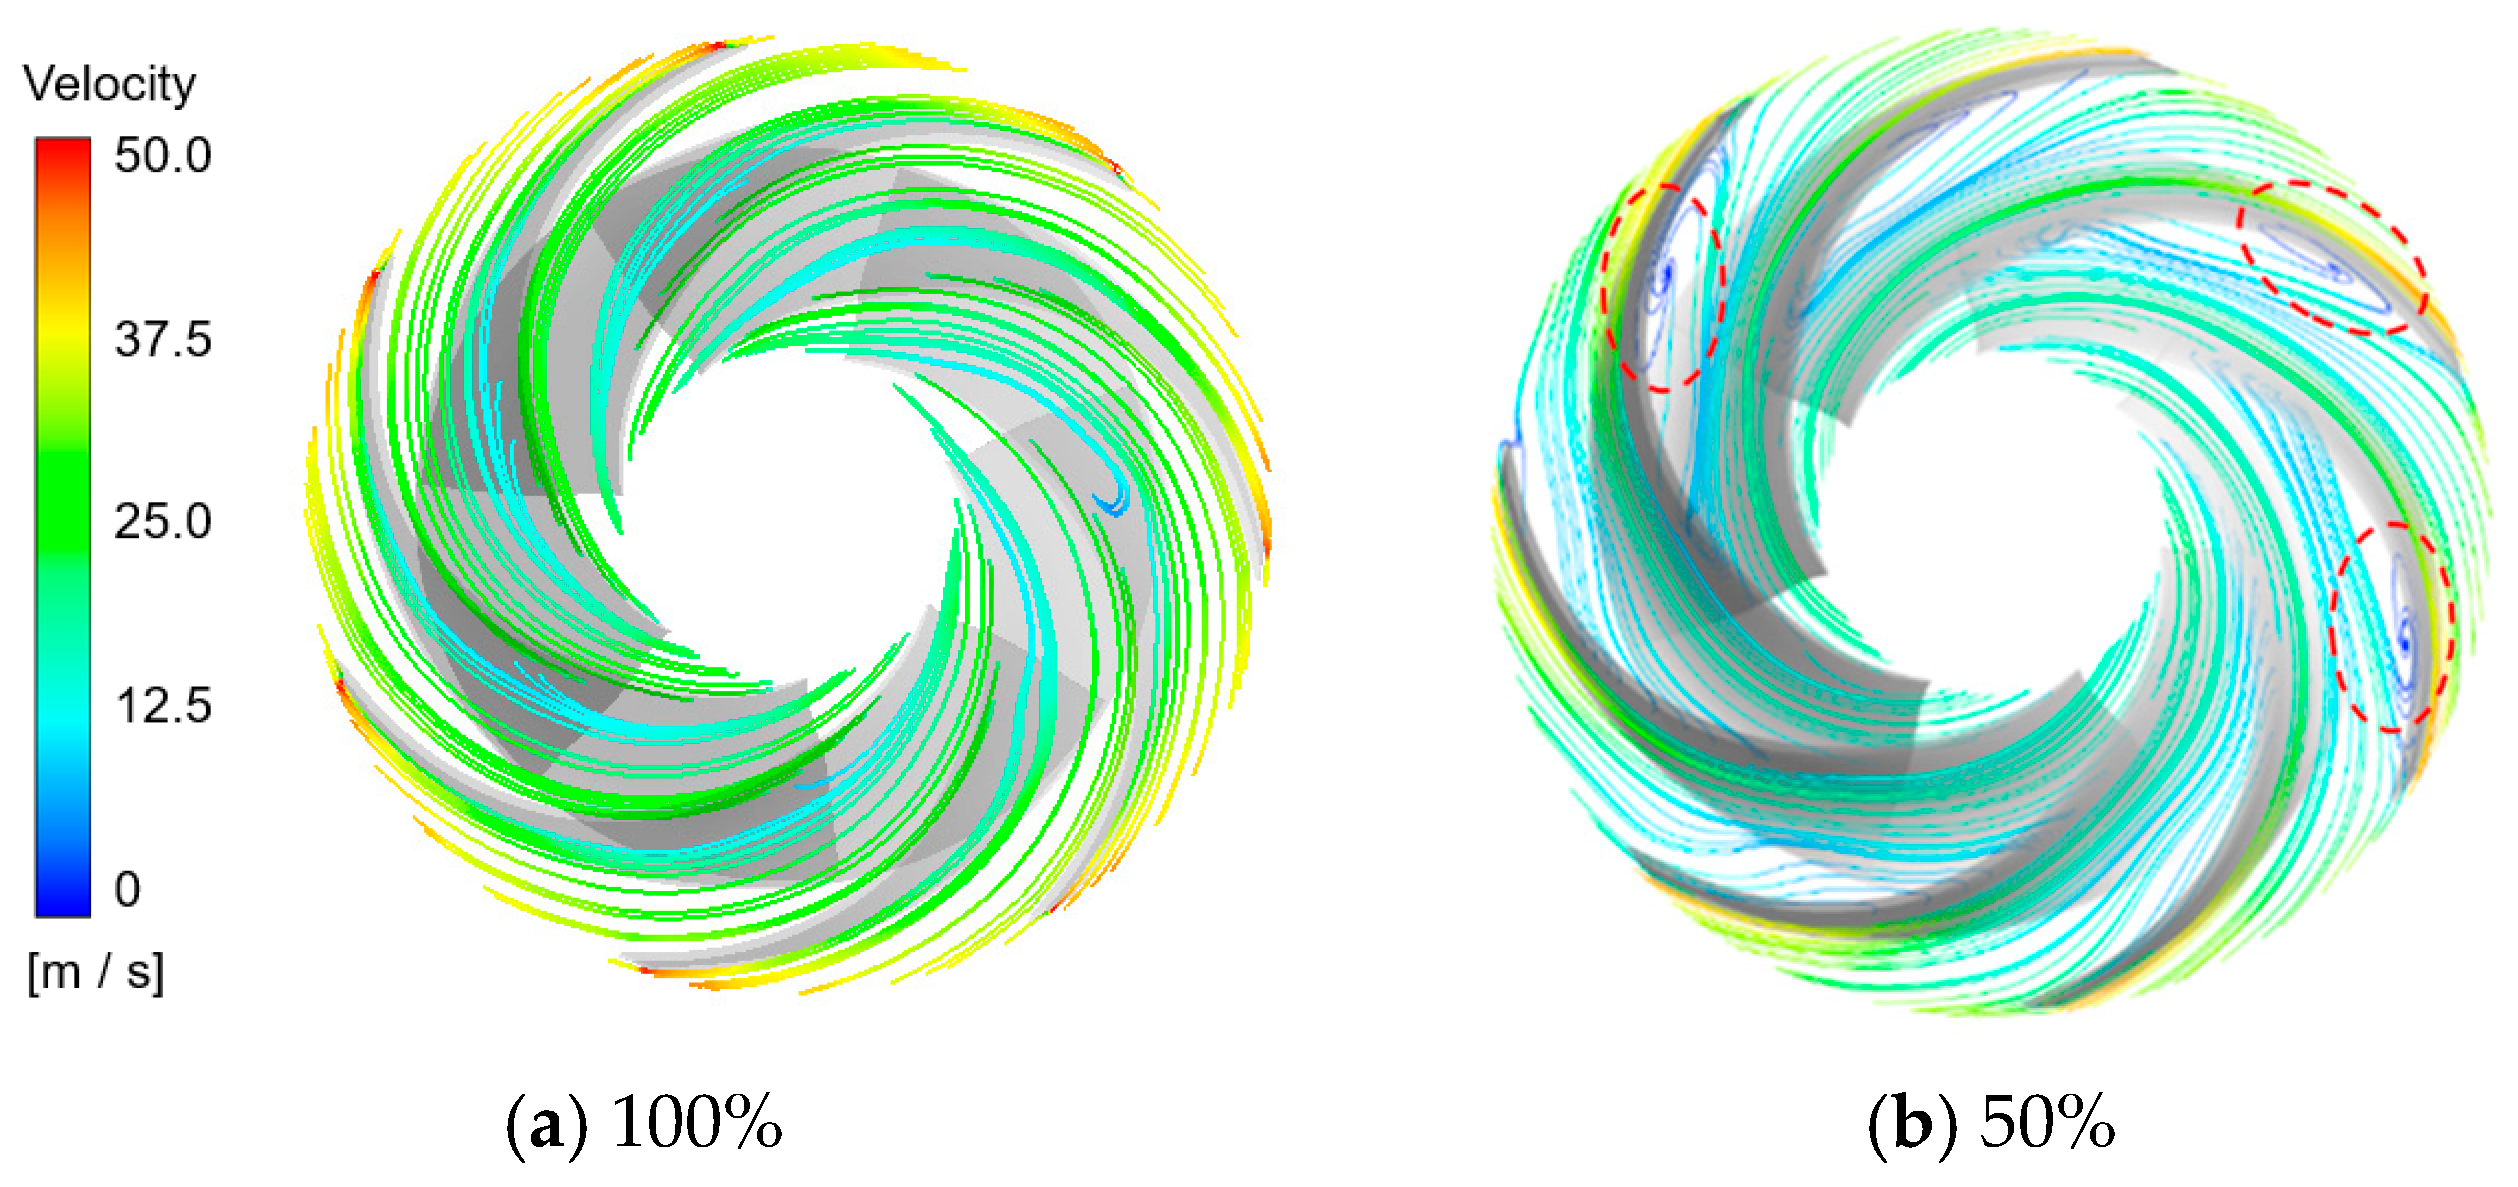
3.3. Internal Flow Characteristic of Draft Tube

Since the draft tube in this study has a single pier, we define the flow passages on both sides of the pier as Passage A and Passage B, as shown in Figure 9. It is evident that Passages A and B exhibited significantly different flow characteristics, i.e., asymmetry. At 100% load, the flow in Passage A and Passage B aligned better with the geometry of the draft tube, while the flow in Passage B was somewhat turbulent. At 50% load, the flow velocity near the outer wall at the inlet of the draft tube was high, with an obvious swirling motion, resulting in an uneven flow distribution between Passages A and B, and the flow characteristics became more complex. Judging from the flow streamline density, the majority of flow was concentrated on the left side of Passage A, while a large vortex formed on the right side of Passage A near the pier. In Passage B, low-speed spiral motion dominated. Near the outlet of the draft tube where the pier disappeared, the spiral flow in Passage B from the bottom mixed with the high-speed region in Passage A.
The difference in streamline density between the two passages means a difference in the flow rate. It intuitively comes from the geometry: as the center-symmetric vortex flow turns from vertical to horizontal inside the draft tube elbow, the curvature means shorter effective lengths near the top of the draft tube elbow and longer effective lengths near the bottom. Based on the direction of rotation, the top fluid mainly flows from Passage A to Passage B, which means fluid obstructed by the prematurely encountered pier accumulates in Passage A. The bottom fluid mainly flows from Passage B to Passage A, entering the pier later and allowing more fluid transfer across passages. The combined result is visibly greater discharge in Passage A over Passage B. The abstract diagram is shown in Figure 10. There is obviously more fluid on the side of Passage A (dashed blue line) than on the side of Passage B (solid blue line).
In Figure 11, two cross sections S1-A and S2-B are selected along the flow direction to observe the flow characteristics inside the vertical plane. The surface streamlines are shown in Figure 12. At 100% load, only a small back-flow area appeared on the outer side of the elbow in the draft tube, with a relatively low vortex intensity. Even though spiral motion existed in Passage B to some extent, the back-flow area was small. At 50% load, the vortex area at the elbow increased, distributing closer to the center of the flow cross section. Passages A and B exhibited significant differences: a large vortex formed near the pier in Passage A, while a large vortex appeared near the outlet of the draft tube in Passage B. Judging from the streamline distribution, the presence of the pier has such an effect: splitting the high-speed swirling flow at the inlet of the draft tube into two parts, one recirculating and dissipating in Passage A, while most of the angular momentum is stored in the slower outflow in Passage B, then mixing and dissipating after the pier ends. To some extent, this design reduces the likelihood of intense pressure fluctuation at specific frequencies, but the resulting changes in pressure distribudtion characteristics need further examination.
Intuitively, the flow asymmetry would lead to differences in the pressure distributions between the two passages, with the load likely also impacting these differences. However, unexpectedly, the results for the average pressure distributions at S1-A and S2-B shown in Figure 13 did not exhibit quite significant discrepancies, except for the larger high-pressure zone on the outer side of the draft tube elbow at 50% load. This may be an advantage conferred by the presence of the pier—despite the apparent differences in flow characteristics between the two passages, strong pressure differentials are not induced, which is important for improving the hydraulic efficiency and fatigue life of structural components.
To observe this further, we chose several sections along the mainstream direction to check the process of pressure differential change. Their pressure contour maps are displayed in Figure 14, which allows us to further see how the pier played a role in this process. At 100% load, the two passages had relatively symmetric pressure distributions. Although there was a high-pressure zone near Passage B at section S2, both passages maintained a similar concentric circular pressure distribution when entering sections S3 and S4. With the generation of the vortex rope at 50% load, the pressure distribution at section S2 showed an evident low-pressure zone at the inlet of Passage A and a high-pressure zone at the inlet of Passage B. However, this difference was mitigated suddenly when entering section S3, at the cost of Passage B losing the concentric circular pressure distribution. Judging from the results, Passage B reduced the global pressure differential with Passage A through localized pressure adjustments.
From the distribution of turbulent kinetic energy in Figure 15, it can be seen that under 50% load, the flow inside the draft tube was unstable, the velocity fluctuation increased, and the turbulent kinetic energy increased and presented an uneven distribution. Overall, the turbulent kinetic energy decreased significantly after entering the passage on both sides of the pier. Additionally, at the S4 section in the middle of the pier, the turbulent kinetic energy in channel A was significantly higher than that in channel B. The occurrence of these results is understandable in light of the preceding analysis. At 50% load, a vortex rope developed in the draft tube. Regions approaching red in the color contours denote areas significantly influenced by the vortex rope. Such high-turbulence fluids divide—one part entering Passage A, another entering Passage B. However, lower mainstream velocities in Passage B afford ample time for turbulence dissipation. Thus, by cross section S4, these fluids demonstrated drastically lower turbulence than in Passage A. Fundamentally, dissipation constitutes energy loss, eventually manifesting pressure decreases. This further validates the rapid pressure differential reduction between Passages A and B—Passage B experienced immense dissipation around cross section S3.

3.4. Spectral Characteristics of Draft Tube Pressure Fluctuation

Figure 16 shows the distribution of monitoring points in the draft tube. Points dt1 to dt3 were at different heights in the draft tube; dt5, dt7, and dt9 were in Passage A of the draft tube; and dt4, dt6, and dt8 were in Passage B of the draft tube.
Figure 17 shows the pressure fluctuation spectra of monitoring points in the draft tube at 100% load. The results indicate that at 100% load, no draft tube vortex rope was generated. The monitoring points were mainly affected by rotor–stator interaction, exhibiting frequencies like 7fn, 14fn, and 21fn. The amplitude of rotor–stator interaction frequency decreased as the distance from the runner increased. However, near the pier in Passage B, dt8 showed a low-frequency vortex frequency of 0.1fn, and near the pier in Passage A, dt9 also exhibited 0.2fn. Looking back at Figure 12a,b again, the reason for the discrepancy in the dominant frequencies of the two low-frequency components can be identified. The streamlines in Passage A are relatively smoother with less backflow, while Passage B has an adverse pressure gradient, and the streamlines bend twice. In the front section of the pier, the same pressure fluctuation may occur twice, resulting in a higher dominant frequency compared to Passage A.
Figure 18 shows the pressure fluctuation spectra of monitoring points in the draft tube at 50% load. At all monitoring points, 21fn lot its dominance, 7fn and 14fn almost disappeared. Instead, low-frequency peaks emerged. At most points, the low-frequency component centered at 0.2fn had a relatively prominent peak, but some monitoring points still exhibited slight differences. The dt5 point had more low-frequency components with a wider frequency band, corresponding to the large back-flow area on the pier side of Passage A and the confluence point where the mainstream and recirculation flow merged. It is imaginable that complex vortex characteristics are generated there. Point dt8 was exceptionally different, with a very low amplitude at 0.2fn, while 0.13fn and 0.4fn appeared as compensation, though the peaks of these two frequencies remained insignificant. From Figure 14b, two local minimums can be observed in the pressure distribution on the cross section S4 of the passage, indicating that the 0.2fn vortex in Passage B is split into 0.13fn and 0.4fn vortices at the middle of the pier, and the amplitudes are low because the energy is shared. This phenomenon is highly likely due to kinematic progression caused by flow evolution—it is also essentially due to the position of the pier, which is important for improving the understanding of flow inside draft tubes with a pier.

3.5. Discussion

3.5.1. Evolution Process of Vortex Rope

As a supplement, the morphology of the draft tube vortex rope can be observed to discuss the cause of 0.2fn under 50% load. The vortex rope edge is represented by the iso-surface of velocity λ2 = 0 as illustrated in Figure 19. The rotation period of the runner T = 1/fn = 0.3s, and it can be seen that the draft tube vortex rope exhibited a periodic evolution pattern over five rotation periods of the runner. At 0T, vortex ropes existed at both the inlet and elbow of the draft tube. Afterward, the vortex rope volume at the inlet decreased, while the one at the elbow increased. Until 2/3T, the inlet vortex rope disappeared. Then, the elbow vortex rope split into two parts, one moving toward the inlet, the other moving toward the pier. The part moving toward the pier gradually dissipated when approaching the pier, and completely disappeared at 5/3T. The part moving toward the inlet became shorter and thicker during 5/3T to 13/3T, with reducing volume, until a new vortex rope was generated at the elbow again at 5T, similar to the structure at 0T. This fully demonstrates that the 0.2fn frequency component originated from the periodic generation, movement, and decay of the draft tube vortex rope.

3.5.2. Complementary Shape of Vortex Rope and Recirculation Zone

Figure 20 shows the recirculation zone corresponding to the draft tube vortex ropes and the flow lines inside the runner at different moments, which can be used to observe the influence of the vortex rope evolution. It is evident that the vortex rope and recirculation zone exhibited a complementary morphology in their distributions: At 0T and 2/3T, the large vortex rope volume at the elbow caused a flow blockage there, resulting in extensive recirculation in the center region of the draft tube’s straight cone section. Meanwhile, vortex motion also occurred in the center region inside the runner. As the main vortex rope body moved toward the inlet, the recirculation zone decreased, and the flow inside the runner also gradually improved, especially at 10/3T when the recirculation zone almost disappeared. Afterward, the recirculation zone emerged again at the elbow and started the next cycle.

3.5.3. Effect on the Runner

We also evaluated the influence of vortex rope evolution on the upstream runner through spectral analysis. In the rotating coordinate system, two typical pressure fluctuation monitoring points were selected inside the runner, as shown in Figure 21: rn1 located near the inlet of the runner, and rn3 located near the outlet of the runner. From the pressure fluctuation spectra in Figure 22, it can be seen that the runner inlet was dominated by the rotor–stator interaction with a main frequency of 20fn, while the runner outlet was dominated by the draft tube vortex rope frequency of 0.8fn, which presents a considerably large amplitude. This indicates that, within one evolution cycle of the draft tube vortex rope, the interior of the runner experienced four pressure pulsations induced by the draft tube vortex rope. It is intricately linked to the alternate impingement on the runner outlet by the vortex rope and the recirculation zone in the cone section.

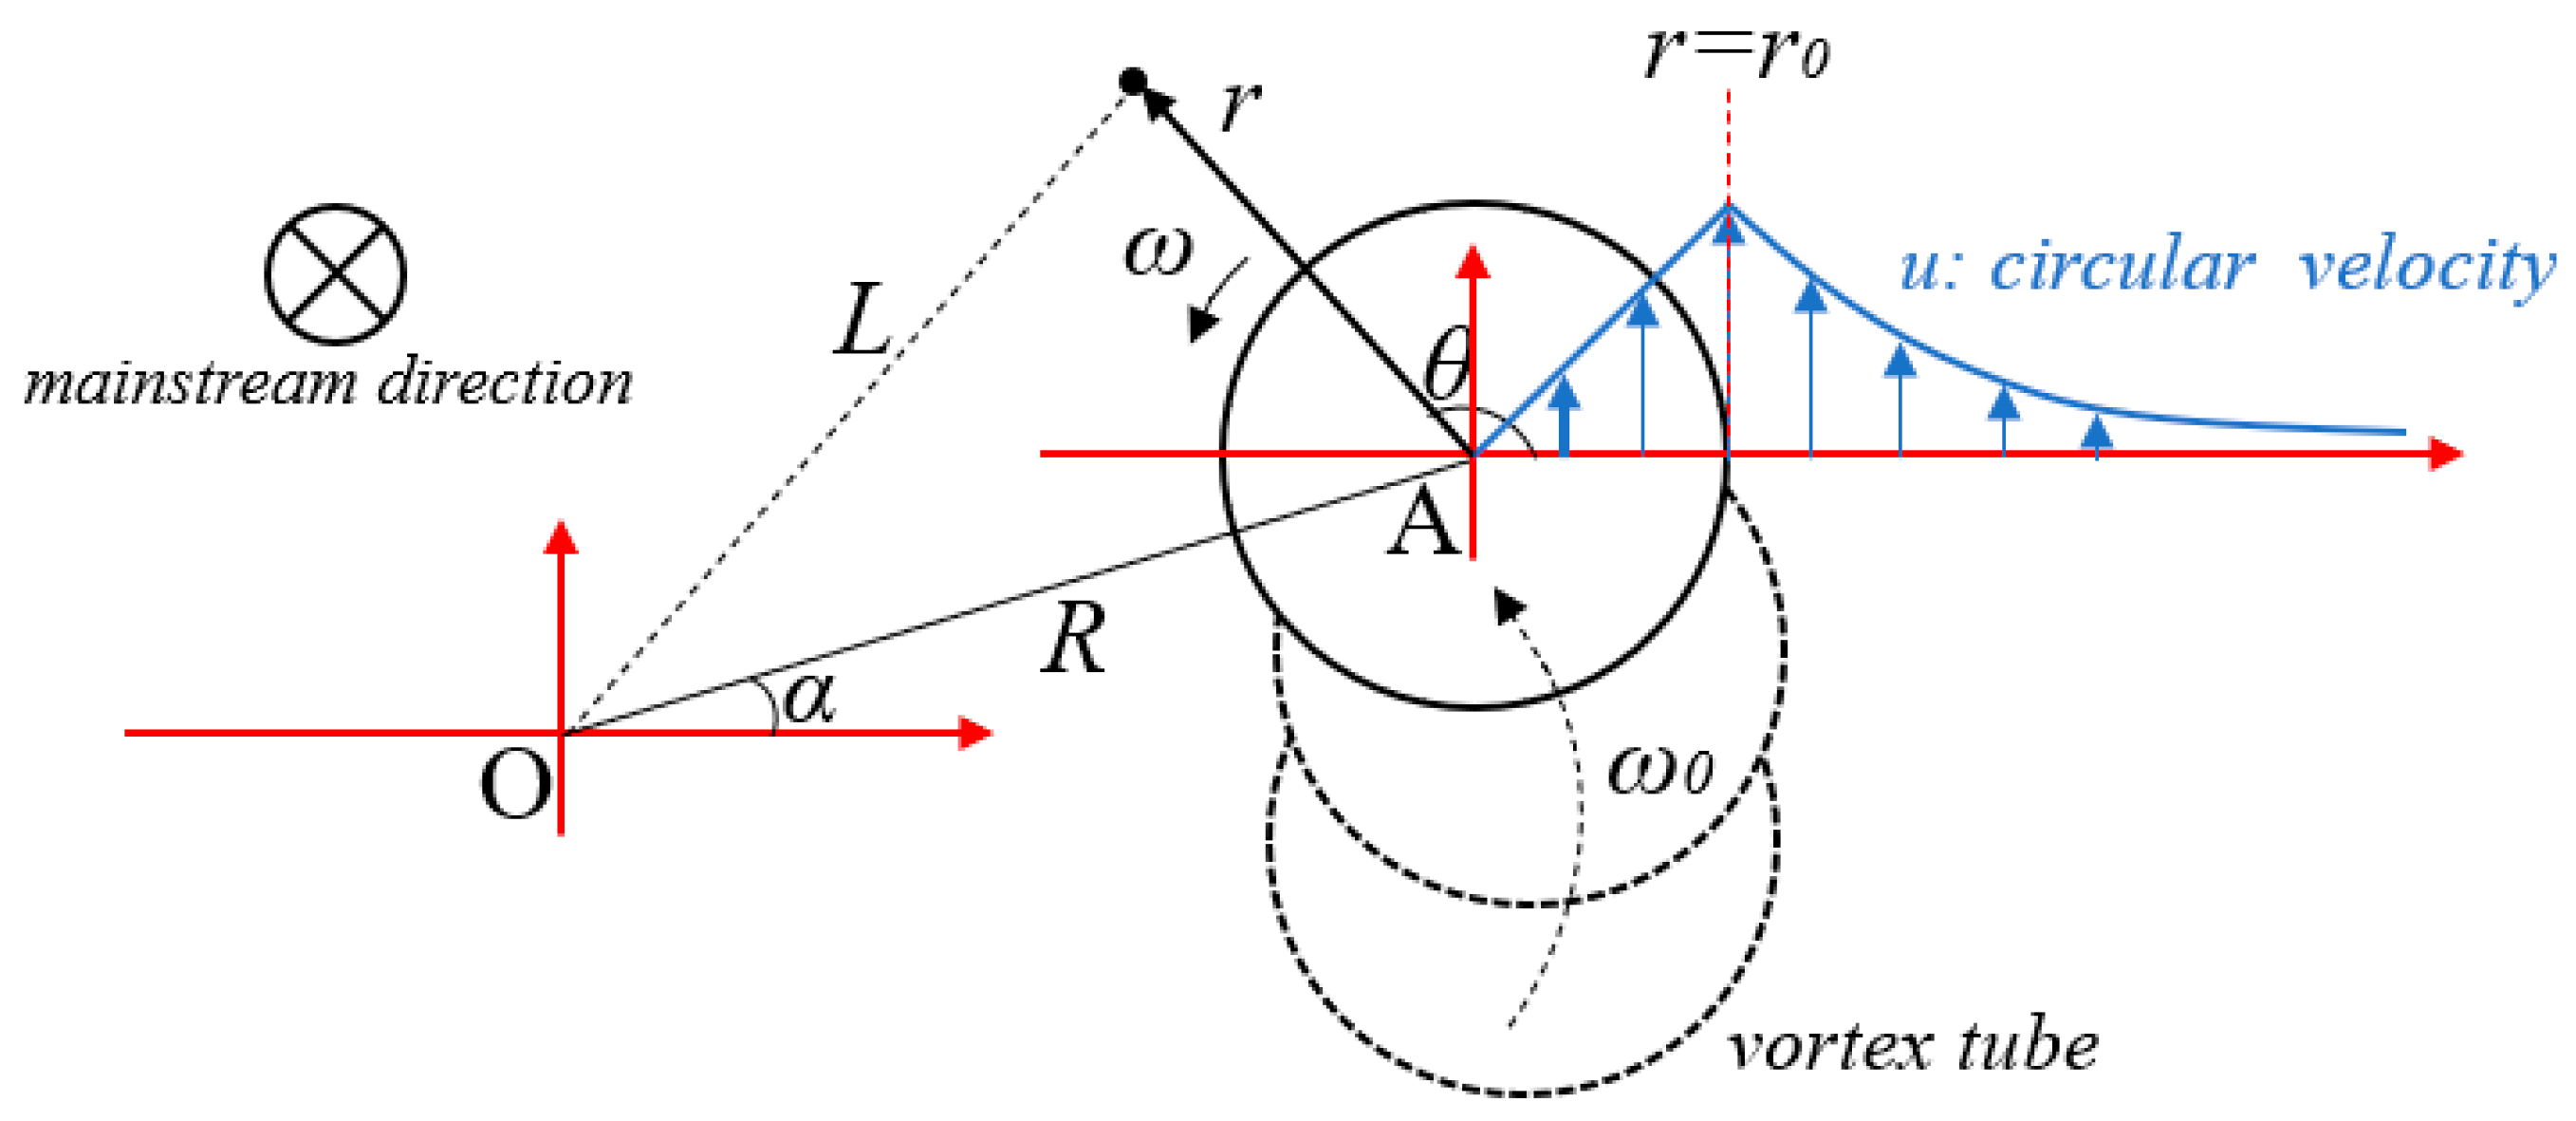
3.5.4. Preliminary Analysis of Fluid Kinematic Progression

When discussing Figure 18 previously, we mentioned the potential existence of kinematic progression. Here, a preliminary explanation for this progression phenomenon is provided based on vortex theory. Influenced by geometric potential, the vortex tube experiences twisting, causing the vortex tube center to deviate from its initial rotation center and revolve around it. The definitions of various parameters are illustrated in Figure 23. Inside the vortex tube ( r r 0 ), the flow is dominated by a forced vortex, while outside ( r > r 0 ), it is dominated by a free vortex. Here, for ease of analysis, we neglected the transition region in between. According to the energy equations of vortex theory [34] (Equation (5)), the circumferential velocity distributions inside and outside the vortex tube, namely u f o r c e d and u f r e e , follow Equations (6) and (7):
d H d r = u g d u d r + u r
u f o r c e d = ω r
u f r e e = c r
where c is a constant. Then, for a vortex tube with a revolution angular velocity of ω 0 , the relative velocity v r and the convected velocity v c are described in Equations (8) and (9), respectively. Additionally, the distance L between any fluid particle and the origin O is given by Equation (10):
v r = ω r sin θ , ω r cos θ                     r r 0 c r sin θ , c r cos θ                             r > r 0
v c = ω 0 R sin α , ω 0 R cos α
L = R cos α + r sin θ , R cos α + r cos θ
here c = ω r 0 2 . According to Helmholtz’s theorems, vortex tubes demonstrate conservativity. In the present analysis, this manifests as the integral conservation of velocity moments inside the control volume, as given in Equation (11):
r = 0 r θ = 0 2 π ν r + ν c L d θ d r = c o n s t .
After simplification, we obtain Equation (12) as follows:
r 3 ω + 6 R 2 ω 0 = c o n s t .
where r is the upper limit of the control volume’s radius. In theoretical analysis, this value is infinite, but in actual fluid flows, we can still select an appropriate upper limit based on the situation, representing the maximum dominant range of the vortex tube in complex flow fields. Meanwhile, the mainstream velocity, namely the flow velocity along the vortex tube’s extending direction, will also affect r through the continuity equation. This may hold significance for more in-depth analyses, but Equation (12) alone can already offer us a clear explanation for the occurrence of splitting at 0.2fn in Passage B—the vortex tube experiences twisting under the influence of both mainstream and geometric potential, with its twisting frequency and fluid vortex frequency demonstrating opposite variation trends.

3.5.5. Comparability and Limitation of Experimental and Numerical Simulations

From researchers’ expectations, greater alignment of numerical results with experiments is preferred. This consistency is more likely to occur in model tests predicting pump turbines’ overall energy characteristics, while for more delicate, local traits like pressure fluctuation in a prototype test, the situation is much worse. Fully comprehensive prototype data comparable to numerical simulations are rarely attainable. The authors provide two examples here. First, the power plant involved used ~10m long measuring pipes, severely attenuating high-frequency components in pressure fluctuation signals. In Figure 5, absence of rotor–stator interaction (RSI) at the draft tube elbow seems fallacious when considering common knowledge or contrasting with numerical results (Figure 17). This reflects one limitation of prototype testing—the majority of power plants were constructed sans considerations for intricate measurement requisites.
As a second example, the said plant (and numerous others) adopted annular pipelines or aggregated chambers for pressure extraction, necessitating multiple boreholes per cross section. For instance, tapping at 0°, 90°, 180°, and 270° orientations of a draft tube cross-section to get four boreholes, then connecting them and entering the same sensor for an “average” value. Aside from hampering pulsation measurement accuracy, such schemes inherently disturb the internal flow. Thus, consistently evaluating the relative accuracy between testing and simulation proves difficult—perhaps the CAD modeling, turbulence model, and boundary conditions of numerical simulation will have an impact on the accuracy, but there are also many unexpected factors in the test. Nonetheless, clearly capturing fluid phenomena bears significance for the current work, at least underscoring the necessity of future model tests with pier inclusion.
The only stronger consistency manifests in the draft tube vortex rope frequency. The test showed 0.23 fn at 50% load versus 0.2 fn in simulations. This minor numeric deviation matters less as the author’s past study [35] demonstrates test variability in this frequency. The extremes of spectrum amplitude signify the absolute dominance of the vortex rope near a 50% load. The field tests relayed data more akin to Figure 18c’s simulation at dt3, where the vortex rope’s second harmonic appeared in both.
Thus, the simulations essentially expand upon the field test data presently. Long-term prototype pump turbine research requires optimization from the design stage—improving test accuracy for enhanced comparability against simulations.

4. Conclusions

This paper uses numerical simulation methods to study the internal flow characteristics of a pump turbine with a single pier in the draft tube. The results are as follows:
(1)
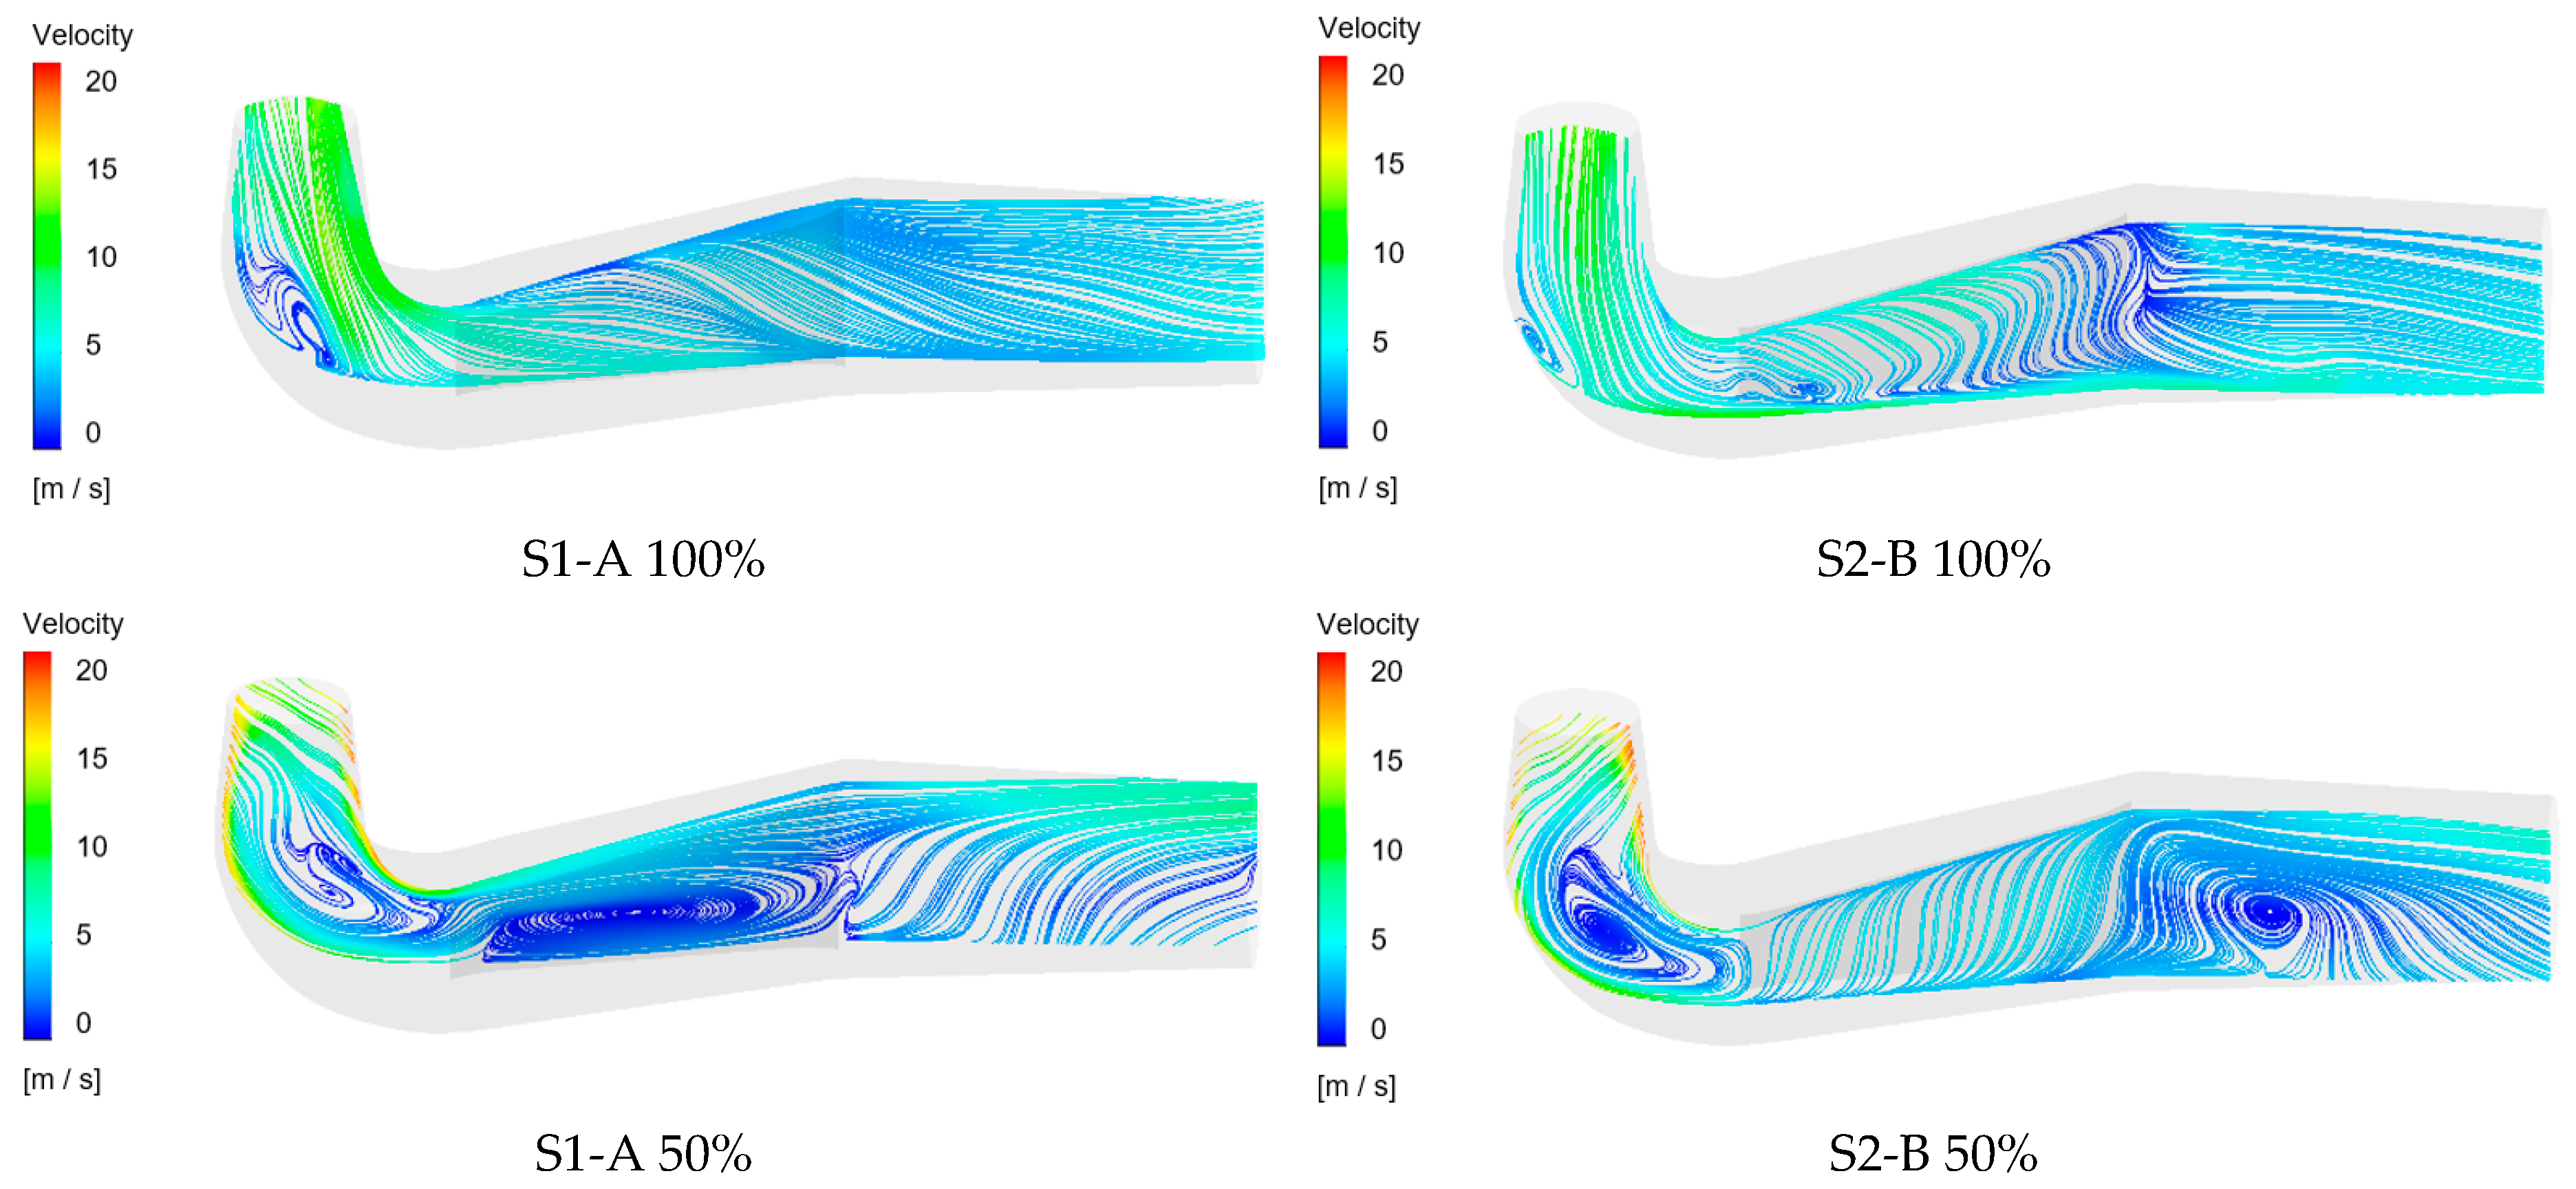
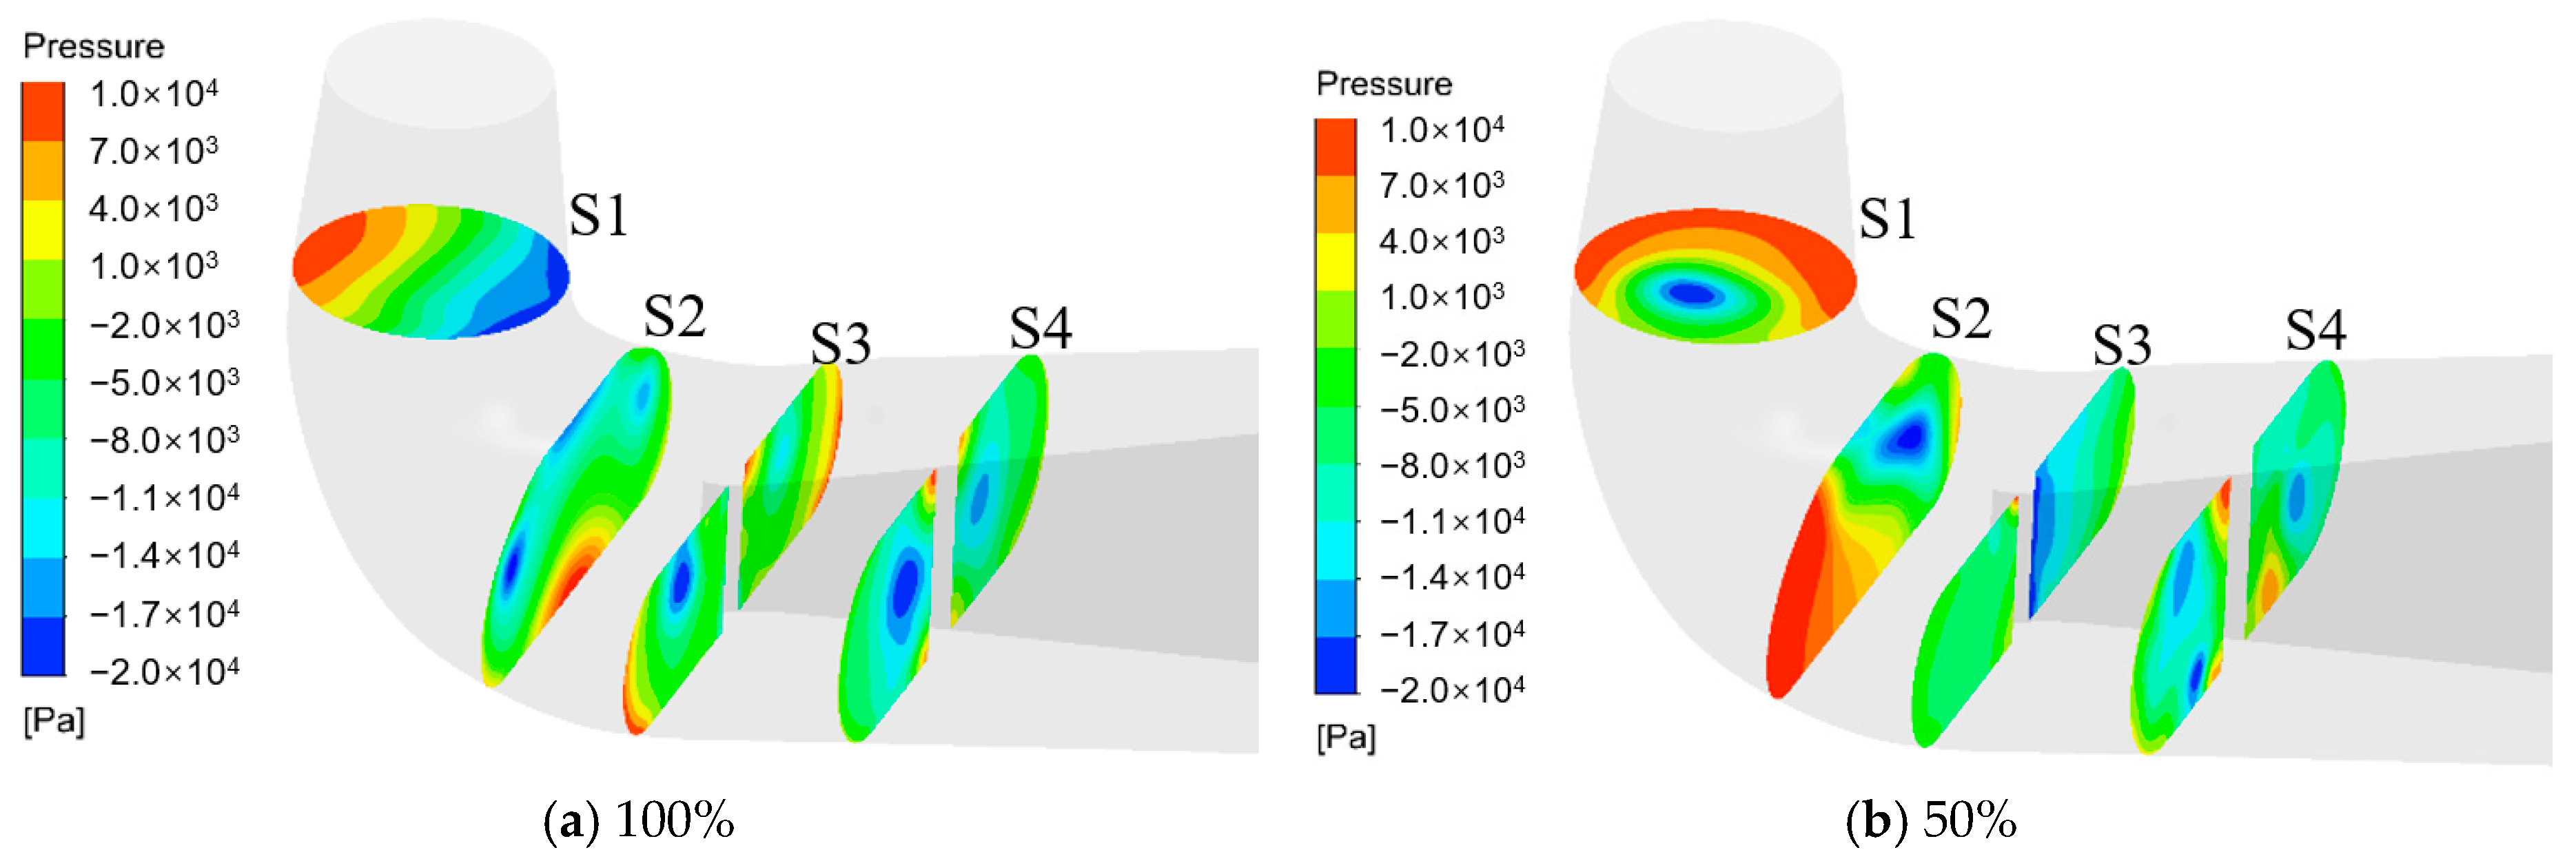
The asymmetry of the flow is preordained. At 100% load, the flow in Passage A and Passage B on both sides of the pier was relatively consistent with the geometric contour of the draft tube. At 50% load, Passage A had a larger flow rate and generated a large area of vortex near the pier. Passage B mainly exhibited a low-speed spiral motion, mixed with the high-speed area of Passage A, and formed a large-scale vortex at the outlet of the draft tube. The existence of the pier made Passage B reduce the global pressure difference with Passage A through localized pressure adjustments and also reduced the turbulent kinetic energy of the fluid, especially in the front section of Passage B.
(2)
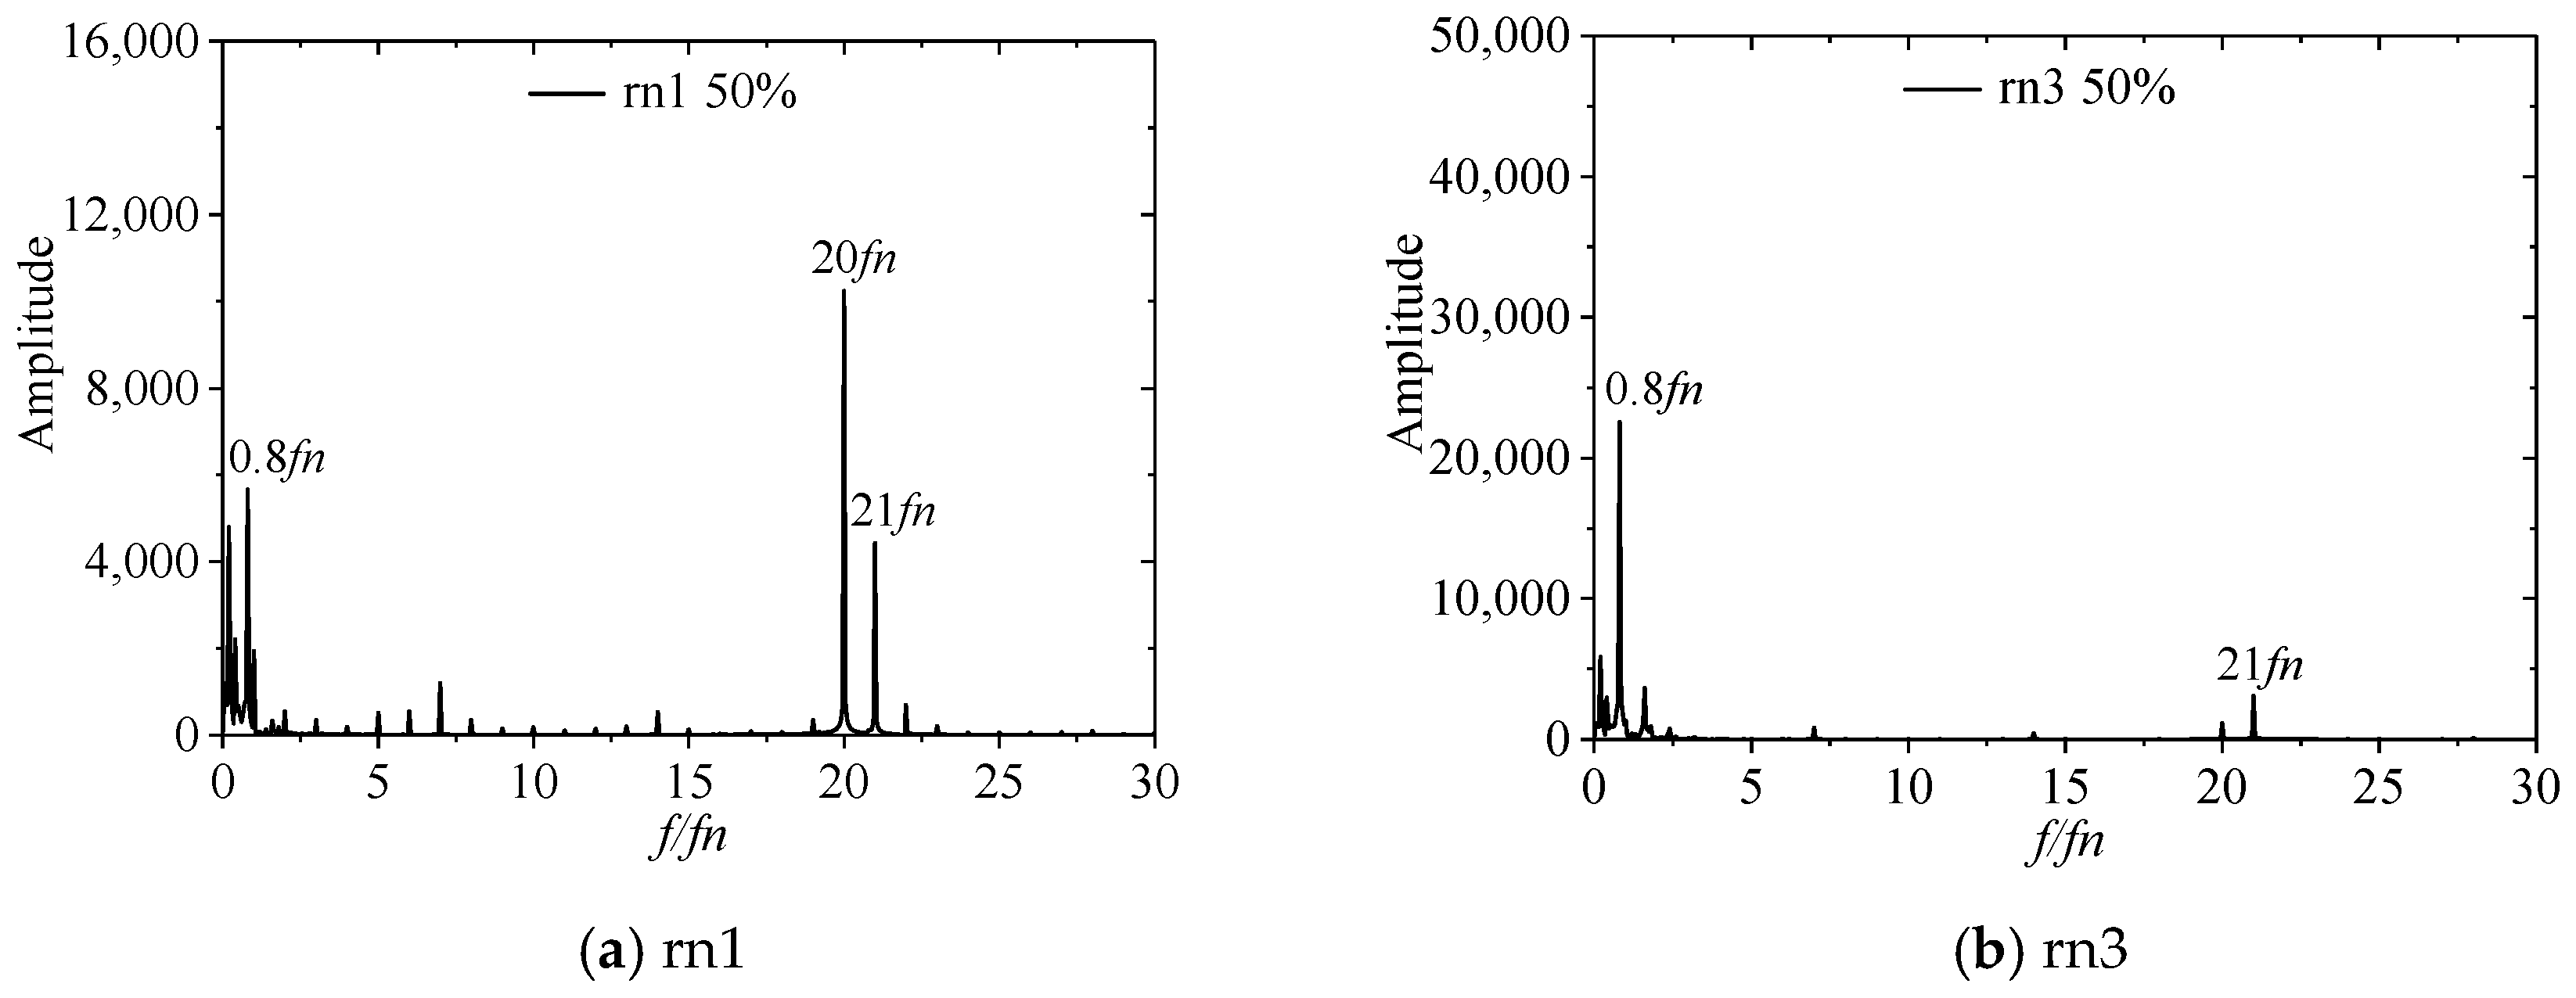
Through the analysis of pressure fluctuation, it was found that, at 50% load, the rotor–stator interaction component that dominated at 100% load basically disappeared, and the more pronounced component was the low frequency (0.2fn), which is the evolution period of the process of the generation, movement, and decay of the vortex rope. At the monitoring point in the middle of the pier, the main frequency split into 0.13fn and 0.4fn, which may be due to the kinematic precession originated from the evolution of vortex rope.
(3)
The distribution of the vortex rope in the draft tube and the recirculation zone showed a complementary shape. The frequency of the vortex rope had a significant impact on the pressure fluctuation of the runner, and the point near trailing edge of the runner blade showed a high-amplitude vortex rope frequency of 0.8fn.
Prospection: The pier exerts conspicuous benefits on turbine mode—vortex rope fragmentation, draft tube diffuser pressure balance, etc. This underscores the meaningfulness of reconsidering pier design in subsequent pump-turbine model tests, encompassing the pier effects on pump mode.

Author Contributions

Conceptualization, H.H. and Z.W.; data curation, H.H. and M.X.; formal analysis, H.H. and M.X.; investigation, H.H., X.S. and M.Q.; methodology, H.H. and M.X.; resources, M.Q.; software, X.S. and M.Q.; supervision, Z.W.; validation, M.X., X.S. and Z.W.; visualization, M.X. and X.S.; writing—original draft, H.H. and M.X.; writing—review and editing, X.S., Z.W. and M.Q. All authors have read and agreed to the published version of the manuscript.

Funding

This research was funded by the project “Research Project on Strong Vibrations in the Head Cover of Baishan Pumped Storage Power Station (No. 525784270002)” of State Grid Xinyuan Co., Ltd.

Data Availability Statement

The data presented in this study are available on request from the corresponding author. The data are not publicly available due to the owner’s security requirements for engineering data.

Acknowledgments

The authors thank the cooperation of the leadership and field staff of the Baishan Power Station in the testing work. In addition, the author thanks Hunan Shuhua Technology for the support of testing equipment and debugging technology.

Conflicts of Interest

Author Haiping Hu was employed by the Baishan Storage Power Station, State Grid Xinyuan Co., Ltd., and author Ming Xia was employed by the Department of Energy and Power Engineering, Tsinghua University. The remaining authors declare that the research was conducted in the absence of any commercial or financial relationships that could be construed as a potential conflict of interest.

References

  1. Zhao, J.F.; Oh, U.J.; Park, J.C.; Park, E.S.; Im, H.B.; Lee, K.Y.; Choi, J.S. A Review of World-wide Advanced Pumped Storage Hydropower Technologies. IFAC Pap. 2022, 55, 170–174. [Google Scholar] [CrossRef]
  2. Hu, J.Y.; Wang, Q.B.; Song, H.G.; Mao, J.H. Effect of wave disturbance on the fluid dynamics of the pump turbine in a seawater pumped storage hydroplant. Front. Earth Sci. 2023, 11, 1220842. [Google Scholar] [CrossRef]
  3. Hu, J.Y.; Wang, Q.B.; Meng, Z.Z.; Song, H.G.; Chen, B.W.; Shen, H. Numerical Study of the Internal Fluid Dynamics of Draft Tube in Seawater Pumped Storage Hydropower Plant. Sustainability 2023, 15, 8327. [Google Scholar] [CrossRef]
  4. Zuo, Z.G.; Liu, S.H. Flow-Induced Instabilities in Pump-Turbines in China. Engineering 2017, 3, 504–511. [Google Scholar] [CrossRef]
  5. Yan, J.P.; Seidel, U.; Koutnik, J. Numerical simulation of hydrodynamics in a pump-turbine at off-design operating conditions in turbine mode. IOP Conf. Ser. Earth Environ. Sci. 2013, 15, 032041. [Google Scholar] [CrossRef]
  6. Zhu, D.; Yan, W.; Guang, W.L.; Wang, Z.W.; Tao, R. Influence of Guide Vane Opening on the Runaway Stability of a Pump-Turbine Used for Hydropower and Ocean Power. J. Mar. Sci. Eng. 2023, 11, 1218. [Google Scholar] [CrossRef]
  7. Hu, H.P.; Xia, M.; Qiao, M.; Wang, W.; Wang, J.Z.; Wang, Z.W. A Simulation Study of Hydraulic Vibration caused by Clearance Flow in a Pump Turbine. IOP Conf. Ser. Earth Environ. Sci. 2022, 1079, 012032. [Google Scholar] [CrossRef]
  8. Asomani, S.N.; Yuan, J.P.; Wang, L.Y.; Appiah, D.; Zhang, F. Geometrical effects on performance and inner flow characteristics of a pump-as-turbine: A review. Adv. Mech. Eng. 2020, 12, 1687814020912149. [Google Scholar] [CrossRef]
  9. Fu, X.L.; Li, D.Y.; Wang, H.J.; Zhang, G.H.; Li, Z.G.; Wei, X.Z. Influence of the clearance flow on the load rejection process in a pump-turbine. Renew. Energy 2018, 127, 310–321. [Google Scholar] [CrossRef]
  10. Yang, H.; He, Q.; Bi, H.; Huang, X.; Yang, M.; Zou, M.; Wang, Z. Head-Cover vibration investigation of a Prototype Reversible Pump-Turbine Unit during Start-up in Pump mode. Part I: Fluid dynamic analysis. IOP Conf. Ser. Earth Environ. Sci. 2022, 1037, 012055. [Google Scholar] [CrossRef]
  11. Yang, M.Q.; Zhao, W.Q.; Bi, H.L.; Yang, H.X.; He, Q.L.; Huang, X.X.; Wang, Z.W. Flow-Induced Vibration of Non-Rotating Structures of a High-Head Pump-Turbine during Start-Up in Turbine Mode. Energies 2022, 15, 8743. [Google Scholar] [CrossRef]
  12. Zhang, W.W.; Chen, Z.M.; Zhu, B.S.; Zhang, F. Pressure fluctuation and flow instability in S-shaped region of a reversible pump-turbine. Renew. Energy 2020, 154, 826–840. [Google Scholar] [CrossRef]
  13. Kim, S.J.; Suh, J.W.; Choi, Y.S.; Park, J.; Park, N.H.; Kim, J.H. Inter-Blade Vortex and Vortex Rope Characteristics of a Pump-Turbine in Turbine Mode under Low Flow Rate Conditions. Water 2019, 11, 2554. [Google Scholar] [CrossRef]
  14. Tridon, S.; Barre, S.; Ciocan, G.D.; Tomas, L. Experimental analysis of the swirling flow in a Francis turbine draft tube: Focus on radial velocity component determination. Eur. J. Mech.-B-Fluids 2010, 29, 321–335. [Google Scholar] [CrossRef]
  15. Lin, T.; Li, J.; Xie, B.F.; Zhang, J.R.; Zhu, Z.C.; Yang, H.; Wen, X.M. Vortex-Pressure Fluctuation Interaction in the Outlet Duct of Centrifugal Pump as Turbines (PATs). Sustainability 2022, 14, 15250. [Google Scholar] [CrossRef]
  16. Pang, S.; Zhu, B.; Shen, Y.; Chen, Z. Study on cavitating vortex rope characteristics of reversible pump-turbine under part load turbine condition. Phys. Fluids 2023, 35, 085131. [Google Scholar] [CrossRef]
  17. Vu, T.C.; Devals, C.; Zhang, Y.; Nennemann, B.; Guibault, F. Steady and unsteady flow computation in an elbow dr aft tube with experimental validation. IOP Conf. Ser. Earth Environ. Sci. 2010, 12, 012045. [Google Scholar] [CrossRef]
  18. Ciocan, G.D.; Iliescu, M.S.; Vu, T.C.; Nennemann, B.; Avellan, F. Experimental Study and Numerical Simulation of the FLINDT Draft Tube Rotating Vortex. J. Fluids Eng. 2006, 129, 146–158. [Google Scholar] [CrossRef]
  19. Foroutan, H.; Yavuzkurt, S. Unsteady Numerical Simulation of Flow in Draft Tube of a Hydroturbine Operating under Various Conditions Using a Partially Averaged Navier–Stokes Model. J. Fluids Eng. 2015, 137, 061101. [Google Scholar] [CrossRef]
  20. Gagnon, J.-M.; Aeschlimann, V.; Houde, S.; Flemming, F.; Coulson, S.; Deschenes, C. Experimental Investigation of Draft Tube Inlet Velocity Field of a Propeller Turbine. J. Fluids Eng. 2012, 134, 101102. [Google Scholar] [CrossRef]
  21. Gouin, P.; Deschênes, C.; Iliescu, M.; Ciocan, G.D. Experimental investigation of draft tube flow of an axial turbine by laser doppler velocimetry. In Proceedings of the 3rd IAHR International Meeting of the Workgroup on Cavitation and Dynamic Problems in Hydraulic Machinery and Systems, Brno, Czech Republic, 14–16 October 2009; pp. 87–97. [Google Scholar]
  22. Lemay, S.; Fraser, R.; Ciocan, G.D.; Aeschlimann, V.; Deschênes, C. Flow field study in a bulb turbine runner using LDV and endoscopic S-PIV measurements. IOP Conf. Ser. Earth Environ. Sci. 2014, 22, 022015. [Google Scholar] [CrossRef]
  23. Vuillemard, J.; Aeschlimann, V.; Fraser, R.; Lemay, S.; Deschênes, C. Experimental investigation of the draft tube inlet flow of a bulb turbine. IOP Conf. Ser. Earth Environ. Sci. 2014, 22, 032010. [Google Scholar] [CrossRef]
  24. Tridon, S.; Barre, S.; Ciocan, G.D.; Leroy, P.; Ségoufin, C. Experimental investigation of draft tube flow instability. IOP Conf. Ser. Earth Environ. Sci. 2010, 12, 012044. [Google Scholar] [CrossRef]
  25. Tridon, S.; Barre, S.; Ciocan, G.; Ségoufin, C.; Leroy, P. Discharge Imbalance Mitigation in Francis Turbine Draft-Tube Bays. J. Fluids Eng. 2012, 134, 041102. [Google Scholar] [CrossRef]
  26. Cedric, D.; Balarac, G.; Metais, O.; Sylvain, T.; Stephane, B.; Ciocan, G.; Thomas, L.; Laurent, T. Large-Eddy Simulations of Draft Tube Flow and Validation from Experimental Results. In Proceedings of the 3rd IAHR International Meeting of the Workgroup on Cavitation and Dynamic Problems in Hydraulic Machinery and Systems, Brno, Czech Republic, 14–16 October 2009. [Google Scholar]
  27. Li, H.; Xu, L.; Zhao, F.; Zhang, F.; Deng, Y.; Li, H.; Cheng, Y.; Zheng, Y.; Kan, K. Investigation of Flow Characteristics of Flow Passage Components in Francis Turbine under No-load and 50% Load operating conditions. J. Phys. Conf. Ser. 2022, 2285, 012040. [Google Scholar] [CrossRef]
  28. Wang, L.; Cui, J.; Shu, L.; Jiang, D.; Xiang, C.; Li, L.; Zhou, P. Research on the Vortex Rope Control Techniques in Draft Tube of Francis Turbines. Energies 2022, 15, 9280. [Google Scholar] [CrossRef]
  29. Paik, J.; Sotiropoulos, F.; Sale Michael, J. Numerical Simulation of Swirling Flow in Complex Hydroturbine Draft Tube Using Unsteady Statistical Turbulence Models. J. Hydraul. Eng. 2005, 131, 441–456. [Google Scholar] [CrossRef]
  30. Pasche, S.; Gallaire, F.; Avellan, F. Origin of the synchronous pressure fluctuations in the draft tube of Francis turbines operating at part load conditions. J. Fluid Struct. 2019, 86, 13–33. [Google Scholar] [CrossRef]
  31. Temam, R. Navier-Stokes Equations: Theory and Numerical Analysis; American Mathematical Society: Providence, RI, USA, 2001; Volume 343. [Google Scholar]
  32. Hu, J.; Luo, X.; Zhao, Y.; Liang, Q.; Liu, D.; He, Q.; Wang, Z.; Guan, Z. Evolution mechanism of unsteady internal flow of an ultra-high head pump-turbine in pump mode. J. Energy Storage 2023, 74, 109309. [Google Scholar] [CrossRef]
  33. Zhang, Y.L.; Li, J.F.; Zhu, Z.C. The acceleration effect of pump as turbine system during starting period. Sci. Rep. 2023, 13, 4913. [Google Scholar] [CrossRef]
  34. Chen, W.; Zydek, N.; Parma, F. Evaluation of hydrocyclone models for practical applications. Chem. Eng. J. 2000, 80, 295–303. [Google Scholar] [CrossRef]
  35. Hu, H.P.; Xia, M.; Song, X.H.; Zhao, W.Q.; Wang, W.; Wang, Z.W. A Field Investigation of Stability Characteristics of Pressure Fluctuation and Vibration in Prototype Pump Turbine at Multiple Working Points. Water 2023, 15, 3378. [Google Scholar] [CrossRef]
Figure 1. Schematic of the computational domain.
Water 16 00013 g001
Figure 2. Mesh division of the runner area. (a) Global mesh. (b) Details near the blades.
Water 16 00013 g002
Figure 3. Mesh division of the draft tube area.
Water 16 00013 g003
Figure 4. Pressure signal spectrum of the draft tube elbow section under different loads. Red means a higher amplitude.
Water 16 00013 g004
Figure 5. Pressure signal and spectrum of the draft tube elbow section under 100% and 50% loads.
Water 16 00013 g005
Figure 6. Pressure distribution of the guide vane. Spanwise = 0.5.
Water 16 00013 g006
Figure 7. The three-dimensional streamline distribution of the runner.
Water 16 00013 g007
Figure 8. Streamline distribution in the middle section of the runner.
Water 16 00013 g008
Figure 9. The three-dimensional streamline distribution of the draft tube.
Water 16 00013 g009
Figure 10. Schematic diagram of flow asymmetry caused by draft tube elbow bending.
Water 16 00013 g010
Figure 11. Two cross sections S1-A and S2-B.
Water 16 00013 g011
Figure 12. The streamline distribution of the draft tube at S1-A and S2-B.
Water 16 00013 g012
Figure 13. Pressure distribution of the draft tube at S1-A and S2-B.
Water 16 00013 g013
Figure 14. Pressure distribution of the draft tube at different main flow cross sections.
Water 16 00013 g014
Figure 15. Turbulent kinetic energy of the draft tube at main flow cross section.
Water 16 00013 g015
Figure 16. The distribution of monitoring points in the draft tube.
Water 16 00013 g016
Figure 17. Pressure fluctuation spectrum of the draft tube under 100% load.
Water 16 00013 g017aWater 16 00013 g017b
Figure 18. Pressure fluctuation spectrum of the draft tube under 50% load.
Water 16 00013 g018aWater 16 00013 g018b
Figure 19. The vortex rope changes in the draft tube. T = 1/fn = 0.3 s.
Water 16 00013 g019
Figure 20. The recirculation zone of the draft tube vortex rope. T = 1/fn = 0.3s.
Water 16 00013 g020
Figure 21. Monitoring point distributions of the runner.
Water 16 00013 g021
Figure 22. Pressure fluctuation spectrum of the runner under 50% load.
Water 16 00013 g022
Figure 23. Theoretical flow field analysis diagram in the vicinity of the vortex tube.
Water 16 00013 g023
Table 1. Basic parameters of the unit.
ParameterUnitValue
Runner inlet diameter (D)m5.22
Rotational speed (n)r/min200
Rated power (P)MW139
Rated flow (Q)m3/s148.8
Number of blades (Zb)/7
Number of stay vanes (Zs)/20
Number of guide vanes (Zg)/20
Rated head (H)m105.8
Table 2. Number of mesh nodes in partial fluid domain.
Fluid DomainSpiral CaseStay VaneGuide VaneRunnerDraft Tube
Number of Nodes (×104)13.236.226.515626.6
Disclaimer/Publisher’s Note: The statements, opinions and data contained in all publications are solely those of the individual author(s) and contributor(s) and not of MDPI and/or the editor(s). MDPI and/or the editor(s) disclaim responsibility for any injury to people or property resulting from any ideas, methods, instructions or products referred to in the content.

