Article

The Impact of Plant Spatial Patterns on Nitrogen Removal in the Naolihe Wetlands of Northeast China

1
College of Geographical Sciences, Changchun Normal University, Changchun 130032, China
2
Northeast Institute of Geography and Agroecology, Chinese Academy of Sciences, Changchun 130102, China
*
Author to whom correspondence should be addressed.
Water 2024, 16(1), 128; https://doi.org/10.3390/w16010128
Submission received: 26 November 2023 / Revised: 21 December 2023 / Accepted: 23 December 2023 / Published: 29 December 2023

Abstract

:
The impact of the spatial pattern of wetland plants on nitrogen removal is a hot research topic. Ten water samples were collected from separate sampling points in mid-August and at the end of October 2021, and the concentrations of TN, NH4-N, and NO3-N in the water were measured to calculate the removal rates for the three forms of nitrogen in Naolihe wetlands. The spatial indices were interpreted for various plants based on images from samples taken in August. Step-by-step eliminations and function fitting methods were performed to determine the relationships between the spatial index and the removal rates for three forms of nitrogen. The results show that both Deyeuxia angustifolia (DA) and Phragmites australis (PA) ranked first for the functions between the order of sampling points of spatial indices (areas and shapes) and the removal rates for the three forms of nitrogen during the elimination process, indicating that DA and PA were the main forces determining nitrogen removal, which was dependent on plants covering the largest areas (DA: 31.2% and PA: 24.3%), with some large patches (largest plants index: DA (0.26) and PA (0.21)) and strong connectivity (patch edge density: DA (16.79) and PA (15.70)). These results have value for studying the relationship between spatial patterns and water purification functions.

1. Introduction

With the extensive development of wetlands into farmlands, wetlands have become surrounded by farmlands, where low-lying wetlands have become places that receive farmland retreat water [1]. The nitrogen generated by the application of nitrogen fertilizer in farmlands enters the wetlands in water, and wetland plants have undertaken the function of nitrogen removal from water bodies [2,3]. Therefore, the impact of plant spatial patterns on nitrogen removal in water has gradually become a hot research topic. Plants have a certain absorption capacity for the various forms of nitrogen in wetland water [4]. Aquatic plants (Iris pseudacorus) may increase the removal rate of total nitrogen (TN) from wetlands by 10.29% [5]. A TN removal rate of 15.3 g/m2d by floating plant uptake in wetlands was determined based on the results of kinetic modeling [6]. Plants play an important role in the removal of nitrogen from water bodies. In the water of 26 wetlands in Jilin Province, China, the removal of ammonia nitrogen (NH4-N) and nitrate nitrogen (NO3-N) is mainly reliant on wetland plants, and the removal ability varied with different plant species. The best removal of TN from water is shown by Eichhornia crassipes and Myriophyllum verticillatum, while Thalia dealbata has the strongest removal of NH4-N in Erhai Wetland, Dali City, Yunnan Province, China [7]. Aquatic plants have a good removal of TN in the water, and their removal of TN in the water decreased from the mature stage to the withering stage in the Baiyangdian Wetland in China [8]. In Lamby Way, wetlands with reeds and willow have a 20% higher nitrogen removal rate than wetlands without plants [9].
Wetland plants use their own absorption function to remove nitrogen from water, and the plant absorption capacity is related to the physiological habits, shape, and area of the plants. Regarding wetlands, the removal of nitrogen from water bodies is often reliant on physical, chemical, and biological means. The various methods of nitrogen removal involve using MFC CWs, artificial aerated CWs, baffled flow CWs, micro-electrolysis CWs, enhanced CWs, and ME-SSFCWs [10]. According to the Level 1B standard of the Urban Wastewater Treatment Plant Pollutant Discharge Standard in China, TN ≤ 20 mg/L and NH4-N ≤ 15 mg/L, and when the nitrogen content of the water is below the levels of this standard, the water quality is good. In addition, among all the methods, those using enhanced CWs have good efficiency for NH4-N removal, while ME-SSFCWs have the highest efficiency for the removal of NO3-N and TN [11]. Significant differences have been found regarding the removal ability of different forms of nitrogen among different plants in wetlands [12]. In some wetlands in Hunan Province, China, M. elatinoides exhibited the highest NH4-N uptake rates, while E. crassipes had the highest NO3-N uptake rate [13]. The efficiency of TN removal in China differed in three aquatic macrophytes according to the order: emergent plants > floating plants > submerged plants in tidal wetlands [14]. In Australian wetlands, a comparative study was conducted on the nitrogen removal ability of six wetland plants, and it was found that there are significant differences in nitrogen removal ability among different plants [15]. The Drepanocladus fluitans (140 kg) has an exceptionally high N-removal rate compared to the other four species (<50 kg) in northern Sweden [16]. The plant efficiently promotes sewage TN removal in plateau wetlands in Chinese Yunnan, where the average removal rate was found to range from 29.42% to 43.57% [17]. Lolium perenne and Myriophyllum verticillatum have the highest removal rates of all forms of nitrogen and significant differences regarding their removal ability compared to other plants in Hangzhou wetlands, China [18]. In a typical wetland in Beijing, China, the TN removal efficiencies under high concentrations of nitrogen were found to follow the order of the TN removal efficiencies as follows: Typha orientalis C. Presl > Ceratophyllum demersum > Lemna minor [19].
The spatial structure of wetland plants has a significant impact on nitrogen removal [20]. From aquatic plants to mesophytes, the TN and NH4-N contents in wetland water significantly change with the spatial structure of different plants. The nitrogen content in the water was found to be influenced by the spatial pattern of plants in the lakeside wetlands of Napahai in northwest Yunnan Plateau, Southwest China [21]. Juncus effusus showed a greater nitrogen removal capacity than Calluna vulgaris and sphagnum mosses, where the spatial pattern of nitrogen removal showed a decreasing trend from the deep-water area along the river channel to the shallow-water area along the shore in the wetlands in the upper, southern area of the Conwy catchment, North Wales, UK [22]. The significant spatial heterogeneity of Nymphaea tetragona and Vallisneria natans led to spatial differences in NH4-N concentration, and the spatial distribution of nitrogen removal in water bodies was controlled by the distribution trend of the plants [23]. The plant spatial allocation in the lakeside zone of Yunnan Plateau wetlands varied, and there was a significant spatial difference in the nitrogen removal ability of wetland water [24].
The ability and spatial pattern of wetland plants regarding the removal of nitrogen from water have been addressed in several studies, where it was found that different plants have significant differences in their abilities to remove nitrogen from water bodies. In addition, the spatial pattern of plants has an impact on the removal capacity of nitrogen in wetland water. However, there was little research on the impact of plant area or shape patterns on the removal capacity of wetland nitrogen, especially on the differences in the spatial characteristics of different plant areas or shapes on nitrogen removal. Therefore, we took the Naolihe wetlands as the research area and analyzed how nitrogen removal from water varies according to different plant spatial patterns using area and shape indices. The objectives of this study were as follows: (1) understanding the impact of spatial patterns of plant areas on three forms of nitrogen removal rate, (2) revealing the effect of shape features of plants on nitrogen removal rates, and (3) comprehensively analyzing the role of spatial patterns of wetland plants in nitrogen removal. We then provide a method for further research on the mechanisms underlying the water purification functions of wetlands.

2. Materials and Methods

2.1. Study Area

The Naolihe wetlands (132°22′41″–134°10′21″ E, 46°30′10″–47°22′17″ N) are in the Sanjiang Plain, China [25]. Due to the low-lying terrain, water accumulation, and slow water flow, large wetlands have formed, representing one of the most typical wetlands in inland China [26]. The Naoli River runs through the entire wetlands, which are distributed along the river and have a total area of 20,800 hm2. A large number of farmlands are distributed in the surrounding wetlands, and a large amount of farmland retreat water is discharged into the wetland every year [27]. The amount of chemical fertilizer has gradually increased as farmland area has increased. In 2015, 450 kg/hm2 corresponded to paddy fields, and 325 kg/hm2 corresponded to dry farmland. The concentrations of nitrogen in wetland water have been increasing, primarily due to the discharge of agricultural drainage into the fragmented wetlands [28]. A total of 8 main plant types were recorded in the wetlands, including weeds (WS), Nymphoides peltata-Nymphoides cristatum (N-N), Deyeuxia angustifolia (DA), Typha orientalis (TO), Carex heterolepis (CH), Phragmites australis (PA), Carex appendiculata (CA), and Zizania latifolia (ZL) [29]. The main plants are DA and PA, which are scattered throughout wetlands. Due to the small differences in water depth, there was no obvious gradient in the spatial distribution of plants, which are mainly scattered (Figure 1).

2.2. Water Sampling and Determination

A total of 10 sampling points, numbered 1–10 from upstream to downstream, were evenly established in Naolihe wetlands in mid-August 2021 (Table 1). At each sampling point, sampling was repeated 3 times in mid-August (summer) 2021 and also at the end of October (late autumn) 2021 (before freezing). In total, 250 milliliters of water was taken from 0.5 m below the water surface into a polyethylene sampling bottle for each water sample. All samples were placed in a water-quality freezer (FYL-YS-50L, Beijing Electric Applian Co., Ltd., Beijing, China) and brought back to the laboratory [30]. The TN concentrations of the samples were measured using an alkaline potassium persulfate digestion-UV spectrophotometric method. For the testing process, first, a mixture of potassium persulfate and sodium hydroxide was used in a volume ratio of 4:1, and then some ultrapure water was added to it to prepare a digestion solution. The water samples were then separately digested in digestion liquid for measuring the TN concentration using a TU-1901 UV visible spectrophotometer. At 120–124 °C, an alkaline potassium persulfate solution converts the nitrogen in nitrogen-containing compounds in the sample into nitrate. The absorbances A220 and A275 were measured using UV spectrophotometry at wavelengths of 220 nm and 275 nm, respectively. The corrected absorbance A was calculated using the following formula, and the TN (measured in N) content was directly proportional to the corrected absorbance A (HJ 636-2012) [31].
A = A220 − 2A275
The NH4-N concentrations were measured using Nessler’s reagent colorimetry, and the NO3-N concentrations were measured using phenol disulfonic acid spectrophotometry [32]. The mean TN of 3 times was calculated for each sampling point as the TN concentration for that point in August. The same method was used to calculate the means for NH4-N and NO3-N at each sampling point in August. The three nitrogen indices (TN, NH4-N, and NO3-N) were calculated for October using the same method. Finally, the concentrations of three nitrogen indices (TN, NH4-N, and NO3-N) were obtained for the 10 sampling points in August and October.

2.3. Remote Sensing Interpretation and Spatial Indices Extraction

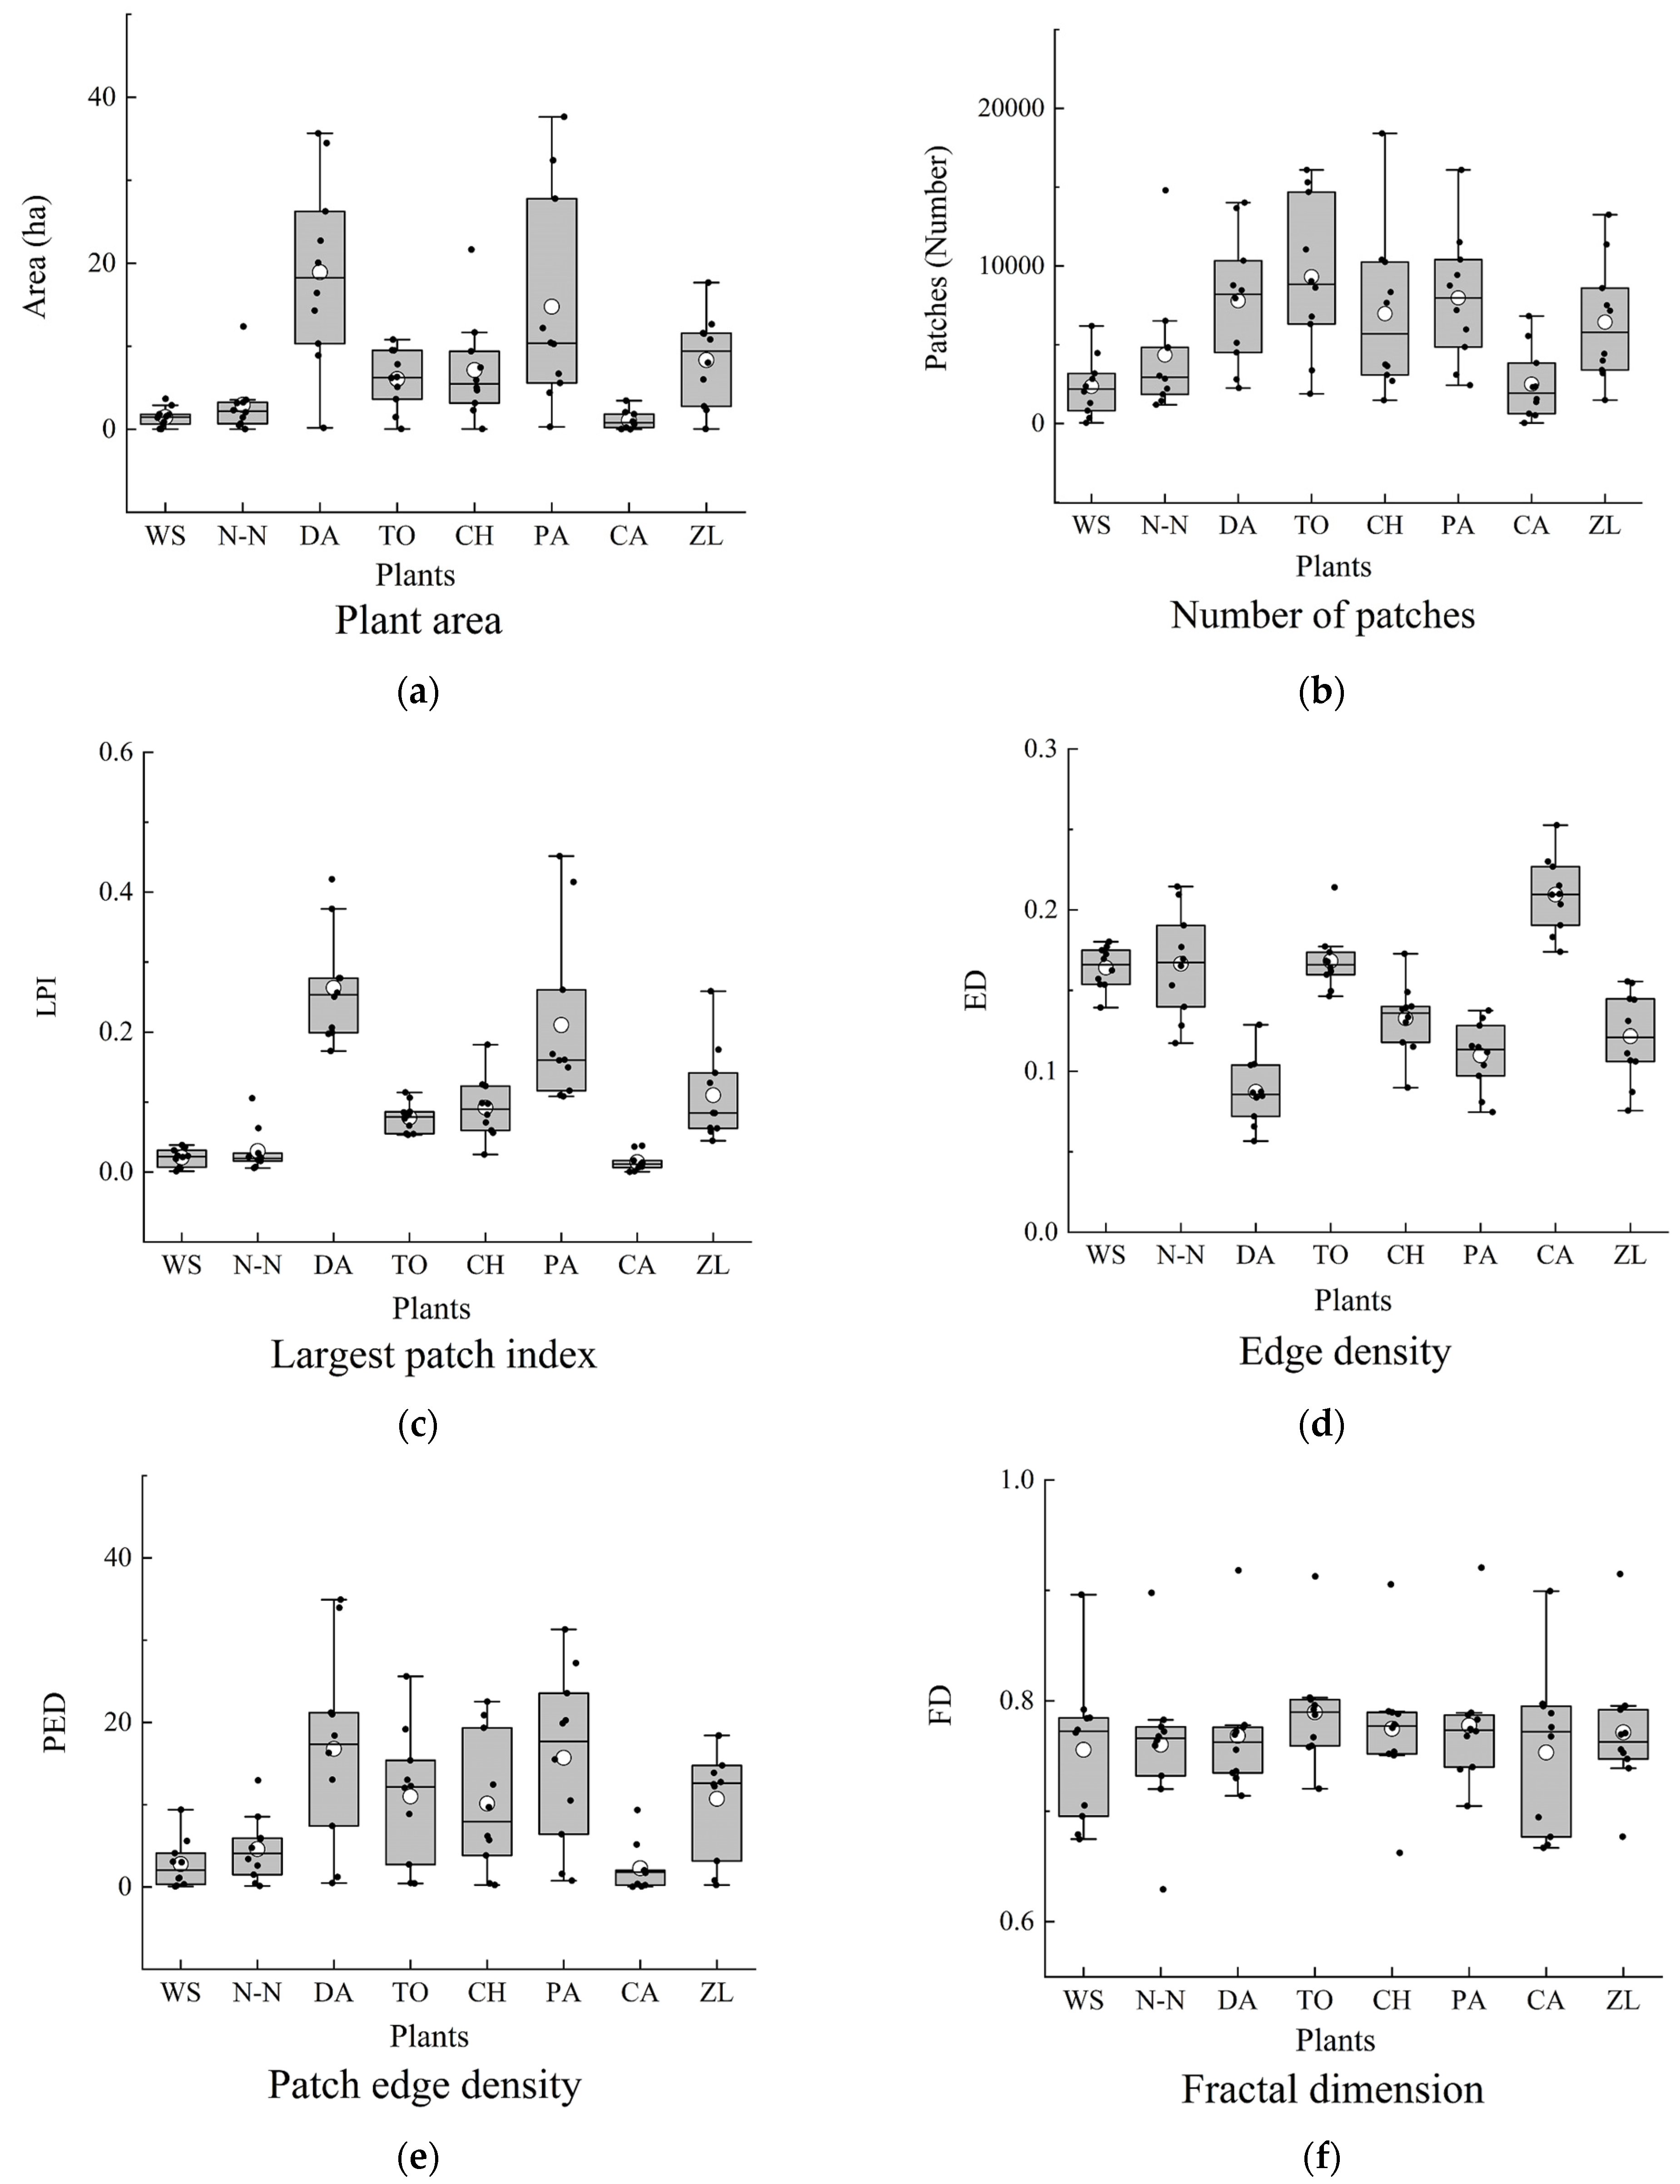
The remote sensing images of the study area were sourced from the official website of the European Space Agency (https://scihub.copernicus.eu/) Sentinel-2 L2A satellite digital product, 10 August 2021. The images coincide not only with the time of collecting water samples in the field but also with the peak period of wetland plant growth, and the interpretation was relatively straightforward. All images were subsets, geometrically and atmospherically corrected, and the spatial resolution was 10 m. Using the Envi 5.1 image processing software by Exelis Visual Information Solutions Company in Boulder, Colorado, USA, the classification method was applied to extract wetland plants using a random forest for sequential extraction of target priority. The spatial distributions of all wetland plants were extracted for the study area, and the interpretation accuracy was verified through field investigation (Figure 1). A total of 45 sample points were collected, of which 41 were correct, with a total accuracy of 91.11%. The wetlands were divided into 10 sections along the Naoli River water in cross-section through the sampling point of the river. Therefore, the wetlands were cut at the upper sampling point of the river and controlled by the sampling point. The area and shape indices of each wetland plant (a total of 8) were calculated in relation to each section using Fragstats 3.3 and ArcGIS 10. In each segment, the sum of the number of pixels and the area of a pixel (1 m × 1 m) in all patches of a plant was taken as the total area of that plant. Due to the continuous occupation of wetlands by farmland, there was very obvious fragmentation of plant patches, and the increase in various plant patches (Figure 2b) led to a mixed pattern of different plant patches. In addition, five spatial indices were calculated for 8 plants in 10 segments. Area indices are based on the plant area and the largest patch index (LPI) for each plant. Shape indices are based on edge density (ED), patch edge density (PED), and fractal dimension (FD) (Figure 2).

2.4. Data Analysis

2.4.1. The Calculation of Removal Rates for TN, NH4-N, and NO3-N

The sampling time was in summer and late autumn; nitrogen from surrounding farmland was discharged into the wetlands with precipitation in summer, and the nitrogen content in the wetland water increased. Various wetland plants participated in the nitrogen removal up until the end of autumn. When the water was about to freeze, wetland plants began to wither, and the nitrogen removal ability rapidly decreased. Therefore, we used the method of revealing the nitrogen removal ability of various plants through the changes in nitrogen concentrations at sampling points in summer and autumn, and the calculation formula was as follows:
TNR = TNSUM − TNAUT/TNSUM
where TNR is the TN removal rate, TNSUM is TN concentration in summer, and TNAUT is TN concentration in autumn.
NH4-NR = NH4-NSUM − NH4-NAUT/NH4-NSUM
where NH4-NR is the NH4-N removal rate, NH4-NSUM is NH4-N concentration in summer, and NH4-NRAUT is NH4-N concentration in autumn.
NO3-NR = NO3-NSUM − NO3-NAUT/NO3-NSUM
where NO3-NR is the NO3-N removal rate, NO3-NSUM is NO3-N concentration in summer, and NO3-NAUT is NO3-N concentration in autumn.

2.4.2. The Step-by-Step Elimination

Using the TNR, NH4-NR, and NO3-NR obtained from each sampling point and the spatial indices (the area and shape) of each plant in the wetland controlled by the corresponding sampling point, step-by-step elimination was applied to determine the impact of each spatial index on nitrogen removal capacity and sort the sampling points. In the specific analysis process, the impact of the WS area on TNR was taken as an example. The WS area controlled by each sampling point was extracted and formed a data pair with the TNR of the corresponding sampling point, forming a total of 10 data pairs, and the correlation coefficient (R) was then calculated between the area and the TNR of the 10 data pairs. Gradually, one data pair was removed from one of the 10 sampling points, and the R between the area and TNR of the remaining 9 sampling points was calculated. The data pair was removed for the sampling point data with the smallest R from the 10 calculated Rs, thus completing the first round of elimination. A data pair was removed from one of the remaining 9 sampling points, the R was calculated for the remaining 8 sampling points, and the method of operations was followed according to the first round. Finally, the second round of operations was completed. This process was carried on in succession until the last sampling point in the last round was extracted. All sampling points were reordered again according to the elimination order. When the R reached the significance level (p < 0.05), the impact of the WS area on TNR became apparent, and as the elimination process progressed, the larger the R, the greater the impact of WS on TNR. The correlation between the area and shape indices of other plants and other nitrogen forms was sequentially analyzed using the same method to obtain the sorting sequence of each plant for each spatial index and the rate of removal for each nitrogen form.

2.4.3. Function Fitting

In each sequence, the order of each plant arrangement was used as the independent variable, and the spatial index was used as the dependent variable for function fitting. Taking WS as an example, the order of sampling points for TNR in the elimination process was used as the independent variable, and the corresponding area index of each sampling point was used as the dependent variable for function fitting. Gradually, the fitting was conducted from 1st to 6th times, and when the function (3rd) reached a significant level (p < 0.05), the 3rd function was selected. The values and numbers were calculated for inflection points within the significance range of the function curve, using the difference between extreme values (maximum and minimum values of the curve) to determine the effective range of TNR. The impact of the area feature of WS on TNR in wetland water was revealed by these function eigenvalues. The function fittings of spatial indices of three forms of nitrogen were used with the same method to separately understand the impact of the spatial pattern of each plant on the nitrogen removal capacity in wetland water.

3. Results and Discussion

The calculation results of 5 spatial indices (area and shape) for 8 plants in 10 segments were as follows: the rank of the plant’s area (mean ± 1STD) of all sections was DA (18.93 ± 10.70 km2) > PA (14.77 ± 12.31 km2) > ZL (8.34 ± 5.24 km2) > CH (7.12 ± 5.81 km2) > TO (6.04 ± 3.37 km2) > N-N (2.93 ± 3.36 km2) > WS (1.45 ± 1.11 km2) > CA (1.07 ± 1.03 km2); the DA and the PA have the largest areas (DA: 31.2%; PA: 24.3%) (Figure 2a). The rank of number of patches (mean ± 1STD) of all sections was TO (9314 ± 4693) > PA (7970 ± 3949) > DA (7786 ± 3932) > CH (6969 ± 4908) > ZL (6434 ± 3622) > N-N (4350 ± 3842) > CA (2495 ± 2133) > WS (2354 ± 1816); all plant patches were severely fragmented (Figure 2b). The rank of LPI (mean ± 1STD) of all sections was DA (0.26 ± 0.08) > PA (0.21 ± 0.12) > ZL (0.11 ± 0.06) > CH (0.09 ± 0.04) > TO (0.08 ± 0.02) > N-N (0.03 ± 0.03) > WS (0.02 ± 0.01) > CA (0.01 ± 0.01); the DA and the PA have some larger patches (Figure 2c). The rank of ED (mean ± 1STD) of all sections was CA (0.21 ± 0.02) > TO (0.17 ± 0.01) > N-N (0.17 ± 0.03) > WS (0.16 ± 0.01) > CH (0.13 ± 0.02) > ZL (0.12 ± 0.02) > PA (0.11 ± 0.02) > DA (0.09 ± 0.02); the DA and the PA have minimally mixed with other plants (Figure 2d). The rank of PED (mean ± 1STD) of all sections was DA (16.79 ± 11.29) > PA (15.70 ± 10.06) > TO (11.00 ± 7.76) > ZL (10.71 ± 6.47) > CH (10.13 ± 7.91) > N-N (4.60 ± 3.75) > WS (2.78 ± 2.82) > CA (2.28 ± 2.77); the DA and the PA have stronger internal patch connectivity (Figure 2e). The rank of FD (mean ± 1STD) of all sections was TO (0.79 ± 0.05) > PA (0.78 ± 0.05) > CH (0.77 ± 0.06) > ZL (0.77 ± 0.06) > DA (0.77 ± 0.06) > N-N (0.76 ± 0.06) > WS (0.76 ± 0.06) > CA (0.75 ± 0.07); there was no significant difference in the shape of different plant patches (Figure 2f).

3.1. The Effect of Plant Area on Nitrogen Removal

3.1.1. The Impact of Patch Area

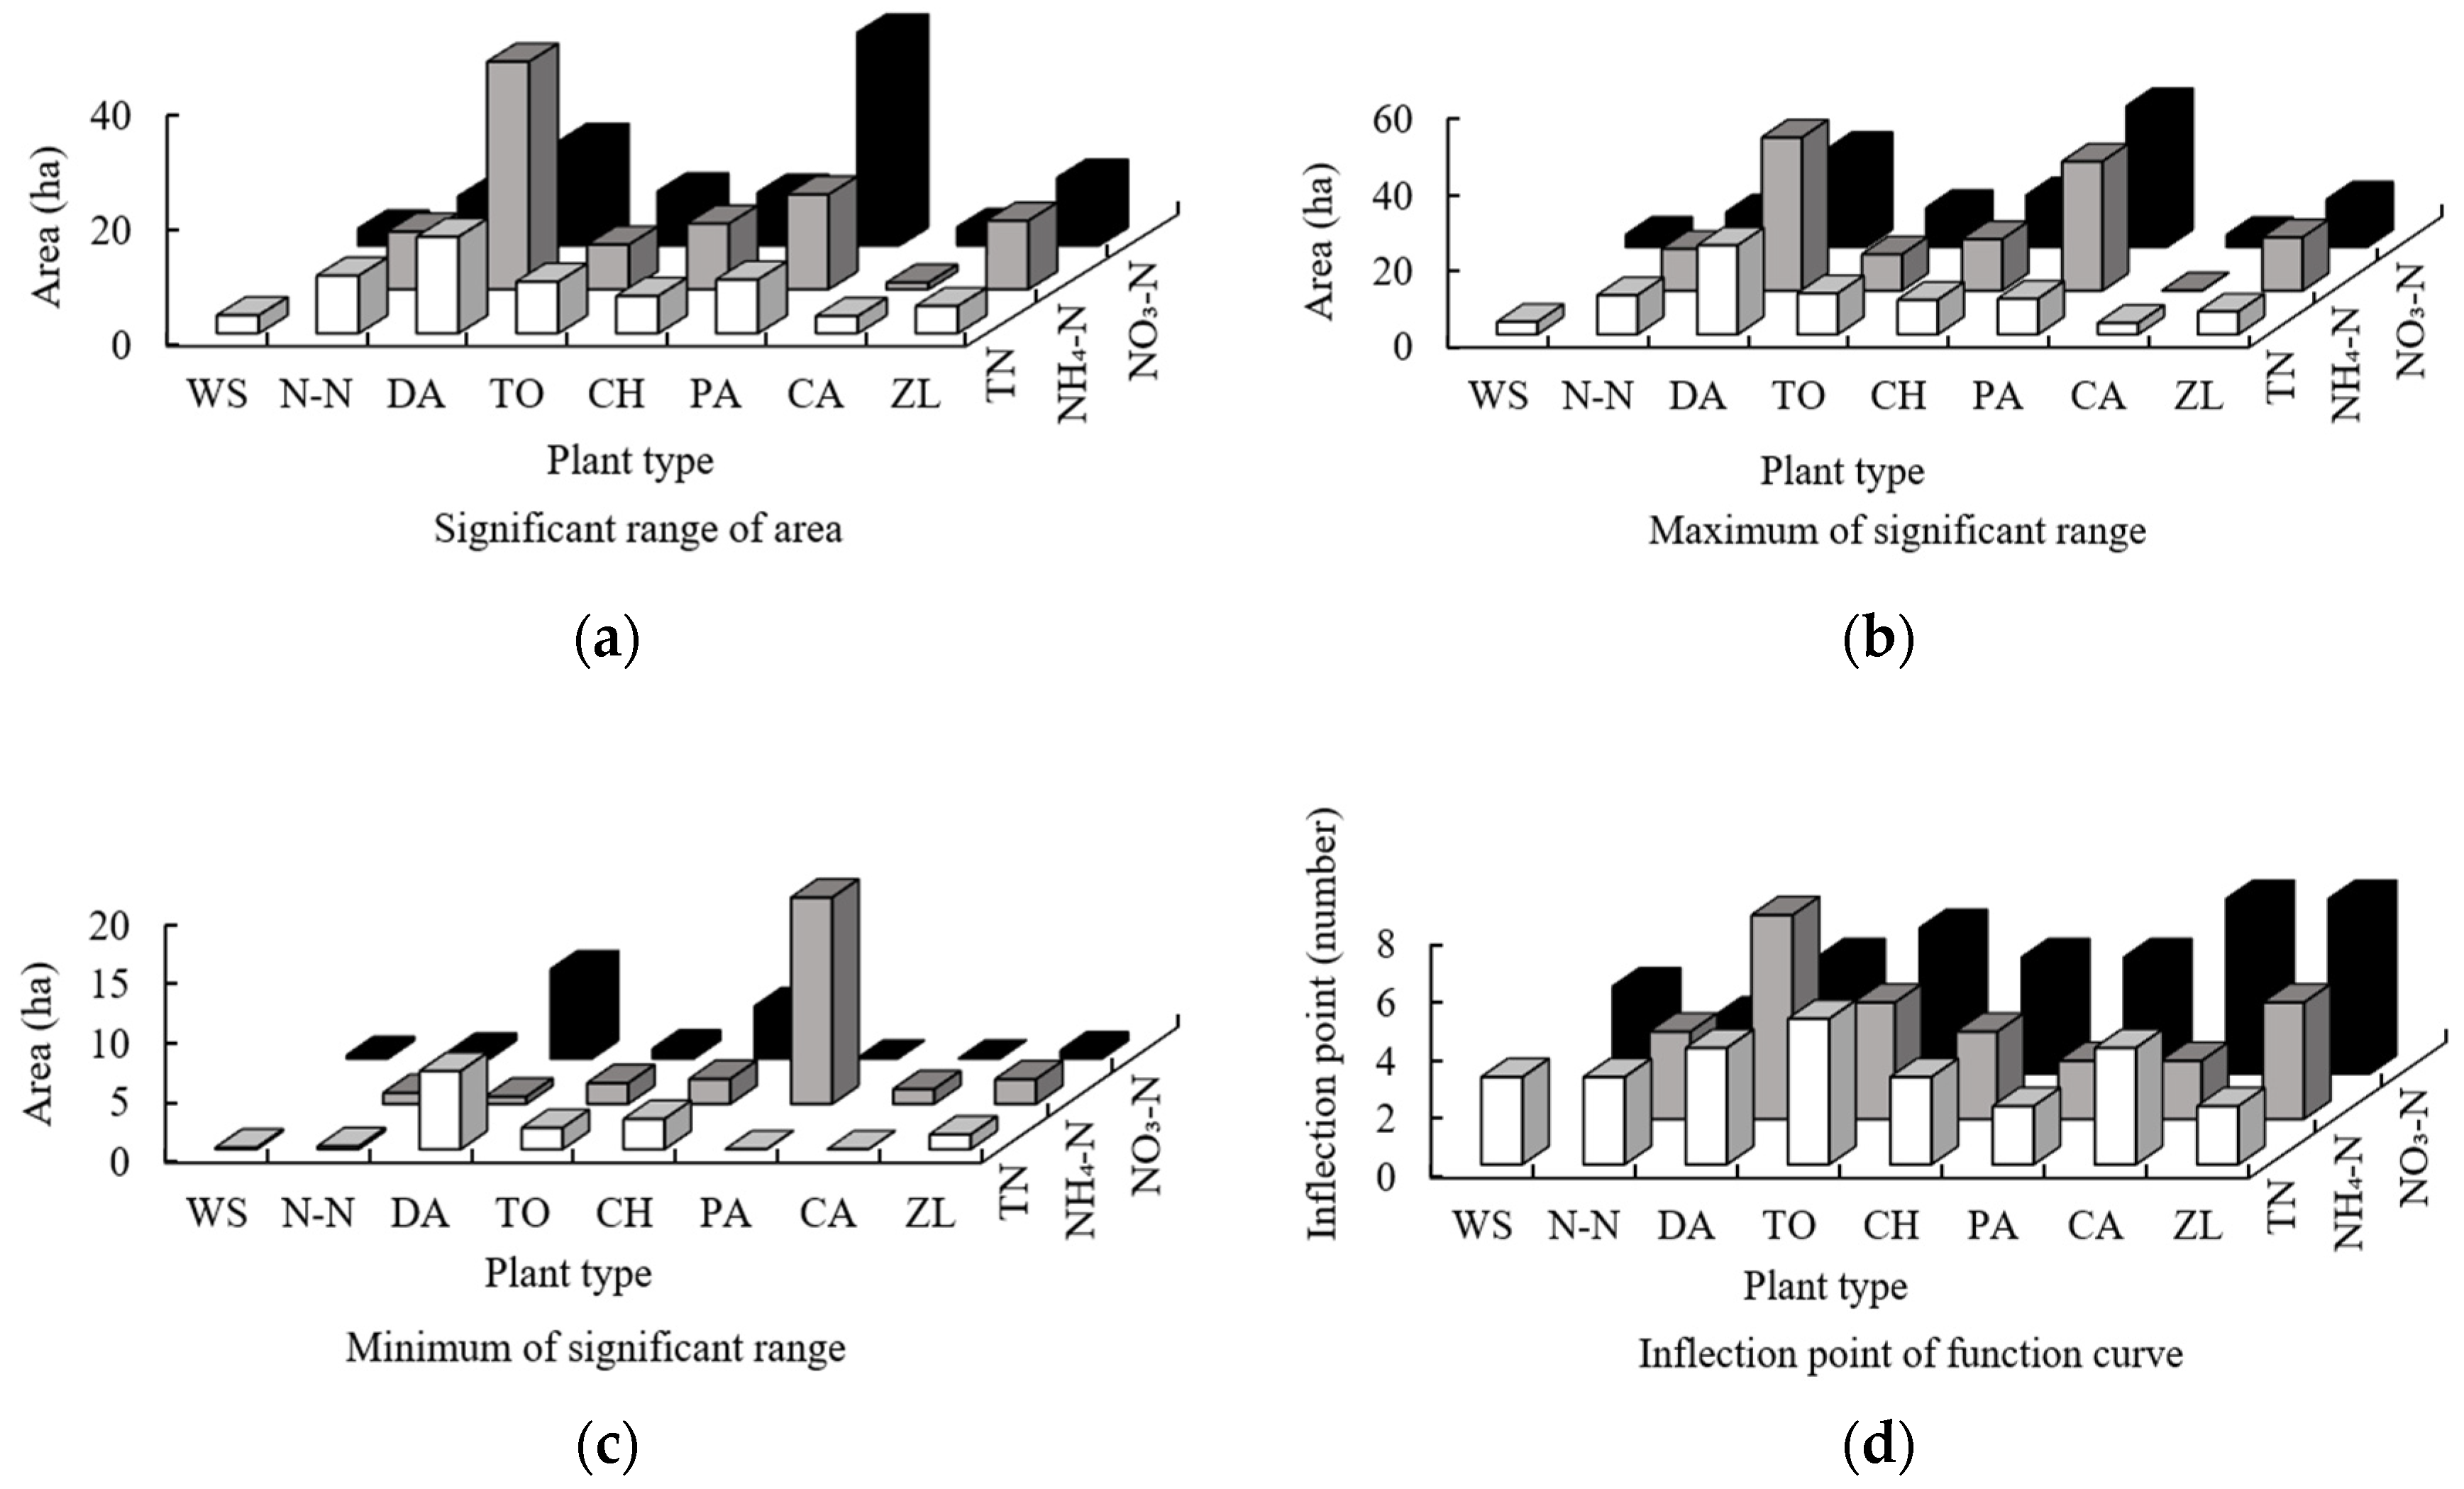
The significant ranges of the functions between the order of sampling points of all plant areas and TNR during the elimination process were as follows: DA > N-N > PA > TO > CH > ZL > WS > CA; NH4-NR: DA > PA > ZL > CH > N-N > TO > CA (did not reach a significant level for WS); and NO3-NR: PA > DA > ZL > TO > CH > N-N > CA > WS (Figure 3). Both DA and PA ranked in the top three, indicating that nitrogen removal in wetlands is mainly dependent on the plants with the largest area (DA: 31.2%; PA: 24.3%) (Figure 2). However, N-N ranked second, indicating that N-N has a strong ability to remove TN, although its area was small (Figure 2). The maximum of the function within the significant range between the order of sampling points of all plants’ areas and TNR was as follows: DA > TO > N-N > PA > CH > ZL > WS > CA; NH4-NR: DA > PA > ZL > CH > N-N > TO > CA (did not reach a significant level for WS); and NO3-NR: PA > DA > CH > ZL > TO > N-N > WS > CA (Figure 3). DA and PA ranked in the top two, with TNR ranking fourth, indicating that the largest area plant may accommodate and remove more nitrogen-containing wastewater based on area advantages (DA: 31.2%; PA: 24.3%). The result was similar to the 63% and 28% rates of nitrogen removal from wetland water bodies by Zizania caduciflora and PA, respectively, with the largest area in the Luoshi River wetland of China [33]. In addition, in the Guishui River wetland, China, the MIKE21 model was used to simulate a 13.16% increase in wetland plant area, and NH4-N and TN concentrations decreased by 14.29% and 20.00%, respectively [34]. However, in the ranking of TNR, the second and third were TO and N-N, respectively, indicating that the two plants have a strong ability to accommodate and remove TN. The minimum of the function within a significant range between the order of sampling points of all plants’ areas and TNR was as follows: DA > CH > TO > ZL > N-N > WS > PA = CA; NH4-NR: PA > CH > ZL > TO > CA > N-N > DA (did not reach a significant level for WS); and NO3-NR: DA > CA > TO > ZL > N-N > WS > PA = CH (Figure 3). DA ranked first in terms of TNR and NO3-NR, indicating that this plant must have a large area to exert its nitrogen removal ability. However, the NH4-NR only required a small area to take effect (DA: the last in terms of NH4-NR). On the contrary, PA required a larger area for the other two forms of nitrogen, except for NH4-NR, in order to exert nitrogen removal ability. There were differences in the area dependence of different plants on different forms of nitrogen removal. The number of inflection points of the function within a significant range between the order of sampling points of all plants’ areas and TNR was as follows: TO > DA = CA > CH = N-N = WS > PA > ZL; NH4-NR: DA > TO = ZL > CH = N-N > PA = CA (did not reach a significant level for WS); and NO3-NR: PA > DA > CH > ZL > TO > N-N > WS > CA (Figure 3). The ranking of DA as first indicates that the nitrogen removal ability of the plant increased with the increase in area, and the fluctuation in the removal rate increased. There were significant differences in the ranking of other plants, indicating that there were differences in the fluctuation of nitrogen removal among different forms of plants as the area increased.

3.1.2. The Impact of Patch Fragmentation

The significant ranges of the functions between the order of sampling points of all plants regarding LPI and TNR during the elimination process were as follows: DA > CH > TO > CA> WS (did not reach a significant level for N-N, PA, and ZL); NH4-NR: PA > DA > CH > N-N > WS > CA (did not reach a significant level for ZL and TO); and NO3-NR: PA > DA > CH > TO > N-N > CA > WS (did not reach a significant level for ZL) (Figure 4). DA and PA ranked in the top two of the three forms regarding removal rates of nitrogen (except for TNR), indicating that the main plants that remove nitrogen may still perform a nitrogen removal function even if they are associated with large patch fragmentation. The maximum of the function within the significant range between the order of sampling points of all plants regarding LPI and TNR was as follows: DA > CH > TO > WS > CA (did not reach a significant level for N-N, PA, and ZL); NH4-NR: DA > PA > CH > N-N > CA > WS (did not reach a significant level for ZL and TO); and NO3-NR: DA > PA > CH > TO > N-N > CA > WS (did not reach a significant level for ZL) (Figure 4). DA and PA ranked in the top two for the three forms of nitrogen removal rates (except for TNR), indicating that the more complete the plant patch, the stronger the ability. The minimum of the function within the significant range between the order of sampling points of all plants regarding LPI and TNR was as follows: DA > CH > TO > WS > CA (did not reach a significant level for N-N, PA, and ZL); NH4-NR: DA > PA > CH > CA > WS > N-N (did not reach a significant level for ZL and TO); and NO3-NR: DA > PA > CH > TO > WS > N-N > CA (did not reach a significant level for ZL) (Figure 4). DA and PA ranked in the top two for the three forms of nitrogen removal rates (except for TNR), indicating that although DA and PA play a role in patch fragmentation, there is still a requirement regarding the integrity of the patch area. Compared to other plants, these two plants may only have the function of nitrogen removal when they maintain the integrity of larger patches. Therefore, patch fragmentation has a significant impact on the nitrogen removal function of all wetland plants. The number of plant patches is negatively correlated with nitrogen removal capacity in southeastern Ontario, Canada [35]. A significant level is not reached for ZL regarding all forms of nitrogen removal, indicating that the removal ability of this plant is not sensitive to patch fragmentation. The number of inflection points of the function within the significant range between the order of sampling points of all plants regarding LPI and TNR was as follows: CA = TO > DA = CH = WS (did not reach a significant level for PA, ZL, and N-N); NH4-NR: N-N > PA = CH = DA > CA = WS (did not reach a significant level for TO and ZL); and NO3-NR: TO > CA = PA = CH = WS > N-N = DA (did not reach a significant level for ZL) (Figure 4). The complex changes in the fitting curve of the plants with low LPI indicate that patch fragmentation reduced the nitrogen removal ability of the plants.

3.2. The Effect of Plant Patch Shape on Nitrogen Removal

3.2.1. The Impact of Contact Density between Different Plants

The significant ranges of the functions between the order of sampling points of all plants regarding ED and TNR during the elimination process were as follows: N-N > ZL> PA > TO > CA > CH (did not reach a significant level for WS and DA); NH4-NR: N-N > ZL > DA > CH > CA > TO > WS > PA; and NO3-NR: N-N > ZL > CH > PA > WS > CA > DA > TO (Figure 5). N-N and ZL ranked in the top two, indicating that the two plants with strong nitrogen removal ability and insensitivity to patch fragmentation have the largest dependence of complexity on patch boundaries. The mix between these two plants and other plants has a small impact on nitrogen removal. The maximum of the function within a significant range between the order of sampling points of all plants regarding ED and TNR was as follows: CA > N-N > TO > CH > PA > ZL (did not reach a significant level for WS and DA); NH4-NR: CA > TO > N-N > WS > CH > ZL > PA > DA; and NO3-NR: CA > N-N > WS > TO > PA > CH > ZL > DA (Figure 5). The highest ranking of the three plants, namely CA, N-N, and TO, indicated that their nitrogen removal abilities may only be achieved when the three plants are fully mixed with other plants. The result was consistent with the average TN removal rate of about 20% higher than that of a single plant in any mixed method of 8 wetland plants in indoor experiments [36]. The DA ranked last, indicating that the nitrogen removal of this plant relied more on internal integrity and had a stronger ability to independently complete nitrogen removal. The minimum of the function within the significant range between the order of sampling points of all plants regarding ED and TNR was as follows: CA > TO > N-N > CH > PA > ZL (did not reach a significant level for WS and DA); NH4-NR: CA > TO > N-N > WS > CH > ZL > PA > DA; and NO3-NR: CA > TO > WS > PA > N-N > CH > ZL > DA (Figure 5). CA and TO are first, and DA ranks last, indicating that CA and TO require plant mixing to perform a nitrogen removal function, while this may be independently completed by DA. The number of inflection points of the function within the significant range between the order of sampling points of all plants regarding ED and TNR was as follows: PA > ZL > TO > CH = DA = WS > CA (did not reach a significant level for N-N); NH4-NR: CA = TO = ZL > CH = DA = WS > PA = N-N; NO3-NR: WS > TO = N-N = PA = ZL > CA = CH > DA (Figure 5). The fluctuation complexities of fitting curves for different forms of nitrogen differed, indicating that the impacts of different levels of plant mixing on the removal of different forms of nitrogen are very complex.

3.2.2. The Influence of the Contact of Internal Patches on Plants

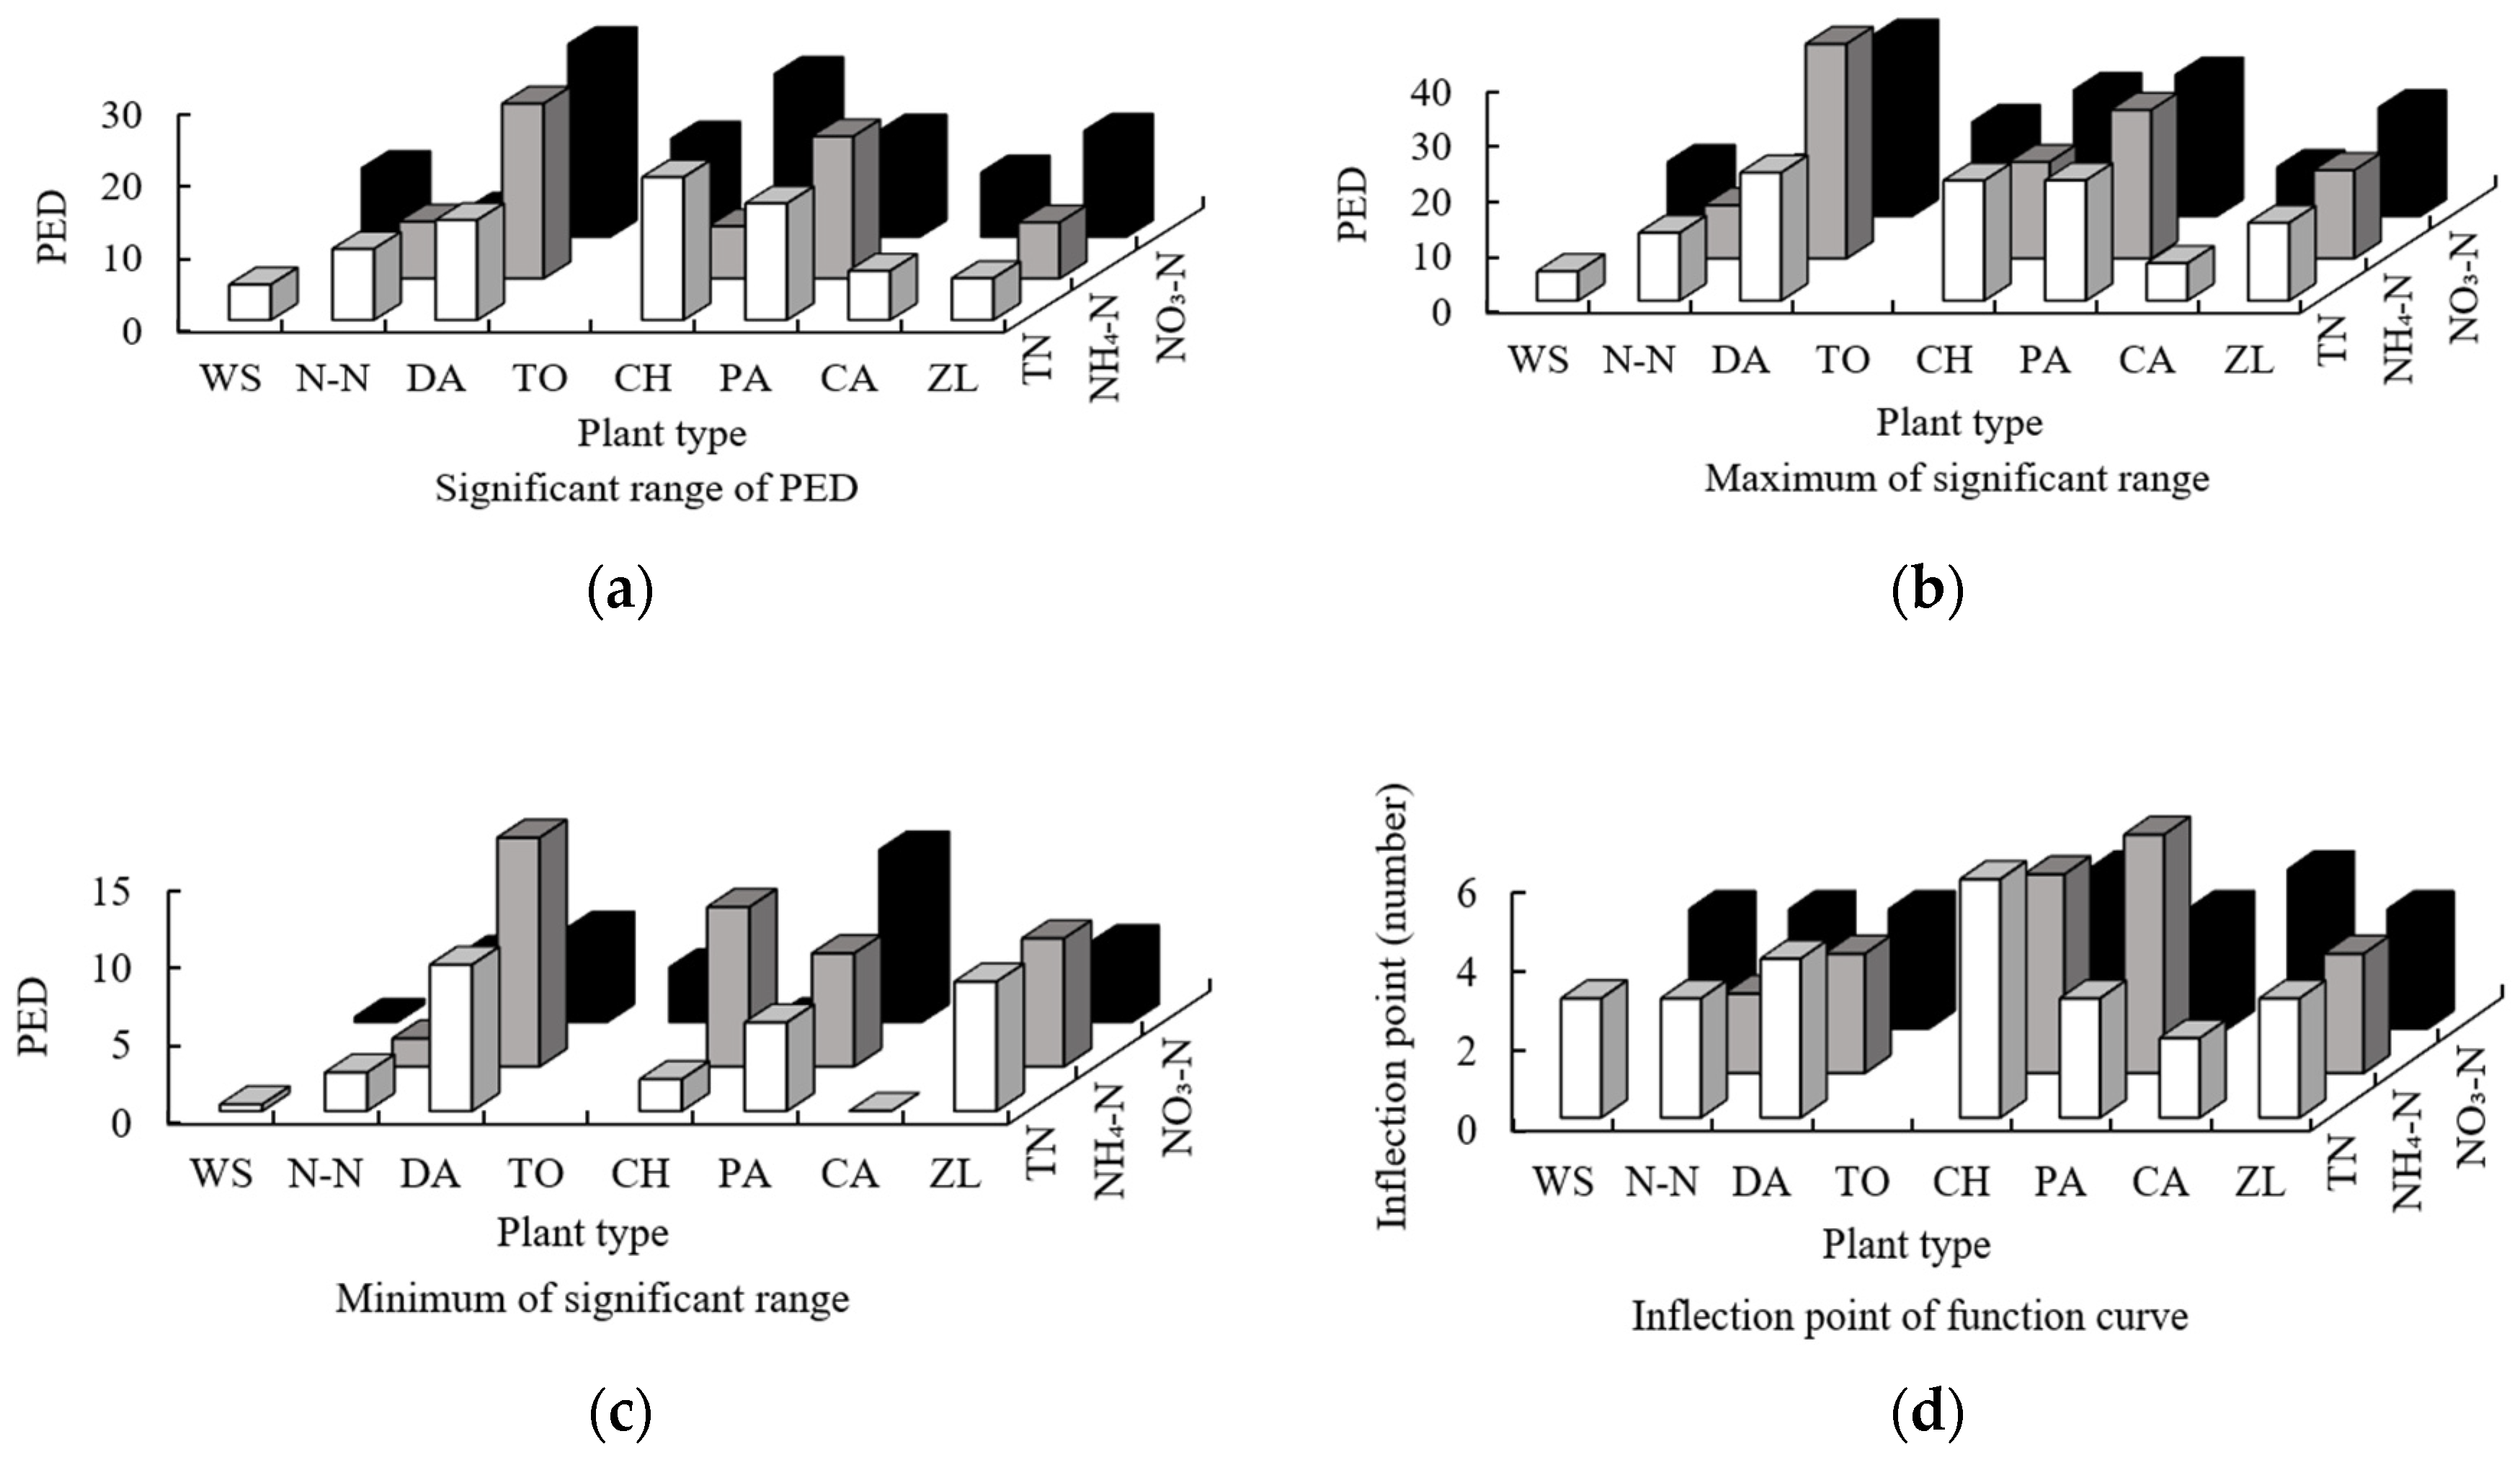
The significant ranges of the functions between the order of sampling points of all plants regarding PED and TNR during the elimination process were as follows: CH > PA > DA > N-N > CA > ZL > WS (did not reach a significant level for TO); NH4-NR: DA > PA > N-N > ZL > CH (did not reach a significant level for CA, TO, and WS); and NO3-NR: DA > CH > ZL > PA > TO > WS > CA > N-N (Figure 6). PA and DA ranked first, with the largest areas and some large patches. Therefore, many patches may independently perform nitrogen removal functions, and the requirements for connectivity between patches are not particularly strict. In addition, CA was first for the TNR and second for NO3-NR, indicating that this plant has a higher independent nitrogen removal ability in small patches. The maximum of the function within the significant range between the order of sampling points of all plants regarding PED and TNR was as follows: DA > PA > CH > ZL > N-N > CA > WS (did not reach a significant level for TO); NH4-NR: DA > PA > CA > ZL > N-N (did not reach a significant level for CH, TO, and WS); and NO3-NR: DA > PA > CH > ZL > TO > WS > CA > N-N (Figure 6). Both DA and PA ranked in the top two, indicating that the larger the plant area, the stronger the connectivity within the internal patch and the greater the nitrogen removal ability. This result is consistent with the conclusion that a 13.3% decrease in wetland plant coverage led to the fragmentation of large patches and the disruption of patch connectivity. The TN content increased from less than 1 mg/L in the 1950s to 2.07 mg/L in 2006 [37]. The minimum of the function within the significant range between the order of sampling points of all plants regarding PED and TNR was as follows: DA > ZL > PA > N-N > CH > WS > CA (did not reach a significant level for TO); NH4-NR: DA > CH > ZL > PA > N-N (did not reach a significant level for TO, CA, and WS); and NO3-NR: PA > DA > ZL > N-N > TO > CH > WS > CA (Figure 6). DA ranked first in TNR and NH4-NR and second in NO3-NR, indicating that this plant only played the role of nitrogen removal when the connectivity of the internal patch reached a high level. The relatively lower ranking of WS indicates that this plant can play a role when patch connectivity is low. The number of inflection points of the function within the significant range between the order of sampling points of all plants regarding PED and TNR was as follows: CH > DA > PA = ZL = N-N = WS > CA (did not reach a significant level for TO); NH4-NR: PA > CH > DA = ZL > N-N (did not reach a significant level for TO, CA, and WS); and NO3-NR: CH = CA > PA = DA = ZL = N-N = TO = WS (Figure 6). There were significant differences in the curve changes of different types of communities, indicating that different plants exhibit differences as fluctuations in nitrogen removal ability strengthen the internal patch connectivity.

3.2.3. The Influence of Patch Shape on Plants

The significant range of functions between the order of sampling points of all plants regarding FD and TNR during the elimination process was as follows: N-N > ZL > WS > DA > CH > CA > PA (did not reach a significant level for TO); NH4-NR: CA > WS > PA > DA > TO > ZL > CH > N-N; and NO3-NR: N-N > ZL > CA > PA > WS > CH > DA > TO (Figure 7). The N-N ranked first for TNR and NO3-NR and last for NH4-NR, indicating that differences were very large due to the influences of the patch shapes of different plants on the removal ability of different forms of nitrogen. Different plants have specific roles in the removal of different nitrogen forms. The maximum of the function within the significant range between the order of sampling points of all plants regarding FD and TNR was as follows: ZL > CH > N-N > DA > PA > WS > CA (did not reach a significant level for TO); NH4-NR: TO > CA > PA > DA > CH > ZL > WS > N-N; and NO3-NR: CA > N-N > WS > TO > PA > CH > ZL > DA (Figure 7). N-N ranked first for TNR, 6th for NH4-NR, and 7th for NO3-NR. There were vast differences in ranking for the removal of different nitrogen forms for the same plant, and similar phenomena were observed for other plants, indicating that different plants have different strengths and weaknesses for the removal of different nitrogen forms. The minimum of the function within the significant range between the order of sampling points of all plants regarding FD and TNR was as follows: CH > PA > ZL > DA > N-N > WS > CA (did not reach a significant level for TO); NH4-NR: TO > CA > PA > DA > CH > ZL > WS > N-N; and NO3-NR: CA > TO > WS > PA > N-N > CH > ZL > DA (Figure 7). CA ranked last for TNR, second for NH4-NR, and first for NO3-NR. There were differences in the order of nitrogen removal for different forms of the same plant, indicating that different plants have different minimums for the removal of different nitrogen forms, as well as the role of division of function. The number of inflection points of the function within the significant range between the order of sampling points of all plants regarding FD and TNR was as follows: DA = WS = ZL = CA = N-N > CH = PA (did not reach a significant level for TO); NH4-NR: PA > TO = CA = WS > DA > ZL = N-N > CH; and NO3-NR: WS > N-N = TO = PA = ZL > CH = CA > DA (Figure 7). The differences in curve changes among different plants indicate that the changes in the nitrogen removal abilities of different plants according to the patch shapes are very complex.

3.3. The Particularity of Floating Leaf Plants

N-N was one of the main forces for removing various forms of nitrogen, especially TN. Although its plant area was not the largest of all plants, the nitrogen removal ability was strong based on the impact of various plant patch sizes on the removal ability (Figure 3). Therefore, N-N, a floating leaf plant, has special value and plays an important role in nitrogen removal from water. This conclusion is consistent with the experimental results, showing that the rate of removal of TN wetlands was 18% higher for floating leaf plants than for emergent plants [38]. It is also in accordance with the result of the rapid nitrogen concentration decline in the distribution area of floating leaf plants in the Taihu Lake wetland [39]. The research results correspond in terms of nitrogen budget, where the N reduction from floating ryegrass treatments was 8.4%-16.9% higher than for other wetland plants [40]. The impact of various plants regarding ED on the nitrogen removal ability showed that the N-N ranking was relatively higher, indicating that floating leaf plants may be combined with any other plants to improve the nitrogen removal ability. The floating leaf plants were distributed in areas with deep water depth, close to river channels, while the other seven plants were distributed in areas with shallow water depth, relatively far from river channels. Wetland water mainly came from river channels, and nearby farmland retreated into river channels first and then flowed from deep water (close to river channels) to shallow water (far from river channels) with the terrain. Therefore, the process of water flow indicated that nitrogen-containing water required passing through the distribution area of floating leaf plants at deeper depths to reach other plant distribution areas at shallower depths. When nitrogen-containing wastewater entered wetlands from channels and came into contact with various wetland plants, the relatively strong nitrogen removal ability of floating leaf plants reduced the content of nitrogen that entered the water where there were these other plants. The floating leaf plants thus play a protective and barrier role for other wetland plants. The N-N rankings were relatively lower for the function eigenvalues of all plants between the removal order of PED and the three-nitrogen removal rate, indicating that floating leaf plants required connectivity, though relatively little, within the patch. Some relatively isolated small patches may also play a role in nitrogen removal; if the patches were too fragmented and isolated, the nitrogen removal ability would be greatly affected.

3.4. The Effect of Fragmentation on Nitrogen Removal Ability

CA ranked last for function eigenvalues in all plants between the removal order according to plant area and the three-nitrogen removal rate, indicating that CA has the weakest nitrogen removal ability, mainly because this plant has the smallest area. CA ranked in the last three for function eigenvalues of all plants between the removal order of LPI and the three-nitrogen removal rate, indicating a decrease in nitrogen removal ability after fragmentation. The integrity of the patch is thus an important guarantee for maintaining nitrogen removal from wetland plants. The results of this study were similar to conclusions from some other research; for example, when the fragmentation index of coastal wetlands increased from 0.244 in 1987 to 0.325 in 2002, the absorbed TN decreased by 4600 tons in southern Laizhou Bay, China [41]. The fragmentation of wetland shortened the convergence distance of the “source” and weakened the purification function of the “sink”, leading to an increase in TN concentration in the Lashihai Basin of Yunnan Province, China [42]. The water purification service was negatively correlated with patch fragmentation (p < 0.01). The nitrogen content in water rapidly increased with the acceleration of patch fragmentation in the wetlands of the Yangtze River Basin [43]. CA ranked in the last three and was mostly last for function eigenvalues of all plants between the removal order of PED and the three-nitrogen removal rate, indicating that the decrease in connectivity with patch fragmentation is an important factor leading to the decrease in the nitrogen removal ability of CA. CA ranked in the top two regarding NH4-NR and NO3-NR for the function eigenvalues of all plants between the removal order of FD and the three-nitrogen removal rate. The FD of CA was the smallest and the most regular, indicating that the more regular the patch shape, the greater the nitrogen removal ability.

3.5. The Collaborative Effects of Wetland Plants on Nitrogen Removal

The different plants have different rankings for function eigenvalues of all plants between the area indices, shape indices, and rates of removal of various nitrogen forms, indicating that different plants have differences in their abilities to remove the different forms of nitrogen. This difference is a result of the different physiological and ecological habits of different plants, as well as the different nitrogen utilization methods for different forms of nitrogen. Nitrogen removal from water is the result of division and cooperation among all plants. In the process of various forms of nitrogen removal, major plants, such as PA, rely on their area advantage to undertake the main function of nitrogen removal. However, they also need to cooperate with other plants, such as floating leaf plants, to avoid a single plant completing all functions of nitrogen removal, resulting in a decreased wetland purification function. Under the effective cooperation of Phragmites australis, the vegetation belts dominated by Typha latifolia were shown to have greater nitrogen removal efficiencies in the coastal marsh of the Natural Reserve Els Aiguamolls de l’Emporda [44]. Lythrum salicaria had the highest (88.1%) NH4-N removal, and Canna indica had the highest TN removal. The N removal efficiency in the mix of four species (Juncus effusus, Oenanthe javanica, Phalaris arundinacea, and Rumex japonicus) reached 75%, showing that a higher species richness level significantly increased N removal rates [45]. The differences in the abilities of different plants to remove different forms of nitrogen effectively complement water purification, completing the function of nitrogen removal in water. Therefore, under certain pressure on the purification function, different plants have different divisions, which may effectively guarantee the ability to remove nitrogen.

4. Conclusions

The removal of various forms of nitrogen in wetland water bodies was found to be related to the spatial pattern of plants. The area and shape of wetland plants have a significant impact on nitrogen removal, and different plants worked together to effectively remove various forms of nitrogen in wetland.
(1)
DA and PA ranked first in terms of the significant range, maximum, and minimum of the functions between the order of sampling points of the area of all plants and the three forms of nitrogen. The main force for nitrogen removal was dependent on the plant with the largest area (DA: 31.2%; PA: 24.3%), and the N-N plant also ranks highly, indicating that floating leaf plants have strong nitrogen removal ability despite their small area (5%). The results for the significant range, maximum, and minimum of the functions between the order of sampling points of the PLI of all plants and the three forms of nitrogen indicate that the fragmentation of plant patches reduces the nitrogen removal ability (the mean for the PLI of 8 plants is 0.10).
(2)
The results for the eigenvalues of the functions between the order of sampling points of the DE of all plants and the three forms of nitrogen showed that the plants had a higher independent nitrogen removal ability, and the plants with low nitrogen removal ability may only perform a nitrogen removal function when mixed with other plants (the mean for the DE of 8 plants is 9.25). The results for the eigenvalues of the functions between the order of sampling points of the PDE of all plants and the three forms of nitrogen showed that plants with strong nitrogen removal abilities may also play a role in nitrogen removal, even in situations of poor connectivity; however, if connectivity was strong (DA: 16.79; PD: 15.70), this function would increase. The results for the eigenvalues of the functions between the order of sampling points of the FD of all plants and the three forms of nitrogen indicated that different plants have obviously different capacities for removing the different forms of nitrogen. Nitrogen removal involved all wetland plants in a collaborative manner, resulting in the completion of the division.

Author Contributions

Conceptualization, Y.A.; Investigation, Y.W.; Writing—Original Draft Preparation, J.M.; Writing—Review & Editing, X.W.; Supervision, M.Z. All authors have read and agreed to the published version of the manuscript.

Funding

This research was funded by the National Natural Science Foundation of China (42230516), the Technology Development Program of Jilin Province (YDZJ202301ZYTS524), the Planning Project of the Jilin Provincial Department of Education (JJKH20220830KJ), and the Natural Science Foundation of Changchun Normal University (CSJJ2022009ZK).

Data Availability Statement

Data are contained within the article.

Acknowledgments

The authors express gratitude to the reviewers and editors for their critical comments on an earlier version of the manuscript.

Conflicts of Interest

The authors declare no conflicts of interest.

References

  1. Yargholi, B.; Kanani, E.; Sepehri, S. A long-term assessment of the effectiveness of a semi-artificial wetland in removing organic materials and nutrients from agricultural drainage water. J. Water Process Eng. 2023, 55, 104117. [Google Scholar] [CrossRef]
  2. Wang, J.L.; Chen, G.F.; Fu, Z.S.; Qiao, H.X.; Liu, F.X. Assessing wetland nitrogen removal and reed (Phragmites australis) nutrient responses for the selection of optimal harvest time. J. Environ. Manag. 2021, 280, 111783. [Google Scholar] [CrossRef] [PubMed]
  3. Khormali, A. Effect of water cut on the performance of an asphaltene inhibitor package: Experimental and modeling analysis. Pet. Sci. Technol. 2022, 40, 2890–2906. [Google Scholar] [CrossRef]
  4. Nilsson, J.E.; Liess, A.; Ehde, P.E.; Weisner, S.E.B. Mature wetland ecosystems remove nitrogen equally well regardless of initial planting. Sci. Total Environ. 2020, 716, 137002. [Google Scholar] [CrossRef] [PubMed]
  5. Gu, X.S.; Chen, D.Y.; Wu, F.; Tang, L.; He, S.B.; Zhou, W.L. Function of aquatic plants on nitrogen removal and greenhouse gas emission in enhanced denitrification constructed wetlands: Iris pseudacorus for example. J. Clean. Prod. 2022, 330, 129842. [Google Scholar] [CrossRef]
  6. Gao, L.; Zhou, W.L.; Wu, S.Q.; He, S.B.; Huang, J.C.; Zhang, X. Nitrogen removal by thiosulfate-driven denitrification and plant uptake in enhanced floating treatment wetland. Sci. Total Environ. 2018, 621, 1550–1558. [Google Scholar] [CrossRef] [PubMed]
  7. Yang, X.; Li, Y.C.; Wang, H.F.; Zhou, J.; Lu, D.P. Purification effects of aquatic plants on nitrogen and phosphorus in eutrophic water bodies. J. Dali Univ. 2021, 12, 65–68. (In Chinese) [Google Scholar] [CrossRef]
  8. Bai, X.M.; He, L.S.; Li, B.C.; Meng, R.; Meng, F.L.; Huang, C.H.; Dong, J.; Li, G. Application of combined aquatic plants to control eutrophic water in Baiyangdian lake. Wetl. Sci. 2013, 11, 495–498. (In Chinese) [Google Scholar] [CrossRef]
  9. Białowiec, A.; Davies, L.; Albuquerque, A.; Randerson, P.F. The influence of plants on nitrogen removal from landfill leachate in discontinuous batch shallow constructed wetland with recirculating subsurface horizontal flow. Ecol. Eng. 2012, 40, 44–52. [Google Scholar] [CrossRef]
  10. Wang, Y.N.; Guo, X.C.; Lu, S.Y.; Liu, X.H.; Wang, X.H. Review of nitrogen removal in low-polluted water by constructed wetlands: Performance, mechanism, and influencing. J. Agric. Resour. Environ. 2021, 38, 722–734. (In Chinese) [Google Scholar] [CrossRef]
  11. Dong, C.; Li, M.T.; Zhuang, L.L.; Zhang, J.; Shen, Y.H.; Li, X.Z. The improvement of pollutant removal in the ferric-carbon micro-electrolysis constructed wetland by partial aeration. Water 2020, 12, 389. [Google Scholar] [CrossRef]
  12. Awad, J.; Hewa, G.; Myers, B.R.; Walker, C.; Lucke, T.; Akyol, B.; Duan, X.H. Investigation of the potential of native wetland plants for removal of nutrients from synthetic stormwater and domestic wastewater. Ecol. Eng. 2022, 179, 106642. [Google Scholar] [CrossRef]
  13. Li, X.; Li, Y.Y.; Li, Y.; Wu, J.S. The phytoremediation of water with high concentrations of nitrogen and phosphorus contamination by three selected wetland plants. J. Water Process Eng. 2021, 40, 101828. [Google Scholar] [CrossRef]
  14. Zhou, X.H.; Wang, G.X.; Guo, C.C.; Cao, Y.; Ge, X.G.; Yang, W.B.; Pan, G.Q.; Ma, T. Effect of aquatic macrophytes in Tidal wetlands on the total nitrogen and total phosphorus. Res. Soil. Water Conserv. 2007, 14, 137–140. (In Chinese) [Google Scholar]
  15. Szota, C.; Farrell, C.; Livesley, S.J.; Fletcher, T.D. Salt tolerant plants increase nitrogen removal from biofiltration systems affected by saline stormwater. Water Res. 2015, 83, 195–204. [Google Scholar] [CrossRef]
  16. Hallin, S.; Hellman, M.; Choudhury, M.I.; Ecke, F. Relative importance of plant uptake and plant associated denitrification for removal of nitrogen from mine drainage in sub-arctic wetlands. Water Res. 2015, 85, 377–383. [Google Scholar] [CrossRef]
  17. Huang, Y.C.; Tian, K.; Yue, H.T.; Yang, Y. Purification effects of common lakeside plant communities in plateau wetlands of Yunnan on the removal of sewage nitrogen. Ecol. Environ. Sci. 2012, 21, 359–363. (In Chinese) [Google Scholar] [CrossRef]
  18. Hong, S.C.; Wang, C.E.; Feng, Z.R.; Xue, X.D. Differential study on nitrogen and phosphorus accumulation in different aquatic plant communities. J. Zhejiang Univ. Sci. Technol. 2021, 33, 432–440. (In Chinese) [Google Scholar] [CrossRef]
  19. Xing, W.M.; Han, Y.G.; Guo, Z.F.; Zhou, Y. Quantitative study on redistribution of nitrogen and phosphorus by wetland plants under different water quality conditions. Environ. Pollut. 2020, 261, 114086. [Google Scholar] [CrossRef]
  20. Zhou, W.; Liu, G.H.; Xing, W. Variations of multi-elements in wetland plants on the Tibetan Plateau are mainly determined by environmental factors. Ecol. Indic. 2023, 146, 109807. [Google Scholar] [CrossRef]
  21. Shang, W.; Yang, Y.X. Degradation characteristics, patterns, and processes of lakeside wetland in Napahai of northwest Yunnan Plateau, Southwest China. Chin. J. Appl. Ecol. 2012, 23, 3257–3265. (In Chinese) [Google Scholar] [CrossRef]
  22. Sosa, L.L.D.; Glanville, H.C.; Marshall, M.R.; Williams, A.P.; Abadie, M.; Clark, I.M.; Blaud, A.; Jones, D.L. Spatial zoning of microbial functions and plant-soil nitrogen dynamics across a riparian area in an extensively grazed livestock system. Soil. Biol. Biochem. 2018, 120, 153–164. [Google Scholar] [CrossRef]
  23. Li, Q.R.; Liu, J.X.; Su, J.H.; Chai, B.F. Diversity distribution pattern and maintenance mechanism of epiphytic fungi communities on leaves of Nymphaea tetragona and Vallisneria natans. Nat. Sci. Ed. 2023. (In Chinese) [Google Scholar] [CrossRef]
  24. Li, Y.; Tian, K.; Xiao, D.R.; Yang, Q.; Xie, W.Y. Effects of lakeside plant spatial allocation in plateau wetlands of Yunnan, Southwest China on the removal of sewage nitrogen and phosphorus. Chin. J. Ecol. 2012, 31, 1425–1431. (In Chinese) [Google Scholar] [CrossRef]
  25. Wei, O.Y.; Yang, W.X.; Tysklind, M.; Xu, Y.X.; Lin, C.Y.; Gao, X.; Hao, Z.C. Using river sediments to analyze the driving force difference for nonpoint source pollution dynamics between two scales of watersheds. Water Res. 2018, 139, 311e320. [Google Scholar] [CrossRef]
  26. Wang, G.D.; Jiang, M.; Wang, M.; Xue, Z.S. Natural revegetation during restoration of wetlands in the Sanjiang Plain, Northeastern China. Ecol. Eng. 2019, 132, 49–55. [Google Scholar] [CrossRef]
  27. Zhang, Q.S.; Sun, J.H.; Zhang, G.X.; Liu, X.M.; Wu, Y.F.; Sun, J.X.; Hu, B.T. Spatiotemporal dynamics of water supply–demand patterns under large-scale paddy expansion: Implications for regional sustainable water resource management. Agr. Water Manag. 2023, 285, 108388. [Google Scholar] [CrossRef]
  28. Yu, H.; Wang, X.D.; Chu, L.J.; Wang, G.D.; Sun, G.Z.; Sun, M.Y.; Wang, J.Y.; Jiang, M. Is there any correlation between landscape characteristics and total nitrogen in wetlands receiving agricultural drainages? Chin. Geogra. Sci. 2019, 29, 712–724. [Google Scholar] [CrossRef]
  29. Fu, J.; Liu, J.; Wang, X.W.; Zhang, M.D.; Chen, W.W.; Chen, B. Ecological risk assessment of wetland vegetation under projected climate scenarios in the Sanjiang Plain, China. J. Environ. Manag. 2020, 273, 111108. [Google Scholar] [CrossRef]
  30. Zhang, S.B.; Qin, W.; Xia, X.H.; Xia, L.Z.; Li, S.L.; Zhang, L.W.; Bai, Y.B.; Wang, G.Q. Ammonia oxidizers in river sediments of the Qinghai-Tibet Plateau and their adaptations to high-elevation conditions. Water Res. 2020, 173, 115589. [Google Scholar] [CrossRef]
  31. Jin, X.G.; Tu, Q.Y. The Standard Methods in Lake Eutrophication Investigation, 2nd ed.; China Environmental Science Press: Beijing, China, 1990. [Google Scholar]
  32. Allen, D.J.; Farrell, M.; Huang, J.Y.; Reynolds, C.; Rupasinghe, M.; Mosley, L.M. Long-term water quality response to increased hydraulic loadings in a field-scale free water surface constructed wetland treating domestic effluent. J. Environ. Manag. 2022, 311, 114858. [Google Scholar] [CrossRef] [PubMed]
  33. Su, Y.; Yang, T. Analysis of the removal effects of nitrogen and phosphorus on reaping wetland plants in Autumn by Loushijiang wetland as an example. Environ. Sci. Surv. 2018, 37, 30–33. (In Chinese) [Google Scholar] [CrossRef]
  34. Li, Y.J.; Du, Y.L.; Bi, E.P.; Wang, L.; Chen, C.B. Simulation of water quality response of Guishui river wetland plants and water diversion. Environ. Sci. 2020, 41, 4096–4104. (In Chinese) [Google Scholar] [CrossRef]
  35. Houlahan, J.E.; Findlay, C.S. The effects of adjacent land use on wetland amphibian species richness and community composition. Can. J. Fish. Aquat. Sci. 2003, 60, 1078–1094. [Google Scholar] [CrossRef]
  36. Peng, W.T.; Zou, L.; Duan, W.B.; Li, Y.X.; Pan, Y.Z.; Zeng, D.G. Efficiency of nitrogen and phosphorus removal from sewage by various combinations of wetland plants. Acta Sci. Circumstantiae 2012, 32, 612–617. (In Chinese) [Google Scholar] [CrossRef]
  37. Hao, M.X.; Yang, L.; Kong, X.H.; Xu, X.; Lu, W.; Li, Z.Q. Diversity and community succession of macrophytes in Lake Changhu, Hubei Province. J. Lake Sci. 2015, 27, 94–102. (In Chinese) [Google Scholar]
  38. Song, Y.Z.; Zhu, G.W.; Qin, B.Q. Applicability analysis of aquatic macrophytes on controlling nitrogen and phosphorus from water in the Kangshan Bay demonstration area of Lake Taihu. J. Lake Sci. 2013, 25, 259–265. [Google Scholar]
  39. Duan, J.J.; Shu, T.; Xue, L.H.; He, S.Y.; Petropoulos, E.; Feng, Y.Y.; Zhou, B.B.; Yang, L.Z. Nitrogen removal efficiency in sustainable eco-ditches with floating ryegrass mats: The effect of loading (hydraulic and nitrogen) and water level on N removal. Ecol. Eng. 2023, 187, 106872. [Google Scholar] [CrossRef]
  40. Zhang, X.L.; Zhang, Z.H.; Xu, Z.J.; Gu, D.Q.; Zheng, W. Landscape pattern change and its cumulative environmental effects of coastal wetlands in southern Laizhou Bay wetlands. Chin. J. Ecol. 2009, 28, 2437–2443. (In Chinese) [Google Scholar] [CrossRef]
  41. Zhang, H.S.; Jiao, Y.M.; Zhang, H.; Zhang, L.X.; Tao, Y.; Xu, Q.; Zhang, Z.N. Effects of Landscape Patterns on Surface Water Quality and Its Characteristic Scale in the Lashihai Basin of Yunnan Province. Chin. J. Ecol. 2023. (In Chinese). Available online: https://kns.cnki.net/kcms2/article/abstract?v=xBNwvqFr00I_tdF_wPjKiIVmFUKrMp3K6jSwzTYtNoQCwMiP4OjdiBqTsnvCyoY82jaJFWdWkMOWXyTsg02DfGN8s9VvU27IlqYcZxvE7sg4jC6Xxzqwgg1XVVo1J8WNZpHkgEDpQ_Y=&uniplatform=NZKPT&=CHS (accessed on 25 November 2023).
  42. Liu, Y.N.; Kong, L.Q.; Xiao, Y.; Zheng, H. Relationships between landscape pattern and ecosystem water purification service in the Yangtze River Basin. Acta Ecol. Sin. 2019, 39, 844–852. (In Chinese) [Google Scholar] [CrossRef]
  43. Garcia-Lledo, A.; Ruiz-Rueda, O.; Vilar-Sanz, A.; Sala, L.; Baneras, L. Nitrogen removal efficiencies in a free water surface constructed wetland in relation to plant coverage. Ecol. Eng. 2011, 37, 678–684. [Google Scholar] [CrossRef]
  44. Han, W.J.; Chang, J.; Du, Y.Y.; Chang, S.X.; Zhang, C.B.; Ge, Y. Plant species diversity impacts nitrogen removal and nitrous oxide emissions as much as carbon addition in constructed wetland microcosms. Ecol. Eng. 2016, 93, 144–151. [Google Scholar] [CrossRef]
  45. Zuo, X.J.; Zhang, H.S.; Yu, J.H. Microbial diversity for the improvement of nitrogen removal in stormwater bioretention cells with three aquatic plants. Chemosphere 2020, 244, 125626. [Google Scholar] [CrossRef]
Figure 1. Sampling plots of TN, NH4-N, and NO3-N in the Naolihe wetlands in northeast China.
Water 16 00128 g001
Figure 2. The area and shape indices of each wetland plant (a total of 8) were calculated in relation to each section in the Naolihe wetlands in northeast China. The black dots represented the data values of each index for all segments, while the white dot represented the mean of the data series. (a): The plant area index of all wetland plants for each section. (b): Number of patch of all wetland plants for each section. (c): largest patch index of all wetland plants for each section. (d): Edge density index of all wetland plants for each section. (e): patch edge density index of all wetland plants for each section. (f): fractal dimension index of all wetland plants for each section. WS: weeds, N-N: Nymphoides peltata-Nymphoides cristatum, DA: Deyeuxia angustifolia, TO: Typha orientalis, CH: Carex heterolepis, PA: Phragmites australis, CA: Carex appendiculata, ZL: Zizania latifolia.
Water 16 00128 g002
Figure 3. The significant range (a), extreme values (maximum (b) and minimum (c)), and the number of inflection points (d) of the functions between the order of sampling points of all plant areas and the three removal rates of nitrogen during the elimination process. WS: weeds, N-N: Nymphoides peltata-Nymphoides cristatum, DA: Deyeuxia angustifolia, TO: Typha orientalis, CH: Carex heterolepis, PA: Phragmites australis, CA: Carex appendiculata, ZL: Zizania latifolia.
Water 16 00128 g003
Figure 4. The significant range (a), extreme values (maximum (b) and minimum (c)), and the number of inflection points (d) of the functions between the order of sampling points of the largest patch indices (LPI) of all plants and the three removal rates of nitrogen during the elimination process. WS: weeds, N-N: Nymphoides peltata-Nymphoides cristatum, DA: Deyeuxia angustifolia, TO: Typha orientalis, CH: Carex heterolepis, PA: Phragmites australis, CA: Carex appendiculata, ZL: Zizania latifolia.
Water 16 00128 g004aWater 16 00128 g004b
Figure 5. The significant range (a), extreme values (maximum (b) and minimum (c)), and the number of inflection points (d) of the functions between the order of sampling points of edge density (ED) of all plants and three removal rates of nitrogen during the elimination process. WS: weeds, N-N: Nymphoides peltata-Nymphoides cristatum, DA: Deyeuxia angustifolia, TO: Typha orientalis, CH: Carex heterolepis, PA: Phragmites australis, CA: Carex appendiculata, ZL: Zizania latifolia.
Water 16 00128 g005
Figure 6. The significant range (a), extreme values (maximum (b) and minimum (c)), and the number of inflection points (d) of the functions between the order of sampling points of patch edge density (PED) of all plants and three removal rates of nitrogen during the elimination process. WS: weeds, N-N: Nymphoides peltata-Nymphoides cristatum, DA: Deyeuxia angustifolia, TO: Typha orientalis, CH: Carex heterolepis, PA: Phragmites australis, CA: Carex appendiculata, ZL: Zizania latifolia.
Water 16 00128 g006
Figure 7. The significant range (a), extreme values (maximum (b) and minimum (c)), and the number of inflection points (d) of the functions between the order of sampling points of the fractal dimension (FD) of all plants and the three removal rates of nitrogen during the elimination process. WS: weeds, N-N: Nymphoides peltata-Nymphoides cristatum, DA: Deyeuxia angustifolia, TO: Typha orientalis, CH: Carex heterolepis, PA: Phragmites australis, CA: Carex appendiculata, ZL: Zizania latifolia.
Water 16 00128 g007
Table 1. Location of sampling plots in the Naolihe wetlands.
Sampling PointsLongitude (E)Latitude (N)
1132.98°47.12°
2132.46°46.82°
3132.68°46.77°
4132.85°46.77°
5132.98°46.82°
6133.12°46.90°
7133.20°47.20°
8133.46°47.24°
9133.73°47.26°
10133.91°47.27°
Disclaimer/Publisher’s Note: The statements, opinions and data contained in all publications are solely those of the individual author(s) and contributor(s) and not of MDPI and/or the editor(s). MDPI and/or the editor(s) disclaim responsibility for any injury to people or property resulting from any ideas, methods, instructions or products referred to in the content.