Article

The Social Fabric of Watershed Management: Comparison of Citizen-Based and Agency-Based Organizations

1
College of Business, Gachon University, Seongnam-si 13120, Republic of Korea
2
Department of Geography and Environment, University of North Carolina at Chapel Hill, Chapel Hill, NC 27599, USA
3
Department of Natural Resources and the Environment, Cornell University, Ithaca, NY 14853, USA
*
Author to whom correspondence should be addressed.
Water 2024, 16(1), 111; https://doi.org/10.3390/w16010111
Submission received: 29 November 2023 / Revised: 18 December 2023 / Accepted: 23 December 2023 / Published: 27 December 2023

Abstract

:
This research offers an exploration of the social networks within two distinct watershed groups in the Hudson River, New York State, USA: citizen-based and agency-based organizations. Through a social network analysis of their operations and interactions, this study unveils the complex dynamics and roles of individual nodes in facilitating nine types of connections, such as political and financial, within these networks. The citizen-based organization demonstrated denser and more cohesive networks, suggesting robust relationships and enhanced resilience and adaptability. In contrast, the agency-based organization exhibited more hierarchical networks. This study employs both network-level and node-level analyses to examine the social networks within watershed groups. Our network-level analysis focuses on metrics such as density, average degree, and hierarchy, while our node-level analysis examines clustering coefficients and influence. It also explores ego networks through an analysis of their density and the effective size of structural holes. Our finding is that the social networks of the two groups are quite distinct, and there is limited exchange of information and resources between them. However, we discovered that effective communication among a few well-connected individuals (e.g., those with high influence values) within each group can enhance the effectiveness and resilience of these networks. These analyses aim to provide a detailed understanding of the social dynamics within regional watershed groups.

1. Introduction

Watershed management, a critical component in preserving and enhancing our natural environments, necessitates a comprehensive understanding of the social networks that underpin the organizations dedicated to this cause. The intricate web of relationships and interactions within and between such organizations can influence their operational efficacy and impact on watershed conservation and management. This study embarks on an exploration into the social networks within two distinct watershed groups, namely citizen-based and agency-based organizations, each possessing unique operational dynamics and interaction patterns within their respective networks. Specifically, our focus is on two watershed groups operating within tributaries of the Hudson River in Dutchess and Orange Counties, New York State, with names omitted for confidentiality.
A citizen-based watershed group is a grassroots organization that is primarily driven by community members, distinct from formal non-governmental organizations (NGOs). It operates independently of government agencies, with its activities—including its establishment, management, and evaluation—carried out by the citizens themselves [1]. Characterized by voluntary participation, community-driven initiatives, and a focus on local environmental issues, these groups often embody a more localized approach to environmental stewardship than larger, more structured NGOs. An agency-based watershed group, in contrast, is typically facilitated, managed, and evaluated by government entities such as municipalities or other public administration bodies [1]. These groups are structured around governmental mandates and policies, focusing on broader, regionally relevant environmental concerns and compliance with regulatory frameworks. Mixed groups often arise in situations where there is a convergence of community interests and governmental objectives [1]. These hybrid organizations blend the community-driven focus of citizen groups with the structured approach of agency-based groups, facilitating collaboration and resource sharing between citizens and governmental entities. Understanding the fundamental differences and potential synergies between these types of groups helps in assessing the dynamics, roles, and impact of these groups in watershed management, particularly in terms of their social networks.
A pivotal aspect that this research aims to unravel is the role of individual actors or nodes within these networks, particularly those serving as an articulation node between different groups or sub-networks. Identifying and understanding these key individuals could illuminate pathways for enhancing collaboration, resource sharing, and collective impact in watershed management initiatives.
To conduct a thorough social network analysis (SNA) and achieve the aforementioned objectives, our research utilized UCINET 6.527 software [2], a prominent tool in the field of network analysis, enabling us to systematically analyze and visualize the networks within and between the watershed groups under study. We utilized network-level analysis tools to assess the overall social network structure and employed node-level analysis tools to examine interactions among individual nodes within the network. Furthermore, to achieve these objectives more robustly, we conducted the general node-level analysis and ego network analysis separately.
While previous research has provided valuable insights into the functioning and impact of social networks within environmental management contexts, a comparative analysis between different types of watershed groups remains scant. Thus, this study endeavors to fill this gap by juxtaposing the social networks of citizen-based and agency-based watershed groups, providing a nuanced understanding of their operational dynamics and potential areas for cross-collaboration and learning.
Considering the above, this research is guided by the following key objectives: to explore and compare the social networks within citizen-based and agency-based watershed groups; to identify and analyze the role of key individual actors within these networks; and to discern the implications of the network structures and dynamics on the groups’ operational efficacy and collaborative potential. This study employs both network-level and node-level analyses to examine the social networks within watershed groups. Our network-level analysis focuses on metrics such as density, average degree, and hierarchy, while our node-level analysis examines clustering coefficients and influence. Additionally, we explore ego networks through an analysis of their density and the effective size of structural holes.
In summary, this study’s focus on the roles of individual nodes in watershed groups resonates with ref. [3], which emphasizes the importance of key actors in environmental governance. However, unlike ref. [4], our study reveals unique dynamics in the interplay between citizen-based and agency-based groups. The remainder of this study is structured as follows: Section 2 shows the study area, Section 3 provides a literature review, Section 4 details the methodology, Section 5 presents the findings, and Section 6 discusses the implications of the findings.

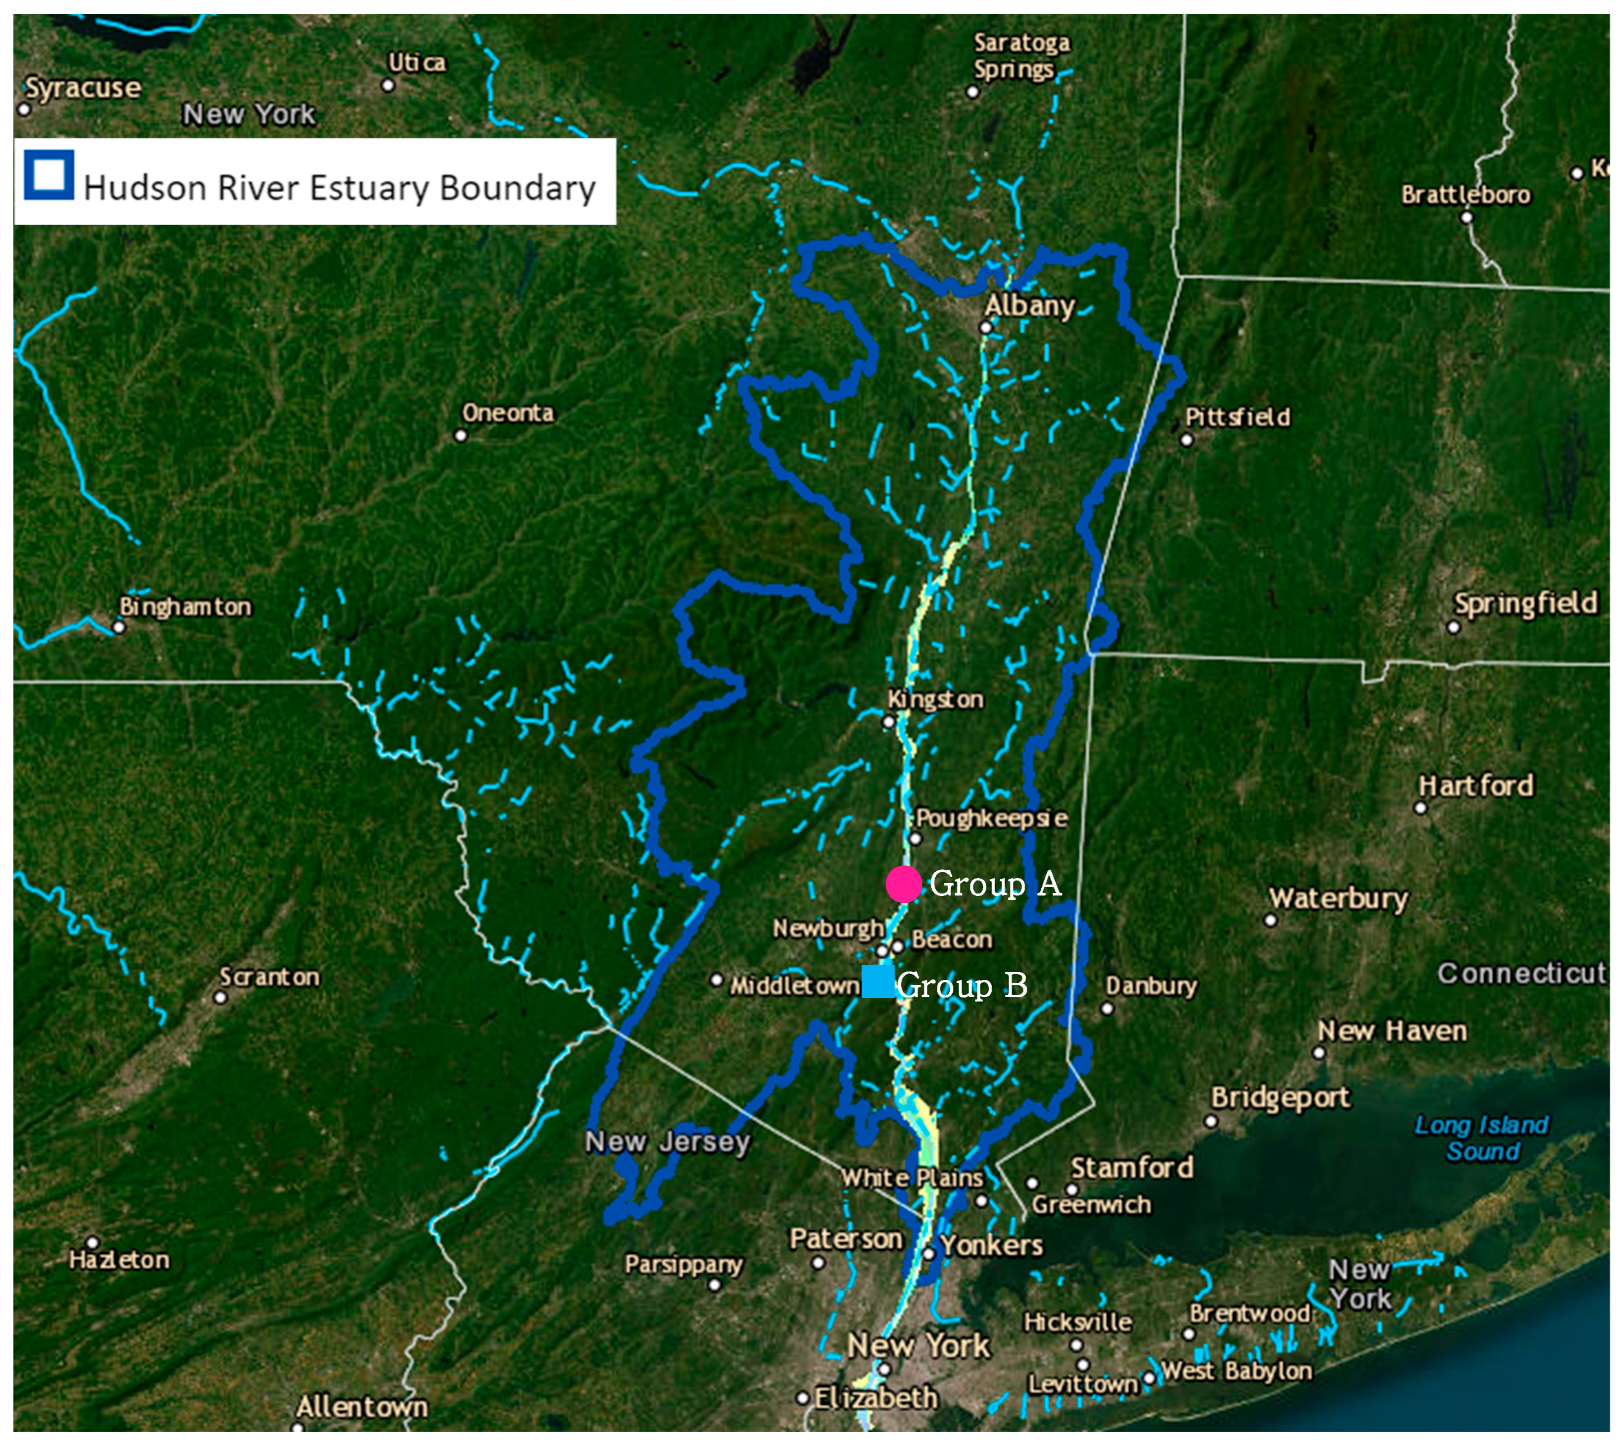
2. Study Area: The Hudson River Basin

The Hudson River is a defining natural feature of New York State. Originating in the Adirondack Mountains near Mount Marcy, New York State’s highest peak, the river embarks on a journey of approximately 315 miles across the eastern part of the state. Its main headstream is sourced from Lake Tear of the Clouds. Figure 1 shows the site map of the Hudson River estuary boundary.

2.1. Natural Condition

The Hudson River’s course is as varied as the landscapes it traverses. For the initial 108 miles, it winds southeast towards Corinth and then northeast to Hudson Falls. Beyond this, it adopts a more direct southern path for approximately 200 miles, culminating in Upper New York Bay in New York City. The Hudson River’s drainage basin is expansive, covering an area of 13,370 square miles, and its lower course is characterized by a drowned valley, extending seaward with a deep submarine canyon. The river’s tidal influence is significant, felt up to the federal dam at Troy, and it exhibits a mean tidal range of 4.7 feet. At its broadest, the river spans 3 miles at Haverstraw Bay, tapering to 0.75 miles at its mouth.
The Hudson River Watershed, encompassing regions from Albany in the north to Yonkers in the south, exhibits a diverse range of climatic conditions. Albany, the northernmost point, endures a continental climate with cold, snowy winters and warm, humid summers. Geographically, the Hudson River is crucial to the area’s landscape. It flows through diverse ecosystems, supporting a wide range of biodiversity. The river’s estuarine system, where saltwater and freshwater mix, provides a unique habitat for many species, including various fish like the striped bass and numerous bird species. This diversity highlights the ecological importance of the Hudson River [5].

2.2. Socio-Economic Aspects of Hudson River Watershed Management

Stewarding the Hudson River Watershed entails a critical balance between promoting economic growth and preserving the environment. The watershed is important for various economic sectors in the local economy, such as agriculture, industry, and tourism. Yet, these activities also present challenges to the ecological health of the river. To effectively tackle these issues, it is essential to employ strategies that safeguard the environment while also fostering sustainable economic development. This means implementing regulations and best practices that reduce environmental impacts while allowing economic activities to flourish. Such an approach is key to the long-term health of the watershed, benefiting both the environment and the communities that depend on it.
Community involvement is important in managing the Hudson River Watershed [6]. Involving these communities in decision-making processes is essential for the success of watershed management efforts. This includes engaging local stakeholders in conservation initiatives, pollution control measures, and sustainable resource management. By doing so, watershed management not only addresses environmental concerns but also supports the socio-economic well-being of the local population. It fosters a sense of stewardship among community members, encouraging them to actively participate in preserving the river for future generations. This community-centric approach not only enhances the effectiveness of environmental management strategies but also ensures that the benefits of a healthy watershed are equitably shared among all stakeholders.

3. Literature Review

3.1. Social Network Analysis for Natural Resource Management

A social network analysis (SNA) encompasses theoretically grounded methods designed to analyze various types and attributes of relations among individuals and groups. The networks formed by individuals and organizations consist of webs of relationships and interactions [7]. SNA applies the structure of these relationships to systematically represent networks, using nodes and ties as foundational elements. This model underpins a suite of mathematical tools that analyze the causes and consequences of diverse types of relations.
In recent decades, there has been a surge in interest in employing SNA for natural resource management [7,8,9,10,11,12,13]. Social networks among individuals or subgroups can positively influence outcomes [14] but can also obstruct collaboration, productivity, and innovative capacity [11,15]. For instance, excessively tight social networks may resist evolution or the acceptance of new ideas and technologies from outside the network. Therefore, comprehending the dynamics of social networks is pivotal for planning, management, and innovation.
SNA emphasizes evaluating core types of ties within and between groups, including ties of common goals [16], information or knowledge sharing [12,17,18], learning [19,20], trust [16,21,22,23], funding support [18], idea sharing [18], and more. SNA seeks to interpret the hidden structural properties underlying visible ties by identifying the structural properties of support networks, examining relationships between individuals and stakeholders, determining the positioning of different individuals or stakeholders within the network, and revealing how relationships are structured within the entire network [24].
Ultimately, SNA is instrumental in understanding the functionalities of social networks, such as the roles and positions of key actors and the flows of knowledge and information, which can potentially influence elements like resilience and adaptive capacity for environmental change [25]. SNA can also identify, select, and engage core individuals or stakeholders in participatory processes related to natural resource management [12,15].
Numerous studies have demonstrated that SNA can be utilized to comprehend various resource management issues or to provide supplementary information. Researchers have employed social networks to enhance aspects of social capital in natural resource management, such as governance processes [11,17,26,27,28], local leadership [29], adoption of new skills or knowledge [12,19,20,29,30], productivity and innovation of capacity [11], involvement of new stakeholders [17,31], recruitment and self-development [32], conflict resolution [8,33], trust between stakeholders [22], and collaborative decision making [12,34,35]. In the analysis of networks, researchers have sought to unveil the structure of social networks suitable for given environments [21,32,34,36,37,38] or to discern the roles or positions of actors and ties in the network [17,33,39,40,41]. Among them, a few studies have concentrated on the social networks of watershed groups as “organizations” [8,29,42].
In line with our focus on the articulation node in watershed management groups, Ptak [43] offers valuable insights into the role of intermediaries. Their study explores the pivotal role of intermediaries in fostering policy integration and system transformation. This reinforces the importance of such roles in facilitating effective communication and collaboration in complex environmental management scenarios, akin to the dynamics observed in our study. Our study, while acknowledging the role of intermediaries, particularly distinguishes itself from ref. [43] by focusing more on the role of articulation nodes.
Analyzing social networks unveils the relationship between network relations and the underlying structural patterns that emerge among actors. Therefore, SNA examines the attributes of individuals, relations among actors, how actors are positioned within a network, and how relations are structured into overall network patterns [44,45,46]. Consequently, SNA can be categorized into three levels: individual, subgroup, and overall network level [7,47]. Although analyses for all three levels are equally vital, most SNA studies for natural resource management have focused on stakeholder analysis [17,21,35,36], which necessitates network- and subgroup-level analyses. Nonetheless, individual-level analysis is also paramount in determining the relationship between the outcomes and roles of individuals and in determining if a subset of individuals can be represented as one node for a subgroup [13,30,39,48].

3.2. Watershed Management Groups

Some researchers [49] address watershed management from a global perspective, while others [29] approach it from national or regional viewpoints. This research specifically focuses on the watershed management of the Hudson River area in New York State, adopting a regional lens. Additionally, while various studies have explored the economic efficiency [50], assessment [51], or sustainable development [52,53] aspects of water resources management, this study centers on a social network analysis within and between watershed management groups. Particularly, it examines how the formation of social networks among individual members of organizations managing watersheds can facilitate the flow of information and resources, thereby enhancing the effectiveness of these networks. Lastly, while some research [50,51,53] has been conducted on agency-based watershed management groups, others [29] have focused on citizen-based groups, and yet others [1] have examined mixed-type watershed management groups. This study investigates both agency-based and citizen-based watershed management, analyzing the differences between these two types and proposing a strategy to improve the social networks within and across these groups, with a particular focus on the individual-level interactions and relationships within and between these different types of networks.
Building relationships through partnerships is a crucial aspect of watershed organizations, and numerous assertions relate to their effectiveness [29]. The concept of “conservation through cooperation” (Local Champions Speak Out: Pennsylvania’s Community) is pivotal. Different groups exert their influences in varied ways. While citizen-based groups often rely on traditional, adversarial means, such as lobbying and petitioning [54], the impact of mixed and agency-based groups tends to be more subtle and less visible, often through technical advice and changes in individual decision-making [1].
Researchers have found that agency-based groups adopt the strategies of the parent organization, as opposed to other types of groups, which may develop more internally based strategies [55]. The research by Graversgaard et al. [56] on agency-based watershed management in Denmark demonstrates that the integration of regional water councils as participatory groups significantly improved the effectiveness of river basin management plans, resulting in more efficient and ecologically favorable outcomes in watershed management. Thus, the type of watershed group can shape both processes and outcomes. However, there is a noticeable gap in the literature concerning comparative analyses of how different watershed groups utilize their social networks. Most studies have focused on the network and subgroup levels, often overlooking the individual level, which is crucial for understanding the roles and outcomes of specific actors within a network [13,30,39,47,57,58].

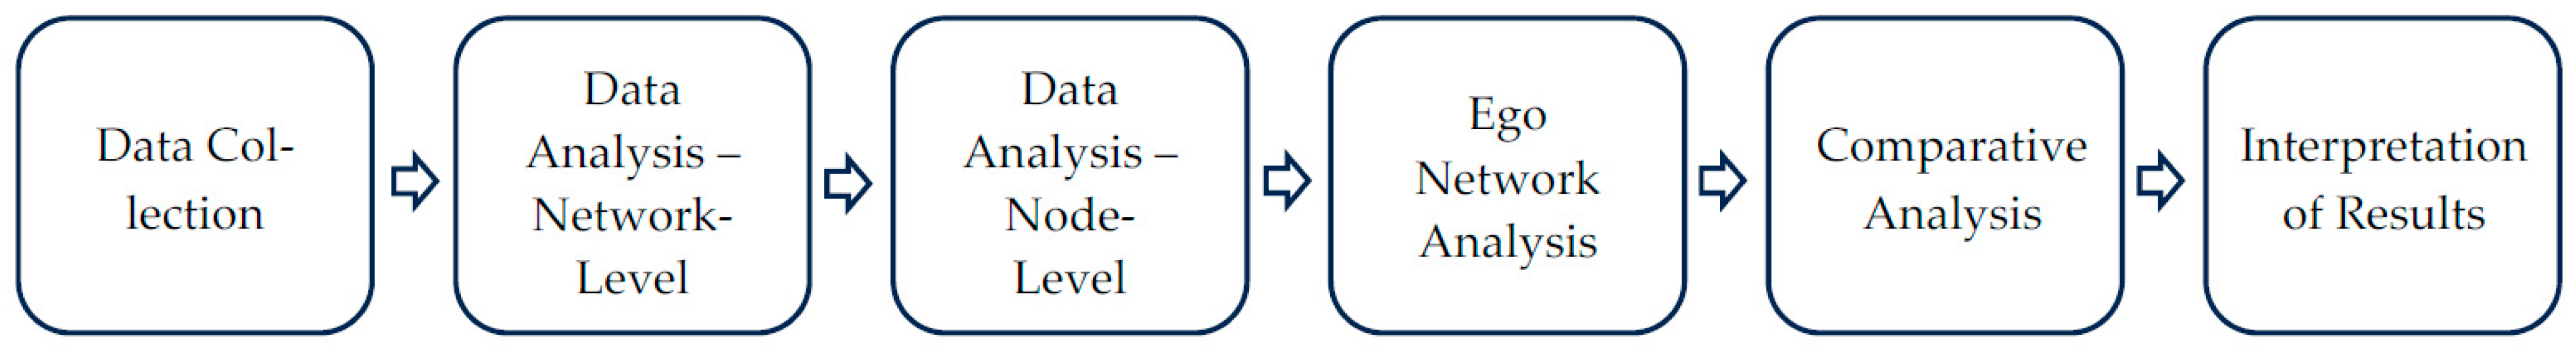
4. Research Methodology

4.1. Site Selection

This study is conducted with two community-based watershed groups, selected by the research team in collaboration with the Hudson River Estuary Program and the Hudson River Watershed Alliance. The selection criteria are based on the duration of the groups’ existence, availability of historical water quality data, evidence of the groups’ activity levels (with a preference for more active groups), location in the Hudson River Estuary drainage area, and the group’s willingness to participate in the study. The two groups are referred to as Groups A and B.
Group A, a relatively new watershed alliance with close ties to an institution of higher education, is selected as a case study in the lower basin. It is primarily comprised of private citizens. The group consists entirely of individuals who racially self-identify as White or Caucasian, contrasting with Dutchess County demographic statistics, which describe only 68.6% of the population as non-Hispanic White [59]. Relative to the overall population statistics for Dutchess County, the watershed members who responded to the survey were significantly more likely to be female (56% versus 50.1% for Dutchess County as a whole). The group members ranged in age from 23 to 76 years, with an average age of 47 years. As might be expected, the group is characterized by a high level of academic attainment, with 56% of the respondents indicating a graduate or professional degree (MS, PhD, etc.) and an additional 38% indicating that they had attained a four-year bachelor’s degree (for a total of 94% holding bachelor’s degrees or higher). Sixty percent of respondents indicated they were professionally tied to a university or other academic institution.
Group B, located in Orange County, is selected as the downstream site due to its longer history and its reflection of a municipal- and agency-based organization. The members of Group B are 52% male, and 95% of the survey respondents in this group self-identified as non-Hispanic White or Caucasian (one individual, or 5% of those who indicated their race or ethnicity, identified as American Indian or Alaskan Native). The average age of the Group B members who responded to the survey was 58 years, ranging from 42 to 78 years.
The educational attainment among the Group B respondents is high, though somewhat lower than for the members of Group A, with 50% indicating they have a bachelor’s or four-year degree and 36% indicating they have a graduate or professional degree. The IRS classifies Group B as a 501(c)(3) charitable organization with a written organizational strategic plan and a fundraising strategy. As an inter-municipal watershed organization, Group B comprises a mix of private citizens and public representatives, with a preponderance of the former.

4.2. Survey Methods

This study utilized data collected from the two watershed organizations described above. The survey instrument incorporated questions focusing on watershed group accomplishments, effectiveness, barriers to effectiveness, impacts on water quality, composition and formation, and watershed group characteristics (Table A1, Appendix A). Additionally, the survey explored watershed group network relationships and how they manifested in terms of ideas, information, financial resources, skills, labor, political power, and shared values. To craft a survey capable of assessing key issues within each watershed group—while reflecting the understanding and interests of the respective organizations, watershed groups, and basin-wide actors representing HREP—the Hudson Watershed Alliance and Cornell Cooperative Extension were engaged throughout all stages of draft development. A web-based survey tool was utilized due to its accessibility, user-friendly interface, and the widespread availability of email addresses for watershed group members. Emails were sent to the entire membership of both groups, encompassing all 46 members of Group A and all 96 members of Group B. An invitation email with a survey link was dispatched, followed by up to five reminders sent to non-respondents.

4.3. Social Network Measures

Generally, social networks encompass two major levels of analysis: network-level and node-level analysis. In this study, we commence with a network-level analysis and subsequently proceeded to an individual node-level analysis. The density, average degree, and hierarchy were analyzed for the network-level measurements. For the general node-level analysis, the clustering coefficient and influence were analyzed. To scrutinize the ego networks, the density of the ego networks and the effective size of structural holes are analyzed. Each of these terms is defined and operationalized as described below.

4.3.1. Network-Level Measurements

Network-level measurements are valuable for various reasons. Analyzing network-level measurements of the groups can unveil the internal dynamics of each group, such as the extent to which the members collaborate, share resources, or exchange information. This is vital for understanding the group’s overall effectiveness and identifying areas for improvement, especially when the networks are as complex as the several network types examined in this study.
The density of a network is calculated by determining the proportion of ties in the network relative to the total number of possible ties, specifically, m/n(n − 1), where m is the number of ties and n is the number of nodes. As a proportion, the value ranges between zero and one.
The average degree of a node is the number of ties connected to it. Its value can range from 0 to n − 1, where n is the number of nodes in the network. Therefore, the average degree also lies within the range [0, n − 1]. Specifically, it is calculated as m/n. Note that the density and average degree are computed using only the number of nodes for the denominator and the number of ties for the numerator. Therefore, if different networks have the same number of nodes, then density and average degree are proportional to the number of ties.
Hierarchy is the proportion of nonreciprocal dyads in the reachability matrix. Mathematically, it is expressed as 1 − |{Xij:Xij > 0 AND Xji > 0}|/|{Xij:Xij > 0 OR Xji > 0}|, where X is the reachability matrix. Typically, this measure is used to determine whether the structure of a network is primarily composed of vertical or horizontal relationships.

4.3.2. Node-Level Measures

While network-level analysis reveals the structural aspects of the network, node-level analysis illuminates the position and role of individual nodes within the given structure. The primary advantage of node-level analysis is that it assigns a score to each node, enabling researchers to perform statistical analyses with an expanded number of nodal samples. For instance, researchers can explore associations between network measurements and other nodal properties [60] and conduct regression analyses with observations serving as network nodes [61].
The clustering coefficient of a node represents the density of its open neighborhood, essentially illustrating how effectively the linked adjacent nodes interact. Its value ranges from 0 to 1. The clustering coefficient of a completely isolated node is 0, while a node with fully connected neighbors has a clustering coefficient of 1.
Influence measures the degree to which one node impacts others. It is calculated using the successive powers of matrices to enumerate the possible paths of a given length between every dyad. Since a longer path between a pair implies a weaker influence of the source node on the target node, weights are assigned to each path according to its length. This study utilized the Katz-influence method. Its influence matrix is (IbA)−1I, where I is the identity matrix, b is an attenuation factor, and A is the adjacency matrix. After dividing the matrix by the overall sum, the resulting value should be in the range of [0, 1].
For the ego-network, we measured the density and effective size. An ego network consists of an ego node, its neighboring nodes (referred to as alters), and the existing ties among them, as in the original network. While a general node-level analysis treats the nodes as members of the entire network set, an ego network analysis deals with a set of subnetworks composed of local nodes and ties surrounding ego nodes. This study examined the basic measurements of ego networks: density and effective size. The density of an ego network is the density measurement of the altered network within a given ego network, with outcomes ranging from 0 to 1. The effective size of an ego network, a measure of structural holes, captures non-redundancy (Figure 2). It is computed as the ego network size minus the redundancy, or the number of alters minus the average number of alters, excluding ties to the ego. Thus, the value ranges from 1 to k, where k is the number of alters.
This study defines ego networks with only outgoing ties to differentiate the values of ego density from those of the clustering coefficient. If we considered both incoming and outgoing ties to define ego networks, the ego density values would be identical to the ego clustering coefficients. An independent-samples t-test was conducted for each network type to compare the clustering coefficient values, influence, ego density, and ego effective size in Groups A and B.

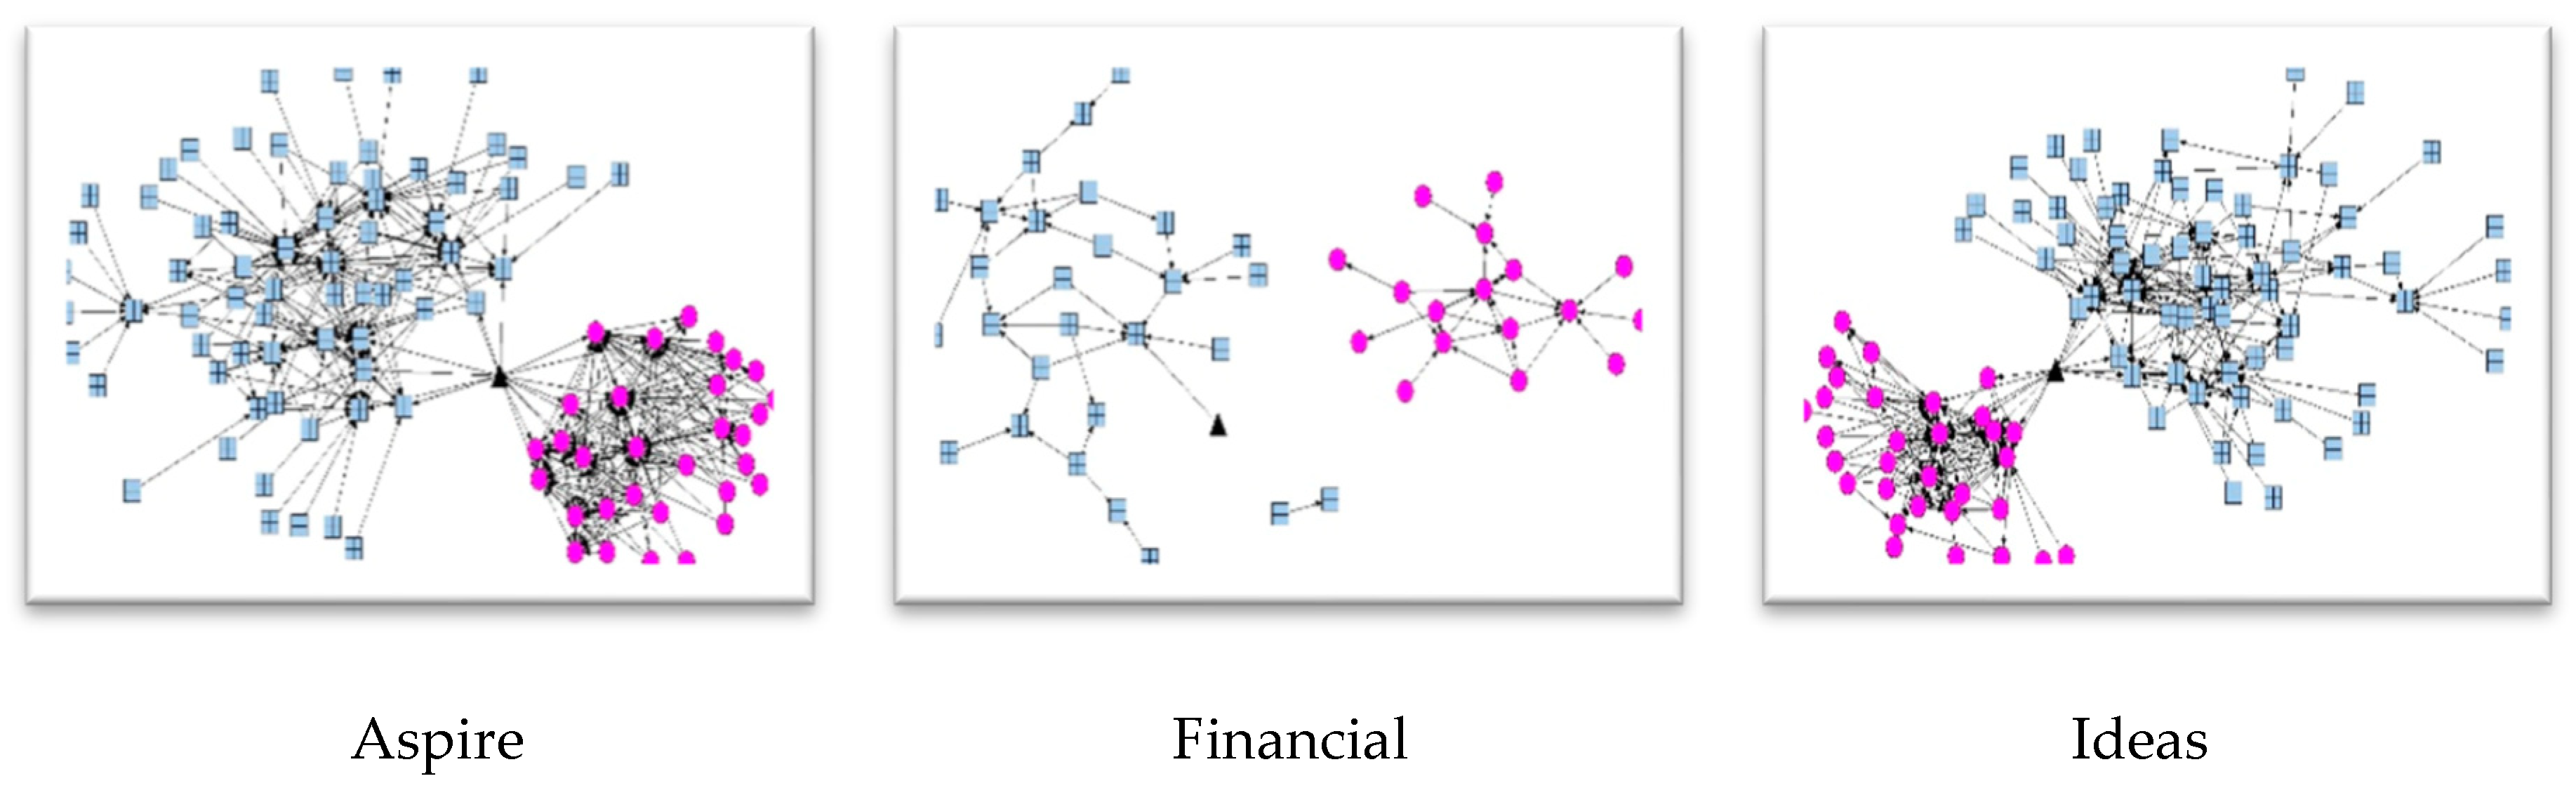
4.4. Social Network Structure

Using survey data, 9 networks, each with 134 nodes, were defined: 43 nodes from Group A and 91 nodes from Group B. The survey measured nine types of relationships, and the following network models were built: (1) aspire, (2) financial, (3) ideas, (4) information, (5) interact, (6) labor, (7) political, (8) skills, and (9) values (Table 1). Table 1 presents the definitions of these types of ties in the network.
We explored the relationships between various characteristics and practices within the social networks of each watershed organization, using t-tests to conduct the group comparisons.
To provide a comprehensive visual overview of the methodology, a flowchart summarizing the key steps is presented in Figure 3.

5. Results

Group A consists of 43 members, while Group B has 91 members, totaling 131 individuals, with three of them affiliated with both groups. The response rate was 86% for Group A (n = 37) and 60% for Group B (n = 55). A total of 12 individuals are isolated in every network model (8 from Group A and 4 from Group B), and 119 people are listed in the network survey questionnaire, with 2708 ties among them. These ties are distributed among the nine network models in Table 1.
Figure 4 provides a visualization of the nine network models (see Figure A1, Figure A2, Figure A3, Figure A4, Figure A5, Figure A6, Figure A7, Figure A8 and Figure A9 in Appendix A for larger images). The red circles represent members of Group A, the blue squares represent members of Group B, and the black triangle represents a node affiliated with both groups. While isolated nodes are not visible in the figures, they are included in the subsequent analysis.
The two groups are financially disconnected. In the interact and values network models, the two groups are connected by only two nodes, and even in the other network models, they are connected by only one articulation node. This suggests that the two watershed organizations are almost entirely separate in terms of their social relations, particularly in their financial relationships, where the two groups are completely independent and separated.

5.1. Network-Level Analysis: Density, Average Degree, and Hierarchy

Table 2 presents the network-level analysis for the nine network models in both groups. The interact network is the densest network for both Group A and Group B, which is not surprising, since interaction is a general term for relationships and might encompass parts of other relationships in this study. Additionally, the interaction network has the highest average degree for both organizations, because the density and average degree are proportional to the number of ties if the number of nodes is held constant, as explained in the previous section. The next-densest networks are aspire for Group A and information for Group B. It appears that citizen-based group members aspire to work with other members but may not have many opportunities because the density of co-work relations networks, such as the labor, financial, ideas, information, and skills networks, are lower than the aspire network. Conversely, members of Group B use the social network more for collecting information than for other co-working relationships.
The number of ties in the labor network is less than the number of nodes in Group B, resulting in an average degree of less than 1. This phenomenon is also observed in the financial and political networks of both groups, which also exhibit the lowest density. These results impact the hierarchies of the networks. In a connected network, as the number of ties approaches the number of nodes, the number of nodes with nonreciprocal reachability relationships increases, leading to higher hierarchies.
It is noteworthy that the hierarchy values of the financial network in Group A and the financial and labor networks in Group B are all 1.000, indicating that the structure of these networks is completely hierarchical. This shows that there are no pairs of nodes that are mutually reachable to each other in these networks. This type of network structure is typically observed in employment relationships, which are characterized by a vertical hierarchy where employers hire employees, but employees do not typically hire their employers. Thus, reciprocity tends to be low, and hierarchy tends to be high in such networks. Therefore, it is logical that the flows of money or labor resources are directed one way and not the other in both groups.
Comparing the hierarchical structures of the two organizations, a comparative advantage is evident. For every type of network, Group B is more hierarchical than Group A. The labor network of Group B has a hierarchy value of 1, but the same labor network of Group A has a hierarchy value of 0.807, which is 19.3% less. On average, the hierarchy value of Group B is 16.3% higher than that of Group A. Based on these results, we can conclude that Group B is more hierarchical than Group A, which is not unexpected given that watershed Group B is more formally structured compared to watershed Group A.
In general, the density values in Group A are higher than those in Group B. Typically, larger social networks tend to be sparser than smaller social networks because the size of personal relations is not linearly proportional to the size of the network. However, the higher density in Group A compared to Group B is not solely due to the size of the social network. This is because, excluding the labor, political, and skills networks, the average degree in Group A is generally higher than that in Group B. The cohesion within a single group can be assessed using the clustering coefficient, which we will revisit in the node-level analysis part.

5.2. Node-Level Analysis: Clustering Coefficient, Influence, Ego-Networks

5.2.1. Clustering Coefficient

For the clustering coefficient values, the maximum is found in the interact network (0.539: Group A, 0.233: Group B), and the minimum is found in the financial network (0.049: Group A, 0.000: Group B) (Table 3). Note that the clustering coefficient of the financial network in Group B is 0; this implies that there is no tie between any pair of neighbors for every node in the network. In other words, there is only one flow between any pair of nodes in the financial network of Group B.
The clustering coefficient values differ significantly between Group A and B for all network types except in the case of political networks. These results suggest that the clusters in Group A networks are generally denser than in Group B networks. The smallest difference is 0.115, which is found between the skills networks, and the largest difference is 0.326, which is found between the aspire networks. We can conclude that Group A generally exhibits higher cohesion than Group B.

5.2.2. Influence

Group A has the highest influence value of 0.015 in the labor network, while the lowest value is 0.009 in the information network (Table 4). Although the highest influence value within Group A is found in the labor network, the metric is still not large, indicating that the source nodes of labor resources hold more influence compared to the sources in the other networks. The influence values within the networks of Group B are even lower. The highest influence value within Group B is 0.009 in the political network, and the lowest is 0.006 in the aspire network. This suggests that the source nodes of political power in Group B hold more influence than those in the other networks.
The influence values differ significantly between Group A and B for the aspire, ideas, labor, and values networks. For these networks, the influence values for Group A are significantly higher than those for Group B. This suggests that the members within Group A have a higher overall ability to influence the other nodes compared to the nodes in Group B concerning collaboration, idea and value sharing, and labor support. In short, members holding central positions in the citizen-based organization are generally more significant or influential than those in the agency-based organization.

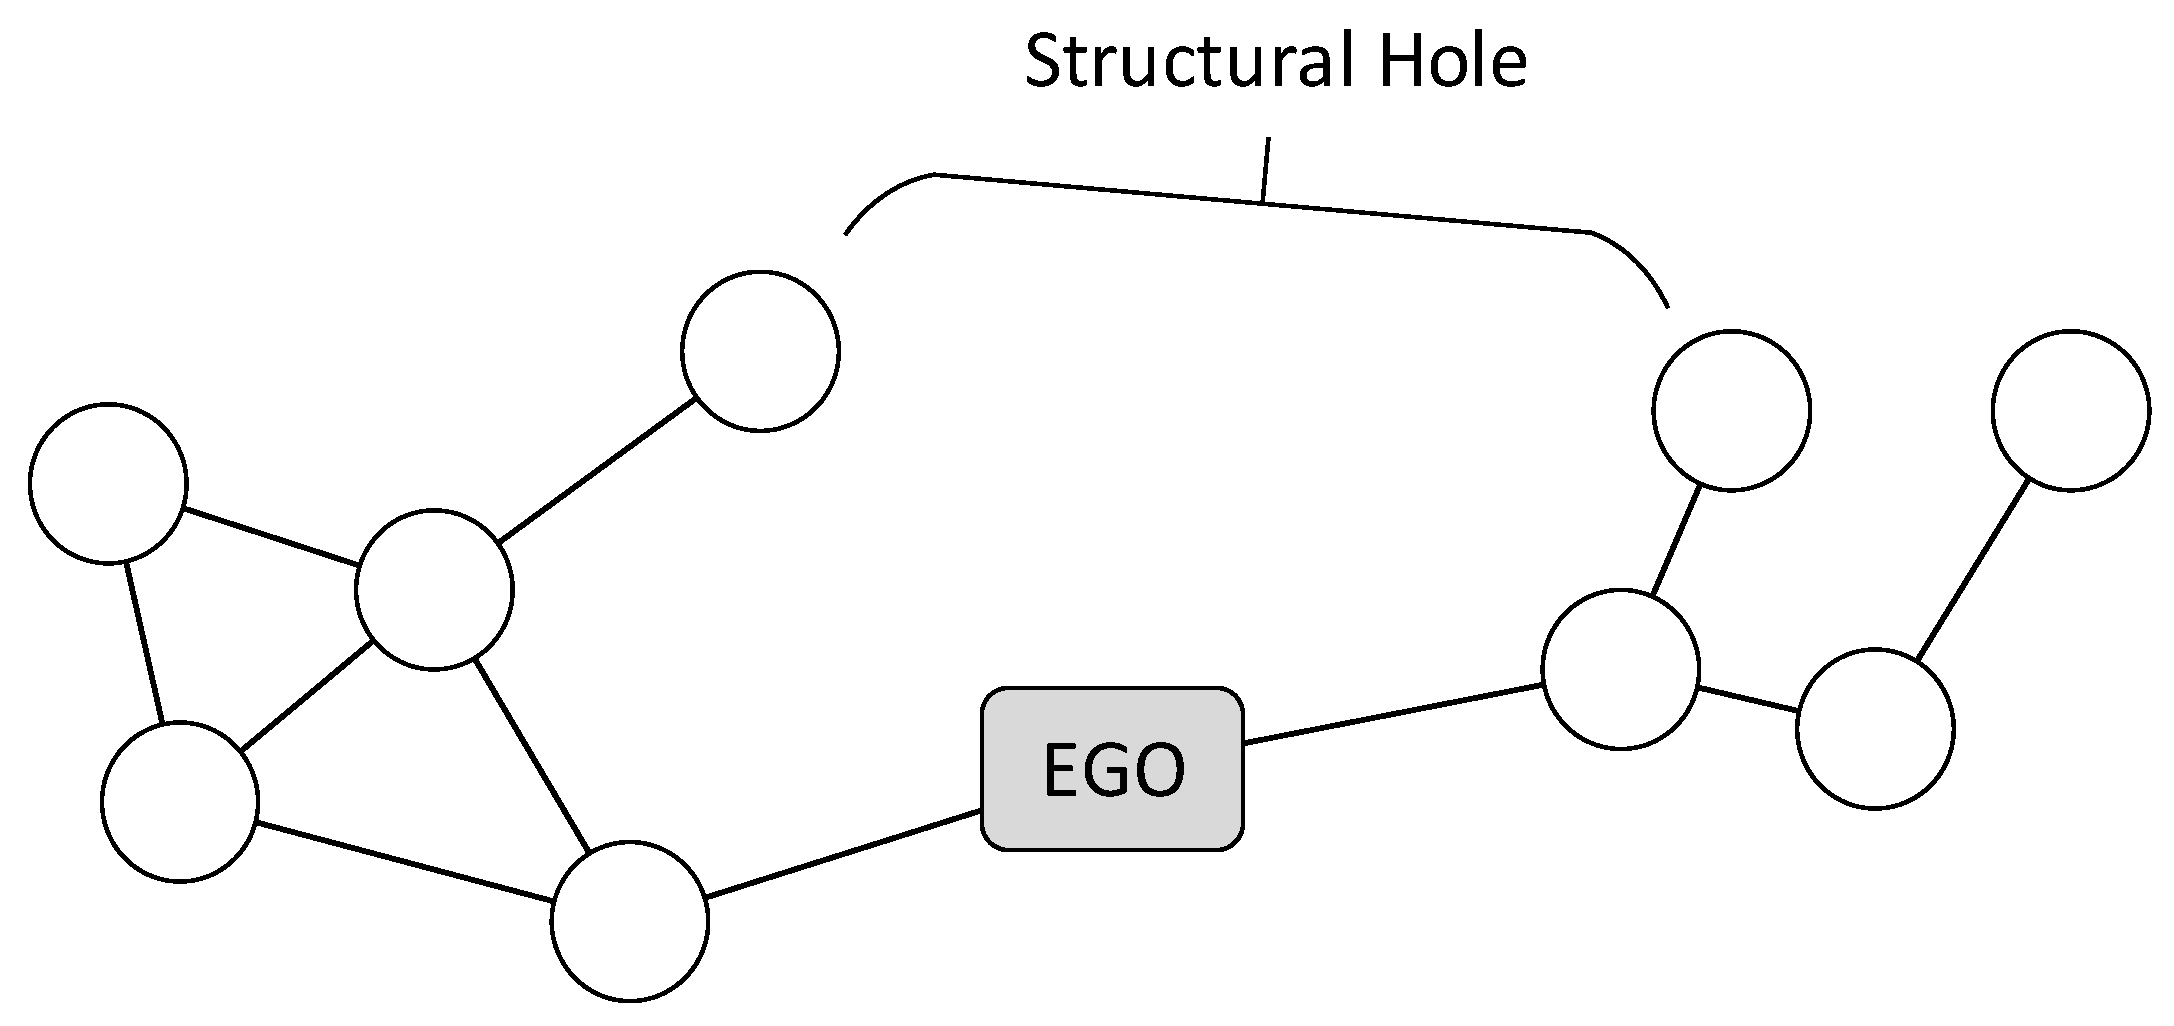
5.2.3. Ego Network: Density and Effective Size

The network with the highest ego-density value in Group A is the values network, while in Group B, the interact network has the highest ego-density value (Table 5). The structural difference in these networks that leads to this contrast lies in their density values around the egos. For example, networks with more leaf nodes tend to have higher ego-density values compared to networks with fewer leaf nodes. This is because in ego networks (the subnetworks centered around a specific node), each leaf node is connected to the ego node, resulting in a denser ego network.
The value of ego density in the financial network of Group B is zero, for the same reason as in the clustering coefficient case. This is because no direct financial relationship exists among alters in any ego network. An ego-density of 0 signifies that the ego network centered around a particular node is entirely isolated or has no connections with other nodes. In other words, there are no relationships formed between that node and any other node, or no ego network has been constructed around that node. This indicates that the node is relatively isolated or lacks connections within the network. When ego-density is 0, it suggests that the node holds minimal importance within the network.
For all network types except the political and skills networks, significant differences exist in the ego density values between Groups A and B. Specifically, all the networks of Group A, except the political and skills networks, are denser than Group B in terms of ego networks. This signifies that the nodes within Group A, on average, possess more connections and form tighter social network relationships. In other words, the members of Group A tend to share more information and collaborate more closely with each other, resulting in a higher degree of interconnectivity within the network. This implies that Group A exhibits greater cohesion and cooperation levels within itself compared to Group B.
The ego-effective sizes in the Group A networks varied from 0.440 (financial network) to 1.955 (interact network) (Table 6). The effective ego sizes in the Group B networks vary from 0.385 (financial network) to 3.191 (interact network). The redundancies in the financial networks are expected to be low, as we can infer from the ego-density values, but their effective sizes are also small due to their small ego networks. On the other hand, because the ego networks in the interact networks are sufficiently large, their effective sizes are also large. However, the interact networks exhibit higher redundancies compared to the financial networks.
Significant differences in the ego-effective sizes between Groups A and B are observed only in the interact and labor networks. Moreover, in the interact network, the effective size of Group B is larger, whereas in the labor network, Group A exhibits a greater effective size. Consequently, overall, it can be said that there is no statistically significant difference in effective size between Group A and Group B. This implies that there is no significant distinction in terms of the size or importance of ego networks between these two groups. In other words, there is not a substantial difference in the network structures or centrality aspects between these groups.
In the two groups we analyzed, only one articulation node was identified. The absence of this node would lead to a disconnection between the two groups. This sole node was shown in Figure 2 to be the only path for information and resource flow between the groups, which is further corroborated in the following table.
Table 7 illustrates the rank of this articulation node in terms of its structural hole and centrality values. In all the networks except the financial network, this articulation node ranks at or near the top in terms of structural hole (Ego-effective size), degree centrality, closeness centrality, and betweenness centrality. While this node occupies a central position as a key intermediary in the flow of information and resources, it also poses a bottleneck risk. If this node is removed, the overall network’s effectiveness and efficiency could be diminished until another node assumes its functions. Therefore, the stability and reliability of this node significantly impact the overall resilience and vulnerability of the network. These findings suggest the need to strengthen the network structure of watershed management groups in the Hudson River area and to fortify the roles of other nodes to reduce dependence on this articulation node. Specifically, strategies to diversify information flow pathways and distribute the load across key nodes, thereby enhancing the network’s resilience, may be required.
We propose a hypothetical scenario that introduces arbitrary relationships into the network to disperse the functions of the articulation node. However, to avoid redundancy in analyzing every network type, we focus on the aspire network, which exhibits the most significant differences in clustering coefficients and influence values between the two groups, along with the highest number of ties.
In this scenario, we selected the top five nodes with the highest influence from each group and created a fully connected subnetwork among them. The subsequent changes in the structural holes and centrality values are described below.
Table 8 shows how the top five structural hole and centrality values shift between the original and hypothetical networks. The results indicate that other nodes can become connectors between the two groups, effectively replacing the role of the articulation node.

6. Conclusions

This study embarked on an innovative exploration of social networks within two distinct watershed groups: citizen-based and agency-based. Our findings reveal the intricate dynamics of these groups’ operations and interactions within their networks. One of the most significant findings was the identification of a key node or individual serving as the articulation node connecting the two groups. The articulation node, while holding a central position as a key connector in the flow of information and resources, also poses as a source of a bottleneck. Its absence impacts the overall effectiveness and efficiency of the network until an alternative node can replace its function, highlighting the need for replaceable nodes. This study demonstrates through a hypothetical scenario that introducing connector nodes between the citizen-based group and the agency-based group can improve the network’s overall effectiveness, resilience, and vulnerability.
Interestingly, our analysis also revealed that the citizen-based organization exhibits denser and more cohesive networks compared to its agency-based counterparts, and the agency-based organization shows more hierarchical networks. This suggests that the citizen-based organization may have more robust relationships, providing them with greater resilience and adaptability. The participants from the citizen-based group emphasized the importance of community engagement and grassroots initiatives [62], but the members of the agency-based group highlighted the role of structured processes and resource allocation, echoing the focus on clear policy guidelines and inter-agency cooperation [63]. However, it is evident that the networks of the two groups in this study are largely independent, indicating untapped potential for increased collaboration and integration. This isolation restricts the flow of critical information and resources, potentially hindering comprehensive environmental efforts. Imperial [64] highlights the value of collaborative governance in watershed management, suggesting that bridging these gaps and fostering cross-group collaborations can leverage the unique strengths and resources of each group for more effective management. In addition, as emphasized by ref. [65], collaboration among key actors within a group is also essential for effective watershed management. This dual focus on collaboration not only fortifies internal group dynamics but also bridges the gap between different groups, thereby enhancing overall efficacy and resource management in watershed initiatives.
We discovered that effective communication among a few well-connected individuals (e.g., those with high influence values) within each group can enhance the effectiveness of these networks. By understanding the nuances of social networks in these groups, policymakers and practitioners can develop more targeted and collaborative approaches to conservation and management. For example, they could consider the following strategies: (1) fostering targeted communication initiatives that leverage the influential roles of key individuals in social networks; (2) developing collaborative frameworks that bridge citizen-based and agency-based groups, utilizing their unique strengths; (3) implementing training programs to enhance the skills of individuals in managing and participating in effective social networks. These approaches, informed by an understanding of social network dynamics, can improve conservation and management efforts in watershed groups.
While this study provides valuable insights, it is essential to acknowledge its limitations. The findings are based on an examination of only two organizations and may not be readily applicable to other watershed groups in other areas. Therefore, these results should be interpreted as a detailed case study rather than a comprehensive overview of all such organizations. Additionally, while the response rates were high, particularly for Group A, the sample size of 43 members in Group A and 91 in Group B may not fully represent the diversity and range of perspectives within each type of watershed group. This limitation is further compounded by the study’s focus on only two organizations, indicating a need for caution in generalizing the findings to broader contexts.
Future research should expand on this initial inquiry by incorporating a broader range of watershed groups, encompassing different sizes, geographical locations, and organizational structures, to validate these findings. Additionally, further studies could delve into the roles of individual nodes within different types of networks and how these roles might evolve over time, particularly in response to environmental or policy changes. Furthermore, future research would benefit from exploring how many nodes should fulfill the role of the connectors and which specific nodes from both groups should be connected to these connector nodes to maximize effectiveness and efficiency.
Our study illustrates the intricate dynamics of social networks within watershed groups and underscores the significance of individual actors and relationship-building within these ecosystems. As the first study to compare social networks among different types of watershed groups, this research lays the foundation for future studies aimed at optimizing the effectiveness of community-based watershed management.

Author Contributions

Conceptualization, S.B.A. and R.S.; methodology, S.-w.C.; software, S.-w.C.; writing—original draft preparation, S.-w.C.; writing—review and editing, S.B.A. and R.S. All authors have read and agreed to the published version of the manuscript.

Funding

This work was supported by the Gachon University research fund of 2023 (GCU-202304960001).

Institutional Review Board Statement

This research was conducted under Institutional Review Board Protocol ID#: 1008001625.

Informed Consent Statement

Informed consent was obtained from all subjects involved in the study.

Data Availability Statement

Data are contained within the article.

Conflicts of Interest

The authors declare no conflict of interest.

Appendix A

Table A1. Survey question list.
Hudson Watershed Groups Survey
1. Overall, how would you rate the water quality in your watershed?
2. How much of an impact do you believe each of the following is having on water quality in your watershed?
3. Which three items from the above list are most threatening to your water quality?
4. Where do you get your information from regarding the issues in the above list?
5. To what extent do you agree or disagree that the watershed organization that you are involved with has accomplished the following?
6. What do you think would increase your group’s effectiveness in the coming year?
7. Below is a list of activities a watershed group might pursue. In which areas do you feel the group has been most effective?
8. What barriers does your watershed group face that prevent it from being more effective?
9. If lack of participation is an issue for your group, why do you feel that there is not greater involvement from members or volunteers?
10. For each of the groups in the list below, please indicate those with whom you interact and the nature of your relationship that apply. Please leave your own organization blank.
11. For each of the groups in the list below, please indicate those with whom you interact and the nature of your relationship that apply. (Continued from previous)
12. From the list below, who would you like to work with or collaborate with in the future? Please check all that
apply.
13. Do you participate with the Group A in some capacity? If so, answer ‘yes’. If no, please select ‘no’.
14. For each of the individuals in the following list, please indicate if you have interacted with them in some capacity of your relationship. Please check all that apply. Please leave yourself blank.
15. For each of the individuals in the following list, please indicate if you have interacted with them in some capacity of your relationship. Please check all that apply. (Continued from previous)
16. What activities would you like the Group A to engage in during the coming year? Please select all that apply.
17. What environmental issue(s) influenced your group or organization to originally form? (Please check all that apply)
18. How important were the following reasons for why your watershed group formed?
19. How many people typically volunteer to help for a project event?
20. How many people typically attend scheduled general meetings?
21. How would you best describe the composition of your watershed group or organization?
22. With whom would you like to work over the coming year?
23. What best describes your role within the Group A?
24. About how many members does your group or organization have in the following categories?
25. What was the maximum number of paid full-time staff in your organization in 2009? (More than 37 h per week)
26. What was the maximum number of paid part-time staff in your organization in 2009? (Less than 37 h per week)
27. For each question below indicate the status of your organization as of 2009.
28. What is the annual budget of your watershed group or organization (US$)?
29. In terms of a written watershed plan, please indicate the stage your group is currently in.
30. Do you participate with the Group B in some capacity? If so, answer ‘yes’. If no, please select ‘no’.
31. For each of the individuals in the following list, please indicate if you have interacted with them in some capacity of your relationship. Please check all that apply. Please yourself blank.
32. For each of the individuals in the following list, please indicate if you have interacted with them in some capacity of your relationship. Please check all that apply. (Continued from previous)
33. For each of the individuals in the following list, please indicate if you have interacted with them in some capacity of your relationship. Please check all that apply. (Continued from previous)
34. For each of the individuals in the following list, please indicate if you have interacted with them in some capacity of your relationship. Please check all that apply. (Continued from previous)
35. What activities would you like the Group B to engage in during the coming year? Please select all that apply.
36. In what year was your group or organization formed?
37. What environmental issue(s) influenced your group or organization to originally form? (Please check all that apply)
38. How important were the following reasons for why your watershed groups formed?
39. How many people typically volunteer to help for a project event?
40. How many people typically attend scheduled general meetings?
41. About how many members does your group or organization have in the following categories?
42. With whom would you like to work over the coming year?
43. What is your role within the Group B?
44. What was the maximum number of paid full-time staff in your organization in 2009? (More than 37 h per week)
45. What was the maximum number of paid part-time staff in your organization in 2009? (Less than 37 h per week)
46. For each question below indicate the status of your organization as of 2009.
47. How would you best describe the composition of your watershed group or organization?
48. What is the annual budget of your watershed group or organization (US$)?
49. In terms of a written watershed plan, please indicate the stage your group is currently in.
50. Which best describes your involvement in water conservation and stewardship?
51. In what capacity, if any, are you involved in stream conservation?
52. Do you feel that you can make a difference in your area of work, related to conservation and/or water stewardship?
53. How much do you personally initiate network building or collaboration?
54. How strong are your network building or collaboration skills?
55. How would you characterize the organization that you work for? Please select all that apply.
56. What is your gender?
57. In what year were you born?
58. What is the highest educational level you have achieved?
59. How would you define your race or ethnicity? Please select all categories that apply to you.
60. What best characterizes your household income US$?
Notes: This survey was conducted in 2010. A full version of the survey with its response categories is available upon request.
Figure A1. Aspire network.
Water 16 00111 g0a1
Figure A2. Financial network.
Water 16 00111 g0a2
Figure A3. Ideas network.
Water 16 00111 g0a3
Figure A4. Information network.
Water 16 00111 g0a4
Figure A5. Interact network.
Water 16 00111 g0a5
Figure A6. Labor network.
Water 16 00111 g0a6
Figure A7. Political network.
Water 16 00111 g0a7
Figure A8. Skills network.
Water 16 00111 g0a8
Figure A9. Values network.
Water 16 00111 g0a9

References

  1. Moore, E.; Koontz, T. Research Note A Typology of Collaborative Watershed Groups: Citizen-Based, Agency-Based, and Mixed Partnerships. Soc. Nat. Resour. 2003, 16, 451–460. [Google Scholar] [CrossRef]
  2. Borgatti, S.P.; Everett, M.G.; Freeman, L.C. Ucinet for Windows: Software for Social Network Analysis. Harv. MA Anal. Technol. 2002, 6, 12–15. [Google Scholar]
  3. Manny, L. Socio-technical Challenges towards Data-driven and Integrated Urban Water Management: A Socio-technical Network Approach. Sustain. Cities Soc. 2023, 90, 104360. [Google Scholar] [CrossRef]
  4. Ulibarri, N.; Imperial, M.T.; Siddiki, S.; Henderson, H. Drivers and Dynamics of Collaborative Governance in Environmental Management. Environ. Manag. 2023, 71, 495–504. [Google Scholar] [CrossRef] [PubMed]
  5. The Hudson River Estuary Program; NY-NJ Harbor & Estuary Program; NEIWPCC. The State of the Hudson 2020; NYSDEC: New York, NY, USA, 2020.
  6. Vail, E. Hudson River Watershed Alliance Watershed Needs Assessment Report; Hudson River Watershed Alliance: Kingston, NY, USA, 2022. [Google Scholar]
  7. Borgatti, S.P.; Mehra, A.; Brass, D.J.; Labianca, G. Network Analysis in the Social Sciences. Science 2009, 323, 892–895. [Google Scholar] [CrossRef] [PubMed]
  8. McGinnis, M.V.; Woolley, J.; Gamman, J. FORUM: Bioregional Conflict Resolution: Rebuilding Community in Watershed Planning and Organizing. Environ. Manag. 1999, 24, 1–12. [Google Scholar] [CrossRef] [PubMed]
  9. Schneider, M.; Scholz, J.; Lubell, M.; Mindruta, D.; Edwardsen, M. Building Consensual Institutions: Networks and the National Estuary Program. Am. J. Polit. Sci. 2003, 47, 143–158. [Google Scholar] [CrossRef]
  10. Anderies, J.M.; Janssen, M.A.; Ostrom, E. A Framework to Analyze the Robustness of Social–ecological Systems from an Institutional Perspective. Ecol. Soc. 2004, 9, 18. [Google Scholar] [CrossRef]
  11. Bodin, Ö.; Crona, B.I. The Role of Social Networks in Natural Resource Governance: What Relational Patterns Make a Difference? Glob. Environ. Chang. 2009, 19, 366–374. [Google Scholar] [CrossRef]
  12. Prell, C.; Hubacek, K.; Reed, M. Stakeholder Analysis and Social Network Analysis in Natural Resource Management. Soc. Nat. Resour. 2009, 22, 501–518. [Google Scholar] [CrossRef]
  13. Keskitalo, E.C.H.; Baird, J.; Laszlo Ambjörnsson, E.; Plummer, R. Social Network Analysis of Multi-level Linkages: A Swedish Case Study on Northern Forest-Based Sectors. Ambio 2014, 43, 745–758. [Google Scholar] [CrossRef] [PubMed]
  14. Nabiafjadi, S.; Sharifzadeh, M.; Ahmadvand, M. Social Network Analysis for Identifying Actors Engaged in Water Governance: An Endorheic Basin Case in the Middle East. J. Environ. Manag. 2021, 288, 112376. [Google Scholar] [CrossRef] [PubMed]
  15. Bodin, O.; Prell, C. Social Networks and Natural Resource Management: Uncovering the Social Fabric of Environmental Governance; Cambridge University Press: Cambridge, UK, 2011. [Google Scholar]
  16. Borg, R.; Toikka, A.; Primmer, E. Social Capital and Governance: A Social Network Analysis of Forest Biodiversity Collaboration in Central Finland. For. Policy Econ. 2015, 50, 90–97. [Google Scholar] [CrossRef]
  17. Cárcamo, P.F.; Garay-Flühmann, R.; Gaymer, C.F. Collaboration and Knowledge Networks in Coastal Resources Management: How Critical Stakeholders Interact for Multiple-use Marine Protected Area Implementation. Ocean Coast. Manag. 2014, 91, 5–16. [Google Scholar] [CrossRef]
  18. Lauber, T.B.; Decker, D.J.; Knuth, B.A. Social Networks and Community-Based Natural Resource Management. Environ. Manag. 2008, 42, 677–687. [Google Scholar] [CrossRef] [PubMed]
  19. Wossen, T.; Berger, T.; Mequaninte, T.; Alamirew, B. Social Network Effects on the Adoption of Sustainable Natural Resource Management Practices in Ethiopia. Int. J. Sustain. Dev. World Ecol. 2013, 20, 477–483. [Google Scholar] [CrossRef]
  20. Crona, B.I.; Parker, J.N. Learning in Support of Governance: Theories, Methods, and a Framework to Assess How Bridging Organizations Contribute to Adaptive Resource Governance. Ecol. Soc. 2012, 17, 32. [Google Scholar] [CrossRef]
  21. Prell, C.; Reed, M.; Racin, L.; Hubacek, K. Competing Structure, Competing Views: The Role of Formal and Informal Social Structures in Shaping Stakeholder Perceptions. Ecol. Soc. 2010, 15, 34. [Google Scholar] [CrossRef]
  22. Smith, C.L.; Gilden, J. Assets to Move Watershed Councils from Assessment to Action. J. Am. Water Resour. Assoc. 2002, 38, 653–662. [Google Scholar] [CrossRef]
  23. Wagner, C.L.; Fernandez-Gimenez, M.E. Effects of Community-Based Collaborative Group Characteristics on Social Capital. Environ. Manag. 2009, 44, 632–645. [Google Scholar] [CrossRef]
  24. Salajegheh, S.; Jafari, H.R.; Pourebrahim, S. Modeling the Impact of Social Network Measures on Institutional Adaptive Capacity needed for Sustainable Governance of Water Resources. Nat. Resour. Model. 2020, 33, e12277. [Google Scholar] [CrossRef]
  25. Bodin, Ö.; Crona, B.; Ernstson, H. Social Networks in Natural Resource Management: What Is There to Learn from a Structural Perspective? Ecol. Soc. 2006, 11, r2. [Google Scholar] [CrossRef]
  26. Alexander, S.M.; Armitage, D. A Social Relational Network Perspective for MPA Science. Conserv. Lett. 2014, 8, 1–13. [Google Scholar] [CrossRef]
  27. Crona, B.; Hubacek, K. The Right Connections: How do Social Networks Lubricate the Machinery of Natural Re-source Governance? Ecol. Soc. 2010, 15, 18. [Google Scholar] [CrossRef]
  28. Ernstson, H.; Sörlin, S.; Elmqvist, T. Social Movements and Ecosystem Services–the Role of Social Network Structure in Protecting and Managing Urban Green Areas in Stockholm. Ecol. Soc. 2008, 13, 39. [Google Scholar] [CrossRef]
  29. Stedman, R.; Lee, B.; Brasier, K.; Weigle, J.; Higdom, F. Cleaning up Water? Or Building Rural Community? Community Watershed Organizations in Pennsylvania. Rural Sociol. 2009, 74, 178–200. [Google Scholar] [CrossRef]
  30. De Nooy, W. Communication in Natural Resource Management: Agreement between and Disagreement within Stakeholder Groups. Ecol. Soc. 2013, 18, 44. [Google Scholar] [CrossRef]
  31. Curtis, A.; Byron, I.; MacKay, J. Integrating Socio-economic and Biophysical Data to Underpin Collaborative Watershed Management. J. Am. Water Resour. Assoc. 2005, 41, 549–563. [Google Scholar] [CrossRef]
  32. Crowe, J.A. In Search of a Happy Medium: How the Structure of Interorganizational Networks Influence Community Economic Development Strategies. Soc. Netw. 2007, 29, 469–488. [Google Scholar] [CrossRef]
  33. García-Amado, L.R.; Pérez, M.R.; Iniesta-Arandia, I.; Dahringer, G.; Reyes, F.; Barrasa, S. Building Ties: Social Capital Network Analysis of a Forest Community in a Biosphere Reserve in Chiapas, Mexico. Ecol. Soc. 2012, 17, 3. [Google Scholar] [CrossRef]
  34. Manring, S.L. Creating and Managing Interorganizational Learning Networks to Achieve Sustainable Ecosystem Management. Organ. Environ. 2007, 20, 325. [Google Scholar] [CrossRef]
  35. Paletto, A.; Ferretti, F.; De Meo, I. The Role of Social Networks in Forest Landscape Planning. For. Policy Econ. 2012, 15, 132–139. [Google Scholar] [CrossRef]
  36. Lienert, J.; Schnetzer, F.; Ingold, K. Stakeholder Analysis Combined with Social Network Analysis Provides Fine-grained Insights into Water Infrastructure Planning Processes. J. Environ. Manag. 2013, 125, 134–148. [Google Scholar] [CrossRef] [PubMed]
  37. McCarty, C.; Killworth, P.D.; Rennell, J. Impact of Methods for Reducing Respondent Burden on Personal Network Structural Measures. Soc. Netw. 2007, 29, 300–315. [Google Scholar] [CrossRef]
  38. Nardone, G.; Sisto, R.; Lopolito, A. Social Capital in the LEADER Initiative: A Methodological Approach. J. Rural Stud. 2010, 26, 63–72. [Google Scholar] [CrossRef]
  39. Marín, A.; Gelcich, S.; Castilla, J.C.; Berkes, F. Exploring Social Capital in Chile’s Coastal Benthic Comanagement System Using a Network Approach. Ecol. Soc. 2012, 17, 13. [Google Scholar] [CrossRef]
  40. Gonzalès, R.; Parrott, L. Network Theory in the Assessment of the Sustainability of Social-ecological Systems. Geogr. Compass 2012, 6, 76–88. [Google Scholar] [CrossRef]
  41. Vance-Borland, K.; Holley, J. Conservation Stakeholder Network Mapping, Analysis, and Weaving. Conserv. Lett. 2011, 4, 278–288. [Google Scholar] [CrossRef]
  42. Rezaei-Moghaddam, K.; Fatemi, M. The Network Analysis of Organizations in Watershed Management toward Sustainability in Northern Iran. Front. Environ. Sci. 2023, 11, 1078007. [Google Scholar] [CrossRef]
  43. Ptak, E.N.; Graversgaard, M.; Dalgaard, T. Navigating the nexus: The role of Intermediaries in Charting a New Frontier of Policy Integration for Agrifood and Energy Systems Transformation. Environ. Sci. Policy 2023, 139, 92–103. [Google Scholar] [CrossRef]
  44. Scott, J. Social Network Analysis: A Handbook, 2nd ed.; Sage Publications: Newberry Park, CA, USA, 2000. [Google Scholar]
  45. Wasserman, S.; Faust, K. Social Network Analysis—Methods and Applications; Cambridge University Press: Cambridge, UK, 1994. [Google Scholar]
  46. Wellman, B.; Gulia, M. Virtual Communities as Communities: Net Surfers Don’t Ride Alone. In Communities in Cyberspace; Smith, M.A., Kollock, P., Eds.; Routledge: New York, NY, USA, 1999; pp. 167–194. [Google Scholar]
  47. Prell, C. Social Network Analysis: History, Theory and Methodology; Sage: London, UK, 2012. [Google Scholar]
  48. Chang, C.; Allen, J.C.; Dawson, S.E.; Madsen, G.E. Network Analysis as a Method for Understanding the Dynamics of Natural Resource Management in Rural Communities. Soc. Nat. Resour. 2012, 25, 203–208. [Google Scholar] [CrossRef]
  49. Wagner, W.; Gawel, J.; Furumai, H.; De Souza, M.P.; Teixeira, D.; Rios, L.; Ohgaki, S.; Zehnder, A.J.B.; Hemond, H.F. Sustainable Watershed Management: An International Multi-Watershed Case Study. Ambio 2002, 31, 2–13. [Google Scholar] [CrossRef] [PubMed]
  50. Hatamkhani, A.; Moridi, A. Optimal Development of Agricultural Sectors in the Basin Based on Economic Efficiency and Social Equality. Water Resour. Manag. 2021, 35, 917–932. [Google Scholar] [CrossRef]
  51. Hashemi, M.; Zare, F.; Moridi, A.; Bagheri, A. Flood Assessment in the Context of Sustainable Development using the DPSIR Framework. Int. J. Environ. Prot. Policy 2014, 2, 41–49. [Google Scholar] [CrossRef]
  52. Hjorth, P.; Madani, K. Systems Analysis to Promote Frames and Mental Models for Sustainable Water Management. In Proceedings of the 3rd World Sustainability Forum, Basel, Switzerland, 1–30 November 2013. [Google Scholar] [CrossRef]
  53. Moridi, A.; Tabatabaie, M.; Esmaeelzade, S. Holistic Approach to Sustainable Groundwater Management in Semi-arid Regions. Int. J. Environ. Res. 2018, 12, 347–355. [Google Scholar] [CrossRef]
  54. Bonney, P.R.; Hansen, B.D.; Baldwin, C. Citizen Science and Natural Resource Management: A Social Network Analysis of Two Community-Based Water Monitoring Programs. Soc. Nat. Resour. 2023, 36, 600–621. [Google Scholar] [CrossRef]
  55. Bidwell, R.D.; Ryan, C.M. Collaborative Partnership Design: The Implications of Organizational Affiliation for Watershed Partnerships. Soc. Nat. Resour. 2006, 19, 827–843. [Google Scholar] [CrossRef]
  56. Graversgaard, M.; Jacobsen, B.; Kjeldsen, C.; Dalgaard, T. Stakeholder Engagement and Knowledge Co-Creation in Water Planning: Can Public Participation Increase Cost-Effectiveness? Water 2017, 9, 191. [Google Scholar] [CrossRef]
  57. Abbasi Rostami, A.A.; Yazdanpanah, M.; Abdashahi, A.; Khalkheili, T.A.; Savari, M. Analysis of the Social Network of the Governance of the Integrated Management of Agricultural Water Resources in Mazandaran Province. J. Watershed Manag. Res. 2022, 13, 197–209. [Google Scholar] [CrossRef]
  58. Es’haghi, S.R.; Hejazi, Y.; Hosseini, S.M.; Rezaie, A. Social Network Analysis of Active Organizations in the Lake Urmia Restoration. Environ. Sci. 2021, 18, 239–258. (In Persian) [Google Scholar] [CrossRef]
  59. U.S. Census Bureau. QuickFacts: Dutchess County, New York. Available online: https://www.census.gov/quickfacts/fact/table/dutchesscountynewyork/RHI825222 (accessed on 24 December 2023).
  60. Panzarasa, P.; Opsahl, T.; Carley, K.M. Patterns and Dynamics of Users’ Behavior and Interaction: Network Analysis of an Online Community. J. Am. Soc. Inf. Sci. Technol. 2009, 60, 911–932. [Google Scholar] [CrossRef]
  61. Uzzi, B.; Lancaster, R. Embeddedness and Price Formation in the Corporate Law Market. Am. Sociol. Rev. 2004, 69, 319–344. [Google Scholar] [CrossRef]
  62. Koehler, B.; Koontz, T.M. Citizen Participation in Collaborative Watershed Partnerships. Environ. Manag. 2008, 41, 143–154. [Google Scholar] [CrossRef]
  63. Chaffin, B.C.; Mahler, R.L.; Wulfhorst, J.D.; Shafii, B. The Role of Agency Partnerships in Collaborative Watershed Groups: Lessons from the Pacific Northwest Experience. Environ. Manag. 2015, 55, 56–68. [Google Scholar] [CrossRef]
  64. Imperial, M.T. Using Collaboration as a Governance Strategy: Lessons From Six Watershed Management Programs. Admin. Soc. 2005, 37, 281–320. [Google Scholar] [CrossRef]
  65. Bentrup, G. Evaluation of a Collaborative Model: A Case Study Analysis of Watershed Planning in the Intermountain West. Environ. Manag. 2001, 27, 739–748. [Google Scholar] [CrossRef] [PubMed]
Figure 1. Site map of the Hudson River estuary boundary, highlighting the locations of groups A and B.
Water 16 00111 g001
Figure 2. Structural holes.
Water 16 00111 g002
Figure 3. Methodology flowchart.
Water 16 00111 g003
Figure 4. Social network maps of Group A (red circles) and Group B (blue squares).
Water 16 00111 g004aWater 16 00111 g004b
Table 1. Meaning of ties in each network model.
Network ModelDefinition of Tie A→B
AspireB aspires to work with A.
FinancialB relies on A for financial resources.
IdeasB receives new ideas from A.
InformationB receives information from A.
InteractB has interacted with A.
LaborB relies on A for labor.
PoliticalB relies on A for political support.
SkillsB relies on A for specialized skills.
ValuesB relies on A for their shared values.
Table 2. Social network measures of cohesion in watershed group networks.
Network TypeGroup AGroup B
No. of TiesDensityAverage DegreeHierarchyNo. of TiesDensityAverage DegreeHierarchy
Aspire2010.1114.6740.7572040.0252.2420.885
Financial270.0150.6281.000350.0040.3851.000
Ideas1450.0803.3720.7581840.0232.0220.962
Information1440.0803.3490.7472580.0322.8350.910
Interaction2570.1425.9770.7244200.0514.6150.891
Labor1130.0632.6280.807750.0090.8241.000
Political250.0140.5810.921770.0090.8460.978
Skills740.0411.7210.9611120.0141.2310.983
Values1880.1044.3720.7122270.0282.4950.894
Table 3. Node-level analysis: clustering coefficient.
Network TypeMean Scoret-Test
Group AGroup BtSig.
Aspire0.4610.1355.8310.000 *
Financial0.0490.0002.9660.005 *
Ideas0.3740.1044.8530.000 *
Information0.3090.1622.8030.007 *
Interact0.5390.2334.9270.000 *
Labor0.3630.0495.5080.000 *
Political0.0600.0420.6670.506
Skills0.1770.0622.8530.006 *
Values0.4630.1804.3580.000 *
Note: * t-test is significant at a 95% confidence level.
Table 4. Node-level analysis: influence.
Network TypeMean Scoret-Test
Group AGroup BtSig.
Aspire0.0130.0063.6890.001 *
Financial0.0110.0061.3740.175
Ideas0.0110.0072.3950.020 *
Information0.0090.0071.0600.291
Interact0.0100.0071.6540.103
Labor0.0150.0054.3380.000 *
Political0.0060.009−1.0420.300
Skills0.0100.0071.3110.195
Values0.0110.0063.0860.003 *
Note: * t-test is significant at a 95% confidence level.
Table 5. Node-level analysis: ego-density.
Network TypeMean Scoret-Test
Group AGroup BtSig.
Aspire0.5180.2134.7670.000 *
Financial0.0610.0002.4510.020 *
Ideas0.4840.1544.7740.000 *
Information0.4140.2202.9410.005 *
Interact0.5560.3253.3550.001 *
Labor0.0400.0475.7640.000 *
Political0.0650.0580.1870.852
Skills0.1480.0721.8490.069
Values0.5890.2764.2300.000 *
Note: * t-test is significant at a 95% confidence level.
Table 6. Node-level analysis: ego-effective size.
Network TypeMean Scoret-Test
Group AGroup BtSig.
Aspire1.8941.7110.5560.579
Financial0.4400.3850.3610.719
Ideas1.5171.559−0.1240.901
Information1.6892.111−1.0130.313
Interact1.9553.191−2.5500.012 *
Labor1.3260.7112.5620.012 *
Political0.4660.738−1.5500.124
Skills0.9691.064−0.3210.749
Values1.5391.850−0.9330.353
Note: * t-test is significant at a 95% confidence level.
Table 7. Structural hole and centrality of the articulation node.
Network TypeEgo-Effective SizeDegree CentralityCloseness CentralityBetweenness
Centrality
ValueRankValueRankValueRankValueRank
Aspire12.468810.122111.325410.11471
Financial1.0000150.0076172.8750250.000017
Ideas12.333310.114511.396410.10941
Information16.025010.152711.416710.12011
Interact17.543510.175611.237310.12551
Labor5.333330.045841.870810.05951
Political4.000010.030521.539440.03421
Skills5.333340.045871.464410.06291
Values10.153810.099211.312110.10861
Table 8. Changes in structural holes and centralities of connector nodes.
Top RanksEgo-Effective SizeDegree CentralityCloseness CentralityBetweenness Centrality
OriginalModifiedOriginalModifiedOriginalModifiedOriginalModified
112.47 *13.050.12 *0.131.33 *1.330.11 *0.05
27.7912.590.100.131.121.220.020.04 *
37.7012.47 *0.090.12 *1.071.220.010.02
46.6912.230.080.111.041.21 *0.010.02
56.0611.460.080.111.041.200.010.02
Note: * Values of the articulation node.
Disclaimer/Publisher’s Note: The statements, opinions and data contained in all publications are solely those of the individual author(s) and contributor(s) and not of MDPI and/or the editor(s). MDPI and/or the editor(s) disclaim responsibility for any injury to people or property resulting from any ideas, methods, instructions or products referred to in the content.

