Article

Pearson K-Mean Multi-Head Attention Model for Deformation Prediction of Super-High Dams in First Impoundments

1
College of Ocean Engineering Equipment, Zhejiang Ocean University, Zhoushan 316000, China
2
Hydraulic Department, Tsinghua University, Beijing 100084, China
3
China Three Gorges Group Corporation, Beijing 100038, China
4
China Three Gorges Construction Engineering Corporation, Chengdu 610041, China
*
Author to whom correspondence should be addressed.
Water 2023, 15(9), 1734; https://doi.org/10.3390/w15091734
Submission received: 19 March 2023 / Revised: 6 April 2023 / Accepted: 26 April 2023 / Published: 30 April 2023
(This article belongs to the Section Hydraulics and Hydrodynamics)

Abstract

:
The first impoundment of a super-high dam is a crucial period from dam construction to operation, in which the prediction of the dam deformation is vital for the continued safety of the dam. Therefore, a multi-head attention model based on Pearson K-means clustering is proposed, which is shortened to PKMA. The inputs of the PKMA include measurements of the displacements of plumb lines, water levels, air temperatures, dam body temperatures, water temperatures, and foundation temperatures. Among these inputs, variables related to displacements are regarded as the dominant explanatory factors. Hence, the K-means clustering based on the Pearson index is utilised to increase the weights of displacements in the PKMA. To involve the interactions between inputs, the MA mechanism of neural networks is used to simulate the relationship between inputs and deformation targets. The PKMA model had a maximum MSE of 1.2518 and a maximum MAE of 0.9017 for the model performance metrics at the study measurement points. Compared to the comparison models MA, HST, and LSTM, the performance metrics of the PKMA model are an improvement of an average of 87.02%, 72.42%, and 69.24%.

1. Introduction

The initial impoundment of a super-high arch dam is the transition from dam construction to operation. As the dam body, bedrock, and abutments are under water pressure from the upstream reservoir for the first time, creeping, extrusion, and plastic deformation often occur [1,2]. Due to the lack of early warnings and treatments, the Vajont and Malpasset dams experienced serious accidents during their first impoundments [3,4,5,6,7]. Therefore, dam deformation prediction in terms of the first impoundment is critical for long-term dam safety. In addition, the increments in water pressure imposed on high dams at various levels remain different, which results in extra challenges in comparison with the operation period. Unfortunately, few studies have been conducted regarding the initial impoundment.
Deterministic, statistical, mixed, hybrid, and machine learning models are the commonly approved approaches for the study of dam behaviours [8,9,10,11]. In recent years, data-driven models have been broadly used for the safety assessment and deformation prediction of super-high dams [12,13]. However, the construction of data-driven models is strongly dependent on the application of in situ monitoring data. Hydraulic monitoring data have the following characteristics: a wide variety of monitoring types, slow new data acquisition, and substantial data availability [14]. The monitoring data sets to be used for prediction modelling are, therefore, becoming extensive, which poses high challenges to data-driven model construction. For example, the data obtained from the Baihetan arch dam are detailed in Table 1. In addition, the complexity of the bedrock structures of newly planned super-high arch dams is increasing. Therefore, the deformation prediction of super-high dams based on traditional methods is subject to limitations. Moreover, a super-high dam during its first impoundment stays in a non-stable environment compared to the operation period. Hence, the relationship between dam behaviour and its impacting factors contains strong nonlinearity. Therefore, dam deformation models should be in line with these features mentioned above.
The selection of the inputs of the data-driven model plays an essential role in increasing the prediction accuracy [15]. According to Wu et al. [16], water levels of the dam reservoir, temperatures, and time components contribute to dam deformation. It is important to note that the interactions between every possible pair of inputs should not be ignored.

1.1. Literature Review

Statistical models and neural network models are the most-used data-driven models for the deformation prediction of super-high dams nowadays. Statistical models are based on multiple regression. The hydrostatic seasonal time (HST) model is one of the most classic methods. It simulates the deformation development by incorporating the effects of water level, seasonal function, and time [16]. Hu introduced the crack opening component into the HST model to explain the crest travelling of the Chencun arch dam [17,18]. Wang et al. added the hysteresis effect to HST to establish the HHST model, by which the continuous deformation of the Jinping I arch dam in the downstream direction was analysed [19]. The HHST method quantitatively shows that the deformation is caused by both the viscoelastic hysteresis water pressure and the periodic drop in ambient temperature. Statistical models are widely used in practical engineering problems due to the flexible and simplified mapping equation. Unfortunately, statistical models are often unique to the specific project, and transferring them for application in other projects likely leads to poor results. Moreover, the performance of statistical models becomes less competitive when addressing complex engineering problems.
In recent years, more and more researchers have utilised artificial neural networks (ANN) to build deformation monitoring models of high arch dams. Yang et al. used the long- and short-term memory (LSTM) model combined with the attention mechanism to build a deformation monitoring model of an arch dam [20]. The results showed that the accuracy of the LSTM model was 20% higher than that of the traditional recurrent neural network (RNN) model and 61% higher than that of the conventional LSTM model. Chen et al. developed the bilateral slope-based distance and dynamic time warping algorithm (BSD-DTW) to cluster arch dam measurement points and avoid data compensation [21].

1.2. Problem Statement

The current deformation prediction models for super-high dams are generally subject to limitations as follows:
  • Traditional statistical models show poor robustness and transfer learning ability. In addition, they are frequently tailored to a specific project, which leads to less flexibility.
  • The missing data in the dam monitoring system are normally compensated for through interpolation methods, which can generate misleading information.
  • Deep learning models, such as LSTM and RNN, generally have poor interpretability.

1.3. Proposed Solution

For predicting the dam deformation of the first impoundment, this paper proposes a Pearson K-mean (PK) multi-head attention (MA) model, abbreviated as PKMA. The PKMA combines the MA mechanism with K-means clustering based on the Pearson index. The approach is designed to evaluate the weights of different influence factors and mechanisms of dam deformation. The application of the MA method increases the calculation speed by searching the optimal from several parameter spaces at the same time relative to single-head models.
The main work and innovation points of this paper are as follows:
  • The attention mechanism of the deformation monitoring model for the first impoundment of super-high arch dams has been improved. Our proposed model not only enables the redistribution of the influence weights of environmental factors, but also visualisation operations. The model can also calculate the degree of interaction between the factors at each moment, which is more in line with the mechanics of dam deformation during the first renewal period of a very high arch dam.
  • After the deformation measurement points are clustered and partitioned, when the deformation prediction model is constructed for a particular measurement point, the model imports the deformation data from the measurement points in the same partition, in addition to the traditional water level, temperature, and time-dependent factors. This allows the model to learn more accurate information.
  • We have optimised the MultiheadAttention model to better match the deformation monitoring data for the first impoundment of a super-high arch dam. To the best of our knowledge, this is the first time that the MultiheadAttention model has been introduced into a first impoundment deformation prediction model for a super-high arch dam. The MultiheadAttention mechanism improves the optimisation of model parameters, enhances model performance, and increases model interpretability.
In this paper, the PKMA model is trained on the data collected from the Baihetan dam, and robustness is verified through the monitoring data of the Xiluodu arch dam. Moreover, the LSTM model and MA models are established in comparison with the performance of the PKMA model. This paper is divided into five sections. Section 1 states the engineering problems and available data-driven models. Section 2 describes the procedures for establishing the PKMA model. Section 3 verifies the feasibility of the PKMA model by using a case study. Section 4 gives research results and model comparisons. Section 5 concludes the contributions of the paper.

1.4. Symbols and Abbreviations

The meanings of the symbols in the equations used in this paper are as follows:
(1)
n is the number of samples.
(2)
y i are the actual measurements.
(3)
y i ^ are the model predictions of the prediction.
(4)
x i are the normalised monitoring data series.
(5)
r i j are the Pearson correlation coefficients.
(6)
σ x and σ j are, respectively, standard deviations of the centroid and remaining variables.
(7)
a i , are the t input variables of the MA mechanism.
The following abbreviations apply to this paper:
(1)
Multi-head attention—MA;
(2)
Pearson K-mean multi-head attention model—PKMA;
(3)
Long- and short-term memory—LSTM;
(4)
Mean absolute error—MAE;
(5)
Root mean square error—RMSE;
(6)
Mean square error—MSE;
(7)
Hydrostatic seasonal time—HST.

2. The Construction of the PKMA Model

The PKMA model is developed to perform deformation predictions for the first impoundment of super-high dams. The procedures for establishing the PKMA model are summarised in Section 2.1. It is structured through the combination of K-means clustering based on the Pearson index and the multi-head attention mechanism, which are, respectively, described in Section 2.2 and Section 2.3.

2.1. The PKMA Model

Beginning with the inputs of the model, the implementation of the PKMA is in five steps, as shown in Figure 1.
Step 1: Input collection. As suggested by Wu et al. [8], the inputs of the PKMA include monitoring values of the displacements, temperatures, and water levels. These data are regarded as the candidates of the inputs of the PKMA model.
Step 2: Input selection. A PKMA model is established for predicting an individual target. However, only the effective variable, that play important roles in the development of the target should be considered as the inputs of the model. Therefore, the candidate inputs around a certain range of the target are selected. The range is determined by using the K-means algorithm based on Pearson, whose details are illustrated in Section 2.2.
Step 3: Data normalisation. To balance the magnitudes of different inputs, the input variables should be normalised before they are used. The z-score method is adopted in this paper [22].
Step 4: Application of the MA mechanism. For each objective variable, a PKMA model is established to train the relations between the standardised inputs and the target. The modelling detail is shown in Section 2.3.
The mean absolute error (MAE) [23] and the root mean square error (RMSE) [24] are introduced to assess the performance of the PKMA:
MAE = 1 n i = 1 n y i y i ^
RMSE = 1 n i = 1 n ( y i y i ^ ) 2
where n is the number of samples and y i and y i ^ are, respectively, the actual measurements and model predictions of the prediction target.

2.2. K-means Clustering Based on Pearson Index

The data sets from the dam monitoring system are time series, many of which show strong similarities [25,26]. The feature can be used to increase the weights of dominant types of input variables by including similar variables in the input set. The dominant input variable in the dam prediction model is referred to as displacement observations. This paper uses K-means clustering based on the Pearson correlation coefficient [27] to perform the input selection [28].
(1)
Let the data from candidate monitoring sets be x 1 , x 2 , , x n after standardization, and the clustering procedures are given as follows:
(2)
Randomly select k variables from x 1 , x 2 , , x n as centroids, which behave as the predefined clusters.
(3)
Assign each of the remaining variables, based on its Pearson correlation coefficients r i j from different centroids, to the centroid where r i j is the highest.
r i , j = cov ( x i , x j ) σ x i σ x j ,   i = 1 n ,   j = 1 k ,   i j
where σ x and σ j are, respectively, standard deviations of the centroid and remaining variables.
  • Place a new centroid for each cluster by calculating the sum of Pearson coefficients between the specific variable and the remaining variables in the cluster. The variable that contains the maximum sum is assigned as the new centroid.
  • Repeat steps (2)–(3) until the centroids are no longer changed.
The number k of clusters is decided through the elbow theory. Let k = 1 , , n , then plot the average Pearson index of variables from their respective centroid. This will give an elbow line whose horizontal axis is the number of clusters and vertical axis is the average of Pearson indices. The optimal k should be taken at the turning point.

2.3. Multi-Head Self-Attention Mechanism

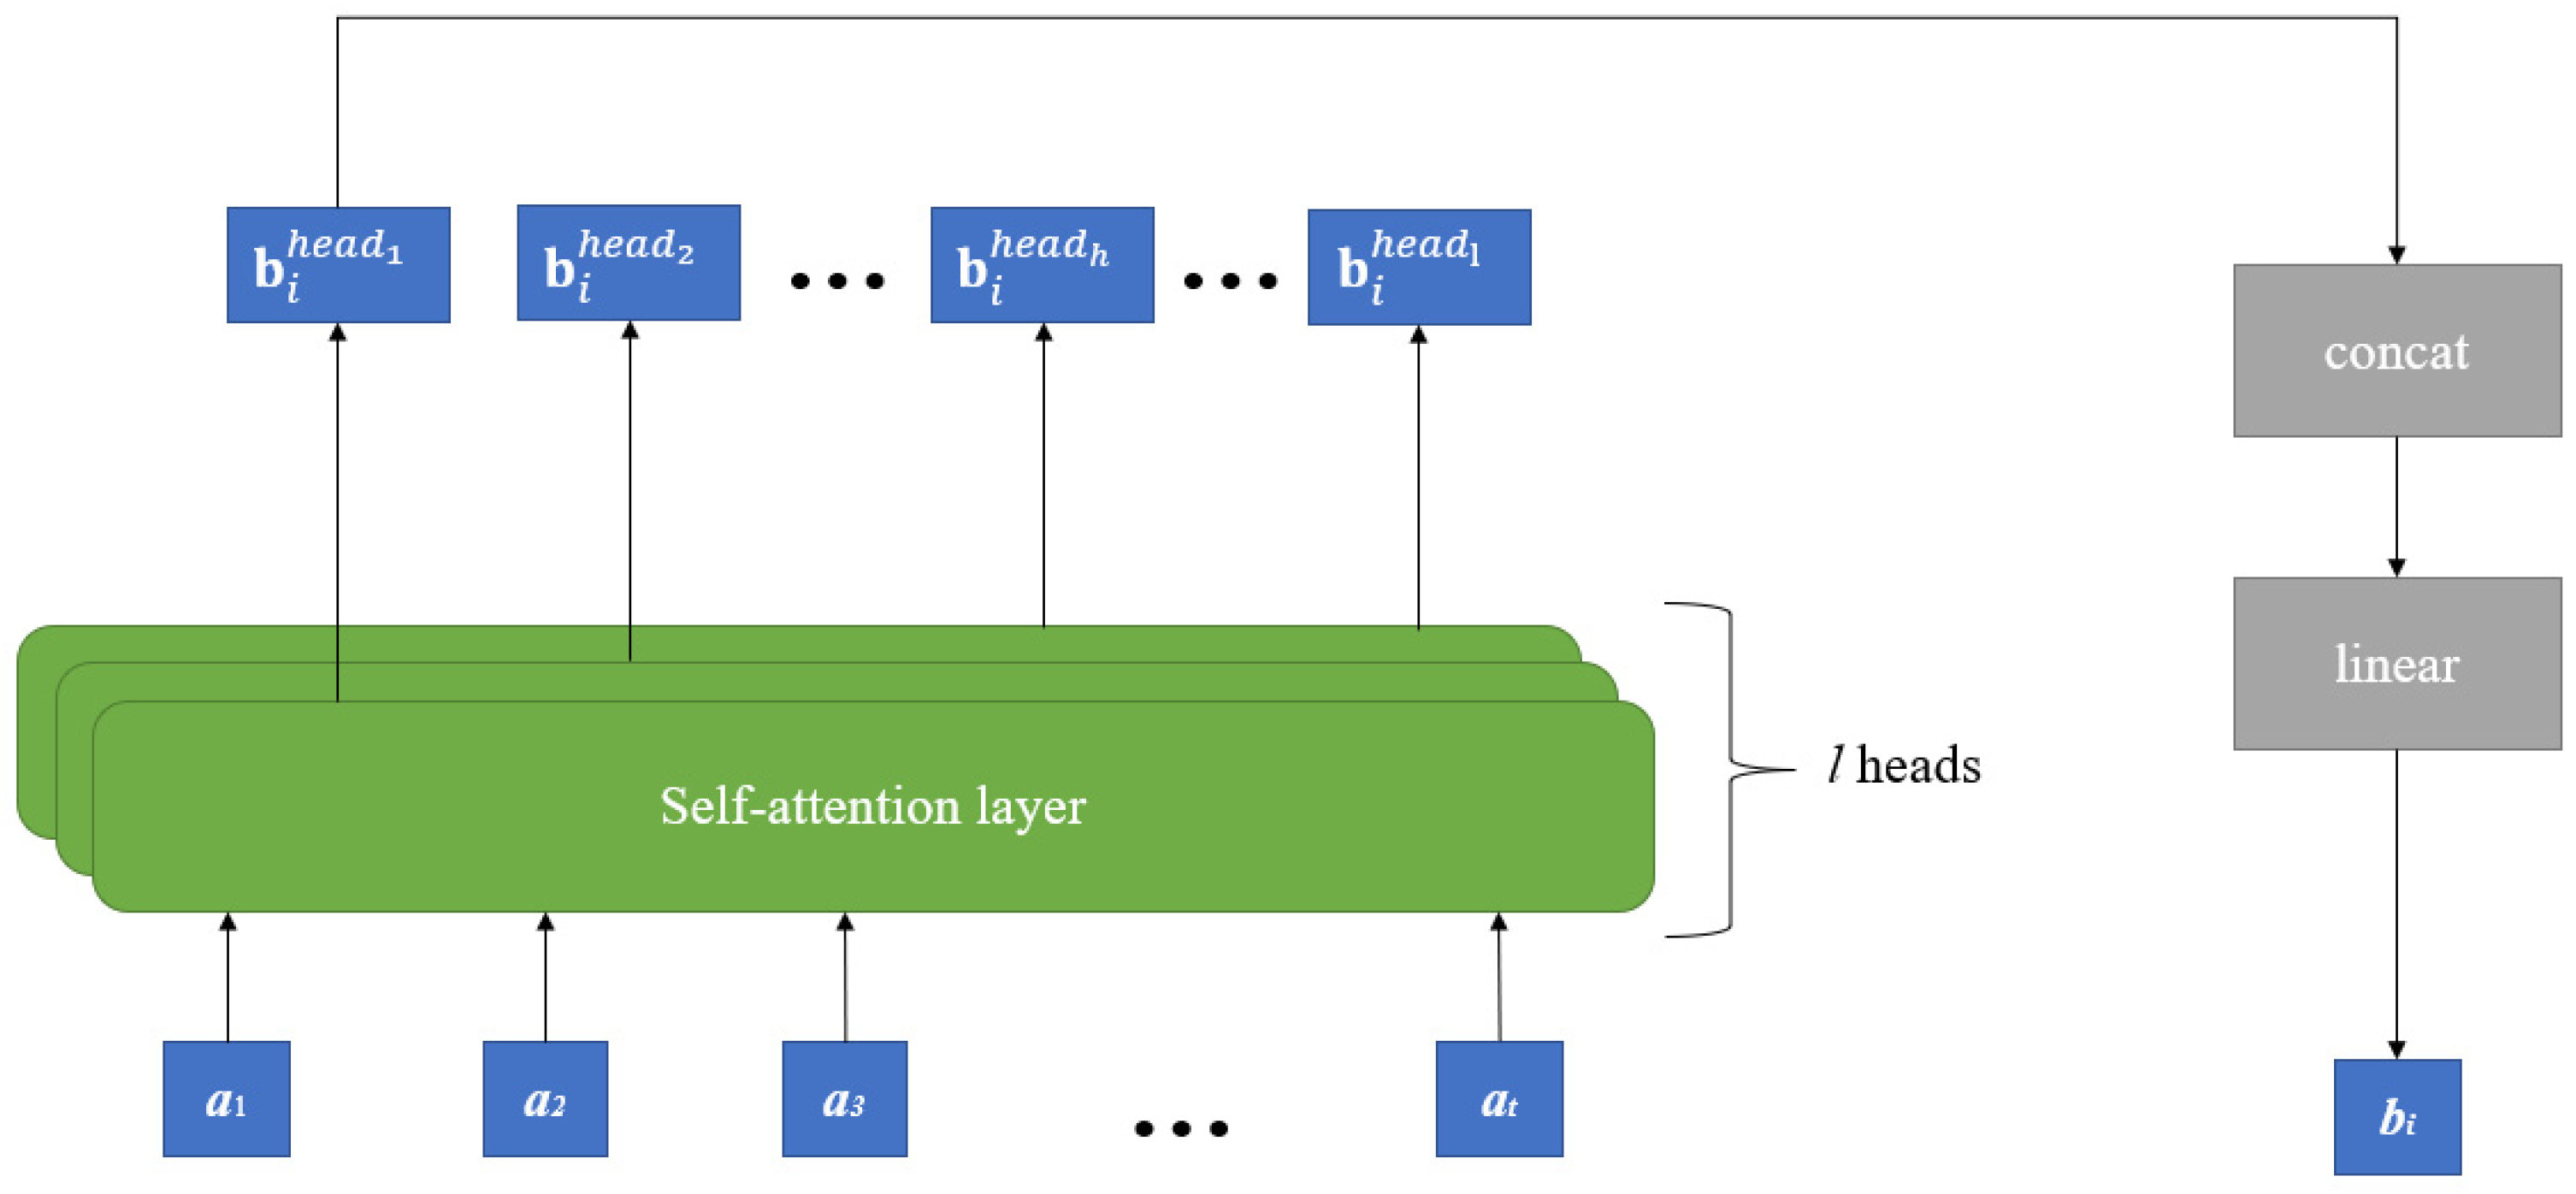
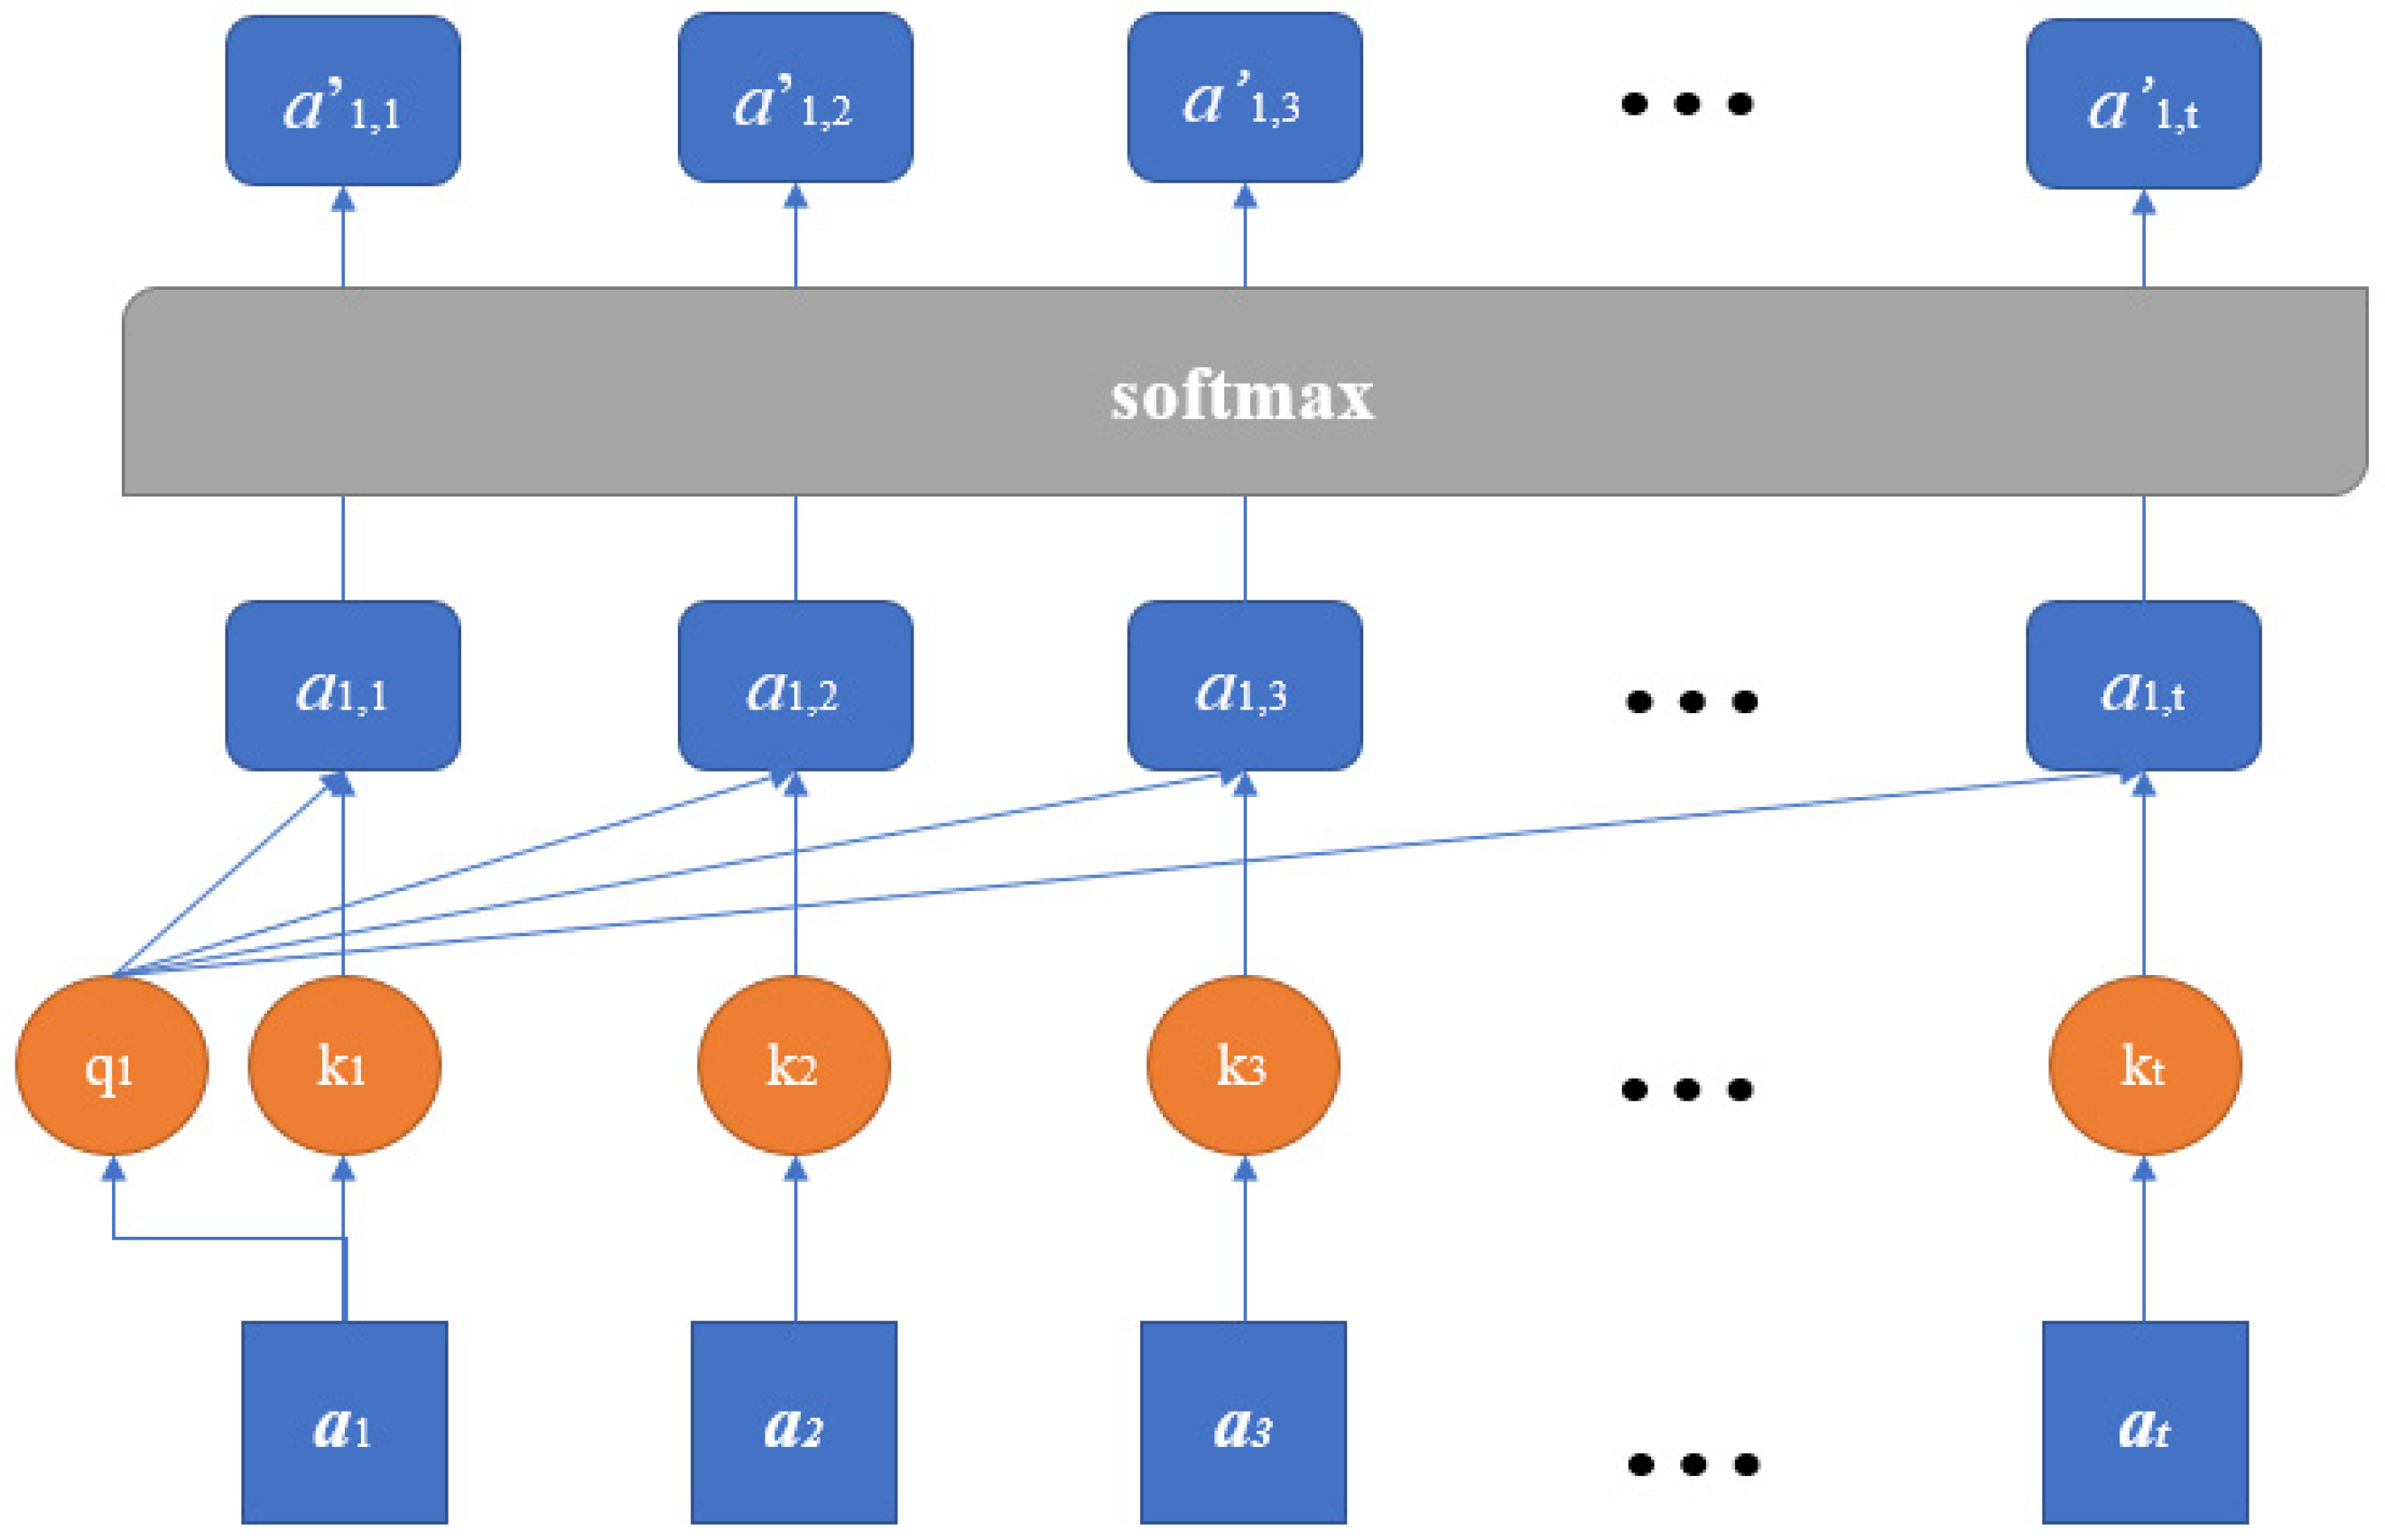
As shown in Figure 2 and Figure 3, the multi-head self-attention (MA) mechanism [29] is constructed of four steps as follows:
  • Let a i , i = 1 , , t be the t input variables of the MA mechanism. Multiply a 1 , a 2 , , a t by weight matrix W h e a d h Q for queries, W h e a d h K for keys, and W h e a d h V for values, respectively:
    q i = W h e a d h Q · a i k i = W h e a d h K · a i v i = W h e a d h V · a i
    where h = 1 , 2 , , l . l is the number of heads used in the MA.
  • For each head, calculate the weight matrix A by using the softmax function:
    A = s o f t m a x ( q 1   q 2 q t · [ k 1   k 2 k t ] T d )
    where d is the dimension of q i and k i .
  • Thereby, head b i h e a d h is obtained by summing the multiplication of A and v i :
    b i h e a d h = A · v i
  • The output b i of the MA is the multiplication of the concatenation of b i h e a d h and the coefficient matrix W O .
    b i = [ b i h e a d 1   b i h e a d 2 b i h e a d l ] · W O
Figure 2. Multi-head self-attention mechanism.
Water 15 01734 g002
Figure 3. Self-attention layer.
Water 15 01734 g003

3. Case Study

3.1. Collection of the Candidate Inputs

The Baihetan and Xiluodu dams are both located on the Jinsha River in southwest China, and they are, respectively, 289 m and 285.5 m high. The monitoring data collected from the first impoundment of the Baihetan dam are used for the establishment of the PKMA model. Subsequently, the transferability of the PKMA model is verified by using the first impoundment data from the Xiluodu dam. The inputs of the PKMA from the Baihetan dam include displacements along the river, temperatures of the dam body and foundation, air temperatures, and reservoir water levels.

3.1.1. Displacements along the River

The displacement data are collected from the normal plumb lines, which have an accuracy of 0.01 mm. Their layout is shown in Figure 4. The displacements are from 27 monitoring sets (represented by black dots), and each set contains 212 temporal values, as shown in Figure 5.

3.1.2. Temperatures of the Dam Body and Foundation

The temperatures are measured using thermometers placed in the Baihetan dam body and foundation. Their layouts are shown in Figure 6 and Figure 7. The temperature measurements in the dam body and foundation are, respectively, from 201 and 24 monitoring points, and each point produces 30 observations during the first impoundment. Figure 8 and Figure 9 demonstrate the temperature values from all thermometers in the dam body and foundation, respectively, on 1 April 2021, 30 June 2021, and 31 October 2021. The measurement accuracy is 0.1 °C.

3.1.3. Air Temperature and Water Levels

As well as dam temperatures and displacements, the local environmental temperatures and reservoir water levels also play important roles in explanting dam deformation. The daily average air temperatures and reservoir water levels obtained are shown in Figure 10.
As the dimension of the temperature variables varies from the dimension of the water level variable, polynomial interpolation is used to fill in the missing data [30]. The same strategy has been used in similar scenarios in this paper.

3.2. Selection of Inputs of the PKMA

To predict an individual target of the dam deformation, a particular PKMA model is built. However, while all air temperatures and water levels are used as inputs for all PKMA models, the inputs of the displacements of normal plumb lines, dam temperatures, and foundation temperatures are only selected from within the vicinity of the target.

3.2.1. Selection of Displacement of Plumb Lines

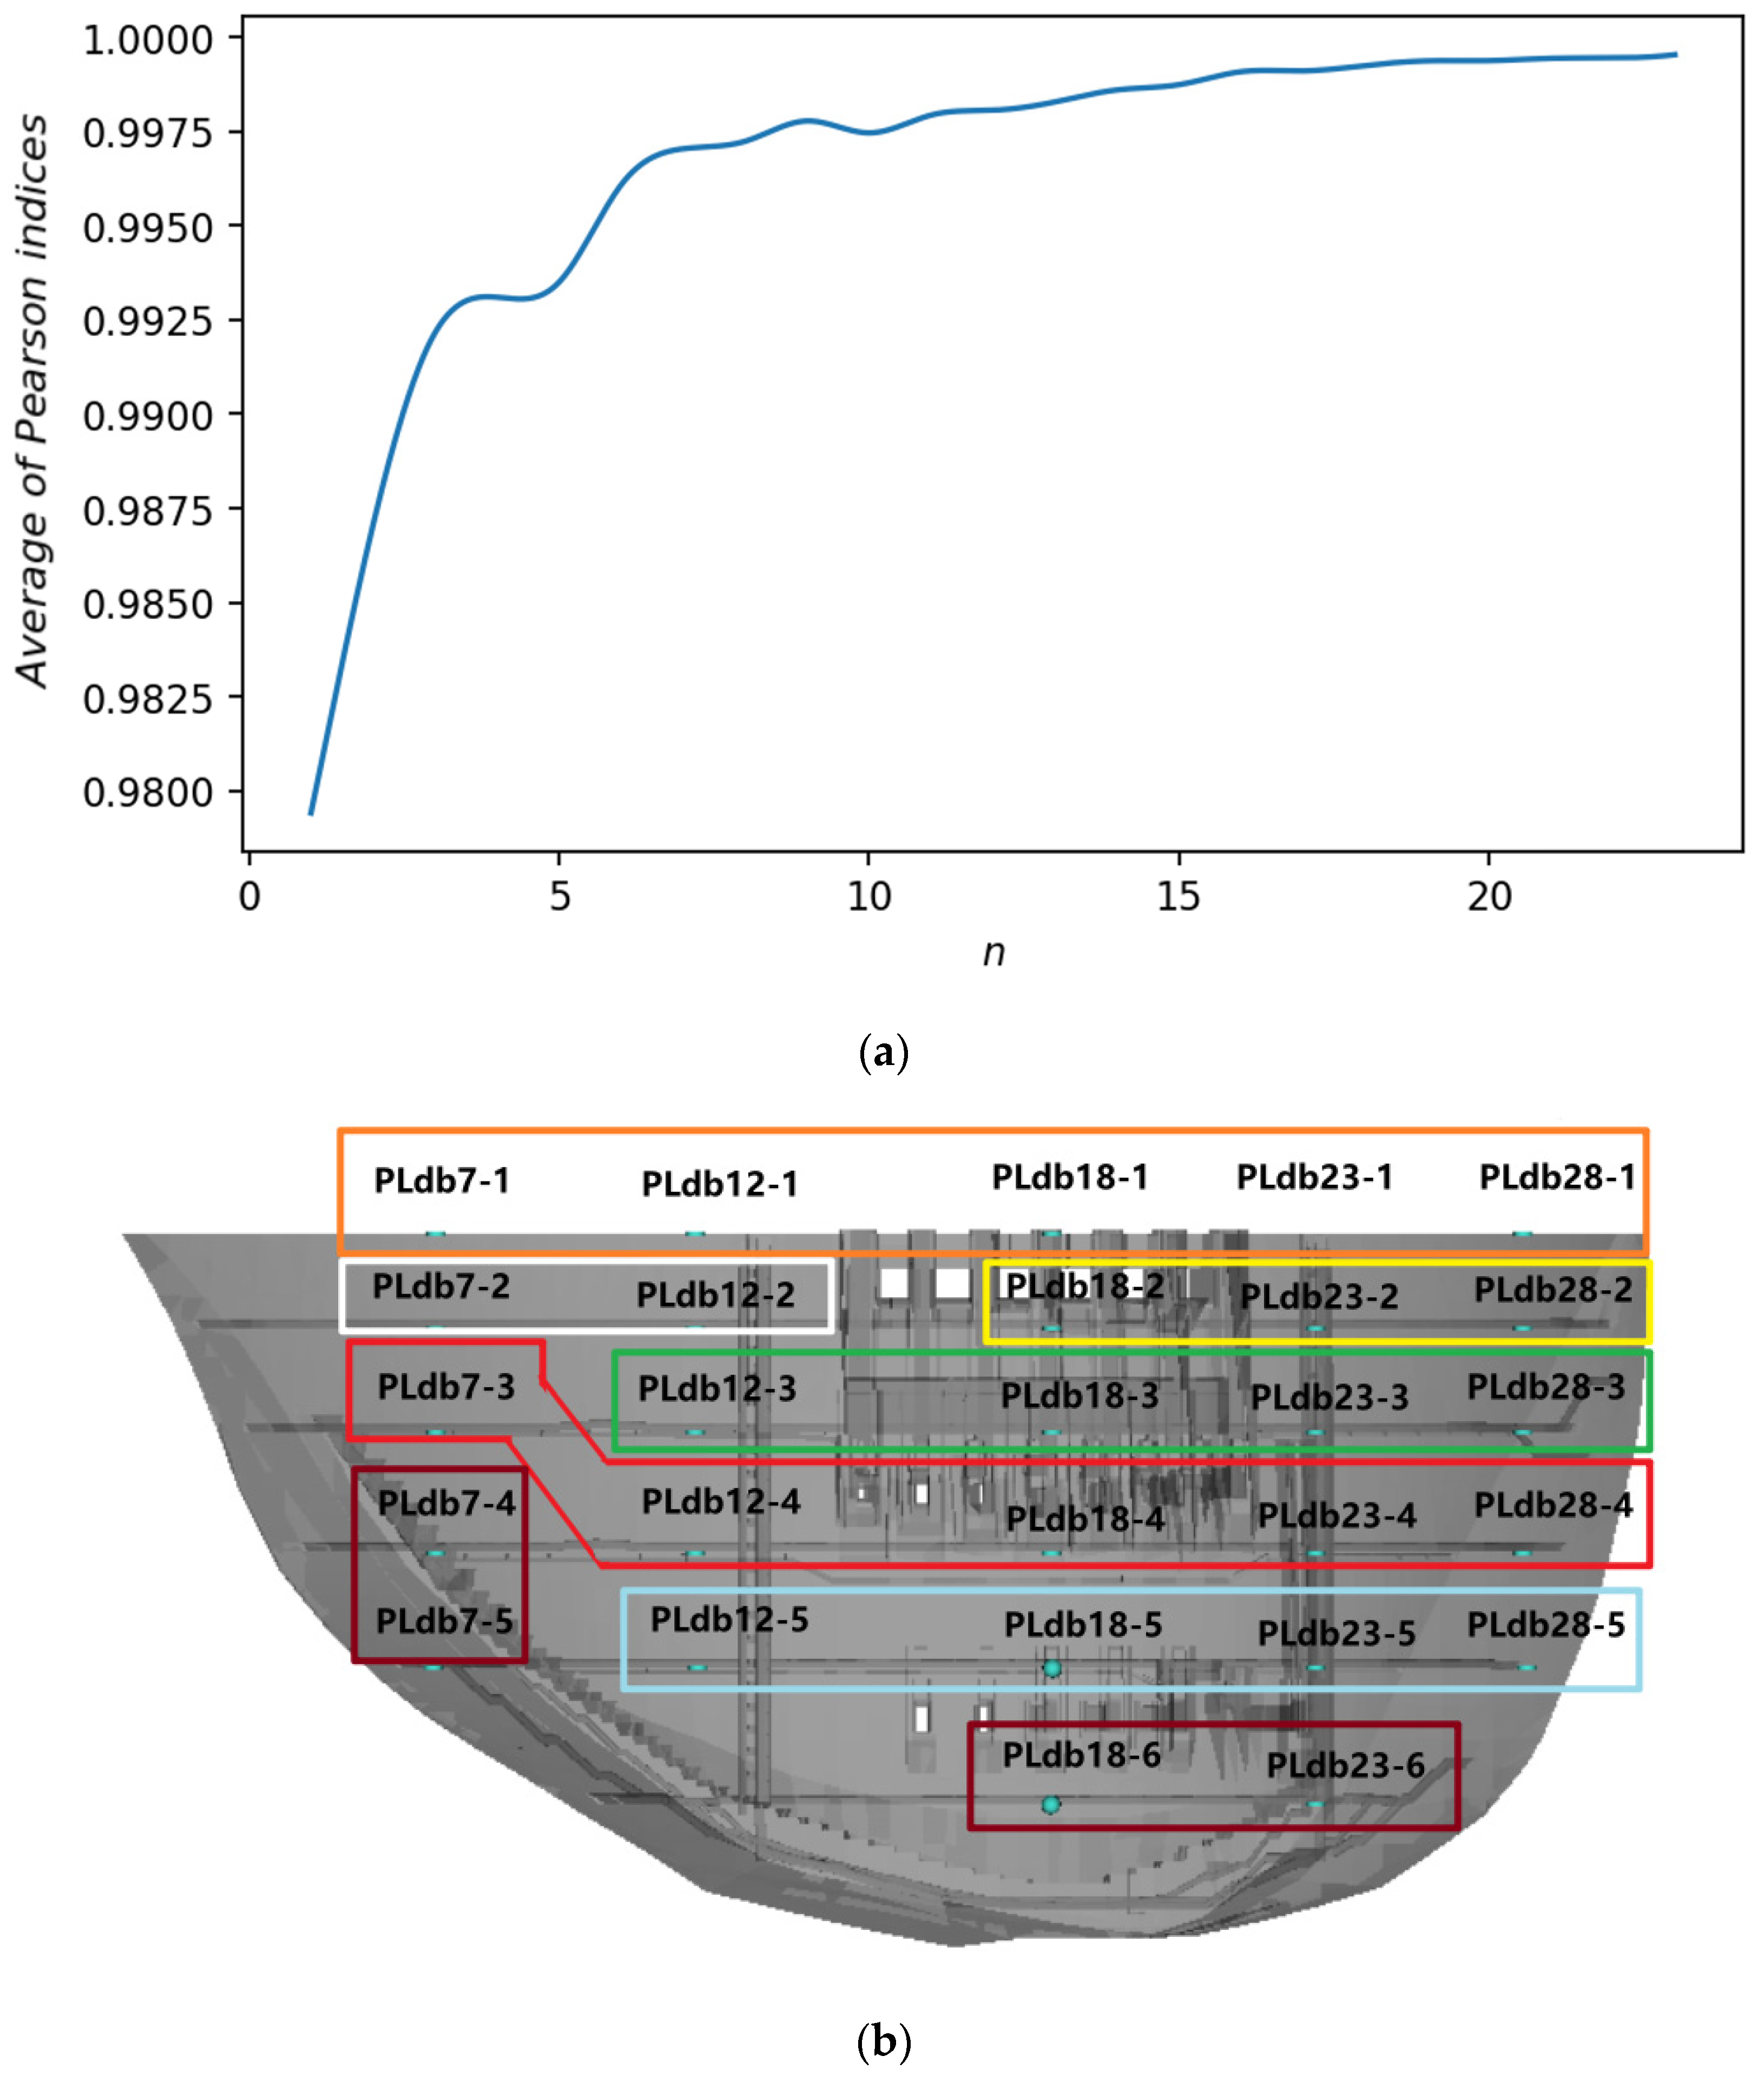
The displacement inputs of the PKMA are measured from the Baihetan normal plumb lines, which are the dominant factors in explaining the dam deformation. Therefore, the PK has been applied to all monitoring points of displacement in Figure 11. The monitoring points clustered into the same zone are considered to share the same deformation mechanism. Therefore, the influences of the displacement variable on the prediction target can be increased by involving all variables in the zone. In order to determine the number of the PK clustering, the plot of the elbow line is drawn in Figure 11a. It is noticeable that the curve increases rapidly along with the increasing number of clusters before 8, then becomes a flat line. Therefore, the 22 monitoring points of displacements are clustered into 8 zones as shown in Figure 11b. The variances among different zones are in line with the geological structures of the valley. For example, the locations of PLdb7-2, PLdb7-5, PLdb28-2, and PLdb28-5 are close to faults embedded in the dam slopes.

3.2.2. Selection of Dam Temperatures

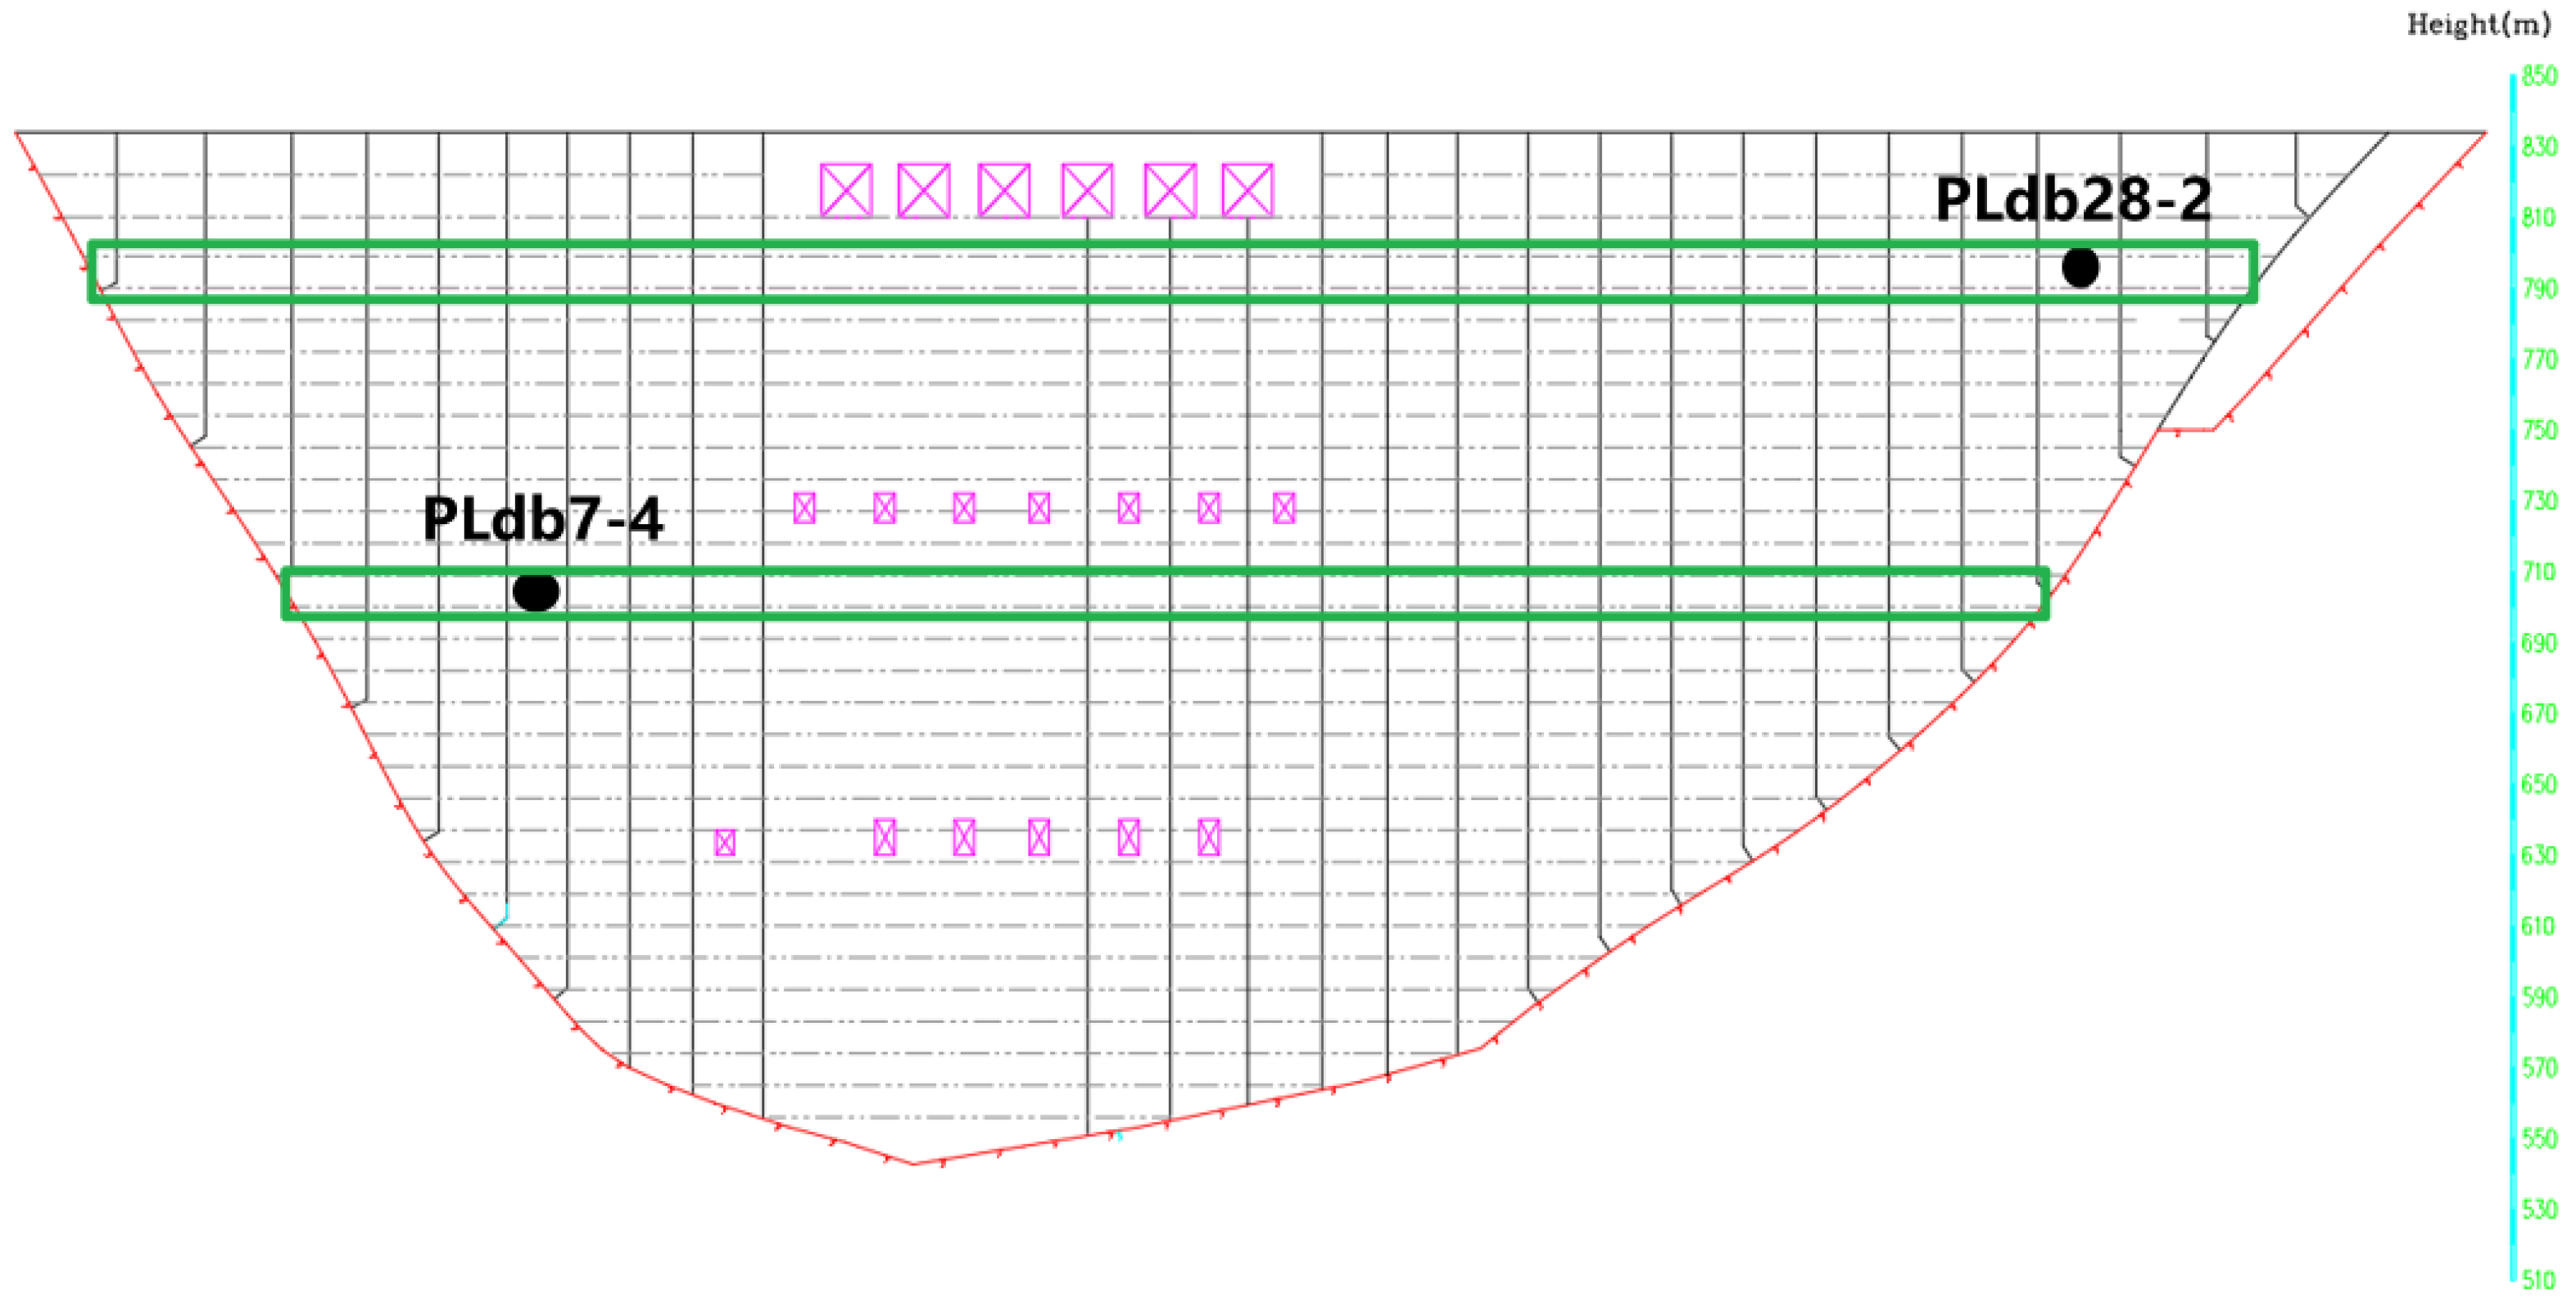
For each target variable, the average temperature of the joint grouting zone where it is situated is regarded as the dam temperature input of the PKMA. The examples shown in Figure 12, PLdb7-4 and PLdb28-2, are, respectively, located in the grouting zones of green boxes, and the average temperatures of the two zones are used to establish PKMAs for network training.

3.2.3. Selection of Foundation Temperatures

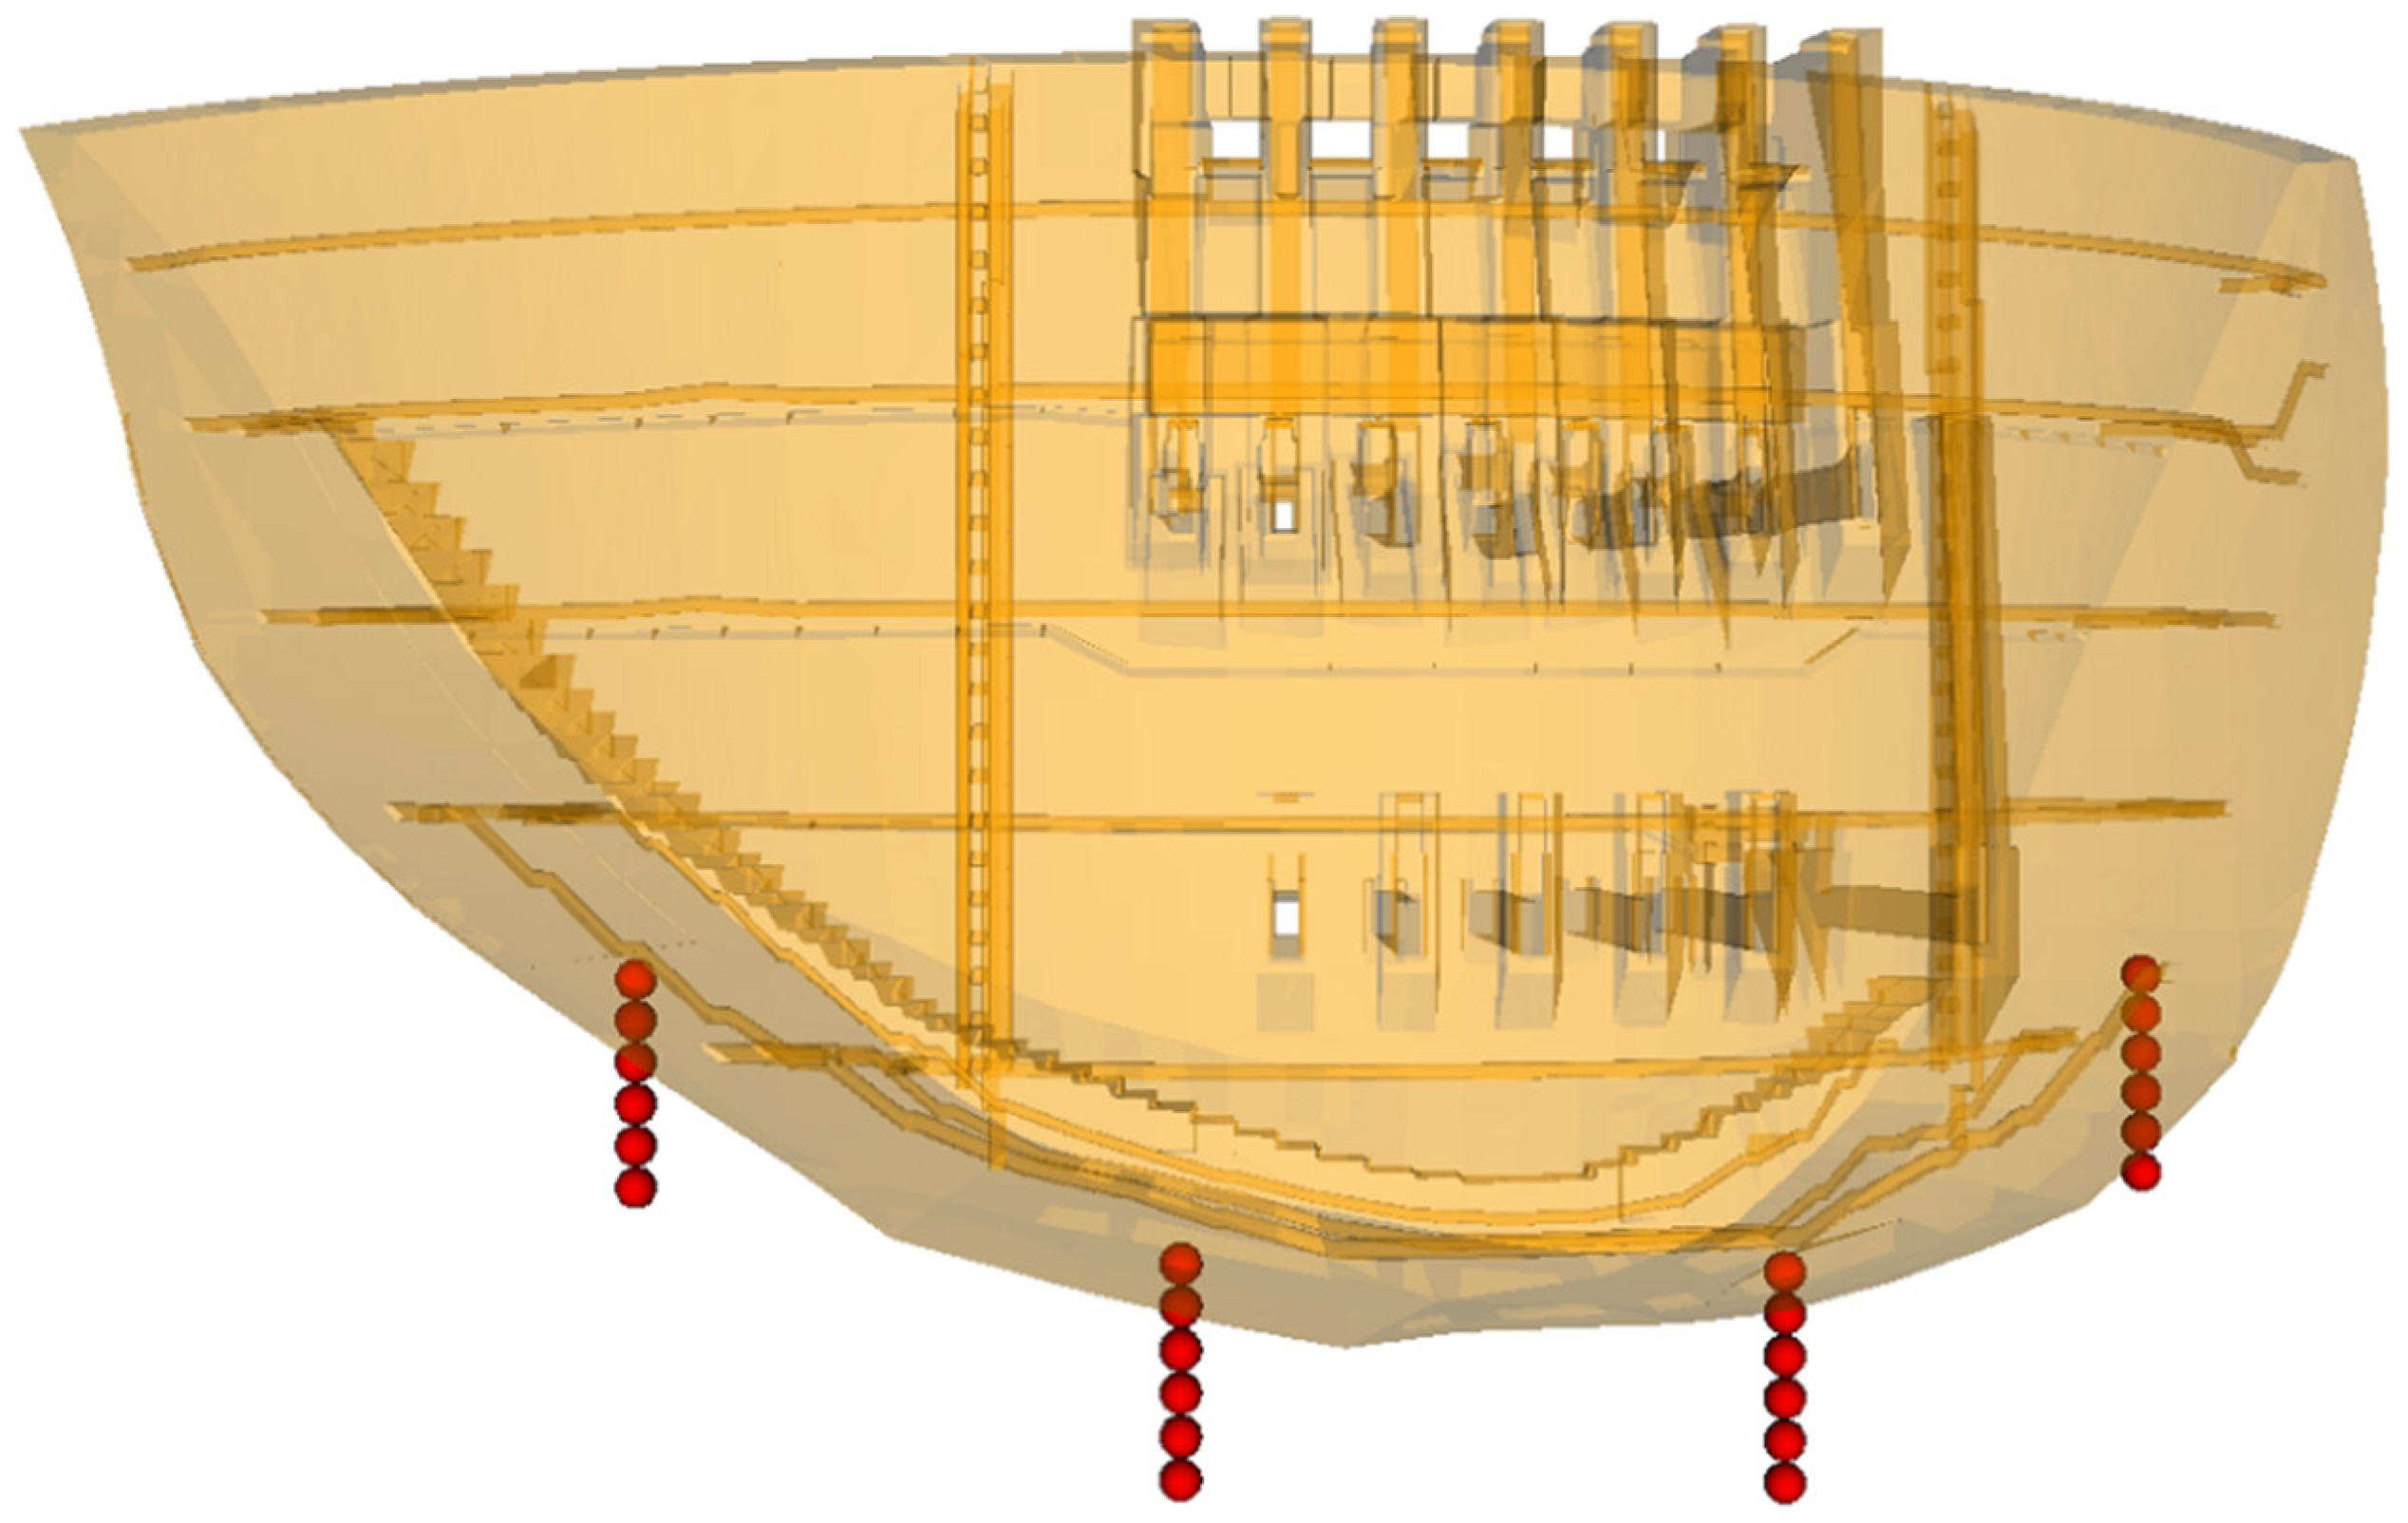
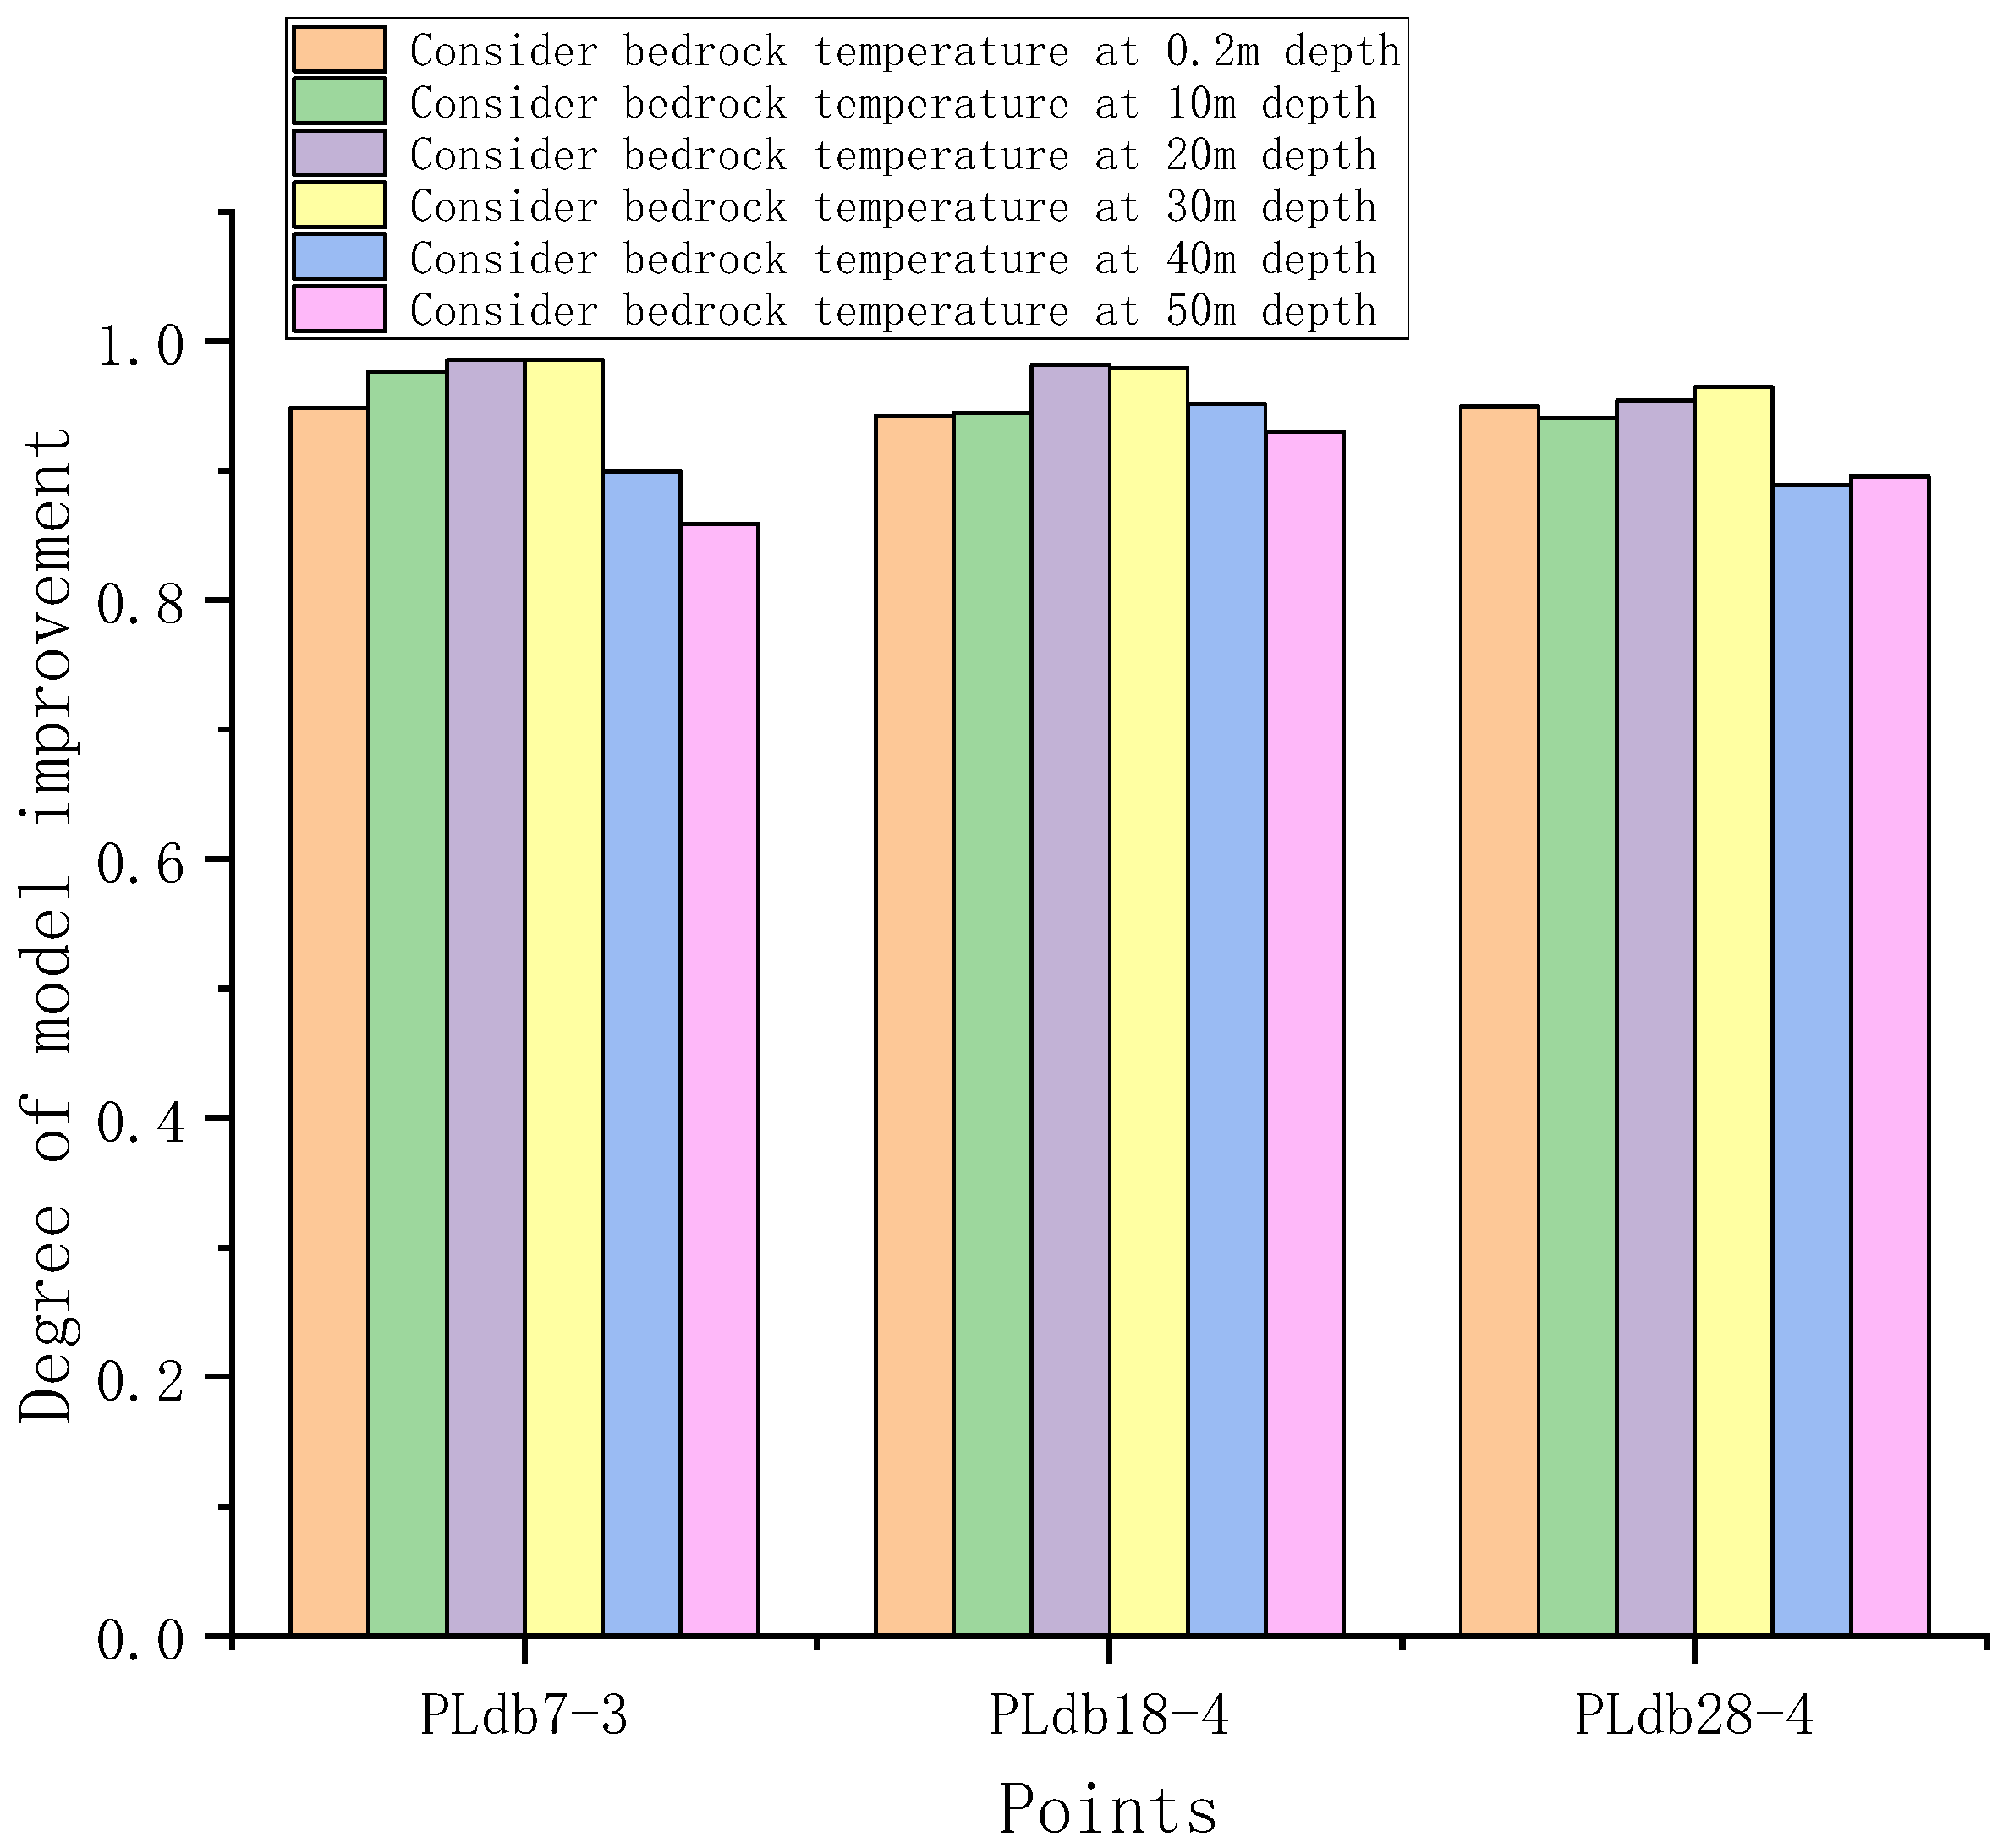
As shown in, the distances between each target and the four groups of foundation thermometers are different. Thus, the group of thermometers that are located nearest to the target are considered the input of the PKMA. Each group contains 6 thermometers, which are, respectively, installed at the depths of 0.2 m, 10 m, 20 m, 30 m, 40 m, and 50 m from the dam body bottom. Only the thermometer that can maximise the performance of the PKMA model is selected. Therefore, a selection test in terms of different depths of thermometers has been conducted. Let PLdb7-3, PLdb18-4, and PLdb28-4 be the prediction targets of the PKMA models. the input variables of these PKMA models are the same except for temperature variables at different depths. The test result is given, in which the vertical axis represents the improvement degree. It is defined by the proportion of model errors between the situation involving the foundation temperatures and the one not involving these temperatures. At the same time, Figure 13 also shows that the involvement of the foundation temperatures does improve the fitting accuracy of the PKMA. The situations involving 20 m and 30 m depths of thermometers improve the model performance more than others; hence, the average of the two is taken into account as the input variables of the PKMA model. As a result, the 4 time series used as the foundation temperatures of the PKMA inputs are given in Figure 14.

3.3. Hyperparameter Configuration

The implementation of the PKMA model is based on the karas framework in TensorFlow. The hyperparameters include the number of epochs, size of batches, learning rate (lr), and number of heads. Due to the rule of thumb, the maximum epoch is set to 500 [31]. The optimisation algorithm, JAYA, is used to determine other hyperparameters. The optimisation results are shown in Table 2, in which hyperparameters for the LSTM and MA models are required in Section 4.2 as comparisons. The results comply with the range suggested in similar research studies [32,33,34,35,36,37,38,39,40]. In addition, the prediction outcomes are always calculated using training samples from the previous 7 days.

4. Results and Discussion

The performance of the PKMA model is represented by predicting the target variables of PLdb7-4, PLdb18-4, and PLdb28-3.

4.1. Model Performance

The converging curves of training the PKMA models are shown in Figure 15. The MSEs of the three models decrease rapidly with the increasing iterations, and then yield small values. When the difference in MSEs between two consecutive iterations is less than 0.005, the training process of each model is regarded as complete. The curve of PLdb7-4 converges after 439 iterations, as shown in Figure 15a, in which converging point C p = 439 . The curve of PLdb18-4 converges after 462 iterations, as shown in Figure 15b, in which C p = 462 . The curve of PLdb28-3 converges after 412 iterations, as shown in Figure 15c, in which C p = 412 .
The model performance is shown in Figure 16, in which the black dotted lines represent the estimations of the PKMA models and the red dotted lines correspond to actual measurements. It can be seen that the estimated values largely match the measurements, as represented by the quantitative evaluation in Figure 16, which shows the performance of the PKMA models.
Though the data samples from the Baihetan impoundment are relatively few compared to the conventional sample usage of the MA network, Figure 16 shows that the MA model can be used to study dam data successfully. Table 3 gives the test set model evaluation index values for the PKMA model. In addition, the PKMA models give positive predictions of the maximum deformation. The prediction performance of the PKMA model on first impoundment data is acceptable by dam engineering standards. Therefore, the effectiveness and feasibility of the PKMA model are verified.

4.2. Model Interpretability

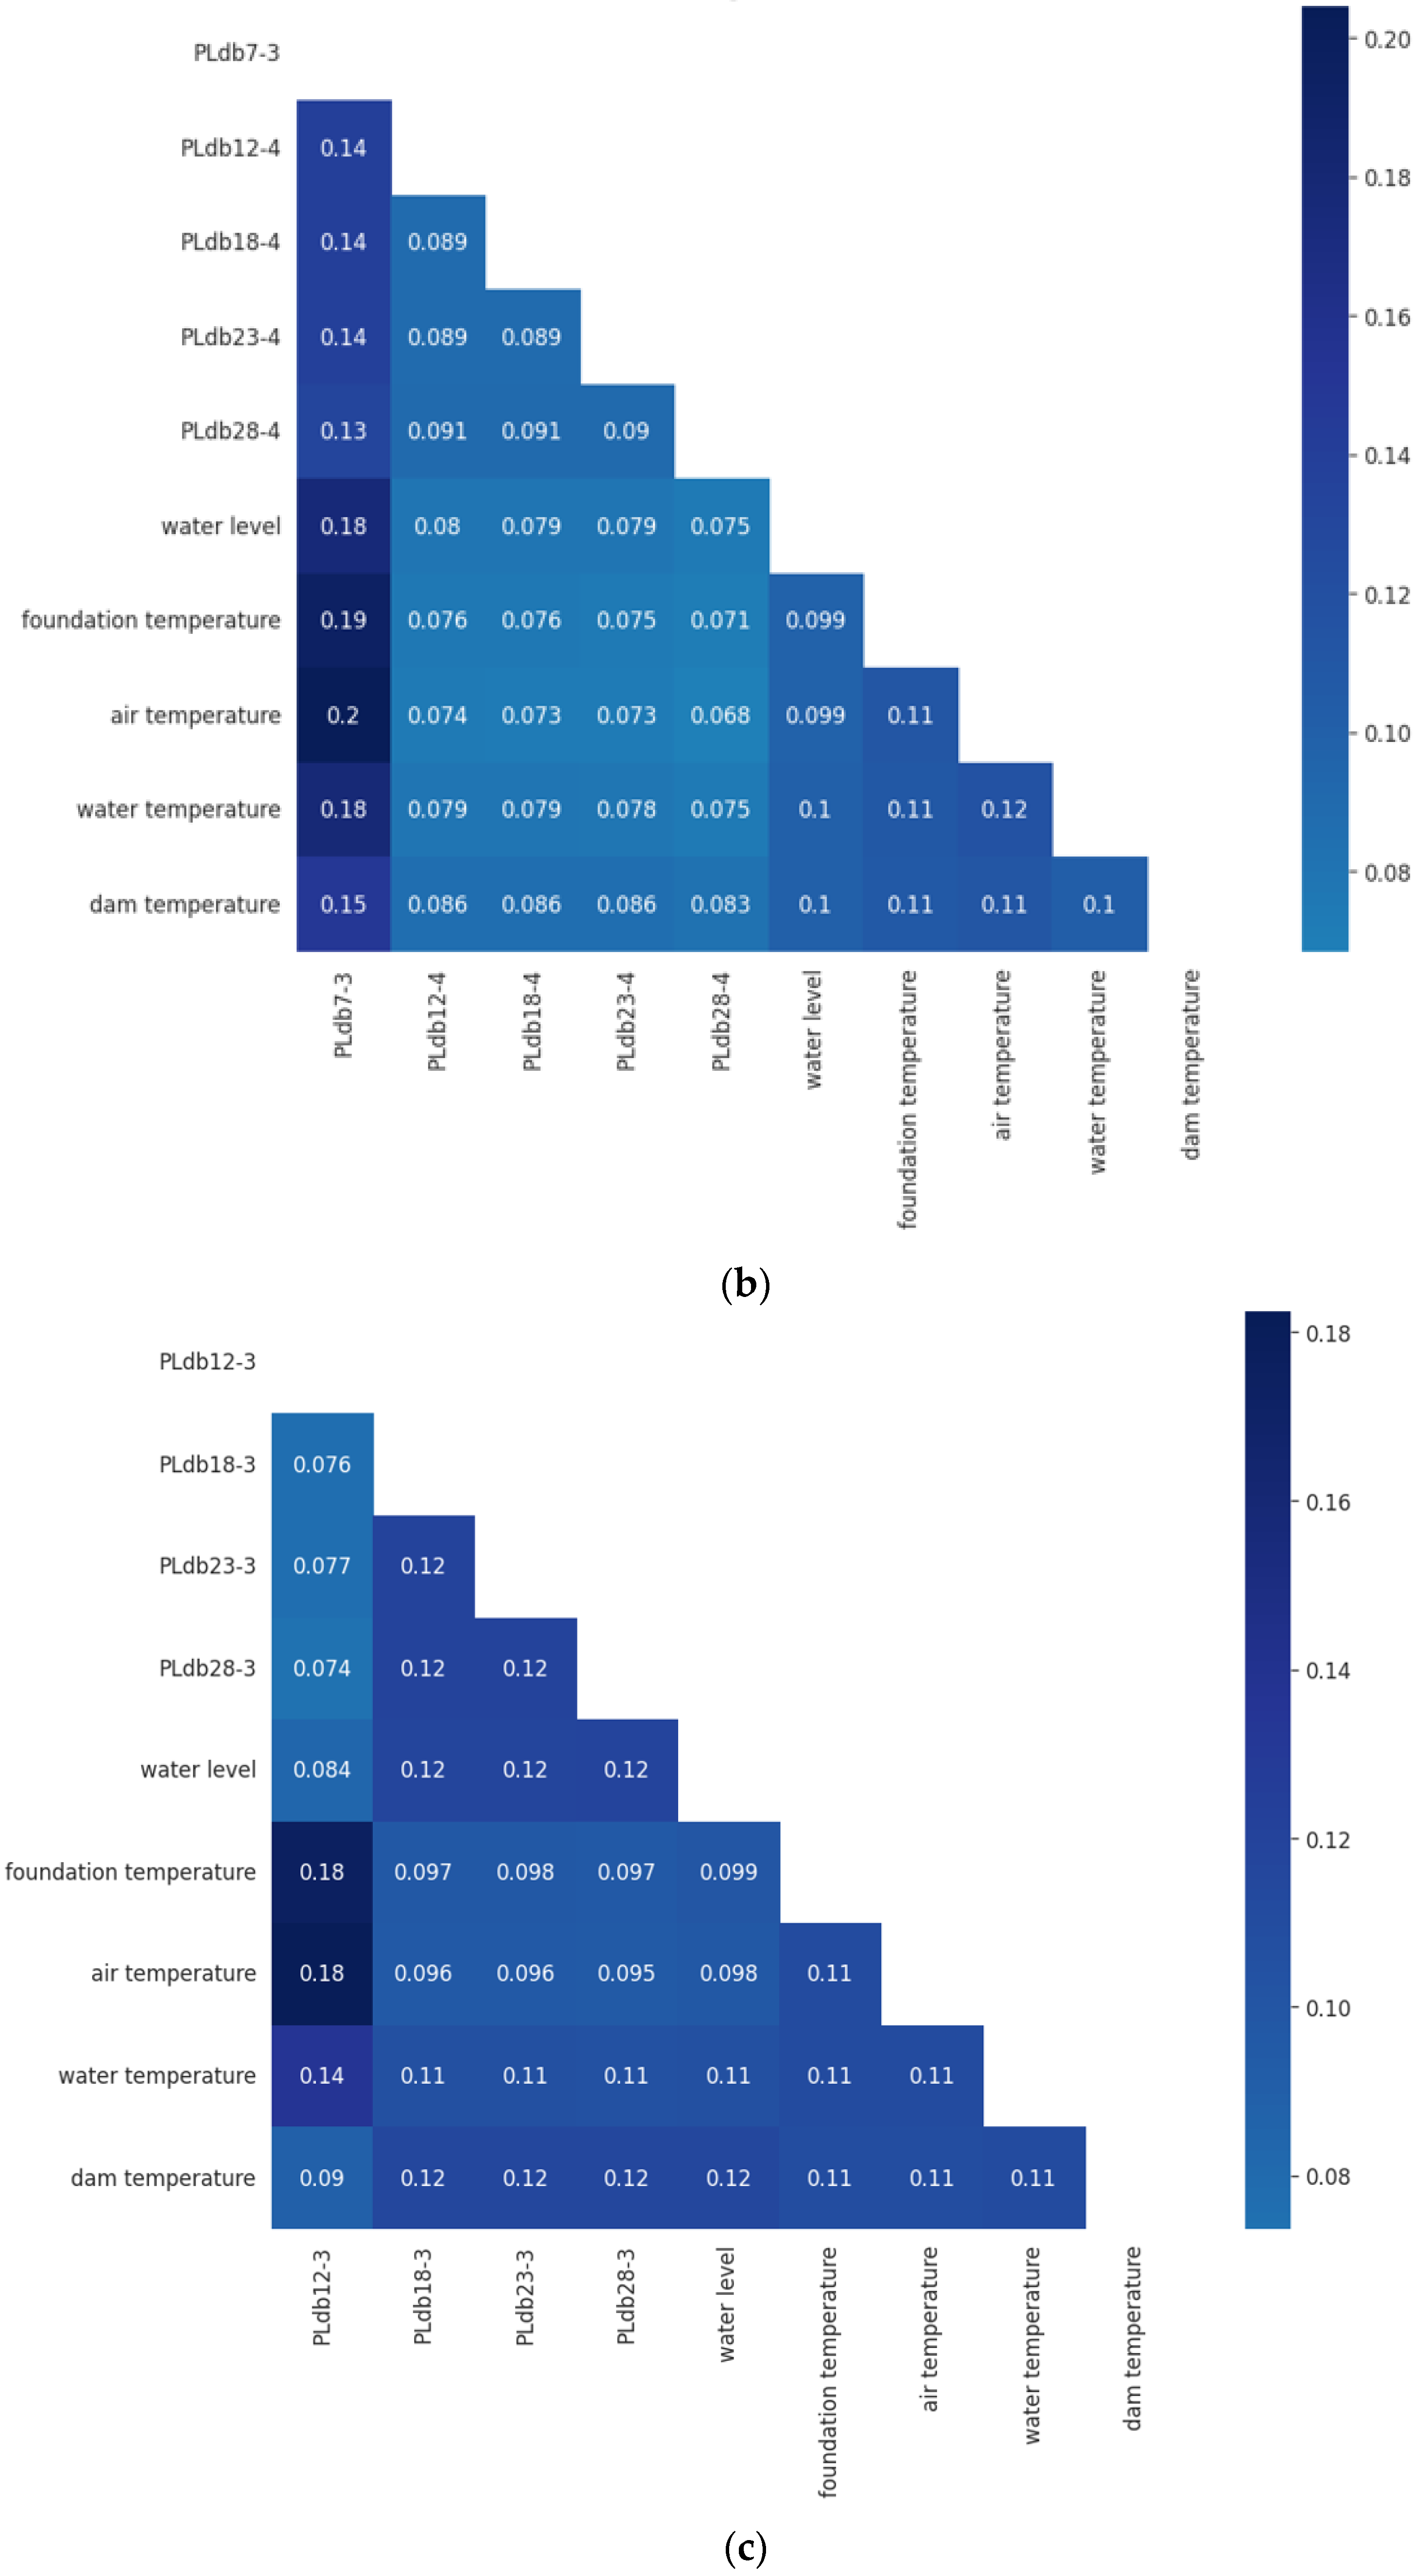
The average correlations of all inputs of the PKMA are visually illustrated in Figure 17. By analysing the statistics, the following conclusions are obtained:
  • The influences of the water level and temperature on the dam deformation are similar; the correlation coefficients between any two of them range from 0.075 to 0.18.
  • The left bank measurement points, such as PLdb7-3, PLdb7-4, PLdb7-5, and PLdb12-3, are more sensitive to environmental factors than other measurement points.
  • Compared to the temperatures of the water, air, and foundation, dam body temperature has a stronger impact on the dam deformation.
  • The dam temperature, air temperature, water temperature, and bedrock temperature interact with each other, and their calculated weights are approximately the same.
Figure 17. Average colourations of inputs of the PKMA. (a) Results of PLdb7-4; (b) Results of PLdb18-4; (c) Results of PLdb28-3.
Water 15 01734 g017aWater 15 01734 g017b

4.3. Prediction Comparisons

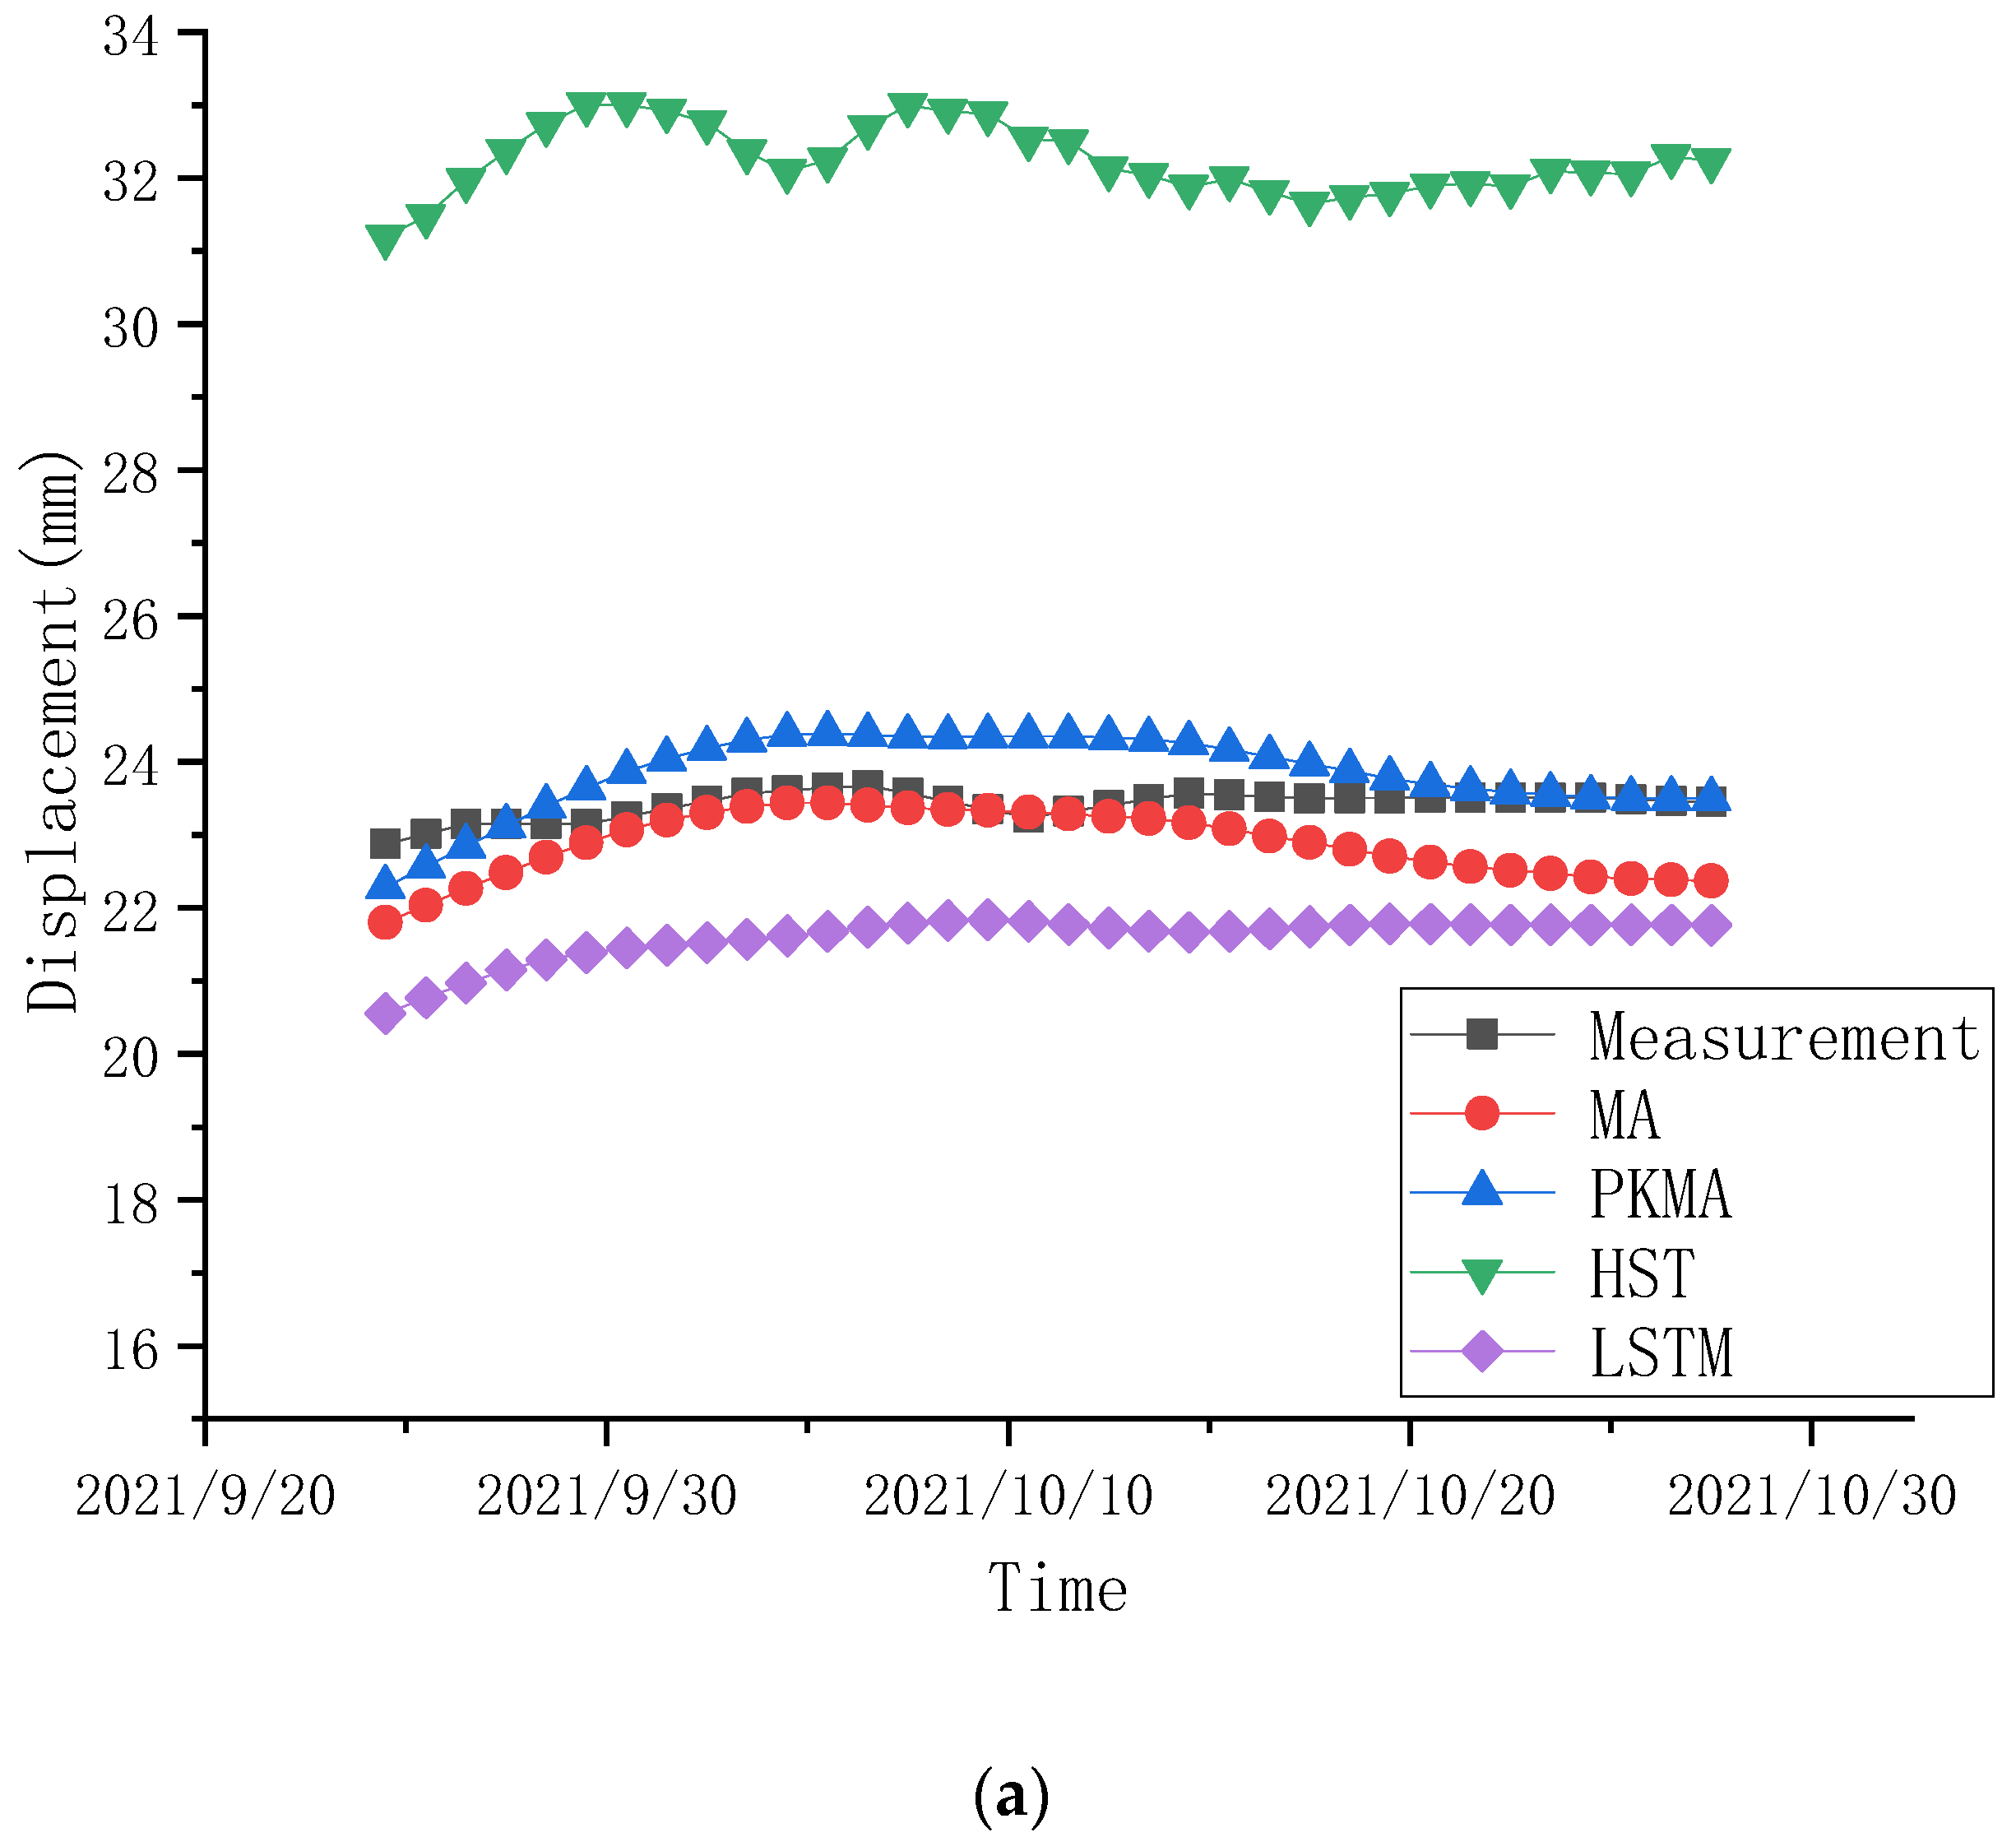
The performance of the proposed PKMA model is compared with the LSTM [41] model, MA [27] model, and HST model [42], as shown in Figure 18. Compared with the results of the PKMA model in Figure 11, the three models manage to roughly simulate the general trend of the dam deformation, but the fitting degrees are lower than that of the PKMA model. The prediction power of the LSTM, HST and MA are less competitive in comparison with the PKMA, and the quantitative evaluation is given in Table 4. The MAE, MSE, and RMSE calculated from the PKMA are always lower than the ones from the LSTM, HST, and MA. Therefore, the superiority of PKMA in handling dam deformation data during the first impoundment is demonstrated.
The performance improvement rates of the PKMA model compared to the other three models are shown in Table 5. As can be seen from Table 5, the PKMA improved the MSE by 34.82% and MAE by 30.82% compared to the MA model, the PKMA improved the MSE by 68.36% and MAE by 54.07% compared to the LSTM model, and the PKMA improved the MSE by 59.61% and MAE by 44.64% compared to the HST model. It can be seen that the PKMA model has good performance in terms of dealing with the deformation of the dam during the first storage period of a very high arch dam.
Although the computational speed of the base linear model was significantly better than that of several DL models, the performance of the base linear model was poor. This is mainly because the base linear model is data-driven and the linear principle used to fit the deformation value of the super-high arch dam cannot fully consider the nonlinear factors of the deformation of the dam itself. Additionally, fixed parameters, i.e., static calculation, were used to analyse the deformation value of the dam, which is not consistent with the working principle of the first storage period of the super-high arch dam; consequently, the model will afford large errors.

4.4. Transferability

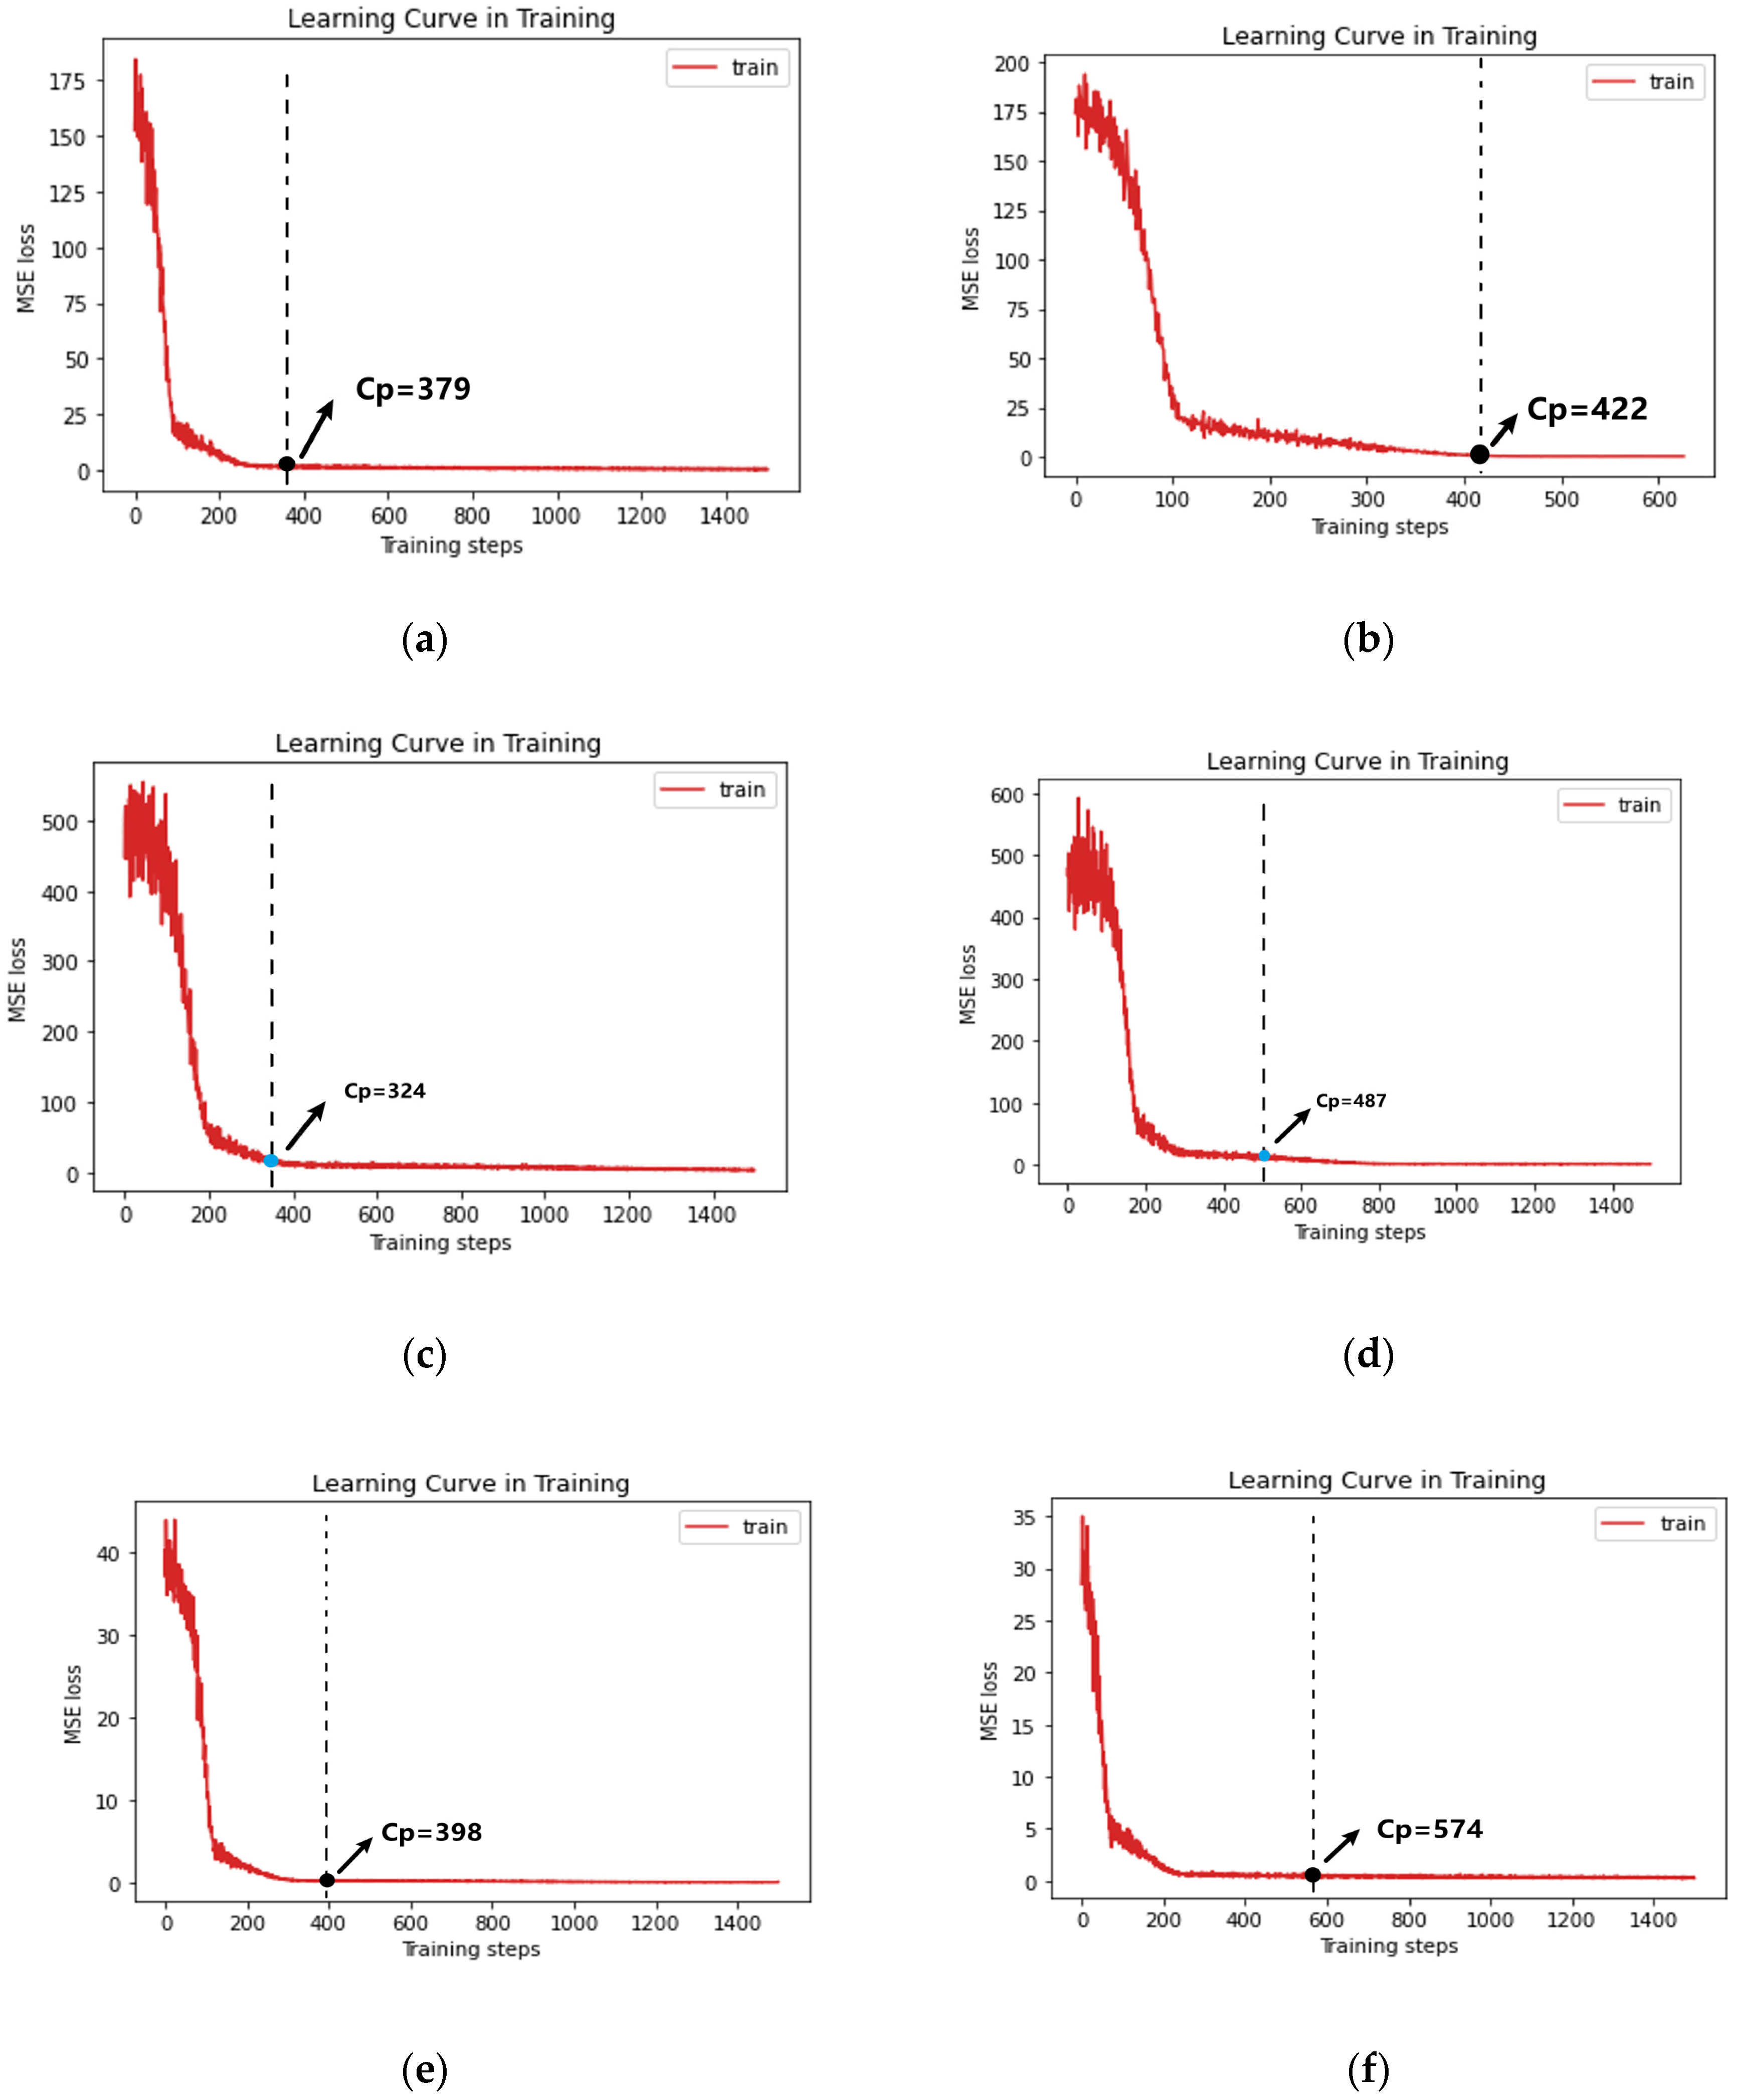
To verify the transferability of the PKMA model, the model parameters trained on the Baihetan data were used to estimate the targets of similar locations in the Xiluodu dam. As shown in Figure 19, the PKMA model parameters of point PLdb5-4 were adopted to initialise the PKMA model of point PLdb7-4, PLdb15-4 for PLdb18-4, and PLdb27-3 for PLdb28-3. The time series of the first impoundment of Xiluodu dam contains 671 samples, of which 480 were used as training data and the rest were testing data. The training curves of the PKMA models for Xiluodu data with pre-training and without pre-training on Baihetan data are given in Figure 20. By taking the same termination rule as in Section 4.1, the training processes of the Xiluodu PKMA models appear to be faster than that without pre-training. Therefore, the training time of the PKMA on a new project is largely shortened, benefiting from its strong transferability.
The advantages of the PKMA model in terms of the transferability can also be verified, as shown in Figure 21. The black lines with squares represent the actual measurements, respectively, from PLdb5-4, PLdb15-4, and PLdb27-3, the red lines with dots correspond to the PKMA performances without using the pre-training model parameters, and the blue lines with triangles are equal to the PKMA performances using the pre-training model parameters with Baihetan data. The predictive power of the PKMAs without pre-training parameters is poorer compared to the PKMAs with pre-training parameters. Their quantitative evaluations are shown in Table 6. The MAE, MSE, and RMSE calculated from the PKMAs with pre-training parameters are always lower than those of the PKMAs without pre-training parameters. Therefore, the PKMA model is considered to possess satisfying transferability.

5. Conclusions

To incorporate the physical mechanism of the dam deformation of the first impoundment into data-driven models, a PKMA model is proposed. The inputs of the PKMA model are from the displacements, temperatures, and water levels, of which displacements are regarded as the dominant factors. Therefore, the PK method is applied to increase the importance of the displacement variables by including more similar variables. Furthermore, the correlations between different variables are considered in the PKMA model by using the MA mechanism.
(1)
The K-means clustering method based on Pearson metrics allows for the similarity in shape of the individual time-series curves to be taken into account, which leads to the method being able to further consider the deformation mechanism of each measurement point. This is because the reason for the slightly different time series curves of deformation at each measurement point is that the environmental factors at the location of each measurement point have different degrees of influence on their deformation. From the clustering results in this paper, the method succeeds in separately partitioning the measurement points in the shoreline dam section close to the structural weaknesses, which is more in line with the engineering reality and the deformation mechanism.
(2)
The PK clustering results adhere to the actual deformation mechanisms of different zones.
(3)
The application of the PK increases the fitting and prediction accuracy of the MA model, which makes the PKMA a satisfying solution for super-high dam deformation of the first impoundments.
(4)
The usage of the MA mechanism provides a way to explore the interactions between different inputs.
(5)
In addition to improving the accuracy of the model prediction for the first storage period of a very high arch dam, the multi-headed attention mechanism adopted in this paper also improves the interpretability of the model. Specifically, the multi-headed attention mechanism quantifies and visualizes the weights of each calculation step, providing a new way of thinking about the deformation-driven mechanism of the first storage period of a very high arch dam.
(6)
The PKMA model has superior transferability regarding training speed and prediction accuracy.
(7)
Given the powerful capabilities of the PKMA model proposed in this paper, we believe that it can be extended to other health monitoring problems for full-size structures with multi-factor effects, such as bridges, high-rise buildings, etc., in addition to its application to prediction models for dam deformation during the first storage period of extra-high arch dams.
(8)
The set of causal factors influencing the deformation during the first storage period of extra-high arch dams can be further determined in subsequent work, and more valid influencing factors can be accurately introduced into the model calculations.
(9)
Follow-up work should combine as many projects as possible, and a more comprehensive and systematic monitoring data mining system is expected in the future.

Author Contributions

Conceptualization, Y.W. (Yilun Wei) and C.L.; Methodology, Y.W. (Yilun Wei); Software, Y.W. (Yilun Wei), C.L. and X.Z.; Validation, C.L. and Y.H.; Formal analysis, Y.W. (Yilun Wei); Resources, H.D. and Y.H.; Data curation, Y.W. (Yilun Wei); Writing—original draft, Y.W. (Yilun Wei); Writing—review & editing, Y.W. (Yilun Wei); Visualization, Y.W. (Yajun Wang); Project administration, Y.H.; Funding acquisition, Y.T. and L.P. All authors have read and agreed to the published version of the manuscript.

Funding

This research was funded by the National Natural Science Foundation of China (No. 51839007) and the China Three Gorges Corporation Research Project (No. BHT/0809).

Acknowledgments

The authors are grateful for the financial support of the National Natural Science Foundation of China (No. 51839007) and the China Three Gorges Corporation Research Project (No. BHT/0809).

Conflicts of Interest

The authors declare no conflict of interest.

References

  1. Hu, B.; Liu, G.; Wu, Z. Analysis of dam foundation deformation characteristics during the first storage period of Xiaowan extra-high arch dam based on prototype monitoring. Hydropower Autom. Dam Monit. 2012, 36, 14–20. [Google Scholar]
  2. Wei, Y.; Hu, Y.; Wang, Y.; Tan, Y.; Liu, C.; Pei, L. A hybrid model approach for predicting deformation during the first storage period of Baihetan. J. Hydropower Gener. 2022, 41, 84–92. [Google Scholar]
  3. Zhang, X.L. Collection of typical cases of dam failures and accidents at hydropower stations. Dam Saf. 2015, 8, 13–16. [Google Scholar]
  4. Londe, P. The Malpasset Dam failure. Eng. Geol. 1987, 24, 295–329. [Google Scholar] [CrossRef]
  5. Alcrudo, F.; Gil, E. The malpasset dam-break case study. In Proceedings of the 4th Concerted Action on Dambreak Modelling Workshop, Zaragoza, Spain, 18 November 1999. [Google Scholar]
  6. Erpicum, S.; Archambeau, P.; Dewals, B.; Pirotton, M. Computation of the Malpasset dam break with a 2D conservative flow solver on a multiblock structured grid. In Proceedings of the 6th International Conference of Hydroinformatics, Singapore, 21–24 June 2004. [Google Scholar]
  7. Pan, J. Danger of arch dam. Knowl. Is Power 2003, 5, 53–55. [Google Scholar]
  8. Ghatak, A. Machine Learning with R; Springer: Singapore, 2017. [Google Scholar]
  9. Belmokre, A.; Mihoubi, M.K.; Santillán, D. Analysis of Dam Behavior by Statistical Models: Application of the Random Forest Approach. KSCE J. Civ. Eng. 2019, 23, 4800–4811. [Google Scholar] [CrossRef]
  10. Salazar, F.; Toledo, M.A.; Oñate, E.; Morán, R. An empirical comparison of machine learning techniques for dam behaviour modelling. Struct. Saf. 2015, 56, 9–17. [Google Scholar] [CrossRef] [Green Version]
  11. Nielsen, A. Practical Time Series Analysis: Prediction with Statistics and Machine Learning; O’Reilly Media: Sebastopol, CA, USA, 2019. [Google Scholar]
  12. Li, B.; Yang, J.; Hu, D. Dam monitoring data analysis methods: A literature review. Struct. Control. Health Monit. 2019, 27, e2501. [Google Scholar] [CrossRef]
  13. Marius, B. Statistical Methods for Dam Behaviour Analysis; ETH Zurich: Zurich, Switzerland, 2018. [Google Scholar]
  14. Ren, Q.; Li, M.; Li, H.; Shen, Y. A novel deep learning prediction model for concrete dam displacements using interpretable mixed attention mechanism. Adv. Eng. Inform. 2021, 50, 101407. [Google Scholar] [CrossRef]
  15. Liu, C. Man-machine model: Pattern recognition and forecasts for complex structures supervised by multi-model ensembles. Struct. Saf. 2021, 88, 102022. [Google Scholar] [CrossRef]
  16. Gu, C.; Wu, Z. Theory and Method of Dam and Dam Foundation Safety Monitoring and Its Application; Hohai University Press: Nanjing, China, 2006. [Google Scholar]
  17. Hu, J.; Ma, F. Statistical modelling for high arch dam deformation during the initial impoundment period. Struct Control. Health Monit. 2020, 27, e2638. [Google Scholar] [CrossRef]
  18. Hu, J. Influence of Regenerated Crack to Arch Dam Deformation and Displacement Forecast. Water Resour. Power 2008, 6, 96–100. [Google Scholar]
  19. Wang, S.; Xu, C.; Gu, C.; Su, H.; Hu, K.; Xia, Q. Displacement monitoring model of concrete dams using the shape feature clustering-based temperature principal component factor. Struct Control Health Monit. 2020, 27, e2603. [Google Scholar] [CrossRef]
  20. Xu, C.; Wang, S.; Liu, Y.; Sui, X. Monitoring Model for Displacement of Arch Dams Considering Viscoelastic Hysteretic Effect. J. Yangtze River Sci. Res. Inst. 2022, 39, 67–72. [Google Scholar]
  21. Ren, Q.; Shen, Y.; Li, M.; Kong, R.; Li, H. Safety monitoring model of hydraulic structures and its optimization based on deep learning analysis. J. Hydraul. Eng. 2021, 52, 71–80. [Google Scholar]
  22. Chen, H.; Chen, X.; Guan, J.; Zhang, X.; Guo, J.; Yang, G.; Xu, B. A combination model for evaluating deformation regional characteristics of arch dams using time series clustering and residual correction. Mech. Syst. Signal Process. 2022, 179, 109397. [Google Scholar] [CrossRef]
  23. Ray, W.C. Advanced Engineering Mathematics; Mcgraw-Hill Book Company, Inc.: New York, NY, USA, 1960. [Google Scholar]
  24. Wu, Y. Exponential convergence rate of conditional mean absolute error for nonparametric regression kernel estimation. J. Jilin Univ. Med. Ed. 1986, 6, 186–194. [Google Scholar]
  25. Zhang, J. Probability Theory and Mathematical Statistics Tutorial; Zhejiang University Press: Hangzhou, China, 2006. [Google Scholar]
  26. Ren, Q.; Li, M.; Bai, S.; Shen, Y. A multiple-point monitoring model for concrete dam displacements based on correlated multiple-output support vector regression. Struct. Health Monit. 2022, 21, 2768–2785. [Google Scholar] [CrossRef]
  27. Penghai, H. Pearson correlation coefficient is applied to medical signal correlation measurement. Electron. World 2017, 1, 163. [Google Scholar]
  28. Neal, M. Bayesian Methods for Machine Learning. Nips Tutor. 2004, 13, 1–67. [Google Scholar]
  29. Vaswani, A.; Shazeer, N.; Parmar, N.; Uszkoreit, J.; Jones, L.; Gomez, A.N.; Kaiser, L.; Polosukhin, I. Attention Is All You Need. arXiv 2017, arXiv:1706.03762. [Google Scholar]
  30. Shen, X. Polynomial interpolation (I)-Lagrange interpolation. Prog. Math. 1983, 12, 193–214. [Google Scholar]
  31. Jaggi, R.; Morris, S. Rule of thumb. Can. Fam. Physician 2007, 1, 1309–1310. [Google Scholar]
  32. Zhou, L.; Gong, J.; He, J. Study on the expression of reasonable factor of time-dependent deformation of concrete dams. In Proceedings of the Technical Information Exchange Meeting of National Dam Safety Monitoring Technology Information Network National Dam Safety Monitoring Technology Information Network; 2007. Available online: https://www.fema.gov/sites/default/files/documents/fema_ndsp-report-congress-fy18-fy19.pdf (accessed on 5 April 2023).
  33. Pan, C. Experimental and Theoretical Study on Time-Dependent Deformation and Shear Performance of Concrete Structures; Southeast University: Dacca, Bangladesh, 2011. [Google Scholar]
  34. He, J.; Shi, Y.; Gong, J. Study on time-dependent deformation characteristics of concrete dams. J. Chang. Acad. Sci. 2010, 27, 5. [Google Scholar]
  35. Xu, C.; Wang, S.; Gu, C.; Su, H. A Probabilistic Prediction Model for Displacement of Super High Arch Dams Considering the Deformation Spatial Association; Geomatics and Information Science of Wuhan University: Wuhan, China, 2021. [Google Scholar] [CrossRef]
  36. Ren, Q.; Li, M.; Shen, Y.; Li, M. Dynamic monitoring model for dam deformation with spatiotemporal coupling correlation characteristics. J. Hydroelectr. Eng. 2021, 40, 160–172. [Google Scholar]
  37. Zhang, J.; Cao, X.; Xie, J.; Kou, P. An Improved Long Short-Term Memory Model for Dam Displacement Prediction. Math. Probl. Eng. 2019, 2019, 6792189. [Google Scholar] [CrossRef] [Green Version]
  38. Qu, X.; Yang, J.; Chang, M. A deep learning model for concrete dam deformation prediction based on RS-LSTM. J. Sens. 2019, 2019, 4581672. [Google Scholar] [CrossRef]
  39. Hu, J. Deformationforecasting model and its modeling method of super high arch dams during initial operation periods. Hydro-Sci. Eng. 2020, 5, 63–71. (In Chinese) [Google Scholar]
  40. Hu, B.; Liu, G.; Wu, Z. Study on deformation characteristics of dam foundation during the first storage period of Xiaowan extra-high arch dam based on prototype monitoring and numerical simulation tests. In Technical Advances in Reservoir Dam Construction and Management, Proceedings of the 2012 Annual Academic Conference of the China Dam Association, Denver, CO, USA, 16–20 September 2012; 2012; pp. 339–349. Available online: https://xueshu.baidu.com/usercenter/paper/show?paperid=19a62e725bdffad616e01ed0cdc14fac&site=xueshu_se (accessed on 18 March 2023).
  41. Sundermeyer, M.; Schlüter, R.; Ney, H. LSTM Neural Networks for Language Modeling. In Proceedings of the Thirteenth Annual Conference of the International Speech Communication Association 2012 Interspeech, Portland, OR, USA, 9–13 September 2012. [Google Scholar]
  42. Mata, J.; Castro, A.T.D.; Costa, J.S.D. Constructing statistical models for arch dam deformation. Struct. Control Health Monit. 2014, 21, 423–437. [Google Scholar] [CrossRef] [Green Version]
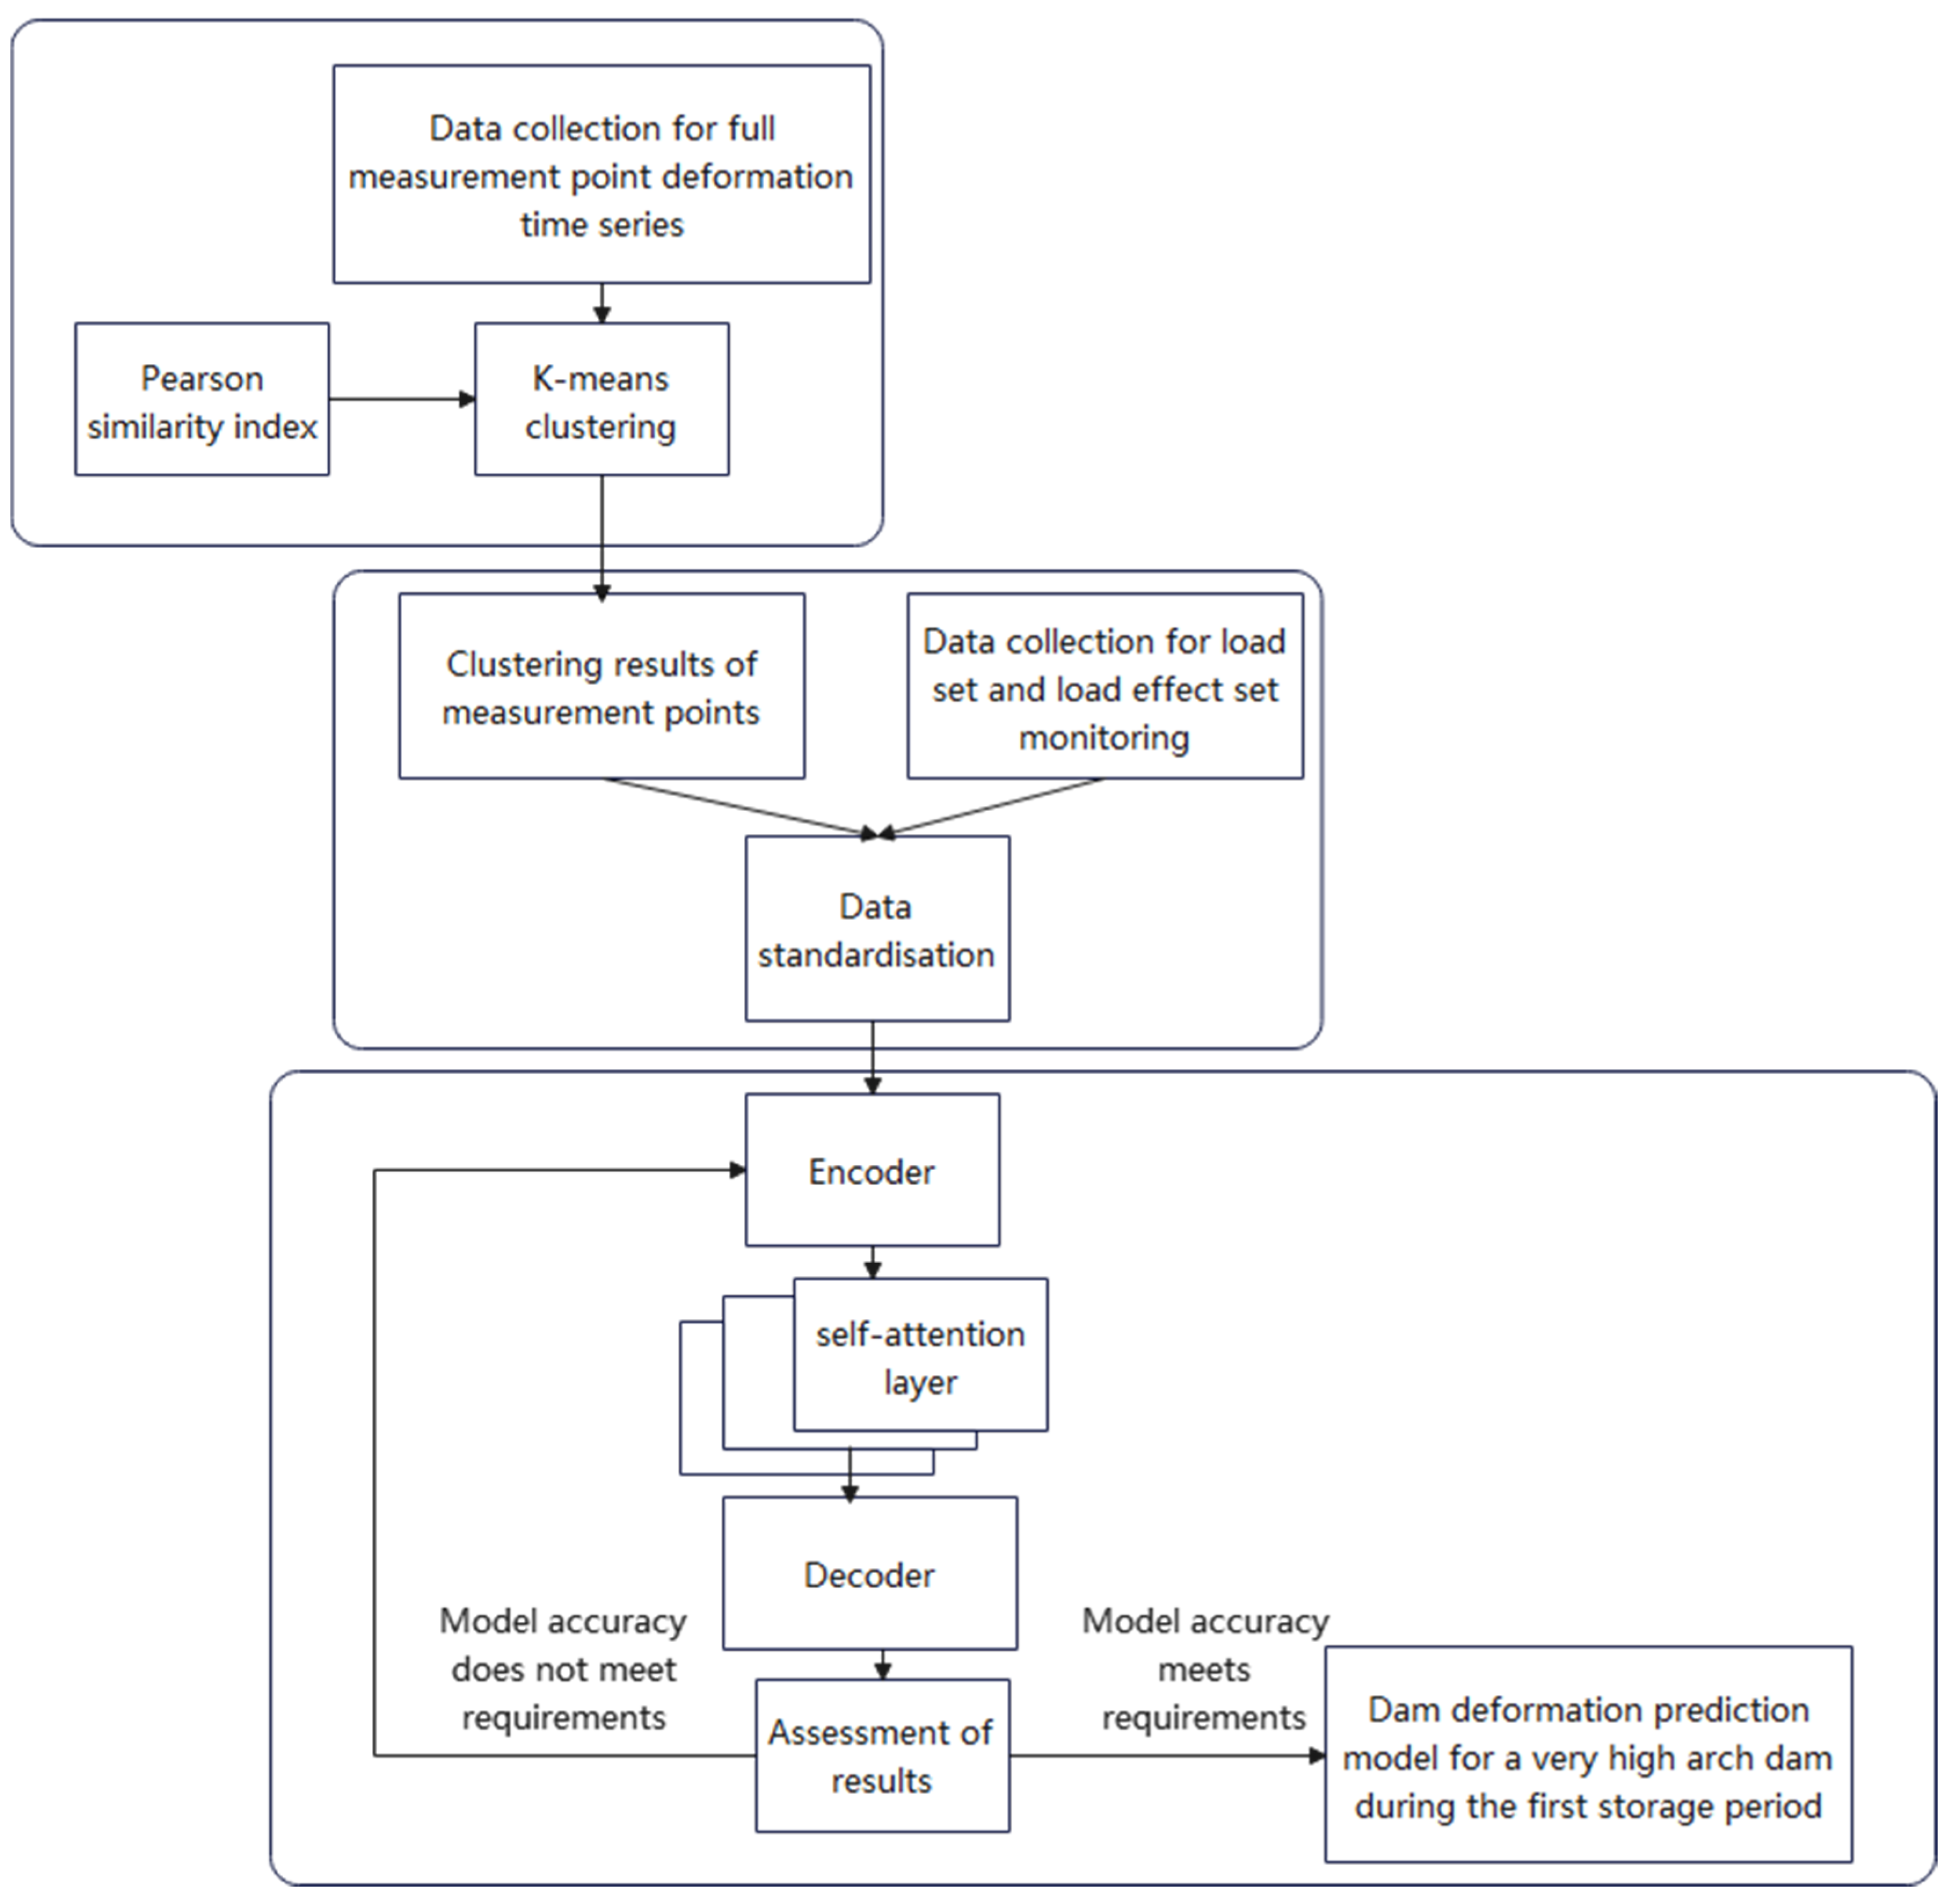
Figure 1. Process of establishing the PKMA model.
Water 15 01734 g001
Figure 4. Layout of normal plumb lines of Baihetan dam.
Water 15 01734 g004
Figure 5. Baihetan normal plumb line first impoundment time course curve. (Different colours represent the temporal process lines of deformation monitoring data at different measurement points).
Water 15 01734 g005
Figure 6. Thermometer arrangement of dam body.
Water 15 01734 g006
Figure 7. Thermometer arrangement of foundation.
Water 15 01734 g007
Figure 8. Temperatures of the dam body. (a) Measurements on 1 April 2021; (b) Measurements on 30 June 2021; (c) Measurements on 31 October 2021.
Water 15 01734 g008aWater 15 01734 g008b
Figure 9. Temperatures of the foundation. (a) Measurements on 1 April 2021; (b) Measurements on 30 June 2021; (c) Measurements on 31 October 2021.
Water 15 01734 g009aWater 15 01734 g009b
Figure 10. Upstream water level time series process line.
Water 15 01734 g010
Figure 11. Displacement clustering. (a) clustering Pearson index similarity, (b) clustering partition map, different colored boxes represent different clusters.
Water 15 01734 g011
Figure 12. Joint grouting zones of the Baihetan dam.
Water 15 01734 g012
Figure 13. Degree of model improvement.
Water 15 01734 g013
Figure 14. Selected foundation temperatures for PKMA models.
Water 15 01734 g014
Figure 15. Converging curve of the PKMA on Baihetan data. (a) Curve of PLdb7-4; (b) Curve of PLdb18-4; (c) The curve of PLdb28-3.
Water 15 01734 g015aWater 15 01734 g015b
Figure 16. Performance of the PKMA models. (a) Results of PLdb7-4; (b) Results of PLdb18-4; (c) Results of PLdb28-3.
Water 15 01734 g016aWater 15 01734 g016b
Figure 18. Prediction comparisons from different models. (a) Results of PLdb7-4; (b) Results of PLdb18-4; (c) Results of PLdb28-3.
Water 15 01734 g018aWater 15 01734 g018b
Figure 19. Locations of two groups of study targets. (a) Baihetan dam; (b) Xiluodu dam.
Water 15 01734 g019
Figure 20. Comparisons between pretraining and non-pretraining. (a) Pretraining results; (b) Non-pretraining results; (c) Pretraining results; (d) Non-pretraining results; (e) Pretraining results; (f) Non-pretraining results.
Water 15 01734 g020
Figure 21. Comparisons of the PKMA model performances. (a) Results of PLdb5-4; (b) Results of PLdb15-4; (c) Results of PLdb27-3.
Water 15 01734 g021aWater 15 01734 g021b
Table 1. Monitoring data of the Baihetan dam regarding various instruments from June 2022.
Monitoring TypesNumber of Monitoring InstrumentsNumber of Monitoring Data Values
Normal and inverted plumb lines5133,762
Observation piers located in the catwalk401360
Gallery benchmarks1628910
Table 2. Optimisation results of model hyperparameters from JAYA algorithm.
ModelHyperparameters
LSTMbatch size = 5, lr = 0.001
MAbatch size = 5, lr = 0.001, heads = 3
PKMAbatch size = 5, lr = 0.001, heads = 3
Table 3. Evaluation of the PKMA model performance on the testing set.
Measuring PointsRMSE (mm)MAE (mm)MSE (mm)
PLdb7-40.37110.50100.6092
PLdb18-41.10270.90171.2518
PLdb28-30.22960.41890.4792
Table 4. Model performance improvement rate.
ModelRMSE (mm)MAE (mm)MSE (mm)
PLdb7-4LSTM vs. PKMA40.58%68.97%64.69%
MA vs. PKMA4.79%11.57%9.35%
HST vs. PKMA57.59%72.42%82.01%
PLdb18-4LSTM vs. PKMA63.98%47.64%87.02%
MA vs. PKMA50.62%69.02%75.61%
HST vs. PKMA48.15%55.81%73.12%
PLdb28-3LSTM vs. PKMA31.72%45.61%53.38%
MA vs. PKMA10.28%11.86%19.50%
HST vs. PKMA12.66%5.69%23.71%
Table 5. Performance evaluations regarding different prediction models on the testing set.
ModelRMSE (mm)MAE (mm)MSE (mm)
PLdb7-4LSTM1.1650 1.35011.3573
MA0.7270 0.47370.5286
HST1.63231.51912.6643
PKMA0.6922 0.41890.4792
PLdb18-4LSTM3.1057 1.72209.6455
MA2.2656 2.91085.1330
HST2.15792.04044.6565
PKMA1.1188 0.90171.2518
PLdb28-3LSTM1.5639 1.81992.4457
MA1.1902 1.12301.4165
HST1.22261.04951.4947
PKMA1.0678 0.98981.1403
Table 6. Comparisons of errors of the PKMA models on the testing set.
Prediction TargetsModelRMSE
(mm)
MAE
(mm)
MSE
(mm)
PLdb5-4PKMA with pre-training parameters1.0941210.83391.1971
PKMA without pre-training parameters1.1554650.96191.3351
PLdb15-4PKMA with pre-training parameters1.0708410.83751.1467
PKMA without pre-training parameters1.1766480.99261.3845
PLdb27-3PKMA with pre-training parameters1.7400290.97453.0277
PKMA without pre-training parameters2.0255371.05754.1028
Disclaimer/Publisher’s Note: The statements, opinions and data contained in all publications are solely those of the individual author(s) and contributor(s) and not of MDPI and/or the editor(s). MDPI and/or the editor(s) disclaim responsibility for any injury to people or property resulting from any ideas, methods, instructions or products referred to in the content.