Article

Characterization of Evapotranspiration in the Orange River Basin of South Africa-Lesotho with Climate and MODIS Data

1
Department of Geography, University of the Free State, Qwaqwa Campus, Phuthaditjhaba 9866, South Africa
2
School of Agricultural, Earth and Environmental Sciences, University of KwaZulu-Natal, Westville Campus, Durban 4000, South Africa
3
Department of Geography and Environmental Studies, University of Zululand, KwaDlangezwa 3886, South Africa
*
Author to whom correspondence should be addressed.
Water 2023, 15(8), 1501; https://doi.org/10.3390/w15081501
Submission received: 15 February 2023 / Revised: 7 April 2023 / Accepted: 8 April 2023 / Published: 12 April 2023

Abstract

:
Evapotranspiration (ET) is crucial to the management of water supplies and the functioning of numerous terrestrial ecosystems. To understand and propose planning strategies for water-resource and crop management, it is critical to examine the geo-temporal patterns of ET in drought-prone areas such as the Upper Orange River Basin (UORB) in South Africa. While information on ET changes is computed from directly observed parameters, capturing it through remote sensing is inexpensive, consistent, and feasible at different space–time scales. Here, we employed the Moderate Resolution Imaging Spectroradiometer (MODIS)-derived spectral indices within Google Earth Engine (GEE) to analyze and characterize patterns of ET over the UORB from 2003 to 2021, in association with various climatic parameters. Our results show spatially consistent ET patterns with the Vegetation Condition Index (VCI), with lower values in the west, increasing toward the eastern section of the basin, over the Lesotho highlands. We noted that the UORB faced significant variability in ET and VCI during pronounced drought episodes. The random forests (RF) model identified precipitation, temperature, Standardized Precipitation Index (SPI)-6, Palmer Drought Severity Index (PDSI), and VCI as variables of high importance for ET variability, while the wavelet analysis confirmed the coherence connectivity between these variables with periodicities ranging from eight to 32 months, suggesting a strong causal influence on ET, except for PDSI, that showed an erratic relationship. Based on the sequential Mann–Kendall test, we concluded that evapotranspiration has exhibited a statistically downward trend since 2011, which was particularly pronounced during the dry periods in 2015–2016, 2019, and 2021. Our study also confirmed the high capacity of the GEE and MODIS-derived indices in mapping consistent geo-temporal ET patterns.

Graphical Abstract

1. Introduction

Terrestrial evapotranspiration (ET) is a key water-balance mechanism involving hydrological and energy cycles, resulting in the combined loss of surface water, soil moisture and plant water from the terrestrial landscape to the atmosphere [1,2]. ET plays a key role in controlling plant functions, climate behavior, and water management in soil-plant-atmosphere interactions [3]. ET is influenced by climatic conditions, landscape, vegetation type, soil properties and land-use management practices, making it a complex and highly variable parameter across spatial and temporal scales [4]. This is arguably one of the least understood surface water–atmosphere interactions, as it is difficult to measure [5], particularly in semi-dry to dry regions where much of the low and erratic rainfall is returned to the atmosphere via ET [6]. The difficulty in measuring ET partly lies in its invisibility compared to other directly quantifiable elements of the water cycle such as precipitation and runoff [7]. This is a serious concern, as Norman et al. [8] predicted a rise in the regularity, magnitude, and impact of droughts, even in areas that are rarely affected by droughts. For this reason, the accurate quantification of ET is a strategic constituent for agricultural monitoring and prediction, hydrological practices such as water-management planning, and supply and drought forecasting [9,10]. Nevertheless, this exercise necessitates a cost-effective and replicable method to monitor and inform water allocation in drought-sensitive regions.
While the estimation of ET is direct, using meteorological station and field data, it is difficult to determine its geospatial distribution over broader geographic scales [11]. Ground measurements are unavailable in some regions of the world and pose a challenge to monitoring ET accurately and continuously. To meet the need for place-based measurements, remote-sensing approaches, with their synoptic and consistent sampling capabilities, offer a flexible, practical, and unique way to retrieve space–time ET information [12] even from unreachable areas [13]. However, cloud cover in some regions poses a challenge in obtaining usable satellite data. Many of these methods were developed over the past three decades with some based on surface energy balance (SEB) [11]. These methods leverage thermal remote-sensing products and have been successful in mapping ET in heterogeneous landscapes with finer ground resolution [14]. Many aspects, including the type of application, image-resolution properties, remotely sensed and meteorological inputs, and the anticipated model’s merits and caveats [15], influence the choice of each method. In this study, we adopted the operational Simplified Surface Energy Balance (SSEBop; [16]) model freely accessible in the Google Earth Engine (GEE) cloud-based toolbox. While most remotely sensed datasets are freely accessible, some users encounter challenges related to computing resources, data storage, and geospatial software to process big data [17].
With the policy of remote-sensing open data along with the proliferation of satellite products, advances in computing technology, innovative systems have been developed to meet increasing application demands for storing, managing, processing, and analyzing earth observation data [18]. One such asset is the Google Earth Engine (GEE). We refer readers to Senay et al. [19], who implemented and assessed the SSEBop method over the United States on the GEE environment. They [19] found that the SSEBop method effectively described spatial ET variability by up to 90% in broader watersheds, although it had some limitations in broad hydroclimatic regions and required place-specific refinement of the model input variables. Recently, Ejaz et al. [20] integrated the Standardized Precipitation Evapotranspiration Index (SPEI) and the Vegetation Condition Index (VCI) for drought monitoring into the GEE and found that the SPEI correlates better with drought indices and is suitable for drought monitoring in the data-poor drier regions. These studies demonstrate the value and applicability of the GEE for monitoring land–water interactions around the world, even in under-studied regions.
The variations in ET have serious implications on water regimes, vegetation growth, and the ensuing regional climate patterns, especially in arid and semiarid regions [21]. The Orange River Basin (ORB) in South Africa is no exception to this effect, due to its high vulnerability to droughts, water stress and flooding, despite its contribution to the country’s economy, supplying water for irrigation and hydroelectric power [22]. More recently, Chisanga et al. [23] projected a temperature increase in the ORB. The country is naturally prone to drought and has been hit by a series of these sinister events over the last forty years [24]; the most extreme include those of 1982–1984, 1991–1992, 1994–1995, 2004–2005, 2008–2009, 2015–2016, and the 2018–2020 [25,26]. In similar regions (e.g., Yellow River Basin in China [21], Upper Rio Grande Basin in the USA [27]) concerted research efforts are being dedicated to understanding changes in ET and their attributions to climate and vegetation variability using remote-sensing products and land-surface models. However, the ORB region has received less research attention and the ET distribution is unknown, and this study addresses this limitation using open access remotely sensed data.
Here, we analyzed the time–space variability of the ET over the Upper Orange River Basin from 2003 to 2021 using the MODIS-derived ET products. We also analyzed patterns of the vegetation condition index (VCI) as well as climatic parameters in the corresponding period to establish causal influences. Our results are expected to provide insights to support water-management planning and ecological protection in the Upper Orange River Basin. The study period experienced a variety of climatic conditions, and the UORB presents an ideal experimental site for analyzing ET variations.

2. Materials and Methods

2.1. Study Area

We selected the Upper Orange Water Management Agency (UOWMA) covering almost 103,671 km2, as a case study to determine geo-temporal patterns of evapotranspiration between 2003 and 2021. The UOWMA is part of the Orange River Basin (ORB) shared by South Africa and Lesotho [28], the wider location of which is shown in Figure 1. The basin is drained by the Orange River, also known as the Senqu River in Lesotho, which is one of the largest rivers in southern Africa [29]. It rises in the Lesotho Highlands with an average flow of 4.73 km3 year−1 to South Africa and stretches more than 2300 km west into the Atlantic Ocean [23].

2.2. Satellite and Climate Data

To understand the evapotranspiration patterns, we the used the El Niño–Southern Oscillation (ENSO), a major inter-annual climate mechanism, which largely enhances precipitation and temperature conditions over southern Africa [30]. We followed several previous studies that have linked ENSO signals with evapotranspiration patterns. We obtained ENSO measured by the Niño3.4 index; a monthly averaged sea surface temperature (SST) anomalies over the tropical Pacific Ocean (5° N–5° S longitude; 120° W–170° W latitude) from the National Oceanic and Atmospheric Administration (NOAA) online portal (https://www.esrl.noaa.gov/psd/gcos_wgsp/Timeseries/, Washington, DC, USA; accessed 12 August 2022). We also used the dipole mode index (DMI) as a measure of climatic conditions [31]; computed by differencing the SST anomalies in the western (50° E–70° E; 10° S–10° N) and eastern (90° E–110° E; 10° S–0° N) over the Indian Ocean conditions [31]. We obtained DMI data from the Japan Agency for Marine-Earth Science and Technology (JAMSTEC) portal (http://www.jamstec.go.jp/frcgc/research/d1/iod/iod/dipole_mode_index.html; accessed 12 August 2022).
We further obtained the Moderate Resolution Imaging Spectroradiometer (MODIS)-derived operational Simplified Surface Energy Balance (SSEBop; [16]) product free from the Climate Engine Application (https://climateengine.com/research-app/; accessed 27 May 2022) to reconstruct ET patterns over the study area. This product provides monthly ET estimates from 2000 to present with a ground resolution of 1 km, and is based on the Simplified Surface Energy Balance (SSEB) methodology [16] with a distinctive parameterization for operative use. We also used the MOD16A2.006: Terra Net Evapotranspiration 8-Day Global data product within the GEE to generate annual composites of ET over the study period. We then extracted a 4 km Potential Water Deficit (PWD), temperature and soil moisture monthly data from the TerraClimate dataset that is publicly available from the Climate Engine Application.
We employed the Climate Hazards Group Infrared Precipitation with Station data (CHIRPS) developed by the United States Geological Survey (USGS), a unique global precipitation data combination of 5000 m resolution satellite product and in situ station data, to produce gridded near real-time precipitation time series (since 1981) that have been publicly available since 2014 [32]. We selected this high-resolution data based on Katsanos et al. [33], who found a good agreement between CHIRPS and rain gauges compared to TRMM estimates that tend to overestimate precipitation. Also, we build on the successful application of CHIRPS to derive the Standardized Precipitation Index (SPI; [34]) for ET mapping by Gao et al. [35]. SPI is an index of precipitation anomalies, which is calculated by transforming the accumulated precipitation from its original distribution (usually gamma or Pearson Type III) to the normal distribution with zero mean and unit standard deviation. The index is typically computed based on aggregated precipitation data over different time periods, commonly at 3, 6, and 12 months (See Guenang and Kamga [36] for more details). Here, we computed SPI-6 and SPI-12, as these are widely used to characterize precipitation anomalies.
Lastly, we used the MODIS-derived 250 m resolution (MOD13Q1 version 6) vegetation product collection with a 16-day revisit cycle from the Google Earth Engine (GEE) to calculate monthly vegetation condition index (VCI) composites. The analysis-ready vegetation product MOD13Q1 is derived from the atmospherically corrected bi-directional surface reflectance masked for water, clouds, heavy aerosols, and cloud shadows. We calculated the VCI using the ratio of the NDVI, and its minimum and maximum values as shown in Equation (1).
VCI = 100 NDVI   NDVI min NDVI max NDVI min
In this sense, the VCI proves to be a better indicator for monitoring water stress than the NDVI, since it normalizes the NDVI and separates the long-term ecological signal from the short-term environmental signal [37]. The VCI values range between 0 and 100%, with minimum values representing very unfavorable vegetation conditions and maximum values representing healthy vegetation.

2.3. Methods

2.3.1. Pearson Correlation

We performed Pearson correlation (r) analysis in R environment to establish the relationship between evapotranspiration and various climate variables. This is a normalized measure of covariance, and so, its value always ranges from −1 to 1, where −1 denotes a strong negative linear correlation and 1 denotes a strong positive linear correlation [38]. When r = 0, there is no linear correlation between the two variables.

2.3.2. Variable Contribution

Random forests (RF; [39]) is the most popular ensemble learning method for classification and regression that combines the results of multiple decision trees with exceptional tolerance for outliers and noise [39]. RF measures the decrease in node impurities with the Gini index to determine which variable contributes to node homogeneity. Following Wu et al. [40], we ranked the importance of climate variables to evapotranspiration using RF. Often, important variables would be included in node creation, resulting in significant decreases in node impurities [41]. We used the decrease in node impurities measured by the Gini index for this purpose. The variable with the highest Gini index was considered the most important compared to the other input variables.

2.3.3. Multiple Linear Regression (MLR)

We applied MLR, a widely used statistical technique to model the linear relationship between the independent variables and one dependent variable as an extension of ordinary least squares regression because it includes more than one explanatory variable [42]. In our case, the independent variables are precipitation, temperature, soil moisture, VCI, SPI-6, SPI-12, Niño, DMI and PWD while the dependent variable is ET. An advantage of this method is the easy interpretation of the coefficients, which are generated in the model with low computational effort, in comparison to more complex techniques, such as energy balance methods and artificial intelligence algorithms. The MLR model is calculated as:
y i = β 0 + β 1 x i 2 + + β p x i p + ε i
where yi is the dependent variable is ET, xip represents the independent variables, β0 is the intercept, and β1, β2, … βp are the coefficients of the x terms. The term εi represents the error term, which the model always attempts to reduce.

2.3.4. Sequential Mann–Kendall (SQ-MK)

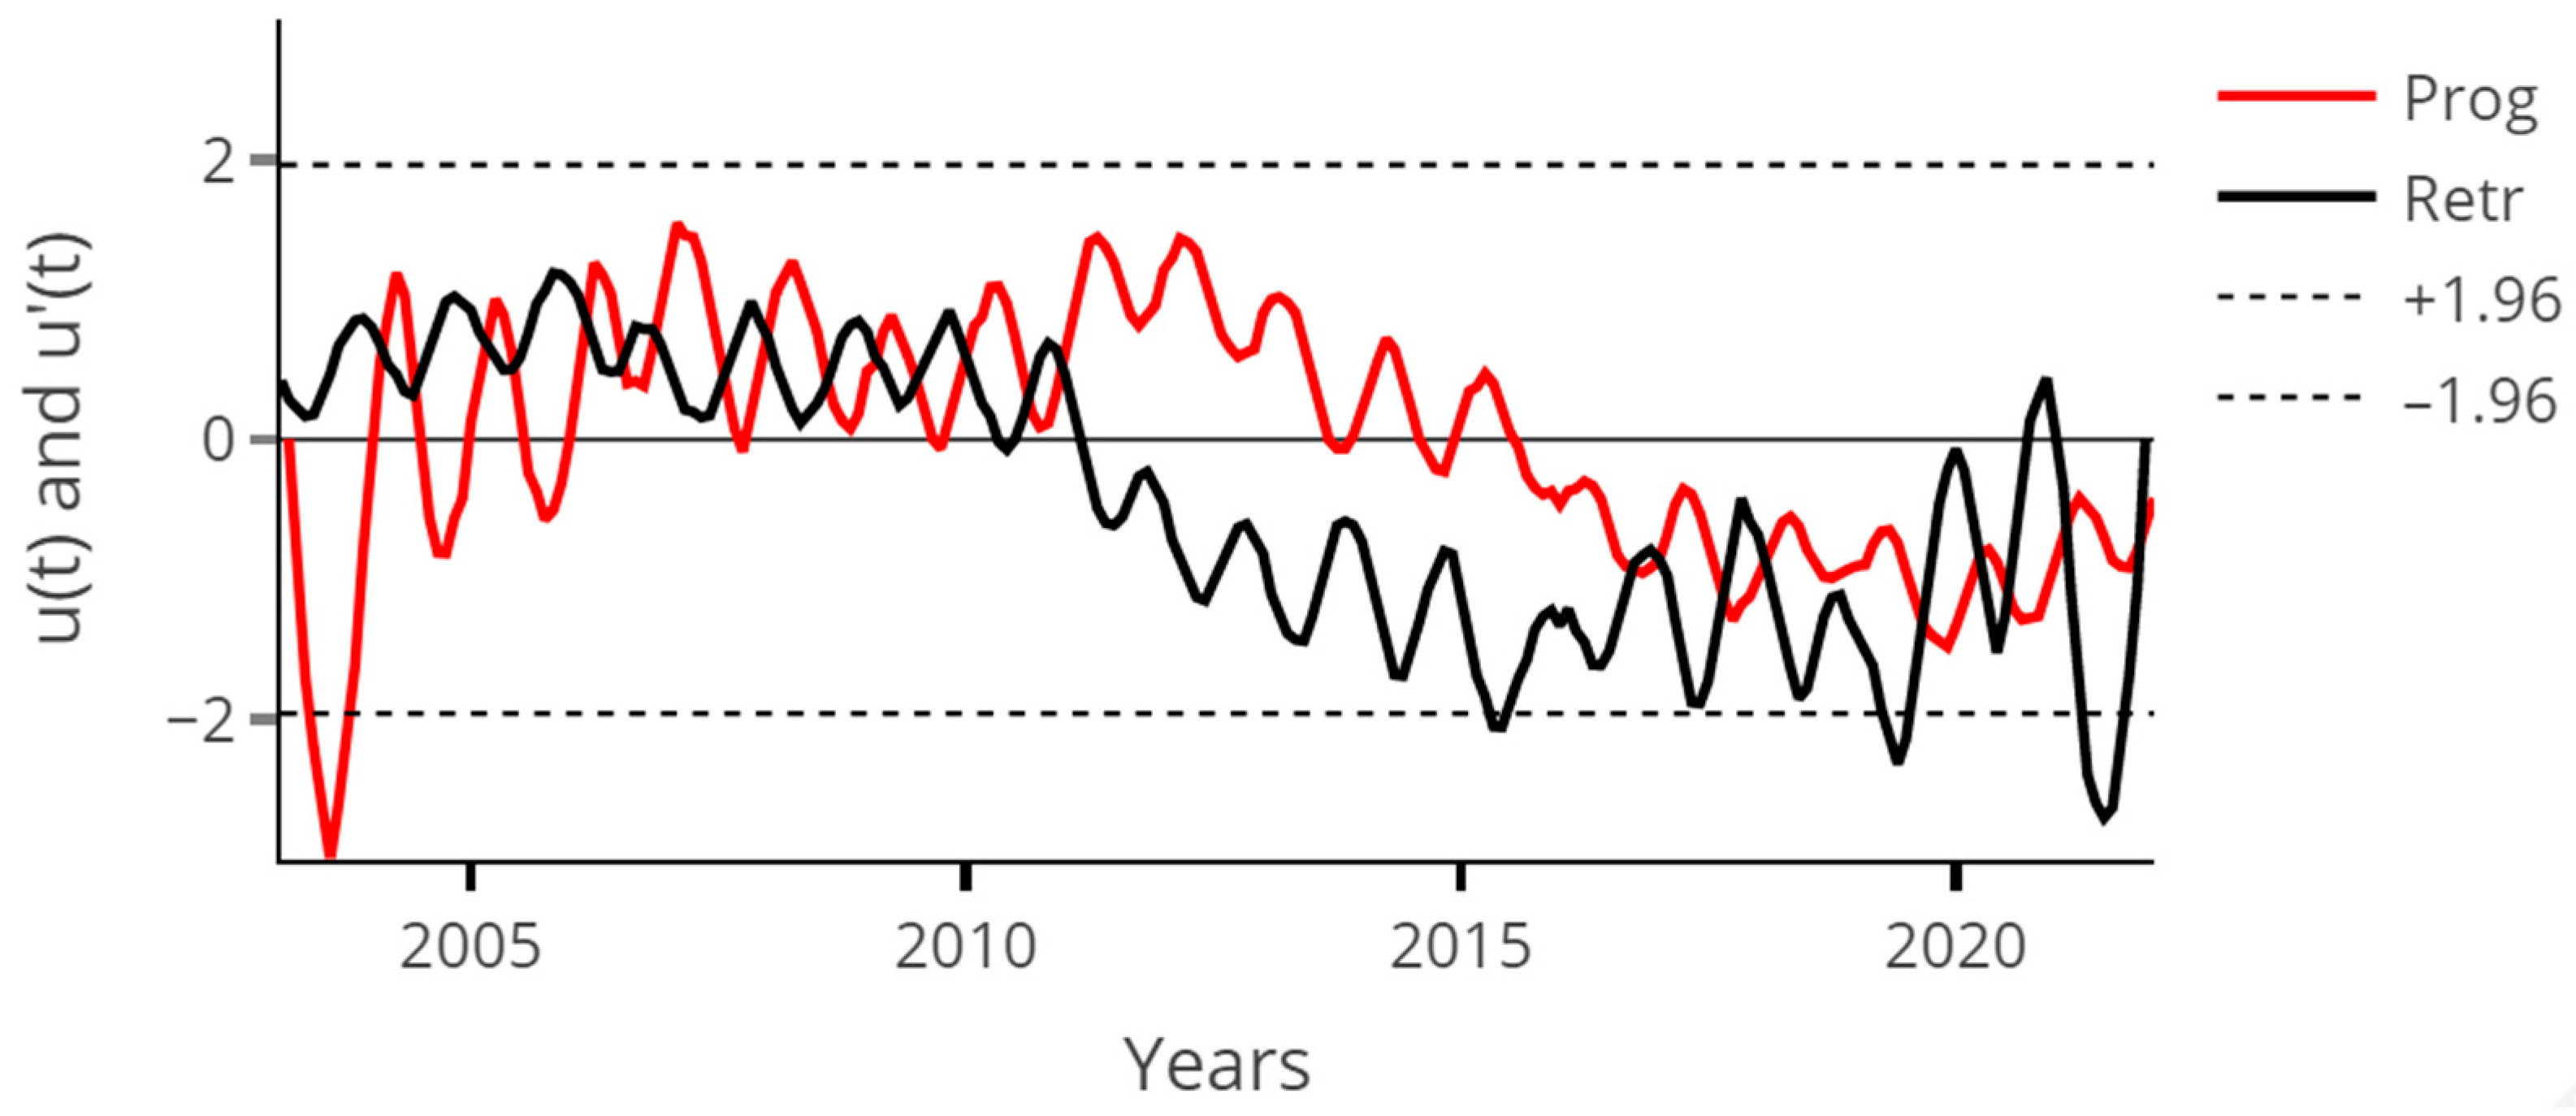
We used Sequential Mann–Kendall (SQ-MK), a variant of the Mann–Kendall trend method proposed by Sneyers [43], to detect approximate potential trend turning points in long-term time series. SQ-MK generates two time series, one forward/progressive ( u ( t ) ) and one backward/retrograde ( u ( t ) ). To use the effectiveness of this trend-detection method, both the progressive and retrograde time series must be plotted in the same figure. When they cross and diverge beyond a certain threshold (±1.96 in our case), a statistically significant trend is present. The area in which they cross indicates the period in which the trend change point begins [44]. Essentially, this method is calculated by using the ranked values of y i of a given time series ( x 1 ,   x 2 , x 3 , , x n ) in the analyses. The magnitudes of y i ,     ( i = 1 ,   2 ,   3 , ,   n) are compared with y i ,   ( j = 1 ,   2 ,   3 , ,  j − 1). For each comparison, the number of cases in which y i > y j are counted and then donated to n i . The statistic t i is then defined by the following equation:
t i = j = 1 i n i
the mean and variance of the statistic t i are given by:
E ( t i ) = i ( i 1 ) 4
and
Var ( t i ) = i ( i 1 ) ( 2 i 5 ) 72
finally, the sequential values of statistic u ( t i ) which are standardized and calculated using the following equation:
u ( t i ) = t i E ( t i ) Var ( t i )
This equation yields a forward sequential statistic, commonly referred to as a progressive statistic. To compute the backward/retrograde statistic values ( u ( t i ) ), the same time series   ( x 1 ,   x 2 , x 3 , , x n ) is used, but the statistics values are calculated by starting from the end of the time series. The combination of the forward and backward sequential statistics allows for the detection of the approximate beginning of a developing trend. In addition, we used a 95% confidence level here, which means that the critical cutoffs are ±1.96. This method has been used successfully in studies to detect trends in temperature [45] and precipitation [46].

2.3.5. Wavelet Coherence (WTC)

In this study, the wavelet-coherence technique, a bi-variate framework which is normally used to study the teleconnection between different time series and their evolution over time and frequency space was used [47]. This technique is designed to also show the cross-wavelet spectrum regions with high spectral power, and it reveals information about the phase relationship between the two independent time series. To extract the wavelet coherence, the first step is to perform the continuous wavelet transforms (CWT) of the given time series, which when done transforms the time domain to frequency space. In general, there are several types of wavelets, in which the choice of the wavelet function is determined by the data series, where for geophysical data, the Morlet wavelet function has been shown to perform much better than others [47,48,49]. Thus, the CWT [Wn(s)] for a given time series (xn, n = 1, 2, 3, …, N) with respect to wavelet Ψ0 (η) is defined as:
W n X ( s ) = n 1 n 1 X n Ψ * [ ( n n ) s δ t ]
where s is the wavelet scale, n′ is the translated time index, n is the localized time index, and Ψ* is the complex conjugate of the normalized wavelet. δt is the uniform time step to calculate the wavelet power, the CWT is squared such that |Wn (n)|2. Moreover, this research opted to estimate the CWT statistical significance at a 95% confidence level against a red noise model [47,48,49].
In this study, the wavelet coherence was calculated to quantify the relationship between evapotranspiration and meteorological parameters, evapotranspiration and SPI-6, and evapotranspiration and PDSI. Following Grinsted et al. [49], for any two-time series of X and Y, with different CWT W n X ( s ) and W n Y ( s ) values, the cross-wavelet transform W n x y ( s ) is given by:
W n X Y ( s ) = W n X ( s ) W n Y * ( s )
where “*” represents the complex conjugate of the Y time series. The output of the above equation can give the wavelet coherence which is a measure of the intensity of the covariance of the two-time series in a time–frequency domain. The additional step in this process which is important is to calculate the phase difference between the two-time series. This is done by estimating the mean and confidence interval of the phase difference of the two-time series. On interpreting the phase relationship between two time series, this study utilized the method by Grinsted et al. [49], where a circular mean of the phase-over regions with relatively high statistical significance that are inside the cone of influence (COI) to quantify the phase relationship between any two independent time series was plotted. Mathematically, the mean circulation of a set of angles (ai, i = 1, 2, 3, …, n) can be defined by the following equation:
a m = arg ( X , Y )   with   X = i = 1 n cos ( a i )   and   Y = i = 1 n sin ( a i )
and the wavelet coherence between two independent time series, as defined by Grinsted [49] can be calculated using the following equation:
R n 2 ( s ) = | S ( s 1 W n X Y ( s ) ) | 2 S ( s 1 | W n X ( s ) | 2 ) × S ( s 1 | W n Y ( s ) | 2 )
where the parameter S is the smoothing operator defined by S(Wn(s)) = Sscale(Stime(Wn(s))). The parameter Stime represents the smoothing in time. More details about the theory of wavelet analyses can be found in these following studies [47,48,49].

3. Results

Our immediate interest in this work was to characterize the time–space variability of evapotranspiration and the drought mechanism as a potential forcing, followed by the relationship of various parameters and their importance in evapotranspiration, before performing a wavelet analysis of evapotranspiration with the most influential variable.

3.1. Characteristics of Drought over South Africa

The El Niño–Southern Oscillation (ENSO) is a widely used index to describe the key elements of climate variability. In southern Africa, precipitation variability is closely linked with land-temperature extremes, with rather drier drought conditions prevailing during the strong El Niño phase [50]. A series of El Niño-driven droughts has been typical in South Africa over the study period, the most pronounced being in 2004–2005, 2008–2009, 2015–2016 and the most recent in 2018–2020 [25,26]. Numerous studies (e.g., Meza [51], Yan et al. [52]) have shown that ENSO can cause variations in the water balance, and thus in evapotranspiration. In Maipo River basin in Chile, Meza [51] found ENSO resemblance on evapotranspiration patterns as well as on water demands.
We also reconstructed SPI-6 and SPI-12 as an independent index for characterizing drought events, and the results are shown in Figure 2. SPI-12 appears to have an ENSO-like configuration, while SPI-6 is much more variable (see Figure 2 and the Supplementary Materials), confirming the sensitivity of SPI-12 to the ENSO signal. While this distinction is clear from a graphical perspective, the correlations of these variables are elaborated in Section 3.3 and their relationship to evapotranspiration is quantified. The response of SPI-12 to the ENSO signal abnormal wetness and mild to strong positive ENSO signal indicate that this index could be used to characterize drought over the study area.

3.2. Temporal Characteristics of ET, Precipitation and VCI

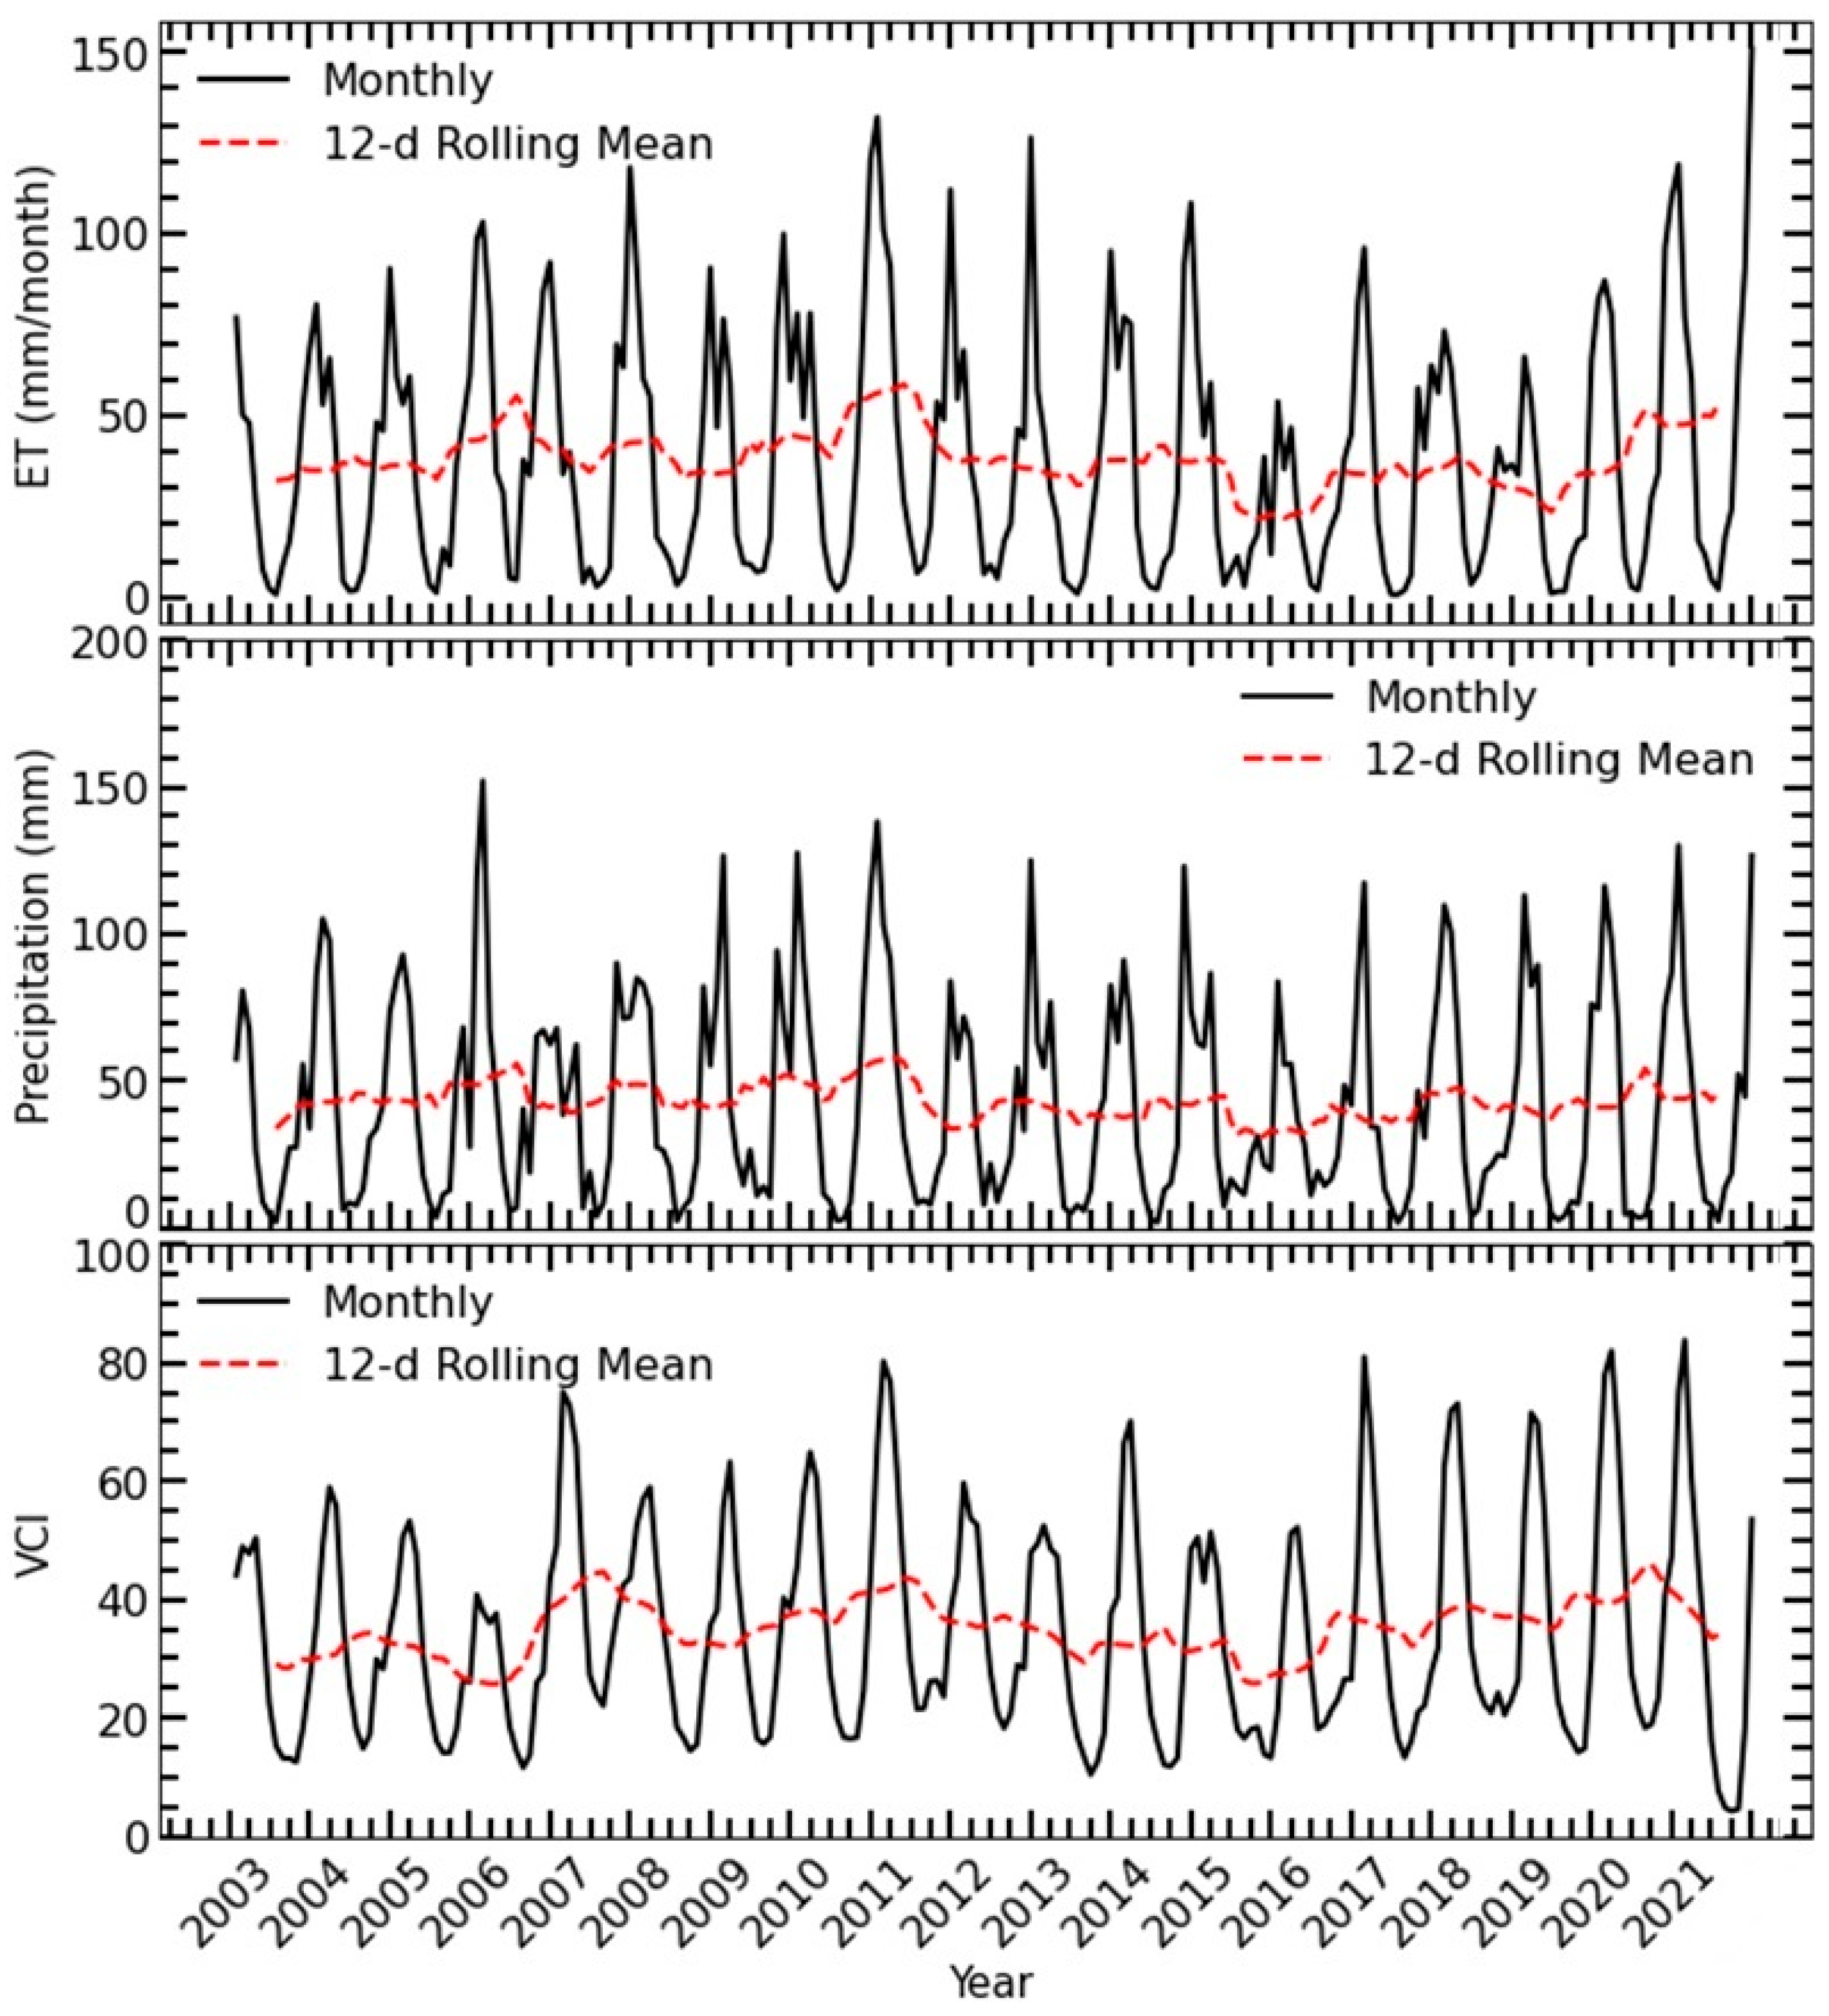
The time variation of ET, precipitation and VCI from 2003 to 2021 over the Upper Orange River Basin is shown in Figure 3. In general, our results show remarkably large temporal variability of evapotranspiration, with a spiky seasonal tendency; an overall configuration almost like ENSO signals and SPI-12 (Figure 2). This pattern is also well coincident with precipitation and VCI (Figure 3), showing a broader wave-like structure. The period 2003 had lower ET and VCI values (possibly affected by the mild-drought event) that improved toward 2006, and dropped until 2011, where they reached a peak, after which a decrease is noticeable, reaching the lowest points during the 2015–2016, and improvement is notable until 2021. These results are consistent with extreme drought events over the studied period. In a similar work, Senay et al. [53] found that the dry years had a lower evaporation while the wet years had high, and reaffirmed the reliability of the SSEBop evapotranspiration for drought monitoring. These conditions typically prevail through the mature El Niño phase when the SSTs are warmer than normal [54]. The strength of El Niño phase in the semi to dry parts of southern Africa enhance drier conditions that affect vegetation health [30]. Our results showed that ET and ENSO exhibited consistent cycles over the study period.

3.3. Spatial Characteristics of ET and VCI over the UORB

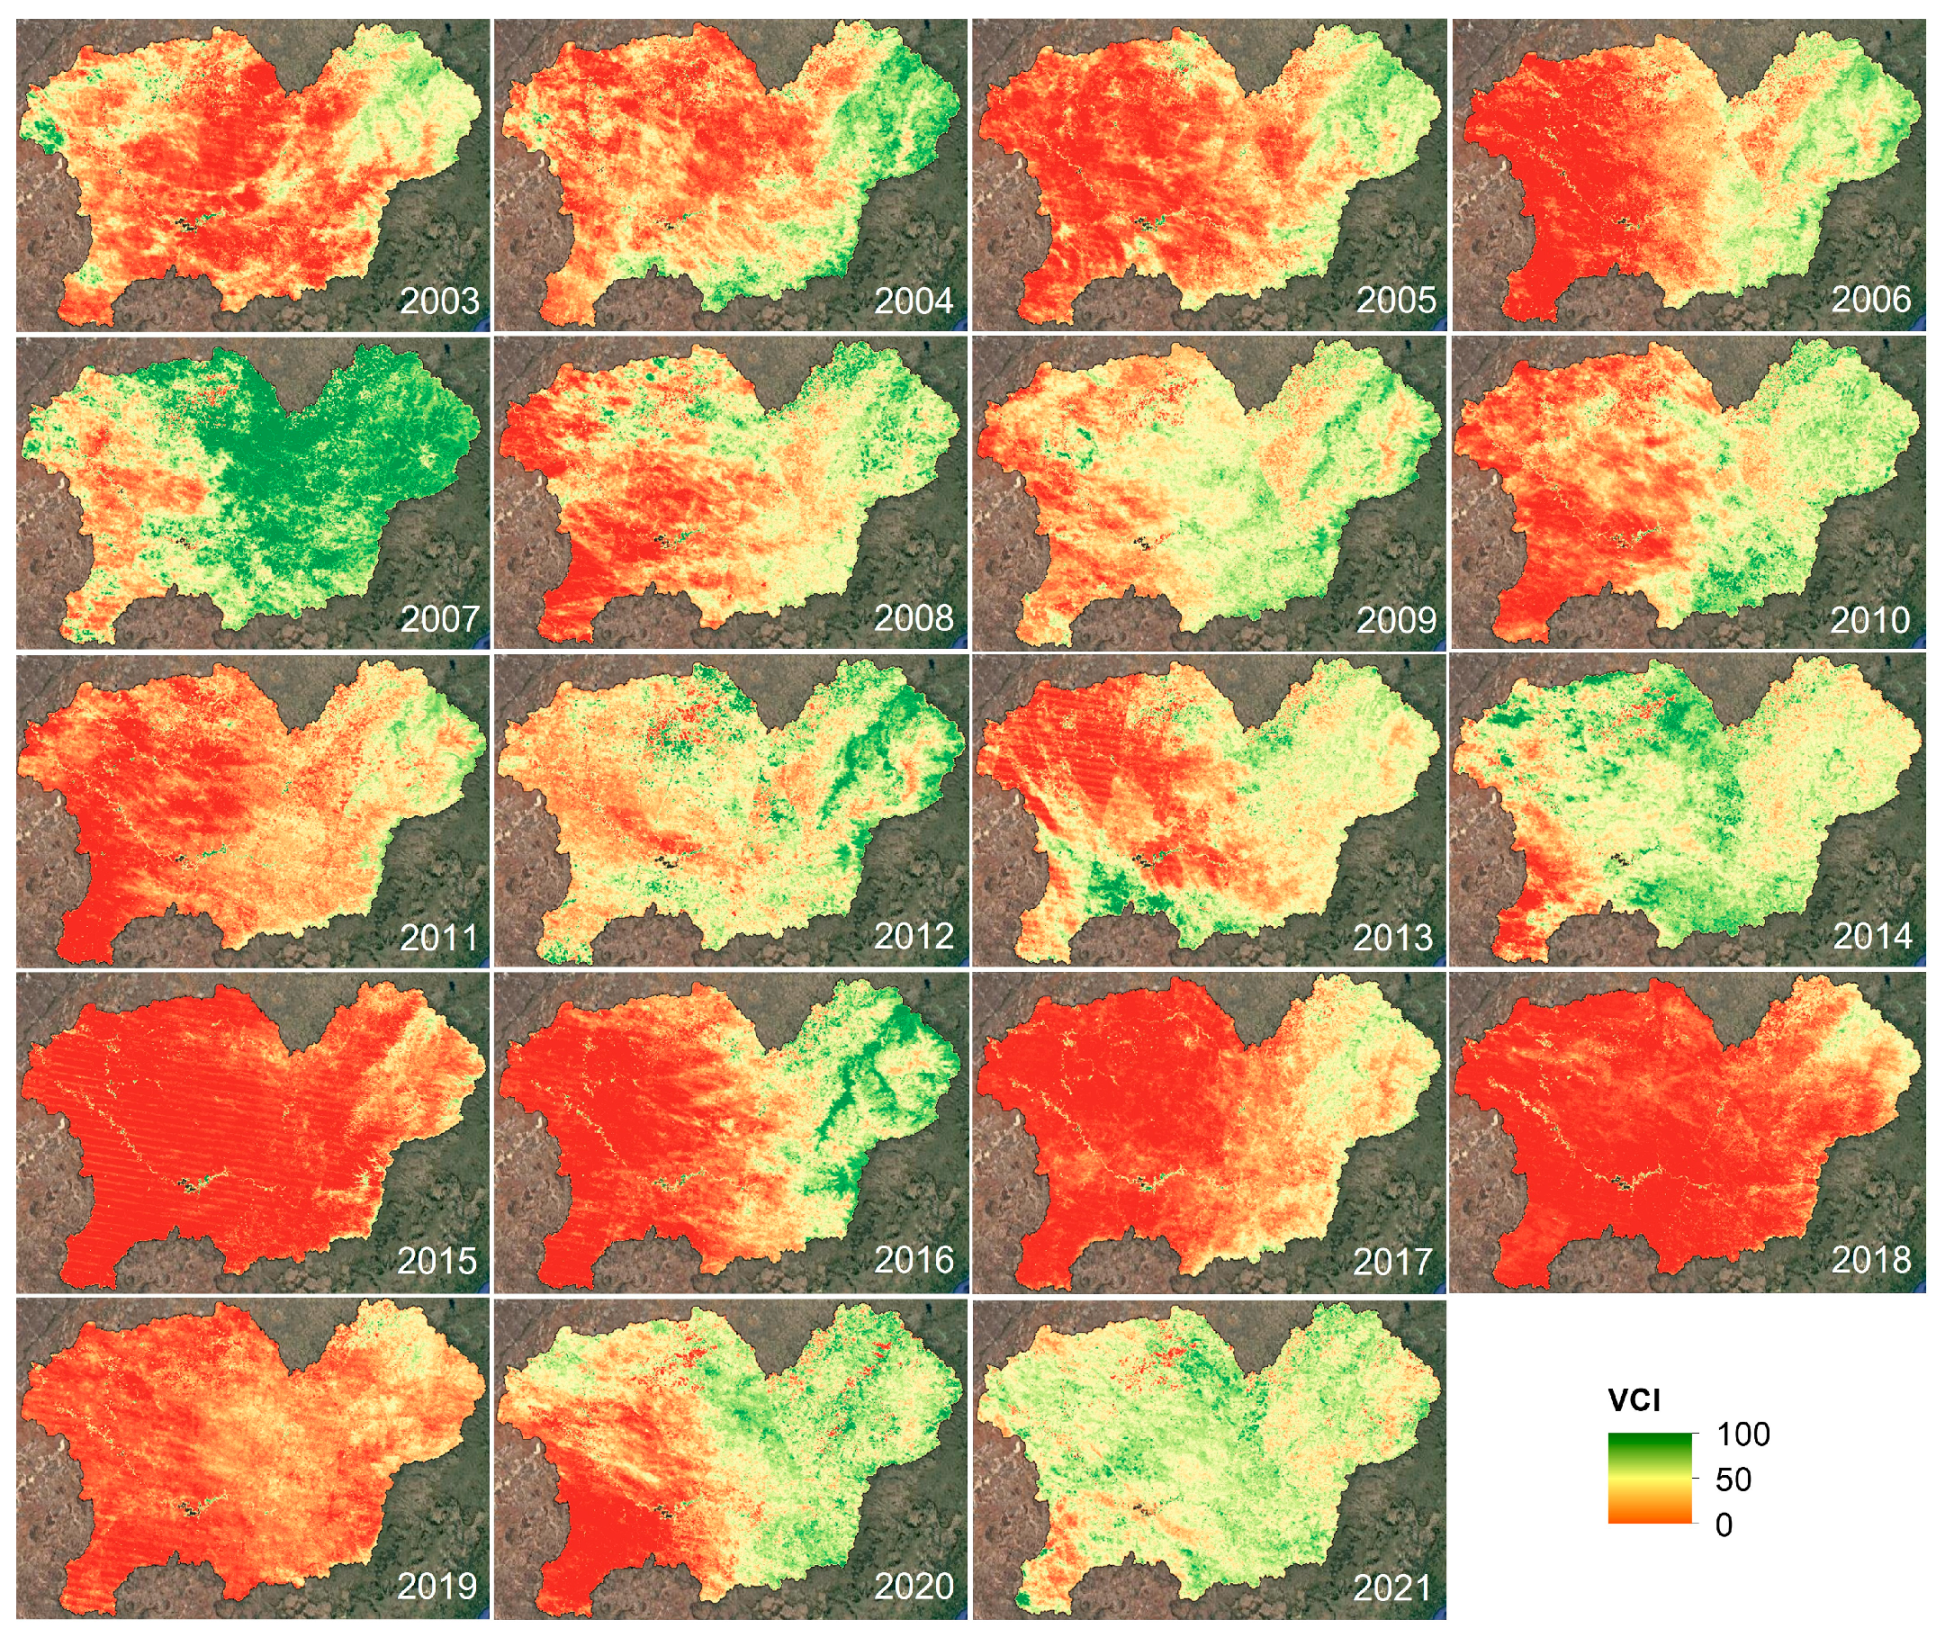
The geo-temporal patterns of ET and VCI over the UORB are shown in Figure 4 and Figure 5, respectively. As shown in these figures, there are obvious similarities between the ET and the VCI configurations. The western section of the UORMA appears to have generally lower ET and VCI values, while the eastern section over the highlands of Lesotho has greater ET values and better vegetation conditions. We observed the spread of better VCI conditions across the UORMA in 2007, 2012, 2014, and 2021 (Figure 5), accompanied by higher rainfall in 2006–2007, 2011–2012 and 2021 (Figure 3), which probably even spread to drier sections of the study area. However, the pattern of change in VCI values is different in other years with increased precipitation, and it is still unclear whether other factors are influencing VCI values. Our results seem to suggest that the spatial characteristics of VCI were affected by drier drought conditions, and low VCI values during marked drought events. For example, the drier period of 2003–2005 shows strong browning from east to west of the study area, although this pattern consolidated in the western central in 2006—suggesting a spillover effect. Notably, our results showed the lowest overall VCI values in 2015, covering almost the whole study area, corresponded with the strongest drought event over the study period and resulted in what is probably the hottest year on record. Similarly, we observed reduced evapotranspiration over Lesotho in the eastern part of the UORB in 2003, 2015 and 2019 and 2020, while 2006 showed the highest evapotranspiration exceeding 120 kg/m2/8day.
Given these results, the question remains of how the evapotranspiration tendency associates with the selected climate variables and the vegetation condition index. The next section is devoted to answering these questions through correlation and multiple linear regression analysis.

3.4. Correlation Analysis between Various Parameters

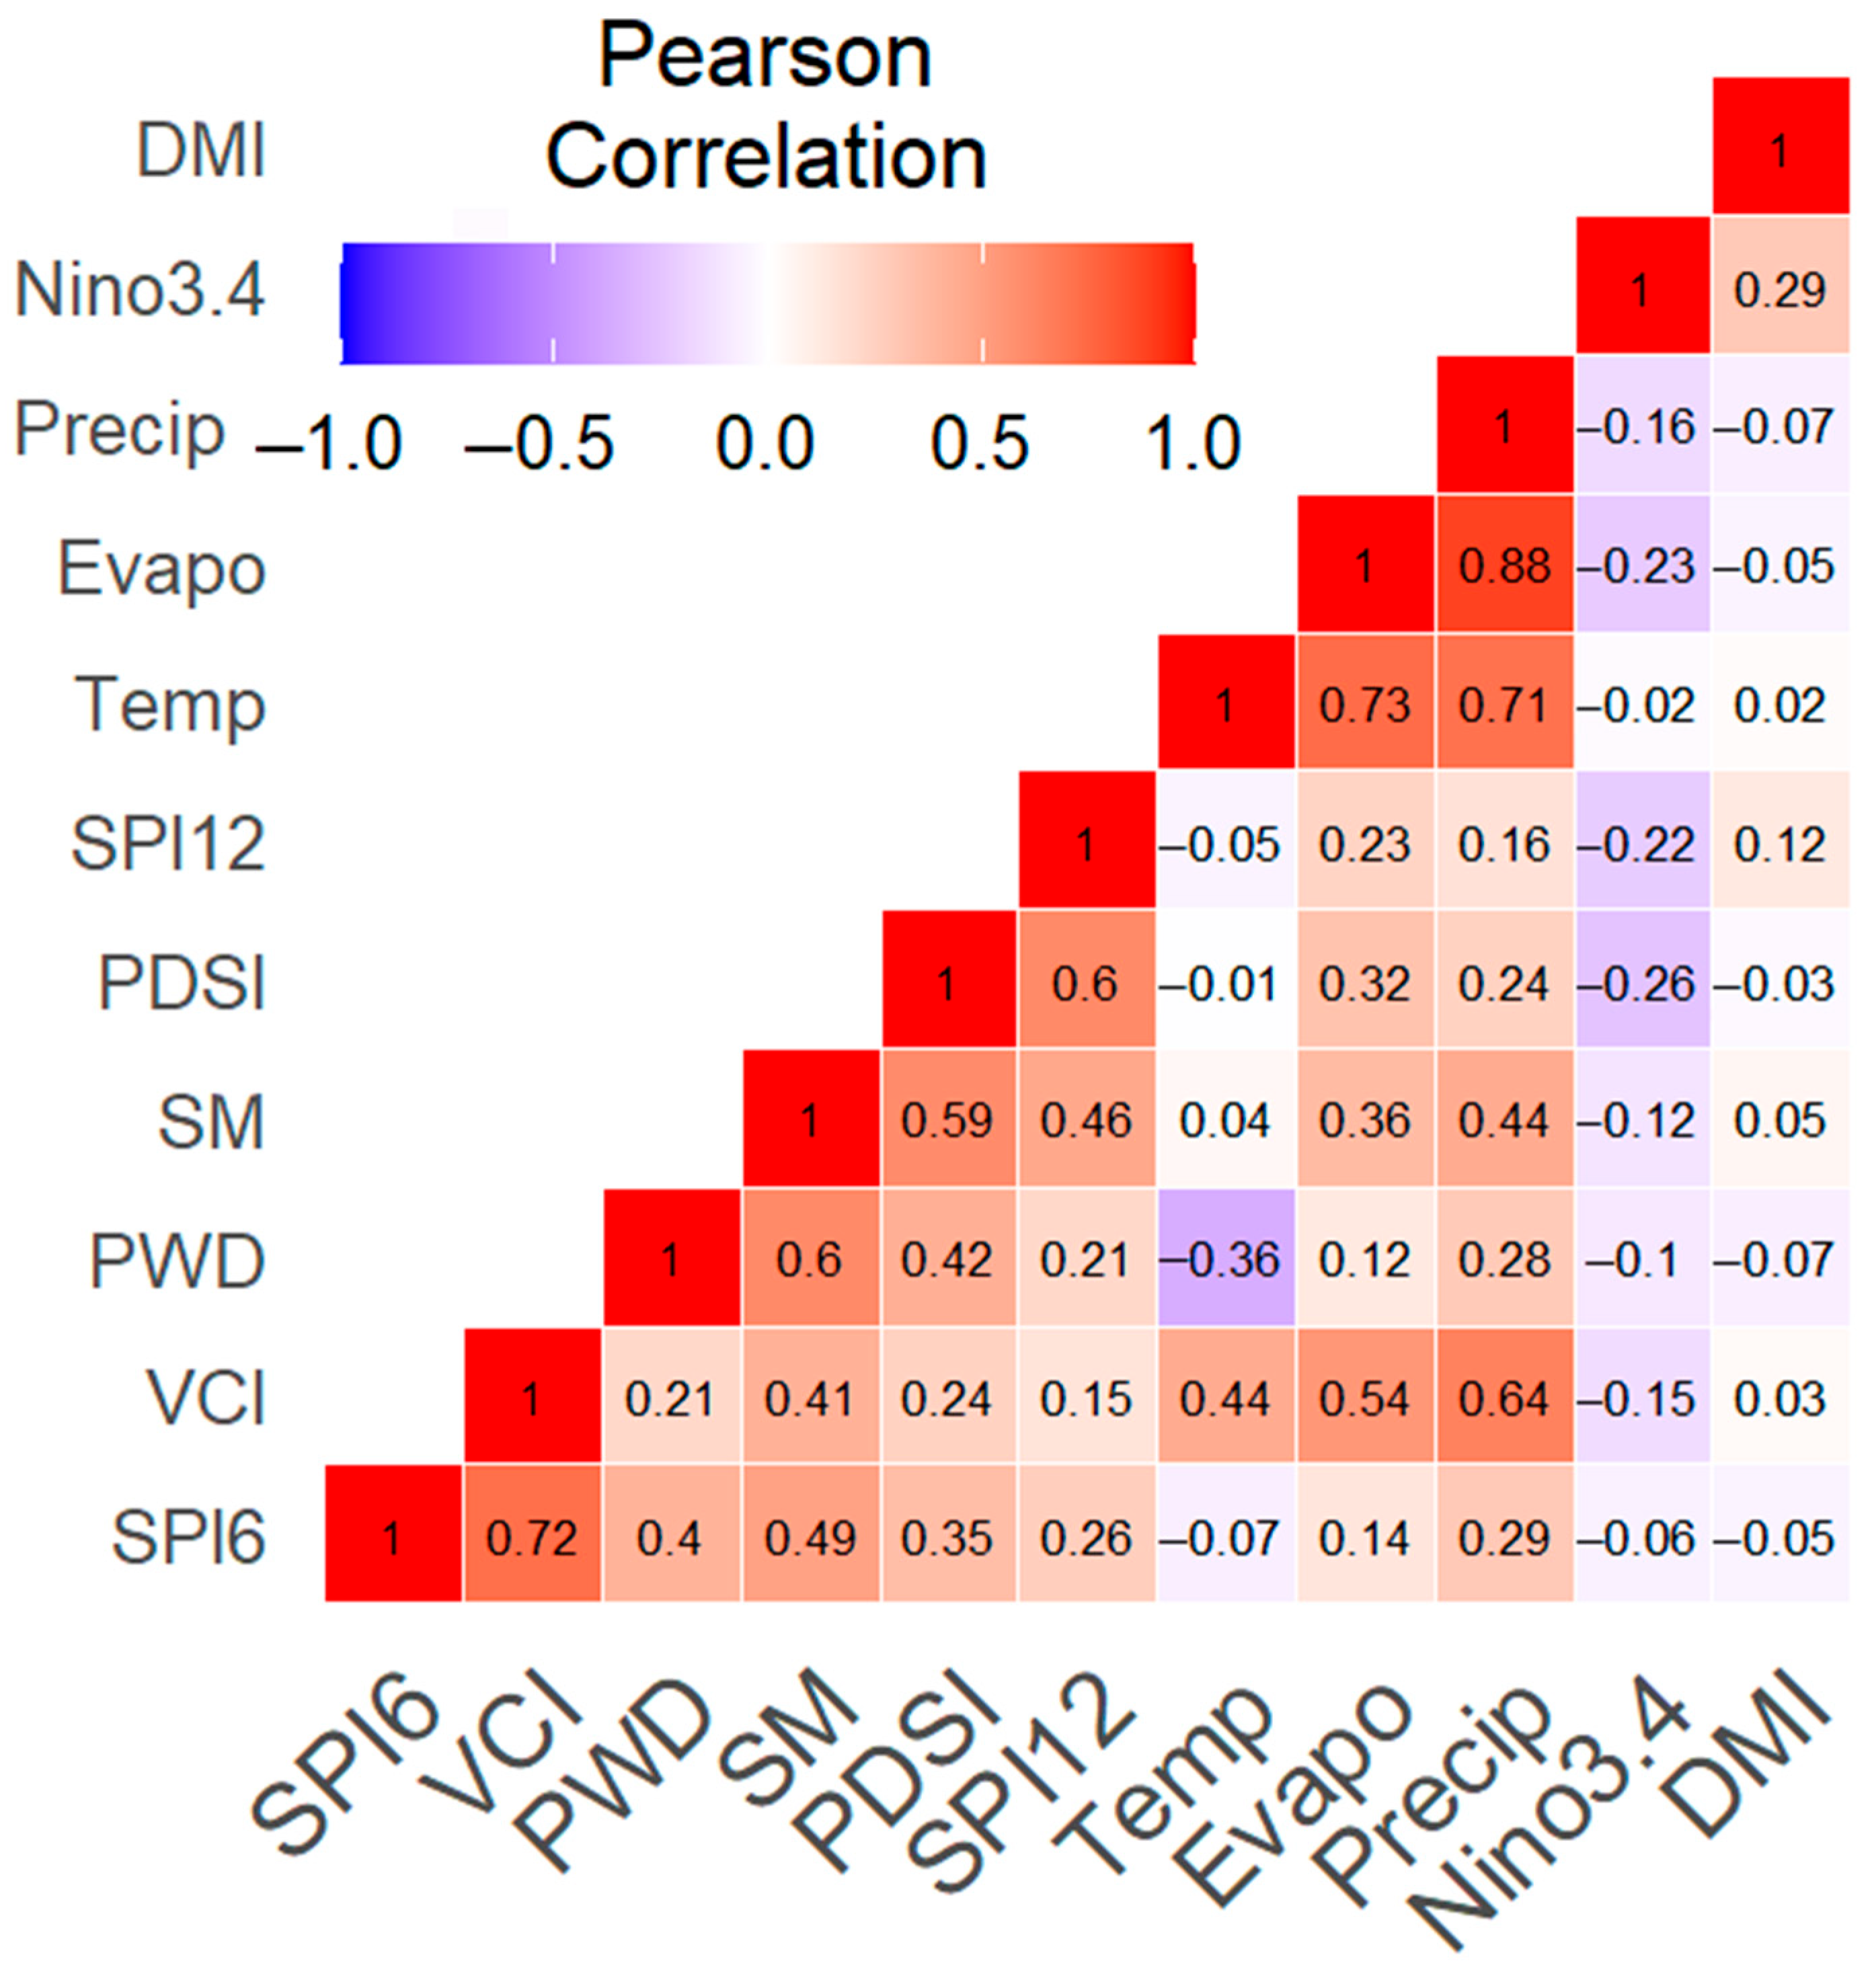
As it is known that some parameters are more closely related than others, we performed the Pearson correlation analysis to establish these associations, as shown in Figure 5. In so doing, we found precipitation to have a strong correlation (r = 0.88) with evapotranspiration, followed by temperature (r = 0.73) and the VCI (r = 0.54). Of interest also are the strong correlations of VCI with SPI-6 (r = 0.72) as well as with precipitation (r = 0.64) (Figure 6). We also note stronger correlation between SPI-12 and PDSI (r = 0.6) and soil moisture (r = 0.46). On the other hand, we found evapotranspiration to negatively correlate with Niño signal (r = −0.23) and so was temperature with PWD (r = −0.36).
Next, we tested the strength of the multiple linear regression (MLR) between evapotranspiration (ET) and various climate variables and the VCI, and the findings are summarized in Table 1. In this table, parameters with significant influence on the ET time series are indicated with an asterisk. The more asterisks, the stronger this significance. Based on the p-value statistic, our results showed that temperature, precipitation, and SPI-6 had a significant relationship with ET, with p-values of 1.76 × 10⁻⁷, 2.25 × 10⁻⁵, 0.000183, respectively. This is followed by the VCI (p-values = 0.002923), PDSI (p-values = 0.001561), and to lesser degree with SPI-12 (p-values = 0.015813). Our results showed no significant relationship with evapotranspiration with Niño, DMI, PWD, SM (Table 1). While this may seem less likely, there is no way to rule out the possibility of such converse relationships based on this observed correlation. A detailed analysis of teleconnections in weather and climate data and their relative contribution to regional anomalies can be found in a study by Kretschmer et al. [55].

3.5. Variable Contribution to ET

As is standard in several similar studies, we further evaluated the importance of various parameters (precipitation, temperature, soil moisture, VCI, SPI-6, SPI-12, Niño, DMI and PWD) to evapotranspiration based on the RF variable importance model; the result is shown in Figure 7. As expected, precipitation is the most important feature of the ET, followed by temperature, SPI-6, PDSI and VCI. It is noteworthy that all these parameters are key to characterizing drought and evapotranspiration patterns.
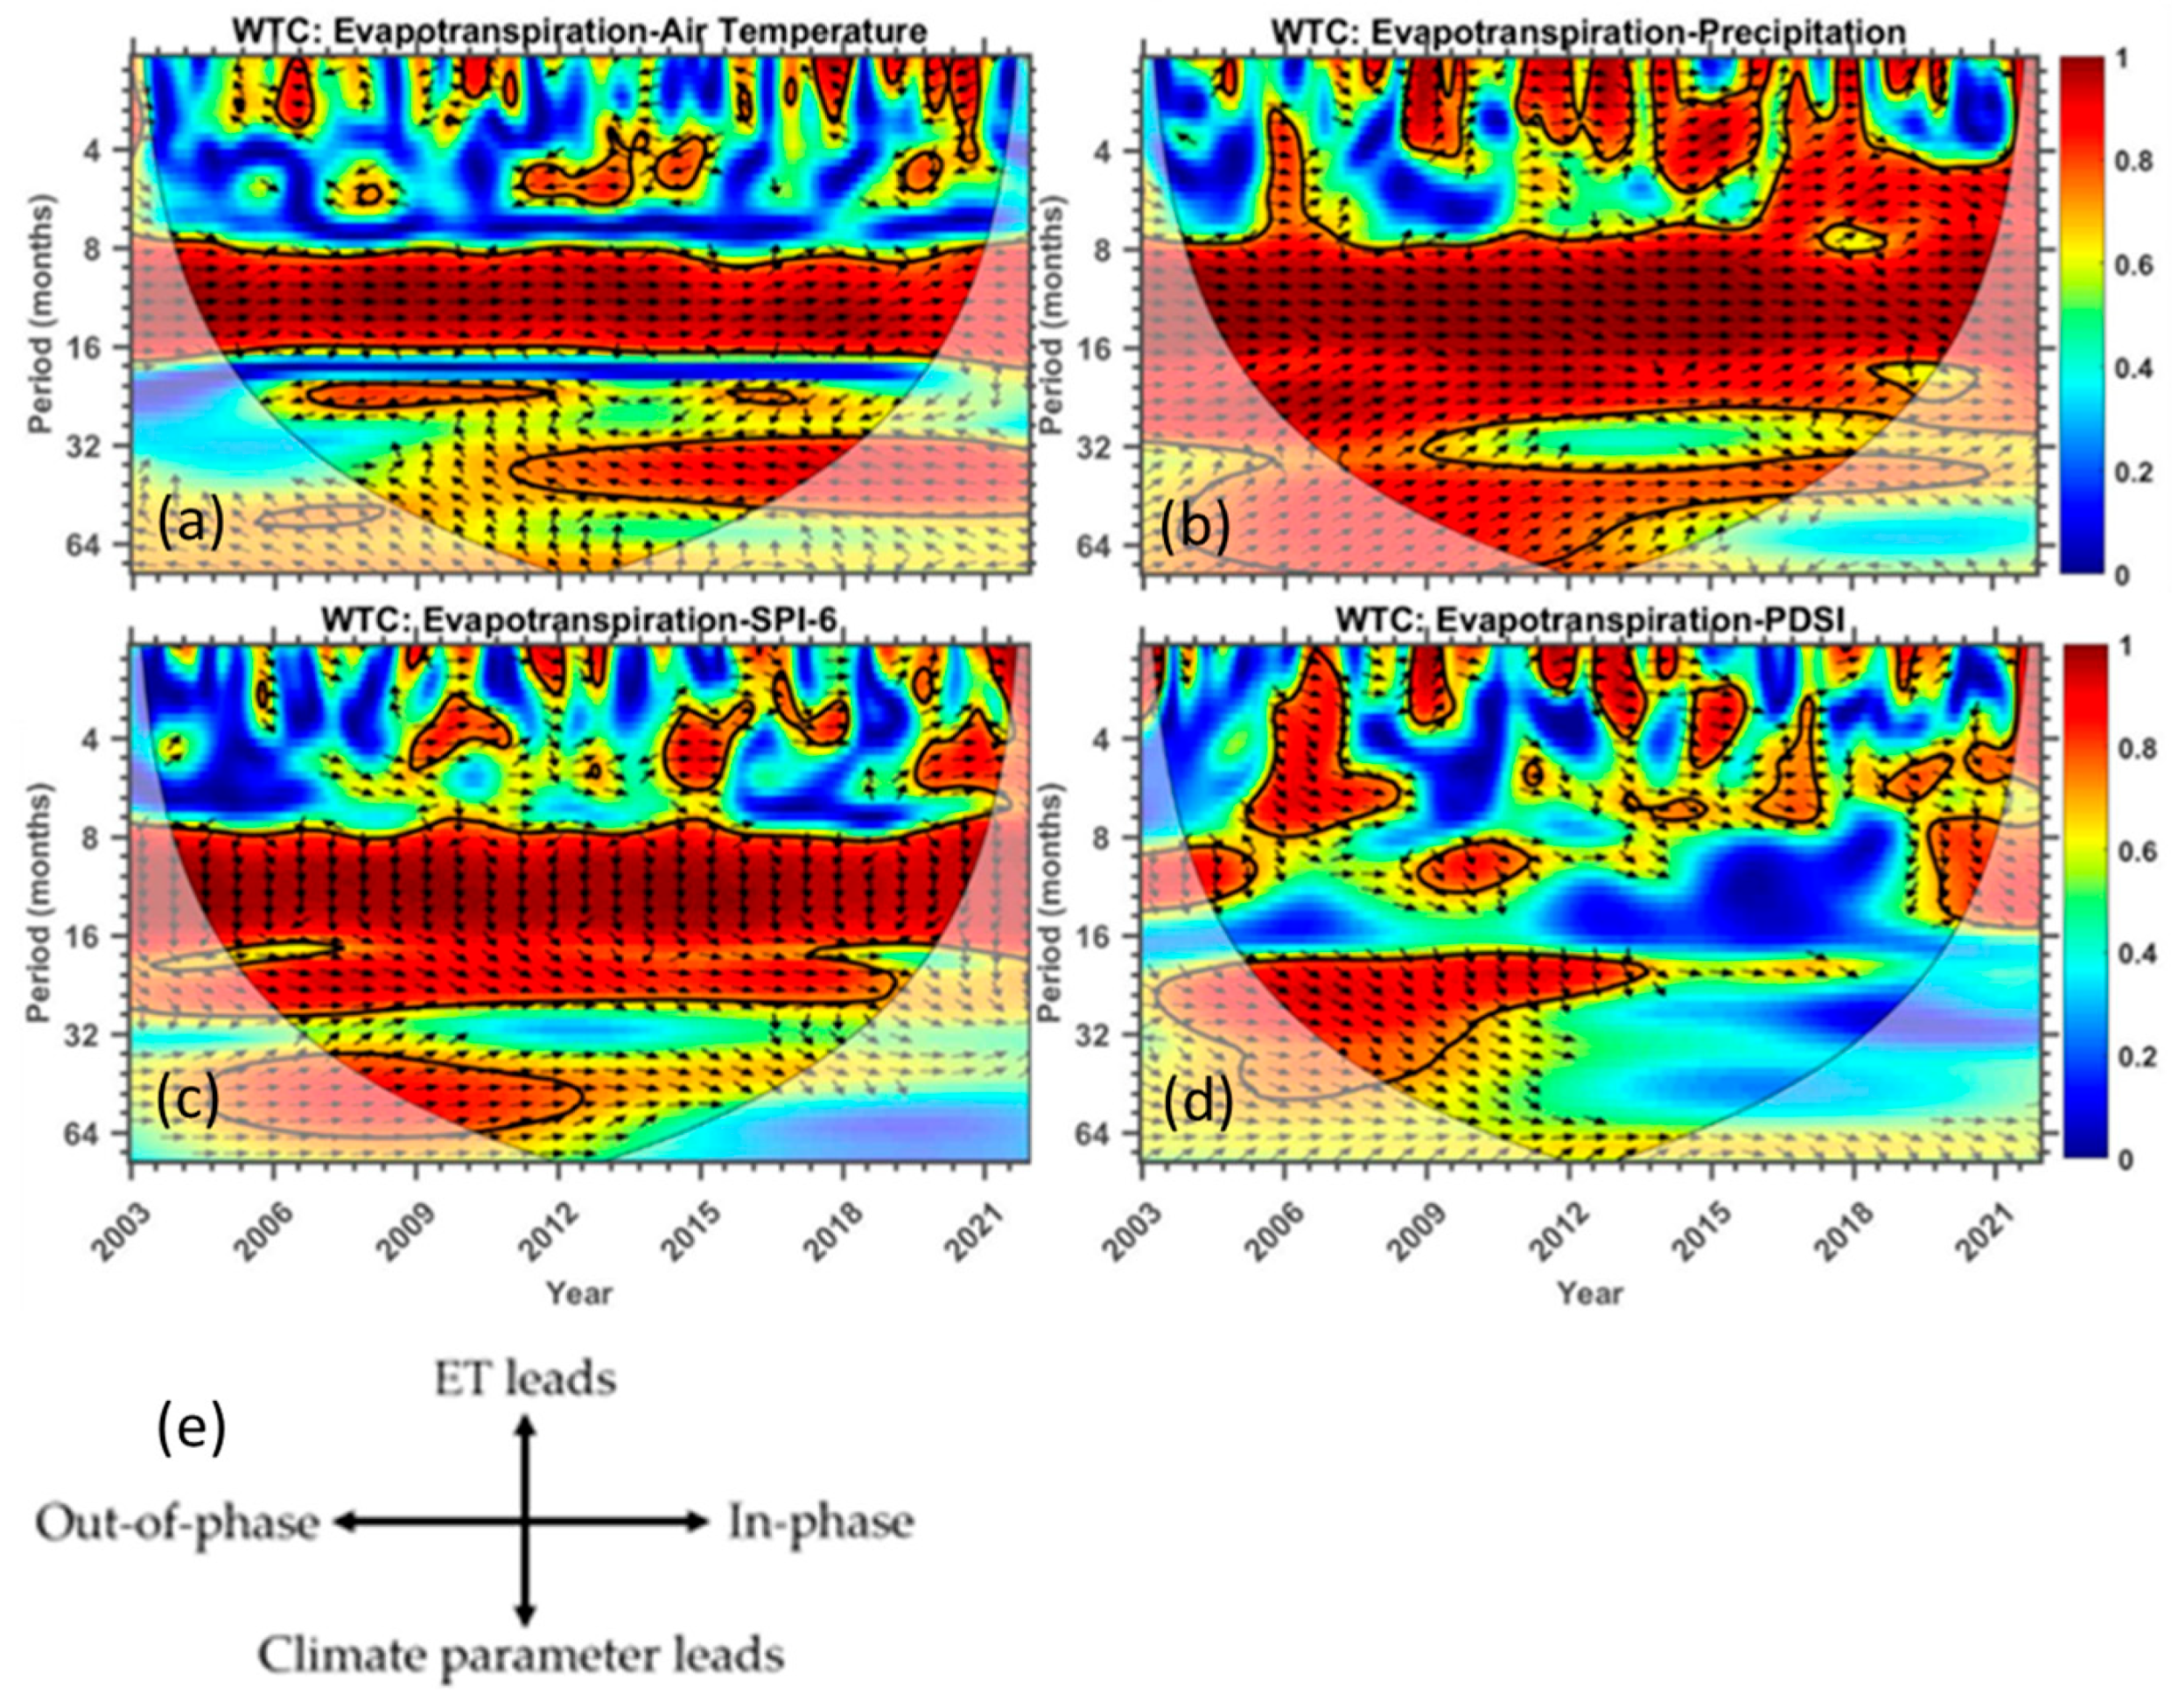
It is essential to also investigate the teleconnection between different time series and their evolution over a continuous time and frequency. In this study, the bi-variate framework method called the wavelet transform coherence (WTC) technique was used to determine the time-frequency teleconnection between evapotranspiration and climate variables which are defined as the most important variables in Figure 7, such as temperature, precipitation, SPI-6, and PDSI, from 2003 to 2021 (see Figure 8). Basically, the visualization appearance of the WTC analysis results is a three-dimensional figure that has time on the horizontal axis, period in the vertical axis, and wavelet coherence power in the z-axis. For each wavelet power position in the figure, a wavelet cross-coherence phase is overlaid, and indicated by black arrows. In the plot, regions which are indicated by warmer colors (red) represent time-frequency regions with significant interrelations between the two-time series, while colder colors (blue) represent time-frequency regions where there are no interrelations between the two-time series. The black arrows which are overlaid on top of the cross-wavelet power spectra represent regions where there is a leading/lagging phase relationship between the two examined times series. Arrows that point to the right (left) represent time-frequency regions when the two-time series are in-phase (out-of-phase), and a zero-phase difference indicate time-frequency regions where the two-time series move together on a particular scale. Regions where the two-time series are in-phase indicate that they move in the same direction and the opposite is true for the out-of-phase scenario. On the other hand, regions where arrows point to the right-down or left-up indicate that the first variable (which is evapotranspiration in this research) is leading, while arrows pointing to the right-up or left-down indicate that the second variable is leading. The summary interpretation of the phase relationship between two independent time series is shown in Figure 8e.
Figure 8a–d shows the wavelet transform coherence spectra for evapotranspiration- air temperature, evapotranspiration-precipitation, evapotranspiration-SPI-6 and evapotranspiration-PDSI. Regarding the wavelet coherence results, Figure 8a–c indicates that there is a strong coherence between evapotranspiration and rainfall, evapotranspiration and temperature, and evapotranspiration and SPI-6 in 8–28 month, 8–32 month, and 8–32 month band, respectively. This indicates common periodicities between evapotranspiration and other parameters in the above-mentioned frequency bands throughout the years. In these frequency bands (see Figure 8a–c), there is a strong in-phase correlation relationship between evapotranspiration and the other parameters. This in-phase relationship means that there is a strong teleconnection between evapotranspiration and these parameters. In shorter period bands which are less than eight months, there are periodic coherent regions which are mostly in-phase for evapotranspiration-precipitation and evapotranspiration-SPI-6, and out-of-phase for evapotranspiration–air temperature. On the other hand, the evapotranspiration-PDSI wavelet coherence analysis results (Figure 8d) seem to indicate periodic in-phase coherent events in the cone of influence region.

3.6. Sequential Mann–Kendall (SQ-MK)

In Figure 9, we show the SQ-MK test results for the UOWMA monthly mean evapotranspiration data (2003–2021), where the solid red line represents the sequential statistic values of forward/progressive (Prog) u ( t ) and the black solid line denotes the retrograde (Retr) u ( t ) . We note a statistically downward trend from 2011, which became significant in the 2015–2016, 2019 and 2021 periods. Overall, the SQ-MK test shows a downward trend (Z = −0.42039) that is not statistically significant over the entire study period (p = 0.6742) but is only significant during extreme El Niño-induced drought events.

4. Discussion

We characterized the time–space variation in ET and examined its relationship with various climate parameters and the vegetation conditions over the UOWMA between 2003 and 2021. Our results showed great variability of ET, with marked lower evapotranspiration signals during drier and warmer conditions, which are often characterized by mild to stronger El Niño phases. Temporarily, the lowest evapotranspiration signals were pronounced during the intense 2015–2016 drought and lately in 2019–2020 event, as clearly confirmed by the 12-month rolling mean; spatially, they were consistent over the western section of the UOWMA and ET reductions were notable during the aforementioned periods in the Lesotho highlands. As expected, ET showed a similar configuration with VCI, with lower values in the west and increased values toward the eastern section of the basin. This extreme degree of persistence is obvious throughout the study period, with exceptions in 2007, 2012, 2014, and 2021, where VCI values improved over much of the basin probably because of increased precipitation. However, the pattern of change in VCI values is different in other years with increased precipitation, and it is still unclear whether other factors are influencing VCI values. This pattern is consistent with Moura et al. [56], where they found evapotranspiration reductions during El Niño-induced drier periods over the Amazon basin in Brazil. The VCI exhibited similar patterns, suggesting high sensitivity of vegetation to climatic variability, and this should also be important to natural ecosystems. In agreement with Esquivel-Arriaga et al. [57], the information of the ENSO influence on climate variability at the basin level is of crucial importance, especially in planning water strategies and management.
Our results showed that numerous climatic parameters played a key role as they are inextricably linked to evapotranspiration tendency. As expected, precipitation showed a strong positive correlation with evapotranspiration (r = 0.88), followed by temperature (r = 0.73), and vegetation condition index (r = 0.54), while potential water demand was negatively correlated with evapotranspiration. These results are in line with Liu et al. [58]. Again, we found that variables such as precipitation, temperature, SPI-6 and VCI are of great importance in the variability of evapotranspiration. Several existing studies have also found precipitation [59], temperature [40], SPI-6 [60], and the VCI [61] as important variables to evapotranspiration. The wavelet transform analysis revealed obvious characteristics for climatic variables that lead evapotranspiration with a persistent time-frequency connectivity for SPI-6 (8–30 months), precipitation (7–32 months) and temperature (8–16 months), except PDSI with patchy relationship, but also with a lead tendency over the UOWMA. While there is no better drought index than any other under all circumstances, some indices are more appropriate than others for specific regional applications [62]. Finally, the SQ-MK test showed a change point of ET from the UOWMA in 2011, after which it decreased and became significant in the 2015–2016, 2019, and 2021 periods. Similar to Pour et al. [63], the SQ-MK facilitated the identification of change point in ET and highlighted the years in which it was significant. However, the limitations of this study include the lack of field data for comparison with remotely sensed data.

5. Conclusions

We analyzed the geo-temporal variation of ET across the UOWMA between 2003 and 2021 through a remote sensing-based synergic approach. Our results show detailed ET information, and this is necessary for understanding water dynamics in this region. We observed spatially consistent patterns between ET and VCI; lower values dominated in the west, while values increased in the east over the Lesotho highlands. Precipitation had the best Pearson correlation with evapotranspiration (r = 0.88), followed by temperature (r = 0.73) and the VCI (r = 0.54). The RF model recognized factors regarding their relative importance to ET, as precipitation, temperature, SPI-6, PDSI, and VCI. Also, wavelet analysis showed the coherence connectivity between these variables with periodicities ranging from eight to 32 months, suggesting a strong influence on ET, except for PDSI that, surprisingly, showed an erratic relationship. Based on the sequential Mann–Kendall test, we conclude that evapotranspiration showed a statistically downward trend from 2011, which was particularly significant during the drier drought periods in 2015–2016, 2019, and 2021. Further studies are needed to examine the dynamics of evapotranspiration from various sections of the Orange River Basin and to investigate other factors affecting VCI changes, since it varies in some years with increased precipitation.

Supplementary Materials

The following supporting information can be downloaded at: https://www.mdpi.com/article/10.3390/w15081501/s1, Figure S1: Standardized monthly Niño 3.4 anomalies from 2003 to 2021, showing warm (red) and cold (blue) phases of abnormal sea surface temperatures (SST) in the tropical Pacific Ocean.

Author Contributions

Conceptualization, P.S.M., S.X. and N.M.; methodology, P.S.M., S.X. and N.M.; formal analysis, P.S.M., S.X. and N.M.; investigation, P.S.M., S.X. and N.M.; writing—review and editing, P.S.M., S.X. and N.M.; visualization, S.X. and N.M.; funding acquisition, P.S.M. All authors have read and agreed to the published version of the manuscript.

Funding

The APC was funded by the University of the Free State and the National Research Foundation (NRF) of South Africa.

Data Availability Statement

Not applicable.

Acknowledgments

This work was made possible by the financial support from the National Research Foundation (NRF) of South Africa [TTK150624120630]—Thuthuka Funding Instrument (PhD Track)—Unique Grants No.: 99424 & 100424 and the University of the Free State (Qwaqwa Campus). We also thank anonymous reviewers for their comments, which improved the quality of the paper.

Conflicts of Interest

The authors declare no conflict of interest.

References

  1. Biggs, T.; Petropoulos, G.P.; Velpuri, N.M.; Marshall, M.; Glenn, E.P.; Nagler, P.; Messina, A. Remote Sensing of Actual Evapotranspiration from Croplands. In Remote Sensing of Water Resources, Disasters, and Urban Studies; CRC Press: Boca Raton, FL, USA, 2015; pp. 59–99. [Google Scholar]
  2. Danodia, A.; Patel, N.R.; Chol, C.W.; Nikam, B.R.; Sehgal, V.K. Application of S-SEBI Model for Crop Evapotranspiration Using Landsat-8 Data over Parts of North India. Geocarto Int. 2019, 34, 114–131. [Google Scholar] [CrossRef]
  3. Cui, Y.; Jia, L.; Fan, W. Estimation of Actual Evapotranspiration and Its Components in an Irrigated Area by Integrating the Shuttleworth-Wallace and Surface Temperature-Vegetation Index Schemes Using the Particle Swarm Optimization Algorithm. Agric. For. Meteorol. 2021, 307, 108488. [Google Scholar] [CrossRef]
  4. Mu, Q.; Heinsch, F.A.; Zhao, M.; Running, S.W. Development of a Global Evapotranspiration Algorithm Based on MODIS and Global Meteorology Data. Remote Sens. Environ. 2007, 111, 519–536. [Google Scholar] [CrossRef]
  5. Amatya, D.M.; Irmak, S.; Gowda, P.; Sun, G.; Nettles, J.E.; Douglas-Mankin, K.R. Ecosystem Evapotranspiration: Challenges in Measurements, Estimates, and Modeling. Trans. ASABE 2016, 59, 555–560. [Google Scholar]
  6. Jovanovic, N.; Mu, Q.; Bugan, R.D.; Zhao, M. Dynamics of MODIS Evapotranspiration in South Africa. Water SA 2015, 41, 79–90. [Google Scholar] [CrossRef] [Green Version]
  7. Luo, Z.; Guo, M.; Bai, P.; Li, J. Different Vegetation Information Inputs Significantly Affect the Evapotranspiration Simulations of the PT-JPL Model. Remote Sens. 2022, 14, 2573. [Google Scholar] [CrossRef]
  8. Norman, S.P.; Koch, F.H.; Hargrove, W.W. Review of Broad-Scale Drought Monitoring of Forests: Toward an Integrated Data Mining Approach. For. Ecol. Manag. 2016, 380, 346–358. [Google Scholar] [CrossRef] [Green Version]
  9. Bai, P.; Liu, X. Intercomparison and Evaluation of Three Global High-Resolution Evapotranspiration Products across China. J. Hydrol. 2018, 566, 743–755. [Google Scholar] [CrossRef]
  10. Guo, M.; Li, J.; Wang, Y.; Long, Q.; Bai, P. Spatiotemporal Variations of Meteorological Droughts and the Assessments of Agricultural Drought Risk in a Typical Agricultural Province of China. Atmosphere 2019, 10, 542. [Google Scholar] [CrossRef] [Green Version]
  11. Hesadi, H.; Behnia, A.; Akhoond-Ali, A.M.; Kashefi Pour, S.M.; Daneshkar Arasteh, P.; Karimi, A.R. Estimation of Evapotranspiration of Rangeland Cover Using SEBAL Algorithm in Robat Mahidasht Region, Kermanshah, Iran. J. Rangel. Sci. 2022, 12, 48–62. [Google Scholar]
  12. Calera, A.; Campos, I.; Osann, A.; D’Urso, G.; Menenti, M. Remote Sensing for Crop Water Management: From ET Modelling to Services for the End Users. Sensors 2017, 17, 1104. [Google Scholar] [CrossRef] [Green Version]
  13. Petropoulos, G.P.; Srivastava, P.K.; Piles, M.; Pearson, S. Earth Observation-Based Operational Estimation of Soil Moisture and Evapotranspiration for Agricultural Crops in Support of Sustainable Water Management. Sustainability 2018, 10, 181. [Google Scholar] [CrossRef] [Green Version]
  14. Awan, U.K.; Anwar, A.; Ahmad, W.; Hafeez, M. A Methodology to Estimate Equity of Canal Water and Groundwater Use at Different Spatial and Temporal Scales: A Geo-Informatics Approach. Environ. Earth Sci. 2016, 75, 409. [Google Scholar] [CrossRef]
  15. Zhang, K.; Kimball, J.S.; Running, S.W. A Review of Remote Sensing Based Actual Evapotranspiration Estimation. Wiley Interdiscip. Rev. Water 2016, 3, 834–853. [Google Scholar] [CrossRef]
  16. Senay, G.B.; Bohms, S.; Singh, R.K.; Gowda, P.H.; Velpuri, N.M.; Alemu, H.; Verdin, J.P. Operational Evapotranspiration Mapping Using Remote Sensing and Weather Datasets: A New Parameterization for the SSEB Approach. JAWRA J. Am. Water Resour. Assoc. 2013, 49, 577–591. [Google Scholar] [CrossRef] [Green Version]
  17. Huntington, J.L.; Hegewisch, K.C.; Daudert, B.; Morton, C.G.; Abatzoglou, J.T.; McEvoy, D.J.; Erickson, T. Climate Engine: Cloud Computing and Visualization of Climate and Remote Sensing Data for Advanced Natural Resource Monitoring and Process Understanding. Bull. Am. Meteorol. Soc. 2017, 98, 2397–2410. [Google Scholar] [CrossRef]
  18. Sudmanns, M.; Tiede, D.; Lang, S.; Bergstedt, H.; Trost, G.; Augustin, H.; Baraldi, A.; Blaschke, T. Big Earth Data: Disruptive Changes in Earth Observation Data Management and Analysis? Int. J. Digit. Earth 2020, 13, 832–850. [Google Scholar] [CrossRef]
  19. Senay, G.B.; Friedrichs, M.; Morton, C.; Parrish, G.E.; Schauer, M.; Khand, K.; Kagone, S.; Boiko, O.; Huntington, J. Mapping Actual Evapotranspiration Using Landsat for the Conterminous United States: Google Earth Engine Implementation and Assessment of the SSEBop Model. Remote Sens. Environ. 2022, 275, 113011. [Google Scholar] [CrossRef]
  20. Ejaz, N.; Bahrawi, J.; Alghamdi, K.M.; Rahman, K.U.; Shang, S. Drought Monitoring Using Landsat Derived Indices and Google Earth Engine Platform: A Case Study from Al-Lith Watershed, Kingdom of Saudi Arabia. Remote Sens. 2023, 15, 984. [Google Scholar] [CrossRef]
  21. Pei, T.; Wu, X.; Li, X.; Zhang, Y.; Shi, F.; Ma, Y.; Wang, P.; Zhang, C. Seasonal Divergence in the Sensitivity of Evapotranspiration to Climate and Vegetation Growth in the Yellow River Basin, China. J. Geophys. Res. Biogeosci. 2017, 122, 103–118. [Google Scholar] [CrossRef]
  22. Reig, P.; Gassert, F.; Luck, M. Orange-Senqu River Basin Study; Working Paper; World Resources Institute: Washington, DC, USA, 2013. [Google Scholar]
  23. Chisanga, C.B.; Mubanga, K.H.; Sichigabula, H.; Banda, K.; Muchanga, M.; Ncube, L.; van Niekerk, H.J.; Zhao, B.; Mkonde, A.A.; Rasmeni, S.K. Modelling Climatic Trends for the Zambezi and Orange River Basins: Implications on Water Security. J. Water Clim. Chang. 2022, 13, 1275–1296. [Google Scholar] [CrossRef]
  24. Baudoin, M.-A.; Vogel, C.; Nortje, K.; Naik, M. Living with Drought in South Africa: Lessons Learnt from the Recent El Niño Drought Period. Int. J. Disaster Risk Reduct. 2017, 23, 128–137. [Google Scholar] [CrossRef]
  25. Mahlalela, P.T.; Blamey, R.C.; Hart, N.C.G.; Reason, C.J.C. Drought in the Eastern Cape Region of South Africa and Trends in Rainfall Characteristics. Clim. Dyn. 2020, 55, 2743–2759. [Google Scholar] [CrossRef]
  26. Walz, Y.; Min, A.; Dall, K.; Duguru, M.; de Leon, J.-C.V.; Graw, V.; Dubovyk, O.; Sebesvari, Z.; Jordaan, A.; Post, J. Monitoring Progress of the Sendai Framework Using a Geospatial Model: The Example of People Affected by Agricultural Droughts in Eastern Cape, South Africa. Prog. Disaster Sci. 2020, 5, 100062. [Google Scholar] [CrossRef]
  27. Senay, G.B.; Schauer, M.; Velpuri, N.M.; Singh, R.K.; Kagone, S.; Friedrichs, M.; Litvak, M.E.; Douglas-Mankin, K.R. Long-Term (1986–2015) Crop Water Use Characterization over the Upper Rio Grande Basin of United States and Mexico Using Landsat-Based Evapotranspiration. Remote Sens. 2019, 11, 1587. [Google Scholar] [CrossRef] [Green Version]
  28. ANBO (African Network of Basin Organizations). Source Book on African’s River Basin Organizations; ANBO: Kampala, Uganda, 2007. [Google Scholar]
  29. Lange, G.-M.; Mungatana, E.; Hassan, R. Water Accounting for the Orange River Basin: An Economic Perspective on Managing a Transboundary Resource. Ecol. Econ. 2007, 61, 660–670. [Google Scholar] [CrossRef]
  30. Anyamba, A.; Tucker, C.J.; Mahoney, R. From El Niño to La Niña: Vegetation Response Patterns over East and Southern Africa during the 1997–2000 Period. J. Clim. 2002, 15, 3096–3103. [Google Scholar] [CrossRef]
  31. Saji, N.H.; Goswami, B.N.; Vinayachandran, P.N.; Yamagata, T. A Dipole Mode in the Tropical Indian Ocean. Nature 1999, 401, 360–363. [Google Scholar] [CrossRef]
  32. Funk, C.; Peterson, P.; Landsfeld, M.; Pedreros, D.; Verdin, J.; Shukla, S.; Husak, G.; Rowland, J.; Harrison, L.; Hoell, A. The Climate Hazards Infrared Precipitation with Stations—A New Environmental Record for Monitoring Extremes. Sci. Data 2015, 2, 150066. [Google Scholar] [CrossRef] [Green Version]
  33. Katsanos, D.; Retalis, A.; Michaelides, S. Validation of a High-Resolution Precipitation Database (CHIRPS) over Cyprus for a 30-Year Period. Atmos. Res. 2016, 169, 459–464. [Google Scholar] [CrossRef]
  34. McKee, T.B.; Doesken, N.J.; Kleist, J. The Relationship of Drought Frequency and Duration to Time Scales. In Proceedings of the 8th Conference on Applied Climatology, Anaheim, CA, USA, 17–22 January 1993; Volume 17, pp. 179–183. [Google Scholar]
  35. Gao, F.; Zhang, Y.; Ren, X.; Yao, Y.; Hao, Z.; Cai, W. Evaluation of CHIRPS and Its Application for Drought Monitoring over the Haihe River Basin, China. Nat. Hazards 2018, 92, 155–172. [Google Scholar] [CrossRef]
  36. Guenang, G.M.; Kamga, F.M. Computation of the Standardized Precipitation Index (SPI) and Its Use to Assess Drought Occurrences in Cameroon over Recent Decades. J. Appl. Meteorol. Climatol. 2014, 53, 2310–2324. [Google Scholar] [CrossRef]
  37. Kogan, F.N. Application of Vegetation Index and Brightness Temperature for Drought Detection. Adv. Space Res. 1995, 15, 91–100. [Google Scholar] [CrossRef]
  38. Ahmadi, A.; Daccache, A.; Snyder, R.L.; Suvočarev, K. Meteorological Driving Forces of Reference Evapotranspiration and Their Trends in California. Sci. Total Environ. 2022, 849, 157823. [Google Scholar] [CrossRef] [PubMed]
  39. Breiman, L. Random Forests. Mach. Learn. 2001, 45, 5–32. [Google Scholar] [CrossRef] [Green Version]
  40. Wu, M.; Feng, Q.; Wen, X.; Deo, R.C.; Yin, Z.; Yang, L.; Sheng, D. Random Forest Predictive Model Development with Uncertainty Analysis Capability for the Estimation of Evapotranspiration in an Arid Oasis Region. Hydrol. Res. 2020, 51, 648–665. [Google Scholar] [CrossRef]
  41. Sandri, M.; Zuccolotto, P. Analysis and Correction of Bias in Total Decrease in Node Impurity Measures for Tree-Based Algorithms. Stat. Comput. 2010, 20, 393–407. [Google Scholar] [CrossRef] [Green Version]
  42. Dimitriadou, S.; Nikolakopoulos, K.G. Multiple Linear Regression Models with Limited Data for the Prediction of Reference Evapotranspiration of the Peloponnese, Greece. Hydrology 2022, 9, 124. [Google Scholar] [CrossRef]
  43. Sneyers, R. On the Statistical Analysis of Series of Observations; WMO: Geneva, Switzerland, 1991. [Google Scholar]
  44. Mosmann, V.; Castro, A.; Fraile, R.; Dessens, J.; Sánchez, J.-L. Detection of Statistically Significant Trends in the Summer Precipitation of Mainland Spain. Atmos. Res. 2004, 70, 43–53. [Google Scholar] [CrossRef]
  45. Chatterjee, S.; Bisai, D.; Khan, A. Detection of Approximate Potential Trend Turning Points in Temperature Time Series (1941–2010) for Asansol Weather Observation Station, West Bengal, India. Atmos. Clim. Sci. 2013, 2014, 64–69. [Google Scholar] [CrossRef] [Green Version]
  46. Soltani, M.; Rousta, I.; Taheri, S.M. Using Mann-Kendall and Time Series Techniques for Statistical Analysis of Long-Term Precipitation in Gorgan Weather Station. World Appl. Sci. J. 2013, 28, 902–908. [Google Scholar]
  47. Torrence, C.; Compo, G.P. A Practical Guide to Wavelet Analysis. Bull. Am. Meteorol. Soc. 1998, 79, 61–78. [Google Scholar] [CrossRef]
  48. Grinsted, A.; Jevrejeva, S.; Moore, J. Influence of the Arctic Oscillation and ENSO on Ice Conditions in the Baltic Sea: The Wavelet Approach. In Proceedings of the EGS-AGU-EUG Joint Assembly, Nice, France, 6–11 April 2003; p. 2786. [Google Scholar]
  49. Grinsted, A.; Moore, J.C.; Jevrejeva, S. Application of the Cross Wavelet Transform and Wavelet Coherence to Geophysical Time Series. Nonlinear Process. Geophys. 2004, 11, 561–566. [Google Scholar] [CrossRef]
  50. Goddard, L.; Gershunov, A. Impact of El Niño on Weather and Climate Extremes. In El Niño Southern Oscillation in a Changing Climate; Wiley: Hoboken, NJ, USA, 2020; pp. 361–375. [Google Scholar]
  51. Meza, F.J. Variability of Reference Evapotranspiration and Water Demands. Association to ENSO in the Maipo River Basin, Chile. Glob. Planet. Chang. 2005, 47, 212–220. [Google Scholar] [CrossRef]
  52. Yan, H.; Yu, Q.; Zhu, Z.-C.; Myneni, R.B.; Yan, H.-M.; Wang, S.-Q.; Shugart, H.H. Diagnostic Analysis of Interannual Variation of Global Land Evapotranspiration over 1982–2011: Assessing the Impact of ENSO. J. Geophys. Res. Atmos. 2013, 118, 8969–8983. [Google Scholar] [CrossRef]
  53. Senay, G.B.; Kagone, S.; Velpuri, N.M. Operational Global Actual Evapotranspiration: Development, Evaluation, and Dissemination. Sensors 2020, 20, 1915. [Google Scholar] [CrossRef] [PubMed]
  54. Rouault, M.; Richard, Y. Intensity and Spatial Extension of Drought in South Africa at Different Time Scales. Water SA 2003, 29, 489–500. [Google Scholar] [CrossRef] [Green Version]
  55. Kretschmer, M.; Adams, S.V.; Arribas, A.; Prudden, R.; Robinson, N.; Saggioro, E.; Shepherd, T.G. Quantifying Causal Pathways of Teleconnections. Bull. Am. Meteorol. Soc. 2021, 102, E2247–E2263. [Google Scholar]
  56. Moura, M.M.; Dos Santos, A.R.; Pezzopane, J.E.M.; Alexandre, R.S.; da Silva, S.F.; Pimentel, S.M.; de Andrade, M.S.S.; Silva, F.G.R.; Branco, E.R.F.; Moreira, T.R.; et al. Relation of El Niño and La Niña Phenomena to Precipitation, Evapotranspiration and Temperature in the Amazon Basin. Sci. Total Environ. 2019, 651, 1639–1651. [Google Scholar] [CrossRef]
  57. Esquivel-Arriaga, G.; Cerano-Paredes, J.; Sánchez-Cohen, I.; Velásquez-Valle, M.A.; Flores-López, F.; Bueno-Hurtado, P. Temporal Analysis of Droughts (1922-2016) in the Upper Nazas River Basin Using SPI and Its Relationship with ENSO. Tecnol. Cienc. Agua 2019, 10, 126–153. [Google Scholar] [CrossRef]
  58. Liu, Y.; Liu, Y.; Chen, M.; Labat, D.; Li, Y.; Bian, X.; Ding, Q. Characteristics and Drivers of Reference Evapotranspiration in Hilly Regions in Southern China. Water 2019, 11, 1914. [Google Scholar] [CrossRef] [Green Version]
  59. Ma, N.; Zhang, Y. Increasing Tibetan Plateau Terrestrial Evapotranspiration Primarily Driven by Precipitation. Agric. For. Meteorol. 2022, 317, 108887. [Google Scholar] [CrossRef]
  60. Tan, Y.X.; Ng, J.L.; Huang, Y.F. Spatiotemporal Variability Assessment and Accuracy Evaluation of Standardized Precipitation Index and Standardized Precipitation Evapotranspiration Index in Malaysia. Earth Sci. Inform. 2023, 16, 67–89. [Google Scholar] [CrossRef]
  61. Bazrafshan, J.; Cheraghalizadeh, M.; Shahgholian, K. Development of a Non-Stationary Standardized Precipitation Evapotranspiration Index (NSPEI) for Drought Monitoring in a Changing Climate. Water Resour. Manag. 2022, 36, 3523–3543. [Google Scholar] [CrossRef]
  62. Ntale, H.K.; Gan, T.Y. Drought Indices and Their Application to East Africa. Int. J. Climatol. J. R. Meteorol. Soc. 2003, 23, 1335–1357. [Google Scholar] [CrossRef]
  63. Pour, S.H.; Abd Wahab, A.K.; Shahid, S.; Ismail, Z.B. Changes in Reference Evapotranspiration and Its Driving Factors in Peninsular Malaysia. Atmos. Res. 2020, 246, 105096. [Google Scholar] [CrossRef]
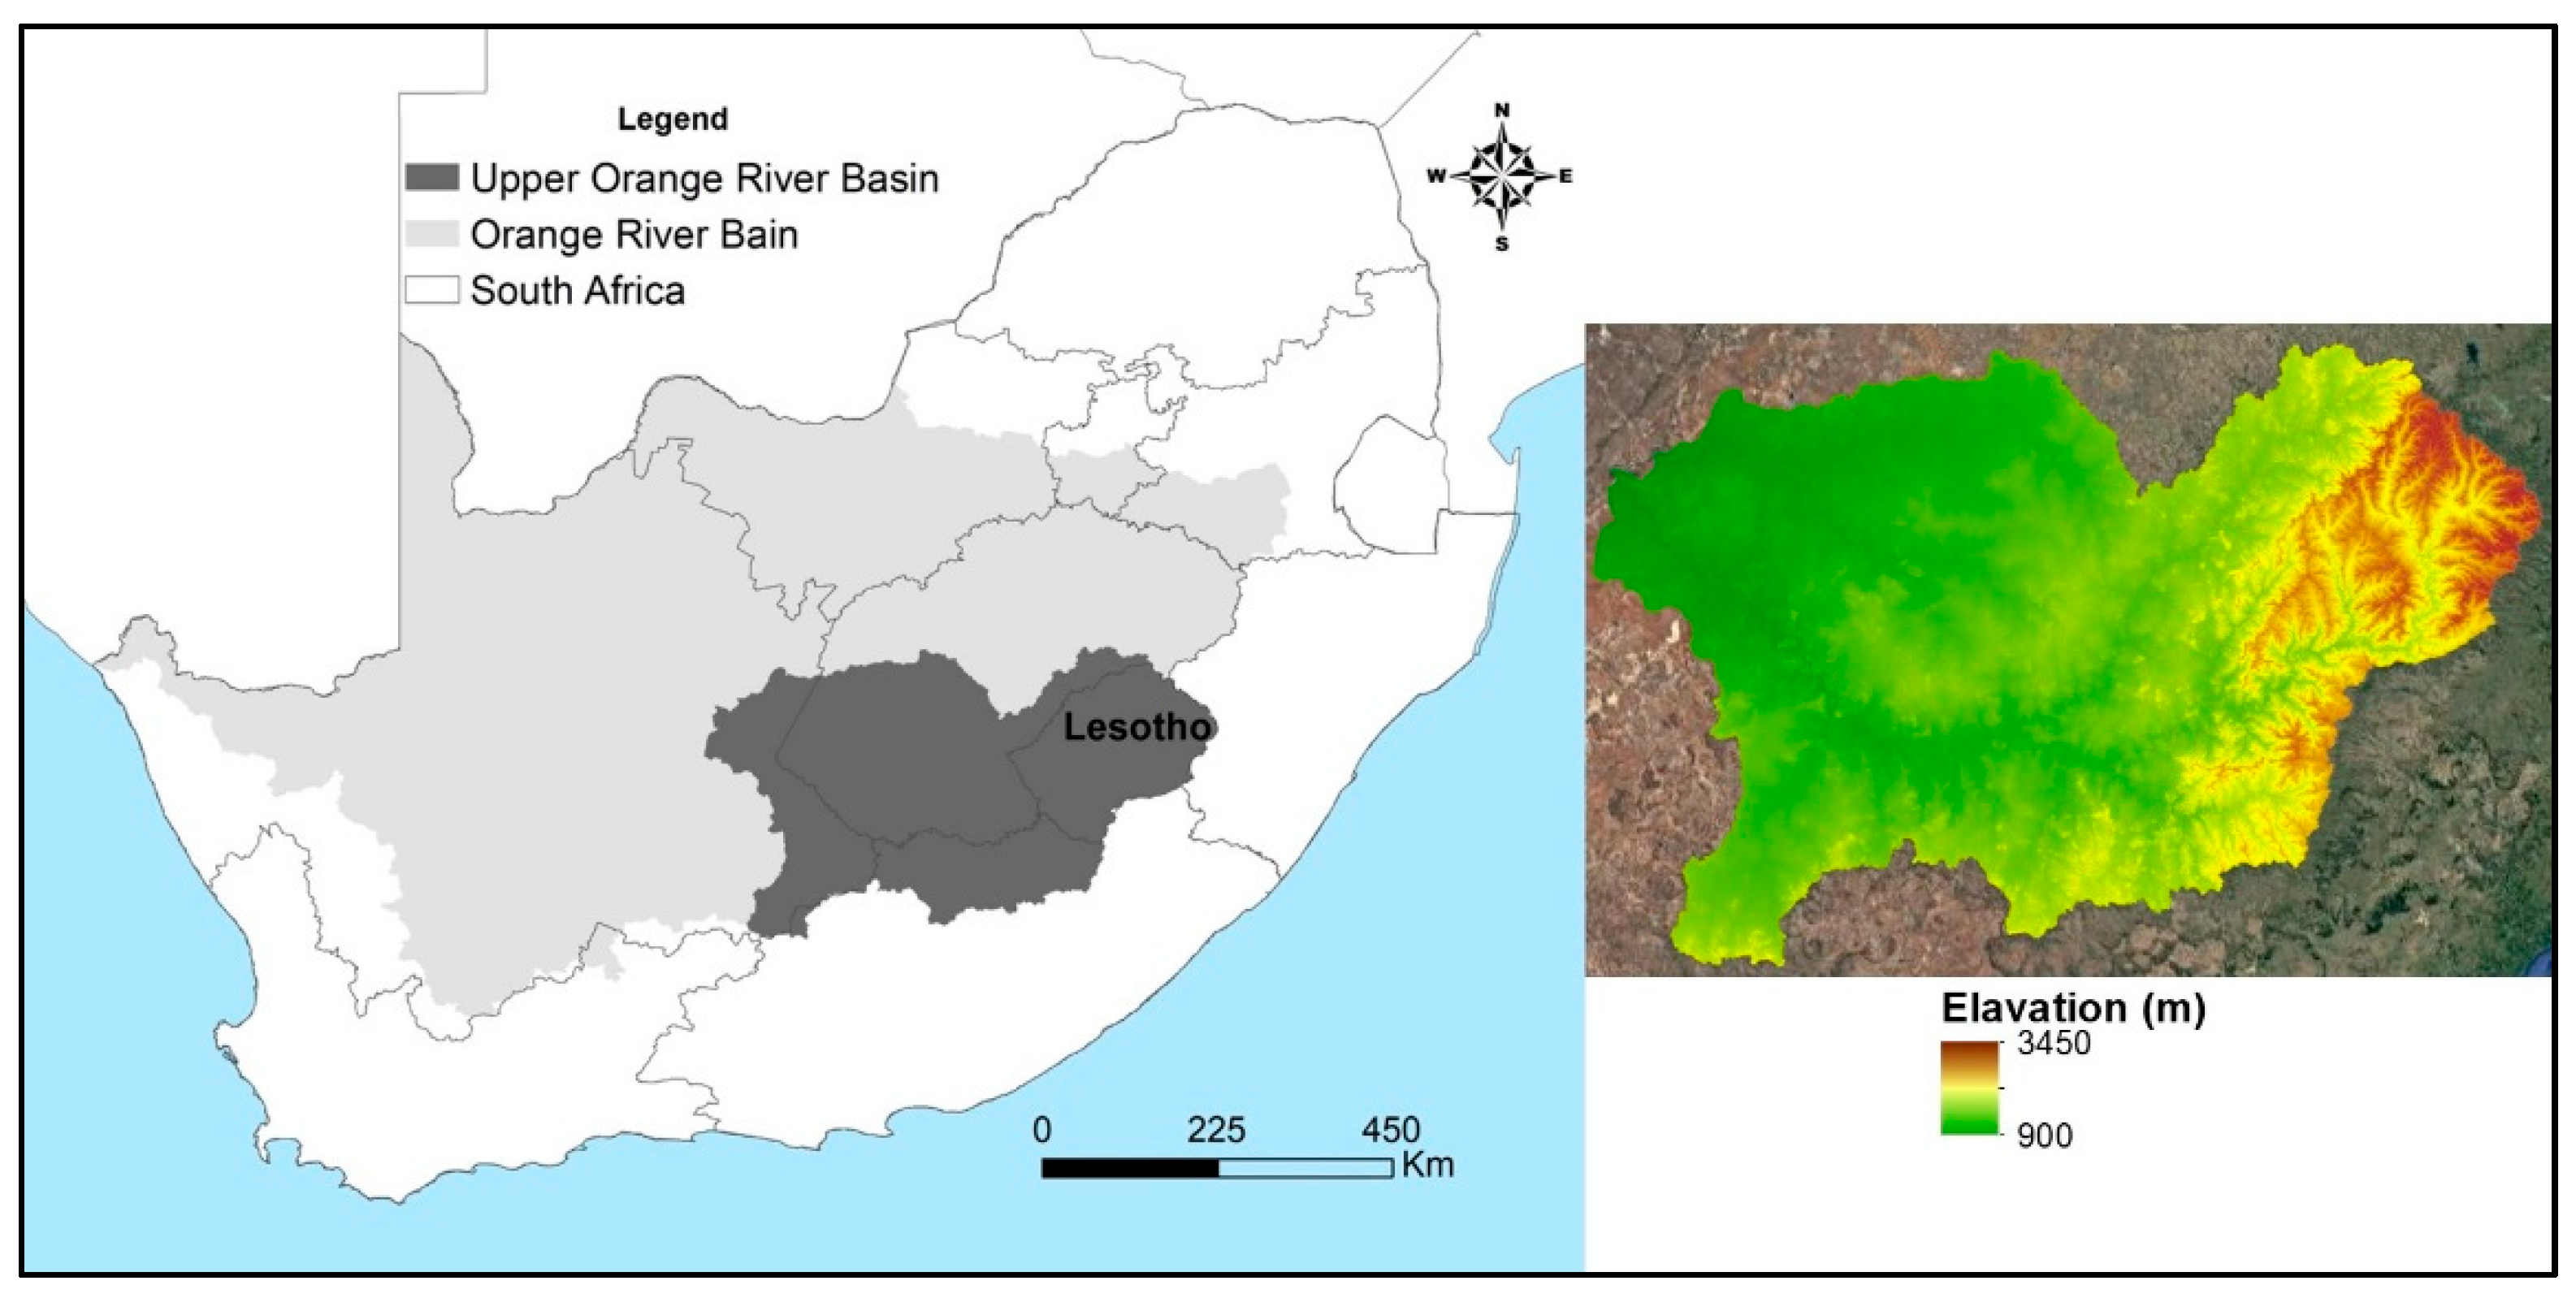
Figure 1. Location of the Upper Orange Water Management Agency (UOWMA) within the Orange River Basin (ORB) shared by South Africa and Lesotho.
Water 15 01501 g001
Figure 2. Standardized precipitation index (SPI)-6 and -12 from 2003 to 2021.
Water 15 01501 g002
Figure 3. Temporal pattern of mean monthly evapotranspiration (top panel), precipitation (middle panel) and the VCI (bottom panel) over the Upper Orange River Basin from 2003 to 2021.
Water 15 01501 g003
Figure 4. Annual composites of evapotranspiration over UORMA between 2003 and 2021.
Water 15 01501 g004
Figure 5. Annual composites of vegetation condition index over UORMA between 2003 and 2021.
Water 15 01501 g005
Figure 6. Correlation between climate-related variables.
Water 15 01501 g006
Figure 7. The order of importance of climate-related variables on ET. Larger values denote greater importance.
Water 15 01501 g007
Figure 8. Wavelet transform coherence between evapotranspiration and temperature (a), precipitation (b), SPI-6 (c) and the PDSI (d). Interpretation of the phase relationship between two independent time series (e). A solid black line indicates the significant areas at the 95% confidence level.
Water 15 01501 g008
Figure 9. Sequential Mann–Kendall test for Upper Orange Water Management Agency (UOWMA) monthly mean evapotranspiration data (2003–2021). The red solid line represents values of progressive (Prog) u ( t ) and the black solid line represents retrograde u ( t ) .
Water 15 01501 g009
Table 1. Multiple Linear Regression (MLR), where Evapotranspiration is a dependent variable and Niño, DMI, PWD, PDSI, soil moisture, VCI, precipitation, SPI-6, and SPI-12 and temperature are independent variables.
VariableEstimateStd. Errort-Valuep-ValueSignificance
Niño0.01082290.05227780.2070.836184
DMI−0.26531610.1432571−1.8520.065380
PWD−0.00061470.0025689−0.2390.811112
PDSI0.09099380.02840223.2040.001561**
SM0.01428550.02610540.5470.584787
VCI0.01355990.00450513.0100.002923**
Precip0.01247210.00287874.3332.25 × 10−5***
SPI-6−0.29505710.0775004−3.8070.000183***
SPI-120.12707740.05224552.4320.015813*
Temp0.11412340.02114205.3981.76 × 10−7***
Note: Significance codes: 0 ‘***’ 0.001 ‘**’ 0.01 ‘*’ 0.05 ‘.’ 0.1 ‘ ’ 1.
Disclaimer/Publisher’s Note: The statements, opinions and data contained in all publications are solely those of the individual author(s) and contributor(s) and not of MDPI and/or the editor(s). MDPI and/or the editor(s) disclaim responsibility for any injury to people or property resulting from any ideas, methods, instructions or products referred to in the content.