Article

Modeling of Soil Loss by Water Erosion and Its Impacts on the Cantareira System, Brazil

by
Guilherme Henrique Expedito Lense
1,
Luca Lämmle
2,*,
Joaquim Ernesto Bernardes Ayer
3,
Giuseppe Francesco Cesare Lama
4,
Felipe Gomes Rubira
5 and
Ronaldo Luiz Mincato
5
1
Graduate Program in Environmental Sciences, Federal University of Alfenas (UNIFAL-MG), Alfenas 37130-001, Brazil
2
Department of Geography, Institute of Geosciences, University of Campinas (UNICAMP), Campinas 13083-855, Brazil
3
Chemistry Department, Paulínia University Center (UNIFACP), Paulínia 13140-000, Brazil
4
Department of Civil, Architectural and Environmental Engineering (DICEA), University of Naples Federico II, 80125 Naples, Italy
5
Institute of Natural Sciences, Federal University of Alfenas (UNIFAL-MG), Alfenas 37130-001, Brazil
*
Author to whom correspondence should be addressed.
Water 2023, 15(8), 1490; https://doi.org/10.3390/w15081490
Submission received: 21 March 2023 / Revised: 31 March 2023 / Accepted: 9 April 2023 / Published: 11 April 2023

Abstract

:
The Cantareira System is one of the largest water supply systems in the world, supplying about half of the water consumed by 22 million inhabitants in the Metropolitan Region of São Paulo, in southeastern Brazil. In this scenario, in view of climate change, silting is a serious environmental threat and a major challenge to the sustainability of water reservoirs. Therefore, identifying the provenance of sediments is an essential tool to support soil conservation policies, slowing erosion processes and mitigating the deposition of sediments in water reservoirs. Thus, this study aimed to model soil losses—sediment production, by water erosion in the Cantareira System, based on the RUSLE model—Revised Universal Soil Loss Equation, GIS—Geographic Information System and SR—Remote Sensing. The work was conducted on data obtained from online platforms of Brazilian public institutions. The results indicate an average rate of soil loss of 13 Mg ha−1 yr−1, which corresponds to an annual loss of 3 million tons, of which 22% reaches water bodies. The data also show that: (1) in 66 % of the Cantareira System, soil losses are below the soil loss tolerance limits, and, in 34% of the region, water erosion is compromising the sustainability of water and soil resources; (2) the areas with the greatest soil losses are predominantly located in planted forests, agricultural crops and non-vegetated areas; and (3) sectors with high rates of soil loss require the adoption of conservationist practices aimed at reducing sediment production rates and thereby increasing supply and improving water quality.

1. Introduction

Life on earth depends on topsoil, a resource that is rapidly degraded but takes hundreds to thousands of years to regenerate [1]. Water erosion, the main cause of soil degradation, is a natural process that is intensified by human activities and causes losses of soil and organic matter and reduced fertility [2,3,4]. In addition, water erosion deteriorates the ecological environment, as sediments also carry nutrients such as nitrogen, phosphorus, potassium and pollutants to water bodies [5,6]. Sediments deposited in watercourses lead to siltation and, consequently, a reduction in the useful volume of water resource reservoirs [7,8,9,10,11,12].
The Cantareira System is one of the largest water supply systems in the world; it has six reservoirs interconnected by a channel and 48 km of tunnels. It has the capacity to supply 33 thousand liters of water per second, crossing the natural barrier of the Serra da Mantiqueira and supplying almost half of all the water consumed by the 22 million inhabitants of the Metropolitan Region of São Paulo in southeastern Brazil [13,14]. The Cantareira System is a work of engineering from the 1970s that was planned to provide clean and abundant water in a scenario of severe environmental and land use changes, water stress and acute pollution [14,15,16].
The eroded sediments that enter the water supply system cause the degradation of its quality due to increased levels of suspended solids, which increases the need for water treatment and the costs involved in this process [17,18]. In addition, sediment pollution contributes to the wear and tear of the water treatment and distribution infrastructure, requiring more frequent maintenance and replacement of equipment utilized in the turbidity removal process [14,19,20]. In this scenario, it is relevant to carry out innovative studies to advance knowledge and assist in the management of environments of this nature, whether in the Cantareira System or in other water reservoirs worldwide.
Models for estimating water erosion are tools capable of quantitatively estimating the rates of soil loss and sediment deposition and thus help propose effective erosion control practices [21,22]. Modeling is a simple, easy-to-interpret technique that requires minimal resources and can be implemented with readily available information in areas exposed to high erosion risks. Additionally, this tool allows the assessment of large-scale erosion rates, overcoming the main limitation of experimental plots in the field [23,24].
Considering the lack of studies on soil losses and their impacts throughout the Cantareira System, the objective of the present study was to model soil losses due to water erosion in the Cantareira System and to identify priority areas for the implementation of mitigation measures. It also aims, from the spatial distribution of the data, to identify the areas with the highest rates of soil loss and thereby define those that are priorities for intervention and impact mitigation. Furthermore, it also aims to encourage scientific debate within the scope of water resource reservoirs, contributing to their more effective management.

2. Materials and Methods

2.1. Study Area

The Cantareira System is a hydraulic set of structures that ensures the transfer of part of the flow from the Piracicaba, Capivari and Jundiaí watersheds to the largest metropolitan region in Brazil, and one of the largest in the world. The system is located in southeastern Brazil between coordinates 45°51′47″ to 46°42′40″ W and 22°36′40″ to 23°25′52″ S (Figure 1). The Cantareira System occupies an area of 228,278 ha, with 55% in the state of São Paulo and 45% in the state of Minas Gerais. According to the Köppen classification, the climate is predominantly temperate oceanic (Cfb), with cold, dry winters and hot, humid summers. The average annual rainfall is 1570 mm, and the average annual temperatures range from 18° to 20 °C [25,26].
The altitude ranges from 734 to 2026 m (Figure 1B). The lowest areas (<900 m) are in the state of São Paulo, in the municipalities of Mairiporã and Nazaré Paulista, while the highest areas (>1700 m) are in the state of Minas Gerais, in the municipalities of Camanducaia and Sapucaí-Mirim. The region has an average slope of 24%, with a predominance of strongly undulating relief (20–45%). The areas with flat and gently undulating reliefs (<8%) are in the valleys of the main rivers, whereas the steepest reliefs (>20%) are distributed throughout the region on the faces of the hills and mountains of the Cantareira System (Figure 1C).
The Cantareira System is occupied by forest formations (45.1%), planted forest (8.46%), pastures (18.80%), temporary crops (22.47%), coffee cultivation (0.27%), water bodies (3.18%), urbanization (1.47%) and non-vegetated areas (0.25%) (Figure 1D) [27]. The pastures present in the Cantareira System are mostly degraded with low productivity and high negative environmental impact [26,30,31]. The planted forest consists mainly of eucalyptus plantations, an important economic activity in the region, with two types of demands: the wood is mainly utilized as fuel, and part of the production is allocated for paper manufacturing [26]. The soils of the Cantareira System consist of Argisols (45.1%), Latosols (34.1%) and Cambisols (16.15%) [30,31] (Figure 1E).

2.2. Revised Universal Soil Loss Equation (RUSLE)

The Universal Soil Loss Equation (USLE) [32] and its revised version (RUSLE) [33] are the most popular and applied empirical models to predict soil loss by erosion worldwide [34,35]. The RUSLE is a practical, easy-to-interpret and flexible model for different edaphoclimatic conditions. In addition, the application can be integrated with geoprocessing techniques, which improve the accuracy of its results, requiring minimal resources. The RUSLE calculates an area’s average annual soil loss by multiplying its factors according to Equation (1).
A = R   ×   K   × LS × C × P
where A is the average annual soil loss in Mg ha−1 yr−1; R is the rainfall erosivity factor in MJ mm ha−1 h−1 yr−1; K is the soil erodibility factor in Mg ha−1 MJ−1 mm−1; LS is the topographic factor, dimensionless; C is the soil use and management factor, dimensionless; and P is the conservation practices factor, dimensionless.
The general flowchart of the methodology demonstrates the procedures adopted to obtain soil loss rates (Figure 2).

2.2.1. Rain Erosivity (R)

Erosivity (R) represents the potential of rainfall and its associated runoff to cause erosion in unprotected soil. The R factor considers the kinetic energy of the rain and its maximum intensity within 30 min [32].
Due to the lack of detailed rainfall records in the Cantareira System, the R factor was generated according to the multivariate geographic model for Brazil [36] (Equation (2)), which allows estimating the R factor from the latitude, longitude and altitude of the studied area. Such methodology [36] has provided accurate results in several studies in other Brazilian regions [34,37,38].
R = 399433 + 420.49 × A 78296 × LA 0.01784 × A 2 1594.04 × LA 2 + 195.84 · LO 2 + 17.77 × A × LO 1716.27 × LA × LO + 0.1851 × LO 2 · A + 0.00001002 × LO 2 × A 2 + 1.389 × LA 2 × LO 2 + 0.01364 × LA 2 × LO 3
where R is the rainfall erosivity factor in MJ mm ha−1 h−1 yr−1; A is the altitude in m; and LA and LO are the latitude and longitude, respectively, both in negative decimal degrees.

2.2.2. Soil Erodibility (K)

The erodibility (K) expresses the susceptibility of soil to suffer detachment of its particles by the impact of raindrops and by the surface runoff [33]. This factor is calculated in experimental plots based on the physical, chemical and mineralogical properties of the soil. However, determining factor K in the field is a process that requires several years of high-cost experiments. Therefore, factor K values were obtained from the erodibility of soils of the State of São Paulo [39,40], which are 0.0228, 0.0254 and 0.0162 Mg ha−1 MJ−1 mm−1 for Argisols, Cambisols and Latosols, respectively.

2.2.3. Topographic Factor (LS)

The LS factor represents the influence of length (L) and the inclination (S) of an area on soil water erosion. The LS factor was calculated by Equation (3) [41].
LS = m + 1 × FA × 30 22.13 m × sin S 0.0896 n
where LS is the dimensionless topographic factor; FA is the flux accumulation expressed as the number of grid cells in the digital elevation model; S is the slope of the area in degrees; m and n are empirical parameters that vary from 0.4 to 0.6 and from 1.0 to 1.4, respectively, according to the predominant type of erosion (sheet or rill); and 30 is the spatial resolution of the digital model elevation in meters.
The parameters m and n were defined as 0.4 and 1.0, respectively, assuming the prevalence of sheet erosion in the area, due to forest formations and pastures representing the highest proportion of land use.

2.2.4. Soil Use and Management Factor (C) and Factor of Conservation Practices (P)

The soil use and management factor represents the effect of all soil management and vegetation cover variables on water erosion. The C factor is obtained in the field in long-term experiments. This factor can also be determined from the scientific literature, considering the land use classes with characteristics like those in the study area. Therefore, the C values for the Cantareira System were defined from the modeling of soil losses in an area of the state of São Paulo [42]. From the land use map, C values were defined for each use class: 0.0004 for native forests and 0.047 for planted forests. For the other land use classes, the C factor was 0.05 for pastures, 0.02 for temporary crops, 0.0135 for coffee-growing areas and 1 for non-vegetated areas. Urbanization and water bodies were not considered in the calculation of soil losses.
Due to the large dimensions of the Cantareira System area, factor P in situ was not determined. Thus, the parameter was defined for each land use class based on specialized literature. In the class of use “non-vegetated areas”, the value of P was 1; in temporary cultivation, coffee and pasture cultivation was 0.35; and in forest and planted forest was 0.2 and 0.56, respectively [35].

2.3. Geoprocessing and Spatial Analysis

To obtain the parameters and modeling, all the data processing steps were developed using ArcMap 10.5 [43]. The digital elevation model (DEM), with a spatial resolution of 30 m, was obtained based on elevation data extracted from the digital platform “United States Geological Survey” [44]. The slope map was prepared based on the digital elevation model with the Slope tool [43]. The land use map was extracted from Collection 7 of 2021, on the MapBiomas platform [27]. MapBiomas is a collection of annual land use and land cover maps in Brazil. They are made from several observations and a large database, which generate high-precision maps [34,45,46]. The soil map was prepared using the Union tool [43], based on the revised and enlarged soil map of the state of São Paulo (Scale 1:250,000) [29], and the soil map of the state of Minas Gerais (Scale 1:650,000) [28].
The calculation of the R factor (Equation (2)) was performed using the Raster Calculator tool [43] for each cell, with a spatial resolution of 30 m in the digital elevation model. From the soil map, the values of the K factor were assigned according to the soil classes of the Cantareira System using the Editor tool [43]. The soil map was converted to a 30 m spatial resolution raster file by the Polygon to Raster tool [43].
Regarding Equation (3), the FA parameter was calculated from the digital elevation model (Figure 1B) using the Flow Accumulation tool [43]. The slope of the Cantareira System (S) was determined from the slope map. The LS factor was calculated using the Raster Calculator tool [43] based on each cell of the digital elevation model. Using the Editor tool [32], the values of the C and P factors were assigned to each land use class of the Cantareira System. The C and P factors were converted to a raster file with a spatial resolution of 30 m by Polygon to Raster tools [43].
The RUSLE factors were multiplied by the Raster Calculator tool [43], giving the spatial distribution of soil losses. The resulting maps were represented with a resolution of 30 m, standardized by the cell size of the digital elevation model (Figure 1A). The soil losses in the Cantareira System were classified as low (<10 Mg ha−1 yr−1), moderate (10–20 Mg ha−1 yr−1), high (20–50 Mg ha−1 yr−1) and very high (>50 Mg ha−1 yr−1) [35] by the Reclassify Raster tool [43]. In addition to determining priority areas for the adoption of conservation management, the results were compared with the Soil Loss Tolerance (T) [47] values by the Raster Calculator tool [43]. In the Cantareira System, the T values were determined to be 10.5, 11.6 and 13.9 Mg ha−1 yr−1 for the Argisols, Cambisols and Latosols, respectively [39,48].

2.4. Data Validation

The RUSLE estimates all water erosion that occurs in each area, both the soil that is eroded and retained in the relief and the fraction of soil that reaches water bodies. The estimation of sediment production, that is, the fraction of soil that reaches water bodies, is possible by integrating the sediment delivery rate coefficient (SDR) with the RUSLE model. The SDR was obtained by Equation (4) [49].
SDR = 0.472 × A 0.125
where SDR is the sediment delivery rate in %, and A is the catchment area in km2.
Sediment production can be directly observed and measured in the field, and the data are generally obtained from hydro-sedimentological monitoring stations of national monitoring institutions. The observed sediment delivery rate can be used to validate soil loss estimates. Therefore, after integrating the RUSLE results with the SDR, it was possible to validate the model results using data from total sediments transported with water discharge and daily runoff [50].
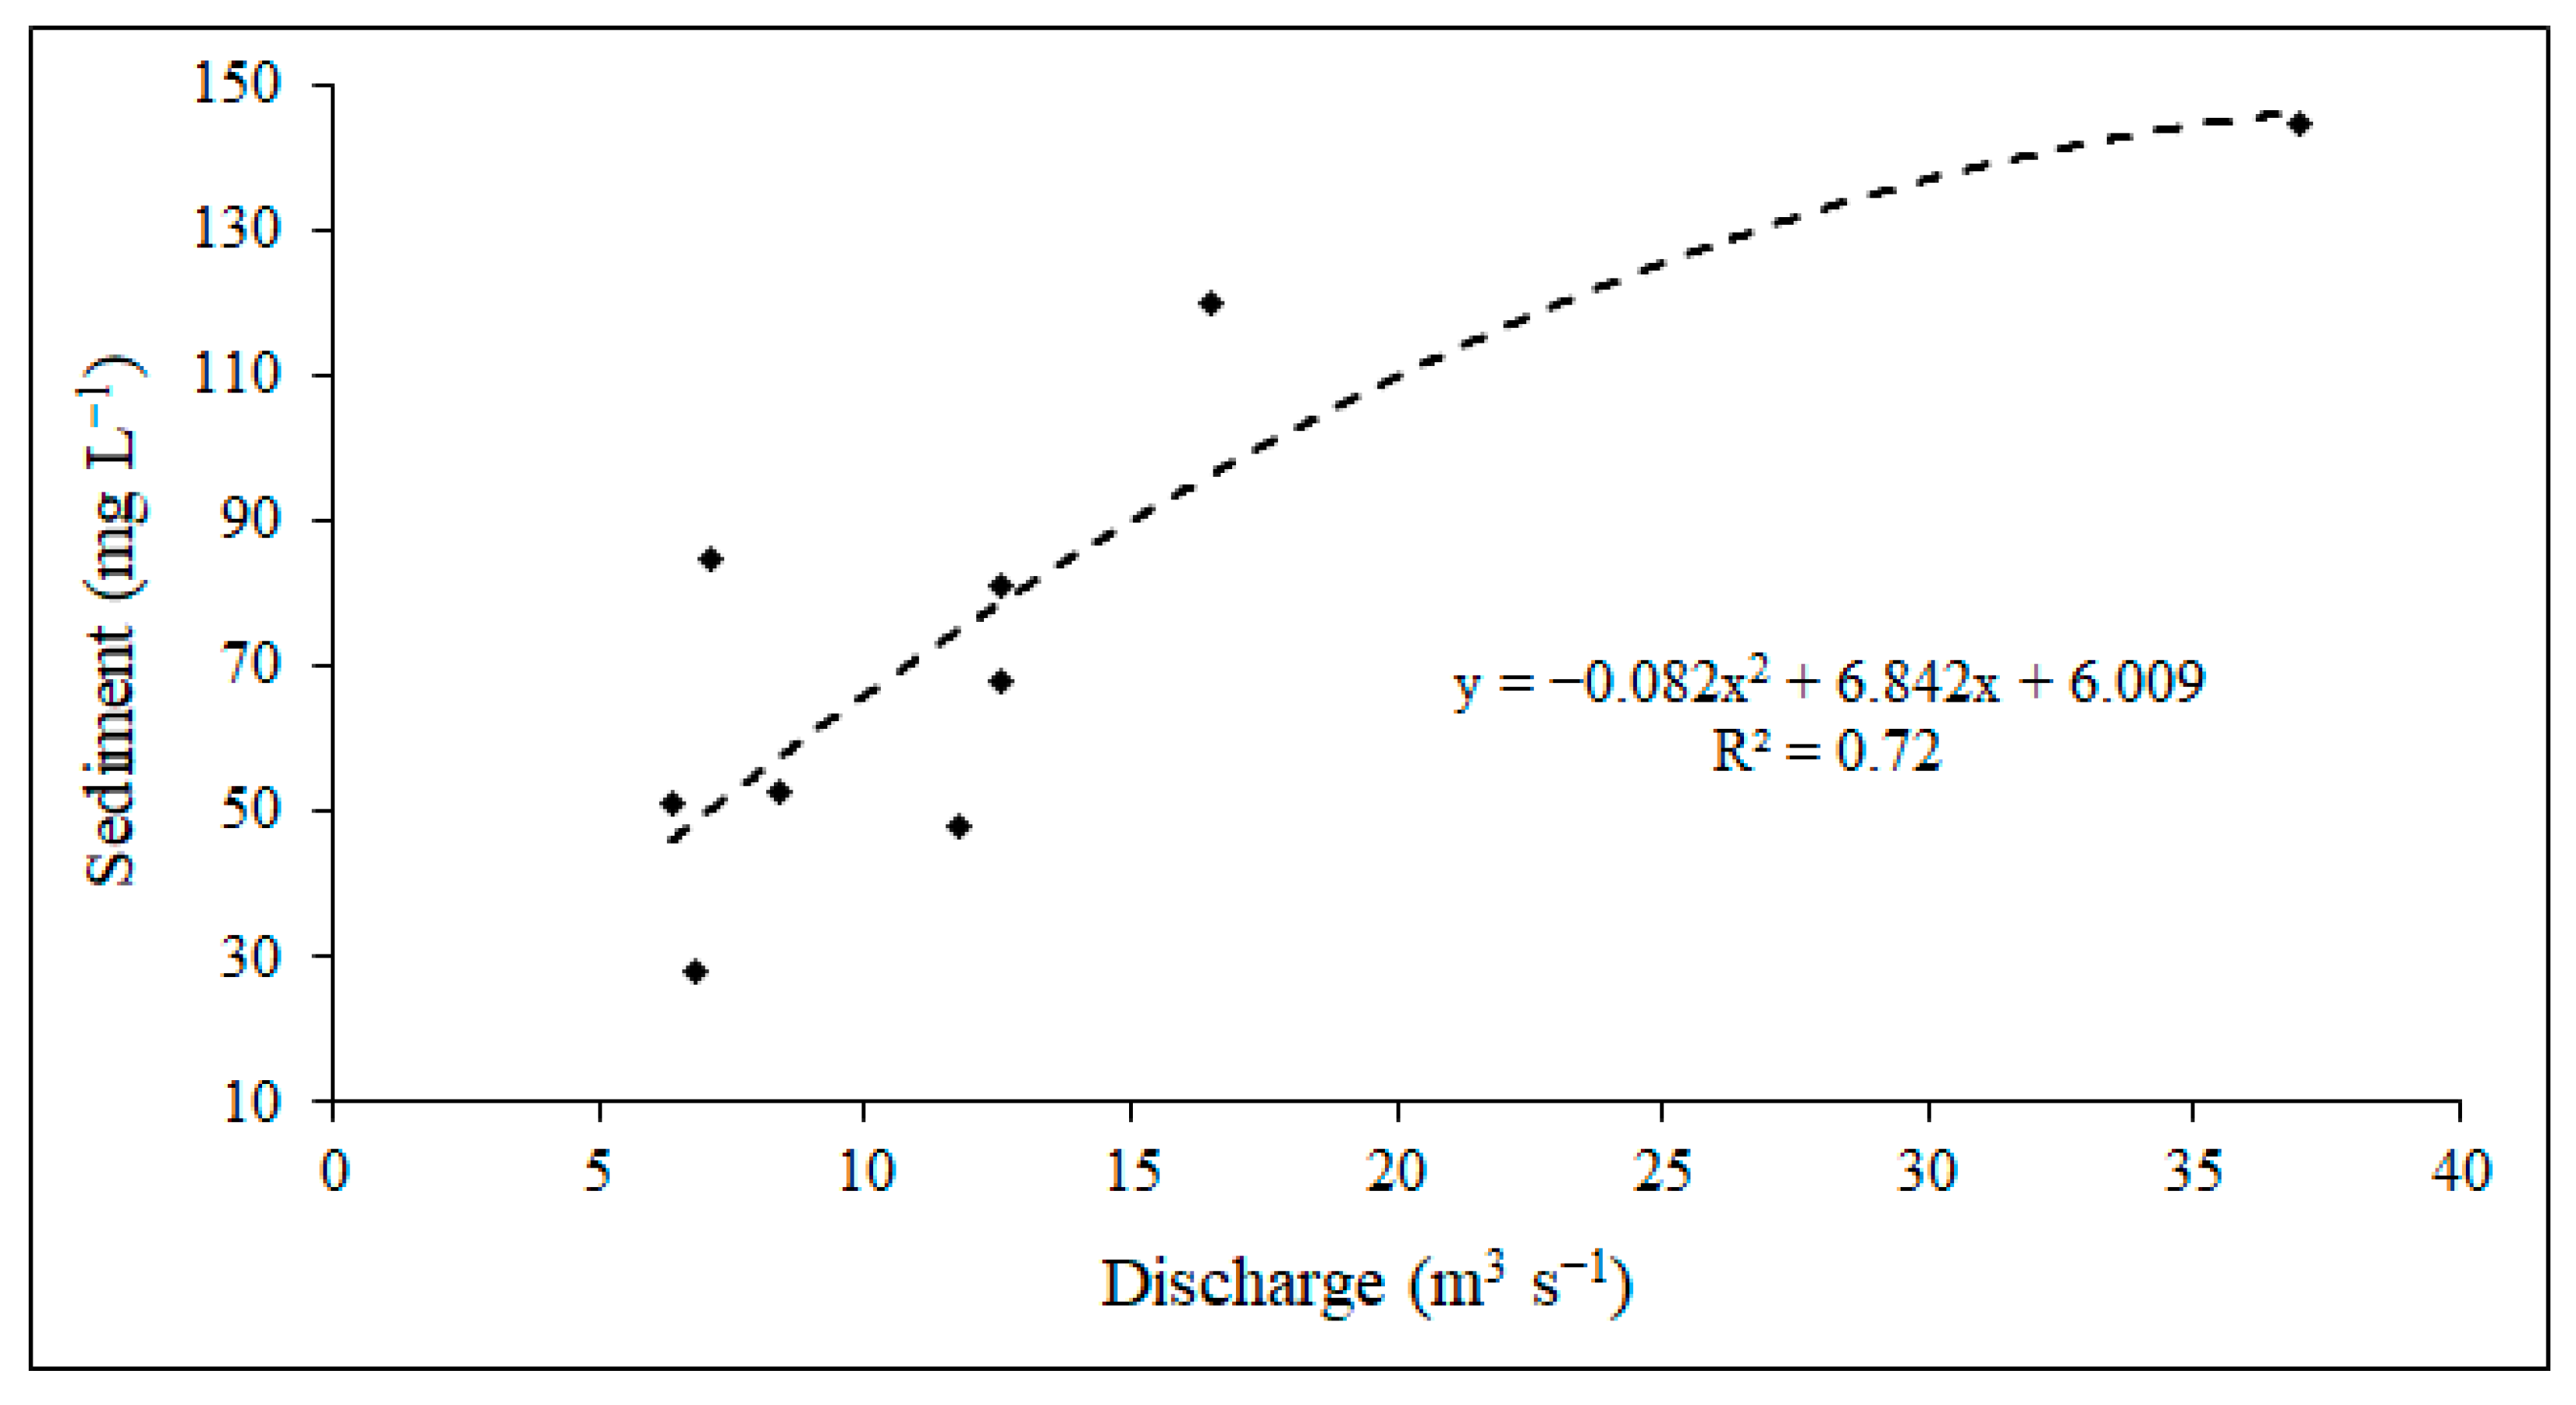
First, a curve was constructed relating the total sediments transported in the watershed and the water discharge (Figure 3). Data monitored between 2016 and 2021 at a hydro-sedimentological station located in the Jaguari River watershed were utilized (Figure 1A). This station is maintained by the Minas Gerais Institute for Water Resources Management—IGAM, and the data were obtained from the Hidroweb platform of the National Water and Basic Sanitation Agency. Although there are several sediment monitoring stations in the Cantareira System, there are stations with discontinuous and sparse measurements, and some are inoperative [51]. Due to this, the validation was based on a sub-catchment [50] of the study area.
The sediment production observed at the hydro-sedimentological station was calculated considering the sediment x flow curve and the daily flow dataset, referring to the Jaguari River Subbasin (400.5 km2), obtained from the National Water and Basic Sanitation Agency. The observed sediment was compared with the sediment estimated by the RUSLE/SDR.

3. Results and Discussions

3.1. RUSLE Factors

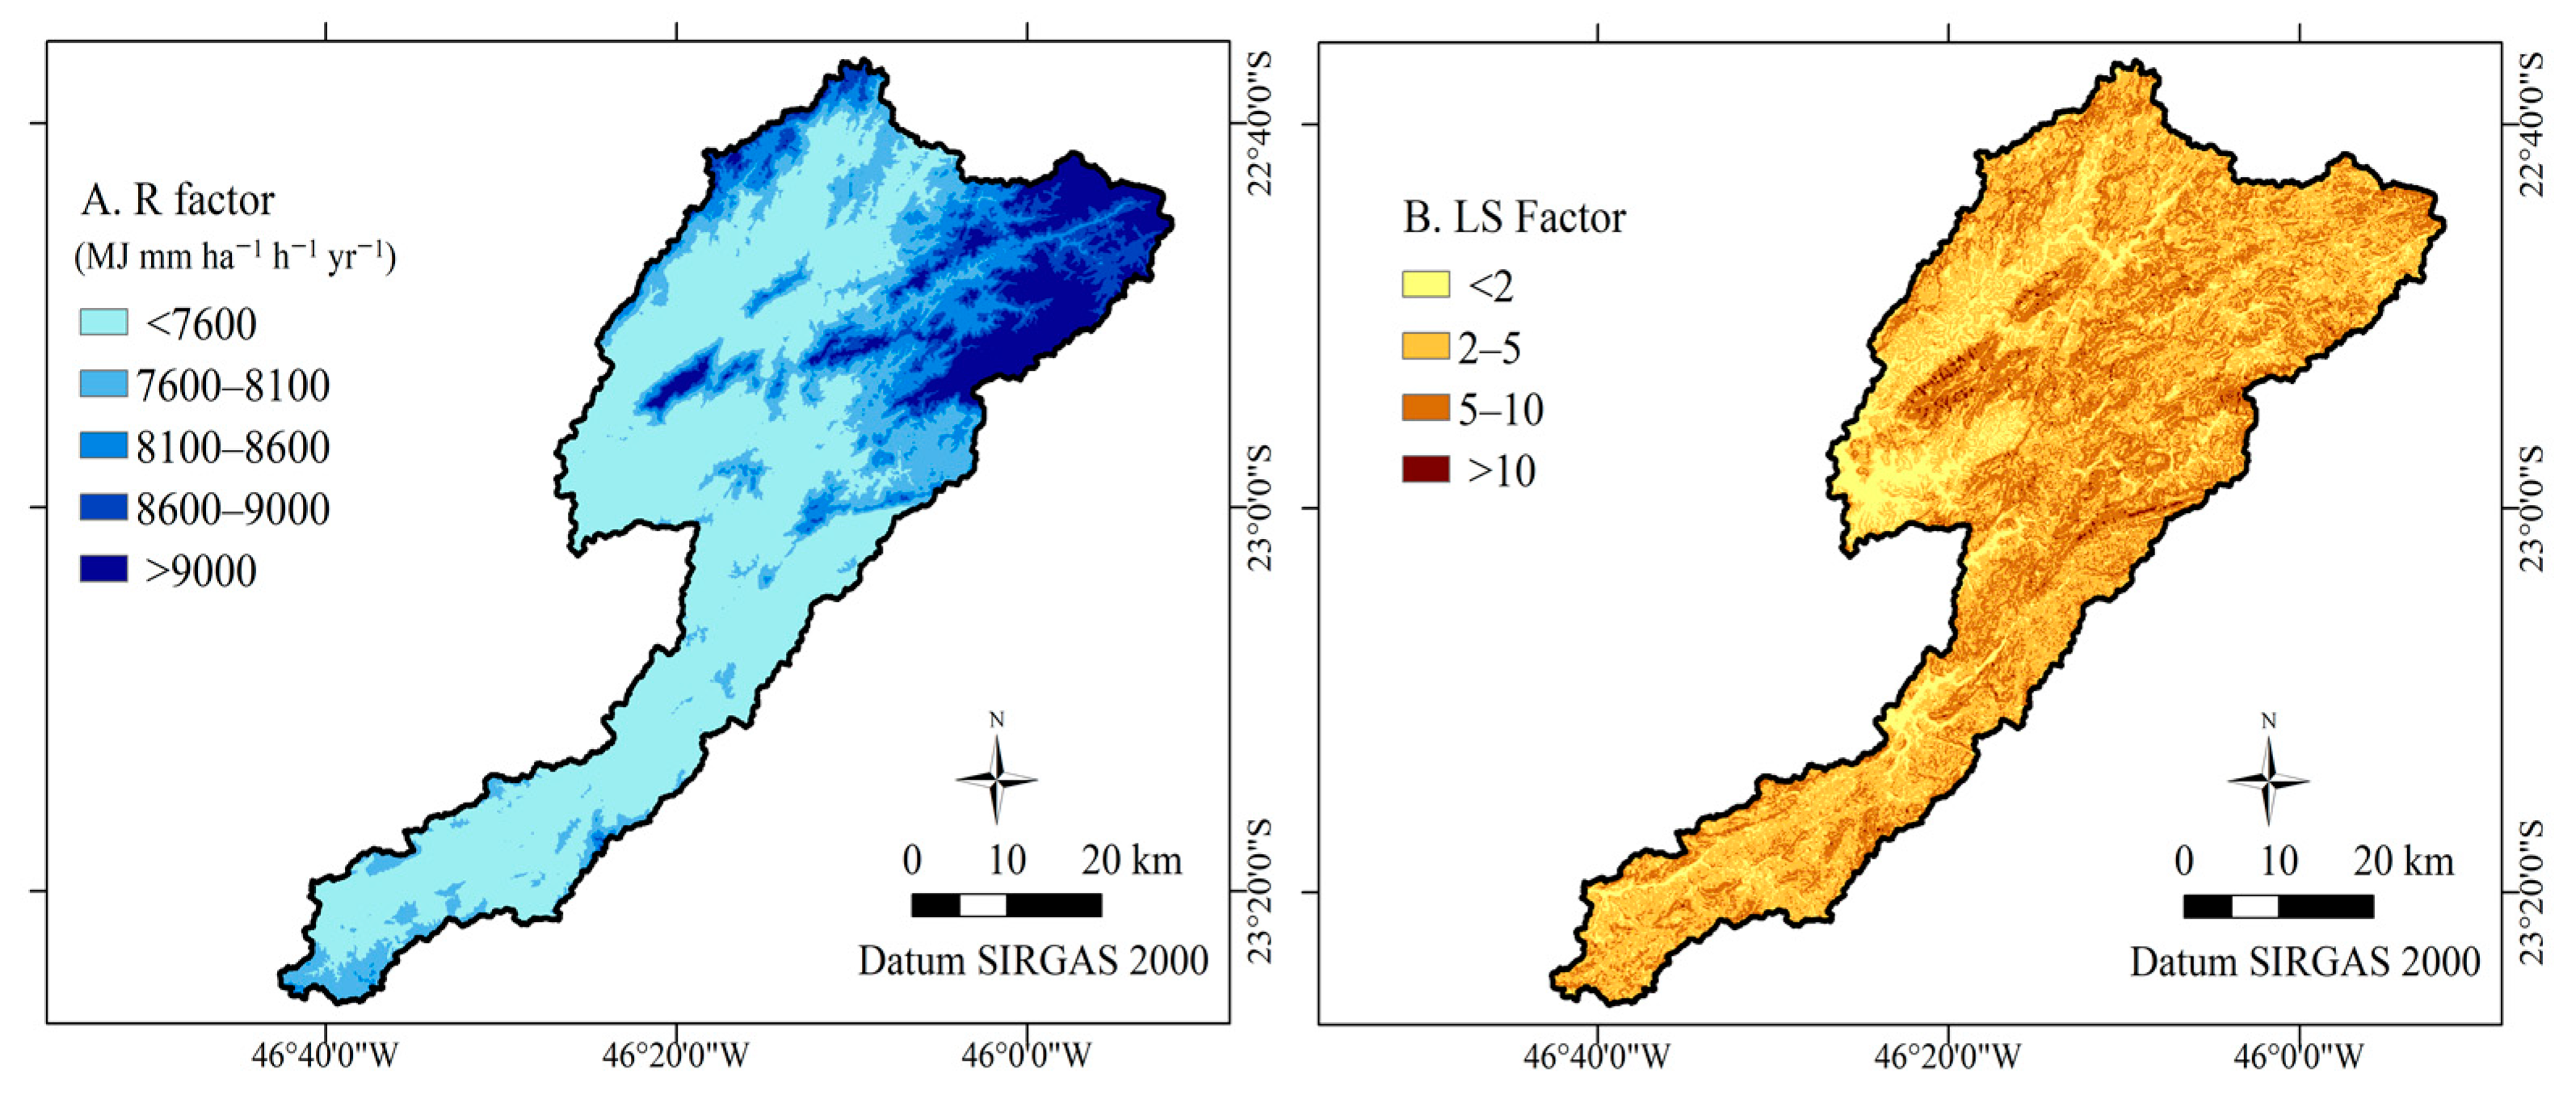
In the Cantareira System, the R factor ranged from 7203 to 12,448 MJ mm ha−1 h−1 yr−1, with an average value of 7843 mm ha−1 h−1 yr−1 (Figure 4A). The values show the region as of “strong erosivity” [36], due to heavy rains in the Cantareira System. The R values obtained are also consistent with those of the Tietê River watershed [34], adjacent to the studied area. In the Cantareira System, the highest values of R are associated with the highest altitudes in the northeast of the area. The highest R values occur predominantly in regions with a predominance of Argisols.
The average value of the LS factor is 4.2, and the maximum is 34 (Figure 4B). In this range, the sites with LS greater than 10, which represent only 1% of the area, may be highly susceptible to water erosion [50]. Despite the low percentage, such areas are distributed throughout the area (Figure 4B), which reveals the importance of sustainable soil and water management in tropical watersheds in southeastern Brazil [37]. The steepest areas play an important role in the hydrological cycle. Such areas concentrate the surface runoff of rainwater, which makes the soils more vulnerable to erosion and mass movements, causing damage to the quality of water and soils [26].
In the Cantareira System, in addition to the high values of R and LS (Figure 4), there is a predominance of Argisols and Cambisols with high erodibility (Figure 1E) and, consequently, high susceptibility to erosion associated with lower tolerance limits for soil loss. Therefore, sustainable management practices for C and P factors are essential to protect soils from erosion. In addition, in the Cantareira System, land use based on agricultural aptitude and the ability to use each soil is essential [52]. The sustainable use of the soil promotes the maintenance of organic matter in the soil, the improvement of its structure and water infiltration, the reduction of surface runoff and the need to add fertilizers and pesticides, and the mitigation of damages related to contamination, eutrophication and silting up of water bodies [34].

3.2. Soil Losses and Priority Areas for Conservation Management

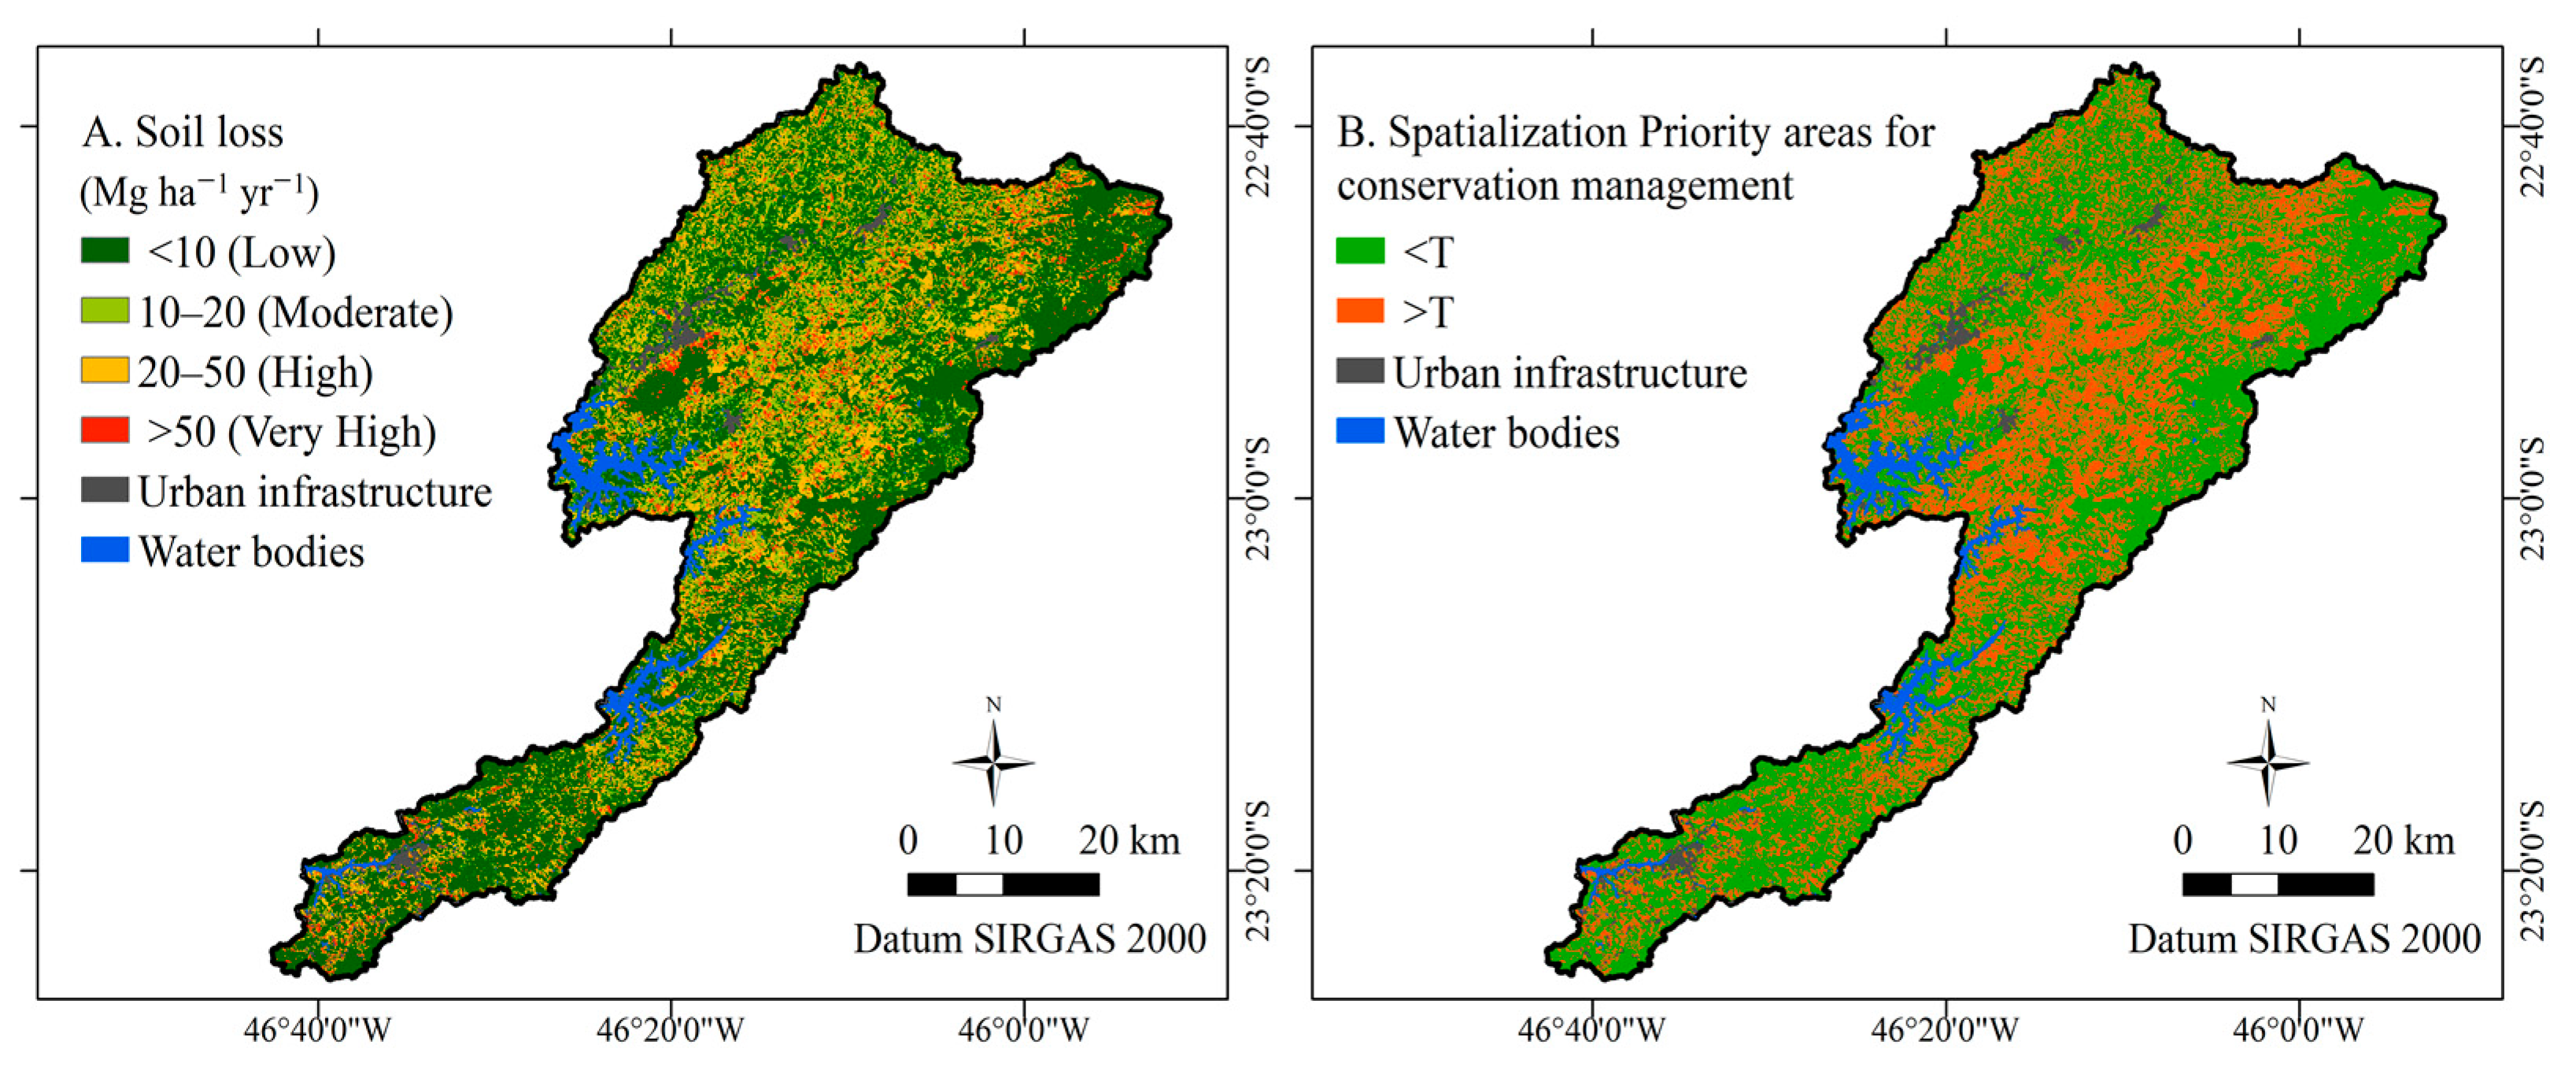
In the Cantareira System, in 62% of the area, low soil loss rates predominate, and, in 13.7%, they are moderate. However, in 17.3% (39,492 ha), soil losses are high and, in another 7% (15,979 ha), very high (Figure 5).
The soil loss estimates in the Cantareira System were compared with the Soil Loss Tolerance (T), which consists of an indicator index of the maximum intensity of the erosion process that still allows an economically sustainable production of agricultural crops [32,53]. Thus, the T values allow identifying priority areas for the adoption of erosion mitigation measures to promote soil sustainability [49,54]. In the Cantareira System, 34% of the area has losses above the T limits (Figure 5B).
The modeling by RUSLE estimated an average rate of soil loss for the region at 13 Mg ha−1 yr−1, which corresponds to an annual loss of about 3 million tons. On average, the results were well below the average of 30 Mg ha−1 yr−1 obtained by RUSLE for the entire state of São Paulo [52]. On the other hand, the results are similar to those of the Tietê River watershed, also in the state of São Paulo, with an average rate of soil loss of 8.9 Mg ha−1 yr−1 [34]. The variation in RUSLE results in areas that make up the same region could be attributed to methodological differences in obtaining its factors. However, the application of different methods for obtaining RUSLE factors in the same area resulted in similar magnitudes of soil loss rates [50,55]. The selection of the methodology for calculating the RUSLE factors depends on the data available for the area and the possibility of comparing the results with the erosion values observed in the field. However, in this case, the adopted methodology was validated by the data of total sediments observed in a hydro-sedimentological station.
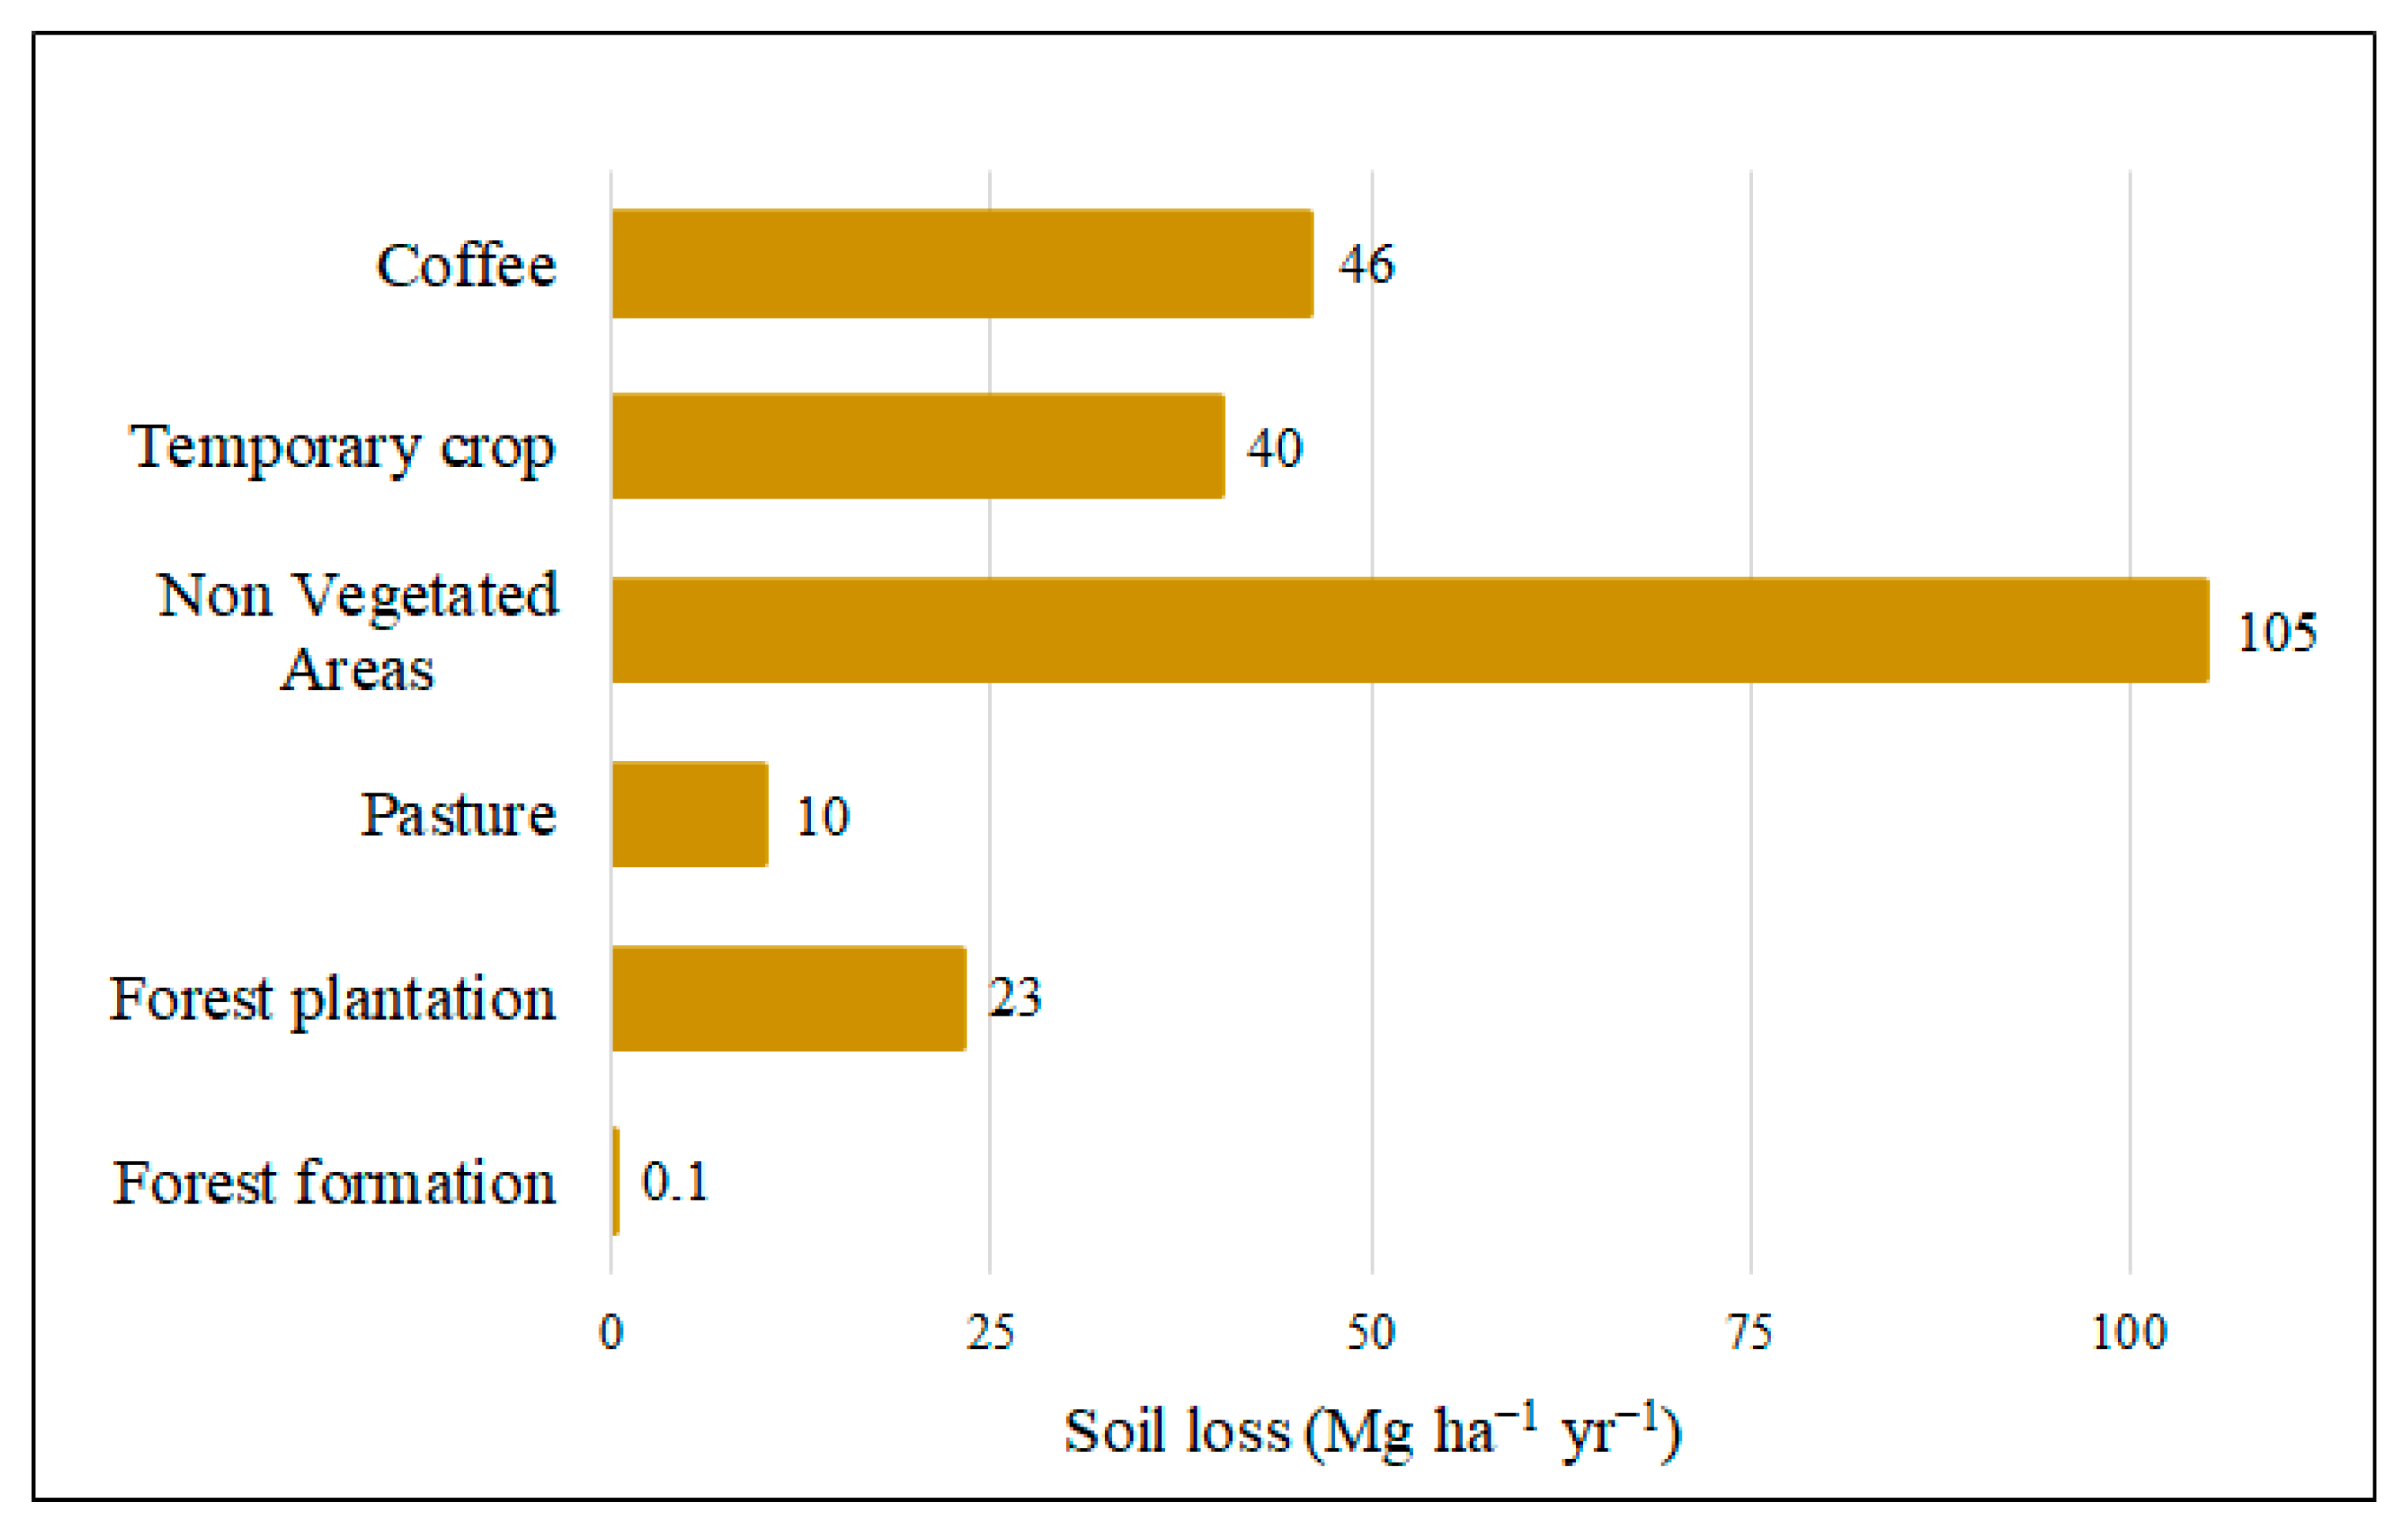
The predominance of areas with low soil loss in the Cantareira System (66%) is mainly due to the high percentage of forest formations (45.1%). The average rate of soil loss in this use was very low, 0.1 Mg ha−1 year−1, which points to the importance of natural and reforested vegetation cover in reducing soil loss and water conservation [34,35]. Notably, in the Cantareira System, important initiatives have recognized the role of forest cover in water management and its benefits, such as the reduction of erosion. These initiatives generate measures to implement forest restoration and conservation as a central strategy to protect the Cantareira System from the water crisis [14].
In the Cantareira System, soil and water conservation programs are worth mentioning, including the Nascentes Program of the state government of São Paulo, whose objective is to optimize and direct public and private resources for the restoration of degraded areas, the river basin committees that are responsible for water management planning, mediating conflicts over water resources and defining mechanisms for charging for water use, and the Water Producer Program of the Municipality of Extrema in Minas Gerais, created in 2005, which is a payment program for environmental services, whose main objective is to increase forest cover in sub-basins that drain into the Cantareira System, aiming to control the impacts of soil erosion on water quality to increase water infiltration and to promote aquifer recharge. The municipality allocates approximately 3% of its budget to the program, demonstrating the support of the local community with soil and water conservation [14,51].
It is worth highlighting the role of the Basic Sanitation Company of the state of São Paulo (SABESP), the public institution responsible for operating the Cantareira System, in managing the region’s soils. SABESP has been committed to reforesting and restoring its private areas and conserves approximately 35 thousand hectares of the Cantareira System [14]. In addition, federal and state laws, such as the Brazilian Forest Code and the São Paulo watershed law, are important legal instruments to encourage the conservation of natural resources in the Cantareira System.
Even in the face of water management and soil erosion reduction initiatives, 34% of the Cantareira System soil losses are above the limits of T. These areas are distributed throughout the region (Figure 5B). Considering that planted forests, agricultural crops and areas without vegetation presented average soil losses higher than T values (Figure 6), they are a priority for the adoption of measures to mitigate water erosion.
To reduce the impacts on the hydro-sedimentological cycle, mechanical, edaphic and vegetative conservationist practices must be adopted. In steep areas, techniques to slow surface runoff should be used, such as vegetation cords, border strips and windbreaks in watershed dividers. Channels and stairs can be used to direct flows from the slopes and relief breaks to the infiltration basins. In low areas and floodplains, the maintenance of riparian forests is essential. In general, level planting and terracing are efficient and relatively low-cost practices and should be widely used [34,56].
In temporary crops, the alternatives are direct planting, cultivation with minimal soil disturbance and alternating planting with legumes. In coffee and silviculture, practices that favor the maintenance of living or dead vegetation cover, such as alternating weeding and joint planting, combined with dense planting, are options. Integrated cropping, livestock and forestry systems, pasture rotation and edaphic practices can also be adopted [34,56].
The conversion of non-vegetated areas and degraded pastures into areas of sustainable agricultural production will promote the growth of agricultural production and the supply of ecosystem services and, at the same time, will prevent soil erosion [56]. Furthermore, areas with very high soil losses should be priority targets for conservation programs for the region’s natural resources. Identifying these priority areas for mitigating water erosion is essential for managing the Cantareira System, as random reforestation of 2% of the area would reduce sediment production by 8% [14]. However, by directing the restoration towards areas of greater susceptibility to erosion, the carrying of sediments into water bodies can be reduced by 36% [14].

3.3. Validation of Results

The sediment delivery rate (SDR) in the Jaguari River watershed was calculated at 0.22, indicating that 22% of soil losses in the region reach water bodies. By RUSLE/SDR integration, it was estimated that the region has an average sediment generation of 2.8 Mg ha−1 yr−1, whereas the observed sediment transport, which was calculated based on data from the hydro-sedimentological station, was 0.8 Mg ha−1 yr−1. Therefore, the RUSLE model overestimated soil losses in the Cantareira System region, like the overestimation also observed in modeling soil losses in the Rio Grande Basin in southeastern Brazil [50]. These results are supported by studies comparing RUSLE with other models for estimating soil loss and sediment generation, which showed that RUSLE tends to overestimate the results [57].
RUSLE overestimates soil losses and presents tolerable errors, but greater accuracy of the results is observed in areas with greater soil losses [55]. The spatial distribution of soil losses generated by RUSLE has good accuracy, and sites with high estimates are most susceptible to the erosion process [58].
Water erosion modeling is a representation of reality, and not reality itself, and is therefore subject to errors, which in most cases are acceptable [59]. In general, measured and modeled soil loss rates show the same order of magnitude [60,61]. Therefore, modeling is an efficient way to identify areas with different soil management [59].
Thus, the estimation of the RUSLE model for the Cantareira System should be interpreted as a tool capable of identifying areas with greater susceptibility to erosion and thereby directing resources and actions to priority locations in the adoption of conservationist measures for soil and water. In addition, the evaluation of erosion in large areas such as the Cantareira System is only economically viable by modeling. Estimating the magnitude of erosion and its spatial trends is essential for planning conservationist soil management and water conservation.

4. Conclusions

In the Cantareira System, 66% of the area has low soil losses, mainly attributed to areas with forest formations, which are the result of soil and water conservation programs implemented in the region. There are still areas with large soil losses (34%), demonstrating that advances are needed in the adoption of conservationist practices in crops, aiming to reduce the generation of sediments and increase the availability and quality of water in the Cantareira System.
The adopted methodology identified areas susceptible to soil loss and defined priority areas for the implementation of mitigation measures. The results contribute to the scientific debate on future works, bringing more information and knowledge to society and sector managers.

Author Contributions

Writing—original draft preparation, G.H.E.L.; conceptualization and review, R.L.M. and F.G.R.; writing—review and editing, L.L., J.E.B.A. and G.F.C.L. All authors have read and agreed to the published version of the manuscript.

Funding

This research received no external funding.

Data Availability Statement

Not applicable.

Acknowledgments

The authors thank the “Fundação de Amparo à Pesquisa do Estado de Minas Gerais—Brasil” (FAPEMIG) for the scholarship offered to the first author. This study was funded in part by the “Coordenação de Aperfeiçoamento de Pessoal de Nível Superior—Brasil” (CAPES)—Finance Code 001.

Conflicts of Interest

The authors declare no conflict of interest.

References

  1. Lisetskii, F.; Stolba, V.F.; Marinina, O. Indicators of Agricultural Soil Genesis under Varying Conditions of Land Use, Steppe Crimea. Geoderma 2015, 239–240, 304–316. [Google Scholar] [CrossRef] [Green Version]
  2. Chen, J.; Chen, J.-Z.; Tan, M.-Z.; Gong, Z.T. Soil Degradation: A Global Problem Endangering Sustainable Development. J. Geogr. Sci. 2002, 12, 243–252. [Google Scholar] [CrossRef]
  3. Bhattacharyya, R.; Ghosh, B.N.; Mishra, P.K.; Mandal, B.; Rao, C.S.; Sarkar, D.; Das, K.; Anil, K.S.; Lalitha, M.; Hati, K.M.; et al. Soil Degradation in India: Challenges and Potential Solutions. Sustainability 2015, 7, 3528–3570. [Google Scholar] [CrossRef] [Green Version]
  4. Pena, S.B.; Abreu, M.M.; Magalhães, M.R.; Cortez, N. Water Erosion Aspects of Land Degradation Neutrality to Landscape Planning Tools at National Scale. Geoderma 2020, 363, 114093. [Google Scholar] [CrossRef]
  5. Nilsson, C.; Berggren, K. Alterations of Riparian Ecosystems Caused by River Regulation: Dam Operations Have Caused Global-Scale Ecological Changes in Riparian Ecosystems. How to Protect River Environments and Human Needs of Rivers Remains One of the Most Important Questions of Our Time. BioScience 2000, 50, 783–792. [Google Scholar] [CrossRef]
  6. Lama, G.F.C.; Crimaldi, M.; Pasquino, V.; Padulano, R.; Chirico, G.B. Bulk Drag Predictions of Riparian Arundo Donax Stands through UAV-Acquired Multispectral Images. Water 2021, 13, 1333. [Google Scholar] [CrossRef]
  7. Pandey, A.; Chaube, U.C.; Mishra, S.K.; Kumar, D. Assessment of Reservoir Sedimentation Using Remote Sensing and Recommendations for Desilting Patratu Reservoir, India. Hydrol. Sci. J. 2016, 61, 711–718. [Google Scholar] [CrossRef]
  8. Fang, G.; Yuan, T.; Zhang, Y.; Wen, X.; Lin, R. Integrated Study on Soil Erosion Using RUSLE and GIS in Yangtze River Basin of Jiangsu Province (China). Arab. J. Geosci. 2019, 12, 173. [Google Scholar] [CrossRef]
  9. Chafai, A.; Brahim, N.; Shimi, N.S. Mapping of Water Erosion by GIS/RUSLE Approach: Watershed Ayda River—Tunisia Study. Arab. J. Geosci. 2020, 13, 810. [Google Scholar] [CrossRef]
  10. Asthana, B.N.; Khare, D. Reservoir Sedimentation. In Recent Advances in Dam Engineering; Asthana, B.N., Khare, D., Eds.; Springer International Publishing: Cham, Switzerland, 2022; pp. 265–288. ISBN 978-3-030-32278-6. [Google Scholar]
  11. Stefanidis, P.; Stefanidis, S. Reservoir Sedimentation and Mitigation Measures. Lakes Reserv. Sci. Policy Manag. Sustain. Use 2012, 17, 113–117. [Google Scholar] [CrossRef]
  12. Araújo, J.C.; Landwehr, T.; Alencar, P.H.L.; Paulino, W.D. Water Management Causes Increment of Reservoir Silting and Reduction of Water Yield in the Semiarid State of Ceará, Brazil. J. S. Am. Earth Sci. 2023, 121, 104102. [Google Scholar] [CrossRef]
  13. Santos, C.C.; Pereira Filho, A.J. Water Demand Forecasting Model for the Metropolitan Area of São Paulo, Brazil. Water Resour. Manag. 2014, 28, 4401–4414. [Google Scholar] [CrossRef]
  14. Ozment, S.; Gray, E.; Padovezi, A.; Hamel, P.; Ribeiro, J.B.; Barrêto, S.R.; Valente, T.P.; Feltran-Barbieri, R. Infraestrutura Natural para Água no Sistema Cantareira, em São Paulo; World Resources Institute: Washington, DC, USA, 2018; 92p, ISBN 978-1-56973-943-3. [Google Scholar]
  15. Taffarello, D.; Samprogna Mohor, G.; do Carmo Calijuri, M.; Mendiondo, E.M. Field Investigations of the 2013–14 Drought through Quali-Quantitative Freshwater Monitoring at the Headwaters of the Cantareira System, Brazil. Water Int. 2016, 41, 776–800. [Google Scholar] [CrossRef]
  16. Padulano, R.; Lama, G.F.C.; Rianna, G.; Santini, M.; Mancini, M.; Stojiljkovic, M. Future Rainfall Scenarios for the Assessment of Water Availability in Italy. In Proceedings of the 2020 IEEE International Workshop on Metrology for Agriculture and Forestry (MetroAgriFor), Trento, Italy, 4–6 November 2020; pp. 241–246. [Google Scholar]
  17. Pereira, V.R.; Teixeira Filho, J. Identificação das áreas susceptíveis aos processos erosivos em duas bacias do Sistema Cantareira por meio de diferentes cenários. Acta Sci. Agron. 2009, 31, 155–163. [Google Scholar] [CrossRef] [Green Version]
  18. Pompêo, M.; Moschini-Carlos, V.; Bitencourt, M.D.; Sòria-Perpinyà, X.; Vicente, E.; Delegido, J. Water Quality Assessment Using Sentinel-2 Imagery with Estimates of Chlorophyll a, Secchi Disk Depth, and Cyanobacteria Cell Number: The Cantareira System Reservoirs (São Paulo, Brazil). Enviorn. Sci. Pollut. Res. 2021, 28, 34990–35011. [Google Scholar] [CrossRef]
  19. Taffarello, D.; Srinivasan, R.; Mohor, G.S.; Guimarães, J.L.B.; do Carmo Calijuri, M.; Mendiondo, E.M. Modeling Freshwater Quality Scenarios with Ecosystem-Based Adaptation in the Headwaters of the Cantareira System, Brazil. Hydrol. Earth Syst. Sci. 2018, 22, 4699–4723. [Google Scholar] [CrossRef] [Green Version]
  20. Mortatti, B.C.; Enzweiler, J. Major Ions and Rare Earth Elements Hydrogeochemistry of the Atibaia and Jaguari Rivers Subbasins (Southeast Brazil). Appl. Geochem. 2019, 111, 104461. [Google Scholar] [CrossRef]
  21. Igwe, P.U.; Onuigbo, A.A.; Chinedu, O.C.; Ezeaku, I.I.; Muoneke, M.M. Soil erosion: A review of models and applications. IJAERS 2017, 4, 138–150. [Google Scholar] [CrossRef]
  22. Sabri, E.; Spalevic, V.; Boukdir, A.; Karaoui, I.; Ouallali, A.; Luiz Mincato, R.; Sestras, P. Estimation of soil losses and reservoir sedimentation: A case study in tillouguite sub-basin (high atlas-morocco). Agric. For. 2022, 68, 207–220. [Google Scholar] [CrossRef]
  23. Ganasri, B.P.; Ramesh, H. Assessment of Soil Erosion by RUSLE Model Using Remote Sensing and GIS—A Case Study of Nethravathi Basin. Geosci. Front. 2016, 7, 953–961. [Google Scholar] [CrossRef] [Green Version]
  24. Imamoglu, A.; Dengiz, O. Determination of Soil Erosion Risk Using RUSLE Model and Soil Organic Carbon Loss in Alaca Catchment (Central Black Sea Region, Turkey). Rend. Fis. Acc. Lincei 2017, 28, 11–23. [Google Scholar] [CrossRef]
  25. Alvares, C.A.; Stape, J.L.; Sentelhas, P.C.; de Moraes Gonçalves, J.L.; Sparovek, G. Köppen’s Climate Classification Map for Brazil. Meteorol. Z. 2013, 22, 711–728. [Google Scholar] [CrossRef] [PubMed]
  26. Uezu, A.; Sarcinelli, O.; Chiodi, R.; Jenkins, C.N.; Martins, C.S. Atlas Dos Serviços Ambientais Do Sistema Cantareira, 1st ed.; Memnon Edições Científicas; IPÊ—Instituto de Pesquisas Ecológicas: São Paulo, Brazil, 2017; ISBN 978-85-7954-113-1. [Google Scholar]
  27. Mapbiomas. Coleções MapBiomas. Available online: https://mapbiomas.org/colecoes-mapbiomas-1 (accessed on 13 February 2023).
  28. UFV—Universidade Federal de Viçosa; CETEC—Fundação Centro Tecnológico de Minas Gerais; UFLA—Universidade Federal de Lavras; FEAM—Fundação Estadual do Meio Ambiente. Mapa de solos do Estado de Minas Gerais: Legenda Expandida; Fundação Estadual do Meio Ambiente: Belo Horizonte, MG, Brasil, 2010; 49p, Available online: http://www.feam.br/noticias/1/949-mapas-de-solo-do-estado-de-minas-gerais (accessed on 19 December 2022).
  29. Rossi, M. Mapa Pedológico do Estado de São Paulo: Revisado e Ampliado; Instituto Florestal: São Paulo, SP, Brazil, 2017. [Google Scholar]
  30. Dias-Filho, M.B. Diagnóstico das Pastagens No Brasil; Embrapa Amazônia Oriental: Belém, PA, Brazil, 2014; 36p. [Google Scholar]
  31. Dias, L.C.P.; Pimenta, F.M.; Santos, A.B.; Costa, M.H.; Ladle, R.J. Patterns of Land Use, Extensification, and Intensification of Brazilian Agriculture. Glob. Chang. Biol. 2016, 22, 2887–2903. [Google Scholar] [CrossRef] [PubMed]
  32. Wischmeier, W.H.; Smith, D.D. Predicting Rainfall Erosion Losses—A Guide to Conservation Planning; Agriculture Handbook No. 537; United States Department of Agriculture: Washington, DC, USA, 1978; 67p.
  33. Renard, K.G.; Foster, G.R.; Weesies, G.A.; McCool, D.K.; Yoder, D.C. Predicting Soil Erosion by Water: A Guide to Conservation Planning with the Revised Universal Soil Loss Equation (RUSLE); Agriculture Handbook No. 703; United States Department of Agriculture: Washington, DC, USA, 1997; 384p.
  34. Lense, G.; Servidoni, L.; Parreiras, T.; Santana, D.; Bolleli, T.; Ernesto, J.; Spalevic, V.; Mincato, R. Modeling of Soil Loss by Water Erosion in the Tietê River Hydrographic Basin, São Paulo, Brazil. Semin. Cienc. Agrar. 2022, 43, 1403–1422. [Google Scholar] [CrossRef]
  35. Senanayake, S.; Pradhan, B.; Alamri, A.; Park, H.-J. A New Application of Deep Neural Network (LSTM) and RUSLE Models in Soil Erosion Prediction. Sci. Total Environ. 2022, 845, 157220. [Google Scholar] [CrossRef]
  36. Mello, C.R.; Viola, M.R.; Beskow, S.; Norton, L.D. Multivariate Models for Annual Rainfall Erosivity in Brazil. Geoderma 2013, 202–203, 88–102. [Google Scholar] [CrossRef]
  37. Steinmetz, A.A.; Cassalho, F.; Caldeira, T.L.; de Oliveira, V.A.; Beskow, S.; Timm, L.C. Assessment of Soil Loss Vulnerability in Data-Scarce Watersheds in Southern Brazil. Ciênc. Agrotec. 2018, 42, 575–587. [Google Scholar] [CrossRef] [Green Version]
  38. Zanchin, M.; Moura, M.M.; Nunes, M.C.M.; Tuchtenhagen, I.K.; Lima, C.R.L. Assessment of soil loss susceptibility in Santa Rita Watershed in southern Brazil. Eng. Agríc. 2021, 41, 485–495. [Google Scholar] [CrossRef]
  39. Mannigel, A.; De Passos, M.; Moreti, D.; Da, L.; Medeiros, R. Fator erodibilidade e tolerância de perda dos solos do Estado de São Paulo. Acta Scientiarum. Agron. 2002, 24, 1335–1340. [Google Scholar] [CrossRef]
  40. Silva, A.M.; Alvares, C.A. Levantamento de informações e estruturação de um banco dados sobre a erodibilidade de classes de olos no Estado de São Paulo. Geociências 2007, 24, 33–41. [Google Scholar]
  41. Mitasova, H.; Mitas, L.; Brown, W.M.; Johnston, D.M. Terrain Modeling and Soil Erosion Simulations for Fort Hood and Fort Polk Test Areas; U.S. Army Construction Engineering Research Laboratories: Champaign, IL, USA, 1999; p. 22. [Google Scholar]
  42. Silva, F.G.B.; Minotti, R.T.; Lombardi Neto, F.; Primavesi, O.; Crestana, S. Previsão da perda de solo na Fazenda Canchim—SP (EMBRAPA) utilizando geoprocessamento e o USLE 2D. Eng. Sanit. Ambient. 2010, 15, 141–148. [Google Scholar] [CrossRef] [Green Version]
  43. ESRI—Environmental Systems Research Institute. ARCGIS Professional GIS for the Desktop Version 10.5. Available online: https://desktop.arcgis.com/en/arcmap/10.5/get-started/setup/arcgis-desktop-quick-start-guide.htm (accessed on 13 February 2023).
  44. USGS—United States Geological Survey. Earth Explorer. Available online: https://earthexplorer.usgs.gov/ (accessed on 13 February 2023).
  45. Nunes, S.; Oliveira, L.; Siqueira, J.; Morton, D.C.; Souza, C.M. Unmasking Secondary Vegetation Dynamics in the Brazilian Amazon. Environ. Res. Lett. 2020, 15, 034057. [Google Scholar] [CrossRef]
  46. Alencar, A.A.C.; Arruda, V.L.S.; da Silva, W.V.; Conciani, D.E.; Costa, D.P.; Crusco, N.; Duverger, S.G.; Ferreira, N.C.; Franca-Rocha, W.; Hasenack, H.; et al. Long-Term Landsat-Based Monthly Burned Area Dataset for the Brazilian Biomes Using Deep Learning. Remote Sens. 2022, 14, 2510. [Google Scholar] [CrossRef]
  47. Di Stefano, C.; Ferro, V. Establishing soil loss tolerance: An overview. J. Agric. Eng. 2016, 47, 127–133. [Google Scholar] [CrossRef] [Green Version]
  48. Demarchi, J.C.; Zimback, C.R.L. Mapeamento, erodibilidade e tolerância de perda de solo na sub-bacia do Ribeirão das Perobas. Energ. NA Agric. 2014, 29, 102–114. [Google Scholar] [CrossRef] [Green Version]
  49. Vanoni, V.A. Sedimentation Engineering; American Society of Civil Engineers: Charleston, SC, USA, 2006; ISBN 978-0-7844-0823-0. [Google Scholar]
  50. Beskow, S.; Mello, C.R.; Norton, L.D.; Curi, N.; Viola, M.R.; Avanzi, J.C. Soil Erosion Prediction in the Grande River Basin, Brazil Using Distributed Modeling. Catena 2009, 79, 49–59. [Google Scholar] [CrossRef]
  51. Pontes, L.M.; Batista, P.V.G.; Silva, B.P.C.; Viola, M.R.; da Rocha, H.R.; Silva, M.L.N. Assessing Sediment Yield and Streamflow with SWAT Model in a Small Sub-Basin of the Cantareira System. Rev. Bras. Ciênc. Solo 2021, 45, e0200140. [Google Scholar] [CrossRef]
  52. Medeiros, G.d.O.R.; Giarolla, A.; Sampaio, G.; de Andrade Marinho, M. Estimates of Annual Soil Loss Rates in the State of São Paulo, Brazil. Rev. Bras. Ciênc. Solo 2016, 40, e0150497. [Google Scholar] [CrossRef] [Green Version]
  53. Bertol, I.; Almeida, J.A. Tolerância De Perda De Solo Por Erosão Para Os Principais Solos Do Estado De Santa Catarina. Rev. Bras. Ciência Solo 2000, 24, 657–668. [Google Scholar] [CrossRef] [Green Version]
  54. Nunes, J.G.; Campos, M.C.C.; Oliveira, F.P.; Nunes, J.C.; Macedo, J.A.B. Tolerância de perda de solo por erosão na região sul do Amazonas. Ambiência 2012, 8, 859–868. [Google Scholar] [CrossRef] [Green Version]
  55. Amorim, R.S.S.; da Silva, D.D.; Pruski, F.F.; Matos, A.T. de Avaliação do desempenho dos modelos de predição da erosão hídrica USLE, RUSLE e WEPP para diferentes condições edafoclimáticas do Brasil. Eng. Agríc. 2010, 30, 1046–1049. [Google Scholar] [CrossRef] [Green Version]
  56. Polidoro, J.C.; de Freitas, P.L.; Hernani, L.C.; dos Anjos, L.H.C.; Rodrigues, R.d.A.R.; Cesário, F.V.; de Andrade, A.G.; Ribeiro, J.L. Potential Impact of Plans and Policies Based on the Principles of Conservation Agriculture on the Control of Soil Erosion in Brazil. Land Degrad. Dev. 2021, 32, 3457–3468. [Google Scholar] [CrossRef]
  57. Efthimiou, N.; Lykoudi, E.; Karavitis, C. Comparative Analysis of Sediment Yield Estimations Using Different Empirical Soil Erosion Models. Hydrol. Sci. J. 2017, 62, 2674–2694. [Google Scholar] [CrossRef] [Green Version]
  58. Ebrahimzadeh, S.; Motagh, M.; Mahboub, V.; Mirdar Harijani, F. An Improved RUSLE/SDR Model for the Evaluation of Soil Erosion. Environ. Earth Sci. 2018, 77, 454. [Google Scholar] [CrossRef]
  59. Alewell, C.; Borrelli, P.; Meusburger, K.; Panagos, P. Using the USLE: Chances, challenges and limitations of soil erosion modelling. WASWAC 2019, 7, 203–225. [Google Scholar] [CrossRef]
  60. Alewell, C.; Egli, M.; Meusburger, K. An attempt to estimate tolerable soil erosion rates by matching soil formation with denudation in Alpine grasslands. J. Soils Sediments 2015, 15, 1383–1399. [Google Scholar] [CrossRef] [Green Version]
  61. Meusburger, K.; Konz, N.; Schaub, M.; Alewell, C. Soil erosion modelled with USLE and PESERA using QuickBird derived vegetation parameters in an alpine catchment. Int. J. Appl. Earth Obs. Geoinf. 2010, 12, 208–215. [Google Scholar] [CrossRef]
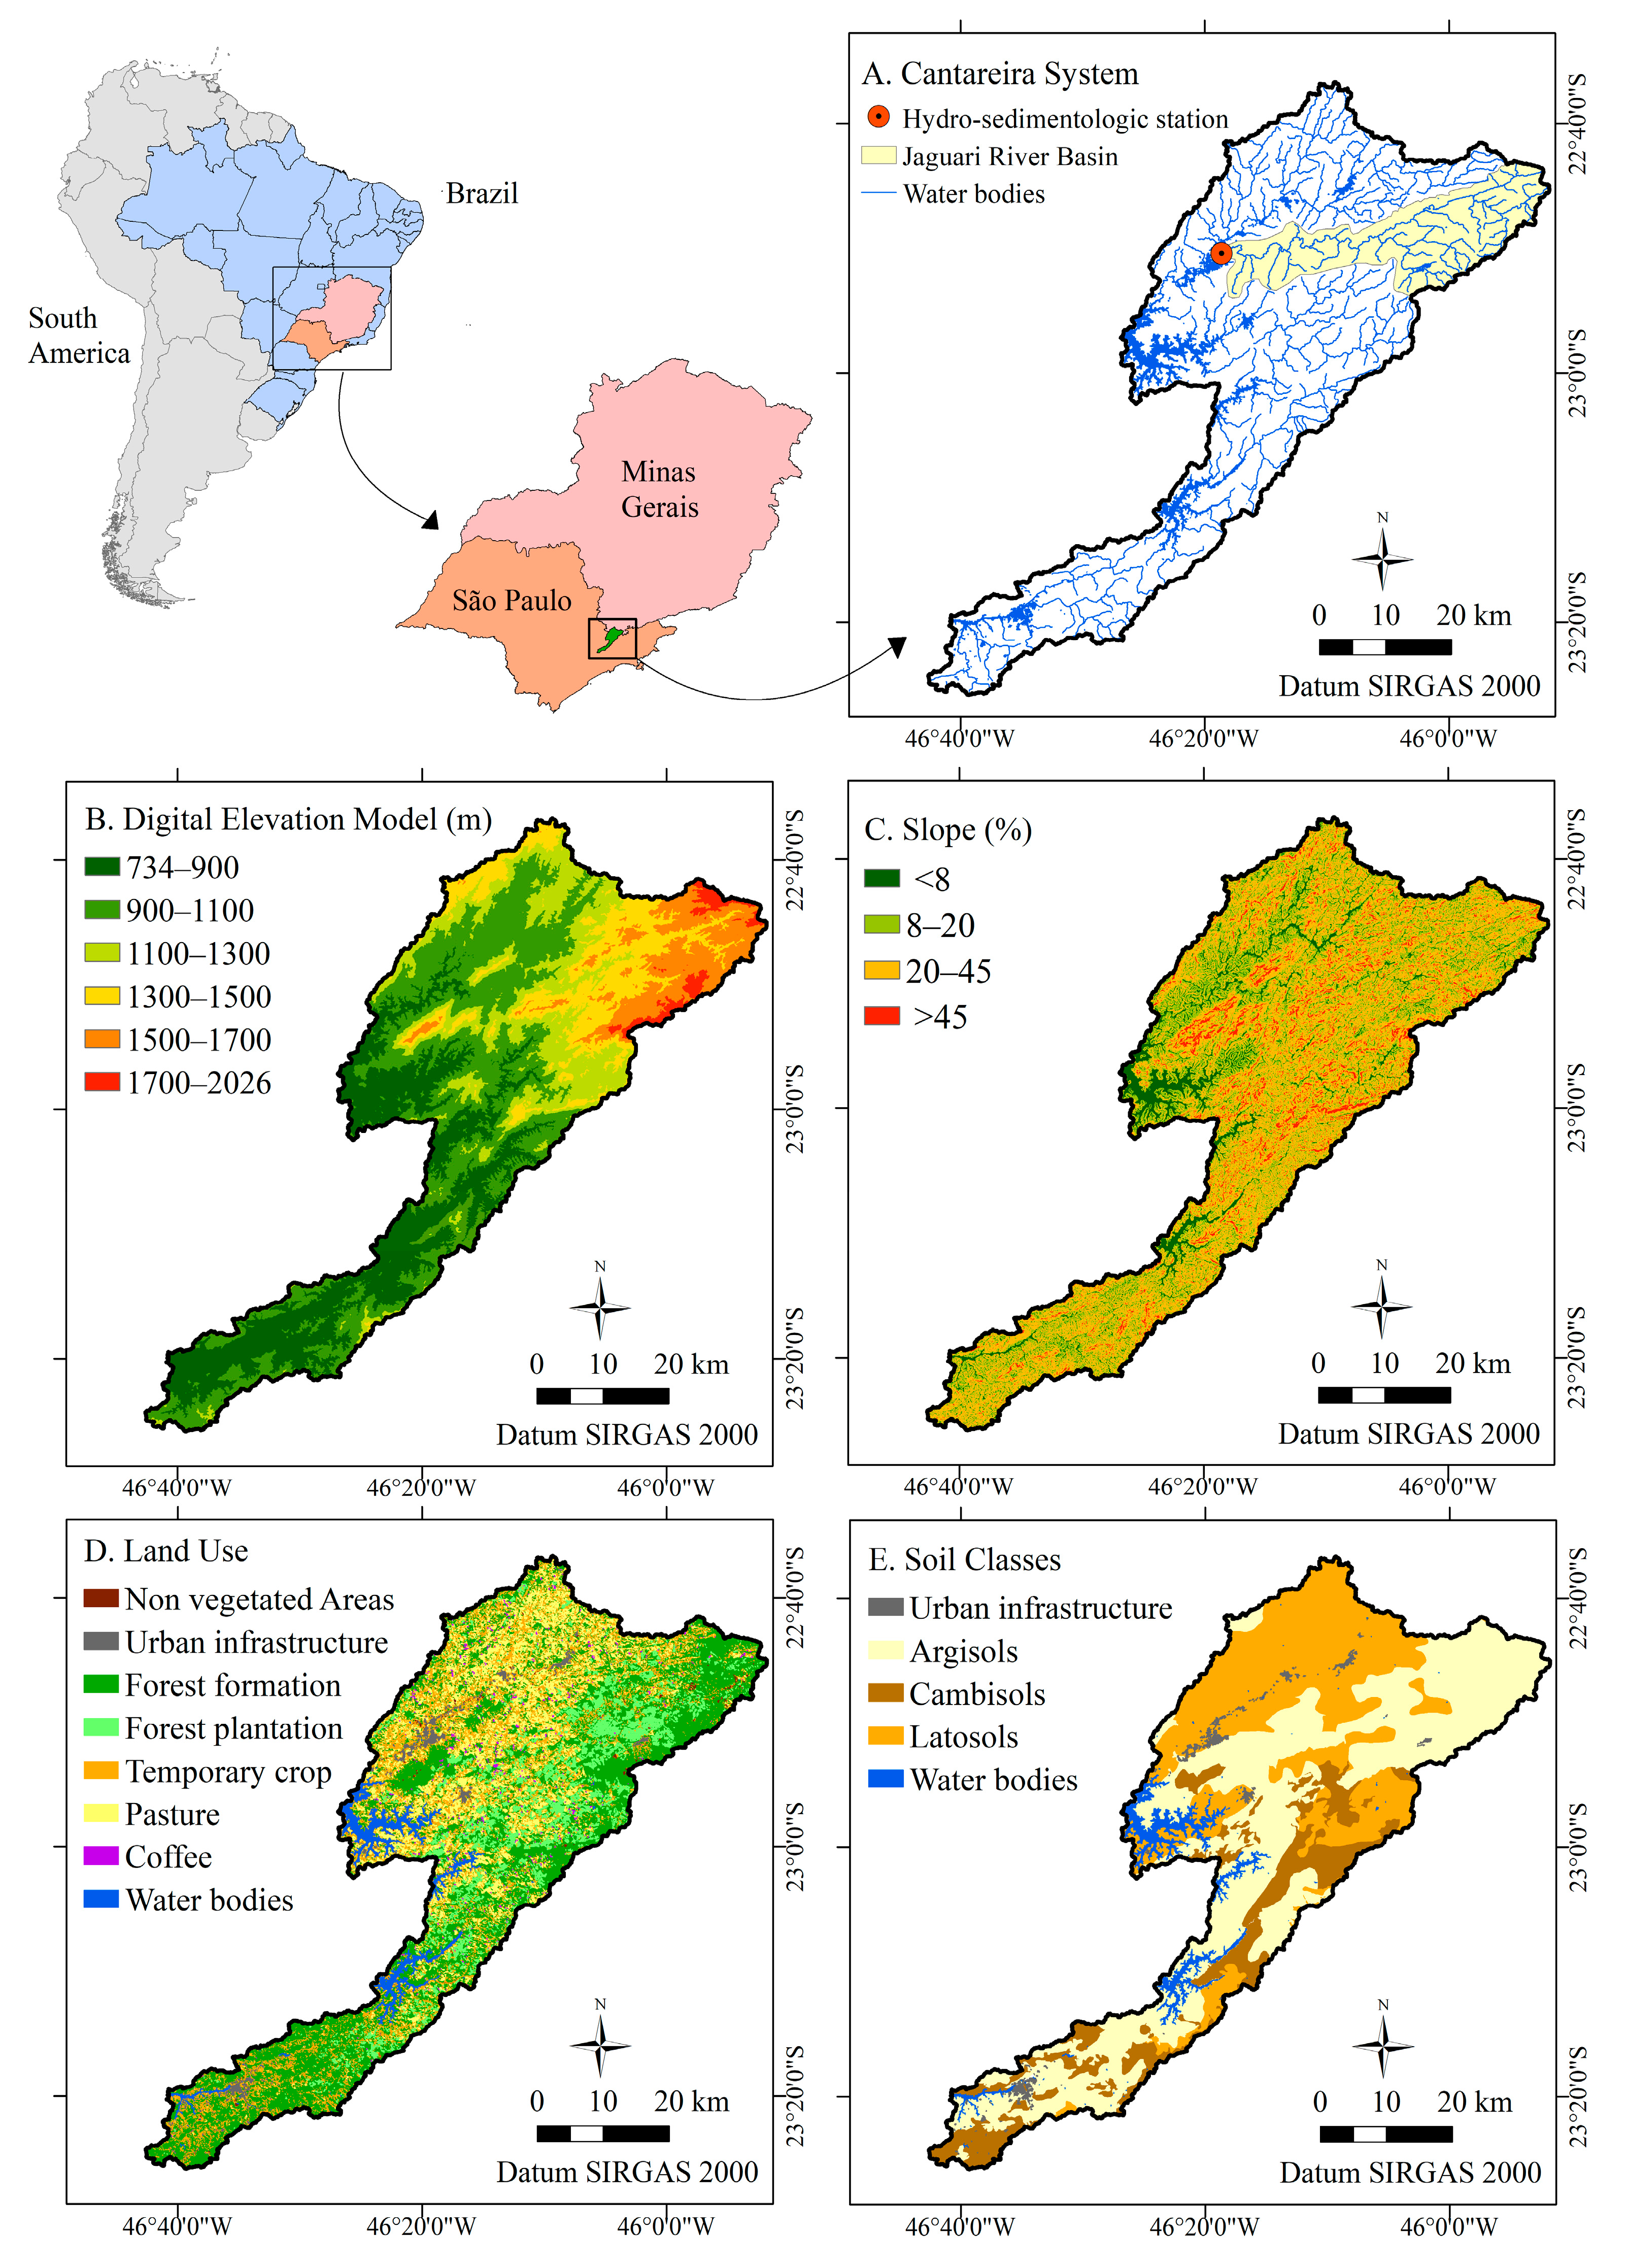
Figure 1. Study area settings. (A) Location of the study area; (B) digital elevation model (m a.s.l.); (C) slope map; (D) land use map from Mapbiomas, Collection 7 [27] and (E) soil class map of the Cantareira System adapted from soil maps of the states of Minas Gerais [28] and São Paulo [29]. The geographic coordinate system is UTM Sirgas 2000. The basemap is available on ArcMap v. 10.5.
Water 15 01490 g001
Figure 2. Flow chart of the methods used to estimate soil erosion.
Water 15 01490 g002
Figure 3. Water discharge curve (sediment transported × water discharge) in the Jaguari River Hydrographic Subbasin, Brazil.
Water 15 01490 g003
Figure 4. Map of the spatial distribution of the rainfall erosivity factor—R (A) and the topographic factor—LS (B) in the Cantareira System, Brazil. Note: factor LS = dimensionless. The geographic coordinate system is UTM Sirgas 2000. The basemap is available on ArcMap v. 10.5.
Water 15 01490 g004
Figure 5. Map of the spatial distribution of soil loss rates (A) and priority areas for conservation management (B) in the Cantareira System, São Paulo, Brazil. The geographic coordinate system is UTM Sirgas 2000. The basemap is available on ArcMap v. 10.5.
Water 15 01490 g005
Figure 6. Land use classes and soil loss rates in the Cantareira System, São Paulo, Brazil.
Water 15 01490 g006
Disclaimer/Publisher’s Note: The statements, opinions and data contained in all publications are solely those of the individual author(s) and contributor(s) and not of MDPI and/or the editor(s). MDPI and/or the editor(s) disclaim responsibility for any injury to people or property resulting from any ideas, methods, instructions or products referred to in the content.