Article

The Salinity of the Great Salt Lake and Its Deep Brine Layer

by
Madeline F. Merck
* and
David G. Tarboton
Utah Water Research Laboratory, Utah State University, Logan, UT 84322, USA
*
Author to whom correspondence should be addressed.
Water 2023, 15(8), 1488; https://doi.org/10.3390/w15081488
Submission received: 8 March 2023 / Revised: 5 April 2023 / Accepted: 7 April 2023 / Published: 11 April 2023

Abstract

:
The Great Salt Lake is a highly saline terminal lake with considerable fluctuations in water surface elevation and salinity. The lake is divided into two arms by a railroad causeway. River inflows enter the larger south arm, while the north arm only receives minimal surface runoff. Evaporation from both arms and limited exchange of water and salt through causeway openings result in complex water and salinity processes in the lake. The north arm is typically homogeneous and close to saturation. The south arm is typically stratified with periodic occurrences of a deep brine layer. This paper analyzes the lake’s long-term historical salinity and water surface elevation data record. Its purpose is to better document the movement of salt and changes to salinity in time and space within the lake and the occurrence and extent of its deep brine layer. This work is important because of the lake’s salinity-dependent ecosystem and industries as well as the role played by the deep brine layer in the concentration of salt and contaminants. We documented that the deep brine layer in the south arm is intermittent, occurring only when causeway exchange supports flow from the north to the south arms. We found that the overall mass of salt in the lake is declining and quantified this in terms of mineral extraction records and historical density measurements.

1. Introduction

The high concentrations of minerals and salts in the Great Salt Lake (GSL) are not only characteristic features of this terminal lake’s water but also its greatest economic and ecologic assets. The distribution of constituents and contaminants within the GSL impact the lake’s ecology and economy. Changes in salinity, dissolved oxygen, nutrients, and contaminants, especially when entrained into the upper layers of the water, can be harmful to brine shrimp, brine fly, and algae the shrimp feed on [1]. These disruptions propagate up the food chain, affecting migratory bird populations [2]. Changes in salinity can also affect mineral extraction, which is an important economic use of the lake. While high salinity makes mineral extraction easier, the lower lake water surface elevation (WSE) associated with higher salinity requires more extensive and expensive mineral extraction brine intakes [3,4]. The total mass of salt in the GSL has been decreasing [5,6,7]. The findings reported here show that the mineral extraction industry is removing much more salt than is added through river and other inputs.
The hypersaline water in the GSL is several times saltier than the ocean and is prone to stratification [8], resulting in lower concentrations of salt and other constituents at the lake’s surface and much higher concentrations at the lake’s bottom. These higher concentrations at the lake’s bottom are often referred to as the deep brine layer (DBL) [1,5,9,10,11,12]. To further complicate matters, the GSL is divided into two distinct arms by an earthen railroad causeway, which was constructed in 1959 by the Union Pacific Railroad Company (Figure 1). Gilbert Bay, the lake’s south arm, receives 95% of the freshwater input from three major rivers entering along the southern and eastern shores [5]. In Gunnison Bay, the lake’s north arm, water input is limited to direct precipitation and intermittent runoff. Evaporation removes water from the lake, but not salt, and is the only form of outflow from either arm, resulting in the high mineral and salt content of the lake water. The imbalances in inflow to each arm lead to an average salinity of the north arm that is as much as twice that of the south arm.
Over the last several decades, various state and federal agencies have collected data on salinity, temperature, density, and other GSL lake water constituents at multiple locations in the lake (Figure 1). Most of the data collection started in 1966 shortly after construction of the causeway. Although the Utah Geological Survey (UGS), United Stated Geological Survey (USGS), and other organizations (both public and private) have monitored salinity in the GSL since the 1960s, the variability in the distribution of salinity and the occurrence and extent of the DBL within the lake over the period of record are not fully known. Yang et al. [11] noted that stratification in the south arm is associated with bi-directional exchange flow through the causeway, observing that destratification occurred within six months of causeway culvert closures in 2013. This has ramifications of displacing contaminants, such as selenium and methylmercury [10,13,14], which can negatively impact the GSL’s ecology. In particular, the DBL stratification acts as a cap that prevents oxygen from the overlying mixed layer coming into contact with sediment organic matter on the lakebed, which drives the accumulation of methylmercury in deep waters. A more recent study [15] examined salt mass transfer and changing salinities in each arm of the GSL for the decade centered on 2016, when a new causeway breach and salinity control berm were opened. While their work informs immediate adaptive management, there is a need for a more holistic analysis of GSL salinity over the full record. Our paper addresses this need.
This paper presents an analysis and visualization of the full historical salinity data record for the GSL. Its purpose is to examine the distribution of salinity and the occurrence and extent of the DBL across space and time for use in future planning and management of the lake. Specifically, based on our analysis of all available data over an extended period, we are interested in more comprehensively understanding the following questions:
  • How does salinity change within the lake?
  • How does the DBL fluctuate in time, space, and concentration?
  • How does surface salinity relate to average salinity and the DBL?
  • How does salt move between the north and south arms?
  • How has the total salt mass changed over time?
While prior work has, to some extent, addressed some of these questions, the work presented here more fully documents the changes in salinity, stratification, and the intermittency of the DBL, and it sharpens our understanding of the answers to these questions.

2. Materials and Methods

Data used in our analysis include lake bathymetry, WSE, salinity and density, water withdrawals for mineral extraction, and west desert pumping and return flows. Salinity calculations were based on the Naftz et al. [16] equation of state (Equation (1), Section 2.3), and salt mass was determined using salinity and lake volume.

2.1. Bathymetry

A digital elevation model (DEM) was prepared by combining multiple elevation datasets into one contiguous DEM for the GSL and surrounding area. In general, elevations above 1280 m (4200 feet) were derived from the 10-meter National Elevation Dataset (NED) DEM, which was downloaded from the Utah Automated Geographic Reference Center in 2010. Elevations at and below 1280 m (4200 feet) came from a DEM representing the bathymetry of the entire lake, which was obtained from BIO-WEST, Inc. and was derived from the following data sources:
  • North and south arm contours from USGS [17,18];
  • Farmington Bay contours from Baskin [19] and modified by BIO-WEST in 2010, including minor contour manipulation and the introduction of a 1280 m (4200 foot) contour at the south end of the bay;
  • Bear River Bay survey by Hansen & Associates [20] under a contract with BIO-WEST.
For consistency with the DEM from BIO-WEST, the NED DEM heights were converted from their native North American Vertical Datum 1988 (NAVD88) elevations to National Geodetic Vertical Datum (NGVD29) by subtracting 0.97 m prior to merging the two.
DEMs for areas within the lake were created using tools in ArcGIS [21]. First, triangular irregular networks were created from the bathymetric contours utilizing vertices as mass points. Then, the ArcGIS Mosaic to New Raster tool was used to merge bathymetric DEMs with the upland DEM of the area surrounding the lake. This was completed such that bathymetric values would replace the upland values at and below 1280 m (4200 feet). Finally, another mosaicking process was performed to fix minor imperfections and fill “no data” values at the edges of adjoining DEMs. The resulting DEM was clipped approximately 5 km beyond the 1287.75 m (4225 foot) contour. The volume and area of each arm of the lake were then obtained in 0.15 m (0.5 foot) elevation increments using the completed DEM as input to the Surface Volume tool in ArcGIS. The resulting DEM is stored in HydroShare [22]. The volumes and areas used are also in HydroShare [23]. This paper used the total volume in each arm, including areas now separated into mineral extraction evaporation ponds because, at the times the lake was high, these pond areas were effectively part of the lake due to either being breached or not yet being constructed.

2.2. Water Surface Elevation Data

GSL lake WSE data are available through the USGS National Water Information System (NWIS) website (USGS Site Numbers 10010000 and 10010100, in https://maps.waterdata.usgs.gov/mapper (accessed on 1 March 2013). The earliest WSE was recorded for the GSL on 18 October 1847. North arm WSE records start on 15 April 1966, nearly seven years after the causeway was constructed. Therefore, it is necessary to use the south arm WSE as a close proxy for the time between 1959, when the lake was divided, and 1966, when measurement of the north arm WSE began. The average monthly lake WSE for each arm was calculated on the first day the month as the average of the previous month.

2.3. Water Sample Data

Measured and recorded point sampling data from UGS and USGS include depth, density, temperature, and many other lake water constituents and characteristics. Lake water samples were collected with varying frequency at 70 sites (Figure 1, Figure 2 and Figure 3) from 1966 to present. UGS sampling began in 1966 and is represented by 58 sites. These data are found in the Great Salt Lake Brine Chemistry Database and are available through the UGS website (https://geology.utah.gov/map-pub/data-databases/ (accessed on 1 March 2013)). USGS sampling began in 1995 and is represented by 12 sites. These data are available through the NWIS website (https://maps.waterdata.usgs.gov/mapper (accessed on 1 March 2013)) using the site numbers from Figure 1 and Figure 2.
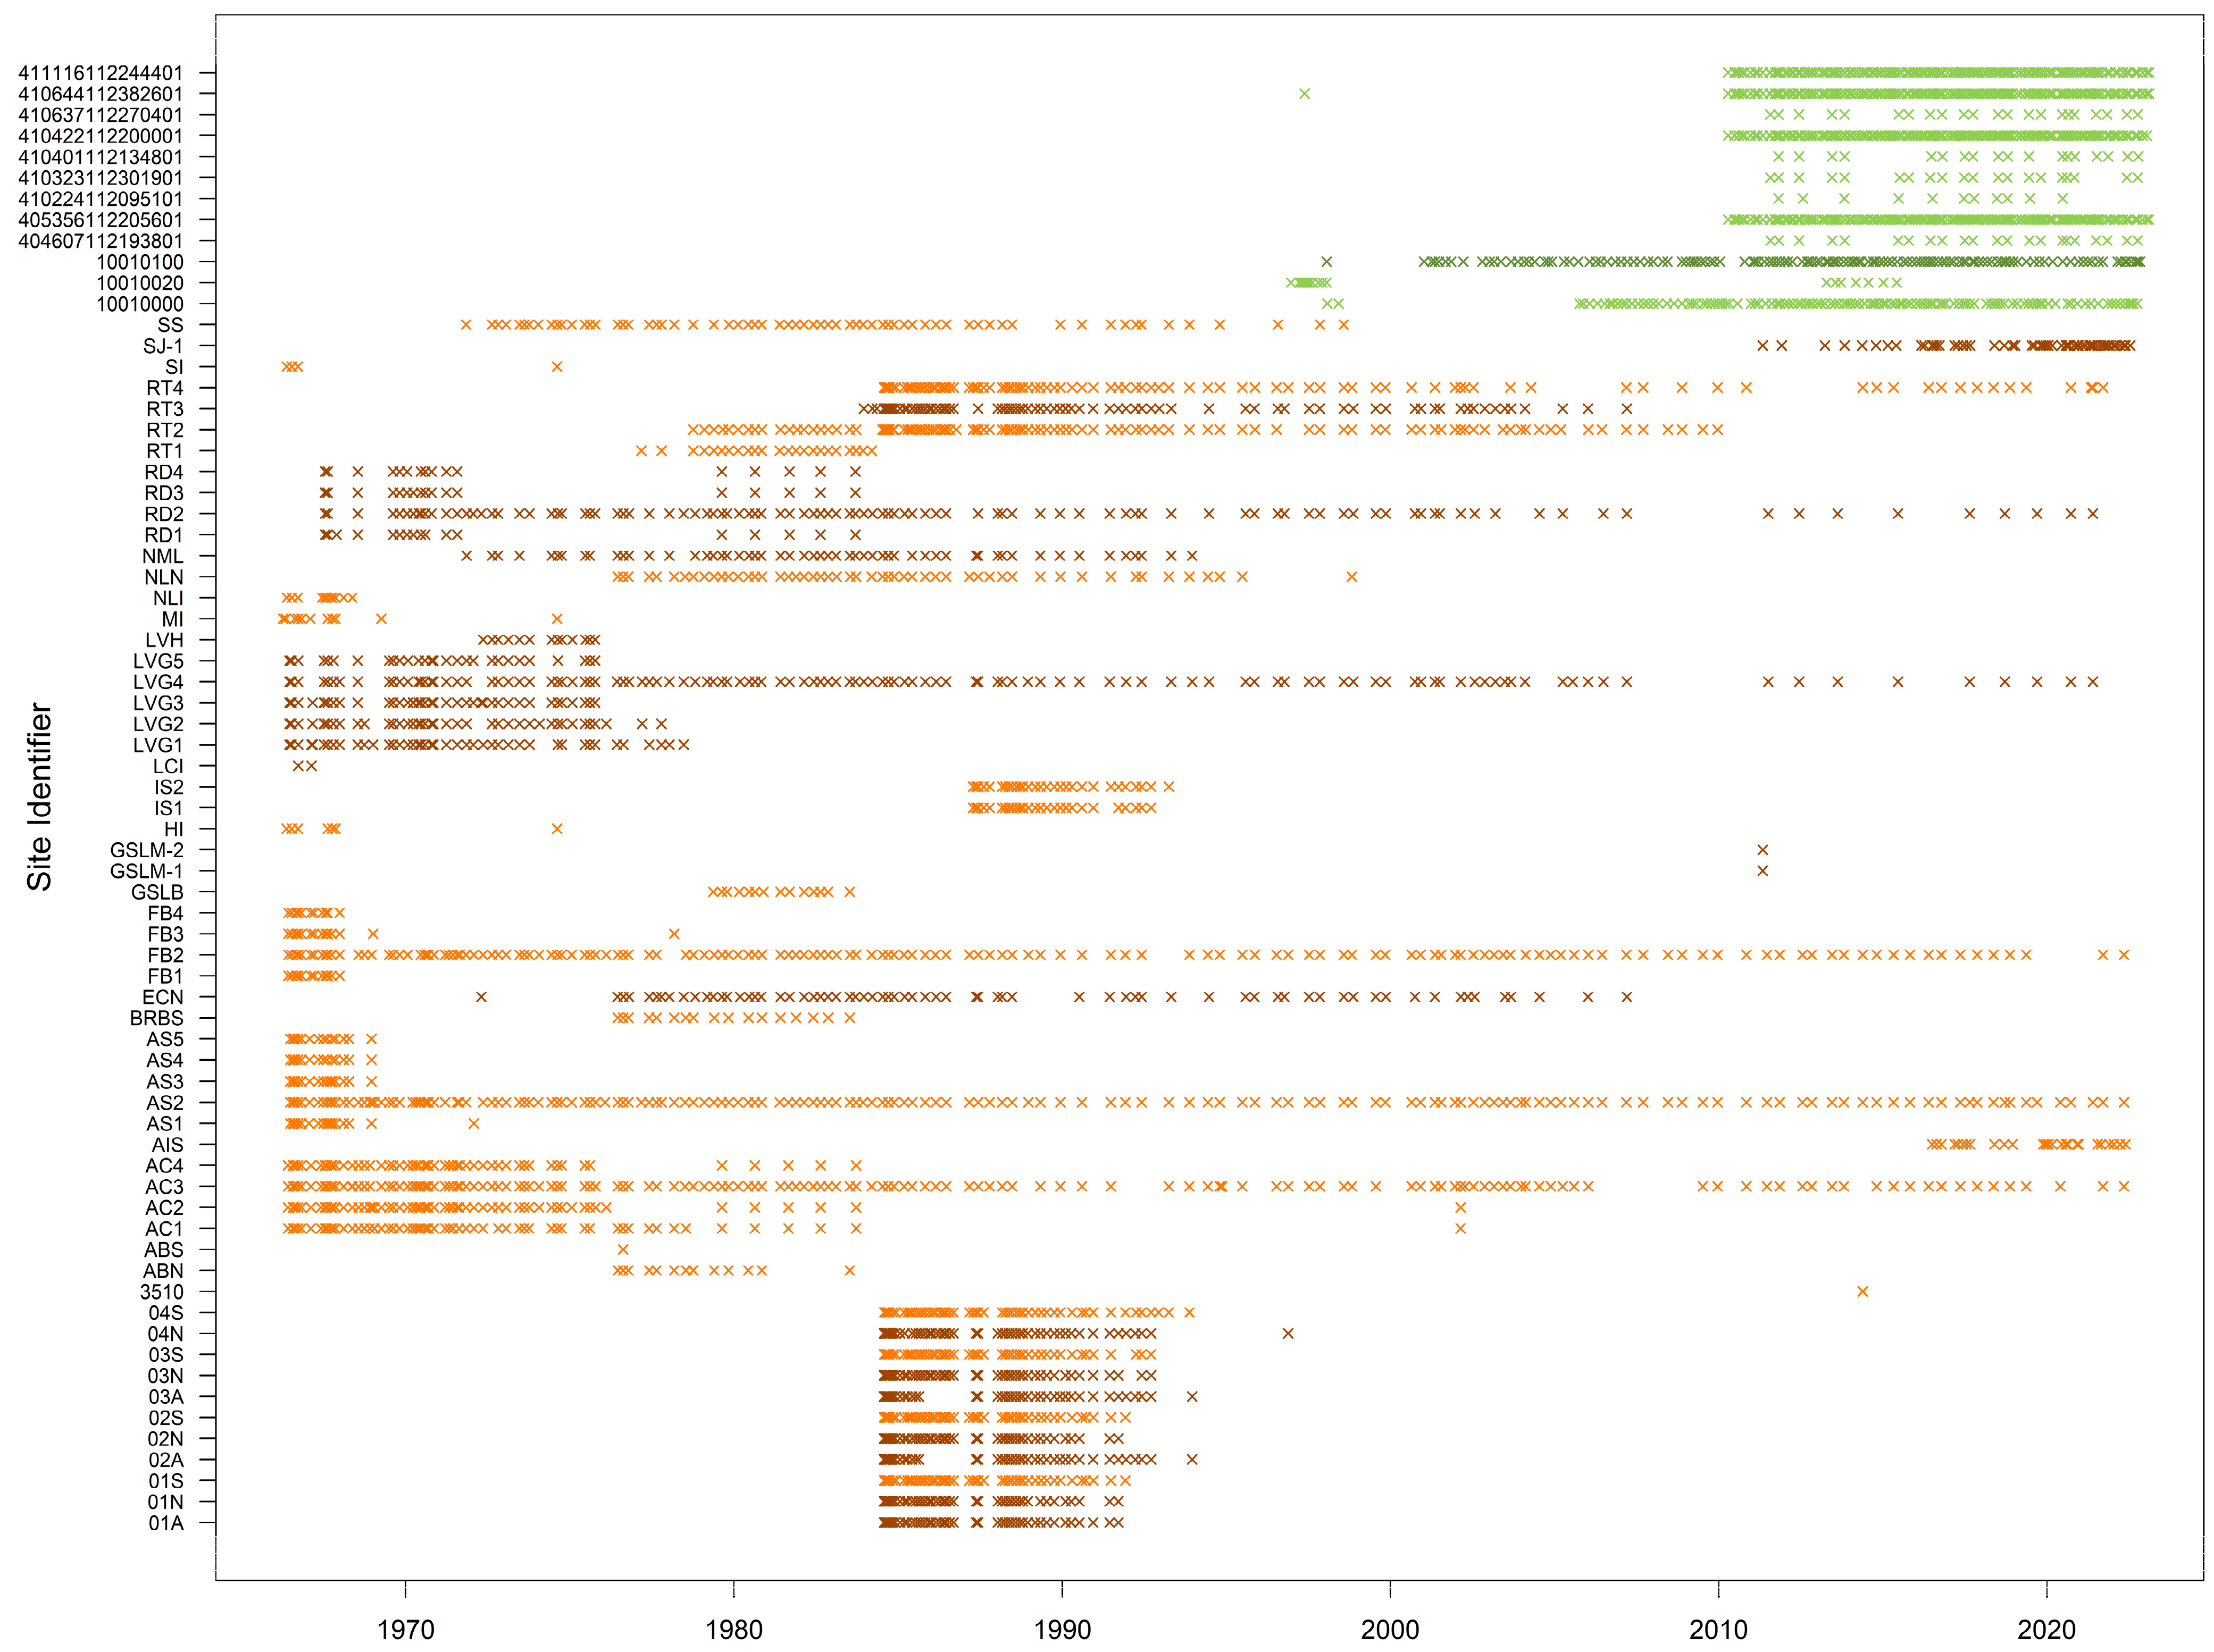
Some of the UGS and USGS sample sites have been measured very sporadically, while others have been measured more frequently and therefore provide a more continuous record (Figure 2). Of the 70 sites, only one (AS2, Figure 2) has been sampled every year of the record up through 2022. UGS performed a great deal of sampling early on after the causeway was constructed and especially during the flooding in the mid-1980s, but it appears as though USGS has become the primary sampling agency in more recent years (Figure 2 and Figure 3).

2.4. Salinity

Water density is temperature and salinity dependent, and it is common for salinity to be calculated from density and temperature measurements. The GSL Salinity Advisory Committee (SAC) was convened in 2018 by the Utah Division of Forestry, Fire and State Lands and the Utah Division of Water Quality. The committee comprised a group of scientists and stakeholders. One of its first tasks was to create a standard operating procedure (SOP) for measuring and reporting GSL water density and to establish a standard for calculating and reporting GSL salinity in weight per volume units. These SOPs were completed and adopted by UGS and USGS in 2020 [24]. The SOP includes the following definitions:
  • “Water Density: A measure of the mass (grams) per unit volume of water (cubic centimeter) including all solutes (g/cm3). Water density varies with temperature and total dissolved solids (TDS).”
  • “Salinity: A measure of the concentration of all solutes dissolved in water. Solutes in GSL water are unique and difficult to accurately measure; GSL salinity is typically defined as the mass of dissolved solids (or TDS) in grams per liter of water (g/L).” [24] (p. 1)
The GSL SAC SOP states that “measured densities of water samples collected from the GSL are used to compute the salinity of each sample” [24] (p. 1) using the following equation of state developed by Naftz et al. [16], which is specific to GSL waters.
ρ ρ o = 184.01062 + 1.04708 S 1.21061 T + 0.000314721 S 2 + 0.00199 T 2 0.00112 S T ,  
where ρ = density of the water sample (kg/m3); ρo = density of pure water (kg/m3); S = conductivity salinity (g/L); and T = water temperature (K), which was taken as 20 °C (293.15 K) for all salinity calculations in this paper. Following Naftz et al. [16], density of pure water, o, was calculated using Spieweck and Bettin [25], resulting in ρo = 998.2031 kg/m3 (0.9982031 g/cm3) at 20 °C.
The bulk of the data in the historical record is from the time before the GSL SAC SOP was adopted and there is variability between UGS and USGS in how lake water samples were collected, which lake water constituents were measured, and how these measurements were performed and recorded. Therefore, the measurements used to determine salinity varied depending on measurement availability. We have included additional details on this in the supplementary material.
Additional preparation of both the UGS and USGS datasets included correcting obvious typos (e.g., 4110 foot versus 4210 foot elevations) and changing non-numeric measurements to numeric values (e.g., “near surface” to a depth of 0 m). Lake bottom elevation at each sample site was determined using the latitude and longitude of the measurement site together with lake bathymetry. The elevation of each sample was computed using lake WSE in the corresponding arm at the time of sampling minus the sample depth recorded with the observation.

2.5. Average Dissolved Salt Mass and Average Salinity

Average dissolved salt mass and average salinity were calculated using each sample at a single site on a given date for the corresponding arm of the lake assuming horizontal homogeneity (following [5,26]) but accounting for vertical variability (Figure 4). Calculations were only performed when 3 or more measurements were recorded at a particular sample site on the given date. To calculate the average dissolved salt mass of an arm of the GSL on a given date, each measurement at a fixed depth was taken to represent the layer of water closest in depth to that measurement. Bathymetry and lake WSE were used to estimate the volume for each layer. Specifically, for the lake at WSE h with measurements at n depths on a given date, the interfaces between the n layers are h − (z1 + z2)/2, h − (z2 + z3)/2 and so on for remaining layers (Figure 4). The volume of layer 1 was then calculated from the bathymetry-derived volume–WSE relationship as V(h) − V(h − (z1 + z2)/2). The volume of layer 2 was calculated as V(h − (z1 + z2)/2) − V(h − (z2 + z3)/2) and so on for remaining layers. The dissolved salt mass in each layer, Ln, is then the volume of the layer, Vn, times the salinity concentration based on the sample measurement, Cn, expressed as Ln = CnVn. The average dissolved salt mass for each arm, L, is then the sum of the dissolved salt masses for each layer, which was expressed as L = L1 + …+Ln. Average salinity of the arm of the lake, C, was then estimated using C = L/V, where V is the volume of the arm of the lake. These calculations, based on individual sites, are plotted in the results as sample event points for each date of observation. Note that while it is common for the DBL interface and sometimes a shallow freshwater lens interface to occur at consistent depths, we did not use this information in the salt mass calculations, as it would have introduced assumptions that may not always hold. Rather, we prefer the nearest depth layering approach, which is objective and repeatable albeit with accuracy dependent on n, which is the number of depths sampled.
To estimate a regularly spaced monthly time series of average dissolved salt mass and average salinity for each arm of the lake, the sample event points were smoothed using the ksmooth function in R [27] with a “normal” or bell-shaped kernel and a bandwidth of 600 days. This bandwidth value was chosen to span the largest gaps between measurement times based on visual inspection.

2.6. Total Salt Mass Calculations

The total dissolved salt mass of the whole lake was obtained by summing the estimated monthly time series of average dissolved salt mass for each arm. This total dissolved salt mass represents only a portion of the total salt mass, as it does not include any salt that is precipitated on the lakebed and therefore not in solution. Following Loving et al. [10], the maximum total salt mass (i.e., dissolved + precipitated) was estimated based on the time of peak lake WSE after the flooding in the mid-1980s when salinity concentrations were lowest and precipitated salt mass accumulations are assumed to have been zero. Working forward in time from this maximum point, the total salt mass was calculated based on changes due to inflows, mineral pond withdrawal, mineral pond leakage and return, and west desert pumping and return. Total salt mass prior to the maximum point was back calculated in a similar manner. Contributions to the total salt mass calculations included:
  • Salt mass increases due to annual inflow from rivers, wastewater, stormwater runoff, and groundwater estimated by Hahl [28] to be 3,175,000 metric tons (3,500,000 US tons; a US ton, sometimes referred to as a short ton, is 2000 lb or 0.907 metric tons; a metric ton is 1000 kg).
  • Salt mass values for mineral pond withdrawal were estimated using volume from water rights data [29,30] and lake salinity during summer months when extraction occurred.
  • Salt mass values for mineral pond leakage and return were estimated using volume equal to 25% of water rights withdrawal values following Utah Division of Water Resources estimates that net withdrawals are 75% of the water right, and salinity of the returning brine, which was assumed to be at a saturation density of approximately 1220 kg/m3 (1.22 g/cm3) [31] and a salinity of 275 g/L based on the Naftz et al. [16] equation of state (Equation (1)).
  • The West Desert Pumping Project circulated water through the west desert pond from 1987 to 1989 and then drained water back to the lake from 1990 to 1992, bringing salt with it [5]. Loving et al. [5] report a net loss of 0.478 billion metric tons (0.527 billion US tons) of salt that precipitated and remained in the west desert. To reconcile our total dissolved salt mass calculations and not have the total salt mass go below the observed dissolved salt mass over the 1987–1992 time period, west desert pumping salt loss values reported by Loving et al. [5] were reduced by a factor of 0.4.
We also computed an upper and lower bound for the total salt mass. While we know that mineral extraction does remove salt, the amount is uncertain, and setting this as zero provides an upper bound on total salt mass. The lower bound was set based on the condition that total salt mass stay above the value for the total dissolved salt mass, which is based on measurements. The precipitated salt mass, along with its upper and lower bounds, is calculated as the difference between the total salt mass, along with its upper and lower bounds, and dissolved salt mass, which also follows Loving et al. [5].

3. Results

3.1. Salinity

Salinity calculated using water sample data along with the Naftz et al. [16] equation of state, Equation (1), was plotted at depth for each site for the entire period of record from 1966 to present. For sites with frequent sampling information, such as UGS site AS2 (Figure 5a), location-specific stratification is visible, including freshening of upper water in the 1980s and late 1990s and the presence of higher salinities at depth (i.e., DBL) prior to that. However, other sites have scant data and provide very little insight on their own. For example, all that can initially be gathered from the plot of UGS site AIS (Figure 5b) is that surface water was consistently ~150 g/L for the last few years. All 70 of the site plots are included as supplementary material. Based on these site plots, we observe that GSL water samples were commonly collected every few months throughout the water column at 1.5 m (5 foot) increments.
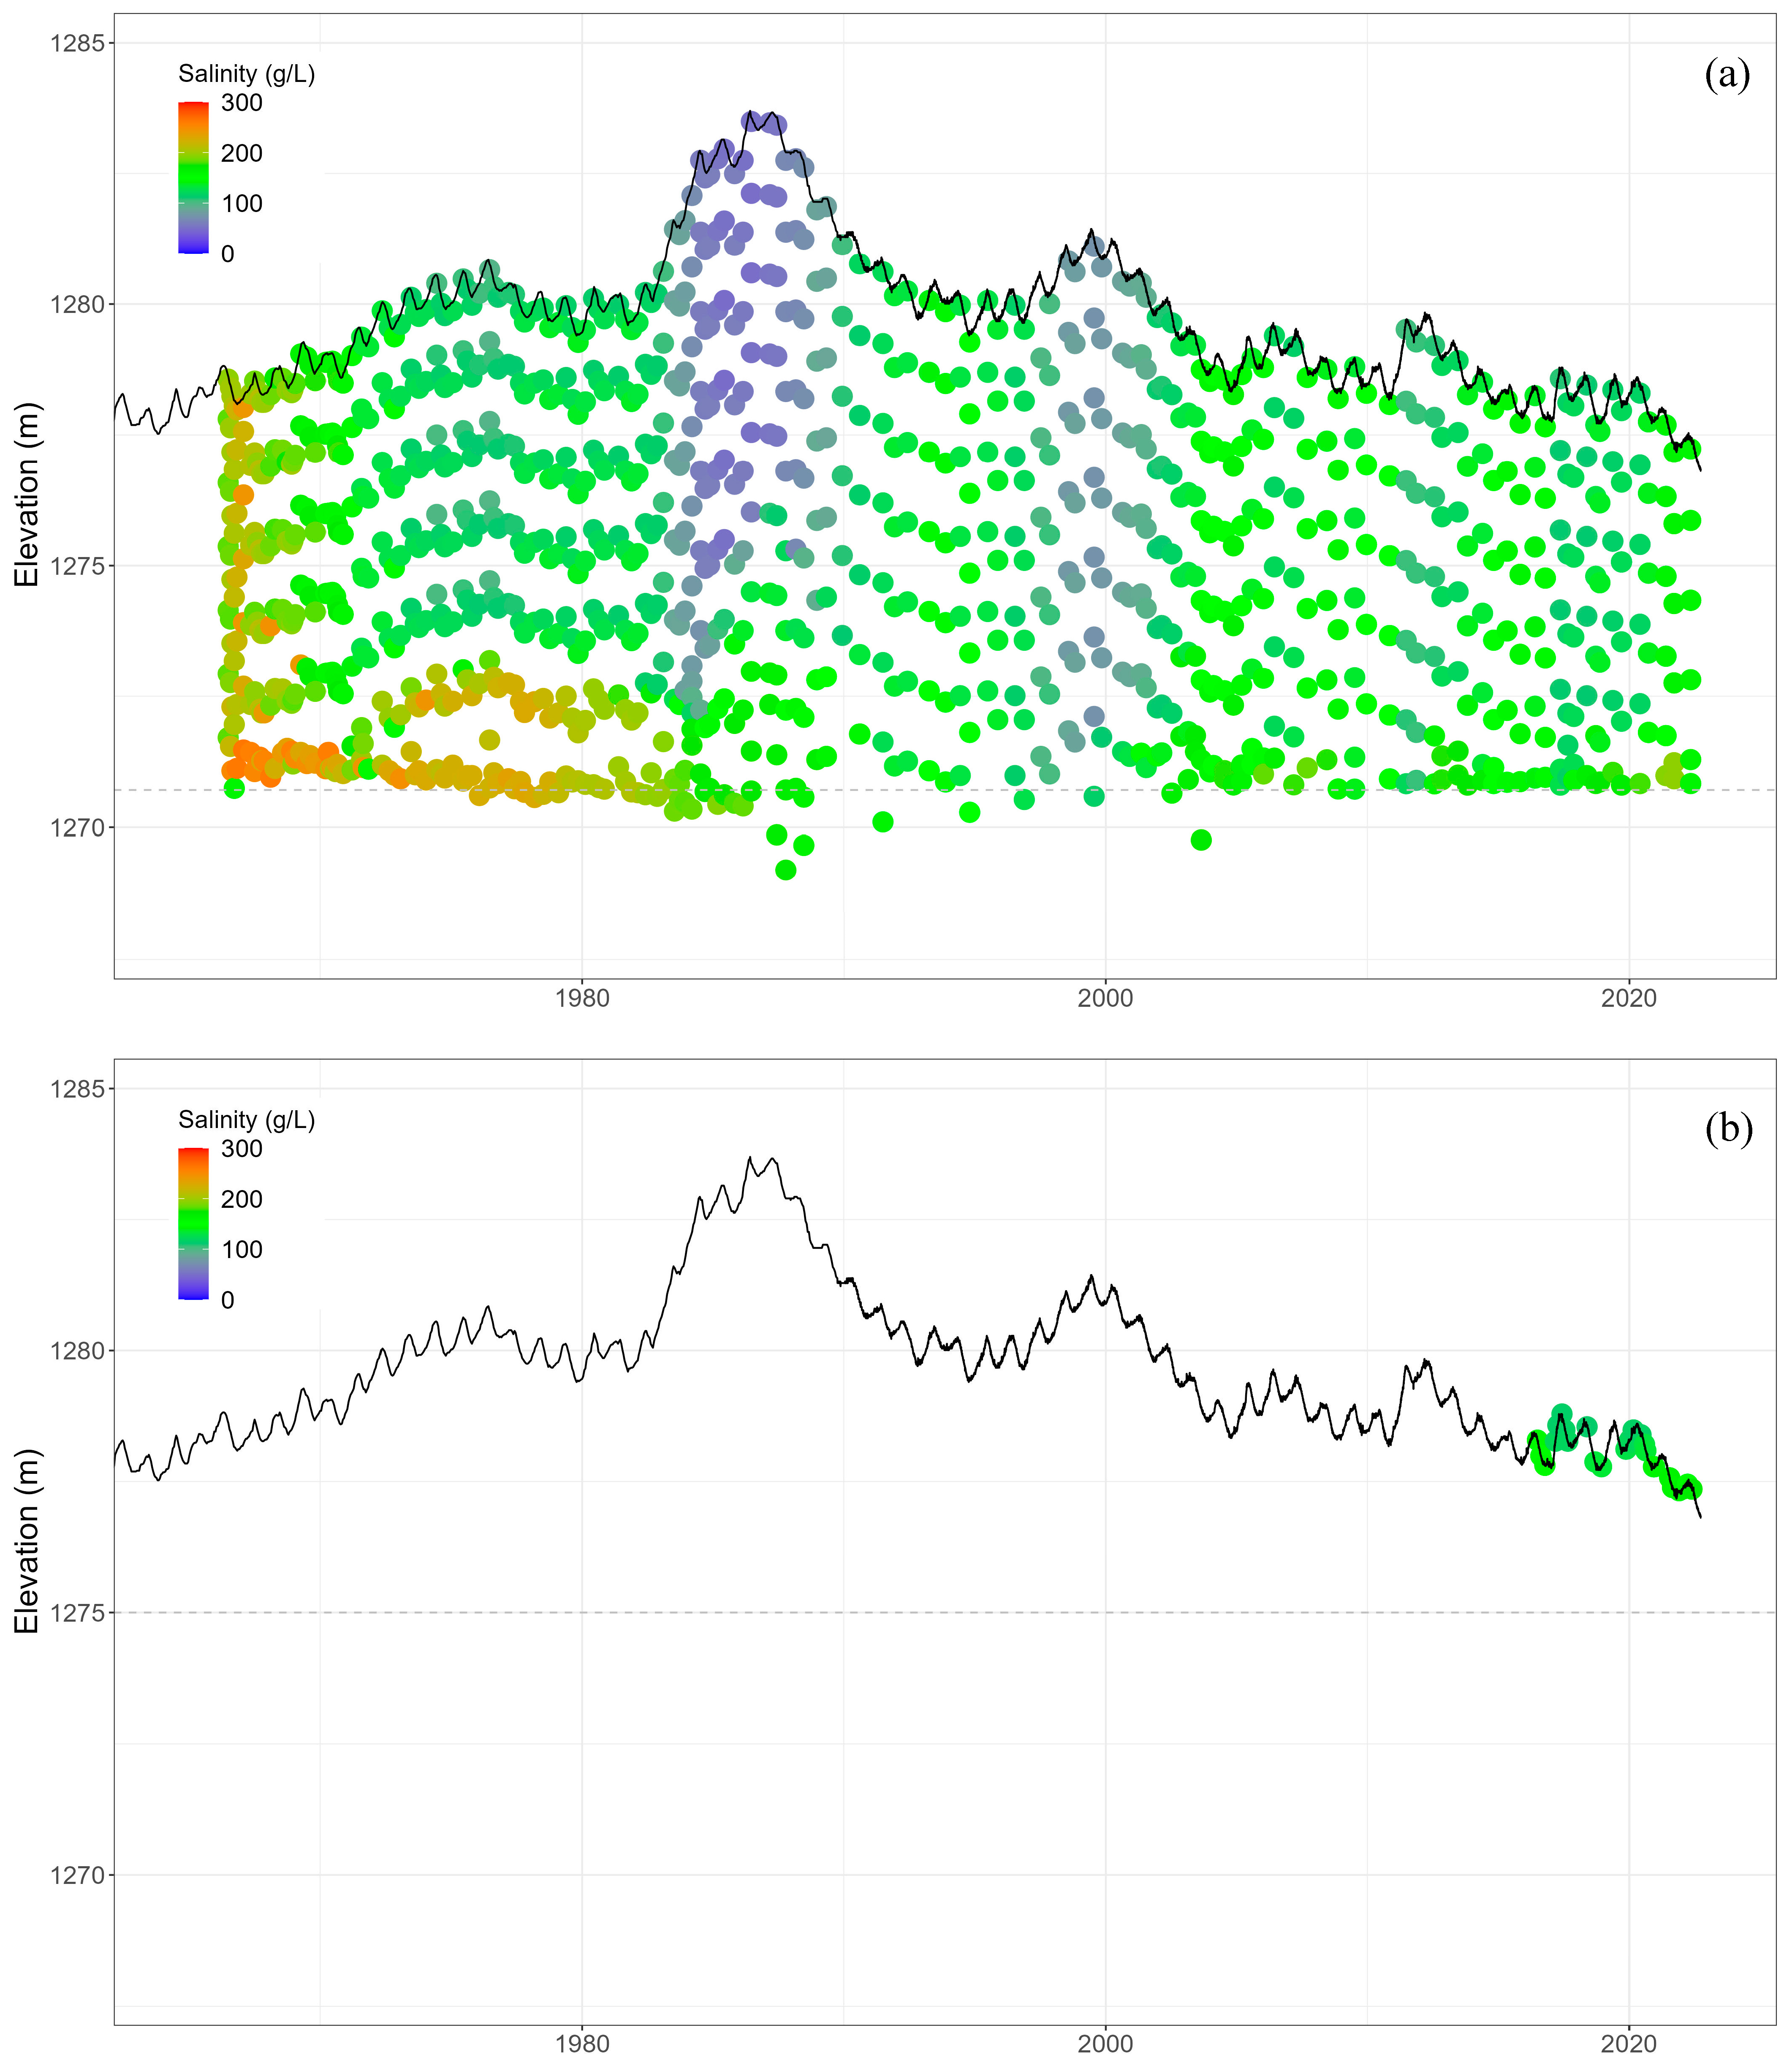
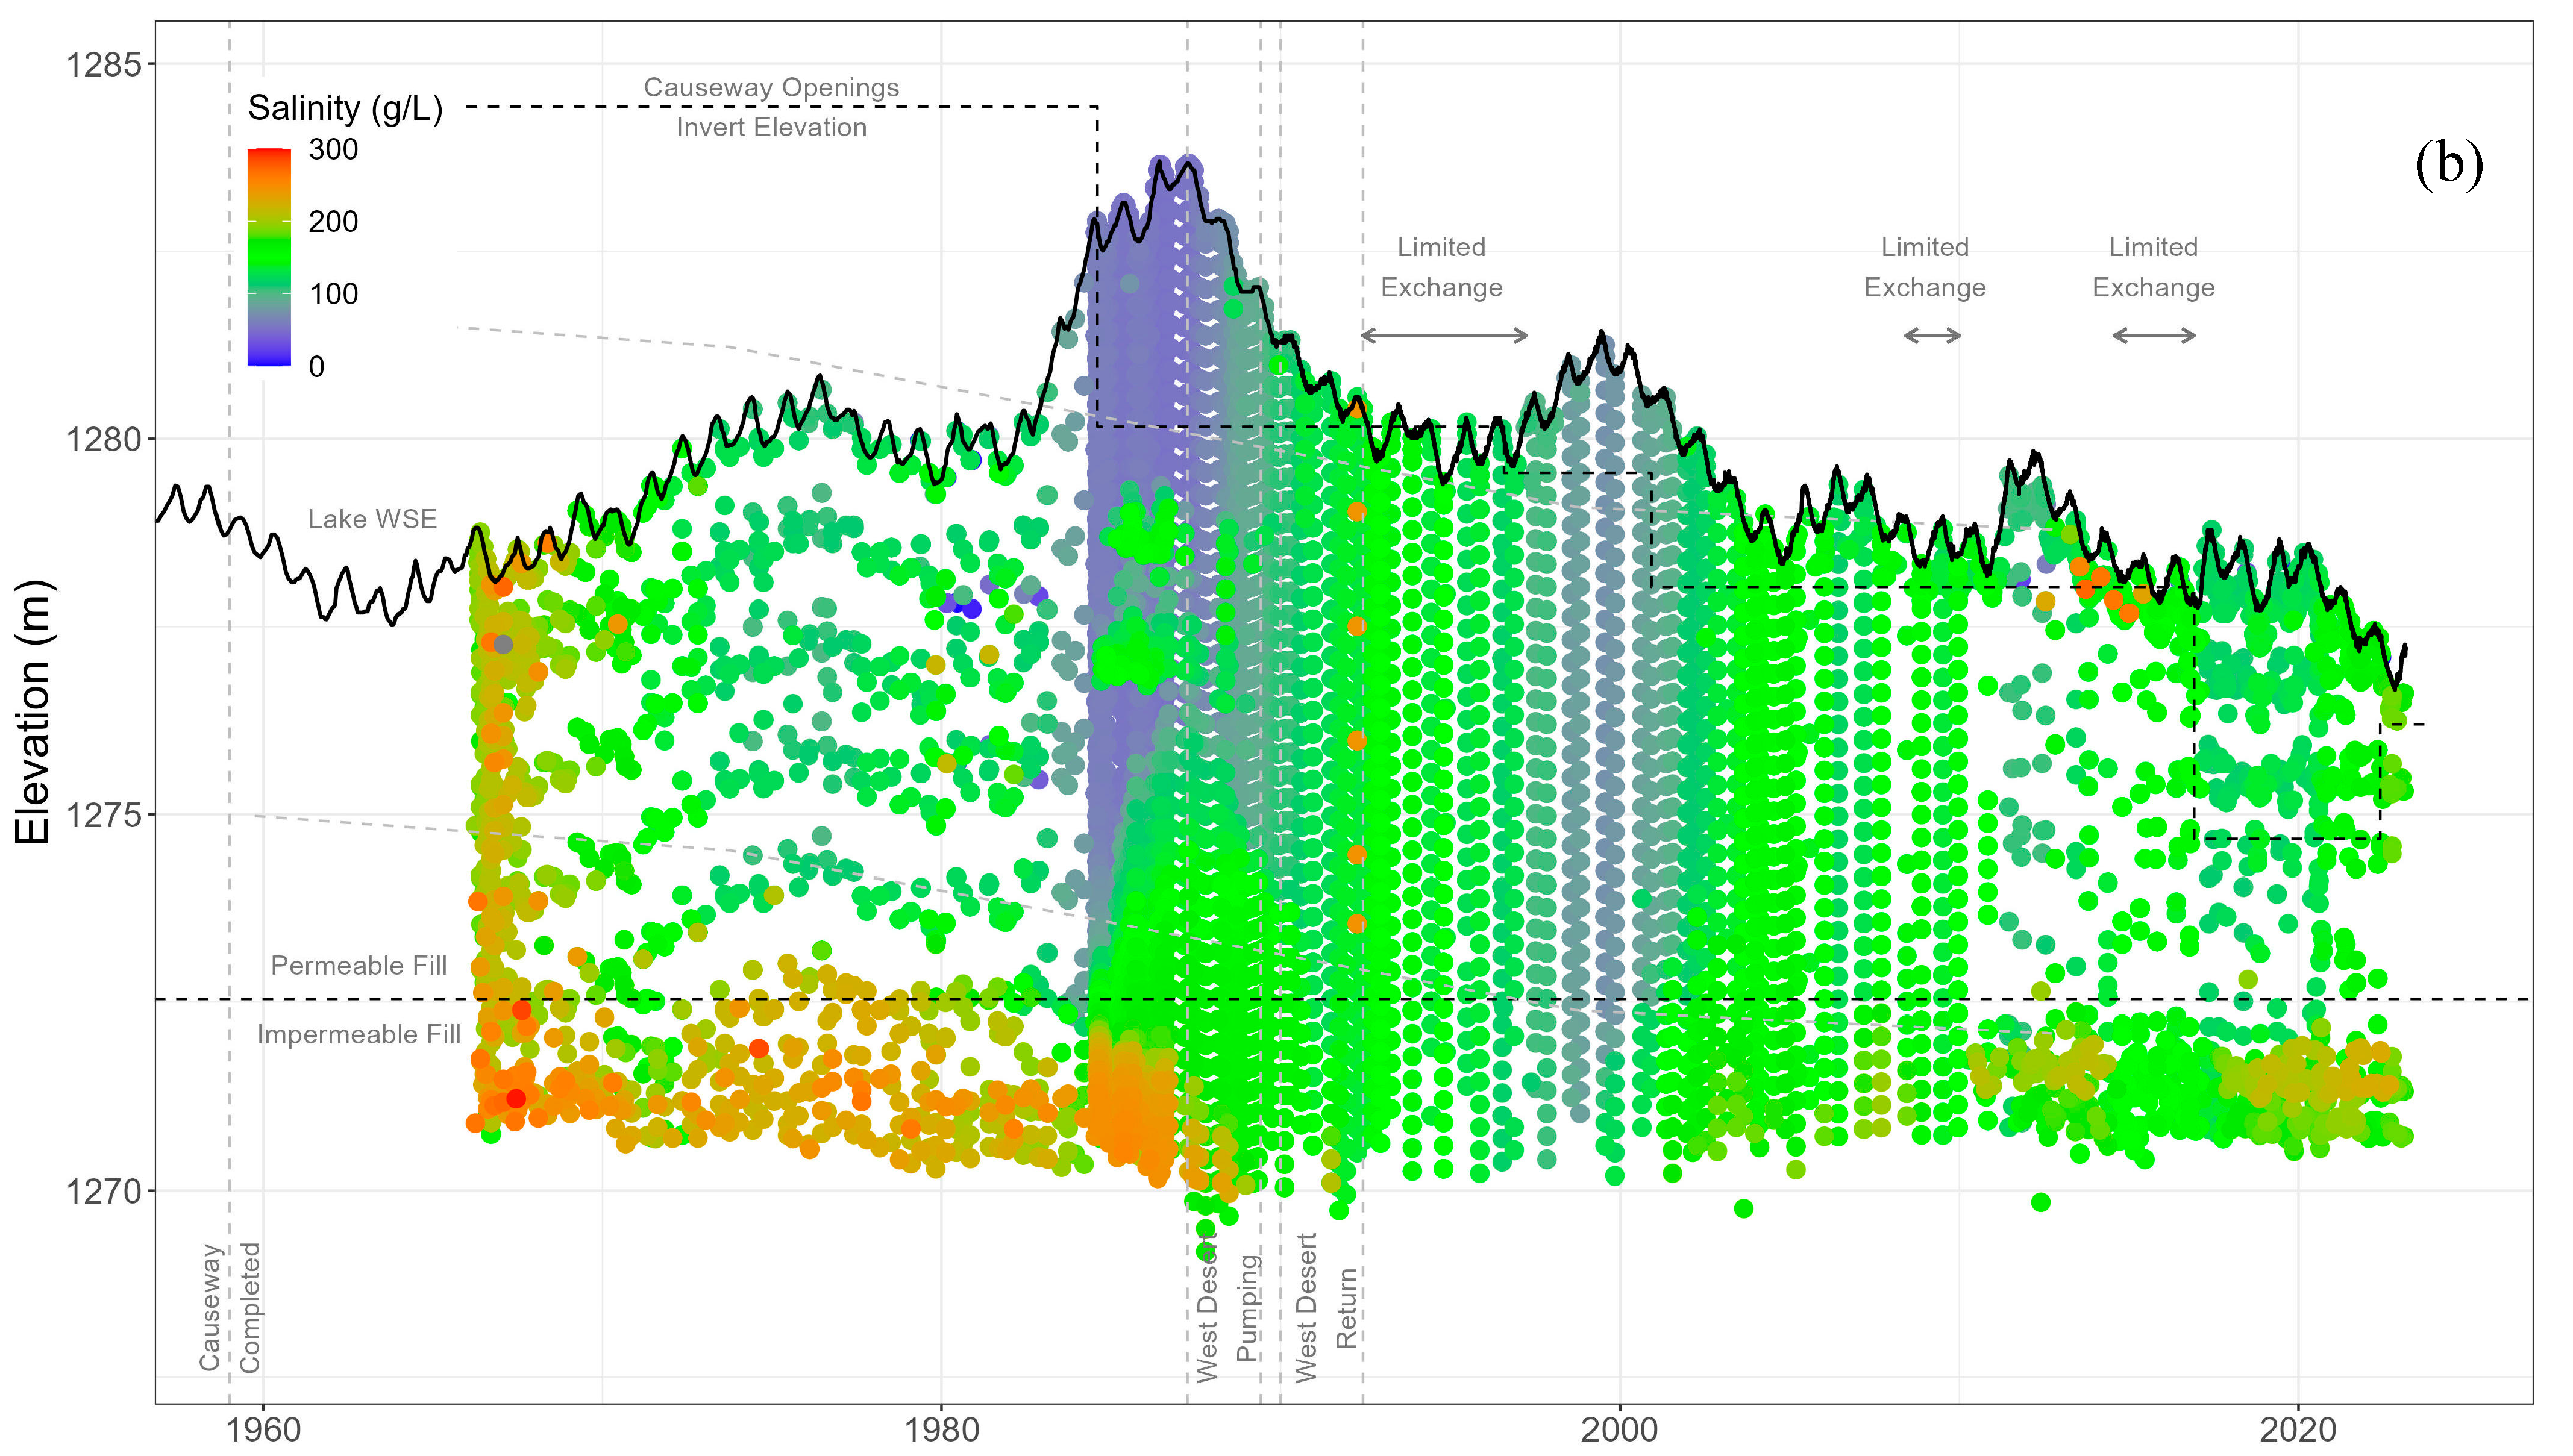
To construct a better picture of salinity at depth over time for the entire lake, the salinity plots for all UGS and USGS sites were combined into two plots, one for each arm (Figure 6a,b). The points in these figures were written to the plot in ascending order of salinity, from lowest to highest, so that points representing high salinity plot in front and are not covered or obscured by overlapping points representing lower salinities. This ensures that high salinities are visualized and can indicate a brine layer if it is present.
Figure 6a,b include what is known about the infrastructure enabling or reducing flow through the causeway. A dashed line at 1272.5 m indicates the elevation that separates permeable and impermeable fill of the causeway structure as reported by Loving et al. [5]. Light dashed lines approximate the base and top elevations of culverts that were installed in the causeway at the time of its construction. However, both culverts were reported to subside and be blocked by the flooding in the mid-1980s and eventually decommissioned (i.e., filled in) in 2013. The upper dashed line starting at 1284.4 m represents the base elevation of causeway breach openings or the invert elevation of the breach. The first causeway breach, West Bridge, was installed in 1985 to alleviate south arm flooding. The West Bridge breach had a base elevation of 1280.2 m, which was then lowered to 1279.6 m in 1996 and 1278 m in 2000. A second causeway breach, West Crack, was installed in 2016, at a time when the first breach was high and dry. The West Crack breach had a base elevation of 1274.7 m but was raised to 1276.2 m in 2022 to manage the flow of brine from north to south [32]. The years of west desert pumping and brine flow return are also indicated. Periods of limited exchange with lake WSE close to or below breach base elevations are labeled to aid in interpretation.
In Figure 6a,b, we see that the north arm is both more saline and more homogeneous than the south arm. Other than during the flooding in the mid-1980s and subsequent lake WSE decline, the north arm salinity remained at about 250–300 g/L throughout the water column for the entirety of the data record. In 1966, seven years after the installation of the causeway in 1959, the south arm salinity was approximately 200 g/L throughout the water column. However, the south arm progressively became more stratified with lower salinity at the surface, 100–150 g/L, and higher salinity at the bottom, 200–250 g/L. This bottom layer of high salinity is what would later become referred to as the DBL. The DBL persisted until the early 1990s and then disappeared during the time the lake WSE was declining after the floods. Hints of a return of the DBL start appearing in about 2000 but are not obvious in these plots until about 2010. The DBL faded once again in 2014 and returned in 2016. The timing of the presence of the DBL appears to align with the periods of limited exchange through the causeway.

3.2. Average Dissolved Salt Mass and Average Salinity

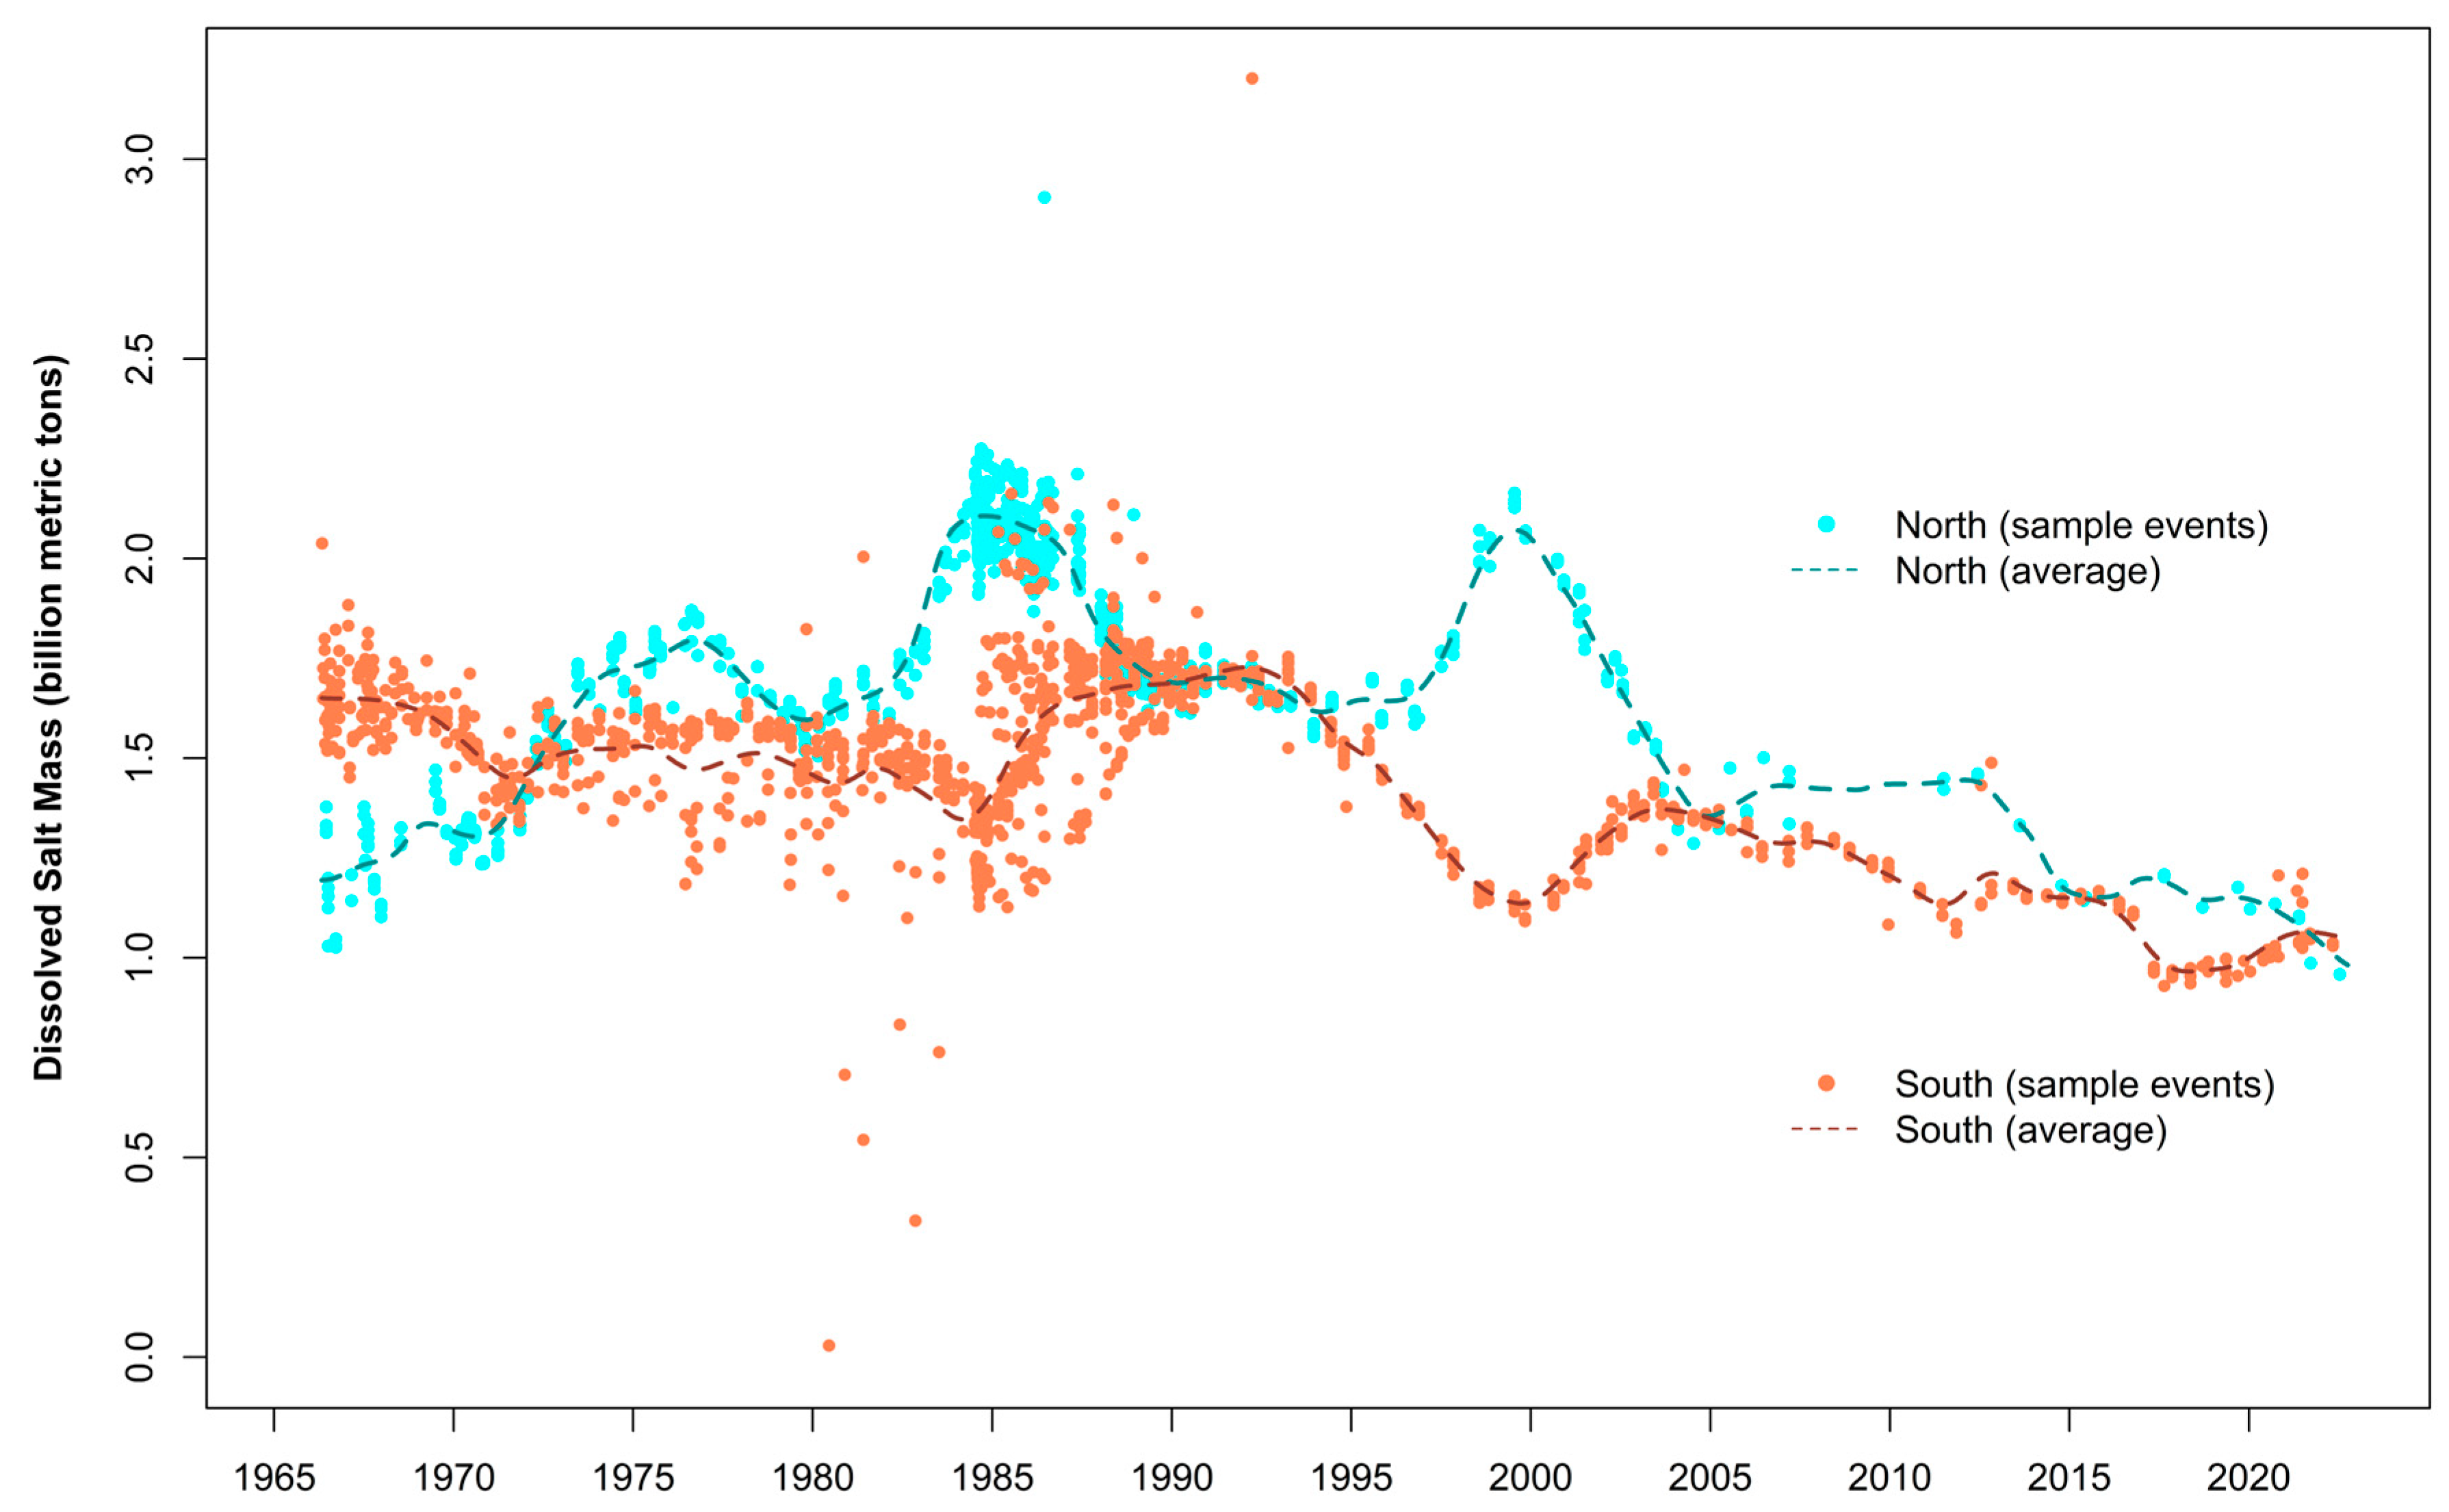
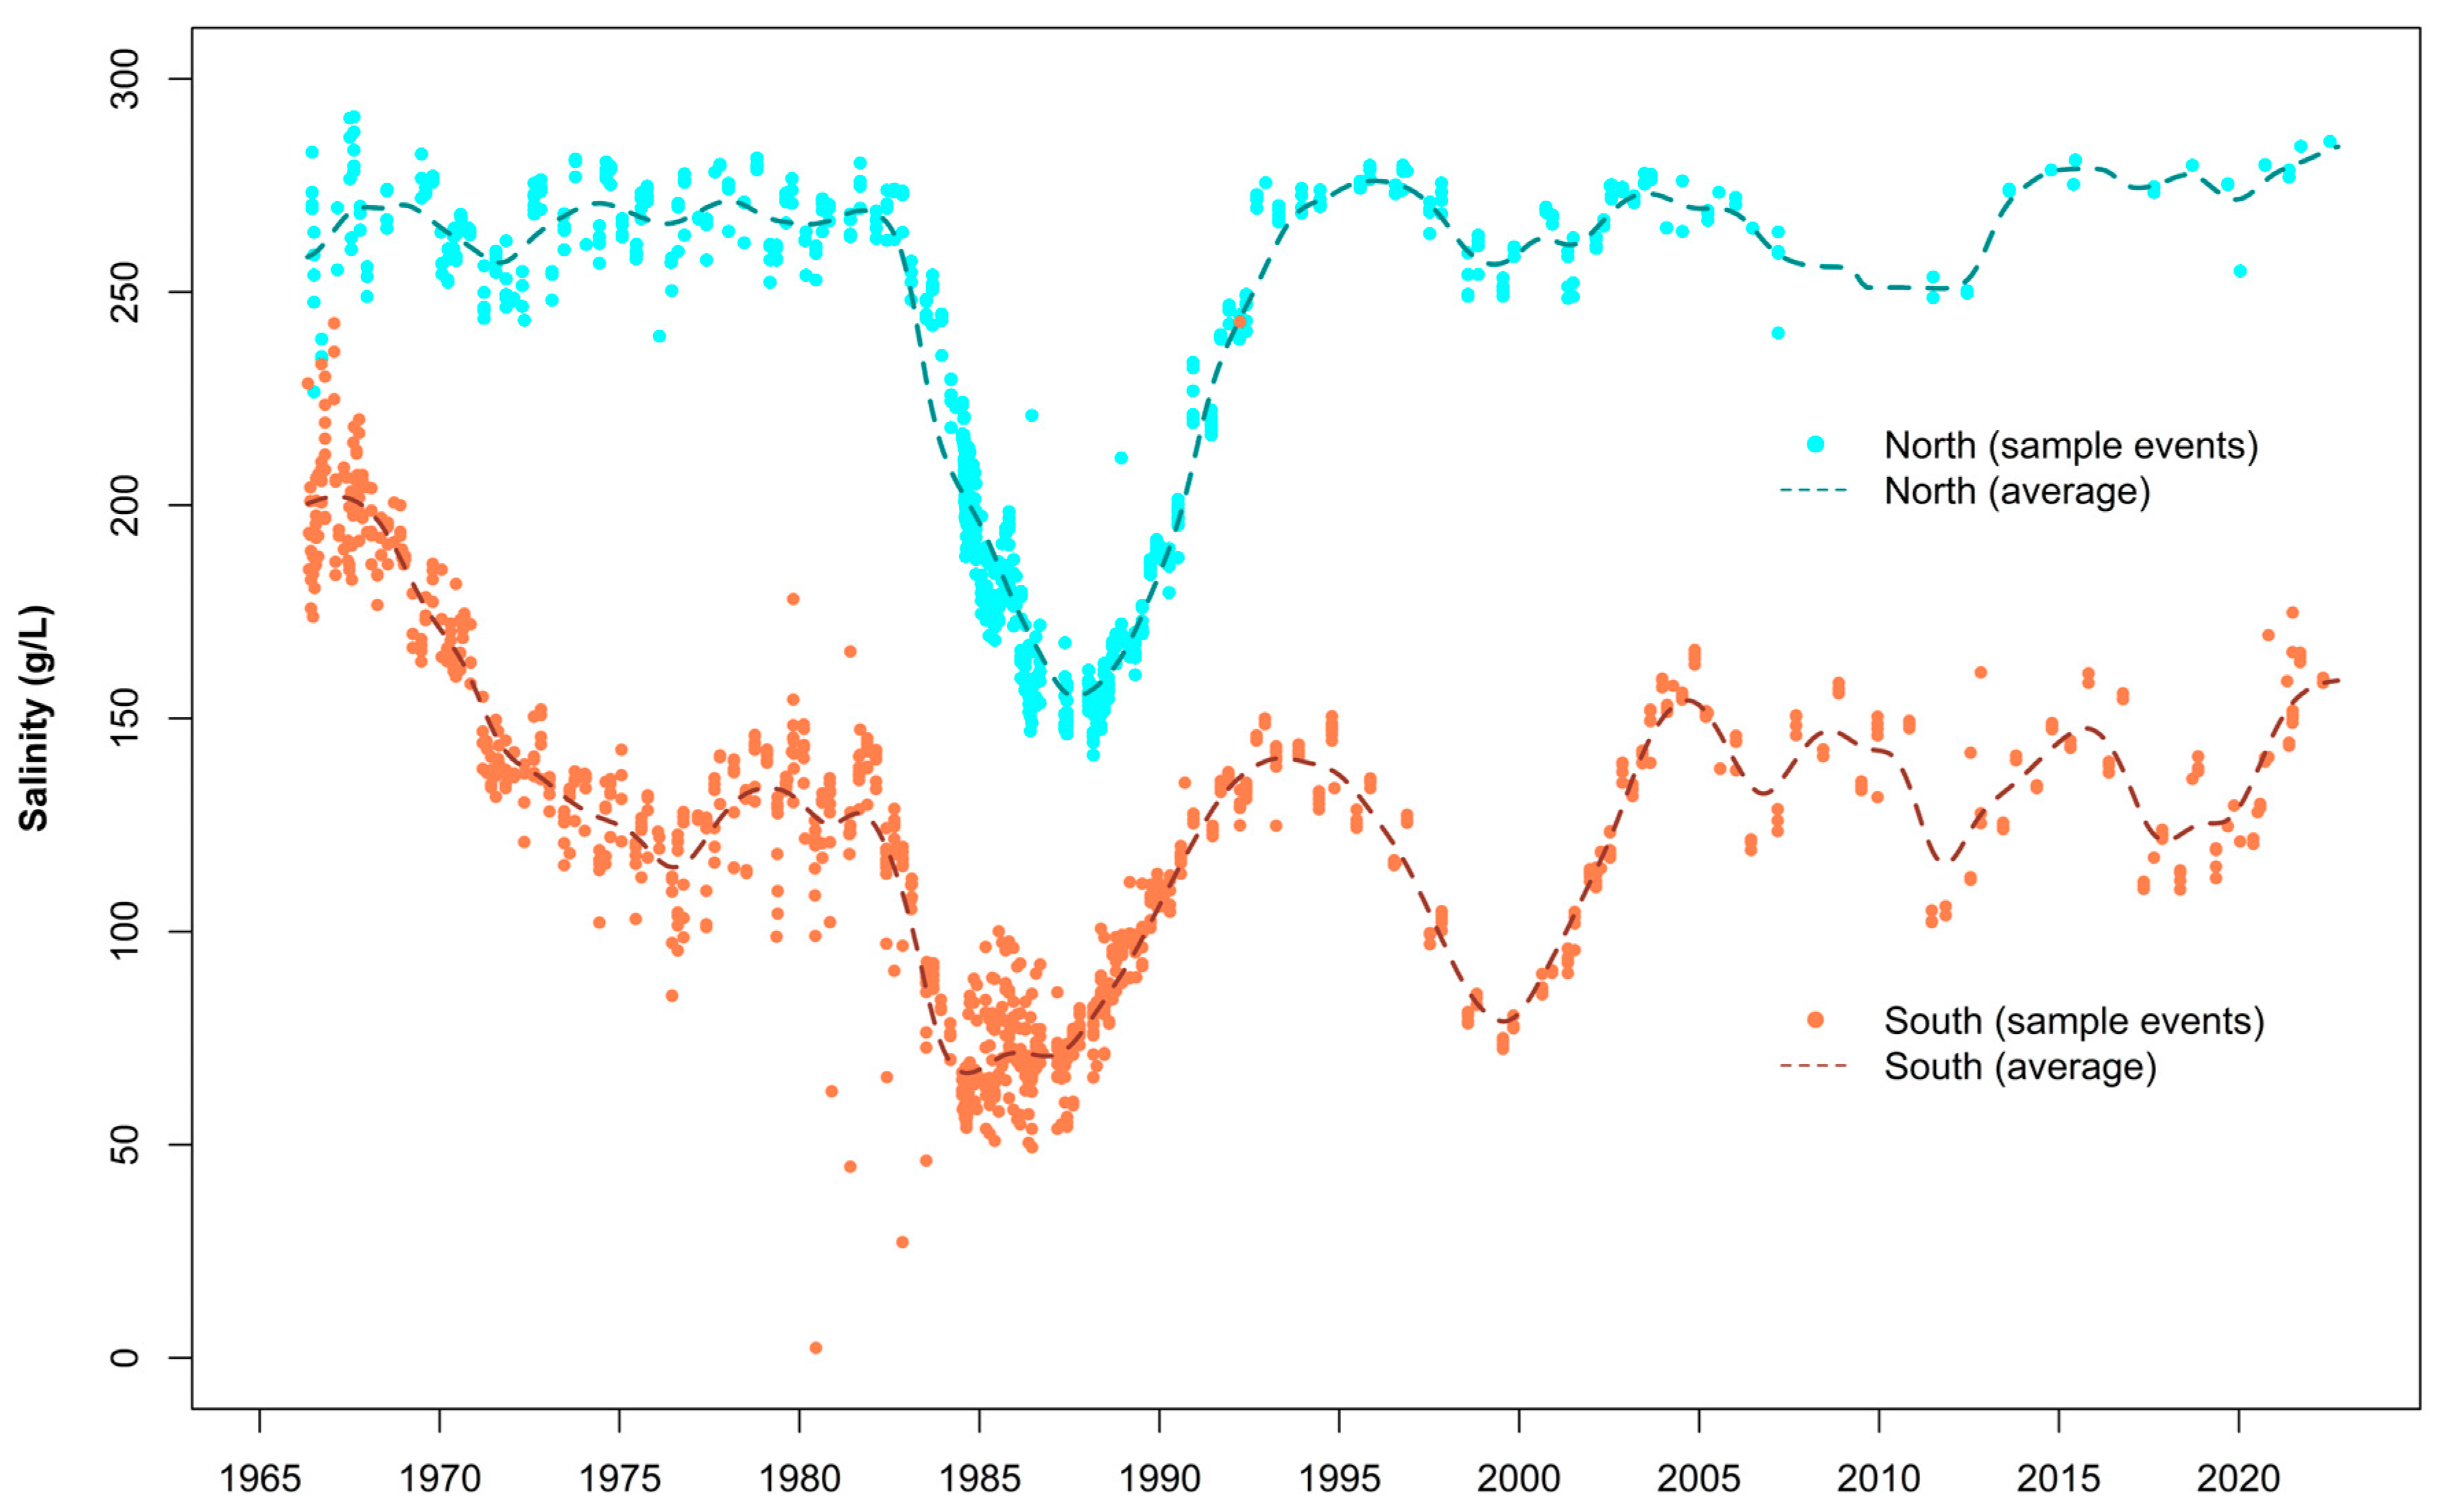
Of the 27,482 salinity calculations for the entire lake, 25,967 were produced using the UGS dataset and 1515 were produced using the USGS dataset. From these individual measurements, there were 1256 sample dates with 3 or more measurements in the south arm and 890 sample dates with 3 or more measurements in the north arm. Therefore, we were able to calculate 1256 sample event values for average dissolved salt mass and average salinity for the south arm and 890 sample event values of each for the north arm. These sample event calculations of average dissolved salt mass and average salinity are plotted as points in Figure 7 and Figure 8 along with dashed lines representing the regularly spaced monthly time series obtained through smoothing of this data. Lake arm is indicated by the color of the point or dashed line.
Smoothing of the data quantifies visible trends and provides a way to interpolate in time between points to obtain estimates for each month. Figure 7 indicates that variability in the dissolved salt mass is coordinated between the two arms such that the north arm dissolved salt mass goes up when the south arm dissolved salt mass goes down. On the other hand, Figure 8 indicates the average salinity of each arm going up and down almost in unison. The average salinity in the north arm has remained close to saturation other than during the flooding in the 1980s [5,8,26,33], while the average salinity of the south arm decreased from the mid-1960s to the mid-1980s and then appears to be increasing thereafter.
Figure 9 is a plot of salinities in the south arm. Points in this figure represent salinities calculated using individual measurements from samples taken at the surface (less than 0.3 m depth) and bottom (below 1272.5 m elevation) of the south arm at sites within the 1272.5 m contour (Figure 1; including UGS sites RT4, RT2, RT1, NLN, FB2, AS2, AC3, and AC2, and USGS sites 405356112205601, 410637112270401, and 410644112382601). The dashed line represents the estimated monthly time series for average salinity, as shown in Figure 8. Figure 9 indicates that the surface salinity is typically slightly lower than the average salinity, whereas the salinity below 1272.5 m, where the DBL would appear, is typically considerably higher than the average salinity. However, from approximately 1992 to 1999, the surface, bottom, and average salinities were more or less the same, indicating there is no DBL during this time. A DBL reappeared following lowering of the causeway breach in 1996 and increased lake WSE in 1999. A similar merging of salinities also occurs during 2008–2010 and 2014–2016. All three occurrences of merging salinities coincide with limited exchange between the north and south arms and indicate the disappearance of a DBL (i.e., absence of higher salinities below 1272.5 m) when there is limited exchange through the causeway. This is consistent with Figure 6b, which shows no DBL during these times, and also the findings of Yang et al. [11]. The extended period from 1992 to 1999 without a DBL complements the findings of Yang et al.’s work, which is based on data subsequent to 2010.

3.3. Total Salt Mass

The calculated total salt mass, dissolved salt mass, and precipitated salt mass are shown in Figure 10. The dissolved salt mass (black line) is the sum of the estimated monthly time series for north and south arm average dissolved salt masses shown in Figure 7. The dissolved salt mass reaches a maximum of 3.672 billion metric tons (4.048 billion US tons) in September 1986 and is assumed to be the total salt mass at that time, following the assumption stated in Section 2.4 that all salt is in solution at peak lake WSE. Prior to and following this point, total salt mass was calculated forward and backward in time as described in Section 2.4. Precipitated salt mass is then calculated as total salt mass minus dissolved salt mass.
The time between the mid-1960s and peak WSE in 1986 shows a slight increase in total salt mass due to the small contribution from inflows. There is a notable increase in total dissolved salt mass and a corresponding decrease in total precipitated salt mass over this period. The time from the peak WSE in 1986 to present shows a decrease in total salt mass and dissolved salt mass and an increase in precipitated salt mass. Contributions to these masses accumulated over the respective periods are listed in Table 1.

4. Discussion

Prior to the construction of the railroad causeway and the separation of the GSL’s north and south arms, the DBL had not been mentioned and likely did not exist [34]. The lake’s salinity was essentially considered vertically and horizontally homogeneous other than in the bays near freshwater river input [34]. As tributary inflows to the GSL changed and causeway breaches and culverts opened and closed, salinity within each arm and the presence and strength of the DBL in the south arm fluctuated.
Plotting the salinities at depth over the period of record, which includes each water sample at every sample site throughout the GSL, presents the most complete picture of salinity in each arm of the lake. The consistent patterns that emerge from sample sites at different locations in each arm of the lake support and validate the assumption of horizontal homogeneity. From Figure 6a, we see that the tendency of the north arm is toward vertical homogeneity, with salinities consistently at or near saturation (275 g/L) throughout the water column except when the lake was high in the 1980s and there was an influx of fresh water from the south. In contrast, the tendency of the south arm is toward vertical stratification (Figure 6b). High salinity water periodically found at the bottom of the lake in the south arm, below approximately 1272.5 m (4175 feet), is what is referred to as the DBL. However, the remainder of the water column above the DBL in the south arm is nearly vertically homogeneous, with salinities of 100–150 g/L. Salinity at the sampling sites within the 1272.5 m (4175 foot) contour in the south arm shows that the concentration of the DBL is typically 150–250 g/L when present (Figure 9). It also shows that the surface water of the south arm is of similar salinity to the rest of its water column, other than the DBL (Figure 6b and Figure 9). These respective phenomena appear throughout the historical period of record for both arms other than during the flooding in the mid-1980s to mid-1990s. This period of high river inflows and flooding affected the salinity of upper layers of both arms of the lake for over a decade.
The upper portion of the GSL experienced significant freshening in both the north and south arms due to higher-than-average river inputs to the south arm in the 1980s and 1990s and exchange of that freshwater through the causeway and into the north arm (Figure 6a,b). This resulted in reduced salinities of both arms by approximately 100 g/L. However, the salinity of the bottom lake water in the north arm experienced nearly no effects during this time, and the entire water column in the north arm returned to pre-flood conditions by 1992, when the lake WSE dropped below the elevation of the causeway opening and south-to-north flow became limited or non-existent (Figure 6a). This north arm homogeneity persisted through a second round of high inflow and high lake WSE around 2000. However, unlike the north arm, the salinity of the bottom water in the south arm was affected by both high-flow events (Figure 6b). By 1992, after the peak lake WSE in 1986, the DBL disappeared from the south arm (Figure 6b and Figure 9), indicating destratification. The DBL did not begin to form again until about 1999 (Figure 6b and Figure 9), which was coincident with exchange flow being re-established by deepening of the breach, giving rise to stratification. However, it was only in 2010 that the DBL made a strong reappearance (Figure 6b).
As shown in Figure 6a,b, the invert elevation of the causeway openings has changed over the course of the causeway’s existence. The two original culverts are reported to have subsided and become filled with enough debris by the mid-1990s that they had little impact on exchange between the two arms [5]. Breach openings were added and then subsequently excavated to a lower elevation to facilitate causeway exchange as the WSE became lower (Figure 6a,b). However, lake WSE was still too low in the north arm to allow for anything but limited exchange or no flow through the causeway in 1992–1997, 2009–2011, and 2014–2016. It was approximately during these times that the DBL was either not present or weak in the south arm. Yang et al. [11] noted that the 2014–2016 destratification occurred six months following closure of the last culvert, putting a time scale on the period needed for mixing without input of high-salinity brine from the north arm.
Even with the lake being divided and times of limited exchange or no flow through the causeway, the average salinity is positively correlated between the two arms such that the salinity of each arm rises and falls in unison (Figure 8). The north arm average salinity has been consistently higher than the south arm throughout the historical record. The north arm salinity has also been more resilient to disturbances than the south arm, tending to equilibrate at a salinity of ~275 g/L, even after disruptions such as flooding and limited causeway exchange. In the 1960s, shortly after the causeway was completed and UGS sampling began, the south arm average salinity was ~200 g/L. Presumably, the south arm salinity was nearer to that of the north arm salinity when the lake was first divided, but the salinity of the two arms began diverging after the causeway was constructed. The south arm appears to have been settling into an average salinity of 100–150 g/L (Figure 8), which was lower than it was in the 1960s shortly after the causeway was completed, although with current low lake WSE, the south arm average salinity appears to be trending a bit higher. Note that the beneficial salinity range for brine shrimp is reported to be 90–130 g/L [4], and salinities higher than this are cause for concern for collapse of the brine shrimp ecosystem.
In contrast to the average salinities of each arm, the dissolved salt mass in each arm is negatively correlated such that the dissolved salt mass in the north arm increases as the dissolved salt mass in the south arm decreases and vice versa (Figure 7). This is easily seen during the flooding in the mid-1980s and around 2000. River inflows into the south arm raised the lake WSE and lowered the south arm salinities. High lake WSE then pushed south arm lake water through the causeway and into the north arm. In effect, this process pushed salt from the south arm into the north arm.
The north arm dissolved salt mass has been higher than that of the south arm throughout the historical record other than very recently, in the early 1990s, and most notably in the late 1960s, which is shortly after the causeway was completed and sampling began. All three episodes are associated with lower lake WSE. The earliest episode is likely due to the lake being much more homogeneous prior to the causeway construction and the smaller volume of the north arm, while the latter episodes appear to be due simply to reduction in north arm volume associated with low lake WSE. Within the range of historical lake WSE, 1276.5–1284 m (~4188–4212 feet), the south arm is nearly twice the volume of the north arm. The north arm dissolved salt mass is equal to or less than that of the south arm when the average salinities of each arm are within 100–110 g/L of one another at low lake WSE.
Between 1986 and 2022, the total salt mass in the GSL decreased by 1.256 billion metric tons, which is more than a 30% reduction (from 3.672 billion metric tons to 2.416 billion metric tons). This equates to a loss of over 35 million metric tons of salt per year. Other than the west desert pumping in the 1980s and precipitated salt left on exposed shores due to low lake WSE, mineral extraction is the only process known to remove salt from the GSL during the period of record. The reduction in total salt mass is consistent with estimates of salt loss due to mineral extraction (Table 1, Figure 10). Based on the assumption that the mineral extraction industry uses 100% of their water rights and returns 25% of their water rights to the lake as saturated brine (i.e., salinity of 275 g/L), approximately 1.3 billion metric tons of salt have been removed from the lake by the mineral extraction industry over the period of record. We noted earlier that Hahl [28] estimated the total inflow from rivers, wastewater, stormwater runoff, and groundwater adds 3.2 million metric tons of salt per year. This means that the amount of salt removed from the GSL by the mineral extraction industry every year is approximately ten times the amount added. Most recently, since 2017, there have been increases in south arm salt mass and decreases in north arm salt mass (Figure 10). Not only is this increase in south arm salt mass larger than would be possible from estimated inflows, it is also accompanied by reductions in north arm salt mass and therefore seems to be attributable to north-to-south exchange through the causeway.
The intensity of GSL data collection has varied over the years in both time and space. For example, water sampling and data collection was more frequent during the heavy precipitation and inflows in the 1980s and less frequent in the 1990s and thereafter. However, after the late 2000s, very little sampling occurred in the north arm with most being surface samples, and sampling in the south arm became concentrated at both the surface and bottom with sporadic sampling at depths in between. It is notable, in examining the plots of dissolved salt mass and average salinity, that points determined from single sampling events at individual sites line up and, other than a few anomalous points, the data cluster such that general trends can be seen in each arm of the lake. Lake water samples from spatially different locations yield similar average salt mass and average salinity information. This validates the use of a single site on a given date to estimate average dissolved salt mass and average salinity on the given date for the arm of the lake where that single site resides. This suggests that sampling that is less frequent in space but more frequent in time and depth would improve the tracking of salinity trends.
Our findings related to the decline in total salt mass and the sampling needed to quantify salt mass and salinity changes have ramifications for the GSL’s economy and ecology. From a practical and lake management perspective, the annual regional economic value of the mineral extraction industry has been reported to be $1.13 billion and to support 5368 jobs [35]. Commercial brine shrimp production has been reported to produce $56.7 million economically and to support 574 jobs [35]. The brine shrimp are also a great ecological asset to the lake as a major food source for migratory birds. The GSL and surrounding wetlands support upward of 5 million birds during the yearly migration [36] and, for some species, is the only stop in North America during their journey [37]. Increased salinity in the south arm and low lake WSE threatens the brine shrimp. At the present lake WSE, south arm salinity is above the optimal brine shrimp salinity range (90–130 g/L, Figure 8). In response to this, the state of Utah recently authorized the raising of a temporary berm in the West Crack breach to reduce flow through the causeway in an attempt to maintain lower salinity levels in the south arm and avoid collapse of the brine shrimp ecosystem. It will be important to monitor salinity in both the south and north arms to quantify the impact of these changes as the causeway berm is used to adaptively manage salinity.

5. Conclusions

We analyzed the historical record of salinity and WSE data for the GSL to better understand the movement and changes of salt in time and space within the lake and to evaluate the occurrence and extent of the DBL. Our analysis of the UGS and USGS datasets produced plots of salinity at depth over time and average salinity for both arms of the lake. The data show positive correlation between the average salinity in each arm such that their salinities rise and falls in unison. Our presentation of the salinities at depth over time show that, apart from flooding events, the north arm is homogeneous throughout the water column and consistently at or near a saturation salinity of approximately 275 g/L. In the south arm, we see fluctuating salinities and a lower portion of the water column that is prone to stratification. The upper portion of the water column in the south arm, above approximately 1272.5 m (4175 feet), is nearly homogeneous with surface salinities at or slightly below the average salinity of the south arm, which tends to remain around 125 g/L, although it was closer to 200 g/L shortly after the railroad causeway was constructed and may once again be increasing. High salinities in the bottom layer of the south arm are what is referred to as the DBL and appear in data from sample sites within the 1272.5 m contour. Consistent with prior studies [11], we found that the DBL is intermittent, occurring only when causeway exchange supports flow from the north to south arms, and that it has a salinity of approximately 150–250 g/L. Our analysis also produced time series of average dissolved salt mass and total salt mass for each arm of the lake. Based on our salinity and salt mass results, similar information from separate sites suggests that salinity trends can be tracked using fewer sampling sites and higher sampling frequencies in time and depth. We also found that the average dissolved salt mass is negatively correlated between the two arms, such that the north arm mass increases as the south arm mass decreases and vice versa. These changes in salt mass reflect net movements of salt through the causeway, from south to north when lake WSE is going up and from north to south when lake WSE is going down. In addition, we show that the GSL has experienced a drop in total salt mass by more than 30% since the peak lake WSE in 1986. This salt loss is driven by mineral extraction processes that have removed approximately 1.177 billion metric tons (1.297 billion US tons) since 1986, which is approximately ten times the estimated contribution from inflows over the same time period.

Supplementary Materials

Supplementary material that provides additional detail on salinity measurements and plots of salinity at depth over the period of record for each sampled site [16,38] can be downloaded at: https://www.mdpi.com/article/10.3390/w15081488/s1.

Author Contributions

Conceptualization, M.F.M. and D.G.T.; methodology, M.F.M. and D.G.T.; formal analysis, M.F.M.; writing—original draft preparation, M.F.M.; writing—review and editing, D.G.T.; visualization, M.F.M.; supervision, D.G.T.; project administration, D.G.T.; funding acquisition, D.G.T. All authors have read and agreed to the published version of the manuscript.

Funding

This research was funded by the Utah Water Research Laboratory and based on early analysis supported by the State of Utah and CH2MHill for the development of the Integrated Water Resources Management Model for the Great Salt Lake Basin. Completion of the project was supported by the Sant Foundation Endowed Professorship to David Tarboton.

Data Availability Statement

Data used in this paper have been added to the publicly available HydroShare Collection of Great Salt Lake Data https://www.hydroshare.org/resource/b6c4fcad40c64c4cb4dd7d4a25d0db6e/ (accessed on 1 March 2023).

Conflicts of Interest

The authors declare no conflict of interest. The funders had no role in the design of the study; in the collection, analyses, or interpretation of data; in the writing of the manuscript; or in the decision to publish the results.

References

  1. Jones, E.F.; Wurtsbaugh, W.A. The Great Salt Lake’s monimolimnion and its importance for mercury bioaccumulation in brine shrimp (Artemia franciscana). Limnol. Oceanogr. 2014, 59, 141–155. [Google Scholar] [CrossRef]
  2. Wurtsbaugh, W.A.; Berry, T.S. Cascading effects of decreased salinity on the plankton, chemistry, and physics of the Great Salt Lake (Utah). Can. J. Fish. Aquat. Sci. 1990, 47, 100–109. [Google Scholar] [CrossRef]
  3. Hassan, D.; Burian, S.J.; Johnson, R.C.; Shin, S.; Barber, M.E. The Great Salt Lake Water Level is Becoming Less Resilient to Climate Change. Water Resour. Manag. 2022, 1–24. [Google Scholar] [CrossRef]
  4. Utah Division of Forestry, Fire and State Lands (UDFFSL). Final Great Salt Lake Comprehensive Management Plan and Record of Decision; Utah Division of Forestry, Fire and State Lands: Salt Lake City, UT, USA, 2013; 391p. Available online: https://geodata.geology.utah.gov/pages/view.php?ref=8267 (accessed on 6 January 2023).
  5. Loving, B.L.; Waddell, K.M.; Miller, C.W. Water and Salt Balance of Great Salt Lake, Utah, and Simulation of Water and Salt Movement through the Causeway, 1987–98; U.S. Geological Survey: Salt Lake City, UT, USA, 2000. Available online: https://pubs.usgs.gov/wri/2000/4221/report.pdf (accessed on 12 August 2022).
  6. Tripp, T.G. Production of Magnesium from Great Salt Lake, Utah USA; Natural Resources and Environmental Issues: Article 10; Utah State University: Logan, UT, USA, 2009; Volume 15, Available online: https://digitalcommons.usu.edu/nrei/vol15/iss1/10 (accessed on 22 May 2012).
  7. White, J.S.; Null, S.E.; Tarboton, D.G. How do changes to the railroad causeway in Utah’s Great Salt Lake affect water and salt flow? PLoS ONE 2015, 10, e0144111. [Google Scholar] [CrossRef] [PubMed] [Green Version]
  8. Madison, R.J. Effects of a Causeway on the Chemistry of the Brine in Great Salt Lake, Utah; Water-Resources Bulletin; Utah Geological and Mineralogical Survey: Salt Lake City, UT, USA, 1970; Volume 14, 50p. Available online: https://ugspub.nr.utah.gov/publications/water_resources_bulletins/WRB-14.pdf (accessed on 1 March 2023).
  9. Naftz, D.; Angeroth, C.; Kenney, T.; Waddell, B.; Darnall, N.; Silva, S.; Perschon, C.; Whitehead, J. Anthropogenic influences on the input and biogeochemical cycling of nutrients and mercury in Great Salt Lake, Utah, USA. Appl. Geochem. 2008, 23, 1731–1744. [Google Scholar] [CrossRef]
  10. Valdes, C.; Black, F.J.; Stringham, B.; Collins, J.N.; Goodman, J.R.; Saxton, H.J.; Mansfield, C.R.; Schmidt, J.N.; Johnson, W.P. Total Mercury and Methylmercury Response in Water Sediment, and Biota to Destratification of the Great Salt Lake, Utah, USA. Environ. Sci. Technol. 2017, 51, 4887–4896. [Google Scholar] [CrossRef] [PubMed]
  11. Yang, S.; Johnson, W.P.; Black, F.J.; Rowland, R.; Rumsey, C.; Piskadlo, A. Response of density stratification, aquatic chemistry, and methylmercury to engineered and hydrologic forcings in an endorheic lake (Great Salt Lake, U.S.A.). Limnol. Oceanogr. 2019, 65, 915–926. [Google Scholar] [CrossRef]
  12. Wurtsbaugh, W.A.; Sima, S. Contrasting Management and Fates of Two Sister Lakes: Great Salt Lake (USA) and Lake Urmia (Iran). Water 2022, 14, 3005. [Google Scholar] [CrossRef]
  13. Diaz, X.; Naftz, D.L.; Johnson, W.P. Selenium Mass Balance in the Great Salt Lake, Utah. Sci. Total Environ. 2009, 407, 2333–2341. [Google Scholar] [CrossRef] [PubMed]
  14. Diaz, X.; Johnson, W.P.; Fernandez, D.; Naftz, D.L. Size and Elemental Distributions of Nano- to Micro- Particulates in the Geochemically-stratified Great Salt Lake. Appl. Geochem. 2009, 24, 1653–1665. [Google Scholar] [CrossRef]
  15. Brown, P.D.; Bosteels, T.; Marden, B.T. Salt load transfer and changing salinities across a new causeway breach in Great Salt Lake: Implications for adaptive management. Lakes Reserv. Sci. Policy Manag. Sustain. Use 2023, 28, e12421. [Google Scholar] [CrossRef]
  16. Naftz, D.L.; Millero, F.J.; Jones, B.F.; Green, W.R. An Equation of State for Hypersaline Water in Great Salt Lake, Utah, USA. Aquat. Geochem. 2011, 17, 809–820. [Google Scholar] [CrossRef]
  17. Baskin, R.L.; Allen, D.V. Bathymetric Map of the South Part of Great Salt Lake, Utah: U.S. Geological Survey Scientific Investigations Map 2894; USGS: Reston, VA, USA, 2005. Available online: https://pubs.usgs.gov/sim/2005/2894/ (accessed on 1 March 2023).
  18. Baskin, R.L.; Turner, J. Bathymetric Map of the North Part of Great Salt Lake, Utah: U.S. Geological Survey Scientific Investigations Map 2006–2954; USGS: Reston, VA, USA, 2006. [CrossRef]
  19. Baskin, R.L. Farmington Bay Contours in 2009 and Modified by BIO-WEST in 2010, Including Minor Contour Manipulation and the Introduction of a 1280 Meter (4200 Foot) Contour at the South End of the Bay. Personal communication. 2010. [Google Scholar]
  20. Hansen & Associates. Bear River Bay Survey in 2009 under a Contract with BIO-WEST. Personal communication. 2010.
  21. ESRI. ArcGIS Desktop: Release 10; Environmental Systems Research Institute: Redlands, CA, USA, 2015. [Google Scholar]
  22. Tarboton, D. Great Salt Lake Bathymetry. HydroShare. 2017. Available online: http://www.hydroshare.org/resource/582060f00f6b443bb26e896426d9f62a (accessed on 1 March 2023).
  23. Tarboton, D. Great Salt Lake Area Volume Data. HydroShare. 2017. Available online: http://www.hydroshare.org/resource/89125e9a3af544eab2479b7a974100ba (accessed on 1 March 2023).
  24. Great Salt Lake Salinity Advisory Committee. Standard Operating Procedure—Great Salt Lake Water Density Measurement and Salinity Calculation; Utah Geological Survey Open-File Report 728; Great Salt Lake Salinity Advisory Committee: Salt Lake City, UT, USA, 2020; 6p. [CrossRef]
  25. Spieweck, F.; Bettin, H. Review: Solid and liquid density determination. Tech. Mess. 1992, 59, 285–292. [Google Scholar] [CrossRef]
  26. Mohammed, I.N.; Tarboton, D.G. An examination of the sensitivity of the Great Salt Lake to changes in inputs. Water Res. Res. 2012, 48, W11511. [Google Scholar] [CrossRef] [Green Version]
  27. R Core Team. R: A Language and Environment for Statistical Computing; R Foundation for Statistical Computing: Vienna, Austria, 2012; Available online: http://www.R-project.org/ (accessed on 1 March 2023).
  28. Hahl, D.C. Dissolved-Mineral Inflow to Great Salt Lake and Chemical Characteristics of the Salt Lake Brine: Summary for Water Years 1960, 1961, and 1964; Water-Resources Bulletin 10; Utah Geological Survey: Salt Lake City, UT, USA, 1968; 35p.
  29. Utah Division of Water Rights. WUSEVIEW Water Records/Use Information Viewer. Available online: https://waterrights.utah.gov/cgi-bin/wuseview.exe (accessed on 28 February 2023).
  30. Merck, M.; Tarboton, D. Great Salt Lake Mineral Extraction Water Withdrawals. HydroShare. 2023. Available online: http://www.hydroshare.org/resource/46b98820b7214850aadf6fa60c9bc1d1 (accessed on 8 March 2023).
  31. Rupke, A.; Jagnieki, E. The Significance of Great Salt Lake’s North Arm on Lake Salinity; Survey Notes; Utah Geological Survey: Salt Lake City, UT, USA, 2021. Available online: https://ugspub.nr.utah.gov/publications/survey_notes/snt53-1.pdf (accessed on 1 March 2023).
  32. Rasmussen, M.; Dutta, S.; Neilson, B.T.; Crookston, B.M. CFD Model of the Density-Driven Bidirectional Flows through the West Crack Breach in the Great Salt Lake Causeway. Water 2021, 13, 2423. [Google Scholar] [CrossRef]
  33. Waddell, K.M.; Bolke, E.L. The Effects of Restricted Circulation on the Salt Balance of Great Salt Lake, Utah; Water-Resources Bulletin; Utah Geological Survey: Salt Lake City, UT, USA, 1973; Volume 18, p. 54. Available online: https://ugspub.nr.utah.gov/publications/water_resources_bulletins/WRB-18.pdf (accessed on 1 March 2023).
  34. Wold, S.R.; Thomas, B.E.; Waddell, K.M. Water and Salt Balance of Great Salt Lake, Utah, and Simulation of Water and Salt Movement through the Causeway; Water Supply Paper 2450: 1–64; US Geological Survey: Salt Lake City, UT, USA, 1997. [CrossRef]
  35. Bioeconomics, Inc. Economic significance of the Great Salt Lake to the State of Utah. Prepared for State of Utah Great Salt Lake Advisory Council. 2012. Available online: https://documents.deq.utah.gov/water-quality/standards-technical-services/great-salt-lake-advisory-council/Activities/DWQ-2012-006863.pdf (accessed on 1 March 2023).
  36. Western Hemisphere Shorebird Reserve Network (WHSRN). Conserving Shorebirds and Their Habitat through a Network of Key Sites across the Americas. Available online: www.whsrn.org (accessed on 1 March 2023).
  37. Aldrich, T.W.; Paul, D.S. Avian ecology of Great Salt Lake. In Great Salt Lake: An Overview of Change; Gwynn, J.W., Ed.; Utah Department of Natural Resources: Salt Lake City, UT, USA, 2002; pp. 343–374. [Google Scholar]
  38. Rupke, A. (Utah Geological Survey, Salt Lake City, Utah, USA). Personal communication. 2022. [Google Scholar]
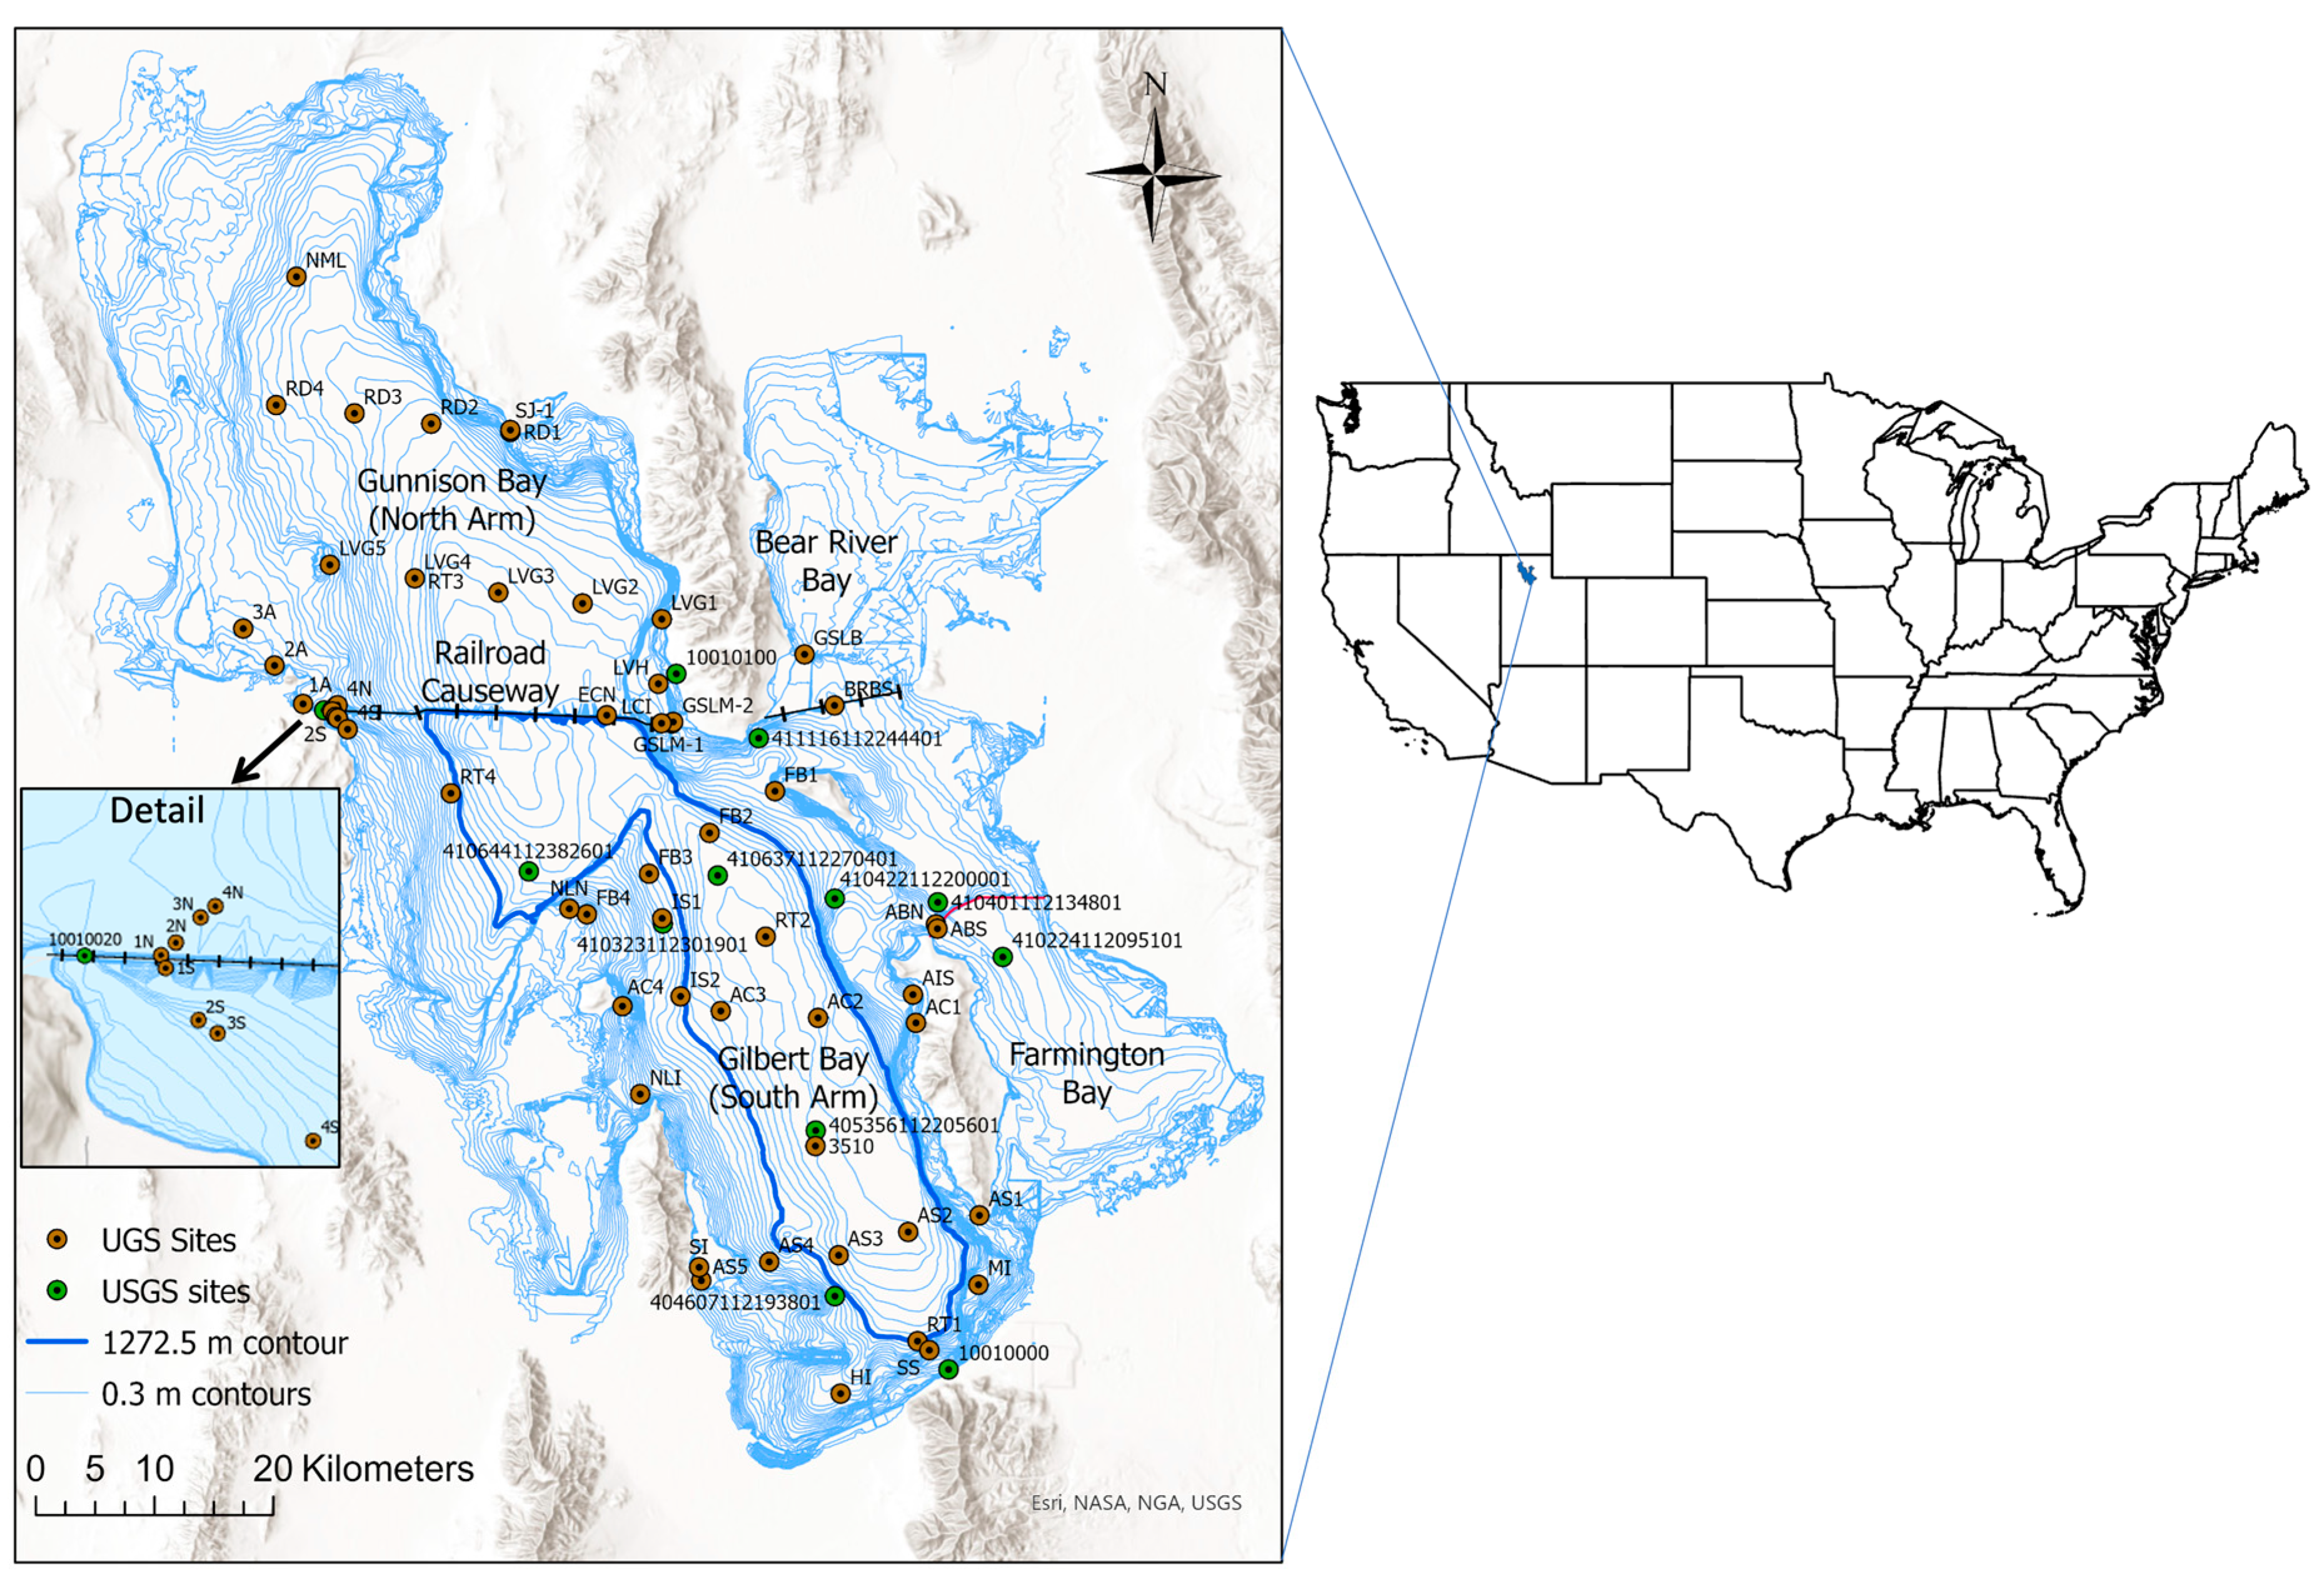
Figure 1. Locations of historical UGS (orange) and USGS (green) sampling sites within the GSL. Light blue lines are 0.3 m contours. Dark blue line is the 1272.5 m contour, within which the DBL can be found. Location of GSL in Northern Utah, USA, is shown.
Water 15 01488 g001
Figure 2. Timeline indicating when the GSL was sampled over the historical record, from 1966 to early 2023, using UGS north arm (dark orange), UGS south arm (light orange), USGS north arm (dark green), and USGS south arm (light green) sites. Each x represents one sampling event.
Water 15 01488 g002
Figure 3. Annual count of individual UGS (orange) and USGS (green) samples over the historical record. Samples taken at different depths at a single site were counted separately.
Water 15 01488 g003
Figure 4. Hypothetical lake at WSE h with n number of measurements at depth on a given day. Cross-sections indicate layers used to calculate average dissolved salt mass and average salinity. Adapted with permission from Ref. [26], Copyright American Geophysical Union, 2012.
Water 15 01488 g004
Figure 5. Example plots of salinity at depth over the period of record for individual sample sites (a) AS2 and (b) AIS, both of which are in the south arm (see Figure 1 for site locations). Each dot indicates a salinity calculation from a single sample site measurement. Salinity was calculated using the Naftz et al. [16] equation of state, Equation (1). Solid black line represents the WSE from USGS measurements. Dashed gray horizontal line represents the elevation of the bottom of the lake at the specific sample site. Due to drifting of the boat or instrument while being lowered into the water, some measurements have been recorded below the elevation of the lake bottom at the location of the measurement site.
Water 15 01488 g005
Figure 6. Salinity at depth over time in the (a) north arm and (b) south arm for all samples taken over the period of record at the UGS and USGS measurement sites shown in Figure 1. Each dot indicates a salinity calculation from a single sample site measurement. Salinity was calculated using the Naftz et al. [16] equation of state, Equation (1). Solid black line represents the WSE from USGS measurements. Horizontal dashed lines indicate causeway openings invert elevations, culvert base and top elevations, and the elevation separating permeable and impermeable fill in causeway base. Vertical dashed lines indicate date causeway was constructed and periods of west desert pumping and return.
Water 15 01488 g006aWater 15 01488 g006b
Figure 7. North and south arm average dissolved salt mass over the period of record at GSL measurement sites (Figure 1). Point values were calculated using all measurements at a single site on a given date. Dashed lines represent the estimated monthly time series.
Water 15 01488 g007
Figure 8. North and south arm salinities over the period of record at GSL measurement sites (Figure 1). Point values were calculated using all measurements at a single site on a given date. Dashed lines represent the estimated monthly time series.
Water 15 01488 g008
Figure 9. Salinities in the south arm. Surface (less than 0.3 m depth) and bottom (below 1272.5 m elevation) salinity points were calculated using individual measurements from sample sites within the 1272.5 m contour shown in Figure 1 (including UGS sites RT4, RT2, RT1, NLN, FB2, AS2, AC3, and AC2; and USGS sites 405356112205601, 410637,112270401, and 410644112382601). The dashed line is the estimated monthly time series of average salinity from Figure 8.
Water 15 01488 g009
Figure 10. North and south arm salt mass calculations over the period of record at the UGS and USGS measurement sites shown in Figure 1. Calculations were only performed for sample events with 3 or more samples at depth. 1 Mg = 1 metric ton.
Water 15 01488 g010
Table 1. Estimated cumulative contributions to the total salt mass calculations before (May 1966–September 1986) and after (October 1986–December 2021) the maximum mass in 1986. Values are in billion metric tons.
Mass Contribution1966–1986 (20 Years)1986–2021 (35 Years)
River, Groundwater and Other Inputs0.0650.112
West Desert Project-−0.191
Mineral Extraction
North Arm Withdrawal
-−1.277
Mineral Extraction
North Arm Return
-0.346
Mineral Extraction
South Arm Withdrawal
−0.099−0.511
Mineral Extraction
South Arm Return
0.0570.265
Disclaimer/Publisher’s Note: The statements, opinions and data contained in all publications are solely those of the individual author(s) and contributor(s) and not of MDPI and/or the editor(s). MDPI and/or the editor(s) disclaim responsibility for any injury to people or property resulting from any ideas, methods, instructions or products referred to in the content.