Article

Remediation of Methylene Blue Dye from Wastewater by Using Zinc Oxide Nanoparticles Loaded on Nanoclay

1
Department of Life Sciences, Hemchandracharya North Gujarat University, Patan 384265, Gujarat, India
2
Department of Chemistry, Maulana Azad National Institute of Technology, Bhopal 462003, Madhya Pradesh, India
3
Department of Zoology, College of Science, King Saud University, P.O. Box 2455, Riyadh 11451, Saudi Arabia
4
Faculty of Medicine and Pharmacy, University of Oradea, P-ta 1 Decembrie 10, 410087 Oradea, Romania
*
Authors to whom correspondence should be addressed.
Water 2023, 15(7), 1427; https://doi.org/10.3390/w15071427
Submission received: 17 February 2023 / Revised: 29 March 2023 / Accepted: 31 March 2023 / Published: 6 April 2023

Abstract

:
Dyes are one of the major environmental pollutants throughout the world, leading to pollution and numerous diseases. Though several techniques have been applied for the remediation of dyes, most of them are ineffective. The authors developed a halloysite clay/zinc oxide nanocomposite (HC/ZnONC) via a chemical route in the present study. The nanocomposite and its constituents, i.e., raw halloysite clay (HC) and zinc oxide nanoparticles (ZnONPs) (synthesized using the same chemical method) were analyzed for their detailed properties by sophisticated instruments. The field emission scanning electron microscope (FE-SEM) and transmission electron microscope (TEM) analysis showed spherical-shaped ZnONPs with an average size of 54.9 nm and tube-like shapes of HC with a diameter ranging from 40–200 nm and a length at the micron scale, while the nanocomposite had incorporated ZnONPs in their tube-like structures. Ultraviolet-Diffuse Reflectance Spectroscopic (UV-DRS) study revealed the photocatalytic ability of the nanocomposite with a band of 3.08 eV. A high surface area of 60.25 m2/g and the microporous and mesoporous nature of the nanocomposite were confirmed by the Brunauer–Emmet–Teller (BET) surface area analyzer. Finally, the developed nanocomposite was used for the remediation of methylene blue from the aqueous solutions, and the efficiency of removal varied from 90 to 97%.

1. Introduction

Dyes are colored fragrant organic compounds that absorb light and give color to the visible region [1]. Dyes are also applied to give a permanent color to the substrates, and due to these features, they are widely used in industries such as textiles, food, rubber, printing, cosmetics, pharmaceuticals, plastics, paper, and concrete [2,3,4,5,6]. These industries produced huge amounts of wastewater containing carcinogenic and toxic dyes that pollute water, making it unfit for human consumption [7]. Every year, a million tons of dyes are dumped into the river or other water bodies. After reaching water bodies, they may lead to pollution that affects flora and fauna. Moreover, dyes will lead to reduced sunlight penetration through the water bodies, thus the plants living at the bottom will not be able to absorb the light [8].
One of the most widely used dyes in various industries is methylene blue, used for dyeing silk, wool, paper, and cotton. Methylene blue (MB) is an aromatic heterocyclic basic dye that comes under the class of polymethine dye. Industrial dyes are some of the dominant chemicals that increase the percentage of water pollution [9]; among these dyes, MB is toxic, carcinogenic, and non-biodegradable and can be a severe threat to human health and environmental safety [10]. MB causes many dangers to human health, such as respiratory distress, abdominal disorders, blindness, and digestive and mental disorders [11]. Various treatment techniques are being used for the removal of dye compounds from wastewater [12,13,14]. Recently, the use of nanotechnology-based methods has received great attention in the area of wastewater treatment [15,16].
Nanoparticles (NPs) have chemical and physical properties that make them very different from the respective bulk materials due to their small size and large surface-to-volume (SVR) ratio [15,16]. One such NP is zinc oxide nanoparticles (ZnONPs), which have gained huge attention in the last decade due to their photocatalytic activity in addition to their small size and high surface-area-to-volume ratio [15]. It is widely used in environmental cleanups such as pollutant removal (organic and inorganic), medicine, and cosmetics [16,17]. ZnONPs are synthesized by all three possible routes: biologically by microbes and plants, chemical routes such as precipitation, co-precipitation, etc., and physically by ball milling, physical vapor deposition, etc. They are commonly used alone or along with large particles on which they are decorated or functionalized. Recently, Khan et al. [18] and Khan et al. [19,20] reported the synthesis of ZnONPs by the chemical co-precipitation method and applied them for the remediation of pesticides from wastewater. Recently, Khan et al. [21] synthesized ZnONPs from zinc precursors and assessed their toxicity against cell lines [22,23]. Purcar and their team synthesized ZnONPs that were modified with various silane-based coupling agents via the sol-gel method. After analysis of all the developed materials, the investigators studied the thermal stability and wettability parameters for all the hybrid materials [24].
Clay is one of the natural particles, which is mainly hydrated Ferro-alumino-silicates [25]. Clay must have at least a diameter of fewer than two microns. It is present in nature in rocks, soil, muddy areas etc. [26,27] and has important roles in medicine [28], environmental cleanup [29,30,31,32] and construction [33]. The surface area of clay is an area which is accessible to ions and molecules when the clay is present in aqueous solutions [34]. However, there are various types of clay, for instance halloysite, montmorillonite, kaolin, vermiculites etc. [35]. Recently, halloysite clay (HC) has gained huge popularity in the field of research and remediation purposes. It has layered structures that are well reported by numerous investigators in the literature; for instance, Albdiry et al. [36] reported its crystalline nature, which is shown below in Figure 1.
Various investigators have used HC for environmental purposes, such as the removal of dyes, heavy metals, and pesticides. For instance, Peng et al. [37] used HC for MB dye removal, and Kamble et al. described the various application of HC [38]. Few investigators have used HC in medicine as a drug delivery agent, as did Hanif et al. [28]. In addition to this, it has also been used in cosmetics such as sunscreen and protecting agents, for instance by Borah et al. [39]. There are several examples where HC has been used either directly or has been decorated by metallic or non-metallic nanoparticles to form a nanocomposite [40,41].
Nanocomposite (NC) is a matrix in which nanoparticles are added to improve the specific properties of a material [42]. Due to the properties of NC, researchers and companies have considered using this material in many fields, such as environmental clean-up, medicine, etc. [42,43,44]. Properties that have undergone substantial improvements include mechanical properties, thermal stability, more surface appearance, improved electrical conductivity, increase chemical resistance and many more [45]. NCs are multiphase solid materials with structures that have one, two or three dimensions less than 100 nanometers (nm) in a single phase or with structures with nano scale repeatable distances between the different phases that make up the material [10,46]. Nanoparticles, nanosheets, nanofibers, and carbon nanotubes (CNTs) [47] are examples of separate inorganic units of nanocomposite materials [43]. NCs are the best candidate for significantly improving the microscopic properties of products [45,48,49,50]. Recently, HC and ZnONPs have gained huge attention in the field of nanocomposite development.
Shu et al. [51] reported the formation of halloysite nanotubes decorated by zinc oxide nanoparticles and silver nanoparticles (Ag). The HC was micron-sized, while the size of the ZnONPs was 100 nm and the size of the Ag was 8 nm. The developed nanocomposites were used for antimicrobial activity against Escherichia coli. The Ag-ZnONPs-HC nanocomposite showed better antimicrobial activity [51]. Sudhakar (2021) investigated the thermomechanical properties of organically modified polymer clay nanocomposites for packaging applications. In this study, the crystalline sharp peaks of the clay in X-ray diffraction (XRD) became widespread upon annealing with polymers, indicating that organo montmorillonite (MMT) can be successfully bonded to each other by polymer chains [52]. Choudhary et al. [53] developed an NC where silver nanoparticles were decorated on the surface of montmorillonite (MMT). The clay particles were large flakes with a layered structure and were micron-sized, and they were used for the removal of MB dye from aqueous solutions [53]. Gnanamoorthy et al. [10] synthesized copper nickel oxide (CuNiO2) and reduced graphene oxide (rGO) nanocomposite via a chemical route and applied them for the remediation of MB dye by photocatalytic action. The developed NC showed better efficiency for the removal of MB dye from the aqueous solutions [10]. Zsirka et al. [54] developed an NC of ZnONPs and HC, where the ZnONPs were synthesized via a chemical precipitation route. The average size of the synthesized ZnONPs was 10–22 nm, and the shape was quasi-spherical scale-like. The developed NC was used for the remediation of a phenolic compound (4-nitrophenol) [54].
Purcar and their team developed a thin film from silica–titanium oxides and silica-aluminum oxide (Si–Al2O3) and utilized them for the remediation of various cation dyes, including MB, malachite green, crystal violet and rhodamine B from the wastewater.
Caprarescu and their team showed the efficient remediation of Indigo Carmine dye from a synthetic solution by using electrodialysis conducted in an ion exchange membrane process. Here, a batch electrodialysis system was carried out at different current identities (0.05, 0.1 and 0.15 A). The authors concluded that when the current intensity was increased, the color removal efficiency (CR%) and electrical conductivity also increased, and the optimum value was obtained at 0.15 A (CR > 97%) [55].
Caprarescu and their team used two types of membranes, namely a normal membrane and another one modified with a natural fruit extract (rosehip). After the analysis of both types of members by analytical instruments, they were used for the remediation of crystal violet dye from synthetic wastewater. Here, the investigators carried out the treatment in a developed three-compartment laboratory-scale electro-dialysis cell. The authors found that the maximum dye removal percentage achieved was (>96%) after 1 h and 30 min by using membranes doped with natural fruit extract [56].
One year later a team led by Caprarescu developed a special type of membrane that was enriched with commercial gooseberry bud extract, which was placed by electrodialysis. Further, the investigators used this system for the remediation of MB dye from the simulated wastewater. The authors revealed that the CR% and EC increase with time and the maximum value of CR% were achieved at one hour (CR, 89%) [57].
Recently, Modrogan and their team tried to remove methyl orange dye from synthetic wastewater by using magnetite and polyvinyl alcohol-based nanocomposite. Here, the investigators assessed the photodegradation method by using variable dosages of the nanocomposite and amount of hydrogen peroxide (H2O2), and various pH levels. From this investigation, investigators concluded that hydrogen peroxide is one of the dependent factors for the complete degradation of MO dye. Moreover, the authors also concluded that H2O2 could also accelerate the degradation of MO dye to more highly oxidized intermediates in the presence of UV radiation (99.35%) [58].
The current research work emphasizes the synthesis of ZnONPs and their utilization as a surface functionalization agent on the surface of natural nano clay to form a nanocomposite. One objective is to synthesize ZnONPs via the ultrasonication method and to characterize and confirm them by various analytical instruments. Another objective is to characterize the halloysite nano clay with analytical instruments. Another objective was to functionalize the synthesized ZnONPs on the HC surface. Another objective was to utilize the developed nanocomposite for the remediation of methylene blue dye from simulated wastewater. One final objective was to observe the effect of the dose of nanocomposites, MB dye concentration, etc. on the adsorption of dye from the simulated wastewater.

2. Materials and Method

2.1. Materials

Halloysite nano clay (H4Al2O9Si2·2H2O) [Sigma-Aldrich, Schnelldorf, Germany, AR grade], Zinc Nitrate Hexahydrate (Himedia, Ahemdabad, Gujarat, India, AR grade), carbamide (Himedia, Gujarat, India, AR grade), and double distilled water (DDW).

2.2. Methods

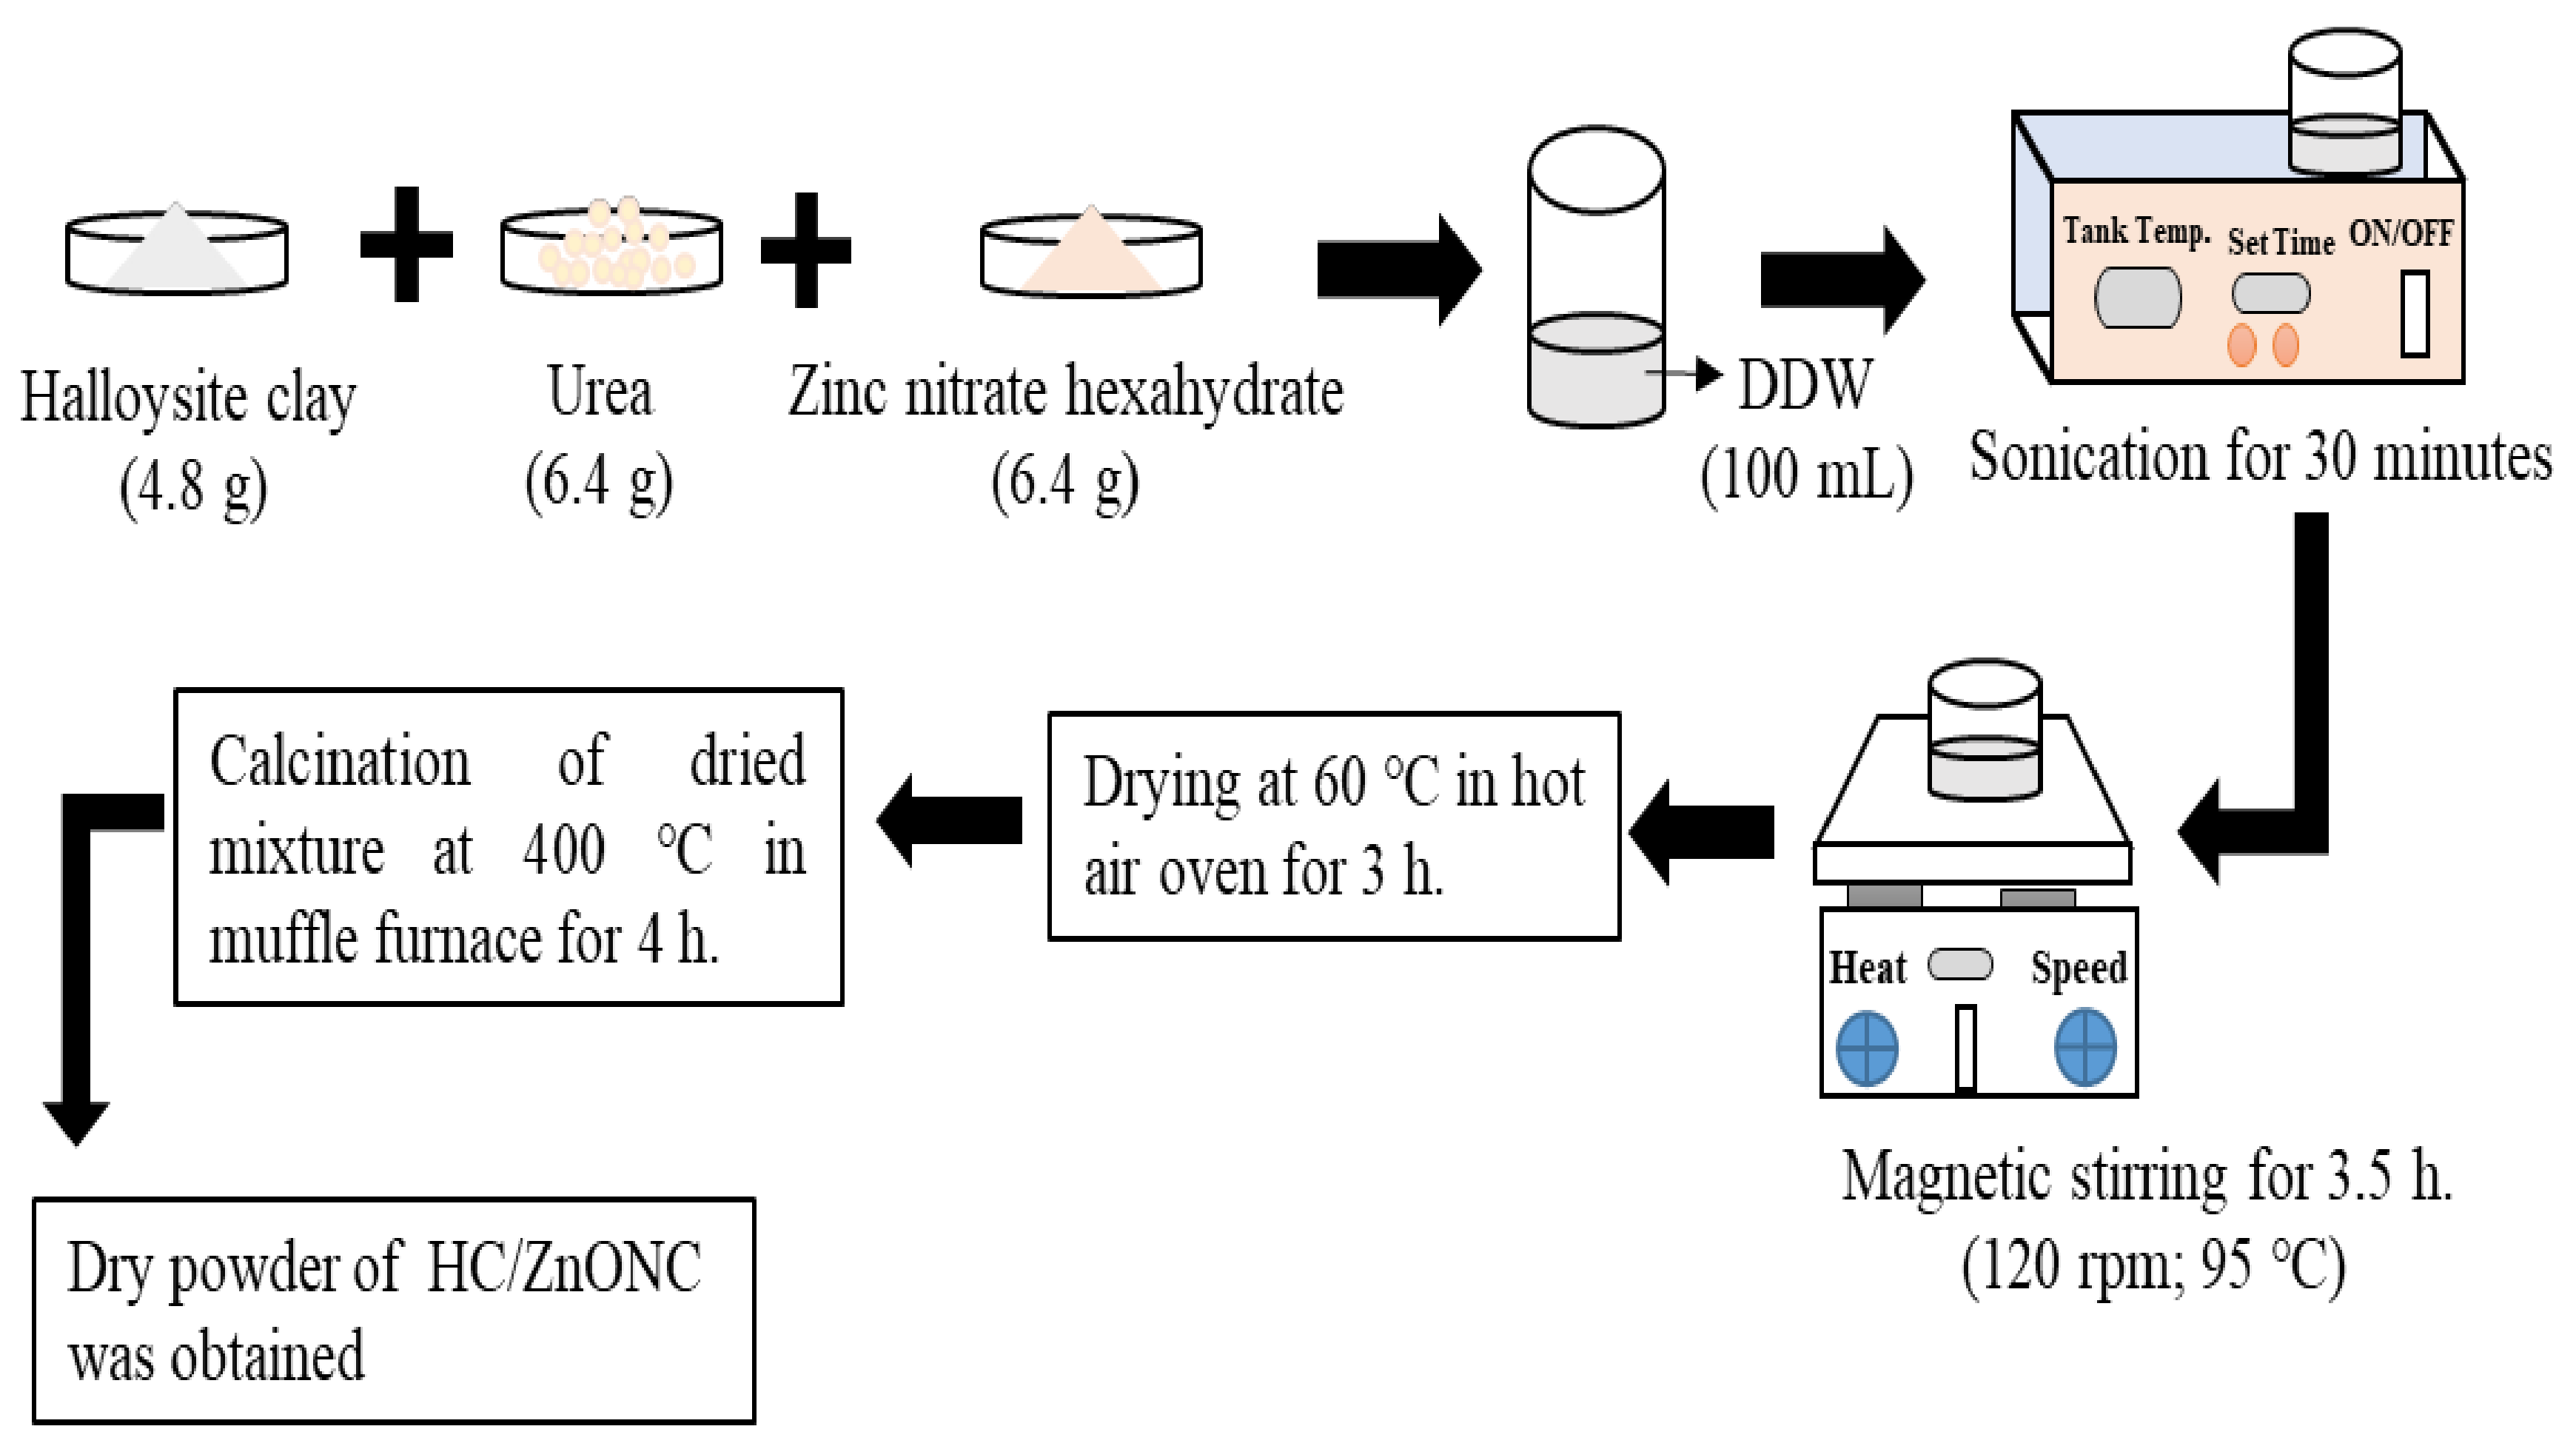
2.2.1. Synthesis Procedure for HC/ZnONC

The development of NC was carried out by the ultrasonication-assisted precipitation method. Pure ZnONPs were also synthesized by using the same method under similar conditions (such as temperature, pH, and sonication and drying time period) without using HC. A mixture was prepared by adding HC, urea and zinc nitrate hexahydrate in DDW and was placed in a water bath ultrasonicator (Sonar, 40 kHz). When the urea is dissolved in water, it produces carbonate anion and ammonia, whereas HC ensures the uniform distribution of ZnONPs throughout the matrix. The formation of the nanocomposite is shown in Figure 2. The formation of ZnONPs in the matrix of the HC by using urea as a precipitating and stabilizing agent might have followed the following Equations (1)–(5):
CO NH 2 2 + 3 H 2 O CO 2 + 2 NH 3 H 2 O
2 NH 3 · H 2 O + CO 2 2 NH 4 + + CO 3 2 + OH
Zn ( NO 3 ) 2 · 6 H 2 O + H 2 O Zn 2 + + 2 NO 3 + 7 H 2 O
4 Zn 2 + + CO 3 2 + 6 OH + H 2 O Zn 4 CO 3 OH 6 · H 2 O
Zn 4 CO 3 OH 6 · H 2 O 4 ZnO + 4 H 2 O + CO 2

2.2.2. Synthesis of Nanocomposite

For the synthesis of HC/ZnO NC, a mixture of HC with urea and zinc nitrate hexahydrate (precursor for ZnO nanoparticles) was prepared in DDW. The sonication-assisted precipitation method was used, and the complete process is shown below in Figure 3.

2.2.3. Preparation of Dye Solution

An aqueous solution of MB with about 50 mL of dye was prepared by dissolving MB at a concentration of 25 ppm, 50 ppm, 100 ppm and 200 ppm in an Erlenmeyer flask. The samples were then stored for future use.

2.2.4. Remediation of Dye

In each of the four different concentrations of MB dye, about 20 mg of NC was added. The doses of the NC were kept constant throughout the experiment, and measurements were taken against time. The sample was kept in a closed chamber fitted with UV light and which had a magnetic stirrer for continuous stirring at 500 rpm. An aliquot of about 5 mL was taken out after regular intervals to detect the concentration of MB over time. After every 15 min, about 5 mL of sample was extracted from the reaction mixture to measure the residual concentration of dye using a UV/visible spectrophotometer. The reaction was carried out for 75 min; after 75 min, the color of the dye faded, after which the reaction was stopped. The percentage removal of MB dye was calculated by using Formula (6):
%   Dye   Removal = C 0 C t C 0 × 100
where C0 = initial concentration (mg/L); Ct = MB concentration at time ‘t’ (mg/L).

3. Characterization of Synthesized HC/ZnO Nanocomposite

The synthesized ZnONPs, HC and HC-ZnONC were analyzed by various sophisticated instruments such as Fourier transform infrared (FT-IR), ultraviolet-Diffuse Reflectance Spectroscopic (UV-DRS), X-ray diffraction (XRD), field emission scanning electron microscopy (FE-SEM), electron diffraction spectroscopy (EDS), transmission electron microscopy (TEM), Brunauer–Emmett–Teller (BET) and thermogravimetric analysis (TGA) for the identification and confirmation of the particle.
UV-Vis analysis: The measurement of all three samples was done by using a Halo double-beam spectrophotometer (D-B 200 Shimdzu, Chiyoda-ku, Tokyo, Japan) in the range of 200–800 nm at a resolution of 1 nm. The samples were dispersed in the DDW, followed by ultrasonication before the UV study.
UV-Diffuse Reflectance Spectroscopic (DRS) Analysis: The UV-Vis diffuse reflectance spectra of ZnO and HC/ZnO nanocomposites. The DRS spectra of ZnONPs and HC/ZnONC were analyzed by using the Kubelka–Munk theory. The calculation of the band gap was carried out by the Kubelka–Munk Formula (7),
K = 1 R 2 2 R
where K = transformed reflectance as per Kubelka–Munk
R = % Reflectance
FTIR measurement of the sample was done by using a spectrum SP 65 Perkin Elmer (Waltham, MA, USA) instrument by using the solid KBr pellet method. The measurement of the samples was conducted in the mid-IR range of 400–4000 cm−1, at a resolution of 1 nm. All the samples were separately taken along with KBr and mixed in a 98:2 mg ratio. The mixture was thoroughly mixed in a mortar and pestle. Finally, a pellet was prepared by using a mechanical pellet-making machine. XRD analysis for all the solid powder samples was analyzed by using D-8, Advance, Bruker (Ettlingen, Germany) model. XRD patterns were recorded in the 2-theta range of 20–70 with a step size of 0.02 and a time of 5 s per step at 40 kV voltage and a current of 30 mA. The crystalline and amorphous phases were determined by the XRD. FESEM was done for the morphological as well as elemental analysis of all the samples. All the powder samples were separately spread on carbon tape, which was placed on an aluminum stub. Aluminum stub holders, along with the samples, were placed in a gold sputtering unit for gold coating. Once the gold coating was finished, the samples were taken out, and morphological analysis work was conducted by using FESEM FEI, Nova, NANOSEM 450 (Eindhoven, The Netherlands) microscopy. The images of the samples were taken at different magnifications. TEM measurement was conducted to obtain internal structures and determine the exact size of the particles developed. The samples were prepared by dispersing the nanoparticles and composites in double distilled water and by ultrasonication for 10 min in an ultrasonicator (Sonar, 40 kHz). The sample was then prepared by the drop-casting technique, where samples were placed on carbon-coated copper grids. The measurement of the size and shape of particles was conducted by using FEI Model Tecnai G2 20 Twin (200 kV) (USA) instruments operated at a voltage of 200 kV, at different magnifications. The crystallinity of the particles was analyzed by the scattering area electron diffraction (SAED) pattern. TGA measurement was done to find the thermal stability of all three samples. The measurement was conducted by using the Netzsch TG-209 model instrument. The grounded samples were taken in a crucible and subjected to 25–1000 °C, and the temperature was raised to 10 °C per minute. The dynamic argon flow was about 99.98%, and TG curves were recorded. BET analysis was carried out to evaluate the specific surface area and porosity of the HC and HC/ZnONC by using Brunauer–Emmett–Teller and Barret–Joyner–Halenda (BJH) models. Pore volume size distribution was analyzed by using the BJH model through the nitrogen adsorption–desorption isotherms measurements. SSA values were calculated by using a liner arrangement. The analysis was conducted by using Micromeritics ASAP 2000-type instrument (Norcross, GA, USA).

4. Result and Discussions

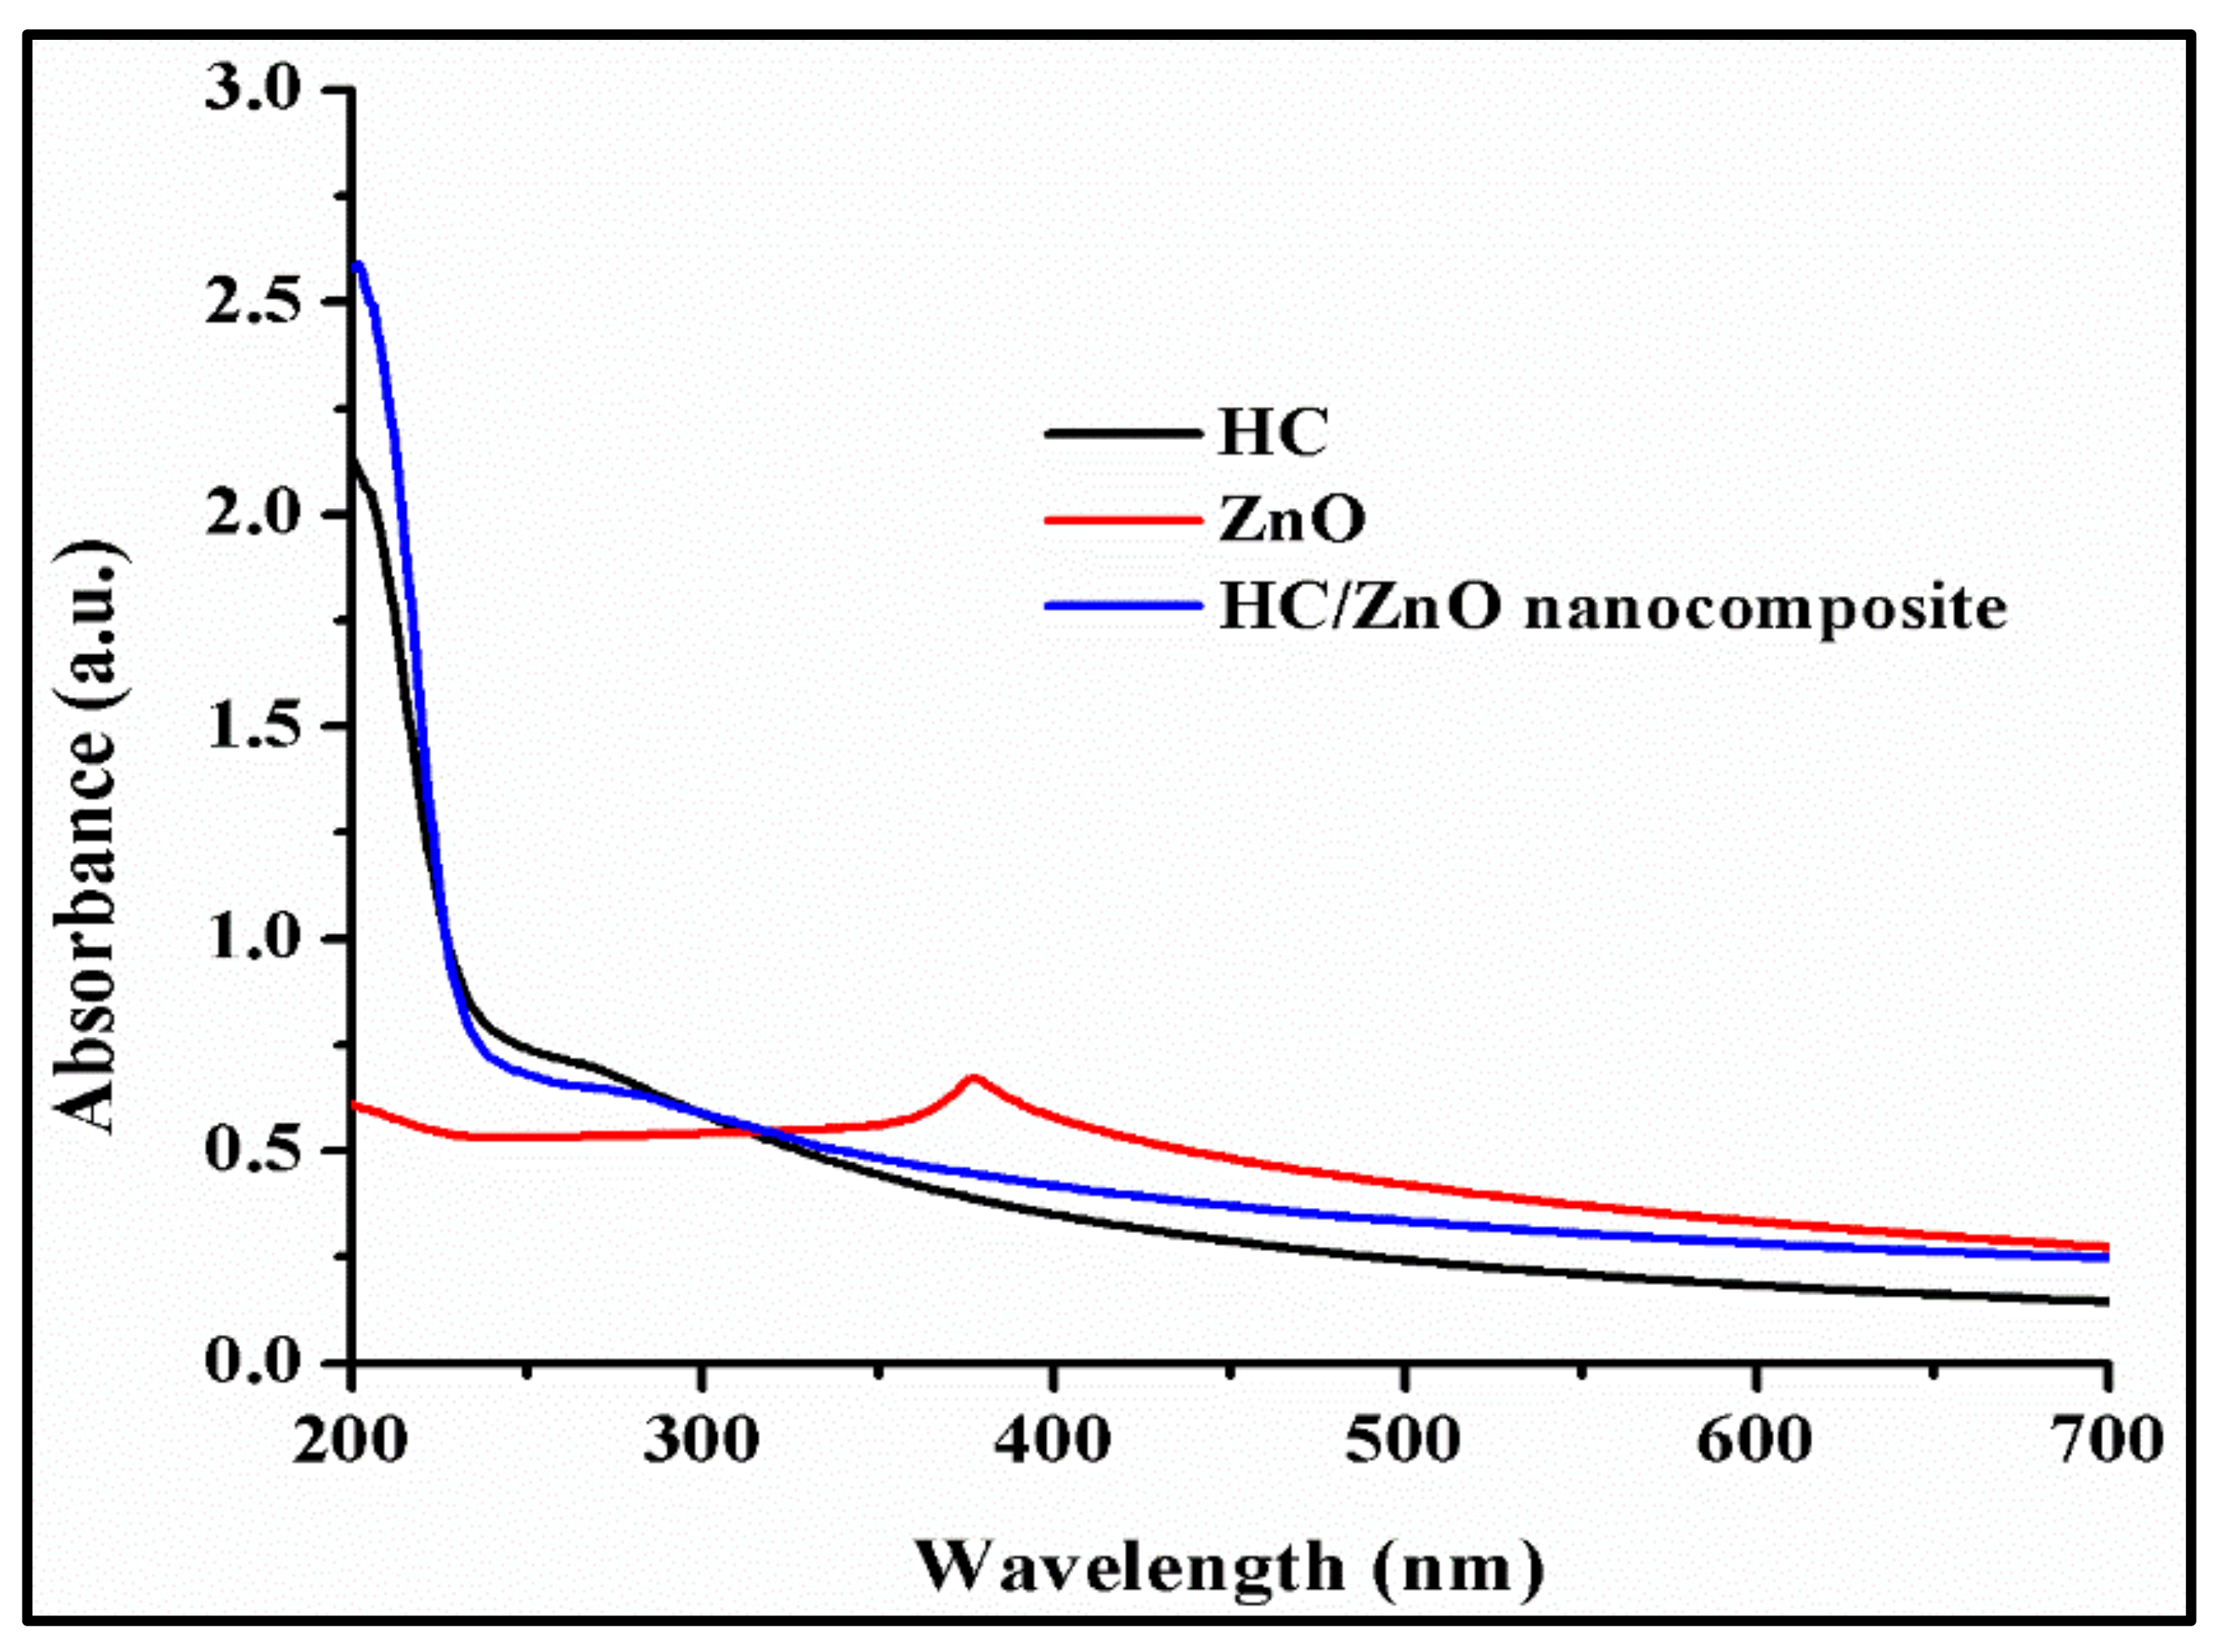
4.1. UV-Vis Study of ZnONPs, HC and HC/ZnONC

A typical spectrum of HC, ZnONPs and HC/ZnONC is shown in Figure 4. The HC shows an absorbance peak at 265 nm, while the ZnONPs show a sharp absorbance peak at 375 nm, and HC/ZnONC shows an absorbance peak at 290 nm. The peak for ZnONPs was missing from the HC/ZnONC. The results were in agreement with previous works by various investigators [59]. A few investigators have also reported similar absorbance peaks for ZnONPs, HC and HC/ZnONC.

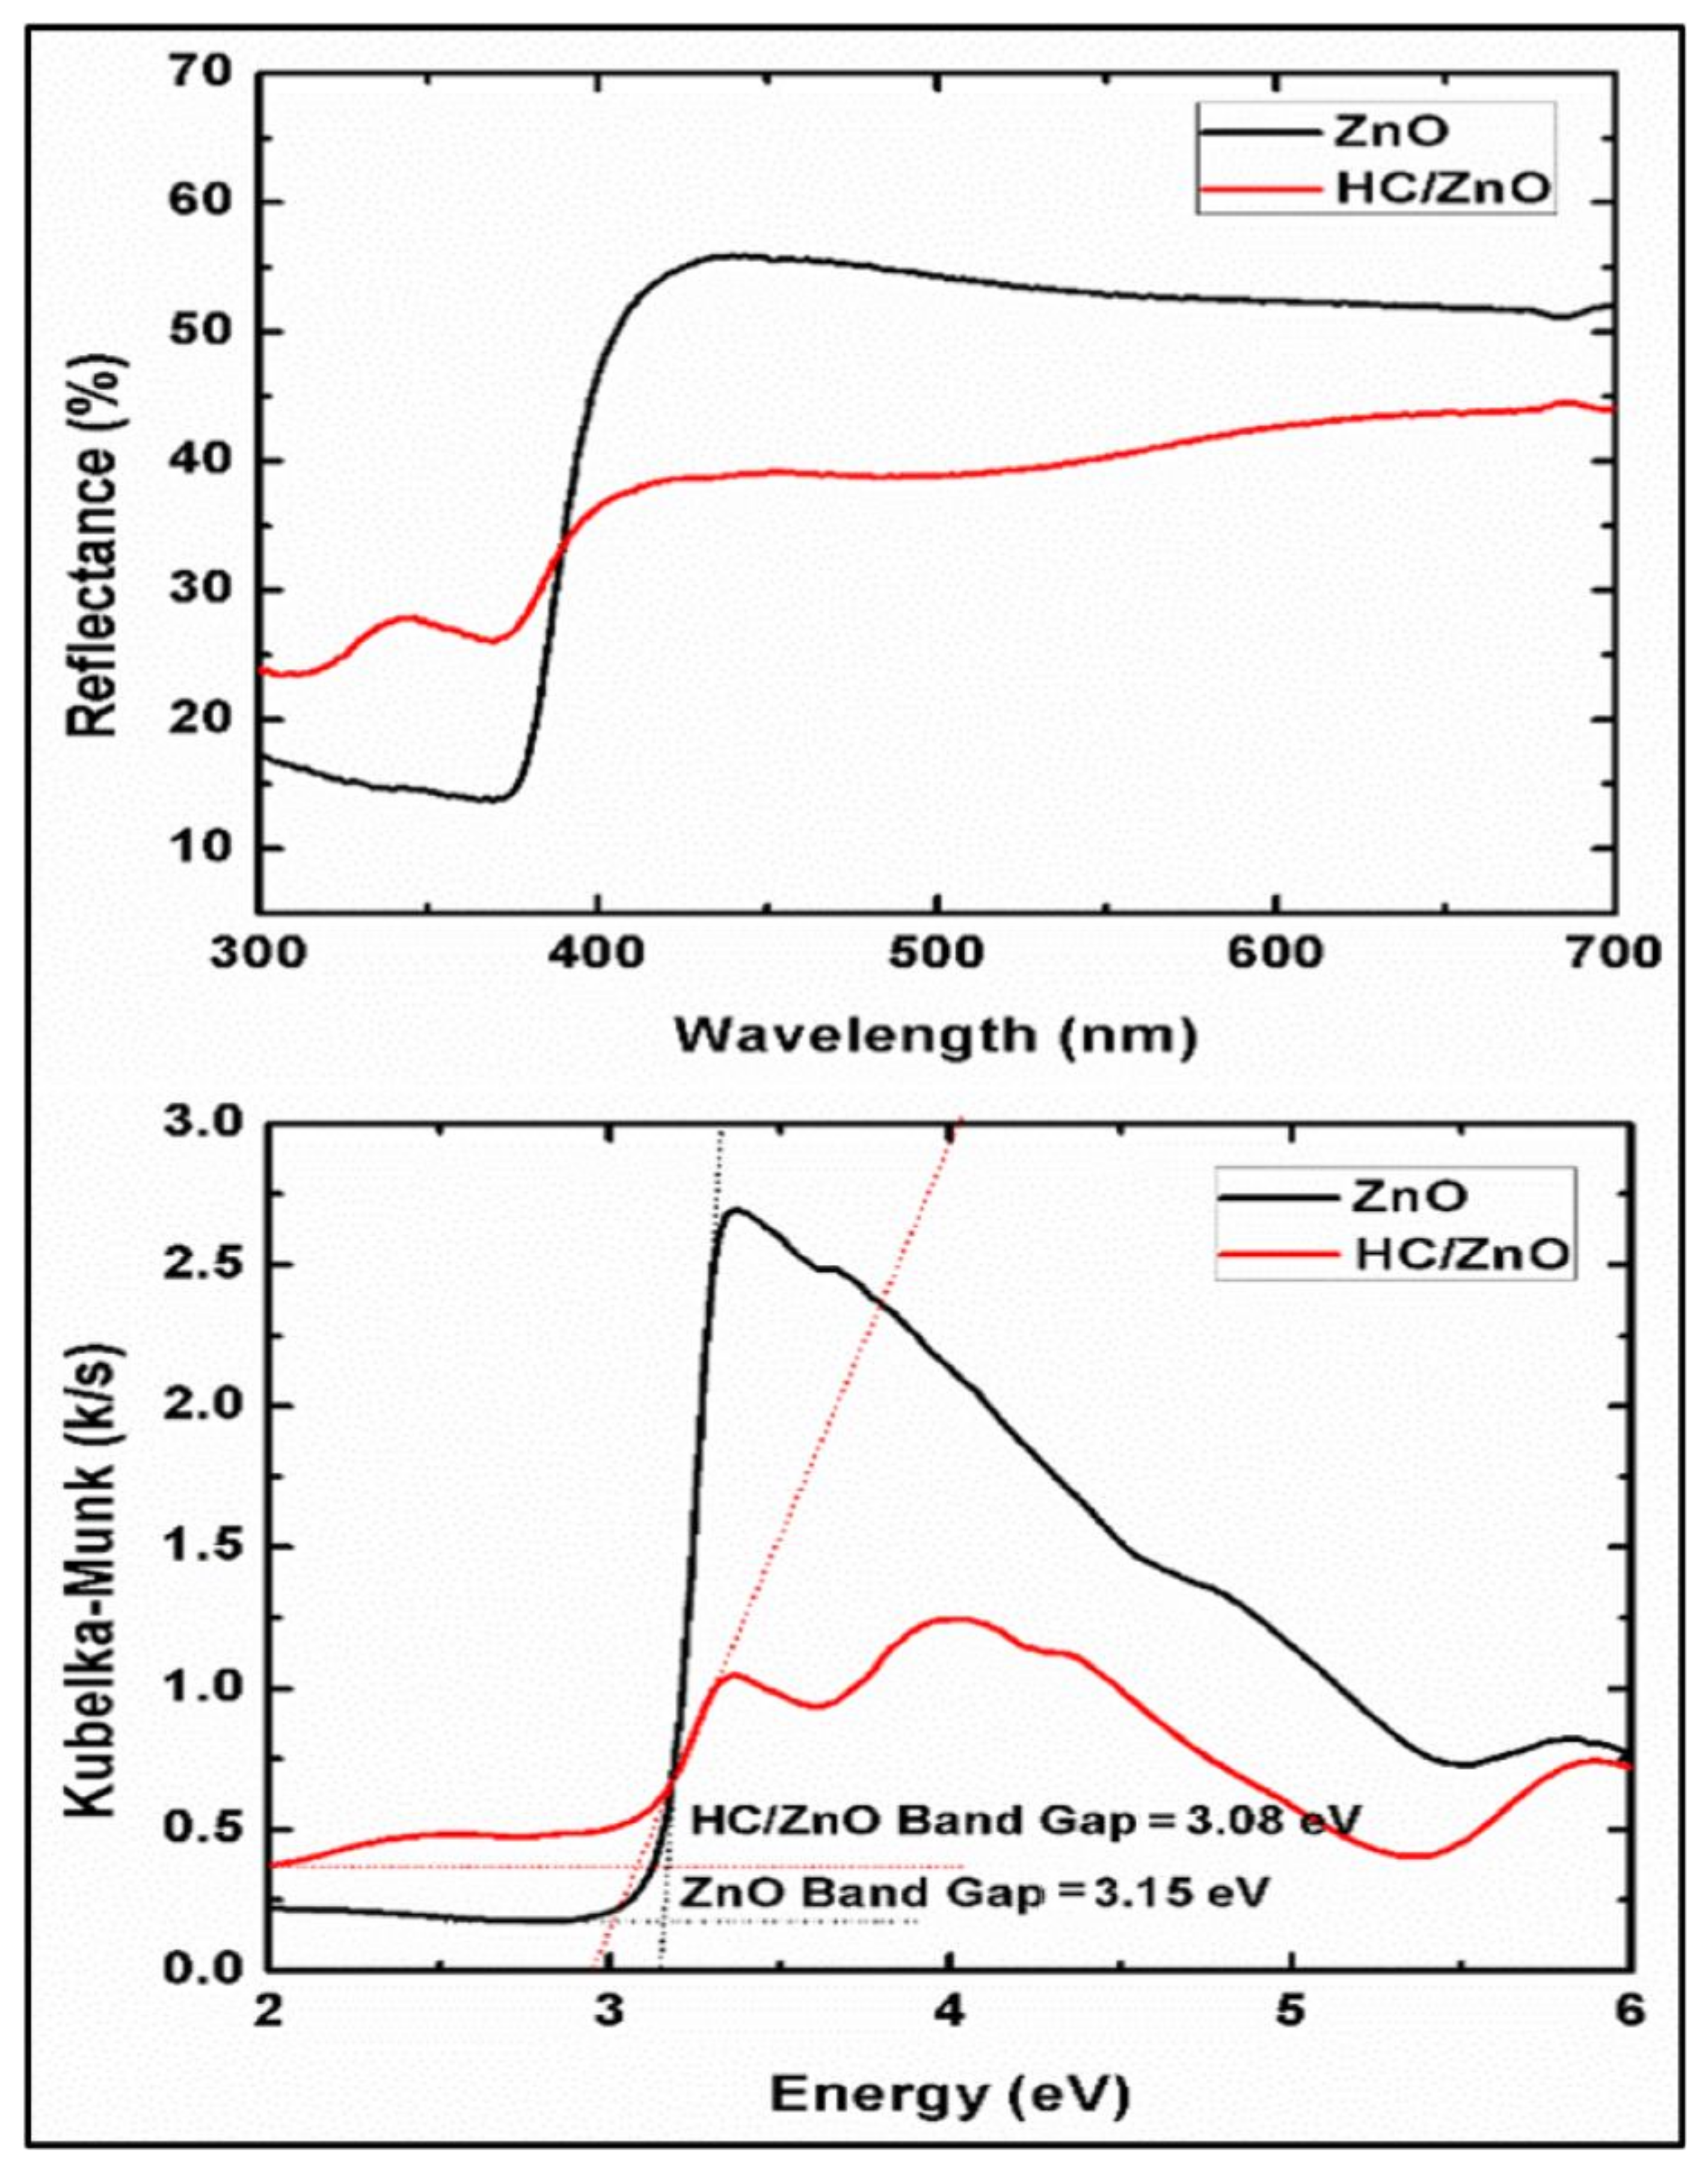
4.2. UV-Diffuse Reflectance Spectroscopic (DRS) Analysis

Figure 5 shows the UV-DRS spectra and band gap of ZnO and HC/ZnONC. The data show that the ZnONPs can absorb UV radiation at 375 nm. The bandgap energy calculated for ZnONPs at 375 nm was 3.15 eV. The obtained result was similar to the results reported earlier by different investigators, for instance Peng et al. [59] and Pradeeswari et al. [60]. It can be seen that the UV absorption band for HC at 265 nm was shifted in the case of HC/ZnONC at 290 nm, which is an indication of the improved optical properties of HC due to its modification using ZnONPs. The band gap energy calculated for HC/ZnONC was 3.08 eV, which is comparatively narrower than the band gap energy of pure ZnONPs. This difference in band gap energies is mainly due to the oxygen vacancies [61]. As per Wang et al. [62] and Kalanur et al., with an increase in oxygen vacancies concentration, the delocalization of the impurity phase increases, which overlaps the valence band edge and decreases the band gap [62]. The chemical passivation and absorptivity of the HC resulted in a higher catalytic effectiveness of the HC/ZnONC. Peng et al. also reported similar results for ZnONPs and NC developed from ZnO NPs and halloysite clay [37]. Chitra et al. also showed a band gap near this range for various NCs [61].

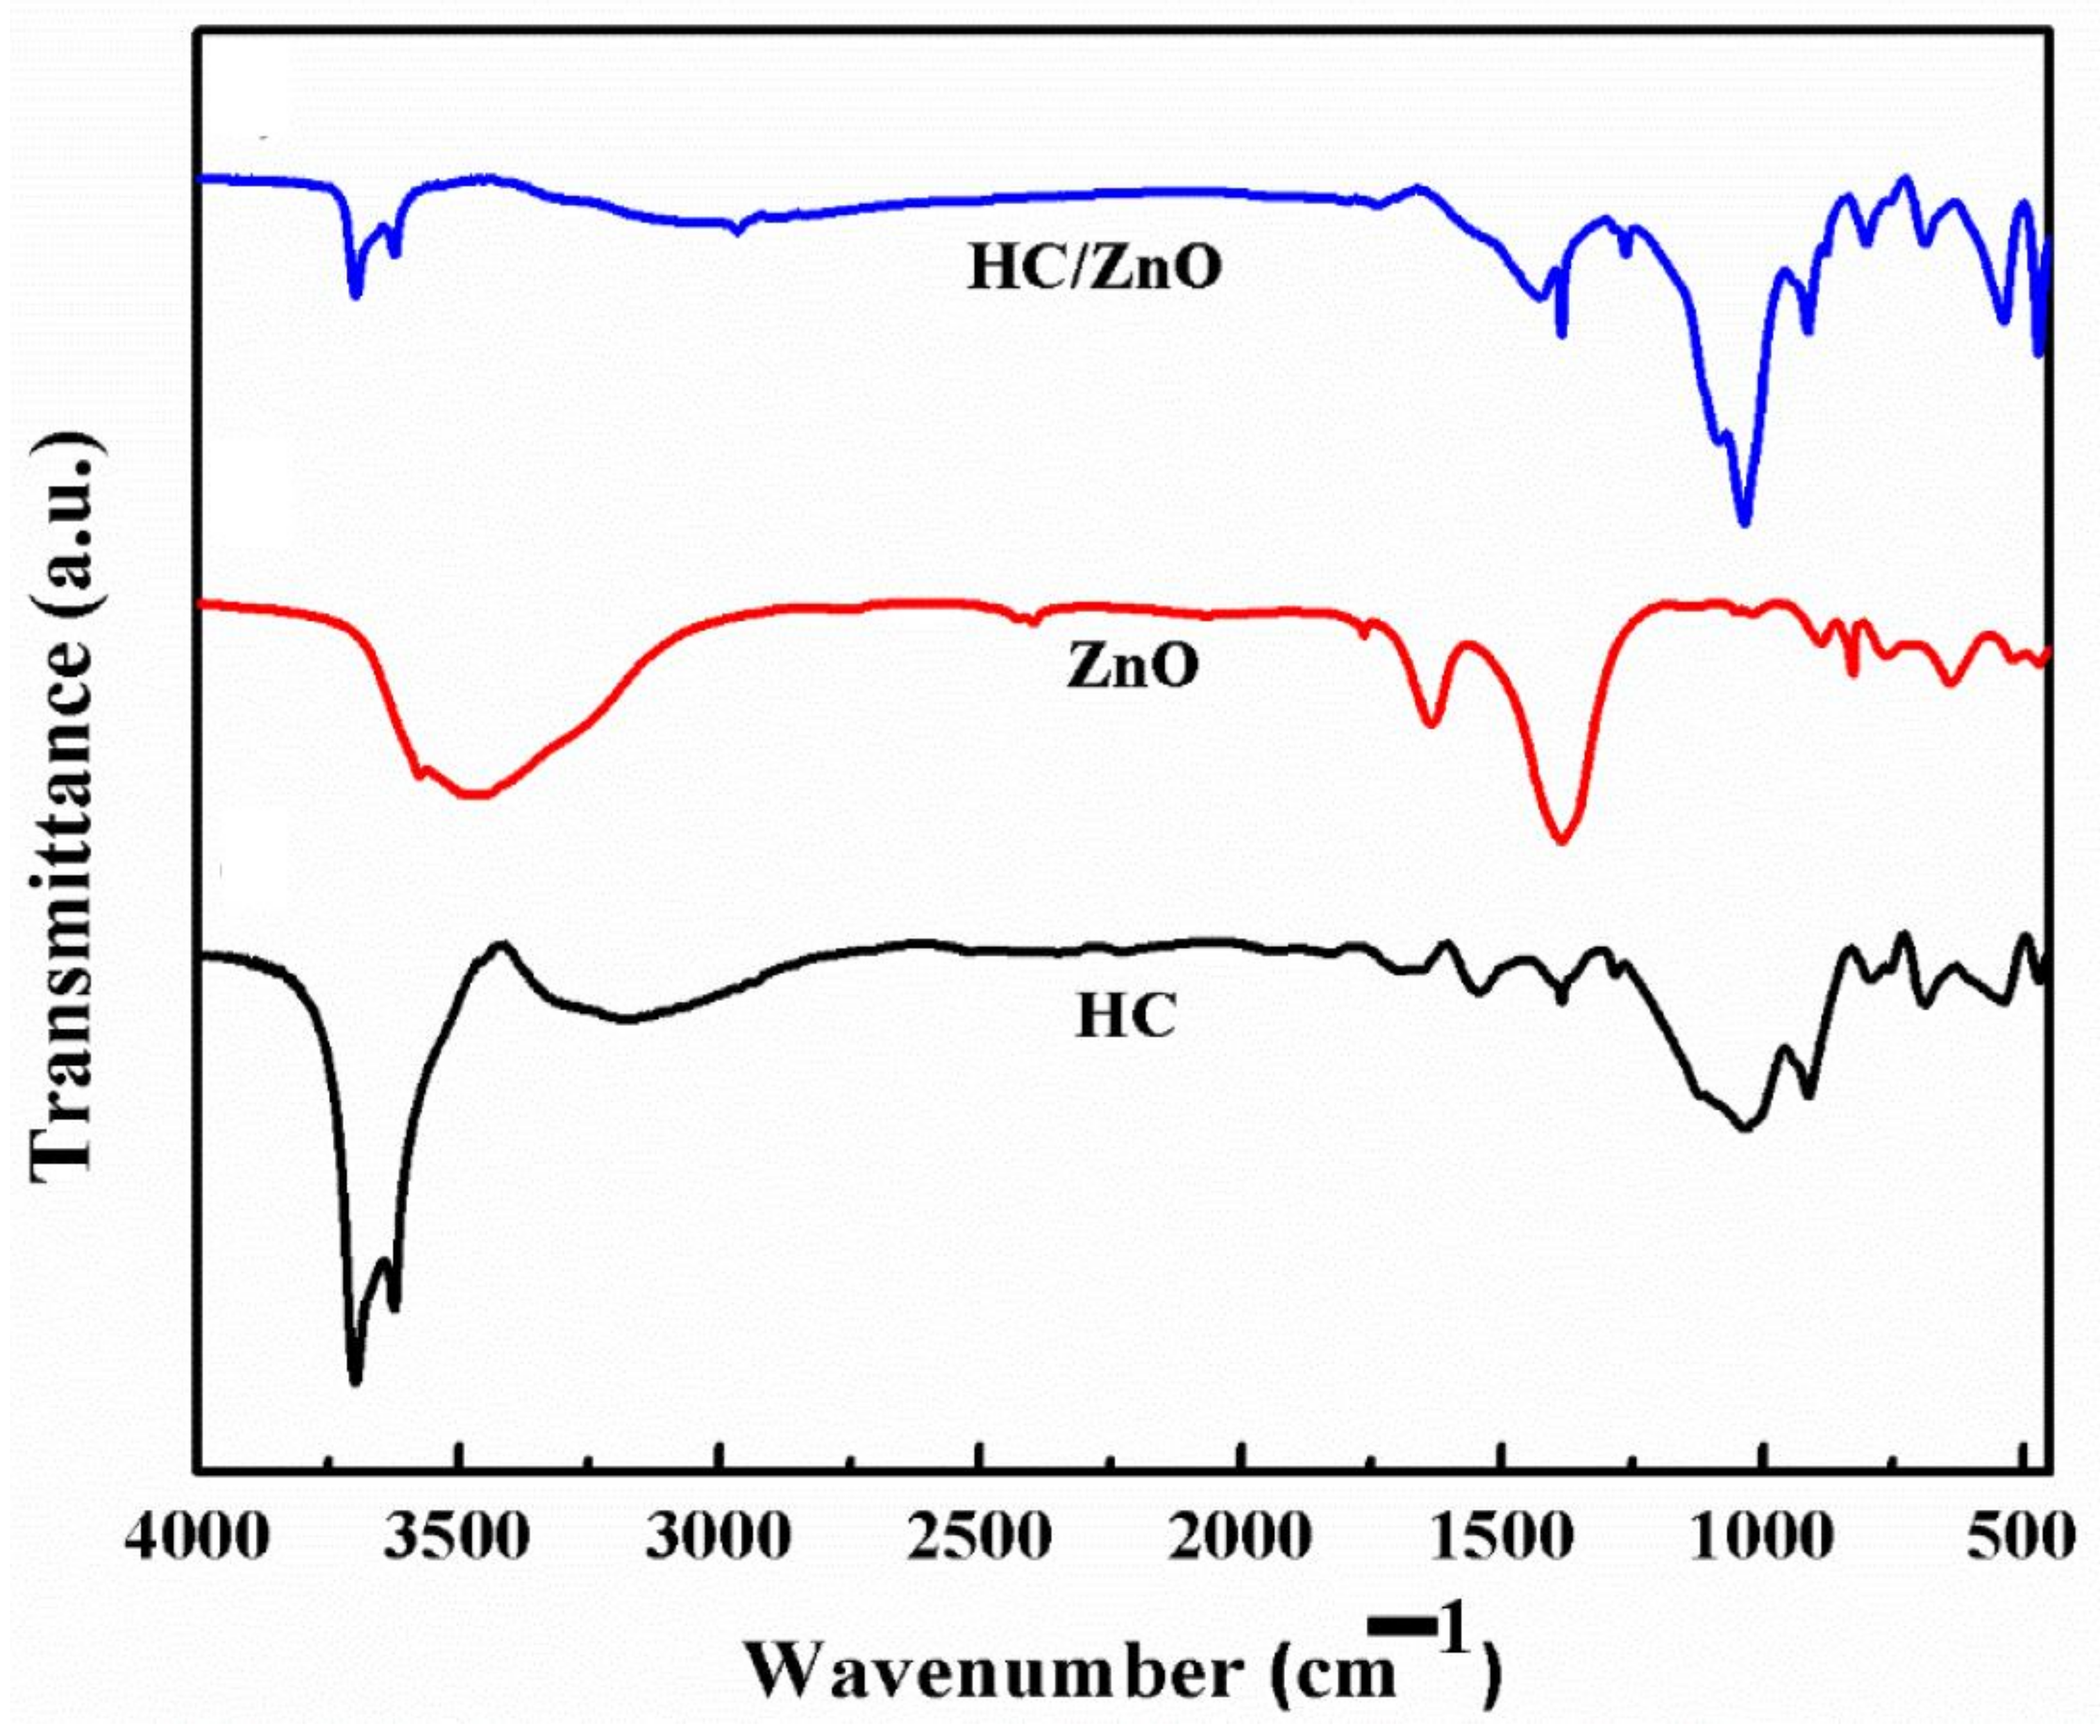
4.3. FTIR Analysis ZnONPs, HC and HC/ZnONC

Typical FT-IR spectra of ZnONPs, HC and HC/ZnONC can be shown in Figure 6. The FT-IR spectrum of HC shows peaks at 3698 cm−1 and 3622 cm−1, which is attributed to the hydroxyl group present in the layers of clay. Another peak in the HC sample is at 1680 cm−1, which is attributed to the -OH group of interlayer water molecules. The presence of two hydroxyl groups was also reported by Gaaz et al. [63] and Kamble et al. [38]. One hydroxyl group was present on the inner side between the nanotube layers, while the second one was present on the external surface [38]. The peaks at 1120 cm−1, 1034 cm−1, 790 cm−1, and 688 cm−1 are attributed to the bending and stretching vibrations of Si-O-Si, which are present in the clay [37]. The band at 910 cm−1 and 536 cm−1 is attributed to the metal oxides, mainly Al-O/Al-OH (bending vibration) and Si-O-Al (bond vibrations), which are present in the clay in the form of aluminosilicates. Gaaz et al. [63] also obtained similar results for the HC in their investigation [63]. Obtained results were consistent with previous results obtained by several investigators such as Alkatheeri et al. [64], and Bordeepong et al. [65].
The ZnONPs showed broad peaks at 3576 cm−1 and 3474 cm−1 in the FTIR spectrum, which are attributed to the O–H stretching of the hydroxyl group in the water molecule. A small peak at 2397 cm−1 and 2427 cm−1 is attributed to the absorption of atmospheric carbon and C–H stretching in the alkane group. The peak at 1634 cm−1 and 1385 cm−1 is attributed to the carbon stretching (symmetric and asymmetric) associated with the attachment to the ZnONPs during its synthesis process. The peaks near 630 cm−1, 519 cm−1 and 460 cm−1 are attributed to the metal oxides, i.e., Zn-O-Zn stretching and the vibrational phonon of ZnO. The obtained results were similar to the previous results obtained by the investigators for the ZnO NPs. Investigators have also obtained similar peaks for their reported sample [66]. Previously, Getie et al. [67] also reported similar results for the synthesized ZnONPs [67].
The FTIR spectrum of ZnONPs and HC is shown in Figure 6. Most of the peaks were similar to the peaks for both the individual particle, i.e., ZnONPs and HC. The peaks of the ZnONPs were absent from the nanocomposite, which were previously present at 1634 cm−1, 826 cm−1 and 631 cm−1. The major FTIR assignments of all three samples of ZnONPs, HC and ZnONP-decorated HC are summarized below in Table 1.

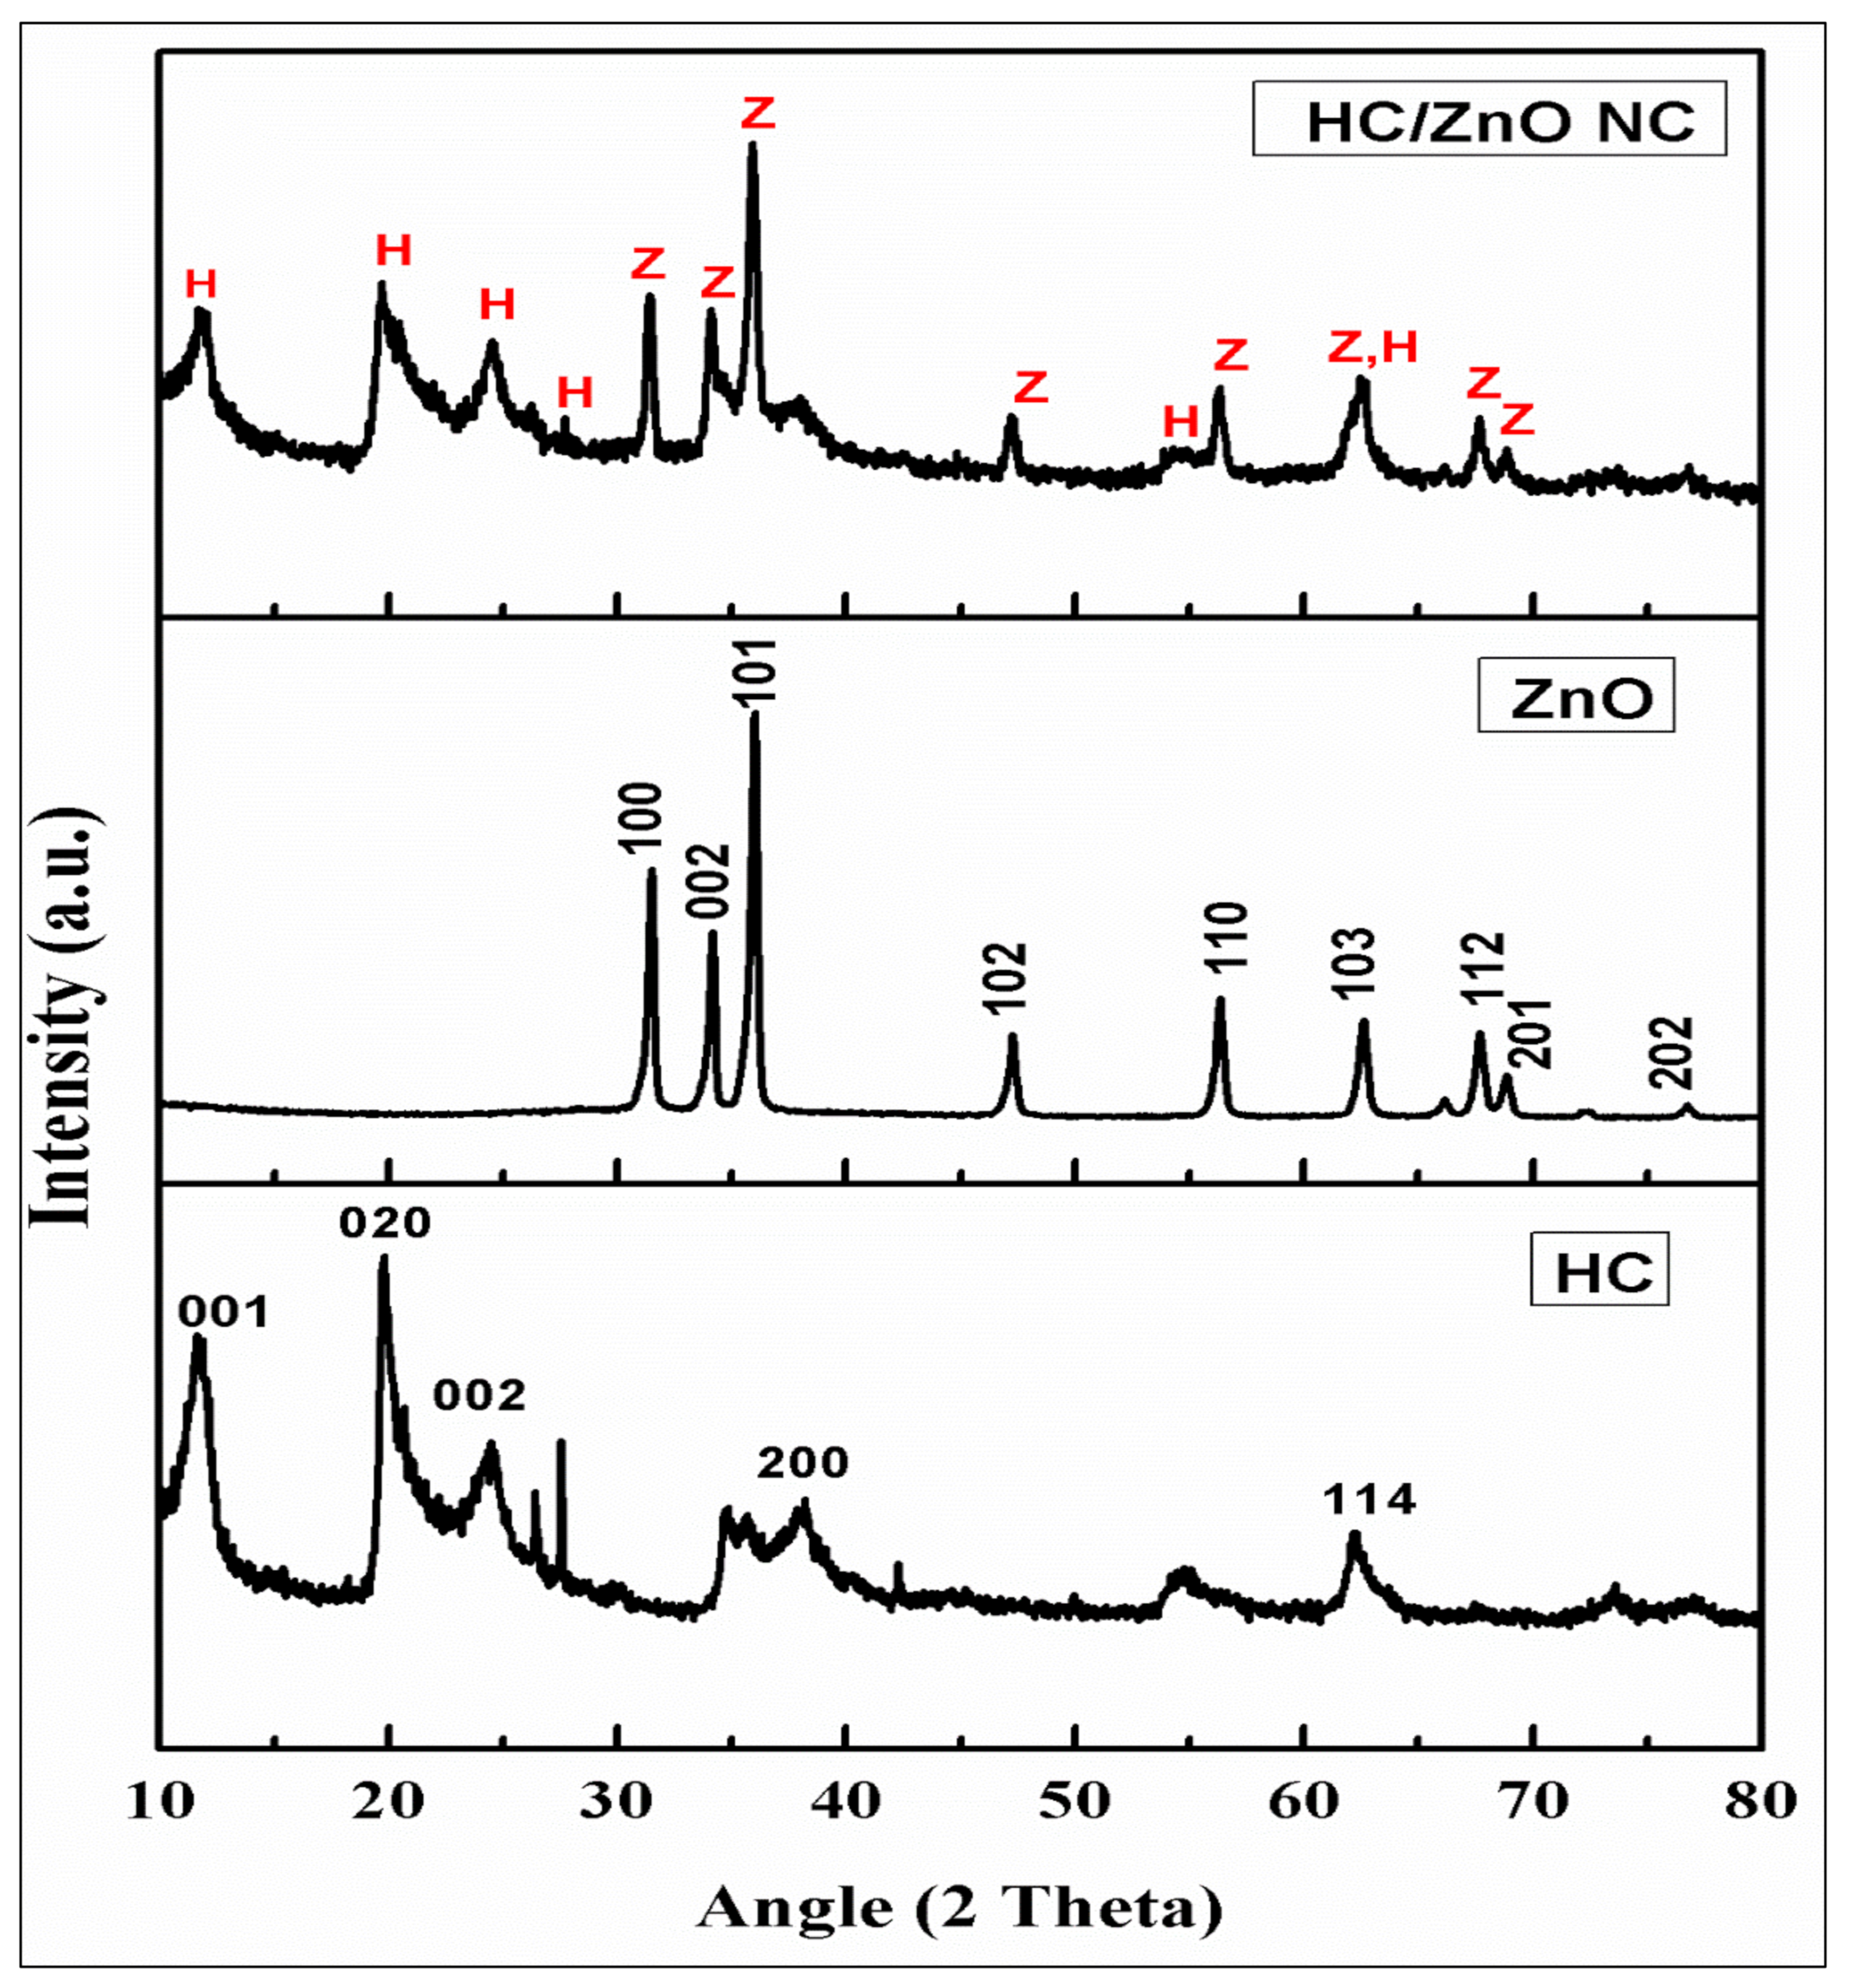
4.4. XRD Analysis of ZnONPs, HC and HC/ZnONC

The XRD analysis was conducted to investigate the amorphous as well as the crystalline nature of the developed materials. Figure 7 shows a typical XRD pattern of ZnONPs, HC and HC/ZnONC. The ZnONPs shown peaks at 31.46° (d = 2.8 Å), 34.19° (d = 2.6 Å), 36.02° (d = 2.5 Å), 47.41° (d = 1.9 Å), 56.30° (d = 1.6 Å), 62.90° (d = 1.4 Å), and 67.92° (d = 1.3 Å). The following peaks resemble the crystallographic orientations in (100), (002), (101), (102), (110), (103) and (112), respectively. All the peaks obtained here were consistent with the result obtained by Peng et al. [37]. The investigators reported almost the same peaks. The obtained peaks were matched with the JCPDS (card no. 36-1451) and indicated the presence of the wurtzite phase. Previously, various investigators also reported similar results for the synthesized ZnONPs, for instance Pradeeswari et al. [63].
The XRD patterns of HC show peaks at 11.7° (d = 7.5 Å), 19.8° (d = 4.4 Å), and 24.53° (d = 3.6 Å), 38.25° (d = 2.3 Å), 62.36° (d = 1.4 Å), which match up with the crystallographic orientations of (001), (020), (002), (200) and (114), respectively. The obtained peaks were matched with the JCPDS (card no. 09-0451) of HC, which confirmed the particle. The peak at 11.95° is due to the partially dehydrated HC, and the position of reflection is 001. The peak near 26.5° is due to the quartz and mullite presence in the clay samples due to alumino-silicates mineral. A similar quartz peak was also obtained by Zsirka et al. [56], whose peak was at 26.6ɵ. It shows a sharp peak, as clay has hydrates of Si and Al. Similar results were also revealed by various investigators such as Gaaz et al. [68] and Shu et al. [51].
The XRD pattern of HC/ZnONC shows all the peaks of both the original particles, which suggests the successful crystallization of the ZnONPs on the HC surface. Besides this, there is no other peak in the sample that indicates the purity of the sample. Besides this, it also suggests the absence of any other type of reaction core and shell, as suggested by Peng et al. and Shu et al. [51]. There is a formation of a new peak in the NC at 35°, which was initially absent from both the materials. The same peak was also obtained by Peng et al. [37].

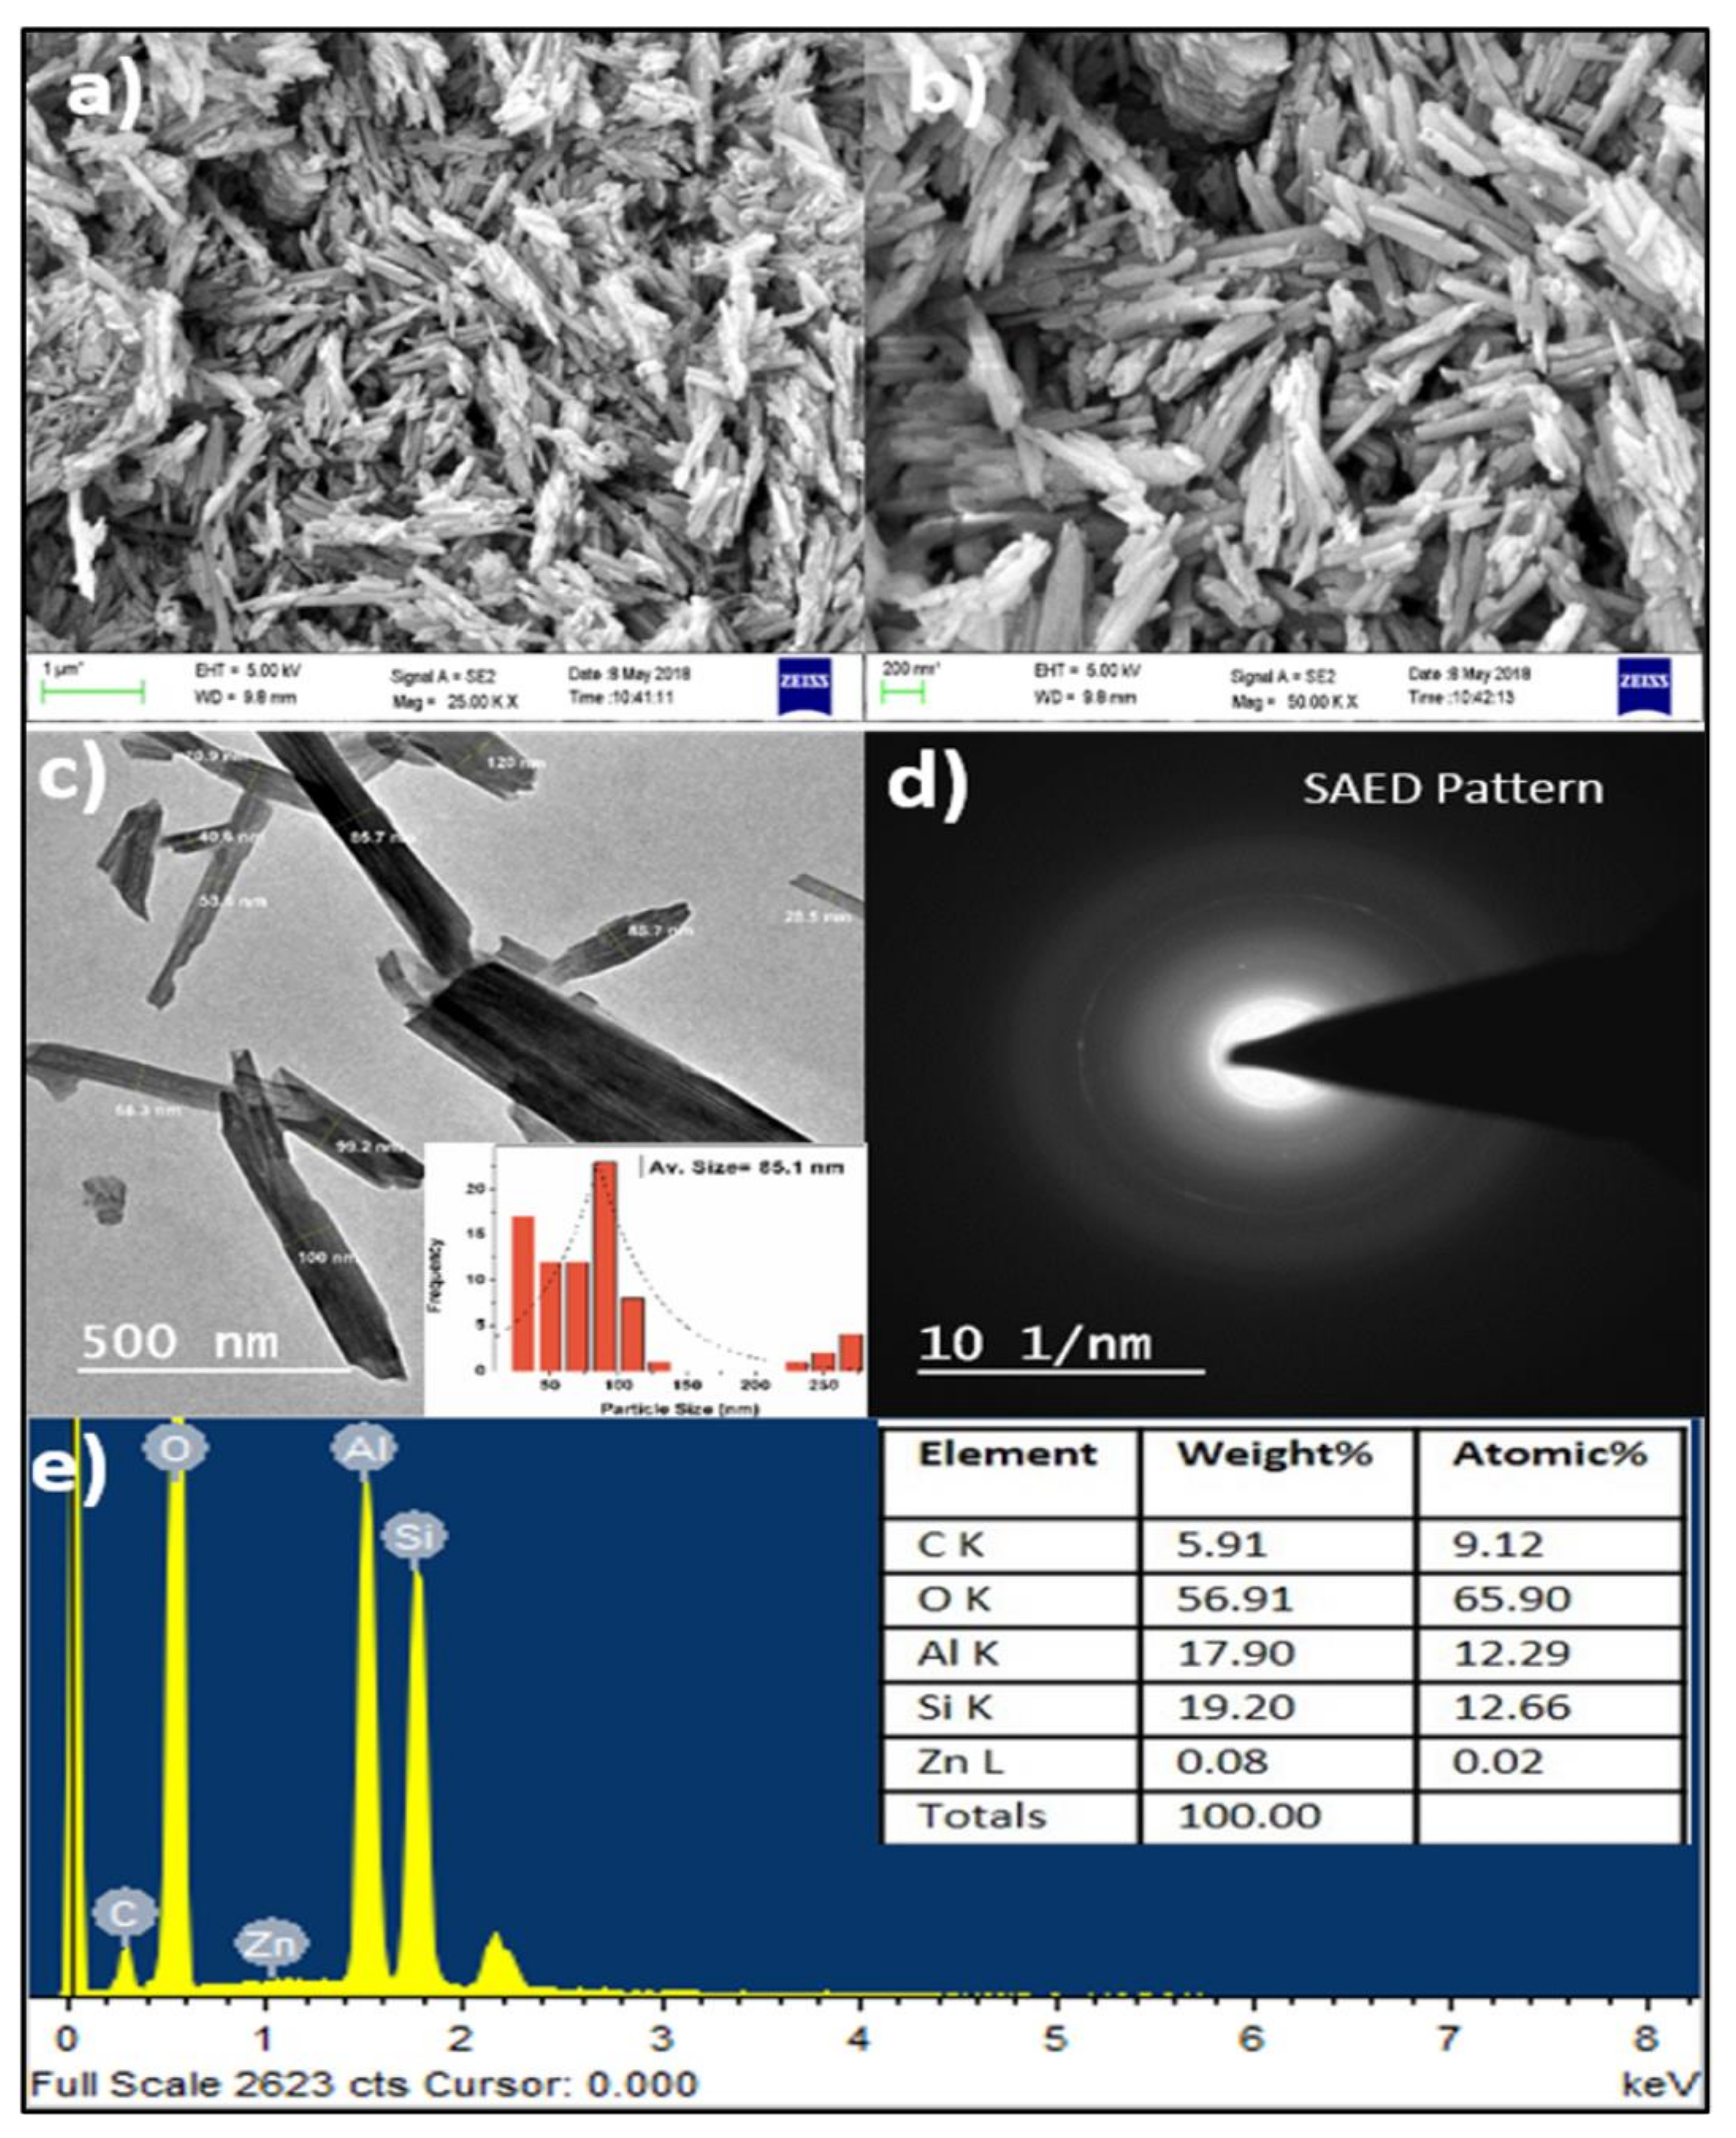
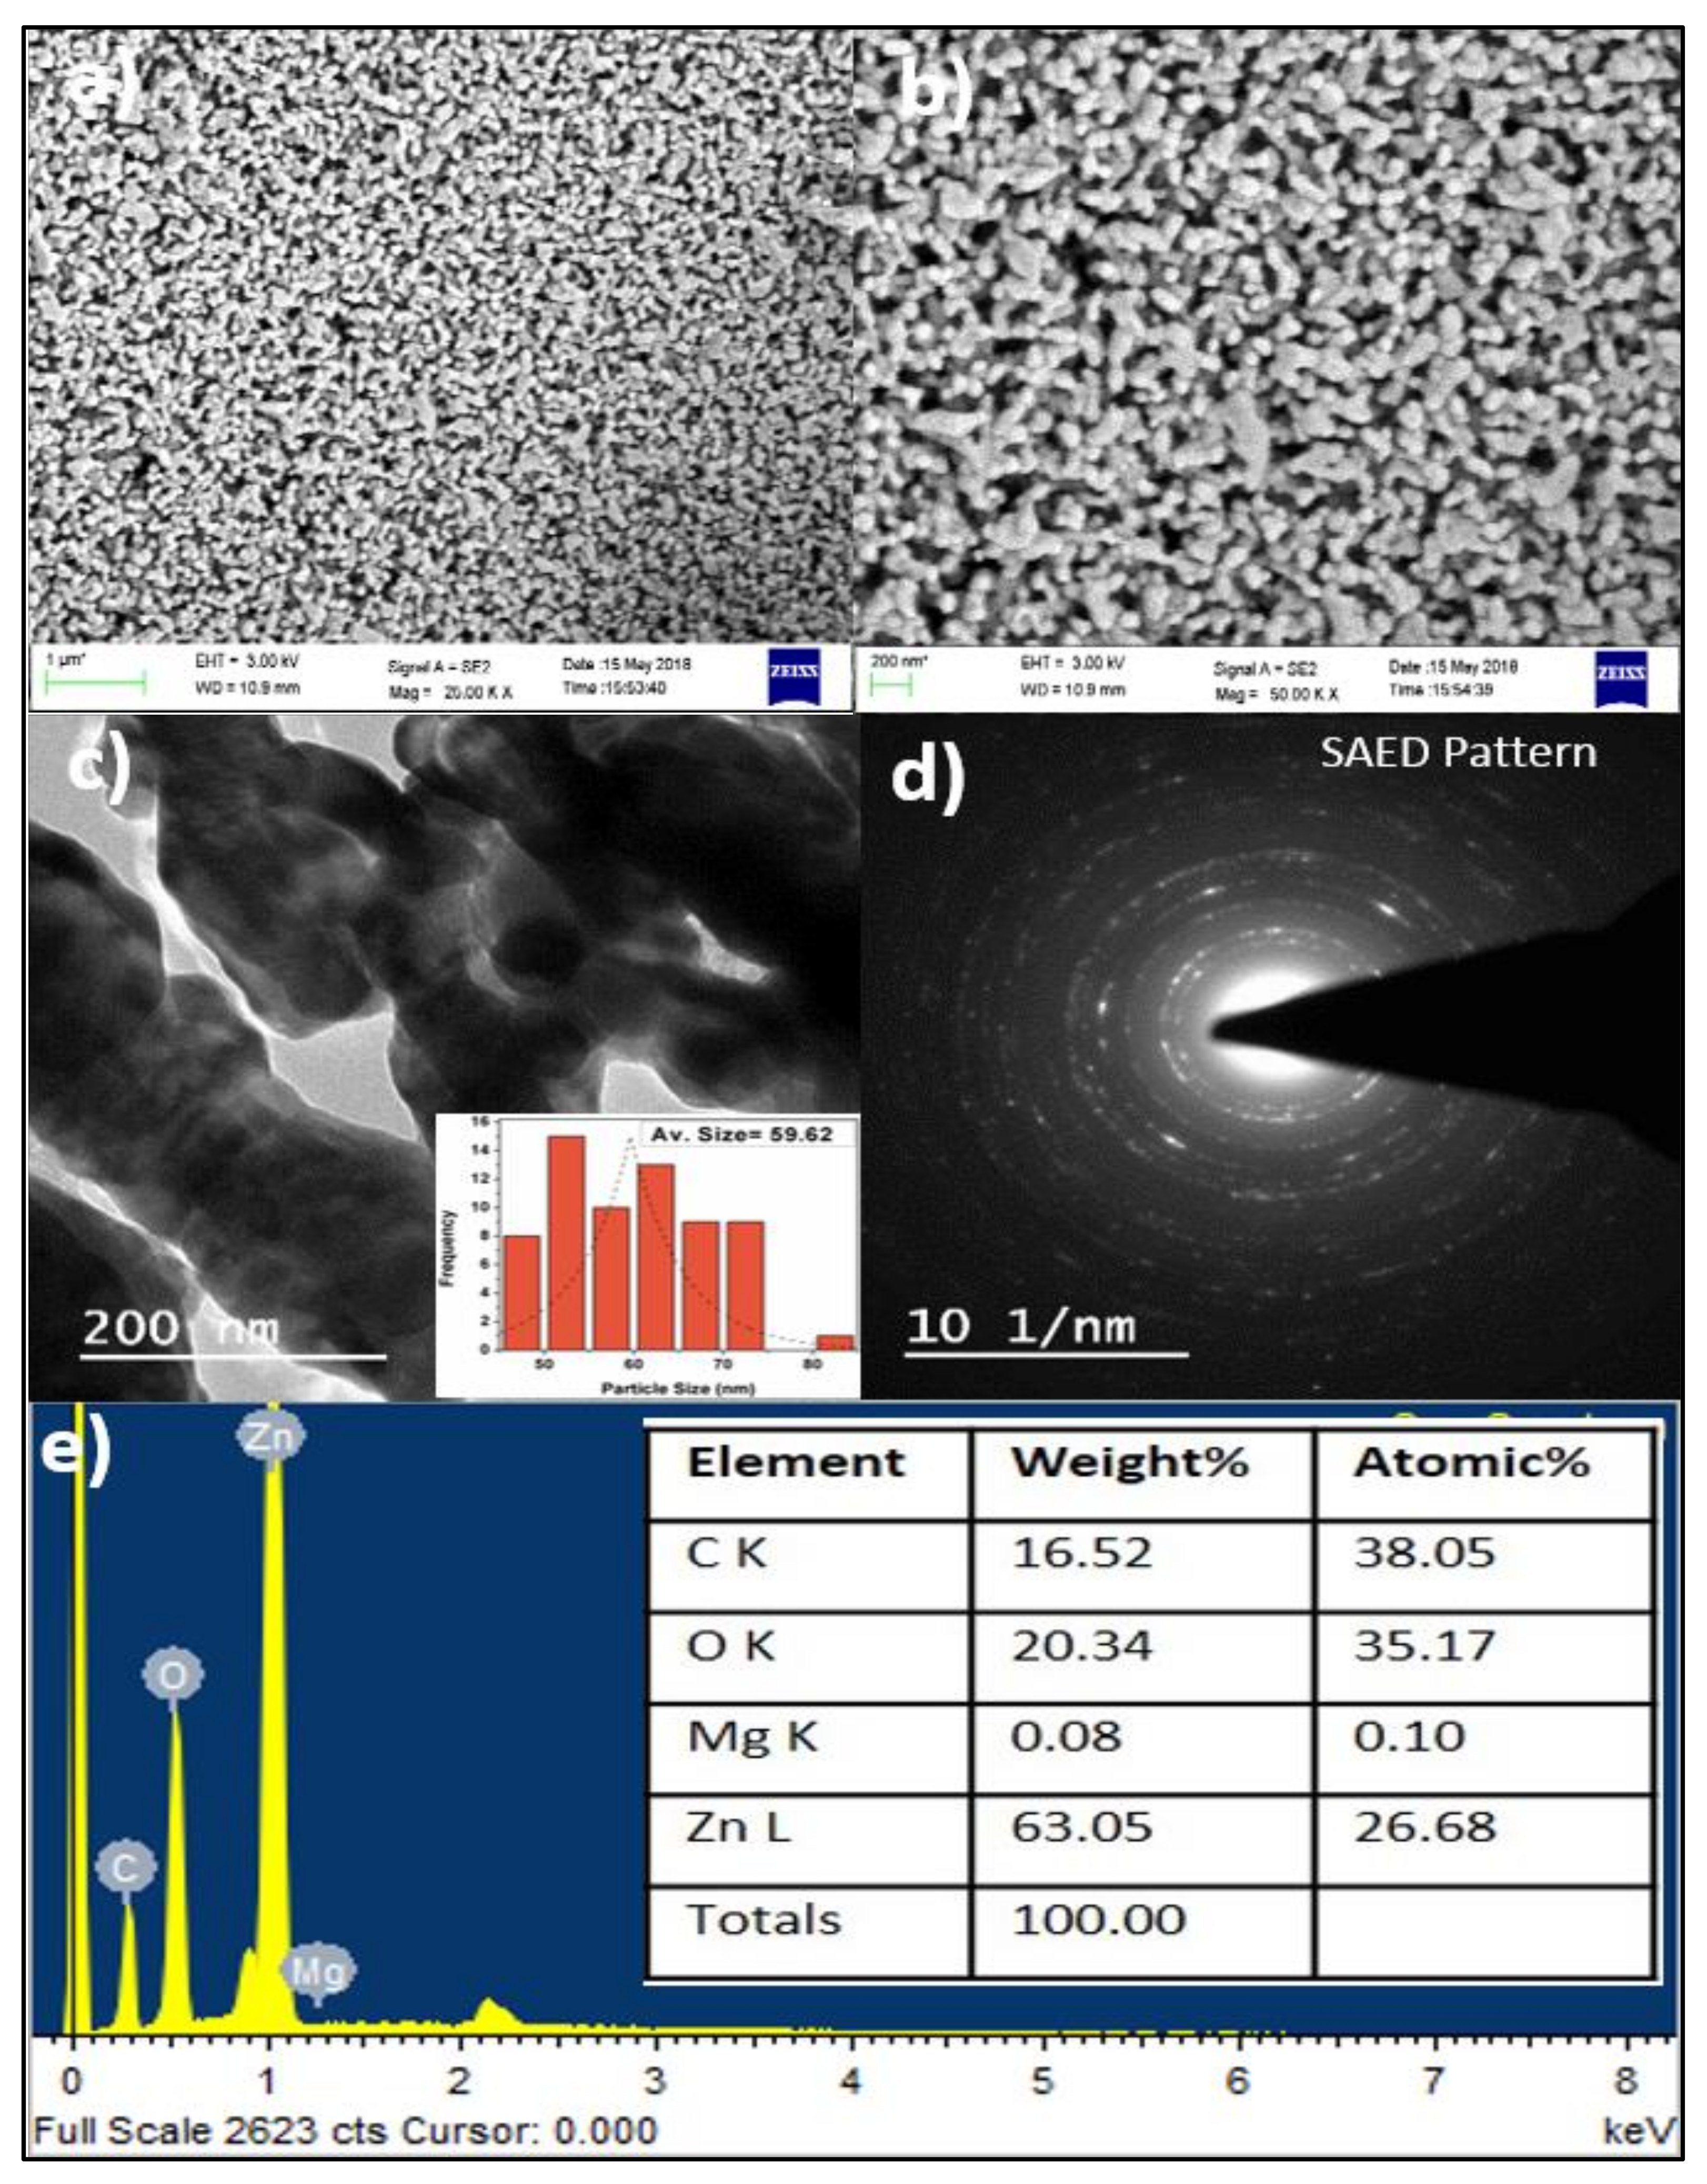
4.5. Morphological and Elemental Analysis

Figure 8a,b shows the FESEM micrograph of HC, whereas Figure 8a shows micron-sized interlayered tube-like particles stacked one over the other. Figure 8b shows the fine structure of HC, which again reveals the layered structures of the particles. These particles are generally rod-shaped and are aggregated to form a large structure. The length of the particles ranges from 80 nm to several microns, while the width varies from 40–200 nm. Gaaz et al. [63], Peng et al. [37] and Kamble et al. [38] also reported a similar morphology of halloysite particles [69]. Figure 8c shows TEM images of HC particles that clearly show rod-shaped particles that are 80 nm to 7–8 microns in size. The width of the particles is 40 nm to 200 nm. Figure 8d shows the SAED pattern of the HC particles, which reveals the amorphous nature of the particles. The average size of the HC particles was about 85.1 nm. There are several reports in the literature by various investigators that support the morphology of the particles. Gaaz et al. [63] also reported a tube-like structure of HC, where the size was about 150 nm to several microns in length and 20–100 nm in diameter [63]. Figure 8e shows the EDS spectra of the HC particles, while the table shows the elemental composition of the HC particles. The spectra show peaks for Al, Si, O, C and Zn. Out of these, O is present in the highest concentration by wt.%, i.e., 56.91%, followed by Si (19.2), Al (17.9%), C (5.91%) and Zn (0.08%). The high percentage of O, Al, and Si indicates the purity of the HC particles. The carbon and traces of Zn reflect the impurity present in the sample. The results obtained by various investigators also indicate a similar elemental composition, for instance those from Gaaz et al. [63].
The FESEM of the ZnONPs is shown in Figure 9a,b. Those of Figure 9a,b are quasi-spherical and shaped like agglomerated particles. The particle size varies from 20 to 120 nm, but due to aggregation, the size has increased, as evident from FESEM. There was no capping agent used during the ZnONPs synthesis. Moreover, the calcination of the ZnONPs might have increased the size due to fusion. Figure 9c shows TEM micrographs of the ZnONPs at a resolution of 200 nm, which indicates the fusion of the spherical particles. The average size of the particles is 59.62 nm. Figure 9d shows the SAED pattern of the as-synthesized ZnONPs, which reveals the crystalline nature of the particle. Figure 9e shows the EDS spectra of the ZnONPs, along with the EDS elemental table. The EDS spectra show peaks for C, O, Zn, and Mg. The elemental composition in wt. percentage was dominated mainly by O and Zn, which was 20.34% and 63.05%, which indicates the formation of the ZnONPs. The high percentage of both O and Zn indicates the purity of the samples. C is mainly due to the capping agent used during the formation of ZnONPs. Besides this, there is a small intensity peak for Mg, which is about 0.08 wt. percent in the sample as an impurity. A similar morphology was also obtained by Shu et al. [51].
Figure 10a,b shows FESEM micrographs of HC-ZnONC developed by the interaction between ZnONPs and HC. Both figures show the white-color depositions of spherical particles on the rod-like, layered particles. This indicates the deposition of ZnONPs on the surface of HC particles. Figure 10c shows TEM images of rod-like structures with sizes of generally one to several microns in length and varying between 40 and 200 nm in width. The TEM image shows small particles inside the HC rod-like particles, which indicates the invasion of smaller ZnONPs in the pores and interspaces of the HC particles. Figure 10d shows the SAED pattern of HC/ZnONC, which indicates the amorphous nature, but the crystallinity of the HC increased in comparison to the previous one. This is due to the occupied incorporation of ZnONPs. The crystalline ZnONPs are not present in the SAED pattern, which indicates that HC particles masked the ZnONPs. Figure 10e shows the EDS spectra of the developed HC-ZnONC, along with the elemental table of the sample. The EDS spectra show peaks for O, C, Al, Si, and Zn. The high percentage of O along with Zn, Al and Si indicates the formation of composites. The high O content also indicates the presence of such elements in the form of oxides. Similar results were also obtained by various investigators whose data were lower than our results, for instance Shu et al. [51].

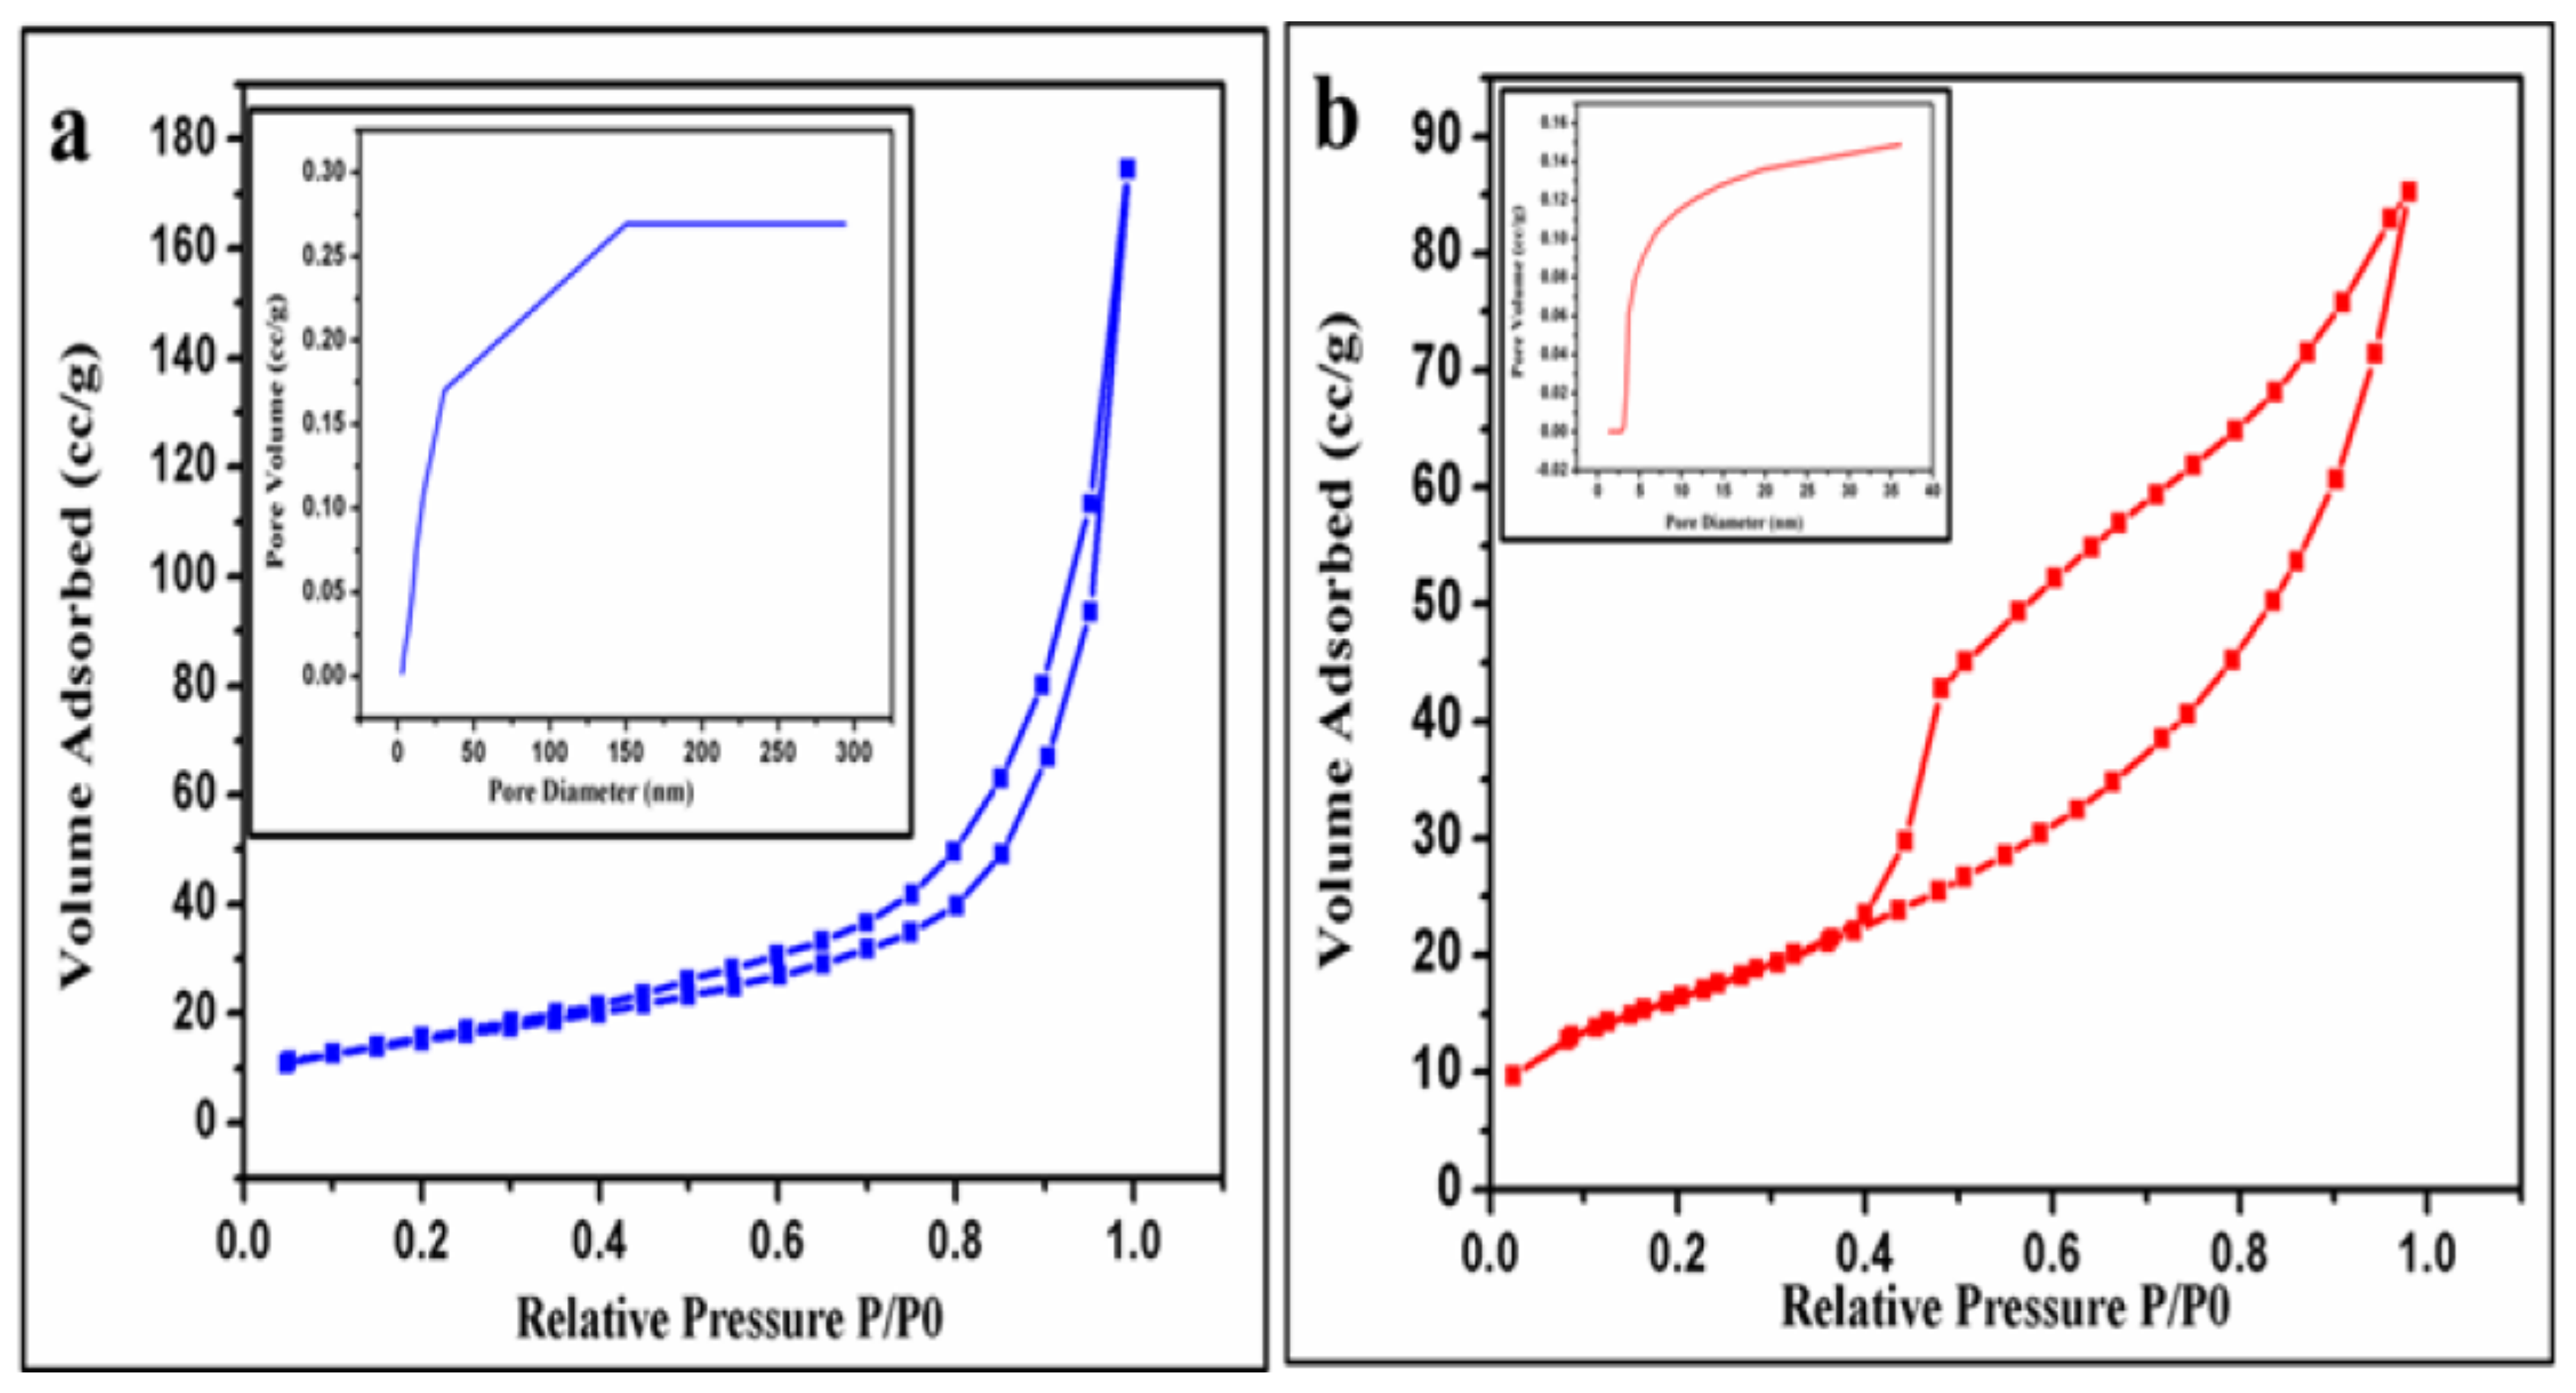
4.6. BET Surface Area Analysis

A typical absorption desorption isotherm and corresponding BJH absorption curve is shown in Figure 11a for the HC particles. HC particle shows type 4 sorption isotherm against H3 hysteresis loop at a high relative pressure, suggesting the presence of mesopores simultaneously. By the BJH method, the average pore diameter (APD) of the HC particle was 3.813 nm (inset in Figure 11a). From the BET, it was revealed that the surface area of the HC particles was 54.75 m2/g, and the total pore volume (TPV) was 0.269 cc/gm (shown in Table 2). Previously, several investigators obtained similar results for HC particles, for instance Peng et al. [37].
Figure 11b shows a typical N2 absorption desorption isotherm and a corresponding BJH absorption curve for the HC-ZnONP NC. As per the IUPAC classification of adsorption, the developed NCs reveal type-IV isotherms, which is a characteristic feature of mesoporous materials [70]. Type IV isotherms are denoted by the presence of hysteresis as observed in the isotherm curve of the ZnONPs/HC composite. The hysteresis loop obtained here is a type of H2-H3 that is dominated by H2. This ensures the presence of both mesopores and micropores simultaneously. By this technique, the calculated SA was 60.258 m2/g, whereas PV was 0.149 cc/g and APD was 3.7076 nm. The SA of the HC-ZnONPs NC was much higher than the original HC particles, respectively. The pores are nanosized along with a high SA, indicating the higher adsorption potential of the developed NC. Similar results were also obtained by Peng et al. [37], who concluded that the NCs have a much larger surface area [37].

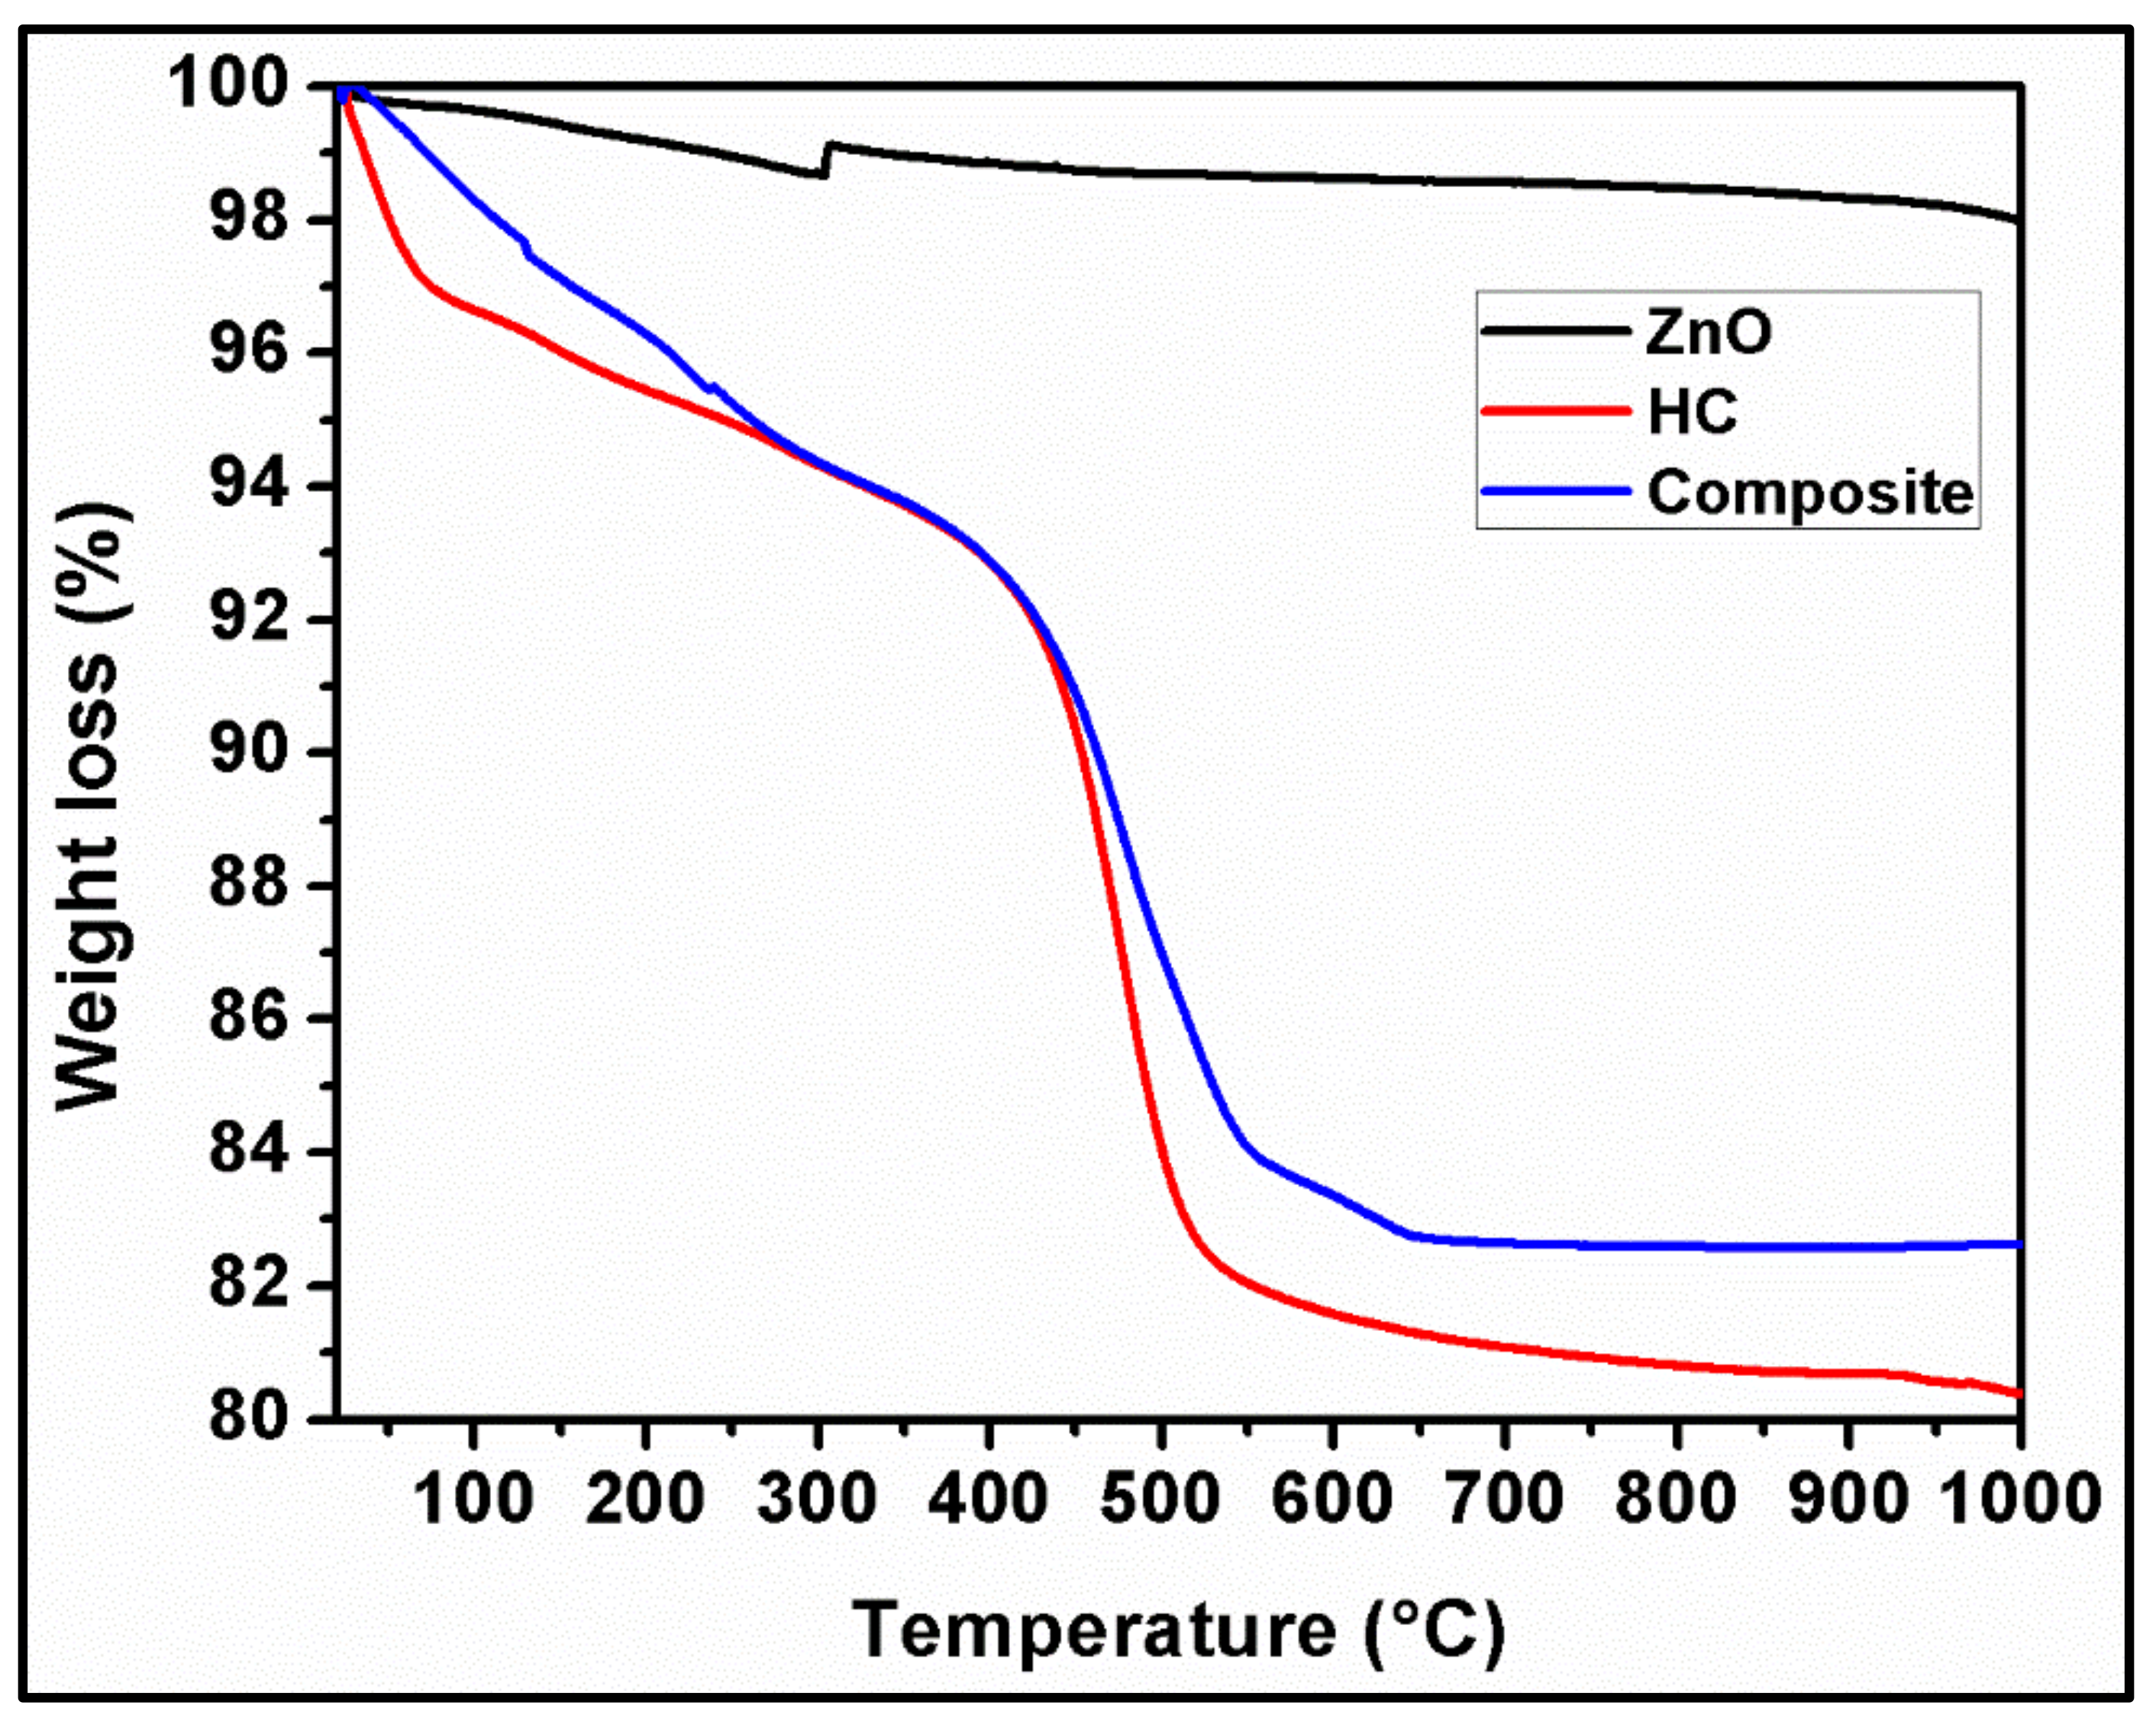
4.7. TGA Analysis of Halloysite Clay and HC/ZnONC

TGA analysis was done to study the thermal stability of the HC/ZnONC. Figure 12 shows TG curves for the NC, where it shows a total weight loss of HC (20%), ZnO NPs (2%) and HC/ZnO NC (17%) when the temperature varied from 25–1000 °C. The HC curve indicates weight loss in three steps; firstly, when the temperature was 25–100 °C there was a 3% wt. loss. This wt. loss could be attributed to the loss of water molecules adsorbed physically on the surface of the NC. In the 2nd step, near 100–400 °C, there was wt. loss of about 4%, and in the final 3rd step, there was wt. loss of about 11% near 400–550 °C. The wt. loss in the 3rd step could be attributed to the dehydroxylation of the Al-OH group in the HC. The results reported here are similar to previous results obtained by Gaaz et al. [37,54,68].
The TGA curve of HC also reveals a three-step wt. loss: the first being 3%, the second one being 4% and the third being 11% at 25–100 °C, 100–400 °C and 400–550 °C, respectively. The first wt. loss could be attributed to the loss of physically adsorbed water molecules, and the third due to the dehydroxylation of the Al-OH group in HC [37]. The TGA curve of ZnONP was quite stable thermally, as it showed a wt. loss of only about 2% due to the loss of adsorbed water molecules. From the TGA investigation, about a 17% wt. loss was revealed in the HC/ZnONC between 25 and 1000 °C. The TG curve shows a two-step degradation process. In the temp. range of 25–400 °C, the loss in wt.% was 7%, which was attributed to the loss of water/moisture. About of a 10% wt. loss was observed in the second step in the temp range of 400–600 °C due to dehydroxylation and devolatilization reactions. The NC showed better thermal stability than the HC from the TGA study whose values are shown in Table 3.

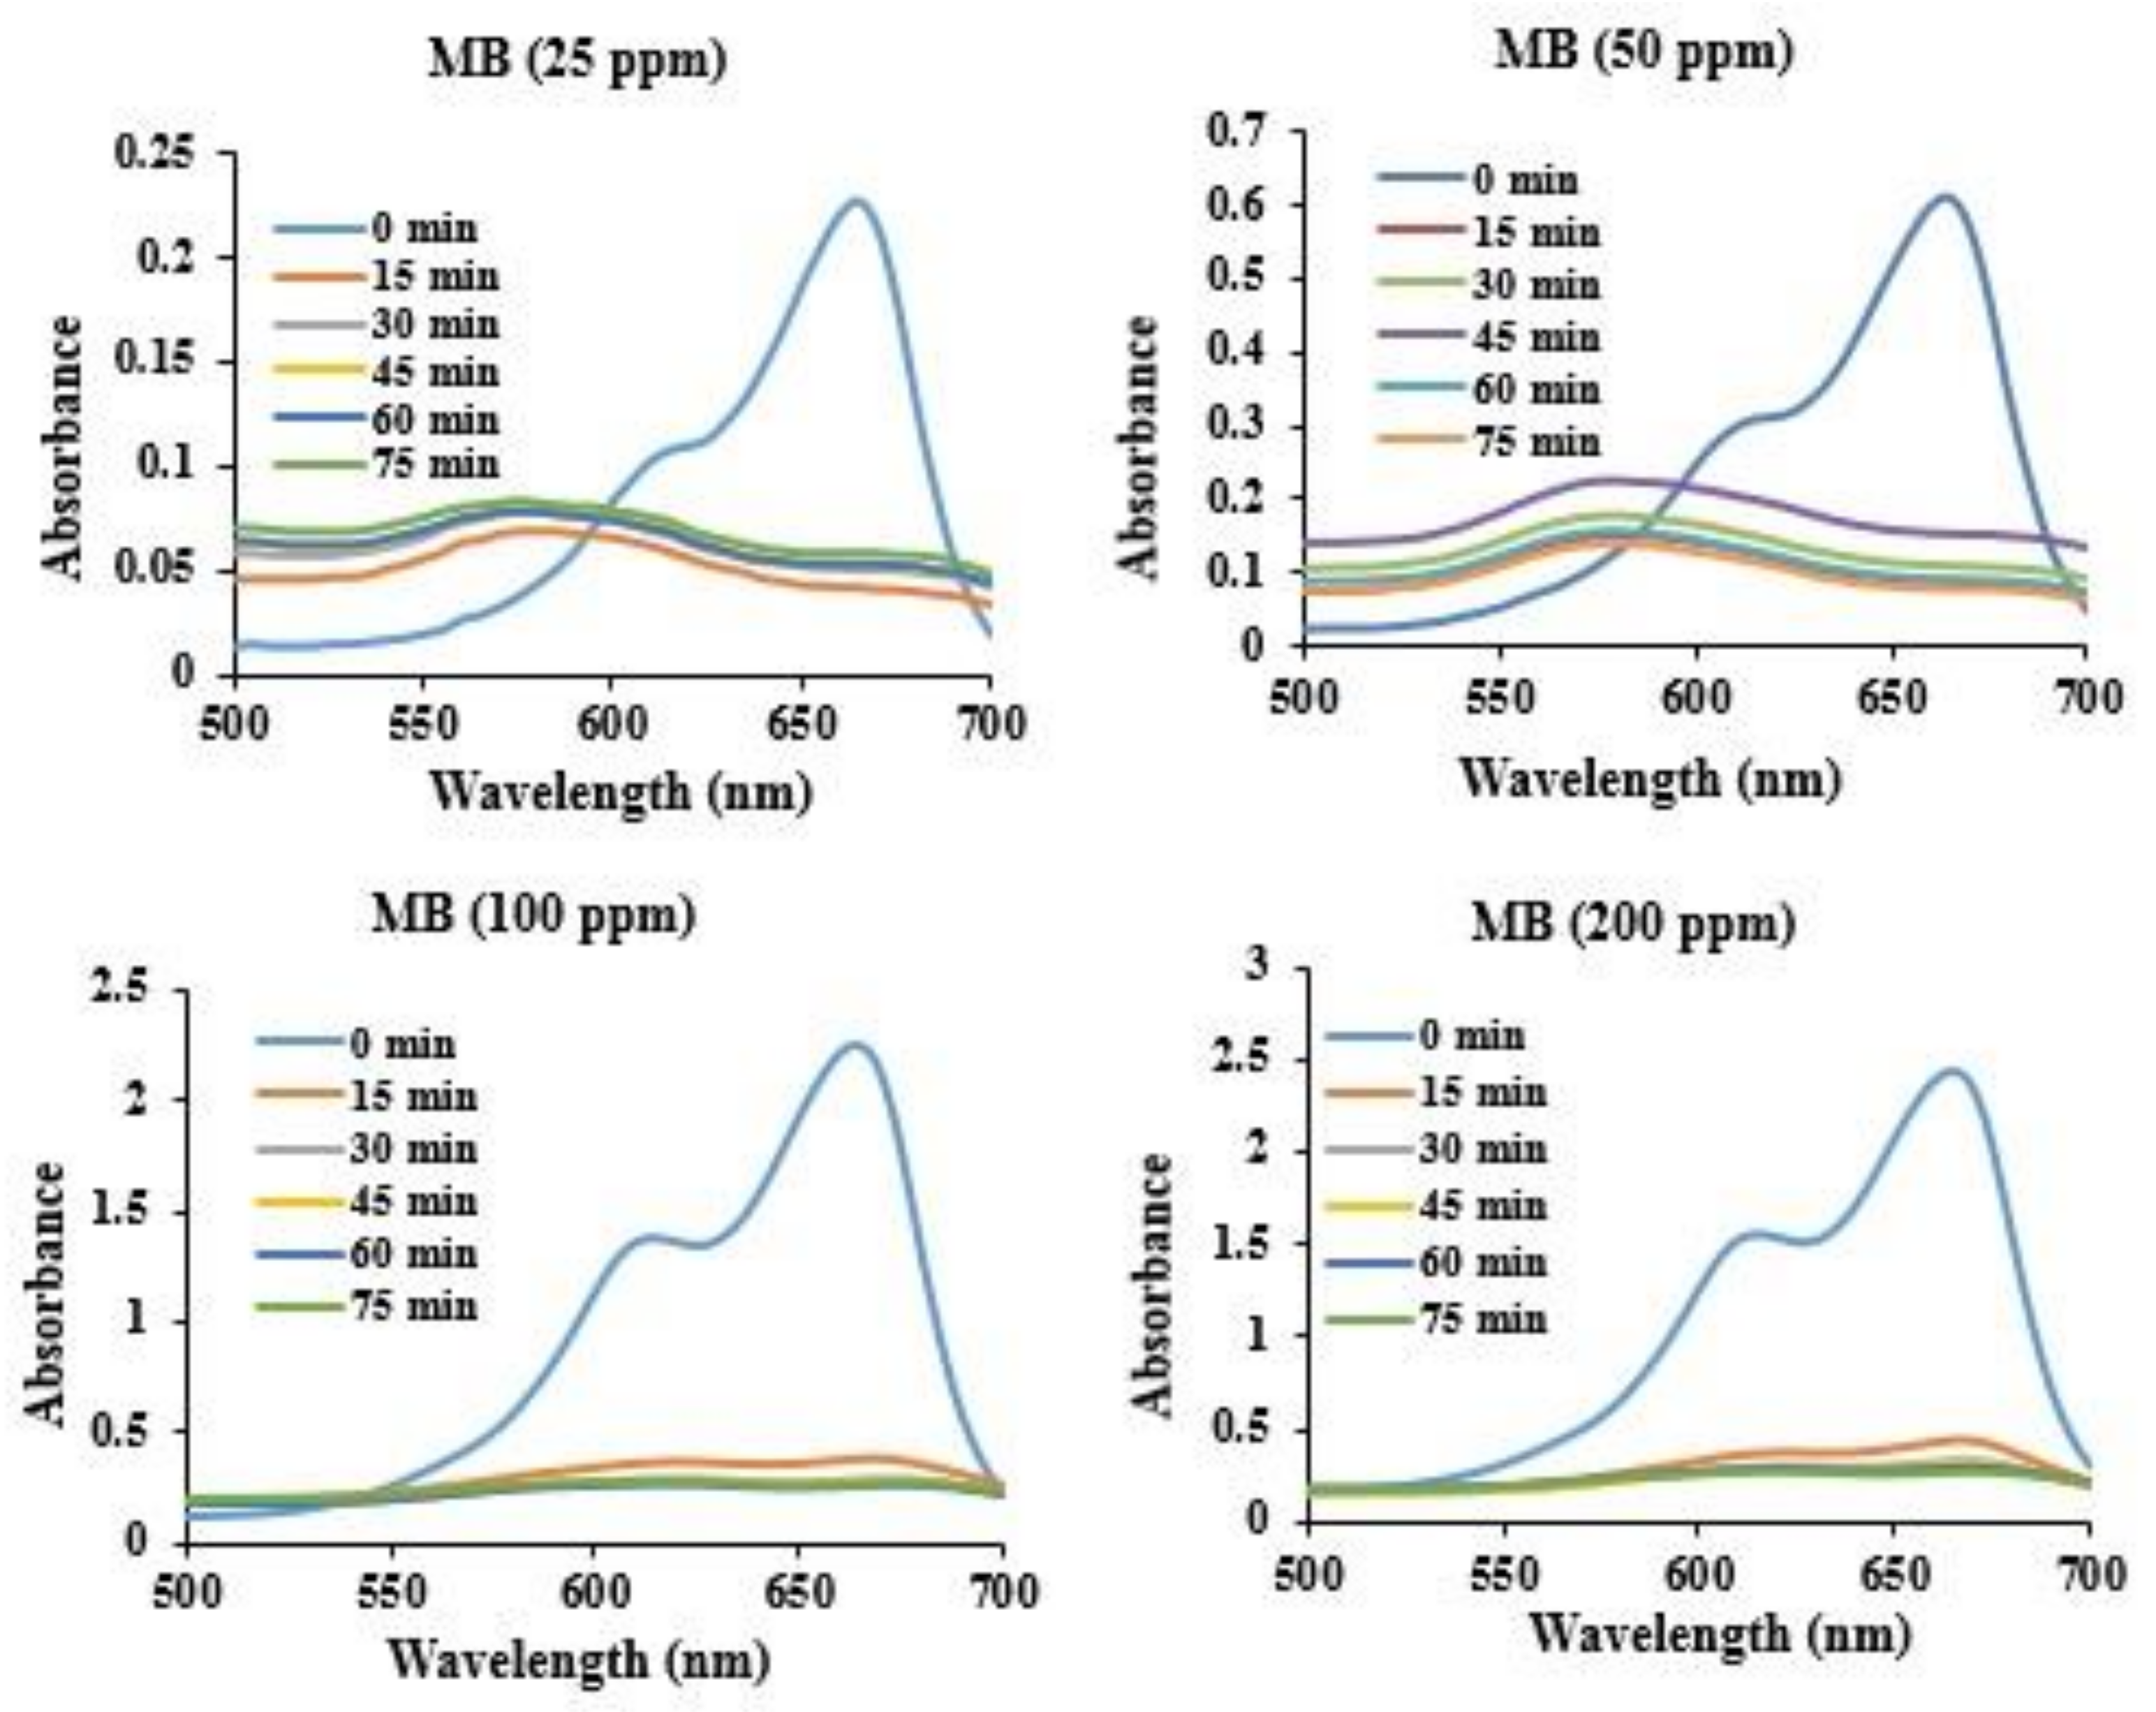
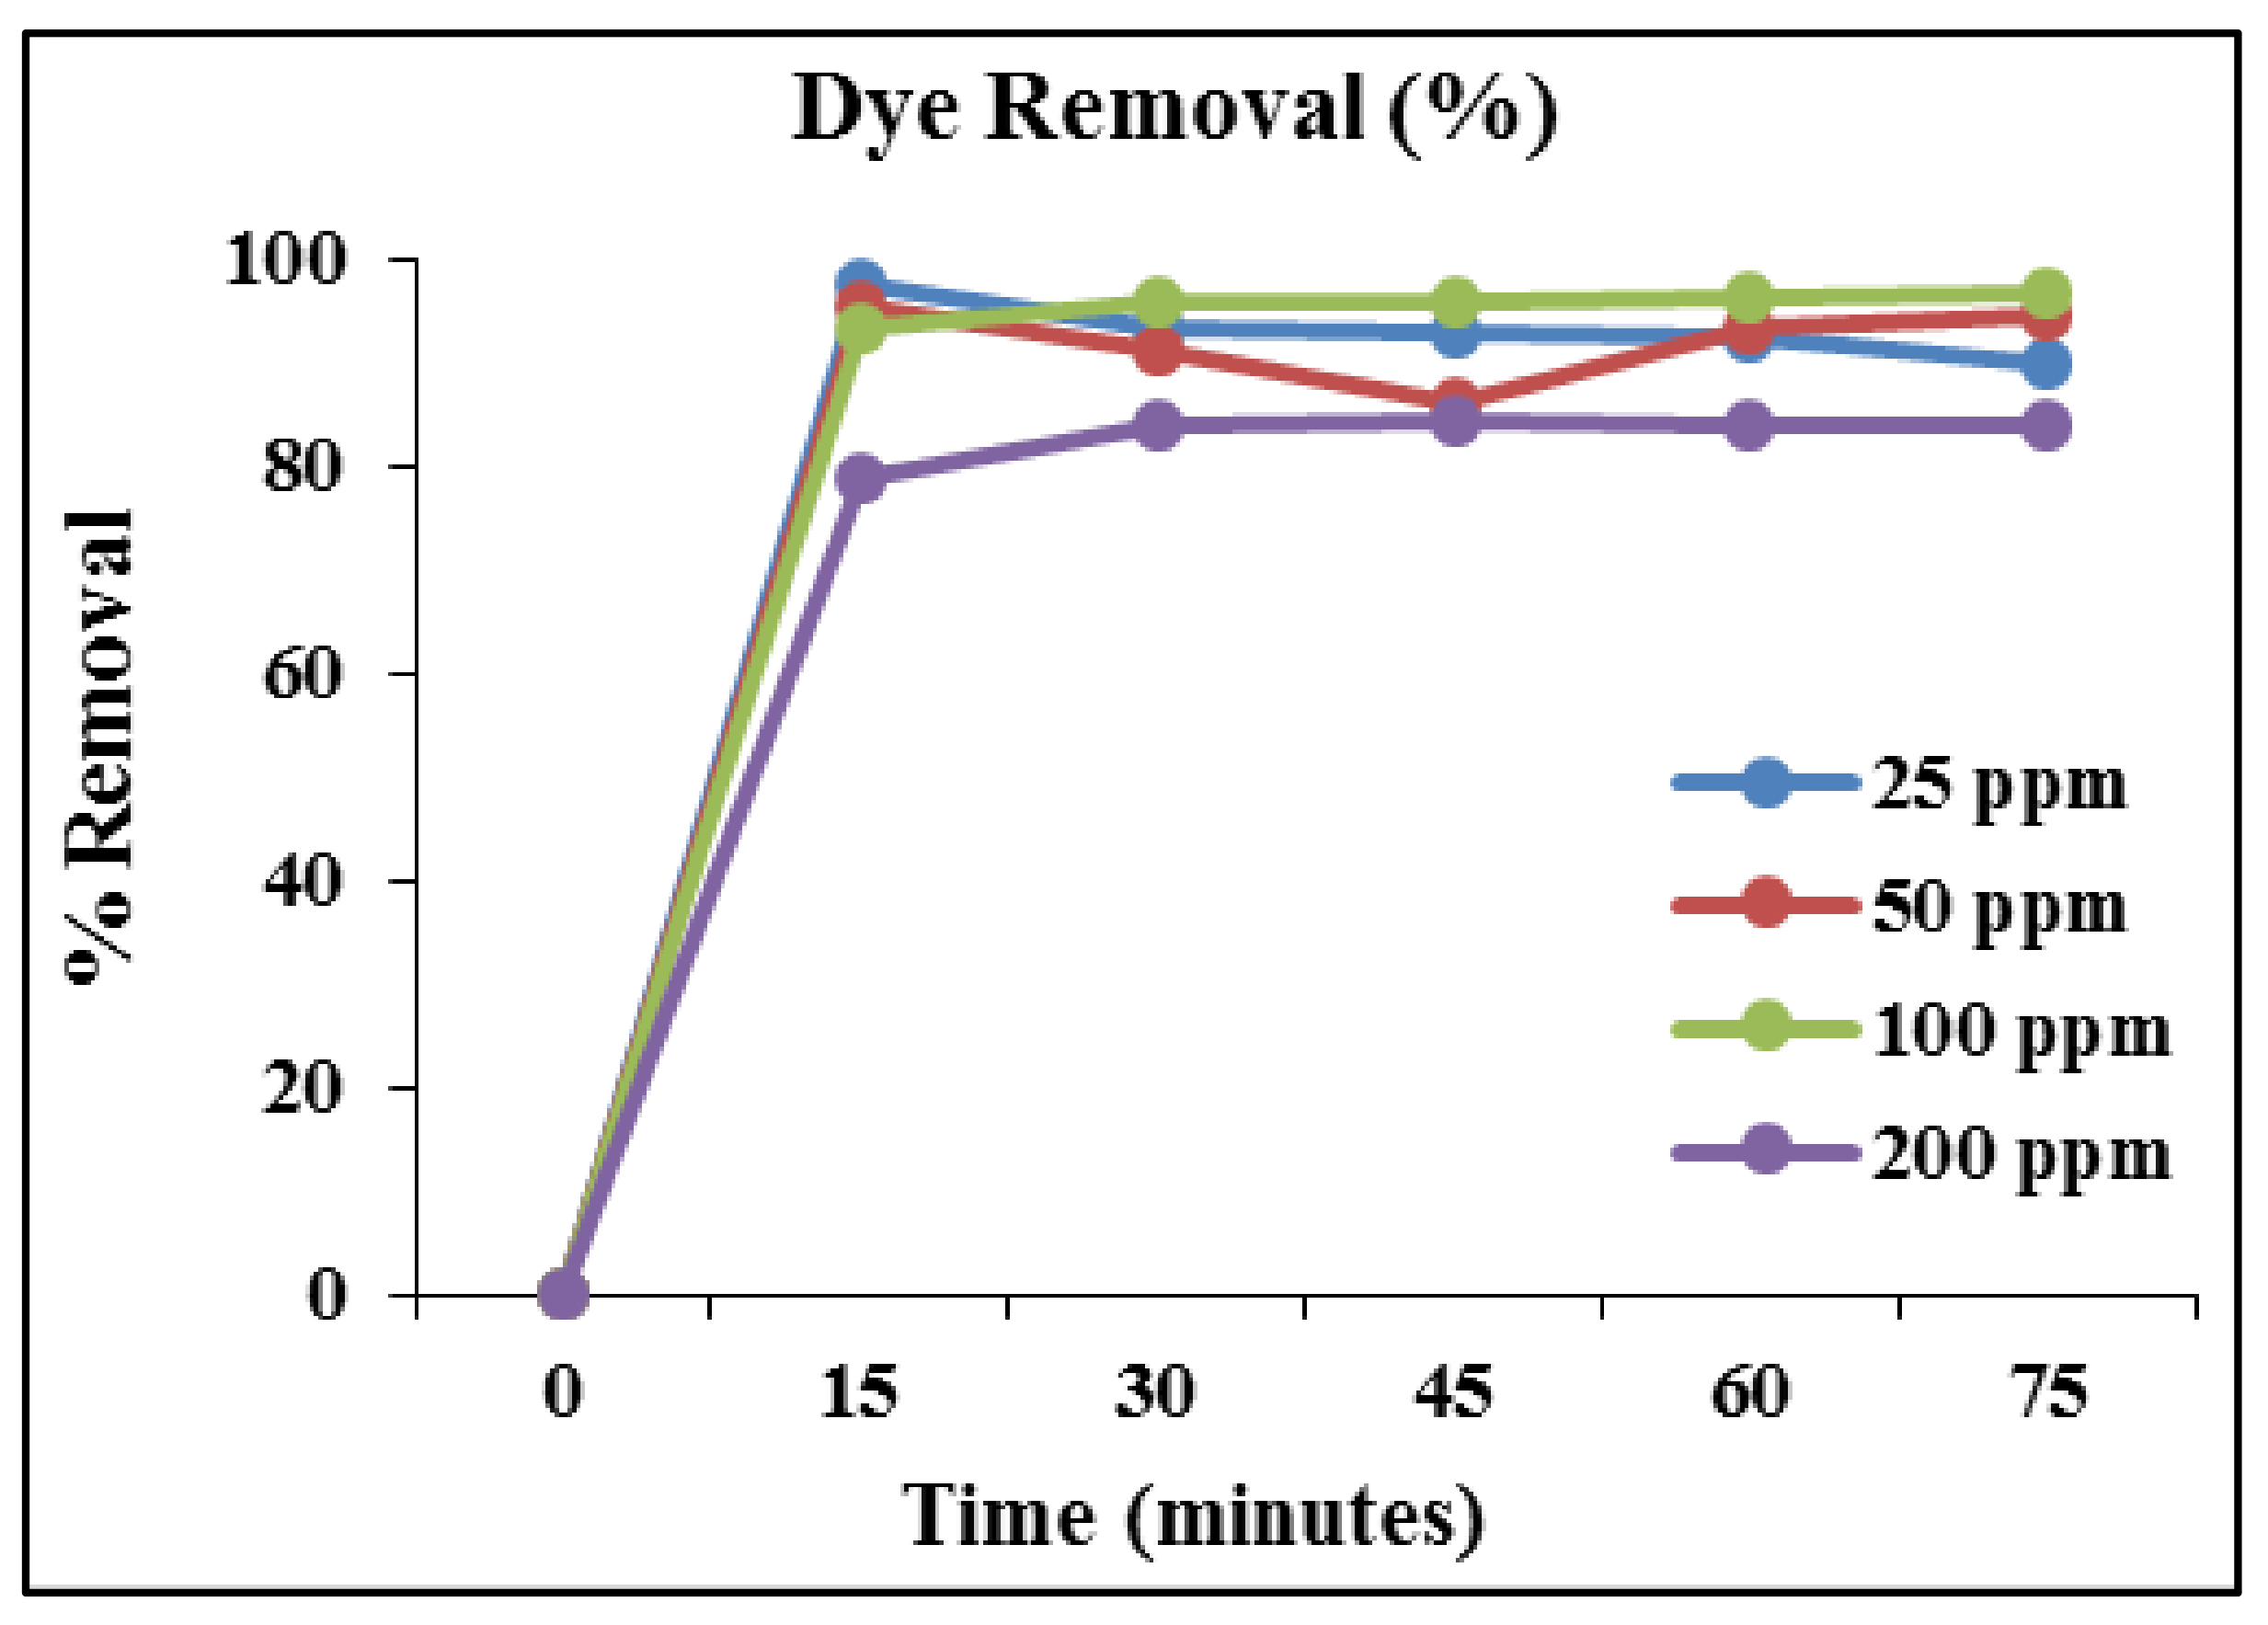
5. MB Dye Removal Study by HC/ZnO Nanocomposite

From the above instrumental analysis, it was found that NC has a band gap of 3.08 eV, which suggests its suitability as a photocatalytic material as well as an adsorbent due to its high SA and porous nature. An aliquot was taken after every minute-long interval and analyzed by UV-Vis to check the decolorization of the dye. The adsorbent-based dye remediation study was carried out with the help of UV-Vis. MB dye has an absorption maxima at 665 nm, which was measured for the initial sample. The absorption maximum of the dye was continuously decreased from 15 min to 75 min. The absorption peak of MB dye reached zero within 15 min after reaching equilibrium, and there was a desorption of the dye molecules from the surface of the adsorbent. An increase in the absorption peak was observed. As far as the other three concentrations (50, 100 and 200 ppm) are concerned, maximum decolorization was obtained at between 15 and 30 min of contact time. Figure 13 shows the UV-Vis absorbance spectra of MB dye from the aqueous solution by using HC-ZnONC., while Figure 14 shows the dye removal percentage for all four concentrations concerning time by using NC which is summarized in Table 4.
From Figure 14, it is evident that the highest percent removal of MB dye was within 15 min of contact time. Equilibrium was attained after 30 min; thereafter, no noticeable change in the color was observed. By using HC/ZnONC as an adsorbent, 97.5% MB dye removal was reached with 25 ppm, 95.45% with 50 ppm, 93% with 100 ppm and 78.61% with 200 ppm of aqueous solutions. The NC has shown potential for the remediation of dyes; due to its relying on active hydroxyl free radical oxidation (·OH), it will cause chromophoric group hydrophobic (-s-) oxidation to the sulfone group. Peng et al. [37] also remediated the MB dye by using HC, ZnONP and HC/ZnONC, whereas the current authors have used only the NC for the dye removal. The superior activity of the NC is due to the combined effect of both ZnONP and HC’s support as an adsorbent. Peng et al. [37] reported that HC minimizes the recombination rate of ZnO NPs’ surface electron holes and band gaps. The immobilization of ZnONP on HC creates novel integrated photocatalytic adsorbents that are more valuable for practical application.
From the above results, it is clear that the mechanism of adsorption of MB dyes is via simple adsorption techniques. The authors showed a possible mechanism of adsorption of dyes by the photocatalytic effect of ZnONP decorated by HC in Figure 15.
Previously, Jian and their team also carried out an experiment for the remediation of MB dye from wastewater under visible light radiation. The investigators used Ce/ZnO, which was decorated on the carbon nanofibers, which in turn was developed by the electrospinning method followed by a hydrothermal technique. The investigators used different concentrations of the dopant of Ce. Finally, the investigators concluded that the composite was more efficient in the remediation of MB dye in comparison to individual NPs. Moreover, the developed ecofriendly photocatalyst exhibited good stability and reusability and could be applied for numerous applications [71].

6. Conclusions

The synthesis of zinc oxide nanoparticles via a chemical approach and their incorporation into the nano clay is possible using the ultrasonication method. The synthesized ZnONPs were spherical shaped, 20 to 120 nm in size and crystalline in nature as confirmed by the microscopic techniques and XRD. The raw halloysite clay was rod shaped and 80 nm to 7–8 microns in size and crystalline in nature, as revealed by TEM and XRD. The instrumental analysis revealed the incorporation of small-sized zinc oxide nanoparticles inside the mesoporous and microporous clay by ultrasonication, and the size of the developed nanocomposite varied from one to several microns in length and about 40–200 nm in width. The FTIR revealed the formation of ZnONPs and nanocomposite due to peculiar functional groups. UV-DRS showed the potential of developed nanocomposite in the field of wastewater treatment due to the small band gap. The microscopic analysis showed the agglomeration of ZnONPs and the incorporation of small ZnONPs into the tube-like clay particles. The EDS confirmed the formation as well as the purity of the samples. TGA showed the thermal stability of the samples, while BET showed that the developed nanocomposites are microporous to mesoporous in nature. The high surface area and low band gap made the nanocomposite a potential candidate for methylene blue dye removal from aqueous solutions, and the developed nanocomposite showed a dye removal efficiency from 90 to 97%, out of which the highest removal percentage was exhibited when the MB dye concentration was lowest, i.e., 25 ppm, and the lowest was when the dye concentration was highest, i.e., 200 ppm. The developed material could be applied for the remediation of the majority of the cationic dyes. Moreover, it could also be used for the remediation of antibiotics from both simulated and natural wastewater. Moreover, in the future, its potential could also be assessed as a nano fertilizer, which will help in the slow and sustained release of nutrients to plants.

7. Future Prospective

Halloysite clay is a low-cost, naturally available nano clay that has tunable properties, and its structure and properties make it an alternative to carbon nanotubes. HC can be used to develop stable composite materials with metal nanoparticles and multi-component nanosystems for application in the biomedical and pharmaceutical fields and for the remediation of environmental pollutants. HC-based nanocomposites could be employed for the treatment of emerging environmental contaminants in an eco-friendly manner, which cannot be removed using conventional treatment methods. The use of clay nanocomposites with metal and metal oxide nanoparticles and biomaterials holds great possibilities for water treatment. The addition of metal oxide nanoparticles imparts the properties of disinfection and photocatalysis. Different clay minerals can be functionalized and modified with different metal nanoparticles and natural adsorbent materials. Further research in this area may provide more effective results for water treatment.

Author Contributions

Conceptualization, N.C. and B.O.A.; Methodology, N.C., D.A. and S.C.; Software, V.K.Y.; Validation, H.A., D.A., S.C. and A.P.; Formal analysis, H.A.; Investigation, V.K.Y., H.A. and B.O.A.; Resources, D.A., B.O.A., S.C. and A.P.; Writing—original draft, N.C. and V.K.Y.; Writing—review & editing, D.A., B.O.A. and A.P.; Supervision, N.C. and A.P.; Project administration, N.C., V.K.Y. and A.P.; Funding acquisition, H.A. and S.C. All authors have read and agreed to the published version of the manuscript.

Funding

This research received no external funding.

Data Availability Statement

All relevant data are included in the article.

Acknowledgments

This research was supported by Researchers Supporting Project number (RSP2023R414), King Saud University, Riyadh, Saudi Arabia.

Conflicts of Interest

There is no conflict of interest regarding the publication of this paper.

References

  1. Patel, Y.; Chhaya, U.; Rudakiya, D.M.; Joshi, S. Biological Decolorization and Degradation of Synthetic Dyes: A Green Step Toward Sustainable Environment. In Microbial Rejuvenation of Polluted Environment; Panpatte, D.G., Jhala, Y.K., Eds.; Springer: Singapore, 2021; Volume 2, pp. 77–110. [Google Scholar] [CrossRef]
  2. Soleimani-Gorgani, A.; Taylor, J. Dyeing of nylon with reactive dyes. Part 1. The effect of changes in dye structure on the dyeing of nylon with reactive dyes. Dye. Pigment. 2006, 68, 109–117. [Google Scholar] [CrossRef]
  3. Kumar, A.; Dixit, U.; Singh, K.; Gupta, S.P.; Beg, M.S.J. Structure and Properties of Dyes and Pigments. In Dyes and Pigments; Dixit, U., Ed.; IntechOpen: Rijeka, Croatia, 2021; p. 8. [Google Scholar] [CrossRef]
  4. Sumathi, S.; Manju, B. Uptake of reactive textile dyes by Aspergillus foetidus. Enzym. Microb. Technol. 2000, 27, 347–355. [Google Scholar] [CrossRef] [PubMed]
  5. Singh, G.; Dwivedi, S.K.; Mishra, J. Role of Fungal Enzymes in the Removal of Azo Dyes. In Microbial Enzymes: Roles and Applications in Industries; Arora, N.K., Mishra, J., Mishra, V., Eds.; Springer: Singapore, 2020; pp. 231–257. [Google Scholar] [CrossRef]
  6. Bello, O.S.; Bello, I.A.; Adegoke, K.A. Adsorption of Dyes Using Different Types of Sand: A Review. S. Afr. J. Chem. 2013, 66, 117–129. [Google Scholar]
  7. Dapson, R. Benzidine-based dyes: Effects of industrial practices, regulations, and world trade on the biological stains market. Biotech. Histochem. 2009, 84, 95–100. [Google Scholar] [CrossRef] [PubMed]
  8. Dellamatrice, P.M.; Silva-Stenico, M.E.; De Moraes, L.A.B.; Fiore, M.F.; Monteiro, R.T.R. Degradation of textile dyes by cyanobacteria. Braz. J. Microbiol. 2016, 48, 25–31. [Google Scholar] [CrossRef] [Green Version]
  9. Bijekar, S.; Padariya, H.D.; Yadav, V.K.; Gacem, A.; Hasan, M.A.; Awwad, N.S.; Yadav, K.K.; Islam, S.; Park, S.; Jeon, B.-H. The State of the Art and Emerging Trends in the Wastewater Treatment in Developing Nations. Water 2022, 14, 2537. [Google Scholar] [CrossRef]
  10. Gnanamoorthy, G.; Karthikeyan, V.; Ali, D.; Kumar, G.; Yadav, V.K.; Narayanan, V. Global popularization of CuNiO2 and their rGO nanocomposite loveabled to the photocatalytic properties of methylene blue. Environ. Res. 2022, 204, 112338. [Google Scholar] [CrossRef]
  11. Kara, H.T.; Anshebo, S.T.; Sabir, F.K.; Workineh, G.A. Removal of Methylene Blue Dye from Wastewater Using Periodiated Modified Nanocellulose. Int. J. Chem. Eng. 2021, 2021, 9965452. [Google Scholar] [CrossRef]
  12. Modi, S.; Yadav, V.K.; Gacem, A.; Ali, I.H.; Dave, D.; Khan, S.H.; Yadav, K.K.; Rather, S.-U.; Ahn, Y.; Son, C.T.; et al. Recent and Emerging Trends in Remediation of Methylene Blue Dye from Wastewater by Using Zinc Oxide Nanoparticles. Water 2022, 14, 1749. [Google Scholar] [CrossRef]
  13. Yadav, V.K.; Choudhary, N.; Ali, D.; Kumar, G.; Gnanamoorthy, G.; Khan, A.U.; Kumar, P.; Kumar, S.H.; Tizazu, B.Z. Determination of Adsorption of Methylene Blue Dye by Incense Stick Ash Waste and Its Toxicity on RTG-2 Cells. Adsorpt. Sci. Technol. 2022, 2022, 8565151. [Google Scholar] [CrossRef]
  14. Zhambolova, A.; Vocaturo, A.; Tileuberdi, Y.; Ongarbayev, Y.; Caputo, P.; Aiello, I.; Rossi, C.O.; Godbert, N. Functionalization and Modification of Bitumen by Silica Nanoparticles. Appl. Sci. 2020, 10, 6065. [Google Scholar] [CrossRef]
  15. Islam, F.; Shohag, S.; Uddin, J.; Islam, R.; Nafady, M.H.; Akter, A.; Mitra, S.; Roy, A.; Bin Emran, T.; Cavalu, S. Exploring the Journey of Zinc Oxide Nanoparticles (ZnO-NPs) toward Biomedical Applications. Materials 2022, 15, 2160. [Google Scholar] [CrossRef]
  16. Jiang, J.; Pi, J.; Cai, J. The Advancing of Zinc Oxide Nanoparticles for Biomedical Applications. Bioinorg. Chem. Appl. 2018, 2018, 1062562. [Google Scholar] [CrossRef] [PubMed]
  17. Chauhan, R.; Kumar, A.; Tripathi, R.; Kumar, A. Advancing of Zinc Oxide Nanoparticles for Cosmetic Applications. In Handbook of Consumer Nanoproducts; Mallakpour, S., Hussain, C.M., Eds.; Springer: Singapore, 2021; pp. 1–16. [Google Scholar] [CrossRef]
  18. Khan, S.H.; Pathak, B.; Fulekar, M.H. Synthesis, characterization and photocatalytic degradation of chlorpyrifos by novel Fe: ZnO nanocomposite material. Nanotechnol. Environ. Eng. 2018, 3, 13. [Google Scholar] [CrossRef]
  19. Khan, S.H.; Pathak, B. Zinc oxide based photocatalytic degradation of persistent pesticides: A comprehensive review. Environ. Nanotechnol. Monit. Manag. 2020, 13, 100290. [Google Scholar] [CrossRef]
  20. Khan, S.H.; Pathak, B.; Fulekar, M.H. A study on the influence of metal (Fe, Bi, and Ag) doping on structural, optical, and antimicrobial activity of ZnO nanostructures. Adv. Compos. Hybrid Mater. 2020, 3, 551–569. [Google Scholar] [CrossRef]
  21. Khan, S.H.; Yadav, V.K.; Ali, D.; Varghese, R. Influence of precursor ions on the structural morphological and optical properties of ZnO nanostructure and cytotoxicity on murine NIH 3T3 cells. Chem. Pap. 2022, 76, 477–489. [Google Scholar] [CrossRef]
  22. Singh, R.; Volli, V.; Lohani, L.; Purkait, M.K. Polymeric ultrafiltration membranes modified with fly ash based carbon nanotubes for thermal stability and protein separation. Case Stud. Chem. Environ. Eng. 2021, 4, 100155. [Google Scholar] [CrossRef]
  23. Cheng, Z.; An, J.; Li, F.; Lu, Y.; Li, S. Effect of fly ash cenospheres on properties of multi-walled carbon nanotubes and polyvinyl alcohol fibers reinforced geopolymer composites. Ceram. Int. 2022, 48, 18956–18971. [Google Scholar] [CrossRef]
  24. Purcar, V.; Şomoghi, R.; Niţu, S.G.; Nicolae, C.-A.; Alexandrescu, E.; Gîfu, I.C.; Gabor, A.R.; Stroescu, H.; Ianchiş, R.; Căprărescu, S.; et al. The Effect of Different Coupling Agents on Nano-ZnO Materials Obtained via the Sol–Gel Process. Nanomaterials 2017, 7, 439. [Google Scholar] [CrossRef] [Green Version]
  25. Mukai, H.; Hirose, A.; Motai, S.; Kikuchi, R.; Tanoi, K.; Nakanishi, T.M.; Yaita, T.; Kogure, T. Cesium adsorption/desorption behavior of clay minerals considering actual contamination conditions in Fukushima. Sci. Rep. 2016, 6, 21543. [Google Scholar] [CrossRef] [PubMed] [Green Version]
  26. Huggett, J. Clay Minerals☆. In Reference Module in Earth Systems and Environmental Sciences; Elsevier: Amsterdam, The Netherlands, 2015. [Google Scholar] [CrossRef]
  27. Hillier, S. Clay Mineralogy. In Sedimentology; Springer: Berlin/Heidelberg, Germany, 1978; pp. 223–228. [Google Scholar] [CrossRef]
  28. Hanif, M.; Jabbar, F.; Sharif, S.; Abbas, G.; Farooq, A.; Aziz, M. Halloysite nanotubes as a new drug-delivery system: A review. Clay Miner. 2016, 51, 469–477. [Google Scholar] [CrossRef]
  29. Sarkar, B.; Rusmin, R.; Ugochukwu, U.C.; Mukhopadhyay, R.; Manjaiah, K.M. Chapter 5—Modified clay minerals for environmental applications. In Modified Clay and Zeolite Nanocomposite Materials; Mercurio, M., Sarkar, B., Langella, A., Eds.; Elsevier: Amsterdam, The Nethelands, 2019; pp. 113–127. [Google Scholar] [CrossRef]
  30. Lu, Z.; Sha, A.; Gao, J.; Jia, M.; Wang, W. An Improved Predictive Model for Determining the Permeability Coefficient of Artificial Clayey Soil Based on Double T2 Cut-Offs. Adv. Mater. Sci. Eng. 2020, 2020, 5323820. [Google Scholar] [CrossRef]
  31. Biswas, B.; Labille, J.; Prelot, B. Clays and modified clays in remediating environmental pollutants. Environ. Sci. Pollut. Res. 2020, 27, 38381–38383. [Google Scholar] [CrossRef]
  32. Amar, A.; Loulidi, I.; Kali, A.; Boukhlifi, F.; Hadey, C.; Jabri, M. Physicochemical Characterization of Regional Clay: Application to Phenol Adsorption. Appl. Environ. Soil Sci. 2021, 2021, 8826063. [Google Scholar] [CrossRef]
  33. Shubbar, A.A.; Sadique, M.; Kot, P.; Atherton, W. Future of clay-based construction materials—A review. Constr. Build. Mater. 2019, 210, 172–187. [Google Scholar] [CrossRef]
  34. Mintis, D.; Mavrantzas, V.G. Effect of pH and Molecular Length on the Structure and Dynamics of Short Poly(acrylic acid) in Dilute Solution: Detailed Molecular Dynamics Study. J. Phys. Chem. B 2019, 123, 4204–4219. [Google Scholar] [CrossRef]
  35. Aluvihara, S.; Kalpage, C.S.; Lemle, K.L. Elementary chemical analysis of different clay types. J. Phys. Conf. Ser. 2021, 1781, 012007. [Google Scholar] [CrossRef]
  36. Albdiry, M.; Yousif, B. Role of silanized halloysite nanotubes on structural, mechanical properties and fracture toughness of thermoset nanocomposites. Mater. Des. 2014, 57, 279–288. [Google Scholar] [CrossRef]
  37. Peng, H.; Liu, X.; Tang, W.; Ma, R. Facile synthesis and characterization of ZnO nanoparticles grown on halloysite nanotubes for enhanced photocatalytic properties. Sci. Rep. 2017, 7, 2250. [Google Scholar] [CrossRef] [Green Version]
  38. Kamble, R.; Ghag, M.; Gaikawad, S.; Kumar Panda, B. Halloysite nanotubes and applications: A review. J. Adv. Sci. Res. 2012, 3, 25–29. [Google Scholar]
  39. Borah, D.; Nath, H.; Saikia, H. Modification of bentonite clay & its applications: A review. Rev. Inorg. Chem. 2021, 42, 265–282. [Google Scholar] [CrossRef]
  40. Khan, I.; Bhat, A.H. Micro and Nano Calcium Carbonate Filled Natural Rubber Composites and Nanocomposites. In Natural Rubber Materials; Royal Society of Chemistry: London, UK, 2014; pp. 467–487. [Google Scholar] [CrossRef]
  41. Isawi, H. Using Zeolite/Polyvinyl alcohol/sodium alginate nanocomposite beads for removal of some heavy metals from wastewater. Arab. J. Chem. 2020, 13, 5691–5716. [Google Scholar] [CrossRef]
  42. Gnanamoorthy, G.; Yadav, V.K.; Latha, D.; Karthikeyan, V.; Narayanan, V. Enhanced photocatalytic performance of ZnSnO3/rGO nanocomposite. Chem. Phys. Lett. 2020, 739, 137050. [Google Scholar] [CrossRef]
  43. Gadore, V.; Ahmaruzzaman, M. Fly ash–based nanocomposites: A potential material for effective photocatalytic degradation/elimination of emerging organic pollutants from aqueous stream. Environ. Sci. Pollut. Res. 2021, 28, 46910–46933. [Google Scholar] [CrossRef]
  44. Gnanamoorthy, G.; Ali, D.; Yadav, V.K.; Dhinagaran, G.; Venkatachalam, K.; Narayanan, V. New construction of Fe3O4/rGO/ZnSnO3 nanocomposites enhanced photoelectro chemical properties. Opt. Mater. 2020, 109, 110353. [Google Scholar] [CrossRef]
  45. Ab Rahman, I.; Padavettan, V. Synthesis of Silica Nanoparticles by Sol-Gel: Size-Dependent Properties, Surface Modification, and Applications in Silica-Polymer Nanocomposites—A Review. J. Nanomater. 2012, 2012, 132424. [Google Scholar] [CrossRef] [Green Version]
  46. Gnanamoorthy, G.; Karthikeyan, V.; Ali, D.; Kumar, G.; Jenifer, S.G.; Yadav, V.K.; Choudhary, N.; Narayanan, V. Realization of rGO/ZnCo2O4 nanocomposites enhanced for the antimicrobial, electrochemical and photocatalytic activities. Diam. Relat. Mater. 2021, 120, 108677. [Google Scholar] [CrossRef]
  47. Fritea, L.; Banica, F.; Costea, T.O.; Moldovan, L.; Dobjanschi, L.; Muresan, M.; Cavalu, S. Metal Nanoparticles and Carbon-Based Nanomaterials for Improved Performances of Electrochemical (Bio)Sensors with Biomedical Applications. Materials 2021, 14, 6319. [Google Scholar] [CrossRef] [PubMed]
  48. Nicola, R.; Costişor, O.; Ciopec, M.; Negrea, A.; Lazău, R.; Ianăşi, C.; Picioruş, E.-M.; Len, A.; Almásy, L.; Szerb, E.I.; et al. Silica-Coated Magnetic Nanocomposites for Pb2+ Removal from Aqueous Solution. Appl. Sci. 2020, 10, 2726. [Google Scholar] [CrossRef] [Green Version]
  49. Rajendran, S.; Wanale, S.G.; Gacem, A.; Yadav, V.K.; Ahmed, I.A.; Algethami, J.S.; Kakodiya, S.D.; Modi, T.; Alsuhaibani, A.M.; Yadav, K.K.; et al. Nanostructured Iron Oxides: Structural, Optical, Magnetic, and Adsorption Characteristics for Cleaning Industrial Effluents. Crystals 2023, 13, 472. [Google Scholar] [CrossRef]
  50. Yadav, V.K.; Amari, A.; Gacem, A.; Elboughdiri, N.; Eltayeb, L.B.; Fulekar, M.H. Treatment of Fly-Ash-Contaminated Wastewater Loaded with Heavy Metals by Using Fly-Ash-Synthesized Iron Oxide Nanoparticles. Water 2023, 15, 908. [Google Scholar] [CrossRef]
  51. Shu, Z.; Zhang, Y.; Yang, Q.; Yang, H. Halloysite Nanotubes Supported Ag and ZnO Nanoparticles with Synergistically Enhanced Antibacterial Activity. Nanoscale Res. Lett. 2017, 12, 135. [Google Scholar] [CrossRef] [PubMed] [Green Version]
  52. Sudhakar, Y.; Selvakumar, M.; Bhat, D.K. Investigations on thermo-mechanical properties of organically modified polymer clay nanocomposites for packaging application. Polym. Polym. Compos. 2021, 29, 1191–1199. [Google Scholar] [CrossRef]
  53. Choudhary, N.; Yadav, V.K.; Yadav, K.K.; Almohana, A.I.; Almojil, S.F.; Gnanamoorthy, G.; Kim, D.-H.; Islam, S.; Kumar, P.; Jeon, B.-H. Application of Green Synthesized MMT/Ag Nanocomposite for Removal of Methylene Blue from Aqueous Solution. Water 2021, 13, 3206. [Google Scholar] [CrossRef]
  54. Zsirka, B.; Vágvölgyi, V.; Horváth, E.; Juzsakova, T.; Fónagy, O.; Szabó-Bárdos, E.; Kristóf, J. Halloysite-Zinc Oxide Nanocomposites as Potential Photocatalysts. Minerals 2022, 12, 476. [Google Scholar] [CrossRef]
  55. Caprarescu, S.; Miron, A.R.; Purcar, V.; Radu, A.-L.; Sarbu, A.; Ion-Ebrasu, D.; Atanase, L.I.; Ghiurea, M. Efficient removal of Indigo Carmine dye by a separation process. Water Sci. Technol. 2016, 74, 2462–2473. [Google Scholar] [CrossRef]
  56. Caprarescu, S.; Miron, A.R.; Purcar, V.; Radu, A.-L.; Sarbu, A.; Nicolae, C.A.; Pascu, M.; Ion-Ebrasu, D.; Raditoiu, V. Treatment of Crystal Violet from Synthetic Solution Using Membranes Doped with Natural Fruit Extract. CLEAN Soil Air Water 2018, 46, 1700413. [Google Scholar] [CrossRef]
  57. Caprarescu, S.; Miron, A.R.; Purcar, V.; Radu, A.-L.; Sarbu, A.; Ianchis, R.; Ebrasu, D.I. Commercial Gooseberry Buds Extract Containing Membrane for Removal of Methylene Blue Dye from Synthetic Wastewaters. Rev. Chim. 2017, 68, 1757–1762. [Google Scholar] [CrossRef]
  58. Modrogan, C.; Cǎprǎrescu, S.; Dǎncilǎ, A.M.; Orbuleț, O.D.; Grumezescu, A.M.; Purcar, V.; Radițoiu, V.; Fierascu, R.C. Modified Composite Based on Magnetite and Polyvinyl Alcohol: Synthesis, Characterization, and Degradation Studies of the Methyl Orange Dye from Synthetic Wastewater. Polymers 2021, 13, 3911. [Google Scholar] [CrossRef]
  59. Ringu, T.; Ghosh, S.; Das, A.; Pramanik, N. Zinc oxide nanoparticles: An excellent biomaterial for bioengineering applications. Emergent Mater. 2022, 5, 1629–1648. [Google Scholar] [CrossRef]
  60. Pradeeswari, K.; Venkatesan, A.; Pandi, P.; Karthik, K.; Krishna, K.V.H.; Kumar, R.M. Study on the electrochemical performance of ZnO nanoparticles synthesized via non-aqueous sol-gel route for supercapacitor applications. Mater. Res. Express 2019, 6, 105525. [Google Scholar] [CrossRef]
  61. Chitra, M.; Mangamma, G.; Uthayarani, K.; Neelakandeswari, N.; Girija, E. Band gap engineering in ZnO based nanocomposites. Phys. E Low Dimens. Syst. Nanostructures 2020, 119, 113969. [Google Scholar] [CrossRef]
  62. Kalanur, S.S.; Yoo, I.-H.; Cho, I.-S.; Seo, H. Effect of oxygen vacancies on the band edge properties of WO3 producing enhanced photocurrents. Electrochim. Acta 2019, 296, 517–527. [Google Scholar] [CrossRef]
  63. Gaaz, T.S.; Sulong, A.B.; Kadhum, A.A.H.; Al-Amiery, A.A.; Nassir, M.H.; Jaaz, A.H. The Impact of Halloysite on the Thermo-Mechanical Properties of Polymer Composites. Molecules 2017, 22, 838. [Google Scholar] [CrossRef] [PubMed] [Green Version]
  64. Alkatheeri, M.S.; Palasuk, J.; Eckert, G.J.; Platt, J.A.; Bottino, M.C. Halloysite nanotube incorporation into adhesive systems—Effect on bond strength to human dentin. Clin. Oral Investig. 2015, 19, 1905–1912. [Google Scholar] [CrossRef] [PubMed]
  65. Bordeepong, S.; Bhongsuwan, D.; Pungrassami, T.; Bhongsuwan, T. Mineralogy, Chemical Composition and Ceramic Properties of Clay Deposits in Southern Thailand. Agric. Nat. Resour. 2012, 46, 485–500. [Google Scholar]
  66. Thangapandiyan, S.; Monika, S. Green Synthesized Zinc Oxide Nanoparticles as Feed Additives to Improve Growth, Biochemical, and Hematological Parameters in Freshwater Fish Labeo rohita. Biol. Trace Elem. Res. 2020, 195, 636–647. [Google Scholar] [CrossRef]
  67. Getie, S.; Belay, A.; Chandra Reddy, A.R.; Belay, Z. Synthesis and Characterizations of Zinc Oxide Nanoparticles for Antibacterial Applications. J. Nanomed. Nanotechnol. 2017, 8, 1–8. [Google Scholar] [CrossRef]
  68. Biddeci, G.; Spinelli, G.; Colomba, P.; Di Blasi, F. Halloysite Nanotubes and Sepiolite for Health Applications. Int. J. Mol. Sci. 2023, 24, 4801. [Google Scholar] [CrossRef]
  69. Alekseeva, O.V.; Shibaeva, V.D.; Noskov, A.V.; Ivanov, V.K.; Agafonov, A.V. Enhancing the Thermal Stability of Ionogels: Synthesis and Properties of Triple Ionic Liquid/Halloysite/MCC Ionogels. Molecules 2021, 26, 6198. [Google Scholar] [CrossRef] [PubMed]
  70. Alothman, Z.A. A Review: Fundamental Aspects of Silicate Mesoporous Materials. Materials 2012, 5, 2874–2902. [Google Scholar] [CrossRef] [Green Version]
  71. Jian, S.; Tian, Z.; Zhang, K.; Duan, G.; Yang, W.; Jiang, S. Hydrothermal Synthesis of Ce-doped ZnO Heterojunction Supported on Carbon Nanofibers with High Visible Light Photocatalytic Activity. Chem. Res. Chin. Univ. 2021, 37, 565–570. [Google Scholar] [CrossRef]
Figure 1. Schematic presentation showing the crystalline structure of halloysite clay (a), front view of HC structure (b) and arrangement of elements i.e., O, Si, Al, hydroxyl and other groups in the crystalline structure of HC (c) adapted from [36].
Water 15 01427 g001
Figure 2. Schematic method for the formation of HC/ZnONC adapted from [39].
Water 15 01427 g002
Figure 3. Schematic steps involved in the synthesis of HC/ZnONC.
Water 15 01427 g003
Figure 4. UV-Visible spectra of HC, ZnONPs and HC/ZnONC.
Water 15 01427 g004
Figure 5. UV-DRS spectra and band gap of HC and HC/ZnONC.
Water 15 01427 g005
Figure 6. FTIR spectra of Halloysite clay, ZnONPs and HC/ZnONC.
Water 15 01427 g006
Figure 7. XRD patterns for HC, ZnONPs and HC/ZnONC.
Water 15 01427 g007
Figure 8. (a,b) FE-SEM micrographs; (c) HR-TEM images; (d) SAED pattern; (e) EDS spectra and elemental table of HC.
Water 15 01427 g008
Figure 9. (a,b) FE-SEM micrographs; (c) HR-TEM images; (d) SAED pattern; (e) EDS spectra and elemental table of ZnONPs.
Water 15 01427 g009
Figure 10. (a,b) FE-SEM micrographs; (c) HR-TEM images; (d) SAED pattern; (e) EDS spectra and elemental table of HC/ZnONC.
Water 15 01427 g010
Figure 11. N2 adsorption–desorption BET isotherm and the pore size distribution (inset) for Halloysite clay (a) and HC/ZnONC (b).
Water 15 01427 g011
Figure 12. TGA analysis of Halloysite clay, ZnO and HC-ZnONC.
Water 15 01427 g012
Figure 13. Absorption spectrum for remediation of MB dye using HC/ZnO NC for 25, 50, 100 and 200 ppm dye concentrations.
Water 15 01427 g013
Figure 14. Percent removal of MB dye for different concentrations using HC/ZnONC.
Water 15 01427 g014
Figure 15. HC/ZnONC mediated photocatalytic degradation mechanism of MB dye removal.
Water 15 01427 g015
Table 1. Major FTIR assignments of ZnONPs, HC and HC/ZnONC.
SamplesHydroxyl GroupAtmospheric Carbon Si-O-SiAl-O/Al-OHZn-O-Zn
ZnONPs3576 & 3474 cm−12397 & 2427 cm−11634 & 1385 cm−1 630, 519 & 460 cm−1
HC3698, 3622 &1680 cm−1 1120, 1034 & 790 cm−1910 & 536 cm−1
HC/ZnONC3800 cm−1 1400 cm−11132 900–400 cm−1
Table 2. Surface area, total pore volume, and average pore size of HC/ZnONC.
MaterialSpecific Surface Area
(m2/g)
Pore Volume
(cc/g)
Average Pore
Diameter (nm)
Halloysite clay (raw)54.7510.2693.813
HC/ZnO nanocomposite60.2580.1493.707
Table 3. TGA details of HC, ZnONPs and HC/ZnONC.
Breakdown StepHalloysite Clay
(Temp.)
HC/ZnONC
(Temp.)
Due to
1st step25–100 °C25–400 °CLoss of water molecule
2nd Step100–400 °C-dehydroxylation
3rd step400–550 °C400–600 °Cdehydroxylation and volatilization
Table 4. Summarized result of the materials and dye removal.
ParametersZnONPsHCHC/ZnONCMB
25 ppm
MB
50 ppm
MB
100 ppm
MB
200 ppm
BET (SSA, m2/g) 54.75160.258
Morphology Spherical shaped Rod-shapedRod-shaped with spherical ZnONPs
XRDCrystalline Crystalline Crystalline
Dye removal with HC/ZnONPs 97.5%95.45%93%78.61%
Disclaimer/Publisher’s Note: The statements, opinions and data contained in all publications are solely those of the individual author(s) and contributor(s) and not of MDPI and/or the editor(s). MDPI and/or the editor(s) disclaim responsibility for any injury to people or property resulting from any ideas, methods, instructions or products referred to in the content.

