Article

Prediction of Earth Dam Seepage Using a Transient Thermal Finite Element Model

1
USDA-ARS, Stillwater, OK 74075, USA
2
Petroleum Engineering, School of Chemical Engineering, Oklahoma State University, Stillwater, OK 74075, USA
*
Author to whom correspondence should be addressed.
Water 2023, 15(7), 1423; https://doi.org/10.3390/w15071423
Submission received: 10 March 2023 / Revised: 31 March 2023 / Accepted: 3 April 2023 / Published: 6 April 2023
(This article belongs to the Section Soil and Water)

Abstract

:
With the majority of the United States Department of Agriculture-Natural Resources Conservation Service (USDA-NRCS)-sponsored earthen dams exceeding their planned service life, seepage is a concern since it is a common failure mechanism among earthen dams as a whole. Seepage occurs when water penetrates a hydraulic barrier to create open pathways, channels, or piping leading to internal erosion or stability issues due to increased effective stress. Due to the complex geometries of these hydraulic structures, time-dependent boundary conditions, and complicated failure analyses, numerical approaches have been used to estimate seepage. However, the existing numerical models are either computationally expensive or assume steady-state conditions. This work develops the framework for using a transient thermal finite element analysis (FEA) model as an analogy to predict transient seepage. The FEA model is compared to a transient analytical model to verify the approach. A sensitivity analysis of the FEA model shows that the time aspect of seepage flow is dependent on the medium, i.e., soil, and not on the fluid properties.

1. Introduction

The movement of water through a medium (seepage) is a topic of concern in multiple disciplines such as irrigation engineering, petroleum engineering, and civil engineering. Seepage occurs when water penetrates a hydraulic barrier, such as soil, and creates open pathways, channels, or piping through the material [1]. Permeable structures can be significantly influenced by seepage due to internal erosion or changes in the effective stress leading to integrity issues. Seepage occurring in earthen dams has been linked as one of the major failure mechanisms from reported incidents of the last decade [2]. Even though seepage is a critical design aspect in a variety of disciplines, numerical predictions of the pressures and/or flow rates are not possible to analytically solve except for simple generalized models [3]. Therefore, researchers have started using empirical, graphical, and numerical approaches, such as finite element analysis (FEA). FEA models can be used for intricate geometries with complex failure mechanisms. Existing numerical models use a generalized form of Richards’ equation in which the hydraulic head of the water is determined with respect to hydraulic conductivity [4]. A limitation of the hydraulic conductivity method is that the original approach is used for a 2D analysis to investigate seepage through lake embankments. A similar approach to the approach in [4] uses an analogy between Darcy flow, i.e., hydraulic head, and the differential heat conduction equation [5,6] to predict propagation and the flux of the flow through the soil. However, the authors consider steady-state conditions without accounting for the changes in the boundary conditions, i.e., dam water levels. As stated by [3], a limitation of FEA models is the mesh generation, i.e., nodal analysis, and extensive computational time. Even though the limitations described in [3] are valid, their mesh-free method neglected the integrity of the dams and focused on seepage prediction only. Numerical models of dam displacements have been previously presented, such as [7,8,9,10], but do not include the effective stress within the dam due to seepage.
The effect of effective stress on dam integrity analysis can be shown by shear failure analysis. The most common shear failure criteria for rocks (and soils) are the Mohr–Coulomb criteria. This theory states that the failure of materials is due to the combination of normal and shear stresses. The normal and shear stresses are determined by the minimum ( σ 3 ) and maximum ( σ 1 ) principal stresses. The failure line is given by Equation (1) where τ f is the shear strength, τ o is the rock cohesion, ϕ is the internal friction angle, μ is the coefficient of internal friction, and σ is the effective normal stress.
τ f = τ o + σ tan ϕ = τ o + σ μ
The normal and shear effective stresses that cause the failure within the rock are given by Equations (2) and (3), respectively, and illustrated in Figure 1.
σ = 1 2 σ 1 + σ 3 + 1 2 σ 1 σ 3 c o s 2 β
τ = 1 2 σ 1 σ 3 s i n 2 β
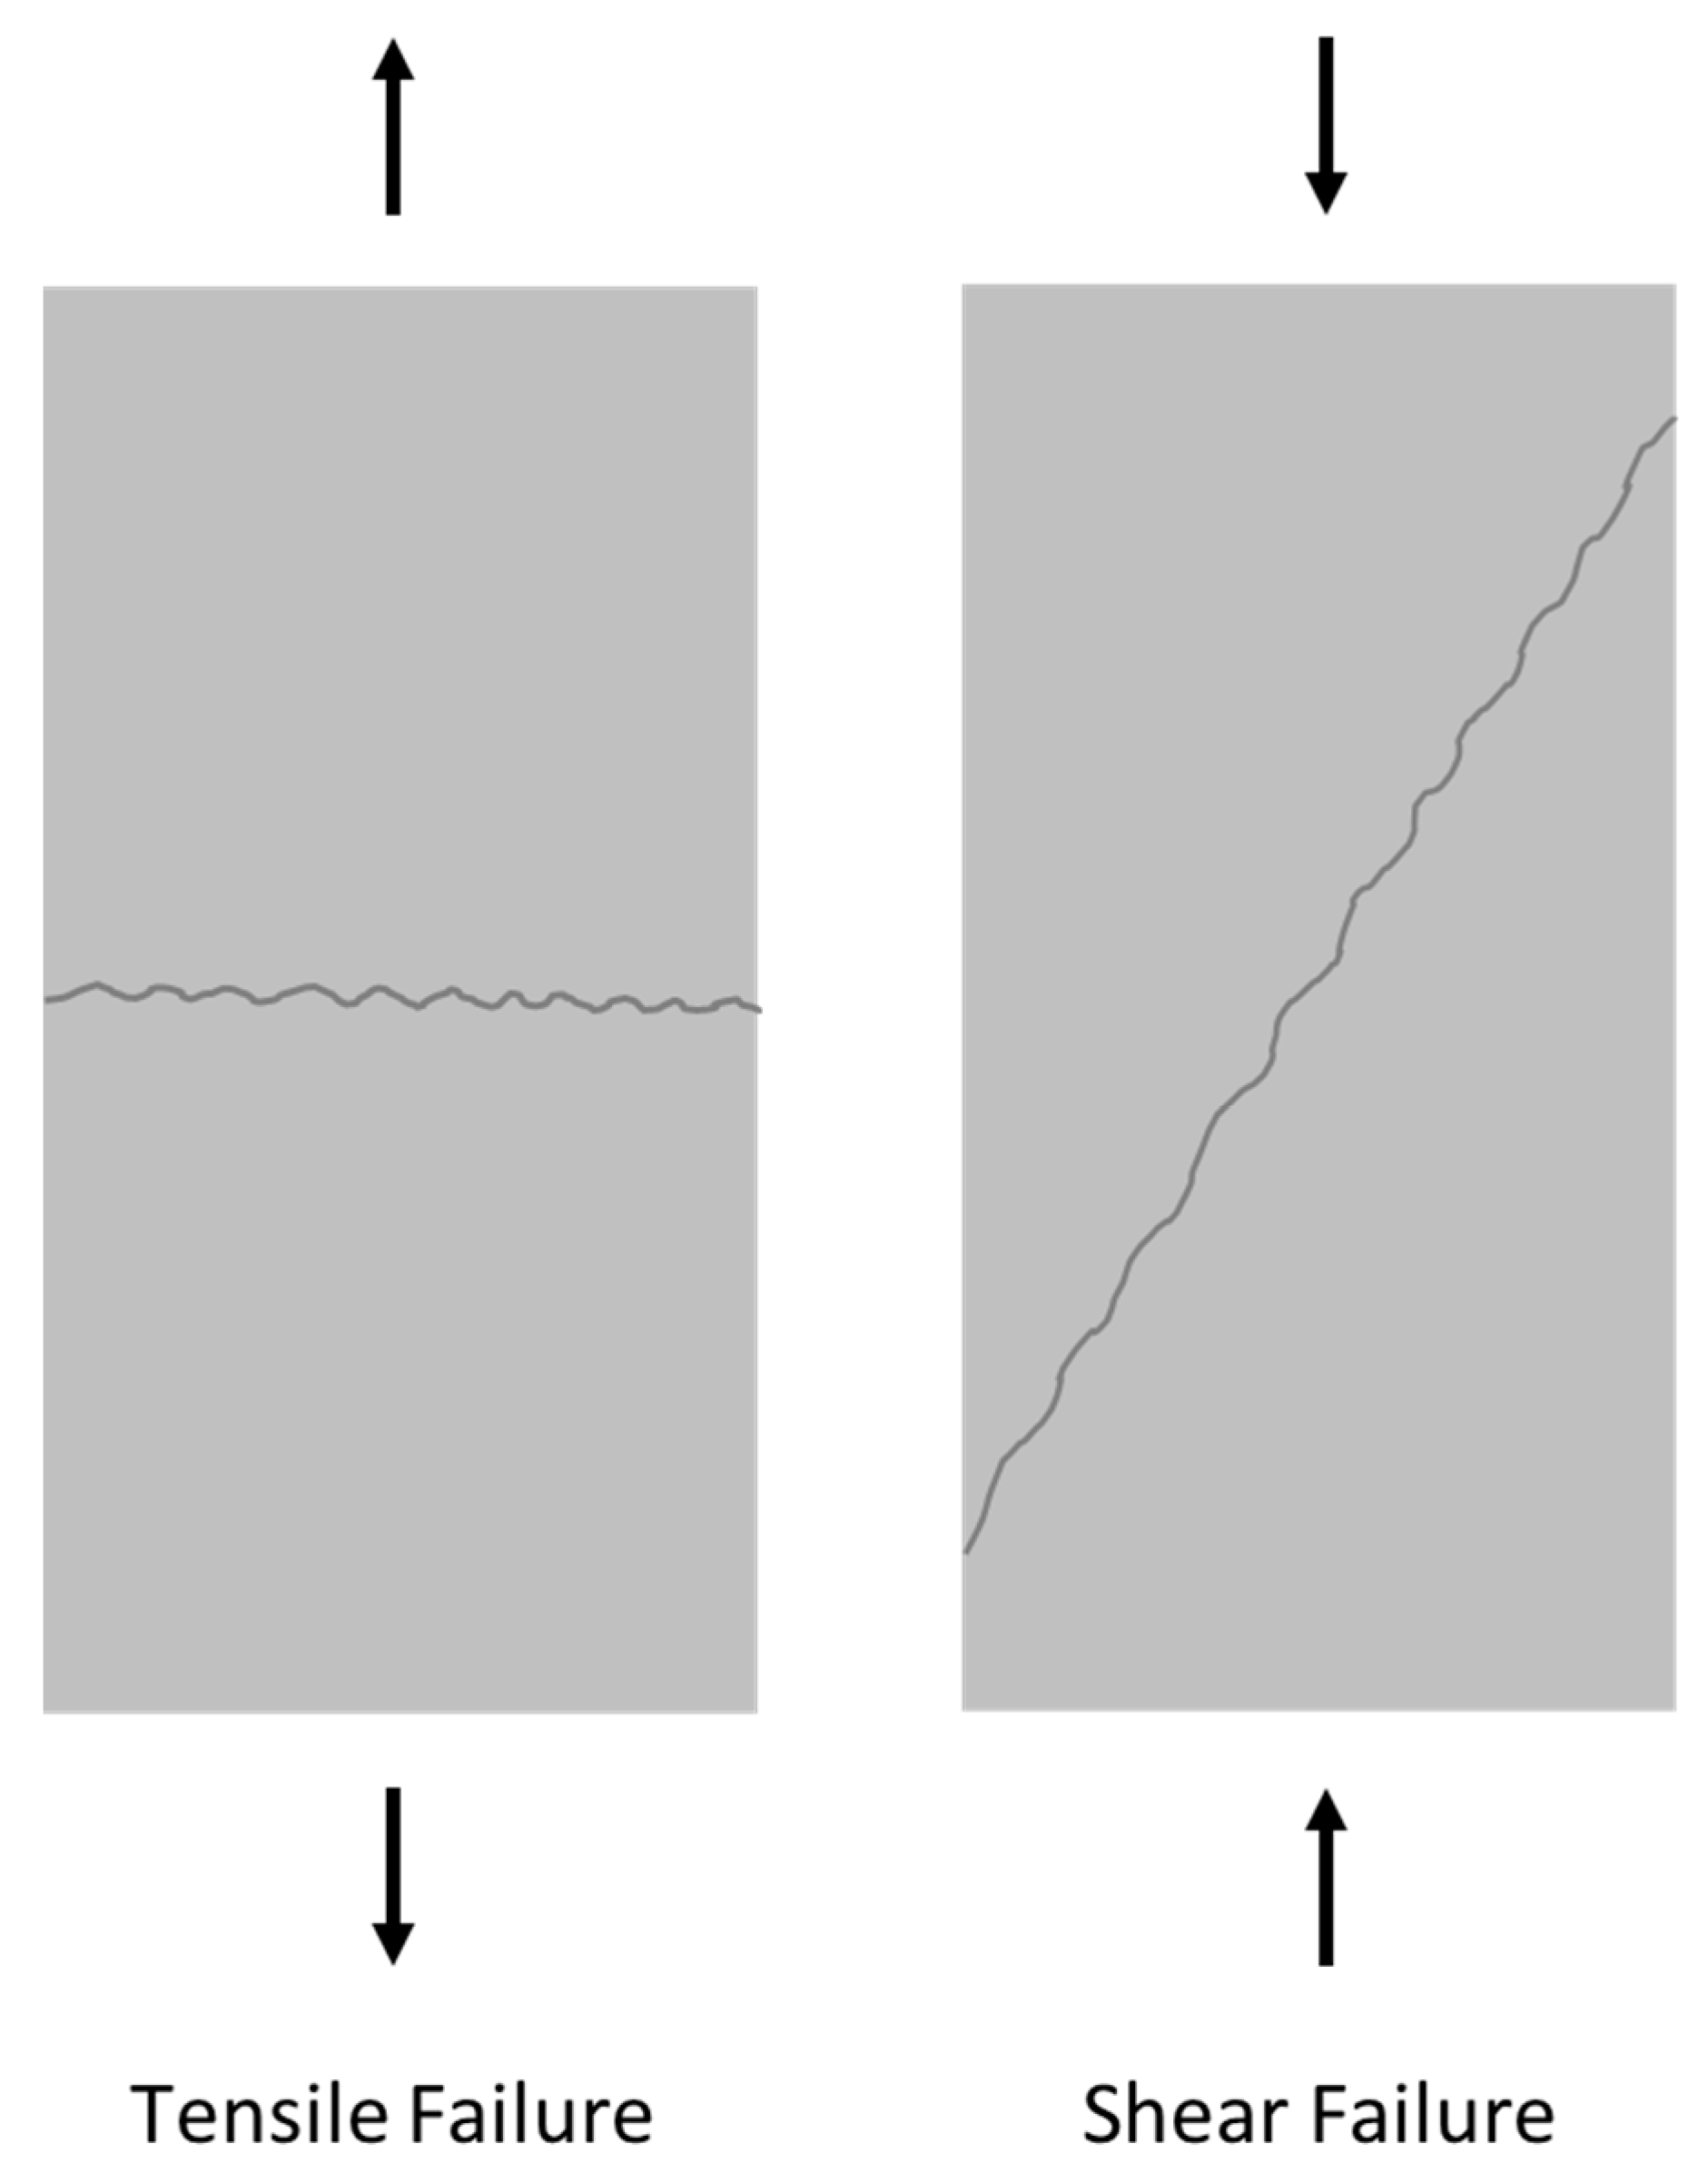
The rock is in shear failure if σ , τ touches or crosses the failure line, τ f . The rock is in tensile failure if σ , τ touches or crosses the shear ( τ ) axis. The concept of shear and tensile failure is illustrated in Figure 2.
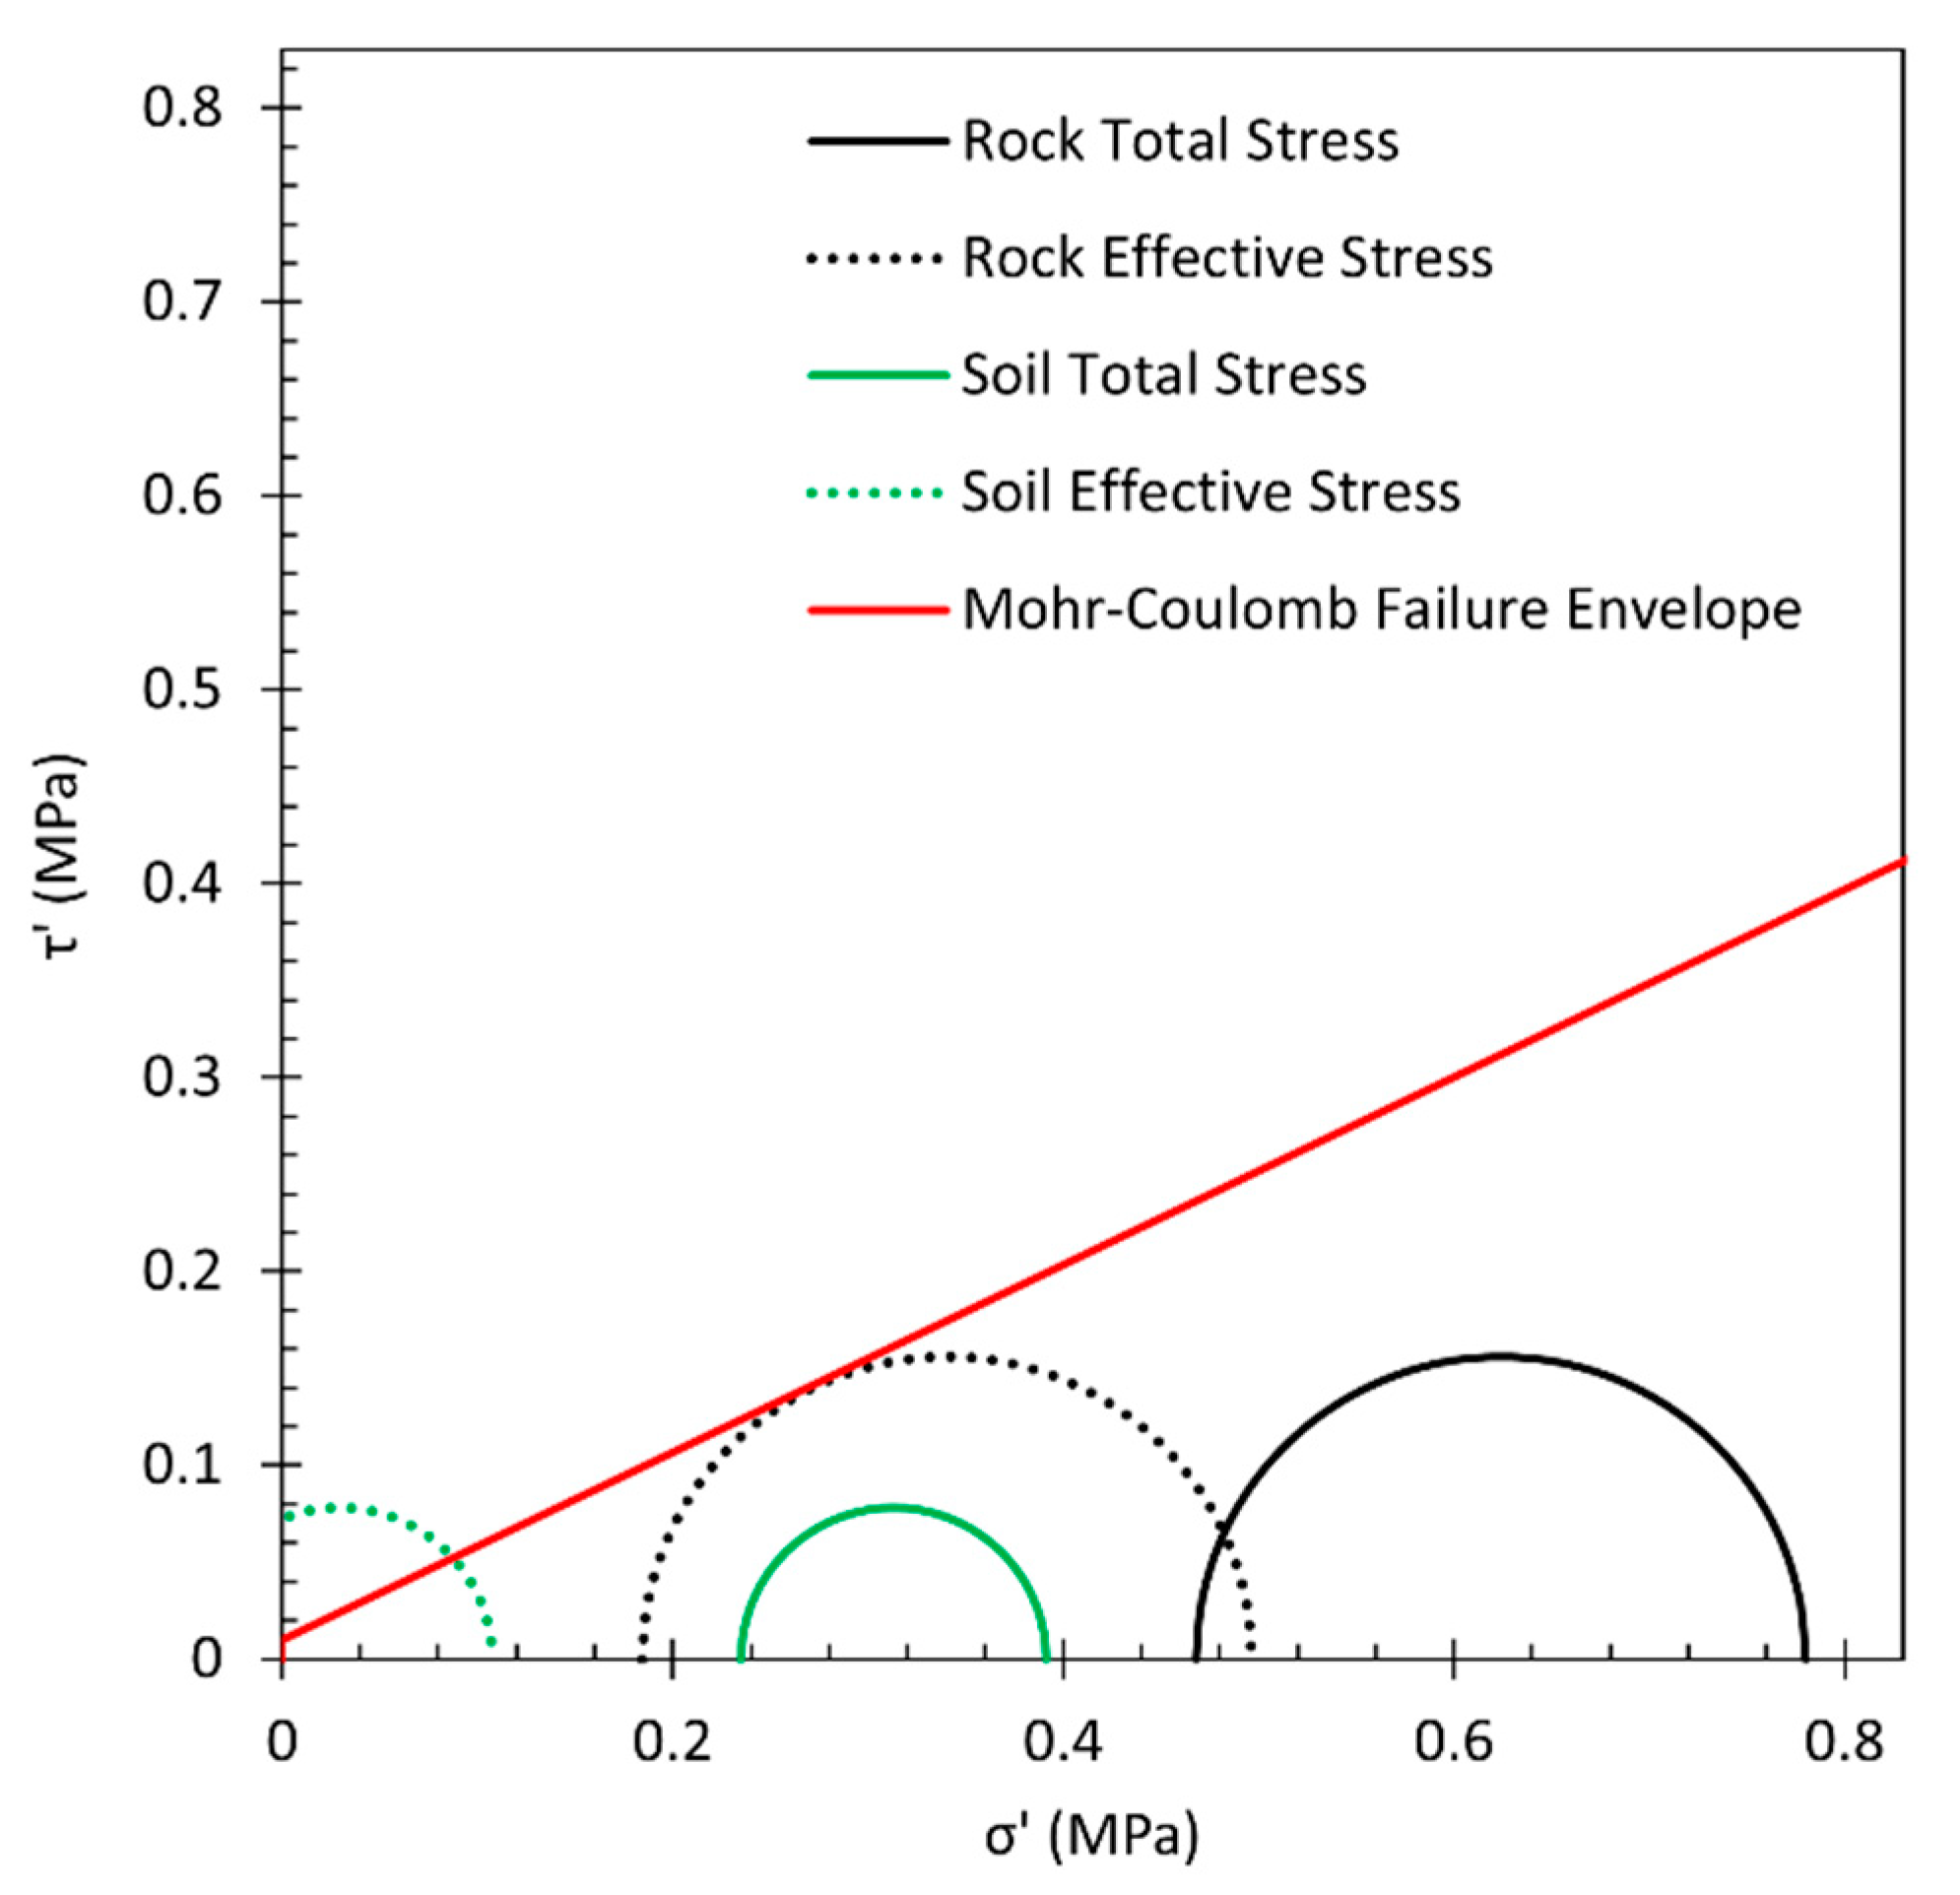
To show the effect seepage pressure can have on a dam, assume a 30 m tall dam constructed out of a homogeneous material with a hydraulic height of 29 m. For comparison purposes, assume the dam is constructed with either soil or rock with common bulk densities of 1.33 g/cc and 2.65 g/cc, respectively [11]. The overburden stress at the base of the dam will be 0.39 MPa (soil) or 0.78 MPa (rock). The hydrostatic head of water would result in a pressure of 0.28 MPa. Assuming soil failure criteria with ϕ = 20° and τ o = 0.01 MPa, the Mohr circle for the total stress of the dam is shown by the solid lines in Figure 3. Assuming 100% seepage occurs, the resulting Mohr circle is represented by a dashed line (green for soil and black for rock).
From Figure 3, seepage can cause the stress to go from total stress to effective stress potentially resulting in shear failure as shown by both the soil and rock effective stresses crossing the Mohr–Coulomb failure envelope. However, this example is assuming a homogeneous material with theoretical bulk densities, dam height, hydraulic height, and steady-state conditions. Since soils are rarely homogeneous, the total stress at the base of the dam will be less, while the hydrostatic pressure stays the same. Therefore, knowing the seepage pressures within earthen dams throughout the transient process is critical in maintaining integrity. Therefore, the objective of this work is to develop a transient seepage FEA model that can be used to determine failure within earthen dams.

2. Materials and Methods

2.1. Analytical Method

The primary assumption is that seepage flows according to Darcy law (Equation (4)).
q D = k D μ P
where q D is the flow velocity (m/s), k D is the permeability (m2), μ is the fluid viscosity (Pa∙s), and P is the pressure gradient (Pa/m).
Using an energy flow analogy for a uniform material, the heat flux can be described by Fourier’s law as
q = k u
where q is the heat flux (W/m2), which can be described as heat flowing per time per unit area, k is the thermal conductivity (W/m∙K), and u is the temperature gradient (K/m). Assuming that the flow velocity is equivalent to the heat flux,
q D = q
Then,
k Δ u Δ x = k D μ Δ P Δ x
k = k D μ Δ P Δ u x x
Assuming the pressure gradient and temperature gradient are equivalent,
Δ P = Δ u
Then,
k = k D μ
Therefore, to relate pore fluid flow, the heat conduction equation can be used by equating the thermal conductivity to the medium permeability divided by the fluid viscosity (Equation (10)). The temperature change is equal to the change in pressure resulting in Equation (11).
q = k D μ Δ u Δ x
Equation (11) represents the steady-state conditions. To account for transient conditions, the relationship in Equation (10) is still valid, but the full heat equation is required. From the heat equation in Equation (5), the gradient can be revised as an ordinary derivative with respect to distance ( x ), resulting in
q = k u x
Assuming that Q = Q ( x , t ) is the internal heat energy per unit volume at each point and time with no outside heat loss or generation, the rate of change in internal heat energy per unit volume in the material, Q / t , is proportional to the rate of change of its temperature.
Q t = c p ρ u t
where c p is the specific heat capacity (J/kg∙K) of the material and ρ is the density (kg/m3) of the material assuming the heat capacity and density remain constant with respect to time. Applying the law of conservation of energy results in Equation (14) in which the rate of heat accumulation is equal to the negative of the derivative of the heat flow at point x ,
Q t = q x
Combining Equations (12)–(14) results in the following transient relationship in one dimension.
u t = 1 c p ρ q x
Substituting Equation (12) into Equation (15) results in Equation (16), which simplifies the 1D heat equation (Equation (17)).
u t = 1 c p ρ x k u x
u t = k c p ρ 2 u x 2
Thermal diffusivity ( α ) is defined in Equation (18), which results in a 1D heat diffusion equation (Equation (19)).
α = k c p ρ
u t = α 2 u x 2
Expanding Equation (19) into three dimensions results in the 3D heat diffusion equation (Equation (20)).
u t = α 2 u x 2 + 2 u y 2 + 2 u z 2
Transient Darcy flow has a similar form to the 3D heat diffusion equation by using the diffusivity equation (Equation (21)). Similar to thermal diffusivity, the pressure diffusivity constant ( α D ) is shown in Equation (22).
P t = α D 2 P x 2
α D = k D μ ϕ c T
From Equation (22), μ is the viscosity of the flowing fluid (Pa∙s), ϕ is the porosity (%), and c T (dimensionless) is the total compressibility. The total compressibility consists of the compressibility of the medium (i.e., rock or soil, c r ) and of the fluid ( c f ) as shown in Equation (23).
c T = c r + c f
Since Equations (19) and (21) follow a similar form, the relationship used in Equation (9) can be used resulting in the relationship shown in Equation (24).
α = α D
k ρ c p = k D μ ϕ c T
Inserting the relationship between thermal conductivity and permeability from Equation (10) into Equation (25) results in the transient relationship between Darcy flow and thermal conductivity.
k ρ c p = k μ μ ϕ c T
c p = ϕ c T ρ
From Equation (27), the porosity and density of the medium (i.e., rock or soil) is known. Assuming the pressures and temperatures of earthen dams are at atmospheric conditions and hydrostatic water pressures, the compressibility of the medium will remain constant with respect to flow, and the compressibility of water is assumed to be constant. Therefore, the total compressibility is negligent resulting in the relationship shown in Equation (28).
c p = ϕ ρ
As shown in Equation (28), the time aspect of the analytical seepage flow is controlled by the porosity ( ϕ ) and the density ( ρ ) of the sample.

2.2. Finite Element Method

Numerical transient thermal finite element analysis (FEA) can be altered to change a transient flow model to a transient porous media flow model by using the relationships shown in Equations (28) and (10). To test the validity of the FEA model, an analytical partial differential equation (PDE) with nonhomogeneous Dirichlet boundary conditions is solved and compared to a transient FEA model. The general solution for the analytical model is shown below.
u t = α u x x
u 0 , t = a
u L , t = b
u x , 0 = f x
u x , t = a + b a L x + n = 1 b n exp n 2 π 2 α t L 2 sin n π x L
b n = 2 L 0 L f x a b a L x sin n π x L d x
Assuming a 1D soil sample of 1 m length has no moisture initially ( u o = 0 ) and is pressurized at one end (0.69 MPa (100 psi)) while the other end is kept at atmospheric conditions (0 MPa), the 1D diffusion equation becomes
u x , t = a 1 x L + n = 1 2 a n π sin n π n π 1 exp n 2 π 2 α t L 2 sin n π x L
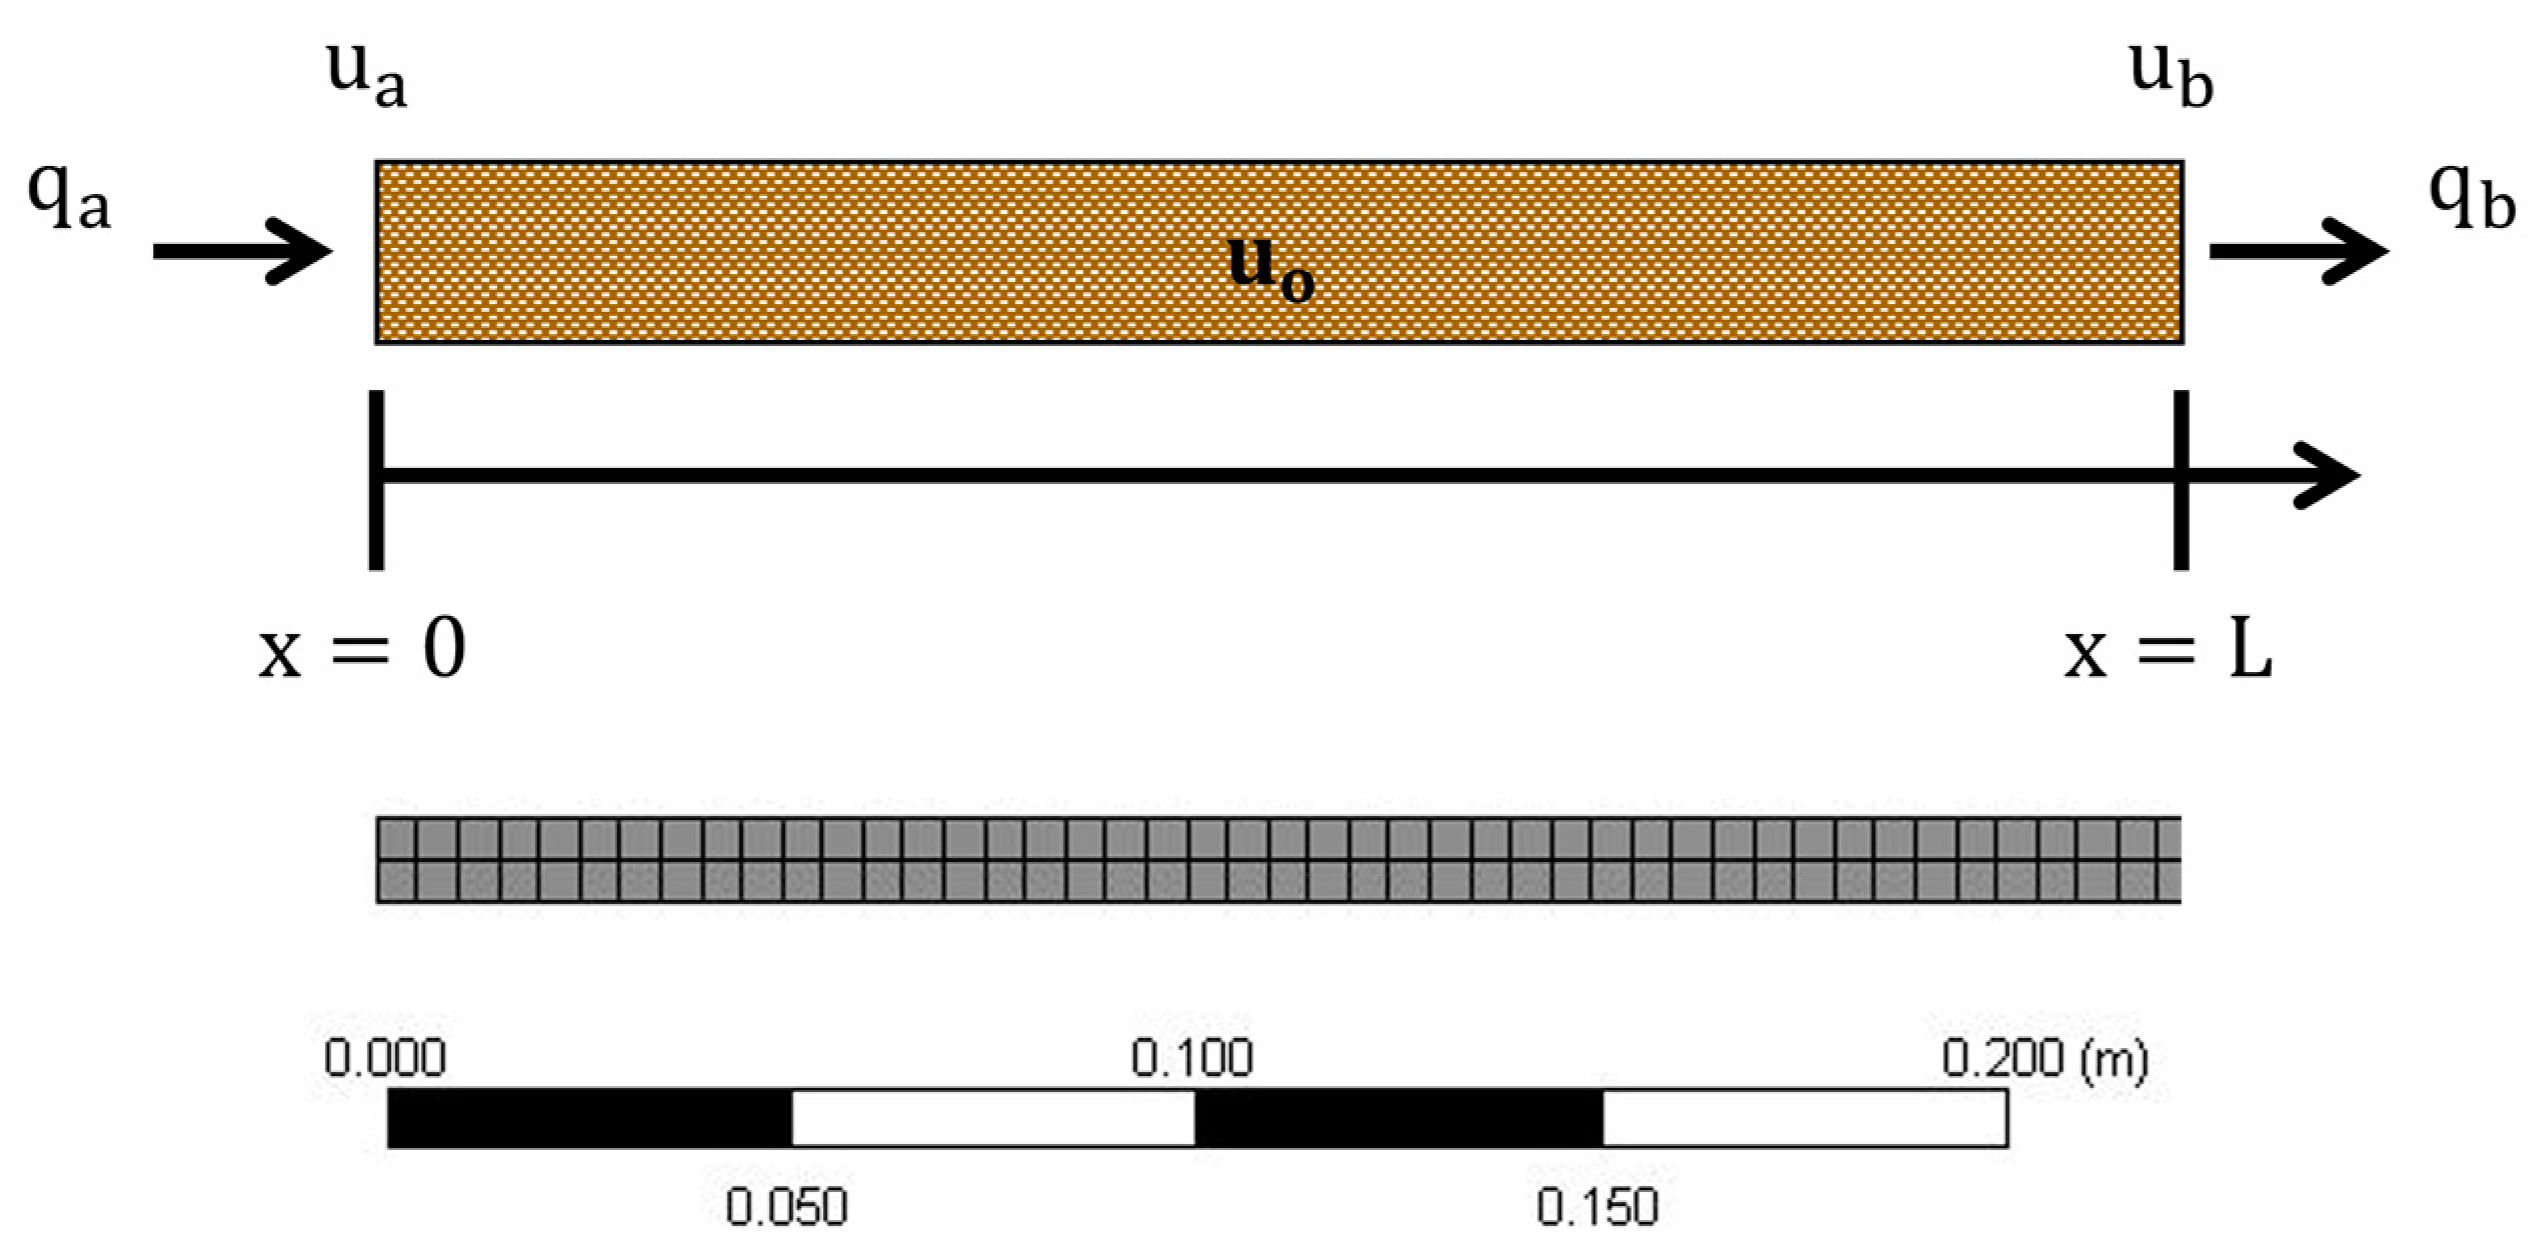
The transient thermal FEA model was created and simulated using ANSYS™ in which a 2D model composed of 400 quadratic PLANE77 brick elements was constructed. Since the FEA model used heat transfer as an analogy to Darcy flow, the pressure was set equal to the temperature value (Equation (9)). The body had an initial temperature of 0 °C ( u o = 0 ), and a constant heat source was applied to one end at 6.89 × 10⁵ °C while the other end was kept at 0 °C. The remaining edges were perfectly insulated to represent a 1D flow model. A schematic of the flow model is shown in Figure 4. The model was simulated from a timespan of 1 year to 10,000 years at order of magnitude intervals to show the time dependence of the system from initial conditions, transient flow, and steady state, i.e., when the flux at the inlet is equal to the flux at the outlet, q a = q b . The input parameters used in the analytical and FEA model are listed in Table 1.
To determine the time required to reach a steady state, Equation (31) is expanded into the first two terms of the series.
F i r s t   T e r m = 2 a π sin π π 1 exp π 2 α t L 2 sin π x L
S e c o n d   T e r m = a π sin 2 π 2 π 1 exp 4 π 2 α t L 2 sin 2 π x L
The ratio of the second to first term is
S e c o n d   T e r m F i r s t   T e r m = 2 a 2 π sin 2 π 2 π 1 exp 4 π 2 α t L 2 sin 2 π x L 2 a π sin π π 1 exp π 2 α t L 2 sin π x L
S e c o n d   T e r m F i r s t   T e r m exp 4 π 2 α t L 2 exp π 2 α t L 2   u s i n g   sin n x n · sin x
S e c o n d   T e r m F i r s t   T e r m exp 4 exp 1   f o r   α T L 2 1 π 2
S e c o n d   T e r m F i r s t   T e r m < 0.050
T L 2 α π 2
From Equation (37), the second term is much smaller than the first term of the series when the time ( T ) is larger than or equal to the expression in Equation (38). Therefore, solving for Equation (38) results in a time of 2.53 × 10¹⁰ s ( 803 years) for the system to reach steady-state conditions.

3. Results

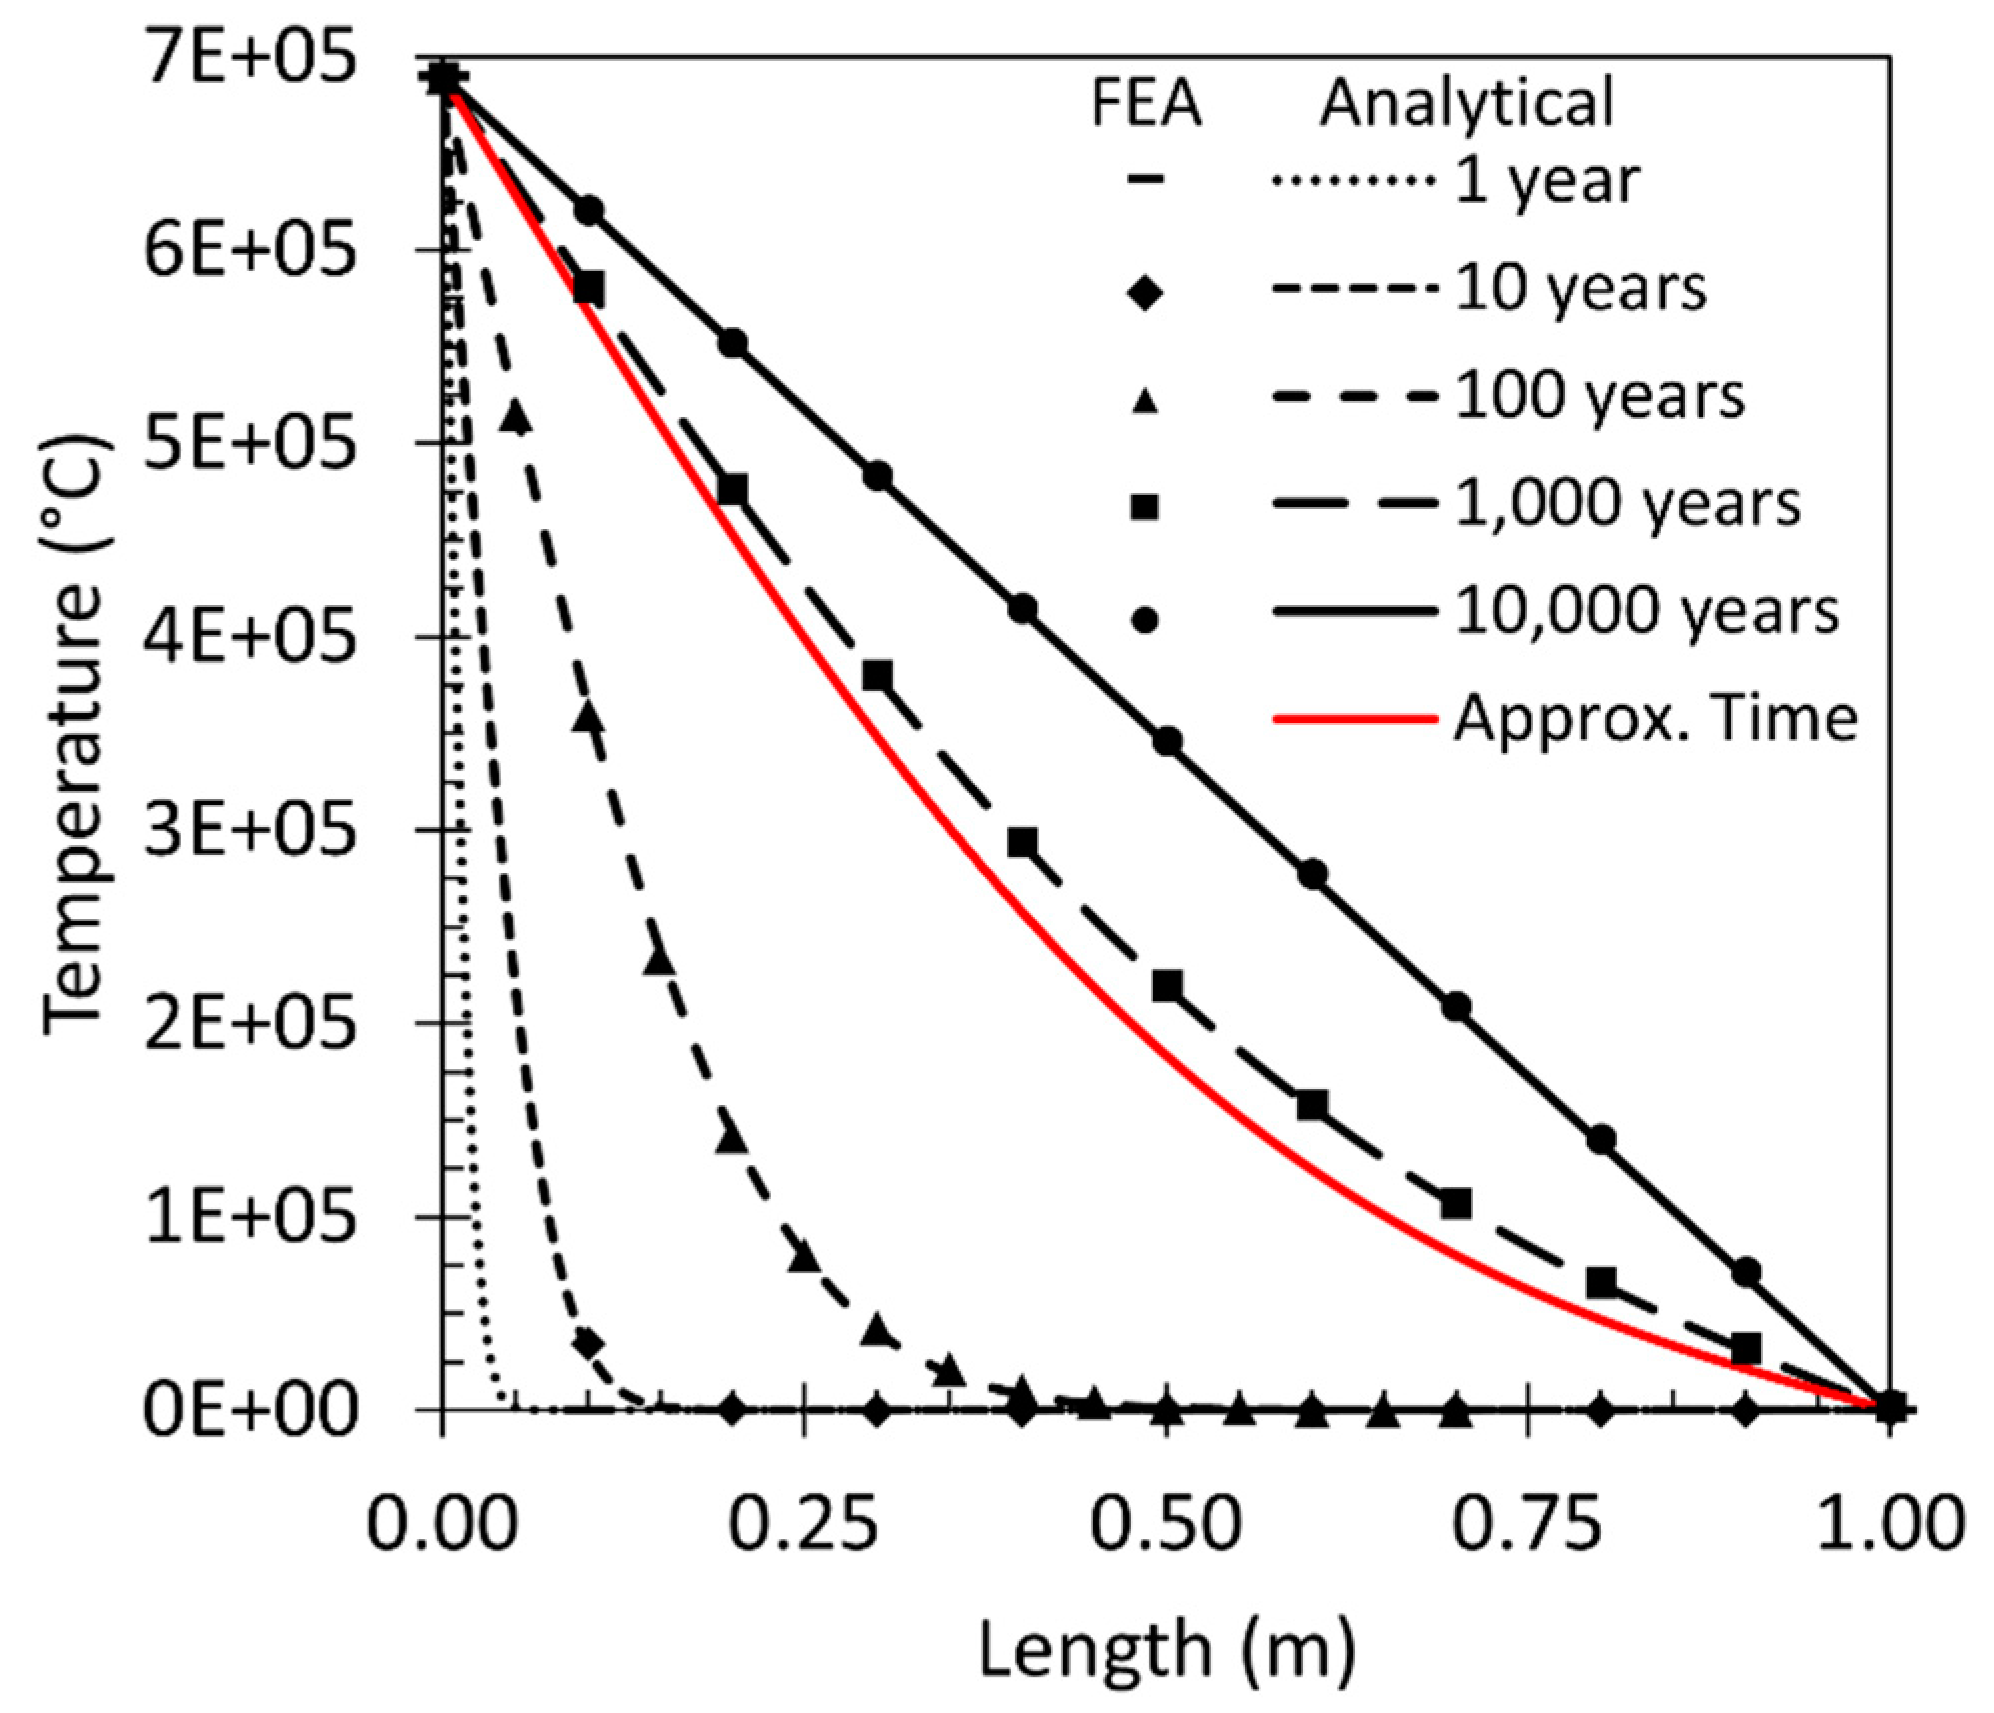
The result for the pressure distribution along the length of the sample with respect to time for the analytical and numerical (FEA) model is shown in Figure 5 with different time intervals ranging from 1 year to 10,000 years. The analytical model is represented by the lines (solid and different dashes) while the FEA model is shown by data points. The approximate time for steady-state conditions based on Equation (38) is represented by the solid red line. As shown in Figure 5, the FEA model agrees with the analytical solution for the different time intervals ranging from transient to steady-state conditions.
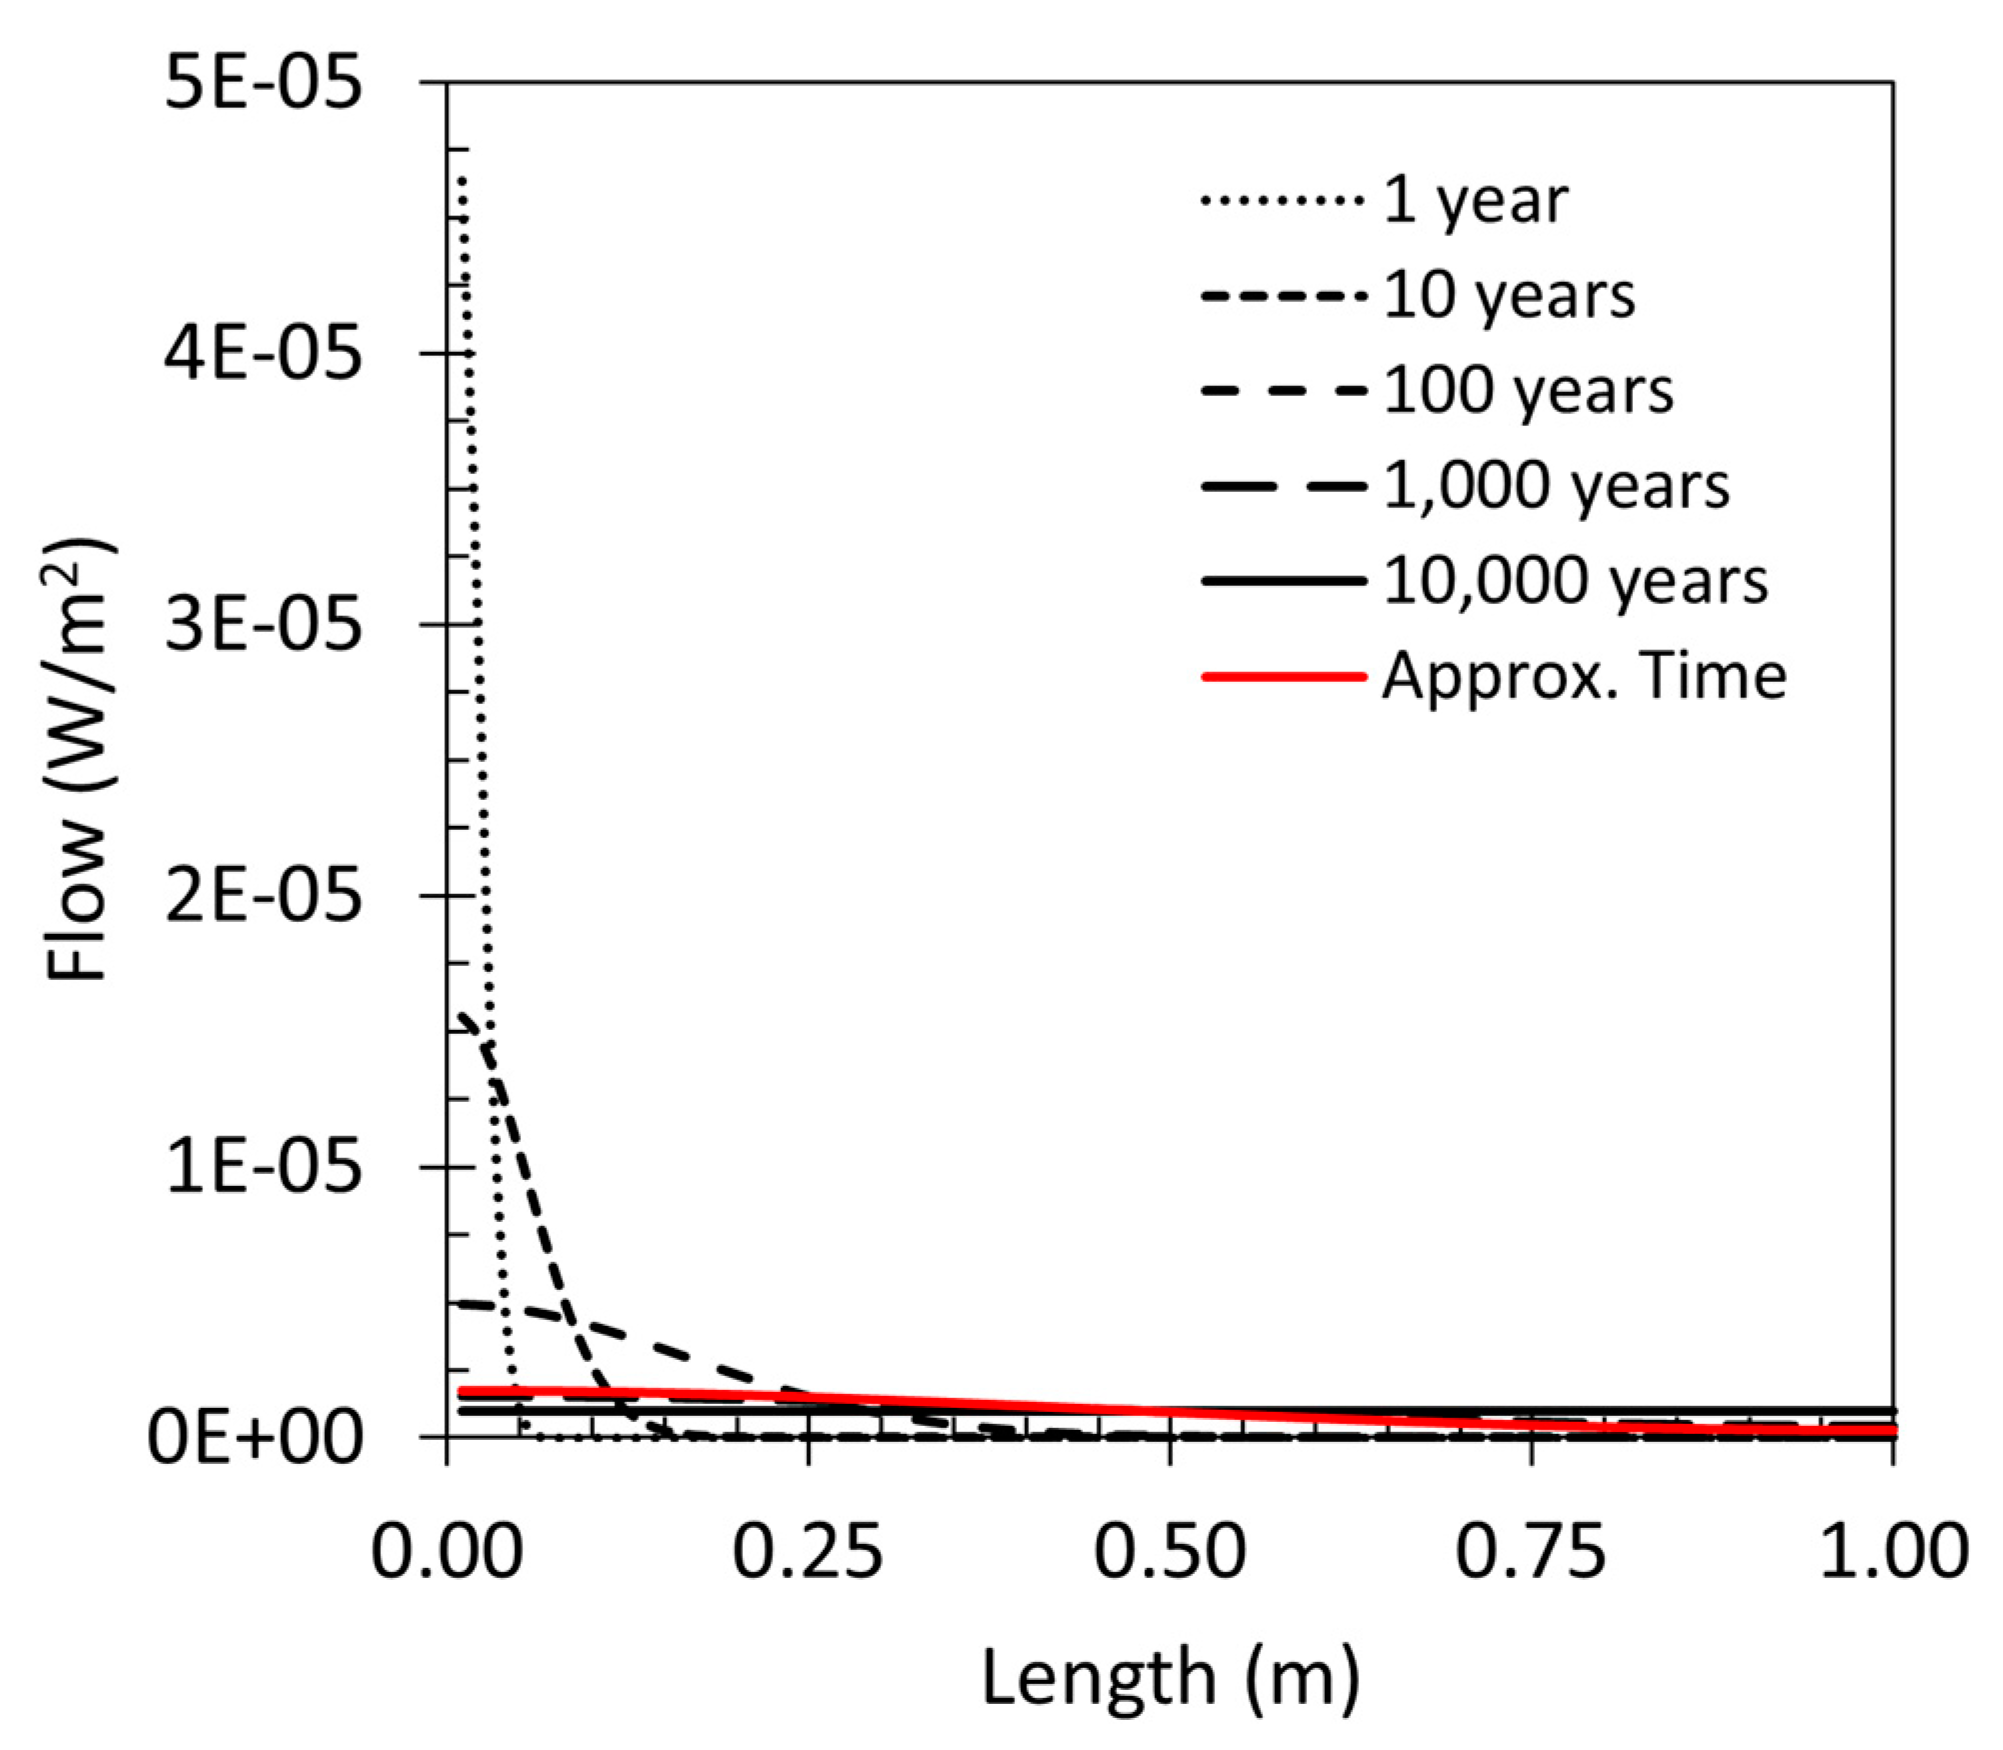
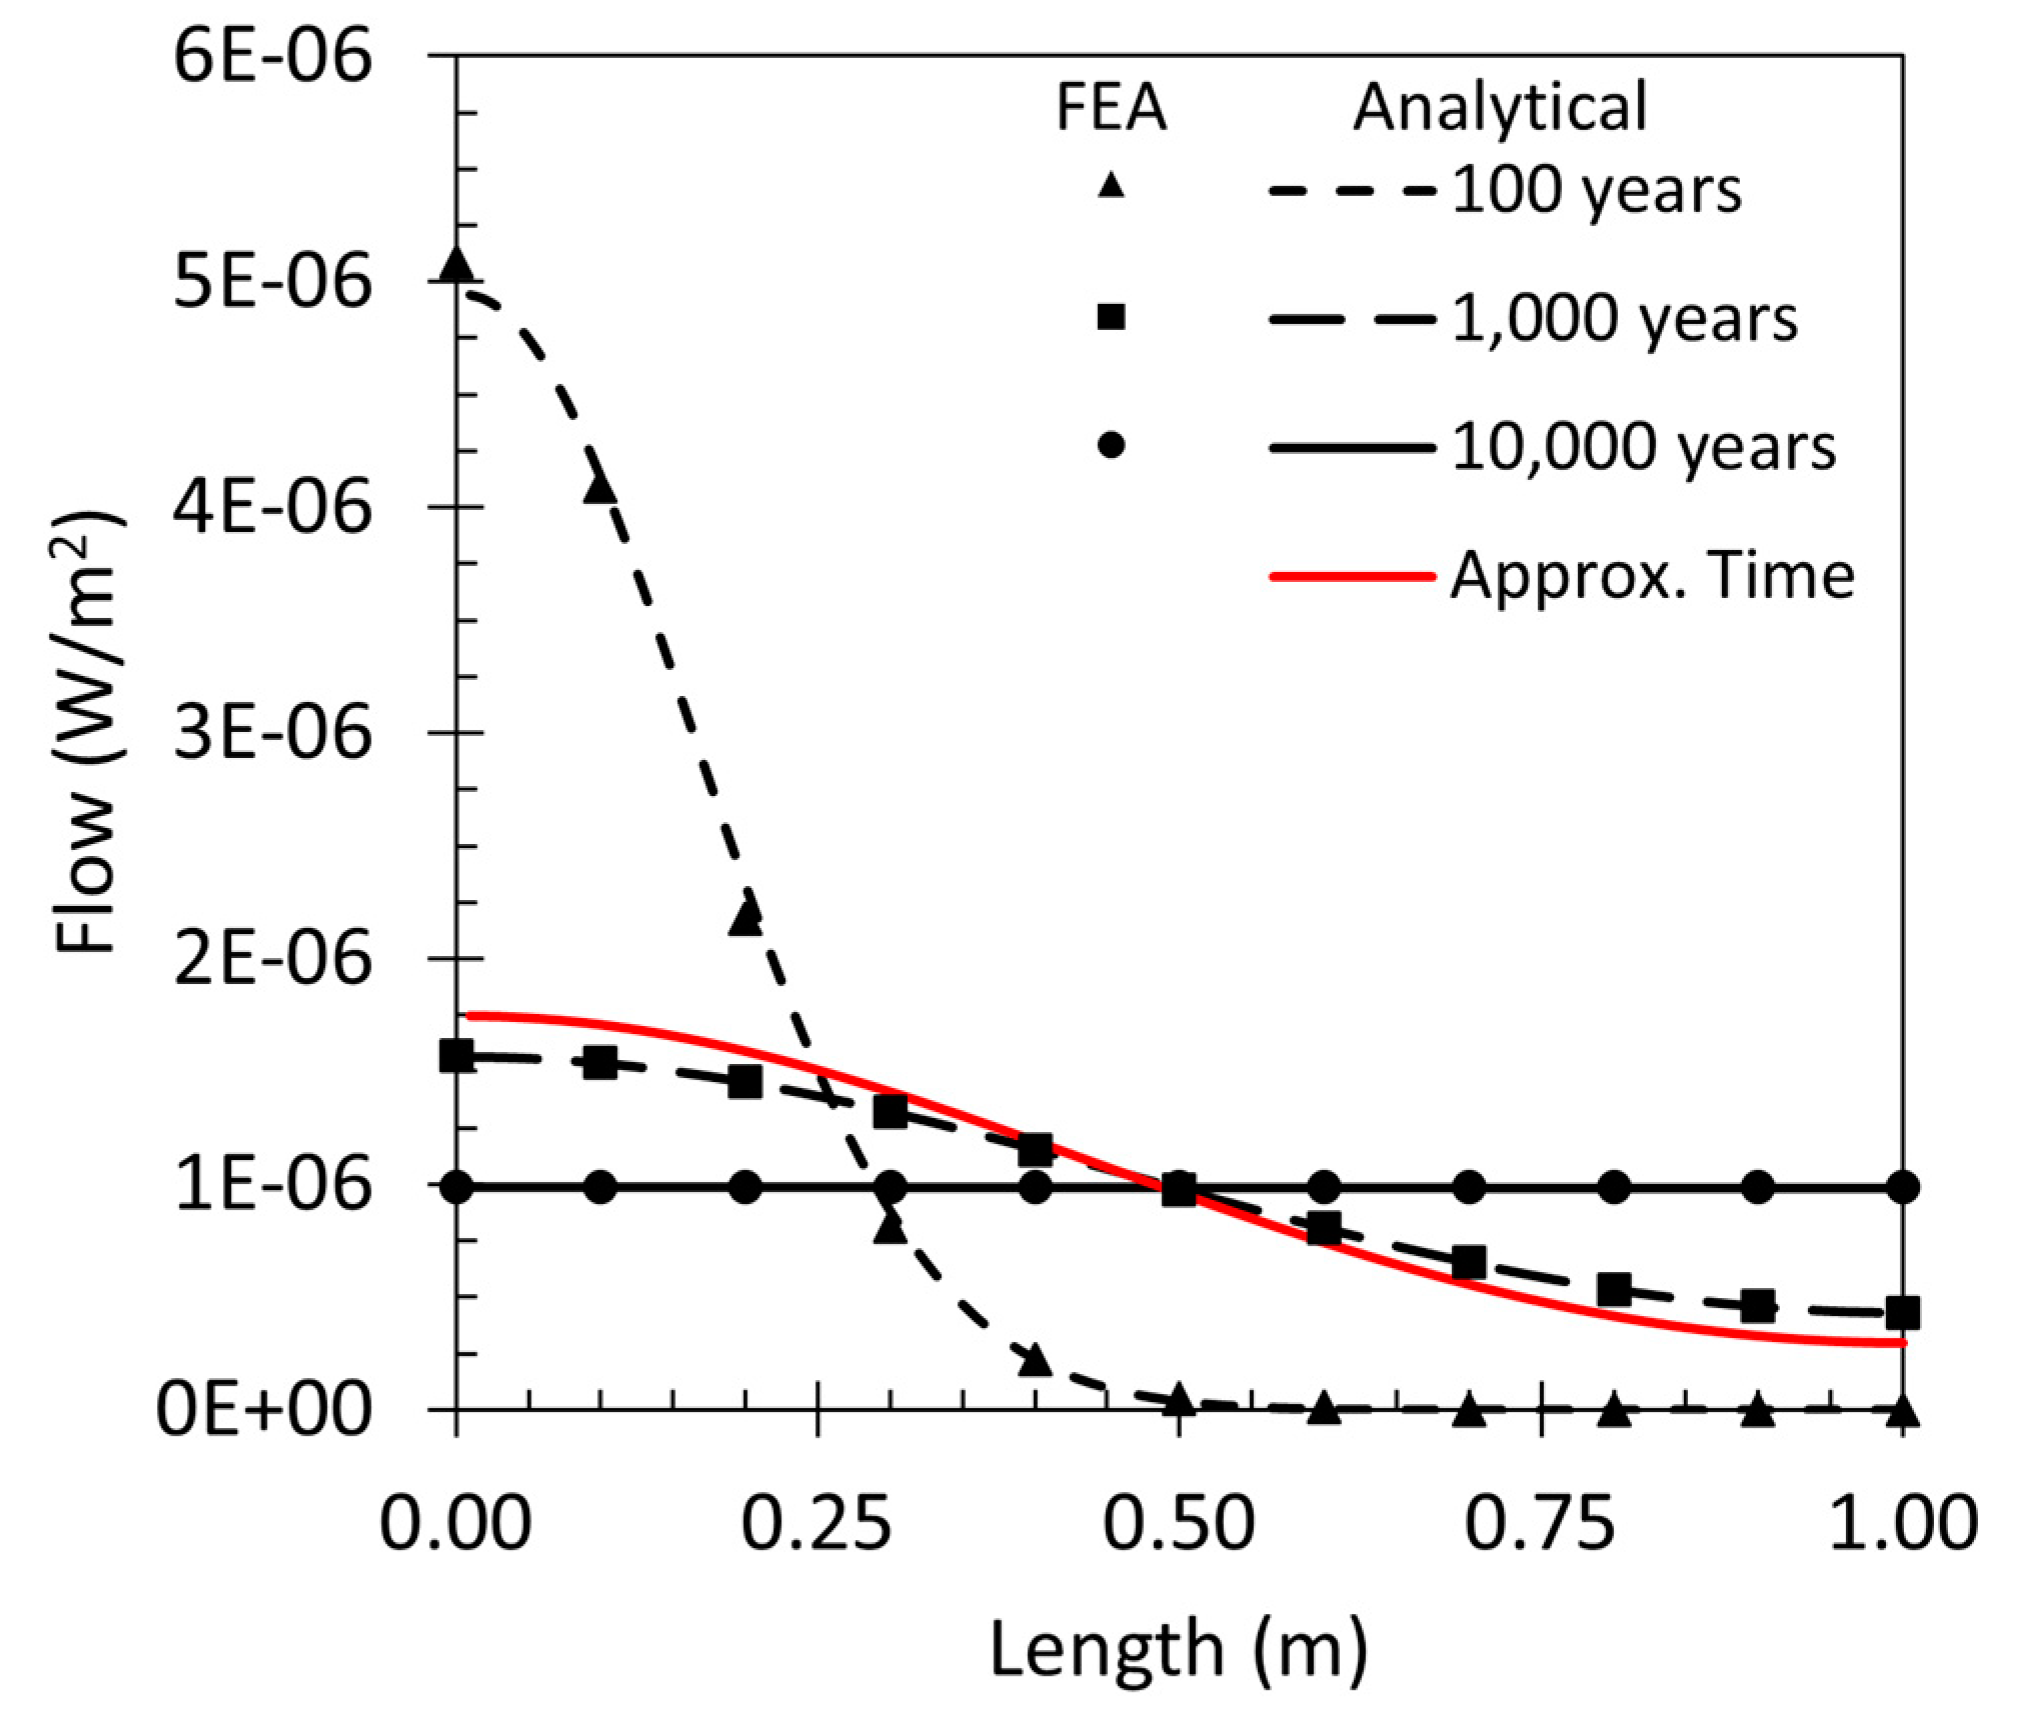
The flow rate distribution along the sample with the same time intervals is shown in Figure 6. Figure 6 shows the large discrepancy from the inlet to the outlet with relatively short time periods (1 and 10 years). Since the flow rate of the 1-year time interval dominates the y-axis of Figure 6, a zoomed-in region showing the 100–10,000-year time intervals is displayed in Figure 7. Figure 7 shows the agreement between the FEA model (data points) and the analytical solution (lines and dashes). The minimum, maximum, and average flow across the sample at the different time intervals is shown in Table 2.
From the results of Figure 5 and Figure 6 and Table 2, the transient FEA model agrees with the 1D analytical heat equation. The individual points along the length of the sample are in agreement between the FEA model and the analytical solution. The average flow of the 1D heat models, for time intervals of 803, 1000, and 10,000 years, are within 0.8% of the theoretical Darcy flow (Equation (4)).

4. Discussion

From Figure 7, determining steady-state flow is not straightforward. It is obvious that the time intervals of 1, 10, and 100 years are in transient conditions since the outlet has zero flow. The 10,000-year interval is in a steady-state condition since the flux is constant throughout the length of the sample. However, the approximate steady-state time (803 years) and 1000-year intervals are not constant, even though, according to Equation (38), 803 years should result in an approximate steady-state flow. As shown in Table 2, the difference between the average flow of the approximate time of the steady-state flow and the flow at 10,000 years is 0.8% even though the maximum and minimum flows of the approximate time are ±78% of the steady-state flow at 10,000 years. Regardless of the exact definition of when the model reaches a steady state, the 1 m length takes at least 800 years to be in steady-state conditions. USDA-NRCS originally constructed earthen dams with a 50-year planned service life, but today new and/or rehabilitated dams are designed with a 100-year planned service life [12]. For 1 m to take 800 years, a 30 m tall dam with slopes of 3:1 will take significantly longer for the fluid to penetrate the hydraulic barrier. Therefore, assuming an earthen dam is built correctly with no voids/pathways within the material, seepage should not be a concern.
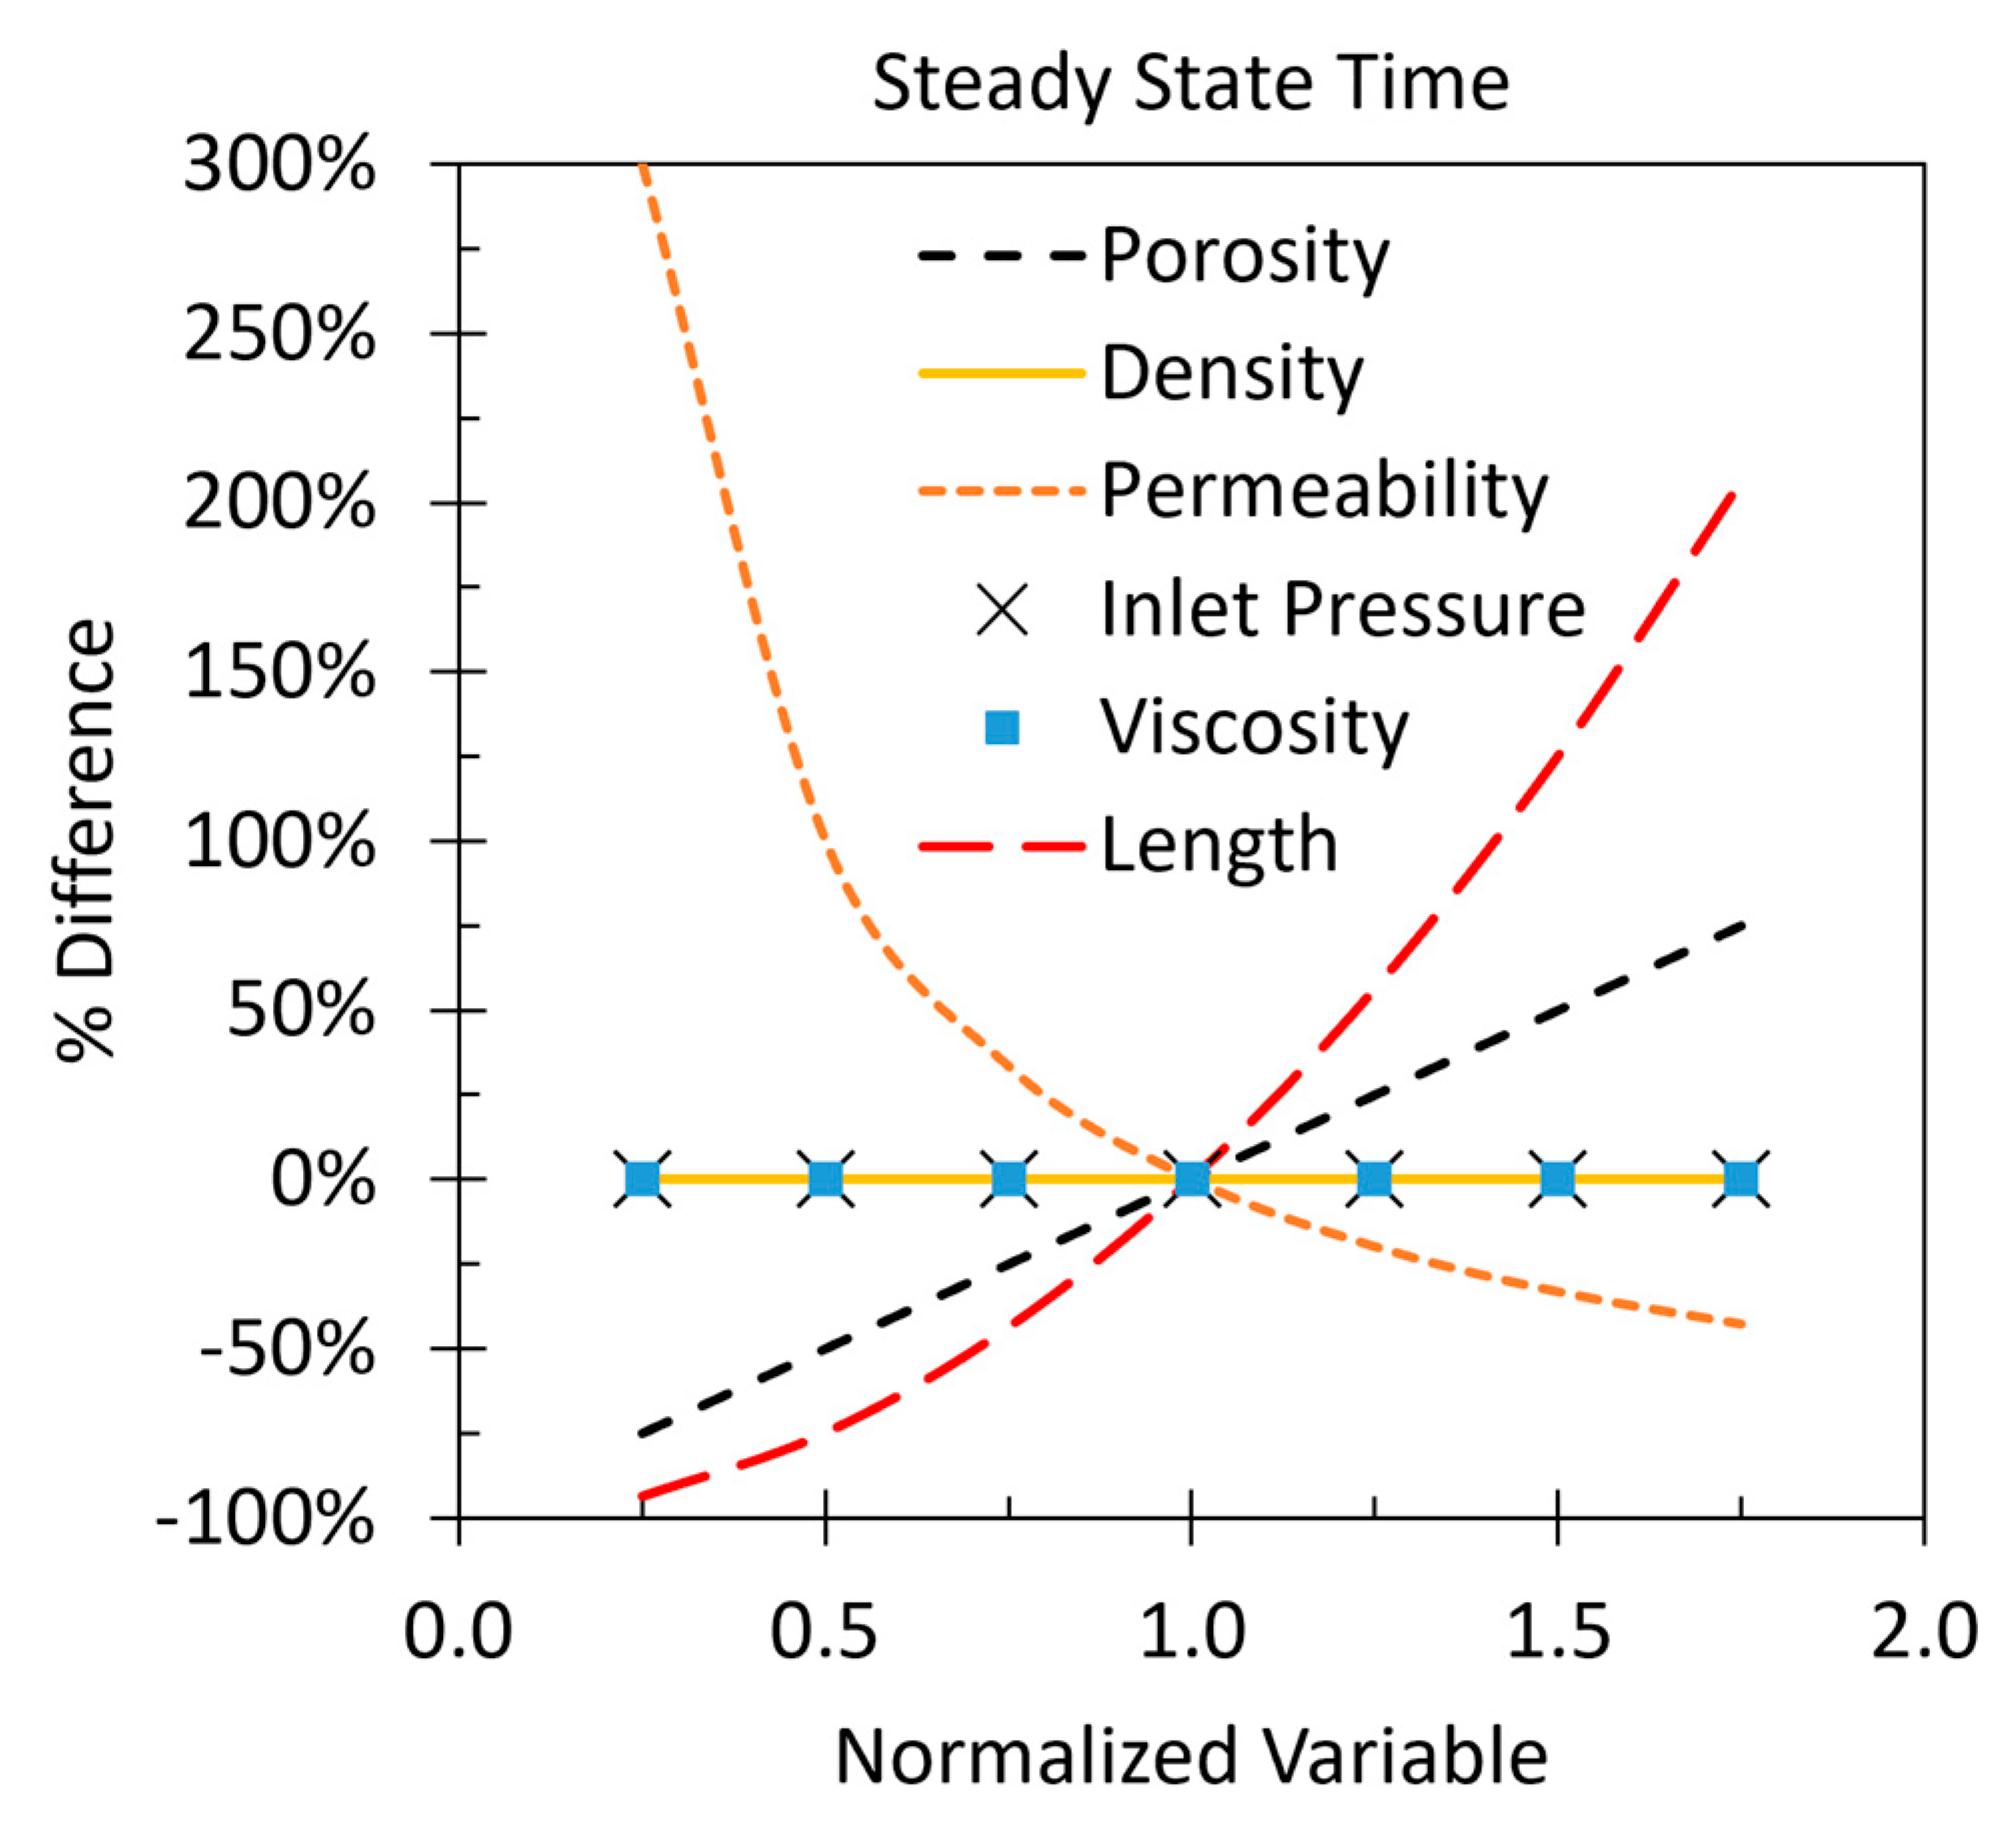
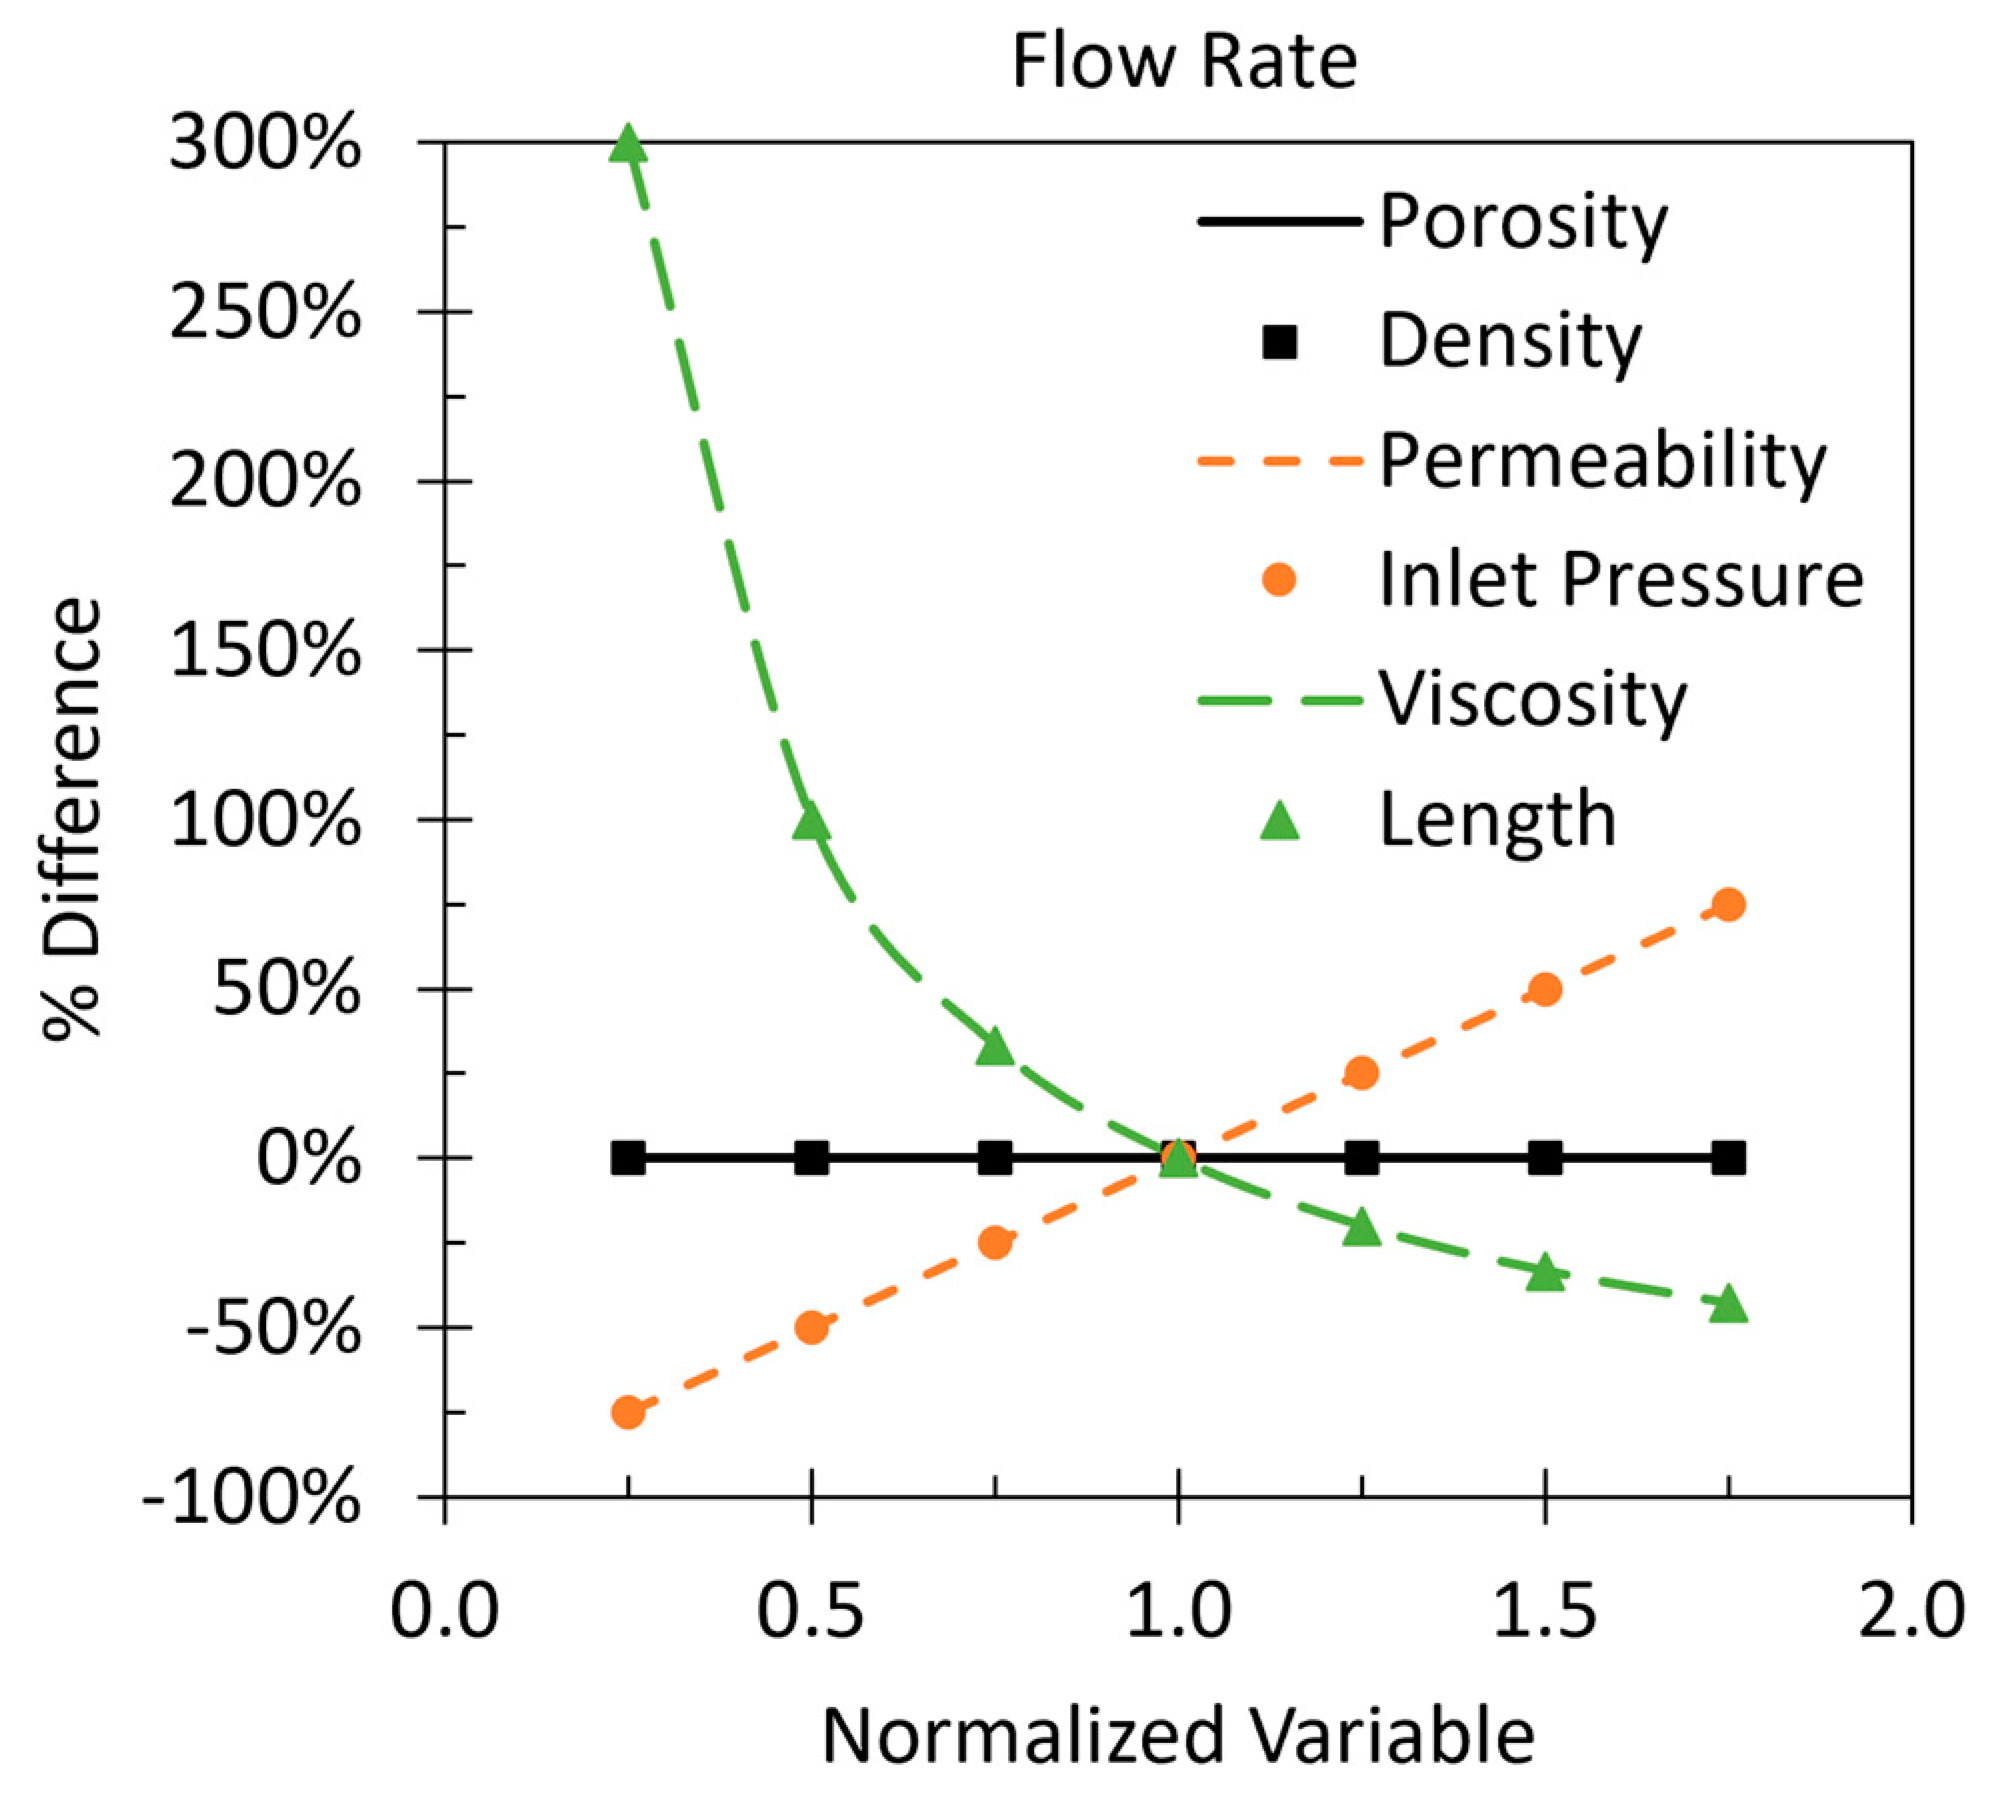
To investigate the sensitivity of the model, a parametric study was performed by varying the porosity, density, permeability, inlet pressure, viscosity, and length by ±75% of the original values stated in Table 1. The variables were compared based on the approximate time the system will take to reach a steady state (Equation (38)) and the steady-state flow rate (Equation (11)). The values used in the parametric study are shown in Table 3. The results are shown in Figure 8 for steady-state time and in Figure 9 for steady-state flow rate.
The approximate steady-state time is only dependent on the permeability, porosity, and length of the system. All the other soil and fluid properties do not affect the transient properties of fluid seepage. The permeability has a nonlinear effect, in which as the permeability decreases, the time required to reach a steady state increases exponentially, whereas as the permeability increases, the time required decreases nonlinearly. The porosity has a linear effect such that the porosity decreases as the time required decreases, and the porosity increases as the time increases. The length of the system has a nonlinear effect similar to the permeability, except as the length gets longer the time increases and vice versa. The time for the system to reach approximate steady-state conditions is only dependent on the medium (i.e., soil) properties, not the fluid properties.
From the results in Figure 9, the steady-state flow is dependent on the permeability, length, fluid viscosity, and pressure differential (i.e., inlet pressure in this case). The length and fluid viscosity had the same effect while the permeability and inlet pressure had the same effect. The density of the material did not affect the steady-state time or the flow rate in either parametric analysis. However, it should be noted that, even though the soil properties were treated as independent variables, the porosity, permeability, and density are interconnected with each other. The porosity and permeability are directly related to the density, i.e., compaction, of the soil. Therefore, if one changes, the others are likely to change as well.

5. Conclusions

Prediction of earth dam seepage using a transient thermal FEA model was presented in this work. The FEA model was verified with an analytical PDE with nonhomogeneous Dirichlet boundary conditions by comparing the heat distribution with respect to time throughout the sample. The verification model with a length of 1 m took over 800 years to reach steady-state conditions. Therefore, based on the properties stated in this work and assuming a well-built dam, steady-state seepage should not be a concern. A sensitivity analysis of the model was performed and showed that the time aspect of seepage flow is dependent only on the medium (i.e., soil) and not the fluid properties (permeability, porosity, and length) whereas the flow rate is dependent on the soil permeability, length, fluid viscosity, and pressure differential. Future work will include the extraction of the transient seepage pressures to be used in a transient slope stability analysis of earthen dams.

Author Contributions

Conceptualization, J.W. and M.A.D.; methodology, J.W. and M.A.D.; software, J.W. and M.A.D.; validation, J.W., M.A.D. and S.H.; formal analysis, J.W. and M.A.D.; investigation, J.W. and M.A.D.; resources, S.H.; data curation, J.W. and M.A.D.; writing—original draft preparation, J.W. and M.A.D.; writing—review and editing, J.W., M.A.D. and S.H.; visualization, J.W. and M.A.D.; supervision, J.W. and M.A.D.; project administration, S.H. All authors have read and agreed to the published version of the manuscript.

Funding

This research received no external funding.

Data Availability Statement

The data presented in this study are available on request from the corresponding authors.

Acknowledgments

The USDA is an equal opportunity provider and employer. Mention of trade names or commercial products in this publication is solely for the purpose of providing specific information and does not imply recommendation or endorsement by the U.S. Department of Agriculture.

Conflicts of Interest

The authors declare no conflict of interest.

References

  1. FEMA P-911; Assessing Dams and Impoundments: A Beginner’s Guide. USDA US Forest Service: Washington, DC, USA, 2017.
  2. Association of State Dam Safety Officials (ASDSO). Dam Failure Incident Driver. 2022. Available online: https://damsafety.org/dam-failures (accessed on 7 September 2022).
  3. Fadaei-Kermani, E.; Shojaee, S.; Memarzadeh, R.; Barani, G.A. Numerical simulation of seepage problem in porous media. Appl. Water Sci. 2019, 9, 79. [Google Scholar] [CrossRef] [Green Version]
  4. McBride, M.S.; Pfannkuch, H.O. The distribution of seepage within lakebeds. J. Res. US Geol. Surv. 1975, 3, 505–512. [Google Scholar]
  5. Aniskin, N.A.; Antonov, A.S. Using Mathematical Models to Study the Seepage Conditions at the Bases of Tall Dams. Power Technol. Eng. 2017, 50, 580–584. [Google Scholar] [CrossRef]
  6. Alekseevich, A.N.; Sergeevich, A.A. Numerical Modelling of Tailings Dam Thermal-Seepage Regime Considering Phase Transitions. Model. Simul. Eng. 2017, 2017, 7245413. [Google Scholar] [CrossRef] [Green Version]
  7. Dardanelli, G.; Pipitone, C. Hydraulic Models and Finite Elements for Monitoring of an Earth Dam, by Using GNSS Techniques. Period. Polytech. Civ. Eng. 2016, 61, 421–433. [Google Scholar] [CrossRef] [Green Version]
  8. Zhou, W.; Li, S.; Zhou, Z.; Chang, X. InSAR Observation and Numerical Modeling of the Earth-Dam Displacement of Shuibuya Dam (China). Remote. Sens. 2016, 8, 877. [Google Scholar] [CrossRef] [Green Version]
  9. Gordan, B.; Adnan, A.; Aida, M.A.K. Soil Saturated Simulation in Embankment during Strong Earthquake by Effect of Elasticity Modulus. Model. Simul. Eng. 2014, 2014, 1–7. [Google Scholar] [CrossRef] [Green Version]
  10. Szostak-Chrzanowski, A.; Massiéra, M. Relation between monitoring and design aspects of large earth dams. In Proceedings of the 3rd IAG Symposium on Geodesy for Geotechnical and Structural Engineering and 12th FIG Symposium on Deformation Measurements, Baden, Austria, 22–24 May 2006. [Google Scholar]
  11. Schueler, T.; Holland, H.K. The compaction of urban soils. Watershed Prot. Tech. 2000, 3, 661–665. [Google Scholar]
  12. Caldwell, L. USDA Watershed Programs Facts and Figures: A Reservoir of Watershed Program Information; U.S. Department of Agriculture Natural Resources Conservation Service (NRCS), Conservation Engineering Division: Washington, DC, USA, 2020.
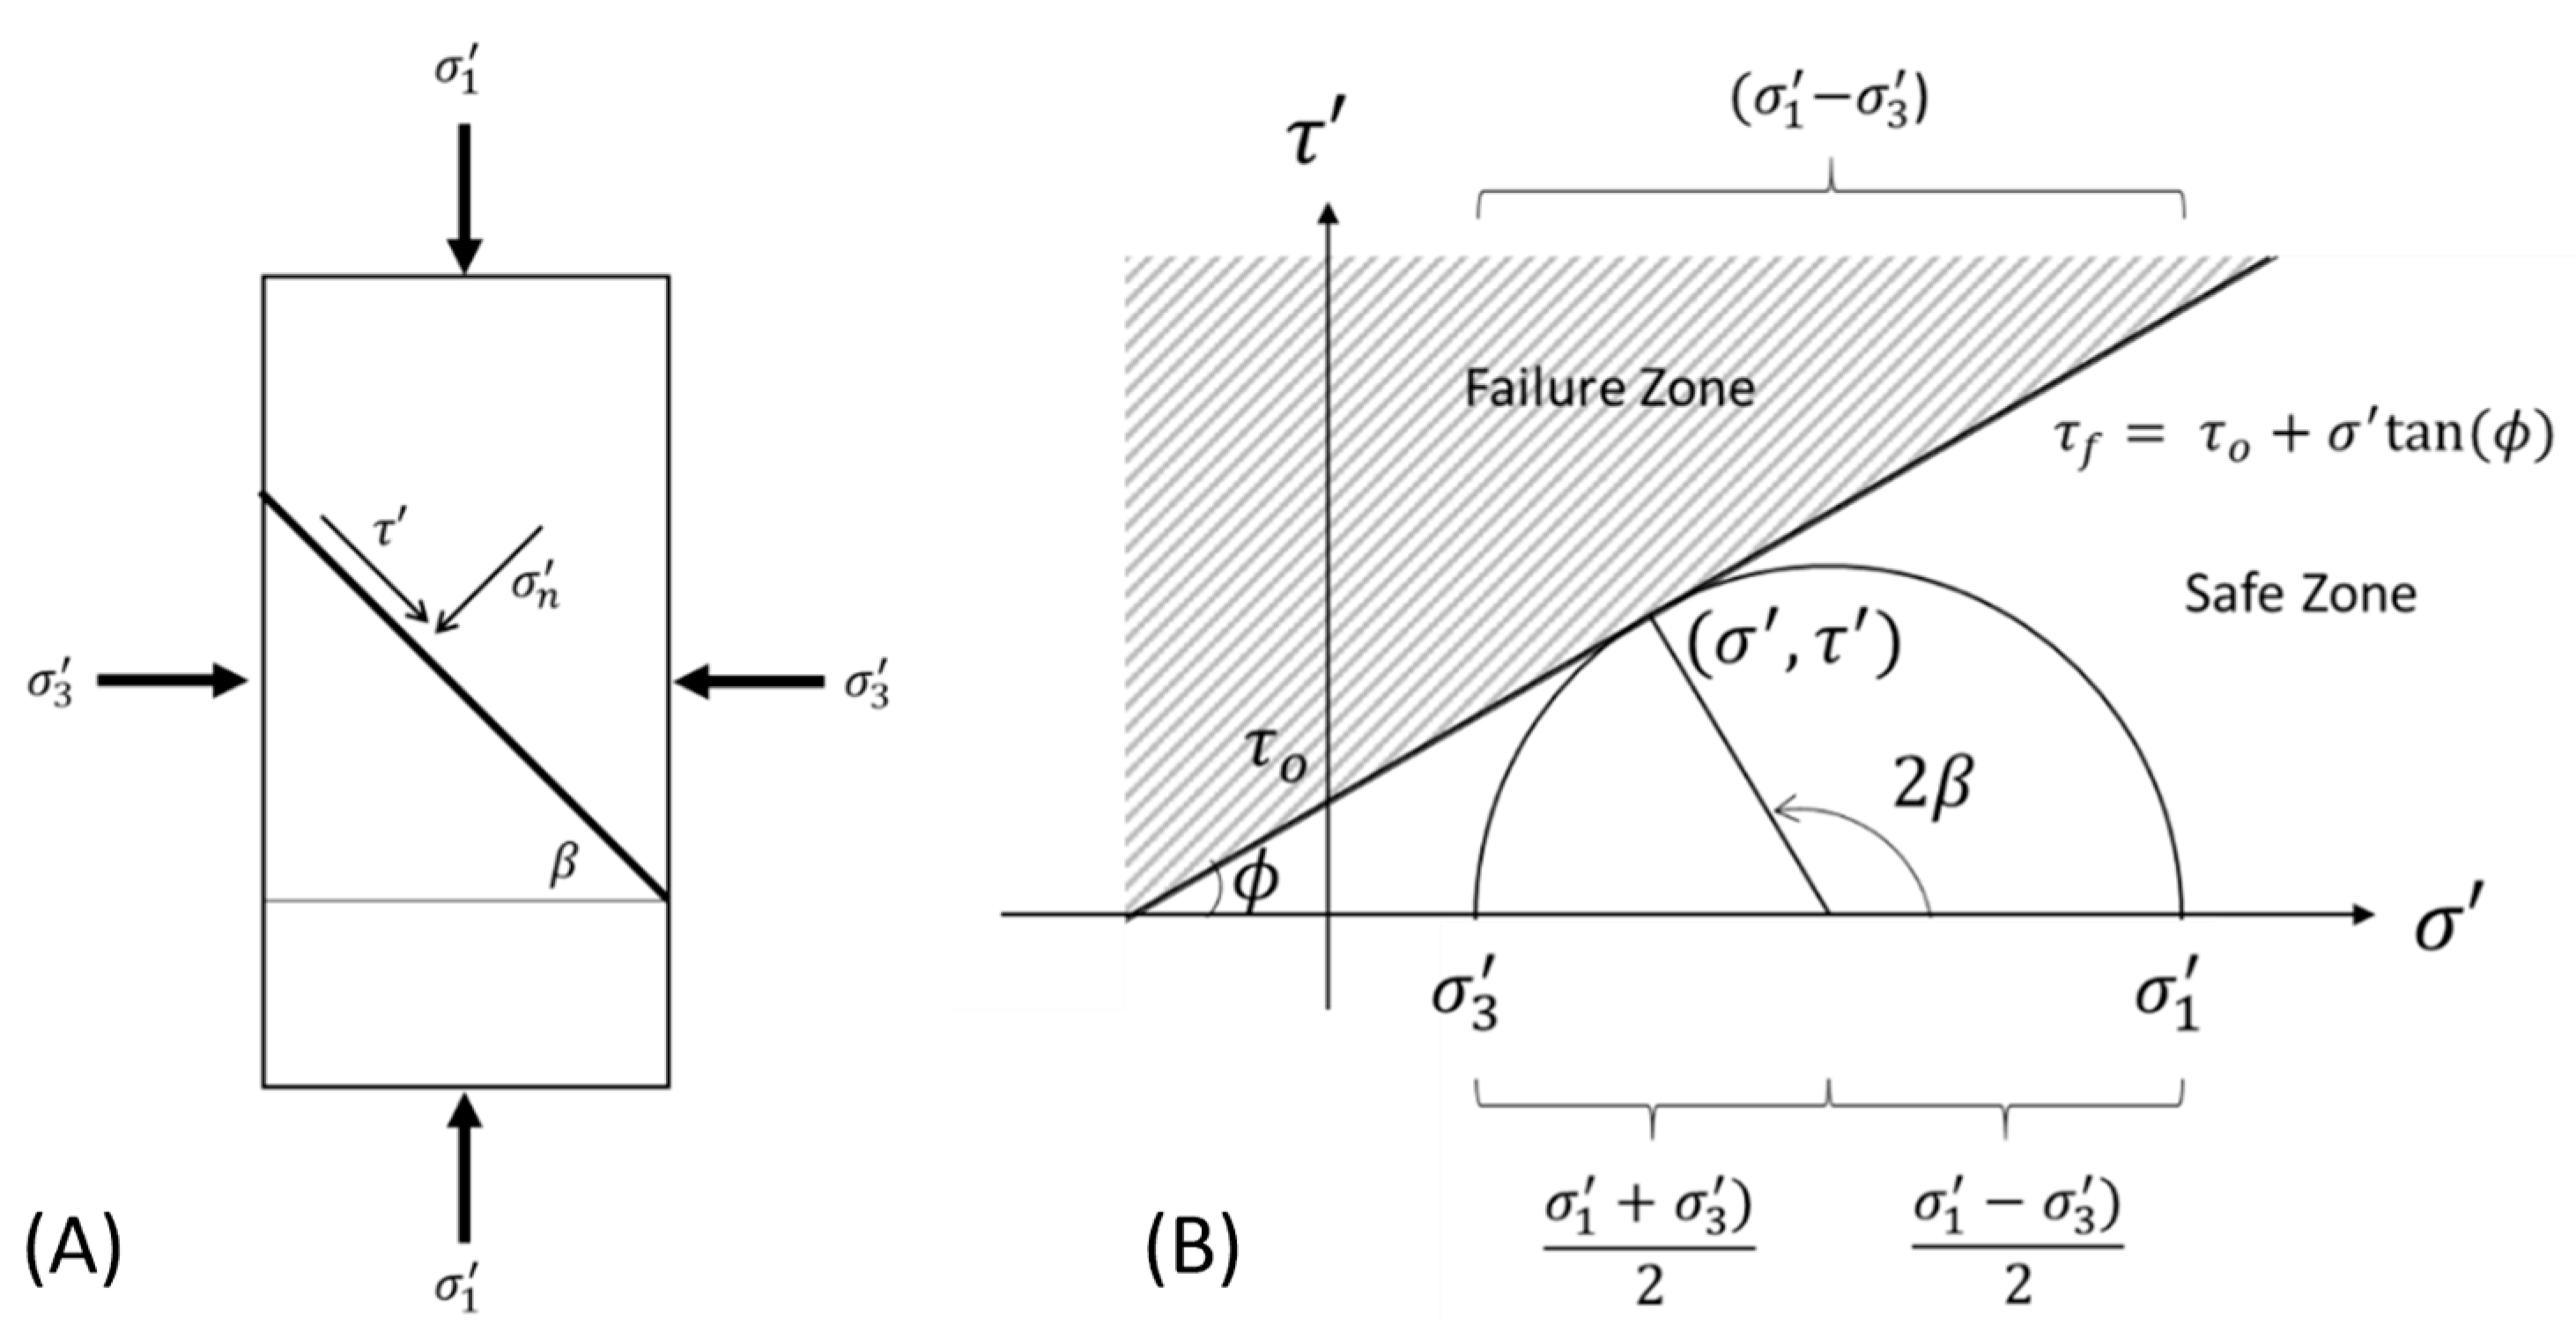
Figure 1. (A) Mohr–Coulomb failure criteria of a cylindrical sample. (B) Mohr circle depicting the failure criteria.
Water 15 01423 g001
Figure 2. Illustration of tensile and shear failure of a 2D cylindrical sample. The arrows indicate the direction of the force being applied to the sample.
Water 15 01423 g002
Figure 3. Mohr–Coulomb failure criteria for dry soil and rock (green and black, respectively) and a “seepage” soil/rock assuming complete seepage of the hydrostatic head of water.
Water 15 01423 g003
Figure 4. (Top): Schematic of the 1D flow model used in the analytical and FEA model comparison. (Bottom): Snapshot of a portion of the gridded FEA model and the corresponding scale.
Water 15 01423 g004
Figure 5. Pressure distribution along the sample with time intervals ranging from 1 year to 10,000 years. The analytical solution is represented by solid and dashed lines while the FEA model results are depicted by data points. Note that the FEA results are in agreement with the analytical solution.
Water 15 01423 g005
Figure 6. Flow rate along the length of the sample from time intervals of 1 year to 10,000 years. B) Zoomed-in flow rates from 100 years to 10,000 years to show the transition from transient to steady-state flow.
Water 15 01423 g006
Figure 7. Zoomed-in flow rates from Figure 6 for time intervals of 100 years to 10,000 years to show the transition from transient to steady-state flow. The FEA model is represented by the data points, and the analytical model is shown by the lines/dashes.
Water 15 01423 g007
Figure 8. Parametric study of the system variables with respect to steady-state time.
Water 15 01423 g008
Figure 9. Parametric study of the system variables with respect to steady-state flow rate.
Water 15 01423 g009
Table 1. Input parameters used in the analytical and FEA models.
Darcy FlowHeat Equation
VariableValueVariableValue
u a ( P a ) 6.89 × 10⁵ u a ( ° C ) 6.89 × 10⁵
u a P a 0.00 u a ( ° C ) 0.00
u o ( P a ) 0.00 u o ( ° C ) 0.00
L ( m ) 1.00 L m 1.00
ρ ( k g / m 3 ) 1.72 × 10³ ρ ( k g / m 3 ) 1.72 × 10³
k D ( m 2 ) 1.43 × 10⁻¹⁵ k ( W / m · K ) 1.43 × 10⁻¹²
μ ( P a · s ) 1.00 × 10⁻³ α ( m 2 / s )4.00 × 10⁻¹²
ϕ 35.7% c p ( J / k g · K )2.07 × 10⁻⁴
Table 2. Minimum, maximum, and average flow across the sample at the specified time intervals compared to the theoretical Darcy flow (Equation (4)) from the parameters in Table 1. Note that if the sample has a minimum flow of zero, the average flow was not considered.
Min. FlowMax. FlowAvg. FlowTheoretical Darcy Flow
(W/m2)(W/m2)(W/m2)(m/s)
1 year0.00 × 1005.15 × 10−5
10 years0.00 × 1001.61 × 10−5 9.85 × 10⁻⁷
100 years0.00 × 1005.09 × 10−6
Approx. time2.96 × 10−72.96 × 10−79.93 × 10−7
1000 years4.32 × 10−71.57 × 10−69.90 × 10−7
10,000 years9.86 × 10−79.86 × 10−79.86 × 10−7
Table 3. Sensitivity analysis parameters with the max, min, and base case values.
VariableMin.BaseMax
u a ( P a ) 1.72 × 1056.89 × 1051.21 × 106
L ( m ) 0.251.001.75
ρ ( k g / m 3 ) 4.31 × 1021.72 × 1033.02 × 103
k D ( m 2 ) 3.58 × 10−161.43 × 10−152.50 × 10⁻¹⁵
μ ( P a · s ) 2.50 × 10−41.00 × 10−31.75 × 10⁻³
ϕ 8.9%35.7%62.4%
Disclaimer/Publisher’s Note: The statements, opinions and data contained in all publications are solely those of the individual author(s) and contributor(s) and not of MDPI and/or the editor(s). MDPI and/or the editor(s) disclaim responsibility for any injury to people or property resulting from any ideas, methods, instructions or products referred to in the content.