Article

Assessing the Feasibility of Sustainable Materials to Boost the Sorption of Pharmaceutical Active Compounds When Included in Reactive Barriers in Soil Aquifer Treatment for Water Reuse

1
Géosciences Montpellier, Université de Montpellier, CNRS, 34095 Montpellier, France
2
HydroSciences Montpellier, Université de Montpellier, CNRS, IRD, 34095 Montpellier, France
*
Author to whom correspondence should be addressed.
Water 2023, 15(7), 1393; https://doi.org/10.3390/w15071393
Submission received: 9 March 2023 / Revised: 28 March 2023 / Accepted: 1 April 2023 / Published: 4 April 2023

Abstract

:
We evaluated the feasibility of five sustainable materials (clay, zeolite, biochar, compost, and woodchips) to be included in a reactive barrier intended to improve the removal of pharmaceutical active compounds (PhACs) during soil aquifer treatment (SAT). The potential of the five materials to sorb PhACs was assessed and compared to sand capacity through batch experiments. Materials with high organic carbon content (biochar, compost, and woodchips) exhibited a greater capacity to sorb PhACs than materials with a low organic carbon content (clay and zeolite). The ion speciation of the molecules is a major parameter controlling the fate and transport of PhACs during SAT operations. Anionic species are the ones with the highest risk of reaching the aquifer since they are generally less sorbed compared to cationic and neutral species. Experimental parameters such as contact time, solid:water ratio, and grain size had no a significant effect on the sorption of PhACs in the studied materials. The incorporation of biochar, compost, and/or woodchips into reactive barriers will promote the sorption of PhACs and will boost the ability of the SAT system to improve the quality of the recharged water.

Graphical Abstract

1. Introduction

The increasing demand for quality water due to population growth urges the development of environmentally sustainable strategies to promote water reuse and recycling, especially in the most populated regions of arid and semiarid zones [1]. Reclaimed effluents from wastewater treatment plants (WWTP) are one of the main sources of water available for reuse and recycle. However, the removal of pharmaceutical active compounds (PhACs) such as antibiotics, anti-inflammatories, sedatives, and β-blockers is limited during primary treatment and compound-variable during the biological treatment, making WWTPs effluents one of the most important sources of PhACs in the aquatic environment [2,3]. The presence of such contaminants in soils, surface water, groundwater, and even drinking water has been largely confirmed [4,5,6]. These emerging contaminants are widely used for human and veterinary medicine purposes, and their presence in the aquatic environment, even at very low concentrations, can produce physiological effects in wildlife, posing a risk to aquatic ecosystems and, eventually, to human health [7,8,9]. Most of the PhACs are designed to be ionizable molecules with at least one ionizable group that will change their degree of ionization during the uptake process [10,11]. Ionized species increase solubility, facilitating ingestion, but some degree of lipophilicity is required to facilitate transport of the pharmaceuticals through membranes of organisms and reach the pharmacological target [12]. One of the parameters controlling the potential toxicity of these molecules and their distribution between environmental compartments is their speciation/ionization [13,14].
Currently there are no legal discharge limits for PhACs, but the European water policy has defined a watchlist of high-risk substances to be prioritized, in which several PhACs such as sulfamethoxazole (SMX) and venlafaxine (VLX) are included [15]. The reuse of reclaimed water requires the application of a treatment that efficiently removes these contaminants. Upgrading the treatment of conventional WWTPs is a logical approach to improve effluent quality, benefiting both the quality of a source for reuse and minimizing the release of PhACs into the environment [16,17]. Tertiary treatments conventionally implemented in WWTPs for PhACs removal include ultraviolet irradiation, advanced oxidation, and membrane technologies, among others [18]. However, these technologies might not be the most suitable due to their high operating costs and/or the potential formation of transformation products of unknown toxicity [17,19].
An alternative approach is to renaturalize the reclaimed water through nature-based, cost-effective, and low-energy systems such as soil aquifer treatment (SAT) [20,21]. SAT consists of the infiltration of the impaired WWTP effluents through the vadose zone and their subsequent travel through the aquifer, providing environmental, economic, and energetic benefits compared to conventional technologies. The quality of the recharged water improves during its passage through the soil at the same time that the groundwater resources increase, benefiting the groundwater-dependent ecosystems, which makes this technology a powerful alternative to achieve the sustainable development goals (SDGs) of the United Nations (UN), in particular SDG 6 (to ensure availability and sustainable management of water and sanitation for all) [22].
The quality of the recharged water improves in terms of organic matter, pathogens, inorganic nutrients, and PhACs [21,23,24]. However, the transport of contaminants from the infiltration zone into the aquifer could result in the occurrence of aquifer contamination. Operational parameters such as the quality of the water source, the flow into the recharge system, and the thickness and composition of the vadose zone play a determinant role in the fate and behavior of contaminants during SAT and therefore in the quality of the recharged water reaching the aquifer [25,26,27]. PhACs behave very differently from each other during SAT. The main processes involved in the fate and transport of theses contaminants during water soil passage are biotransformation and sorption [6,28,29]. Sorption is a key process controlling the behavior of organic molecules in the environment since it regulates their bioavailability and therefore their degradation rates and transport [30,31]. Indeed, sorption process has been proposed as a low-cost treatment for the removal of various pollutants [32,33]. The amount of a contaminant sorbed into a fraction of soil will depend on the physicochemical properties of both and the environmental conditions [34,35]. Neutral species interact with the surface of organic matter through hydrophobic/lipophilic interactions that favor the transfer from the polar phase (water) to the nonpolar phase (soil/sediment), while ionized species interact with minerals, oxides, and the surface of organic matter through electrostatic interactions such as cation exchange, surface complexation, or hydrogen bonding [36].
An optimal strategy to boost the effectiveness of SAT systems improving the quality of the recharge water regarding PhACs is to favor their sorption and biotransformation through the implementation of reactive barriers consisting of a mixture of sand and a series of sustainable materials [37]. The function of the sand is to ensure the structure and hydrological properties of the infiltration basin, and the function of sustainable materials is to provide different sorption surfaces and dissolved organic carbon to favor the sorption and the biotransformation of contaminants present in the recharged water. The sustainable materials selected to compose the reactive barrier in addition to increasing sorption and biotransformation of PhACs should ideally be the following: (i) waste from a near industry, (ii) easy to handle, (iii) cheap, (iv) capable of ensuring permeability, and (v) not releasing any potentially hazardous substances. The presence of diverse materials modifies the structure of the microbial community in the systems [38], and the release of dissolved organic carbon in the recharged water induces denitrification [39]. This strategy has been tested at both in field and pilot scales with beneficial results [40].
The objective of this study is to assess the feasibility of five sustainable materials (low-cost and readily available materials) to increase PhACs sorption when included as components of reactive barriers in SAT applications. The sorption on the selected materials and sand of 12 PhACs regularly consumed in Europe and with different physicochemical properties was evaluated though batch experiments. The sorption on the selected materials was then compared to the sorption on sand, of which recharge basins of SAT systems typically consist. Additionally, the properties that control the sorption capacity of the materials were identified to allow an initial assessment of other materials that can be incorporated into reactive barriers. Contact time, solid:water ratio, material grain size, and water composition were tested parameters to obtain information on optimal operating conditions to promote sorption.

2. Materials and Methods

2.1. Sustainable Materials Selection

Five materials were selected to evaluate their capacity to sorb PhACs compared to sand when included as components of reactive barriers. The selection was based on both the sustainable characteristics of the materials (price, availability, and having a nearby point of distribution) and their potential ability to improve the performance of reactive barriers [21]. Two materials were selected based on their high sorption capacity: clay and zeolite. Clay minerals present high surface area and porosity, and they are low-cost and abundantly available. Their negatively charged surfaces provide sorption sites for the cationic species. We used Colades© clay from Bisbal d’Empordà (Argiles Colades, Corça, Girona, Spain), which contained kaolinite, montmorillonite, and illite. Zeolites are a crystalline, low-cost, high sorption capacity, microporous material applied in drinking water treatment plants [41]. Aqua© zeolite (Zeocat, Sant Esteve de Palautordera, Barcelona, Spain), a natural-type zeolite composed of climnotilotite (82–86%) with a porosity between 24–32%, was used in this study.
Three materials were selected based on their high OC content: biochar, vegetable compost, and woodchips [42,43,44]. Biochar is a carbon-rich material obtained from biomass pyrolysis at temperatures between 300–1000 °C that favors the sorption of neutral and cationic compounds [45]. Production processes and biomass source used for biochar production affect its physicochemical properties such as specific surface area, polarity, and particle size distribution and thus its sorption capacity [46]. We used LivingChar© biochar (LivingChar, Barcelona, Spain) produced locally from pine, olive wood, and shrubs residues at 450 °C. Compost is the result of the biological degradation of organic matter under aerobic conditions. Compost is a low-cost, little-processed material that presents a high OC content, cation exchange capacity, and diversity of functional groups [47]. We selected locally produced compost from garden-maintenance waste. Woodchip is a low-cost, porous material with high cellulose content and therefore is an effective sorbent. The woodchips were obtained from pruning residues of pine and shrubs. The sand used for comparison is a classic coastal sand composed mainly of quartz, silicates, carbonates, and clays (Table 1).

2.2. Sustainable Materials Preparation

The materials were dried and then sieved. The grain size fraction < 2 mm was selected to compare the sorption capacity of the materials under similar conditions. Material analyses were performed to obtain the organic carbon fraction (%OC), the pH in equilibrium with water, the total cationic exchange capacity (CEC), and the reactive surface of each material. The %OC was determined by weight loss at 480 °C. BET (Brunauer–Emmett–Teller) surface areas were determined from N2 adsorption isotherm data collected at 100 °C. The mineralogical composition of the materials was determined by X-ray diffraction using a Bruker D8 Discover (Montpellier Charles Gerhardt Institute, Montpellier, France). X-ray fluorescence was performed using a PANalytical AXIOS Max (Montpellier Charles Gerhardt Institut, Montpellier, France) to determine the elemental composition of each material. X-ray fluorescence coupled with X-ray diffraction allowed identification and confirmation of the mineralogy composition. The sand is mostly composed of quartz grains (51%), albite (17%), muscovite (13%), calcite (10%), and microcline (9%). The clay sample is composed by 35% of quartz, 29% of muscovite, 23% of kaolinite, 8% of calcite, and 4% of iron oxide. Finally, the zeolite is a Na-, K-, and Ca-rich zeolite.

2.3. Selected PhACs Physicochemical Properties

We selected 12 PhACs to evaluate the capacity of the materials to sorb them. The molecules were selected based on both their frequent occurrence in WWTPs effluents and their physicochemical properties. Among the studied molecules, there are three that can be defined as amphoteric (sulfamethoxazole (SMX), oxazepam (OXA), and carbamazepine (CBZ)), four as bases (diazepam (DIA), propanolol (PRL), atenolol (ATL), and venlafaxine (VLX)), and five as acids (fenofibric acid (FFA), diclofenac (DCL), ketoprofen (KTO), ibuprofen (IBU), and paracetamol (PRM)). The selected PhACs display a broad range in their n-octanol/water distribution coefficient (KOW), which accounts mainly for the lipophilicity of the neutral specie of the molecule (Table 2). The wide range of values of physicochemical properties displayed by the selected molecules allows the evaluation of the efficiency of the materials in the sorption of PhACs.

2.4. Speciation and pH-Dependent n-Octanol/Water Distribution Coefficient (Log Dow) Calculations

The speciation of the selected molecules was estimated by applying Henderson–Hasselbalch equation for monovalent acids and bases (Equations (1) and (2)) [31]:
ϕ n = 1 1 + 10 α ( p H p K a )
ϕ i o n = 1 ϕ n
where ϕ n is the molar fraction of the neutral specie, ϕ i o n is the molar fraction of the ionic specie, and α = 1 for acids and −1 for bases.
The Henderson–Hasselbalch equation for two ionizable functional groups is as follows (Equations (3)–(5)):
ϕ n = 1 1 + 10 ( p H p K a , a c i d ) + 10 ( p K a , b a s e p H )
ϕ = ϕ n . 10 p H p K a , a c i d
ϕ + = ϕ n . 10 p K a , b a s e p H
where ϕ and ϕ + are the fractions of the anionic and cationic species, respectively. A fraction of the amphoteric molecules will exist as neutral specie in the range of pH between the two pKa of the molecule. Based on these molar fractions, PhACs were grouped into three categories: cationic, neutral, and anionic. Scherrer and Howards equations were applied for calculate the Log DOW (the pH-dependent n-octanol/water distribution coefficient) for the experimental pH range [48]. We estimated Log DOW for monovalent molecules as follows (Equation (6)):
L o g D O W p H = L o g K O W L o g 1 + 10 α p H p K a
where α = 1 for acids and −1 for bases.
For molecules with two functional groups, the equation used for the Log Dow estimation was (Equation (7)):
L o g D O W p H = L o g K O W L o g 1 + 10 ( p K a , p H ) + 10 p H p K a
Figure S1 displays the estimated molar fraction of the molecule’s species and Log DOW for the experimental pH range. The physicochemical properties of the studied PhACs and their speciation at pH equal to 4, 6, and 8 are summarized in Table 2.

2.5. Sorption Batch Setup

Batch experiments were performed to determine (1) the influence of experimental parameters (contact time, solid:water ratio, material grain size, and water composition) in the sorption capacity of sand, clay, and compost and (2) the capacity of the five selected materials to sorb the selected PhACs and to compare them with that of sand.
The material and the spiked water (at 10 µg/L of PhACs) were put in contact in a glass flask for a defined contact time. The flasks were continuously agitated at 40 rpm using a SCI-RL-E analog tube rotator (Scilogex, Rocky Hill, CT, USA). A Jouan B4i centrifuge (Thermo Fisher Scientific, Waltham, MA, USA) was used at 4000 rpm for 5 min to separate the solid and liquid phases (Figure S2). All experiments were conducted at room temperature and performed in triplicate to account for the variability.
The role of the water composition in the sorption capacity was evaluated by using milli-Q water and synthetic wastewater (SWW) containing a proportion of major inorganic components characteristic of wastewater treatment plant effluents (composition described in Table S1) in batches performed with crushed materials, a S:W ratio of 1:3, and a contact time of 60 min. Four contact times (30, 60, 360, and 1440 min) were tested to include the potential slow kinetics using milli-Q water, a S:W ratio of 1:3, and crushed material. Three solid:water ratios (S:W) (1:5, 1:3, and 1:1) were tested to evaluate the sorption capacity of the materials under conditions close to those of SAT systems using milli-Q water, a 60 min contact time, and crushed materials. Finally, two different grain size fractions (crushed material and d (grain diameter) < 2 mm) were tested for sand, compost, and clay to assess the influence of these parameters in the sorption capacity using milli-Q water, a contact time of 60 min, and a S:W ratio of 1:3. Table S2 summarizes the experimental conditions used in each set of experiment.
The sorption of the PhACs on the materials was calculated by means of the difference between the initial and final concentration of each PhACs. Reference experiments containing only spiked water were also performed in triplicate on each set of batches to account for (1) the accuracy of the analytical method to determine each of the studied PhAcs and (2) the potential loss of some of the PhACs during the experiment and the sample preparation (recovery).
We calculated the sorption (%S) of each PhACs as follows (Equation (8)):
% S i = 100 f i n a l C i , b a t c h i n i t i a l C i , b a t c h f i n a l C i , r e f i n i t i a l C i , r e f × 100
where final Ci, batch, and final Ci, refer to the final concentrations of the molecule i measured in the regular and in the reference batches, respectively. In this way, we avoid including as sorption the potential losses of the PhACs due to the experimental setup. Blank samples containing only milli-Q water or synthetic wastewater were also used for analysis performed on each set of batches to confirm the absence of contamination during sample preparation.

2.6. Sample Preparation and Analysis

Directly after the batch experiments, 1 mL of each supernatant was filtered with a Chromafil xtra filters 0.2 µm PTFE filters (Macherey-Nagel, Bethlehem, PA, USA) for further PhACs quantification and spiked with surrogate standard at 10 µg/L. Samples were stored at −18 °C until LC-MS analysis. Extracts were analyzed using a Vanquish ultra-high liquid chromatography (Thermo, Fisher Scientific, Waltham, MA, USA) coupled to a high-resolution mass spectrometry Q-Focus Orbitrap (Thermo Fisher Scientific, Waltham, MA, USA) equipped with a heated electrospray ionization probe (HESI) source. Chromatographic separation involved a reverse-phase biphenyl 100 Å analytical column (Kinetex, 100 mm × 2.1 mm; 2.6 µm particle size). The chromatography assays involved a 10 µL injection volume, a 0.4 mL/min flow rate, and a binary gradient of water (A) and ACN (B) as follows: 5% B at 0–2 min, 50% B at 11–12 min, 100% B at 16–17 min, 5% B at 19 min, and a stop time at 22 min. Contrary to negative ionization mode, in positive ionization mode, both phases contained 0.1% formic acid. Over a 22 min run, data acquisition was performed in positive and negative ionization mode, and the HESI parameters were as follows: 55 arbitrary units (AU) sheath gas, 10 AU auxiliary gas, 300 °C capillary temperature, 250 °C heater temperature, and the electrospray voltage was set at 3.5/−3.5 kV. The S-lens radio frequency (RF) level was set at 50 AU. Full scan data in both positive and negative ionization mode were acquired at a resolution of 70,000 full width at half maximum (FWHM) with an automatic gain control (AGC) of 106. Moreover, MS2 was achieved using a mass inclusion list composed of the mass of the precursor ion of the compounds of interest (Table S3). A 20 eV absolute collision energy and 17,500 FWHM resolution were used. The m/z scan range was set between 100 and 700.
Analyses were carried out only if the conditions required for analysis (absence of contamination in the blank samples, sensitivity, etc.) were fulfilled. Standard solutions at 10 µg/L were injected before each analysis sequence and about every 12 samples to calculate the internal standard responses factors for quality control and PhACs quantification. The method displays a relative recovery between 80–120% for all analyzed molecules (calculated in reference batches using deuterated standards).

3. Results

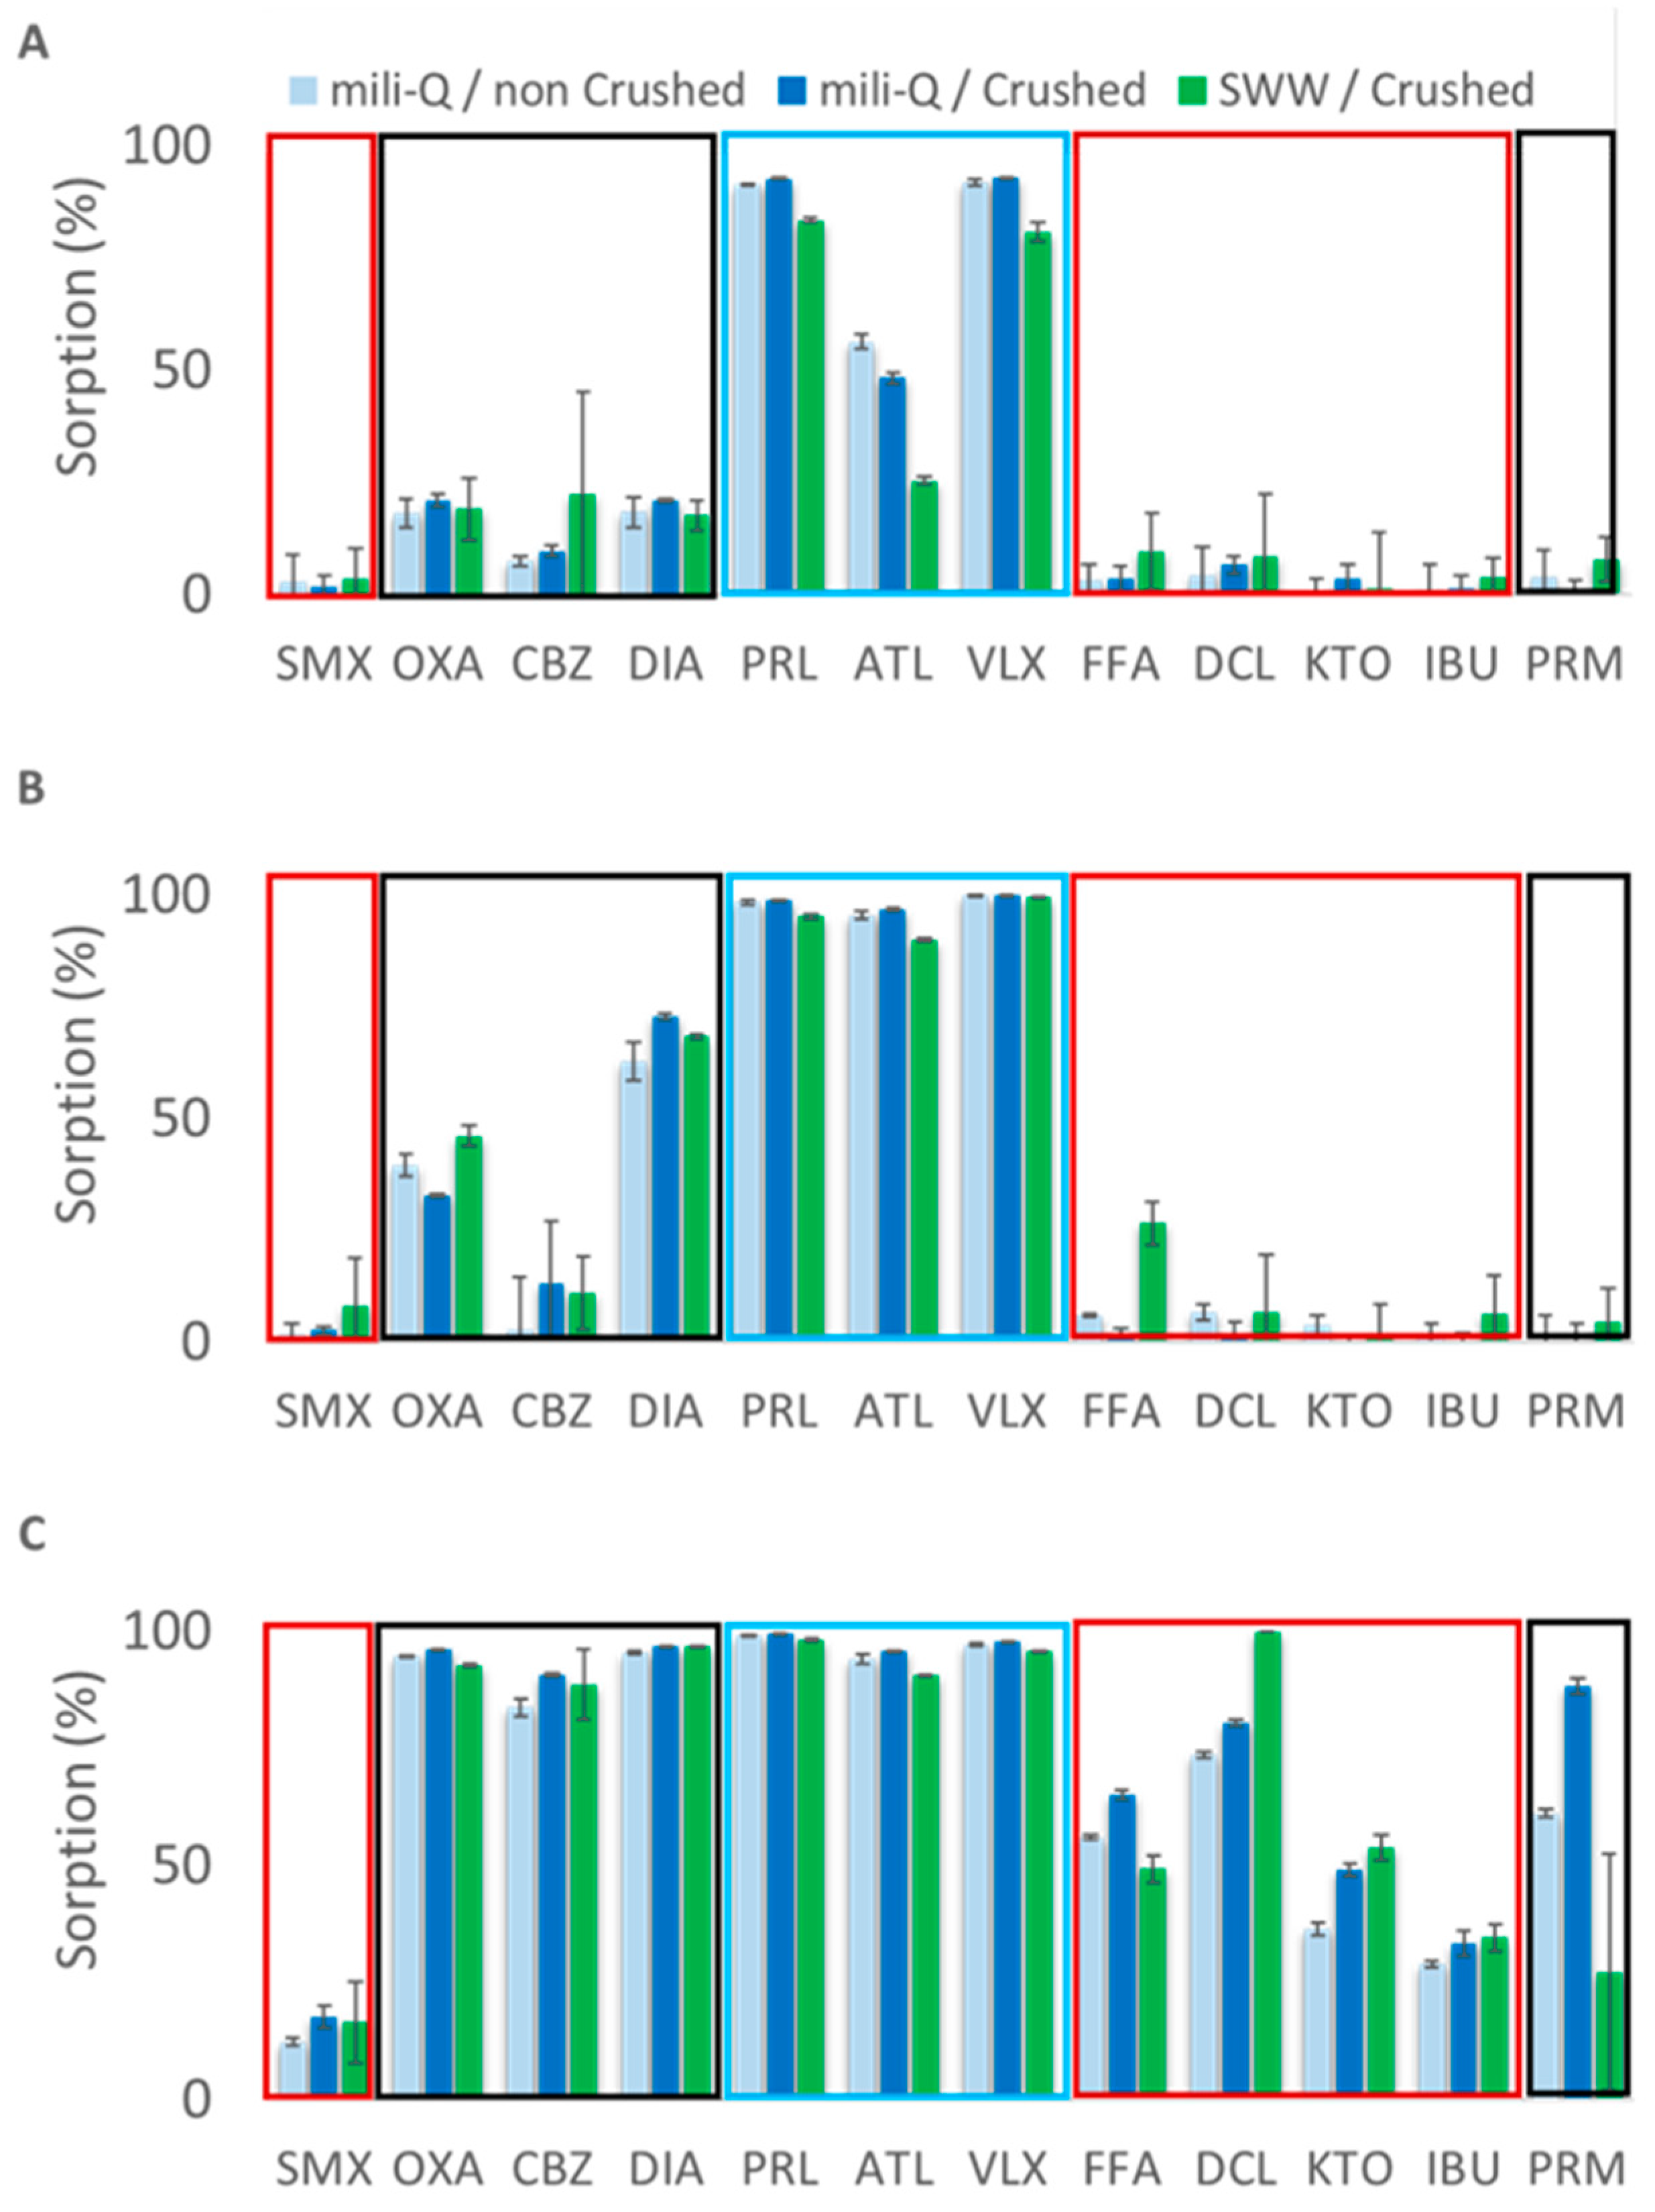
3.1. Influence of Experimental Parameters in the Sorption of PhACs on Sand, Compost, and Clay

The influence of S:W ratio, contact time, water composition, and grain size on sorption capacity was studied for three materials: sand, clay, and compost. The pH in equilibrium with water of these three materials varied between 7.8 and 8.7 (Table 1), and none of the selected PhACs displayed a pKa within this pH range; therefore, no significant differences were expected in the species fraction of PhACs.
Figure 1 shows the influence of the S:W ratio (A, B, and C) and the contact time (D, E, and F) on sorption capacity for sand, clay, and compost, respectively. The S:W ratio displays a moderate influence on the sorption of PhACs under the tested conditions. Overall, the sorption increases with the S:W, as expected. The high sorption of some molecules even for the lowest S:W hides this general trend; this is the case for the alkaline molecules in their cationic form (PRL, ATL, and VLX) on clay and compost and most of the molecules in their neutral form (OXA, CBZ, and DIA) on compost.
Figure 2 displays the influence of the water composition and material grain size on the sorption capacity of sand (A), clay (B), and compost (C). Both parameters, i.e., water composition and grain size, showed a minor effect on the sorption capacity of these three materials under our experimental conditions. Overall, the sorption increases slightly for the crushed materials, as the decrease in the grain size means an increase in the reactive surface and therefore a more efficient sorption. The solid portion is very high compared to conventional sorption studies, preventing sorption from being limited by the availability of sorption sites, and therefore, the decrease in grain size and increased in reactive surface would not have a significant effect on sorption.
Concerning water composition, several studies have reported that ionic strength affects the sorption of ionizable molecules since the cation concentrations increase and so does the competition with the positively charged species [34,49,50]. Indeed, a slight decrease in adsorption with increasing ionic strength (milli-Q compared to SWW) was observed for those PhACs whose cationic fractions are dominant at the experimental pH (PRL, ATL, and VLX, grouped with a blue square in Figure 2A) in the sand tests. The sorption of these three molecules in clay and compost is almost complete, hiding this reported trend. However, the effect of the ionic strength on the sorption of molecules whose anionic fractions are dominant (FFA, DCL, KTO, and IBU, grouped with a red square in Figure 2) is opposite; the sorption is slightly higher when SWW was used instead of milli-Q water.

3.2. PhACs Sorption Capacity of the Five Selected Materials Compared to Sand

We compared the sorption capacity of the selected materials to the sand capacity using the results of batch experiments performed at 1:3 S:W ratio, 60 min of contact time, crushed materials, and with SWW (Table S2). Figure 3 displays the distribution (minimum; 25th, 50th, and 75th percentile; maximum; and outliers) of the sorption of the 12 studied molecules (A) and the sorption distribution of the anionic, neutral, and cationic groups (B) in the six materials as boxplots.
The sorption of the studied PhACs displayed a broader range on clay and zeolites compared to sand (Figure 3A and Figure S3). Clay and zeolite exhibit both high porosity and a negatively charged surface, favoring the retention through electrostatic attraction of cationic species such as ATL, VLX, and DIA. Sorption of anionic, neutral, and cationic species on biochar, compost, and wood is increased compared to sorption on sand (Figure 3B).
The anionic forms of the studied PhACs, gathered in red boxplot in Figure 3B, comprise the group displaying the lowest sorption in all six materials. Within the acid molecules, FFA, DCL, and KTO are in their anionic form, and PRM is in its neutral form throughout the experimental pH range; IBU is in its anionic form in the experiments performed with all materials except for those performed with woodchips, for which it is in its neutral form (Figure S4). Anionic forms are moderately sorbed on biochar, compost, and woodchips but subtlety sorbed on sand, clay, and zeolite. It is worth noting that wood is the material displaying the higher sorption of anionic compounds.
The neutral forms, grouped in the blue boxplots in Figure 3B, are highly sorbed in biochar, compost, woodchips, and the materials with high %OC and little sorbed in sand, clay, and zeolites. OXA and CBZ are in their neutral form for the whole pH range, while SMX is found in its neutral form only in the experiments performed with woodchips and in its anionic form in the experiments performed with the rest of materials (Figure S4). Three within the neutral species (OXA, CBZ, and DIA) display high affinity for high %OC materials and little or moderate affinity with zeolite and clay. However, PRM, an acid molecule mainly in its neutral form for the entire experimental pH range, displays moderate sorption in woodchips and poor sorption in the rest of the materials (Figure S4).
The cationic species, gathered in green boxplots in Figure 3B, is the group displaying the highest sorption in all materials (including sand). Within the basic PhACs, three molecules, namely PRL, ATL, and VLX, are in their cationic form and display high sorption on clay and zeolite (Figure S3). DIA, which is in its neutral form and is so gathered under the blue box in Figure 3B, displays only moderate sorption on clay and zeolite although much higher than on sand (Figure S4D). The sorption of the cationic forms, even those with low Log Dow, is highly increased in biochar, compost, and woodchips compared to sand. The incorporation of any of the tested materials as components of the reactive barrier will favor the sorption of the alkaline molecules, especially those in their cationic form (Figure 3B).
Figure 4 displays the sorption of the neutral (A) and anionic (B) species in the six tested materials. The dependence of the sorption on the Log Kow of the molecule and on the OC content of the materials is clear for neutral species. The only molecule in its neutral form that is poorly sorbed into biochar, compost, and woodchips is PRM, which shows a Log Kow of 0.46, which is much lower than the rest of neutral species (OXA, 2.24; CBZ, 2.45; DIA, 2.82). However, the sorption of anionic species does not display a clear correlation with the Log Kow; most of them were only moderately sorbed even in high %OC materials.
Figure 5 displays the sorption of the 12 PhACs (A) and anionic (B), neutral (C), and cationic (D) species versus the OC content (gr) for each batch experiment and the linear fit in B and logarithmic fit in C and D. Overall, a positive correlation is observed between the OC content of the materials (Table 1) and the PhACs sorption (Figure 5A). The OC contain of the materials is the parameter that most influences their sorption capacity. The correlation between sorption and OC content is clear for anionic and neutral species, while cationic species tend to be sorbed regardless of OC content, which weakens the correlation between the two parameters.

4. Discussion

Sorption and biodegradation are the main two processes controlling the fate and transport of PhACs during SAT operations. The installation of reactive barriers intended to promote both processes is a proven approach to upgrade the effectiveness of SAT systems improving the quality of the recharged water [37,40,51,52]. We studied the capacity of five sustainable materials to increase the sorption of a group of PhACs representative of those commonly identified in WWTPs effluents. The mechanism behind the PhACs sorption differs depending on the molecule structure and ionization and in the surface properties of the materials.

4.1. Role of Experimental Parameters in Sorption

The variation in contact time has no evident effect on the adsorption of the PhACs, supporting that sorption is a fast process. Sorption of PhACs did not increase for contact times greater than 60 min, indicating that the parameterization of the reactive barrier and inflow rate should ensure this time, but longer residence times are not necessary (Figure 1). Gil et al. (2019) performed batch experiments to determine the adsorption of six PhACs on activated carbon, and observed a very rapid initial increase in adsorption up to 40 min of contact time, followed by a long period where the sorption did not increase [53]. A similar influence of the contact time on sorption was found in other studies regarding uranium onto polymeric adsorbents and metal ions onto straw material [54,55]. The fact that grain size is not a determining factor in the control of the sorption process is good news since decreasing the grain size of the reactive barrier material implies reducing its hydraulic conductivity, and therefore, it would limit the volume that can be treated per square meter of infiltration area (Figure 1). The other tested operating parameters, namely the S:W ratio and the composition of the influent water, are not easily manageable, but having a limited effect on sorption, they do not represent an effective approach to boost PhACs sorption (Figure 2).
The increased sorption of anionic species with the ionic strength (Figure 2) might be explained by the decrease of the electrostatic repulsions between molecules and the negatively charged surfaces of materials due to the concentrations of cations near the surfaces [50]. However, the presence of ions in the water decreases the sorption of anionic contaminants in biochar mainly due to the competition for the positively charged carbon surfaces [49]. The effect of the ionic strength on the sorption of anionic species is, in any case, subtle, probably resulting from the opposite effect of these two processes.

4.2. What Materials Should Be Included in Reactive Barriers to Boost PhACs Sorption?

Clay and zeolites exhibit a similar sorption capacity; anionic molecules are poorly sorbed, neutral molecules display a wider sorption range in both materials than in sand, and cationic molecules’ sorption is significantly improved and display a narrower distribution compared to sand (Figure 3B). Sand has little sorption capacity compared to other materials; however, for some molecules (CBZ, SMX, OXA, FFA, IBU, and DCL), sand performed very similar to clay and zeolite (Figure S3), which can be linked to our sand composition (13% of muscovite). Rossner et al. (2009) indicated that the uniform size and shape of zeolite pores might be very effective in removing a specific molecule but not so effective when the objective is to remove a broad range of molecules, as in the case of SAT systems [56]. Other parameters such as the hydrogeological properties of the material must be considered in deciding whether to incorporate these materials into reactive barriers. The incorporation of clay in the reactive barrier will decrease the infiltration capacity and increase the water-retention capacity. On the other hand, the incorporation of zeolites will provide structure to the barrier.
Biochar, compost, and woodchips are shown to be very effective at increasing the sorption of neutral and cationic species and moderately effective for anionic species. The biochar sorption mechanisms for positively charged molecules has been proposed to be cation exchange; it displays a high CEC (6.96 meq/100 g, Table 1) and hydrophobic interactions for the neutral PhACs [46], whereas negative-charge-assisted H bonds, surface complexation, and π–π interaction have been proposed as the sorption mechanisms for anionic species into biochar [44,57,58]. Compost provides a high CEC (Table 1), facilitating electrostatic attraction with the cationic species and a reactive surface higher than sand but much lower than biochar (5 m2/g). Woodchips showed the lowest pH in the water equilibrium: 5.26 (Table 1). The presence of woodchips leads to acid molecules with a pKa greater than 5, such as SMX and IBU, to be mainly in their neutral form rather than in their anionic form, favoring their sorption on the material (Figure S4). The high cellulose content of woodchips favors ion exchange between cationic species and the phenolic hydroxyl groups of the tannins [59].
The molecules speciation clearly affects their interaction mechanism with the active fractions of the soil. Hydrophobic/lipophilic bonds (≈4 KJ/mol) are weaker than electrostatic interactions with change transfer (≈40 KJ/mol) [31]. Scheytt and collaborators concluded that the hydrophobic interaction with the organic matter is the mechanism dominating the sorption process for CBZ and other neutral compounds [60]. Within the neutral species, the anomalous behavior of PRM, which displays subtle sorption onto all the tested materials, might be the explained by its low Log Dow, 0.28, compared to those of the other three neutral species, around 2.5 (Table 2, Figure S1). The π–π interaction between PRM and the syringyl group of lignin was proposed as an important mechanism for this molecule [61]. Accordingly, to our results, the anionic species are the group of PhACs with the highest probability of reaching the aquifer since they are the least sorbed; fortunately, only 20% of PhACs belong to this group [11], and the presence of materials with a high %OC markedly increases the sorption of these molecules compared to sand.
The %OC of the soil was proposed as the main parameter controlling the transport of PhACs in column experiments by Chefetz and collaborators [62]. CBZ, DIA, DCL, IBU, and ATL showed a strong retention in columns operated with materials containing high %OC [51] and in SAT systems operated with a reactive barrier based on compost [37]. The hydrophobic interactions between PhACs and the OC present in the soil were proposed as the main sorption process in a SAT system. This fact supports the hypothesis that in SAT systems operated with reactive barriers, sorption will prevent the transport of cationic and neutral species into the aquifer. In addition, the inclusion of biochar, compost, and specially woodchip in reactive barriers could increase the retention of anionic molecules such as SMX that are included in the surface water watchlist of the European Commission since they might pose a significant risk for the aquatic environment [15]. Furthermore, by including different materials and increasing the sorption surfaces, the distribution of the residence times in immobile zones is broadened, which has been associated with the localization of biogeochemical reactions that favors PhACs biodegradation [63].
Compost, biochar, and woodchips are suitable materials to be included in reactive barriers. Within the studied sustainable materials, biochar is the one with the least-affordable price, but since biochar production provides carbon-sequestration benefits, its cost might be reduced under a carbon pricing regime [46]. On the other hand, biochar addition favored plant growth, which reduces clogging risk and enhances pathogen retention and contaminant biotransformation [64]. In general, the sorption capacity of ionizable compounds correlates with the biochar surface area, which is higher in biochar pyrolyzed at high temperatures [58]. Compost addition can improve water retention, porosity, and nutrient availability, affecting the microbial community structure and metabolism [38]. The optimal proportion of each material should be assessed by column experiments where the changes in the hydraulic conductivity can be investigated. Compost and woodchips have been tested in high proportion (mixed with sand at 50% in volume) in SAT systems, displaying a good performance in both maintaining the infiltration capacity of the system and improving the removal of PhACs [21,40,52]; however, the effect of a potential mixture performance should be tested before field-scale implementation. The proportion of biochar should be lower than 10% (in volume) since proportions higher to 15% of the total will cause the reduction of hydraulic conductivity, reducing the volume of renaturalized water [46].

5. Conclusions

The capacity of five sustainable materials to sorb PhACs was assessed through batch experiments and compared with the capacity of sand. In this study, we propose a simple test using batch experiments to assess the capacity of sustainable materials to sorb a broad group of PhACs present in the effluents of WWTPs. The optimization of the operating conditions must be carried out a posteriori in column tests where, in addition to the sorption capacity, the hydrogeological properties and potential passivation can be evaluated.
Our main findings are the following:
  • All five materials displayed a higher capacity for PhACs sorption than sand;
  • The organic carbon content is the key parameter for the sorption performance of the materials;
  • The PhACs speciation determines the mechanism of interaction with the surfaces and therefore the degree of retention;
  • Cationic species displayed a high potential to be retained even in sand (13% of clay). Neutral species interact with materials showing a high organic carbon content, while their sorption on sand, clay, and zeolites was limited or moderate. Anionic species are the ones with the greatest risk of reaching the aquifer since their sorption is moderate even in materials with a high organic carbon content;
  • The incorporation of a mixture of woodchips, compost, and biochar in reactive barriers will favor the retention of PhACs, increasing the time during which they are bioavailable for degradation, and therefore increasing the efficiency of SAT systems in water renaturalization.

Supplementary Materials

The following supporting information can be downloaded at: https://www.mdpi.com/article/10.3390/w15071393/s1, Figure S1: Calculated Log DOW (green line, secondary vertical axis) and anionic (slashed line), neutral (black line), and cationic (dot line) molar fraction of the studied molecules for pH range between 1 and 15. Pale blue square marked the experimental pH range. Figure S2: Schematic diagram of the experimental procedure. Figure S3: PhACs sorption on studied materials: clay (pale blue), zeolite (dark blue), biochar (orange), compost (yellow), and woodchips (green) compared with sorption onto sand (red bars). Standard deviations from the triplicates are displayed as errors bars. Figure S4: Sorption of the 12 PhACs onto the studies materials (sand: red squares, clay: pale blue squares, zeolite: dark blue squares, compost: yellow circles, woodchips: green circles, and biochar: orange circles) and their ionization fraction (neutral: black line, anionic: red dash line, and cationic blue dot line) for the experimental pH range. Table S1: Composition of the SWW used in the experiments. The composition was achieved by the addition of 0.133 g of CaCl2, 0.687 g of NaCl, 0.058 g of NaHCO3, and 0.064 g of KHCO3 to the commercial brand Aix les Bains®. Table S2: Experimental conditions of the batch sets performed to assess the role of the experimental parameters (S:W ratio, contact time, water composition, and grain size) in the sorption capacity of sand, compost, and clay and in the batch performed to compare the sorption capacity of the five sustainable material studied to sand sorption capacity. Crosses in green indicate the values tested in each case, and crosses in black indicate the default value of the parameter. Table S3: Ionization mode, m/z, and retention time of the selected molecules.

Author Contributions

Conceptualization, C.V., G.D., E.G. and L.L.; methodology, C.V., G.D., G.C., D.R., E.G. and L.L.; formal analysis, C.V. and G.D.; investigation, C.V., G.D., E.G. and L.L.; data curation, C.V., G.D. and G.C.; writing—original draft preparation, C.V.; writing—review and editing, G.D., E.G. and L.L.; funding acquisition, G.D., E.G. and L.L. All authors have read and agreed to the published version of the manuscript.

Funding

This study was funded by Maradentro project (Water JPI 2018) ANR-18-WTW7-0003, by NEREIDE project (Institut Carnot eau & Environnement—French National Research Agency), and by LIFE-REMAR Project (LIFE20 ENV/ES/000284).

Data Availability Statement

The data presented in this study are available on request from the corresponding author.

Acknowledgments

We are grateful to the CIRAD Laboratory of Water, Soil, and Plant Analysis (US Analyses, CIRAD, Montpellier, France) for carrying out the analyses. The authors would like to thank the Platform Of Non-Target Environmental Metabolomics (PONTEM) of the Montpellier Alliance for Metabolomics and Metabolism Analysis (MAMMA) consortium for carrying out the PhACs analyses.

Conflicts of Interest

The authors declare no conflict of interest.

References

  1. Salgot, M.; Huertas, E.; Weber, S.; Dott, W.; Hollender, J. Wastewater Reuse and Risk: Definition of Key Objectives. Desalination 2006, 187, 29–40. [Google Scholar] [CrossRef]
  2. Alygizakis, N.A.; Urík, J.; Beretsou, V.G.; Kampouris, I.; Galani, A.; Oswaldova, M.; Berendonk, T.; Oswald, P.; Thomaidis, N.S.; Slobodnik, J.; et al. Evaluation of Chemical and Biological Contaminants of Emerging Concern in Treated Wastewater Intended for Agricultural Reuse. Environ. Int. 2020, 138, 105597. [Google Scholar] [CrossRef] [PubMed]
  3. Salgado, R.; Marques, R.; Noronha, J.P.; Carvalho, G.; Oehmen, A.; Reis, M.A.M. Assessing the Removal of Pharmaceuticals and Personal Care Products in a Full-Scale Activated Sludge Plant. Environ. Sci. Pollut. Res. 2012, 19, 1818–1827. [Google Scholar] [CrossRef] [PubMed]
  4. Gogoi, A.; Mazumder, P.; Tyagi, V.K.; Chaminda, G.G.T.; An, A.K.; Kumar, M. Occurrence and Fate of Emerging Contaminants in Water Environment: A Review. Groundw. Sustain. Dev. 2018, 6, 169–180. [Google Scholar] [CrossRef]
  5. Heberer, T. Occurrence, Fate, and Removal of Pharmaceutical Residues in the Aquatic Environment: A Review of Recent Research Data. Toxicol. Lett. 2002, 131, 5–17. [Google Scholar] [CrossRef]
  6. Sui, Q.; Cao, X.; Lu, S.; Zhao, W.; Qiu, Z.; Yu, G. Occurrence, Sources and Fate of Pharmaceuticals and Personal Care Products in the Groundwater: A Review. Emerg. Contam. 2015, 1, 14–24. [Google Scholar] [CrossRef] [Green Version]
  7. Kasonga, T.K.; Coetzee, M.A.A.; Kamika, I.; Ngole-Jeme, V.M.; Benteke Momba, M.N. Endocrine-Disruptive Chemicals as Contaminants of Emerging Concern in Wastewater and Surface Water: A Review. J. Environ. Manag. 2021, 277, 111485. [Google Scholar] [CrossRef] [PubMed]
  8. Kunz, P.Y.; Fent, K. Estrogenic Activity of Ternary UV Filter Mixtures in Fish (Pimephales Promelas)—An Analysis with Nonlinear Isobolograms. Toxicol. Appl. Pharmacol. 2009, 234, 77–88. [Google Scholar] [CrossRef] [PubMed]
  9. Meador, J.P.; Yeh, A.; Gallagher, E.P. Adverse Metabolic Effects in Fish Exposed to Contaminants of Emerging Concern in the Field and Laboratory. Environ. Pollut. 2018, 236, 850–861. [Google Scholar] [CrossRef]
  10. Comer, J.E.A. 5.16—Ionization Constants and Ionization Profiles. In Comprehensive Medicinal Chemistry II; Taylor, J.B., Triggle, D.J., Eds.; Elsevier: Oxford, UK, 2007; ISBN 978-0-08-045044-5. [Google Scholar]
  11. Manallack, D.T. The pKa Distribution of Drugs: Application to Drug Discovery. Perspect. Med. Chem. 2007, 1, 25–38. [Google Scholar] [CrossRef]
  12. Ràfols, C.; Subirats, X.; Rubio, J.; Rosés, M.; Bosch, E. Lipophilicity of Amphoteric and Zwitterionic Compounds: A Comparative Study of Determination Methods. Talanta 2017, 162, 293–299. [Google Scholar] [CrossRef] [Green Version]
  13. Peyret, T.; Poulin, P.; Krishnan, K. A Unified Algorithm for Predicting Partition Coefficients for PBPK Modeling of Drugs and Environmental Chemicals. Toxicol. Appl. Pharmacol. 2010, 249, 197–207. [Google Scholar] [CrossRef] [PubMed]
  14. Strope, C.L.; Mansouri, K.; Clewell, H.J., 3rd; Rabinowitz, J.R.; Stevens, C.; Wambaugh, J.F. High-Throughput in-Silico Prediction of Ionization Equilibria for Pharmacokinetic Modeling. Sci. Total Environ. 2018, 615, 150–160. [Google Scholar] [CrossRef] [PubMed]
  15. The European Commission. European Commission Decision (EU) 2020/1161; The European Commission: Brussel, Belgium, 2020; pp. 32–35. [Google Scholar]
  16. Barbosa, M.O.; Moreira, N.F.F.; Ribeiro, A.R.; Pereira, M.F.R.; Silva, A.M.T. Occurrence and Removal of Organic Micropollutants: An Overview of the Watch List of EU Decision 2015/495. Water Res. 2016, 94, 257–279. [Google Scholar] [CrossRef]
  17. Valhondo, C.; Carrera, J. Chapter 1—Water as a Finite Resource: From Historical Accomplishments to Emerging Challenges and Artificial Recharge. In Sustainable Water and Wastewater Processing; Galanakis, C.M., Agrafioti, E., Eds.; Elsevier: Amsterdam, The Netherlands, 2019; pp. 1–17. ISBN 978-0-12-816170-8. [Google Scholar]
  18. Shaikh, I.N.; Mansoor Ahammed, M.; Sukanya Krishnan, M.P. Chapter 2—Graywater Treatment and Reuse. In Sustainable Water and Wastewater Processing; Galanakis, C.M., Agrafioti, E., Eds.; Elsevier: Amsterdam, The Netherlands, 2019; pp. 19–54. ISBN 978-0-12-816170-8. [Google Scholar]
  19. Gupta, V.K.; Ali, I.; Saleh, T.A.; Nayak, A.; Agarwal, S. Chemical Treatment Technologies for Waste-Water Recycling—An Overview. RSC Adv. 2012, 2, 6380–6388. [Google Scholar] [CrossRef]
  20. Dillon, P.; Toze, S.; Page, D.; Vanderzalm, J.; Bekele, E.; Sidhu, J.; Rinck-Pfeiffer, S. Managed Aquifer Recharge: Rediscovering Nature as a Leading Edge Technology. Water Sci. Technol. 2010, 62, 2338–2345. [Google Scholar] [CrossRef]
  21. Valhondo, C.; Martínez-Landa, L.; Carrera, J.; Díaz-Cruz, S.M.; Amalfitano, S.; Levantesi, C. Six Artificial Recharge Pilot Replicates to Gain Insight into Water Quality Enhancement Processes. Chemosphere 2020, 240, 124826. [Google Scholar] [CrossRef]
  22. US Environmental Protection Agency. Guidelines for Water Reuse; US Environmental Protection Agency: Washington, DC, USA, 2012; Volume 26.
  23. Regnery, J.; Wing, A.D.; Alidina, M.; Drewes, J.E. Biotransformation of Trace Organic Chemicals during Groundwater Recharge: How Useful Are First-Order Rate Constants? J. Contam. Hydrol. 2015, 179, 65–75. [Google Scholar] [CrossRef] [Green Version]
  24. Vanderzalm, J.L.; La Salle, C.L.G.; Dillon, P.J. Fate of Organic Matter during Aquifer Storage and Recovery (ASR) of Reclaimed Water in a Carbonate Aquifer. Appl. Geochem. 2006, 21, 1204–1215. [Google Scholar] [CrossRef]
  25. Dillon, P.; Page, D.; Vanderzalm, J.; Pavelic, P.; Toze, S.; Bekele, E.; Sidhu, J.; Prommer, H.; Higginson, S.; Regel, R.; et al. A Critical Evaluation of Combined Engineered and Aquifer Treatment Systems in Water Recycling. Water Sci. Technol. 2008, 57, 753–762. [Google Scholar] [CrossRef]
  26. Elkayam, R.; Aharoni, A.; Vaizel-Ohayon, D.; Katz, Y.; Negev, I.; Marano, R.B.; Cytryn, E.; Shtrasler, L.; Lev, O. Viral and Microbial Pathogens, Indicator Microorganisms, Microbial Source Tracking Indicators, and Antibiotic Resistance Genes in a Confined Managed Effluent Recharge System. J. Environ. Eng. 2018, 144, 05017011. [Google Scholar] [CrossRef]
  27. Fernández Escalante, E.; Henao Casas, J.D.; San Sebastián Sauto, J.; Calero Gil, R. Monitored and Intentional Recharge (MIR): A Model for Managed Aquifer Recharge (MAR) Guideline and Regulation Formulation. Water 2022, 14, 3405. [Google Scholar] [CrossRef]
  28. Xu, Y.; Yu, X.; Xu, B.; Peng, D.; Guo, X. Sorption of Pharmaceuticals and Personal Care Products on Soil and Soil Components: Influencing Factors and Mechanisms. Sci. Total Environ. 2021, 753, 141891. [Google Scholar] [CrossRef]
  29. Yamamoto, H.; Nakamura, Y.; Moriguchi, S.; Nakamura, Y.; Honda, Y.; Tamura, I.; Hirata, Y.; Hayashi, A.; Sekizawa, J. Persistence and Partitioning of Eight Selected Pharmaceuticals in the Aquatic Environment: Laboratory Photolysis, Biodegradation, and Sorption Experiments. Water Res. 2009, 43, 351–362. [Google Scholar] [CrossRef]
  30. Chen, Z.; Xiao, X.; Xing, B.; Chen, B. PH-Dependent Sorption of Sulfonamide Antibiotics onto Biochars: Sorption Mechanisms and Modeling. Environ. Pollut. 2019, 248, 48–56. [Google Scholar] [CrossRef]
  31. Franco, A.; Trapp, S. Estimation of the Soil-Water Partition Coefficient Normalized Organic Carbon for Ionizable Organic Chemicals. Environ. Toxicol. Chem. 2008, 27, 1995–2004. [Google Scholar] [CrossRef] [PubMed]
  32. De Gisi, S.; Lofrano, G.; Grassi, M.; Notarnicola, M. Characteristics and Adsorption Capacities of Low-Cost Sorbents for Wastewater Treatment: A Review. Sustain. Mater. Technol. 2016, 9, 10–40. [Google Scholar] [CrossRef] [Green Version]
  33. Ali, I.; Asim, M.; Khan, T.A. Low Cost Adsorbents for the Removal of Organic Pollutants from Wastewater. J. Environ. Manag. 2012, 113, 170–183. [Google Scholar] [CrossRef]
  34. Sophia, A.C.; Lima, E.C. Removal of Emerging Contaminants from the Environment by Adsorption. Ecotoxicol. Environ. Saf. 2018, 150, 1–17. [Google Scholar] [CrossRef]
  35. Tapia-Orozco, N.; Ibarra-Cabrera, R.; Tecante, A.; Gimeno, M.; Parra, R.; Garcia-Arrazola, R. Removal Strategies for Endocrine Disrupting Chemicals Using Cellulose-Based Materials as Adsorbents: A Review. J. Environ. Chem. Eng. 2016, 4, 3122–3142. [Google Scholar] [CrossRef]
  36. Franco, A.; Fu, W.; Trapp, S. Influence of Soil PH on the Sorption of Ionizable Chemicals: Modeling Advances. Environ. Toxicol. Chem. 2009, 28, 2018. [Google Scholar] [CrossRef] [PubMed]
  37. Valhondo, C.; Martinez-Landa, L.; Carrera, J.; Ayora, C.; Nödler, K.; Licha, T. Evaluation of EOC Removal Processes during Artificial Recharge through a Reactive Barrier. Sci. Total Environ. 2018, 612, 985–994. [Google Scholar] [CrossRef]
  38. Hellman, M.; Valhondo, C.; Martínez-Landa, L.; Carrera, J.; Juhanson, J.; Hallin, S. Nitrogen Removal Capacity of Microbial Communities Developing in Compost- and Woodchip-Based Multipurpose Reactive Barriers for Aquifer Recharge with Wastewater. Front. Microbiol. 2022, 13, 877990. [Google Scholar] [CrossRef]
  39. Abu, A.; Carrey, R.; Valhondo, C.; Domènech, C.; Soler, A.; Martínez-Landa, L.; Diaz-Cruz, S.; Carrera, J.; Otero, N. Pathways and Efficiency of Nitrogen Attenuation in Wastewater Effluent through Soil Aquifer Treatment. J. Environ. Manag. 2022, 321, 115927. [Google Scholar] [CrossRef]
  40. Valhondo, C.; Carrera, J.; Martínez-Landa, L.; Wang, J.; Amalfitano, S.; Levantesi, C.; Diaz-Cruz, M.S. Reactive Barriers for Renaturalization of Reclaimed Water during Soil Aquifer Treatment. Water 2020, 12, 1012. [Google Scholar] [CrossRef] [Green Version]
  41. Chen, Z.; Ma, W.; Lu, G.; Meng, F.; Duan, S.; Zhang, Z.; Wei, L.; Pan, Y. Adsorption of Levofloxacin onto Mechanochemistry Treated Zeolite: Modeling and Site Energy Distribution Analysis. Sep. Purif. Technol. 2019, 222, 30–34. [Google Scholar] [CrossRef]
  42. Espinosa, N.J.; Moore, D.J.P.; Rasmussen, C.; Fehmi, J.S.; Gallery, R.E. Woodchip and Biochar Amendments Differentially Influence Microbial Responses, but Do Not Enhance Plant Recovery in Disturbed Semiarid Soils. Restor. Ecol. 2020, 28, S381–S392. [Google Scholar] [CrossRef]
  43. Palansooriya, K.N.; Shaheen, S.M.; Chen, S.S.; Tsang, D.C.W.; Hashimoto, Y.; Hou, D.; Bolan, N.S.; Rinklebe, J.; Ok, Y.S. Soil Amendments for Immobilization of Potentially Toxic Elements in Contaminated Soils: A Critical Review. Environ. Int. 2020, 134, 105046. [Google Scholar] [CrossRef] [PubMed]
  44. Ahmad, M.; Rajapaksha, A.U.; Lim, J.E.; Zhang, M.; Bolan, N.; Mohan, D.; Vithanage, M.; Lee, S.S.; Ok, Y.S. Biochar as a Sorbent for Contaminant Management in Soil and Water: A Review. Chemosphere 2014, 99, 19–33. [Google Scholar] [CrossRef] [PubMed]
  45. Belhachemi, M. Chapter 14—Adsorption of Organic Compounds on Activated Carbons. In Sorbents Materials for Controlling Environmental Pollution; Núñez-Delgado, A., Ed.; Elsevier: Amsterdam, The Netherlands, 2021; pp. 355–385. ISBN 978-0-12-820042-1. [Google Scholar]
  46. Boehm, A.B.; Bell, C.D.; Fitzgerald, N.J.M.; Gallo, E.; Higgins, C.P.; Hogue, T.S.; Luthy, R.G.; Portmann, A.C.; Ulrich, B.A.; Wolfand, J.M. Biochar-Augmented Biofilters to Improve Pollutant Removal from Stormwater-Can They Improve Receiving Water Quality? Environ. Sci. Water Res. Technol. 2020, 6, 1520–1537. [Google Scholar] [CrossRef] [Green Version]
  47. Paradelo, R.; Al-Zawahreh, K.; Barral, M.T. Utilization of Composts for Adsorption of Methylene Blue from Aqueous Solutions: Kinetics and Equilibrium Studies. Materials 2020, 13, 2179. [Google Scholar] [CrossRef] [PubMed]
  48. Scherrer, R.A.; Howard, S.M. Use of Distribution Coefficients in Quantitative Structure-Activity Relationships. J. Med. Chem. 1977, 20, 53–58. [Google Scholar] [CrossRef]
  49. Li, X.; Zhao, C.; Zhang, M. Chapter 8—Biochar for Anionic Contaminants Removal from Water. In Biochar from Biomass and Waste; Ok, Y.S., Tsang, D.C.W., Bolan, N., Novak, J.M., Eds.; Elsevier: Amsterdam, The Netherlands, 2019; pp. 143–160. ISBN 978-0-12-811729-3. [Google Scholar]
  50. ter Laak, T.L.; Gebbink, W.A.; Tolls, J. The Effect of PH and Ionic Strength on the Sorption of Sulfachloropyridazine, Tylosin, and Oxytetracycline to Soil. Environ. Toxicol. Chem. 2006, 25, 904–911. [Google Scholar] [CrossRef] [PubMed]
  51. Schaffer, M.; Kröger, K.F.; Nödler, K.; Ayora, C.; Carrera, J.; Hernández, M.; Licha, T. Influence of a Compost Layer on the Attenuation of 28 Selected Organic Micropollutants under Realistic Soil Aquifer Treatment Conditions: Insights from a Large Scale Column Experiment. Water Res. 2015, 74, 110–121. [Google Scholar] [CrossRef] [PubMed]
  52. Sunyer-Caldú, A.; Benedetti, B.; Valhondo, C.; Martínez-Landa, L.; Carrera, J.; Di Carro, M.; Magi, E.; Diaz-Cruz, M.S. Using Integrative Samplers to Estimate the Removal of Pharmaceuticals and Personal Care Products in a WWTP and by Soil Aquifer Treatment Enhanced with a Reactive Barrier. Sci. Total Environ. 2023, 867, 161466. [Google Scholar] [CrossRef] [PubMed]
  53. Gil, A.; Taoufik, N.; García, A.M.; Korili, S.A. Comparative Removal of Emerging Contaminants from Aqueous Solution by Adsorption on an Activated Carbon. Environ. Technol. 2019, 40, 3017–3030. [Google Scholar] [CrossRef]
  54. Desta, M.B. Batch Sorption Experiments: Langmuir and Freundlich Isotherm Studies for the Adsorption of Textile Metal Ions onto Teff Straw (Eragrostis Tef) Agricultural Waste. J. Thermodyn. 2013, 2013, 375830. [Google Scholar] [CrossRef] [Green Version]
  55. Saad, D.M.G.; Cukrowska, E.M.; Tutu, H. Phosphonated Cross-Linked Polyethylenimine for Selective Removal of Uranium Ions from Aqueous Solutions. Water Sci. Technol. 2012, 66, 122–129. [Google Scholar] [CrossRef] [PubMed] [Green Version]
  56. Rossner, A.; Snyder, S.A.; Knappe, D.R.U. Removal of Emerging Contaminants of Concern by Alternative Adsorbents. Water Res. 2009, 43, 3787–3796. [Google Scholar] [CrossRef]
  57. Lian, F.; Sun, B.; Song, Z.; Zhu, L.; Qi, X.; Xing, B. Physicochemical Properties of Herb-Residue Biochar and Its Sorption to Ionizable Antibiotic Sulfamethoxazole. Chem. Eng. J. 2014, 248, 128–134. [Google Scholar] [CrossRef]
  58. Oh, S.-Y.; Seo, Y.-D. Sorption of Halogenated Phenols and Pharmaceuticals to Biochar: Affecting Factors and Mechanisms. Environ. Sci. Pollut. Res. 2016, 23, 951–961. [Google Scholar] [CrossRef]
  59. Hopkins, M.A.M.; Kuster, A.M.; Vogel, J.R.; Brown, G.O. Pollutant Removal in Stormwater by Woodchips. Int. J. Environ. Sci. Nat. Resour. 2021, 26, 154–160. [Google Scholar] [CrossRef]
  60. Scheytt, T.J.; Mersmann, P.; Heberer, T. Mobility of Pharmaceuticals Carbamazepine, Diclofenac, Ibuprofen, and Propyphenazone in Miscible-Displacement Experiments. J. Contam. Hydrol. 2006, 83, 53–69. [Google Scholar] [CrossRef]
  61. Villaescusa, I.; Fiol, N.; Poch, J.; Bianchi, A.; Bazzicalupi, C. Mechanism of Paracetamol Removal by Vegetable Wastes: The Contribution of π–π Interactions, Hydrogen Bonding and Hydrophobic Effect. Desalination 2011, 270, 135–142. [Google Scholar] [CrossRef]
  62. Chefetz, B.; Mualem, T.; Ben-Ari, J. Sorption and Mobility of Pharmaceutical Compounds in Soil Irrigated with Reclaimed Wastewater. Chemosphere 2008, 73, 1335–1343. [Google Scholar] [CrossRef]
  63. Wang, J.; Carrera, J.; Saaltink, M.W.; Valhondo, C. On the Localization of Chemical Reactions in Multicontinuum Media. Adv. Water Resour. 2022, 167, 104286. [Google Scholar] [CrossRef]
  64. Lu, L.; Chen, B. Enhanced Bisphenol A Removal from Stormwater in Biochar-Amended Biofilters: Combined with Batch Sorption and Fixed-Bed Column Studies. Environ. Pollut. 2018, 243, 1539–1549. [Google Scholar] [CrossRef] [PubMed]
Figure 1. Influence of the solid:water ratio (volumetric) (AC) (tested for contact time of 60 min) and influence of the contact time (in minutes) (DF) (tested for a material:water ratio of 1:3) on the sorption of the selected PhACs on sand (A,D), clay (B,E), and compost (C,F) in batch experiments performed with milli-Q water and crushed materials. Errors bars display the variability within the three replicates.
Water 15 01393 g001
Figure 2. Sorption on sand (A), clay (B), and compost (C) calculated from batch experiment with 60 min contact time, 1:3 solid: water ratio, non-crushed materials in milli Q-water (pale blue), crushed materials in milli Q-water (dark blue), and crushed materials in SWW (green). Variability in the triplicates is displayed as error bars. PhACs with dominant neutral, anionic, and cationic fractions are grouped in black, red, and blue squares, respectively.
Water 15 01393 g002
Figure 3. Boxplot displaying the distribution (outliers; 25th, 50th, and 75th percentiles; and maximum) of the sorption of the 12 studied PhACs (A). The sorption of anionic (red), neutral (blue), and cationic (green) species (B) on sand (red), clay (pale blue), zeolite (dark blue), biochar (orange), compost (yellow), and woodchips (dark green).
Water 15 01393 g003
Figure 4. Sorption in sand (red), clay (pale blue), zeolite (dark Blue), biochar (orange), compost (yellow), and woodchips (green) of the neutral (A) and anionic species (B) versus their Log Kow.
Water 15 01393 g004
Figure 5. Sorption versus the amount of OC(g) (A) for each batch experiment and a linear fit for anionic (B) and logarithmic fit for neutral (C) and cationic (D) species.
Water 15 01393 g005
Table 1. Physicochemical properties of the tested materials.
Material%OCpH (Eq with Water)CEC (meq/100 g)Reactive Surface (m2/g)
Clay3.118.7120.423
Sand0.738.52.33
Zeolite3.766.3616.633
Biochar83.329.386.998
Vegetable Compost 21.037.8243.95
Woodchips94.835.2610.7-
Table 2. Physicochemical properties of the studied PhACs.
MoleculeAcronymFormula aSolubility in Water a (mg/L)Molecular Weight apKa a (Character)Log KowaSpecies b at pH=
468
SulfamethoxazoleSMXC10H11N3O3S610253.281.6 (A), 5.7 (B)0.8900, −
OxazepamOXAC15H11ClN2O220286.711.55 (B), 10.9 (A)2.24000
CarbamazepineCBZC15H12N2O18236.27−3.8 (B), 13.9 (A)2.45000
DiazepamDIAC16H13ClN2O66284.743.4 (B)2.82+, 000
PropanololPRLC16H21NO262259.349.42 (B)3.48+++
AtenololATLC14H22N2O313266.349.6 (B)0.16+++
VenlafaxineVLXC17H27NO2572277.410.09 (B)3.2+++
Fenofibric AcidFFAC17H15ClO45318.73.1 (A)4.450, −
DiclofenacDCLC14H11Cl2NO22296.14.15 (A)4.510, −
KetoprofenKTOC16H14O351254.284.45 (A)3.120, −
IbuprofenIBUC13H18O221206.285.3 (A)3.9700, −
ParacetamolPRMC8H9NO214151.169.38 (A)0.46000, −
Notes: a Data from PubChem.ncbi database. Acid (A) and basic (B) character of the ionizable functional group. b Species molar fraction calculated with Henderson–Hasselbalch equation. Charge of the occurring species according to their pKa: (0) neutral; (+) cation; (−) anion.
Disclaimer/Publisher’s Note: The statements, opinions and data contained in all publications are solely those of the individual author(s) and contributor(s) and not of MDPI and/or the editor(s). MDPI and/or the editor(s) disclaim responsibility for any injury to people or property resulting from any ideas, methods, instructions or products referred to in the content.

