Article

Impacts of River Bank Filtration on Groundwater Hydrogeochemistry in the Upper of Hutuo River Alluvial Plain, North China

1
Institute of Geophysical and Geochemical Exploration, Chinese Academy of Geological Sciences, Langfang 065000, China
2
Fujian Provincial Key Laboratory of Water Cycling and Eco-Geological Processes, Xiamen 361000, China
3
Institute of Hydrogeology and Environmental Geology, Chinese Academy of Geological Sciences, Shijiazhuang 050061, China
4
Shijin Irrigation District Affairs Center of Hebei Province, Shijiazhuang 050051, China
*
Author to whom correspondence should be addressed.
Water 2023, 15(7), 1343; https://doi.org/10.3390/w15071343
Submission received: 10 February 2023 / Revised: 9 March 2023 / Accepted: 28 March 2023 / Published: 30 March 2023
(This article belongs to the Special Issue River Ecological Restoration and Groundwater Artificial Recharge II)

Abstract

:
River bank filtration (RBF) under human supervision has been applied for groundwater recharge. This study clarified the characteristics of water composition and its origins during the reservoir water recharge RBF. The groundwater samples were collected during four periods: pre-recharge (June 2018), early recharge (November 2018), intermediate recharge (May 2019), and late recharge (October 2019). Hydrogeochemical methods (Piper diagram, chlor-alkali index, and ion correlation) and principal component analysis (PCA) were used to analyze the chemical evolution of groundwater in the aforementioned periods. TDS concentration tended to increase in the later stage due to the aggravation of carbonate rock dissolution and cation exchange adsorption. Results demonstrated a small, temporary influence of reservoir water on groundwater, characterized as the Ca–Mg–HCO3–SO4 and Ca–Mg–SO4–HCO3 types, both before and after the recharge. The research on water chemistry changes under different mixing ratios depicts that the continuation of the recharge process promotes mineral dissolution. Rock dissolution was the primary environmental control factor of groundwater components during the recharge period. This strengthened the water–rock reaction and caused potential risk impacts such as the increase of nitrate.

1. Introduction

The over-exploitation of groundwater is a global challenge at present because it is jointly affected by increased water demand and the instability brought by climate change [1]. The uncertainty of water resources availability demands a solvent that can function both as the water storage area and an energy-efficient treatment process [2]. River bank filtration (RBF), which is also known as Bank filtrate or filtration (BF), has been a natural process for managed aquifer recharge (MAR) with low regulation cost and high efficiency in the removal of contaminants [3,4,5]. As reviewed by Dillon et al. [6], the aquifer recharge started at the end of the 18th century, when a few human intervention measures to improve the efficiency of groundwater recharge were adopted in some European countries; however, those processes were generally incidental and not well-managed. In addition to increased scientific research and practical experience, more MAR technics have been developed within the last 60 years [6]. MAR can be categorized into three types by the way of recharge: (i) infiltration method, (ii) direct injection method, and (iii) filtration method [6,7,8,9]. RBF is an induced recharge method and is considered as filtration in the abovementioned categorization [10].
When river water is replenished into the aquifer, it undergoes hydrogeochemical processes such as water–rock interaction, mixing, and cation exchange adsorption. These processes can lead to changes in groundwater chemistry by altering its components [10,11,12]. Studies in India and Finland have discovered the effect of ion exchange adsorption and water–rock interaction on groundwater chemistry during RBF replenishment [13,14]. In a specific location in Mexico, replenishing groundwater through river infiltration caused a change in its acid–base balance, resulting in an altered water–rock interaction [15]. During ecological water replenishment in Ejina Banner, the water chemistry type remained relatively stable, but with an increase in the concentration of major ions [16]. In an experimental study of infiltrating south-to-north water to replenish groundwater in the Yongding River, Beijing, researchers found that the replenishment process can change water–rock interaction [17].
It is a current research hotspot in RBF by using unique water sources. The infiltration of river water into the aquifer is affected by factors such as temperature and redox potential, resulting in changes in the concentrations of major ions and TDS in groundwater [18,19]. When using reclaimed water to replenish groundwater through RBF, mixing, water–rock interaction, and cation exchange are enhanced [20,21]. In addition, colloidal particles present in the soil can adsorb organic pollutants in reclaimed water [22,23]. The use of flood or rainwater to infiltrate and replenish groundwater through rivers can easily alter the redox conditions of groundwater, and thus, lead to further changes in hydrogeochemical processes [24,25]. The replenishment of reservoir water through rivers is highly dependent on the amount and timing of replenishment, resulting in a phased change in groundwater volume and chemical composition [26,27,28]. Although research on reservoir water replenishment tends to focus on the replenishment amount [29], there has been relatively less attention on studying the changes in groundwater chemistry. Therefore, it is crucial to investigate the changes in groundwater chemistry resulting from the river bank filtration of reservoir water to replenish groundwater.
The Hutuo River alluvial fan of the North China Plain is a critical local economic development zone, but ecological and environmental problems such as spring water cutoff and river drying are severe [30], which have attracted considerable attention from hydrogeologists [31]. To improve the situation, the Huangbizhuang Reservoir in the upper Hutuo River intermittently released water to the dry Hutuo River channel to recharge the groundwater by RBF. The purpose of this study was to analyze the characteristics and impacts of the intrinsic changes for using reservoir water to recharge groundwater by RBF. A conclusion on the possible environmental problems caused by groundwater recharge was reached to support water management strategies and to further increase both the quantity and quality of local groundwater resources.

2. Study Area

The Hutuo RBF area is located in the North China Plain. The river began to dry up after 1980, and the rainy season did not contribute much water. The investigation site covers the area from Huangbizhuang Town (in southwestern Hebei Province, China), to Zhengding County in the middle and lower reaches (38.15°–38.31° N, 114.21°–114.49° E), with an approximate area of 236.88 km2 (Figure 1). The temperate semi-humid and semi-arid continental monsoon climate is the dominant climate type in this region. The upstream average temperature for many years has been 6.4 °C. The average annual precipitation is 484.0 mm, whereas the spatial and temporal distribution of precipitation is uneven [32,33]. The rainy season (from June to August) accounts for 70–85% of the total annual rainfall [34]. The study area is located in the upper of the Hutuo River alluvial fan. The eastern part of this region is the groundwater divide, and the Huangbizhuang Reservoir is situated northwest of this zone. The groundwater in the study area flows from the northwest to the southeast, and the flow direction changes a little before and after water replenishment.
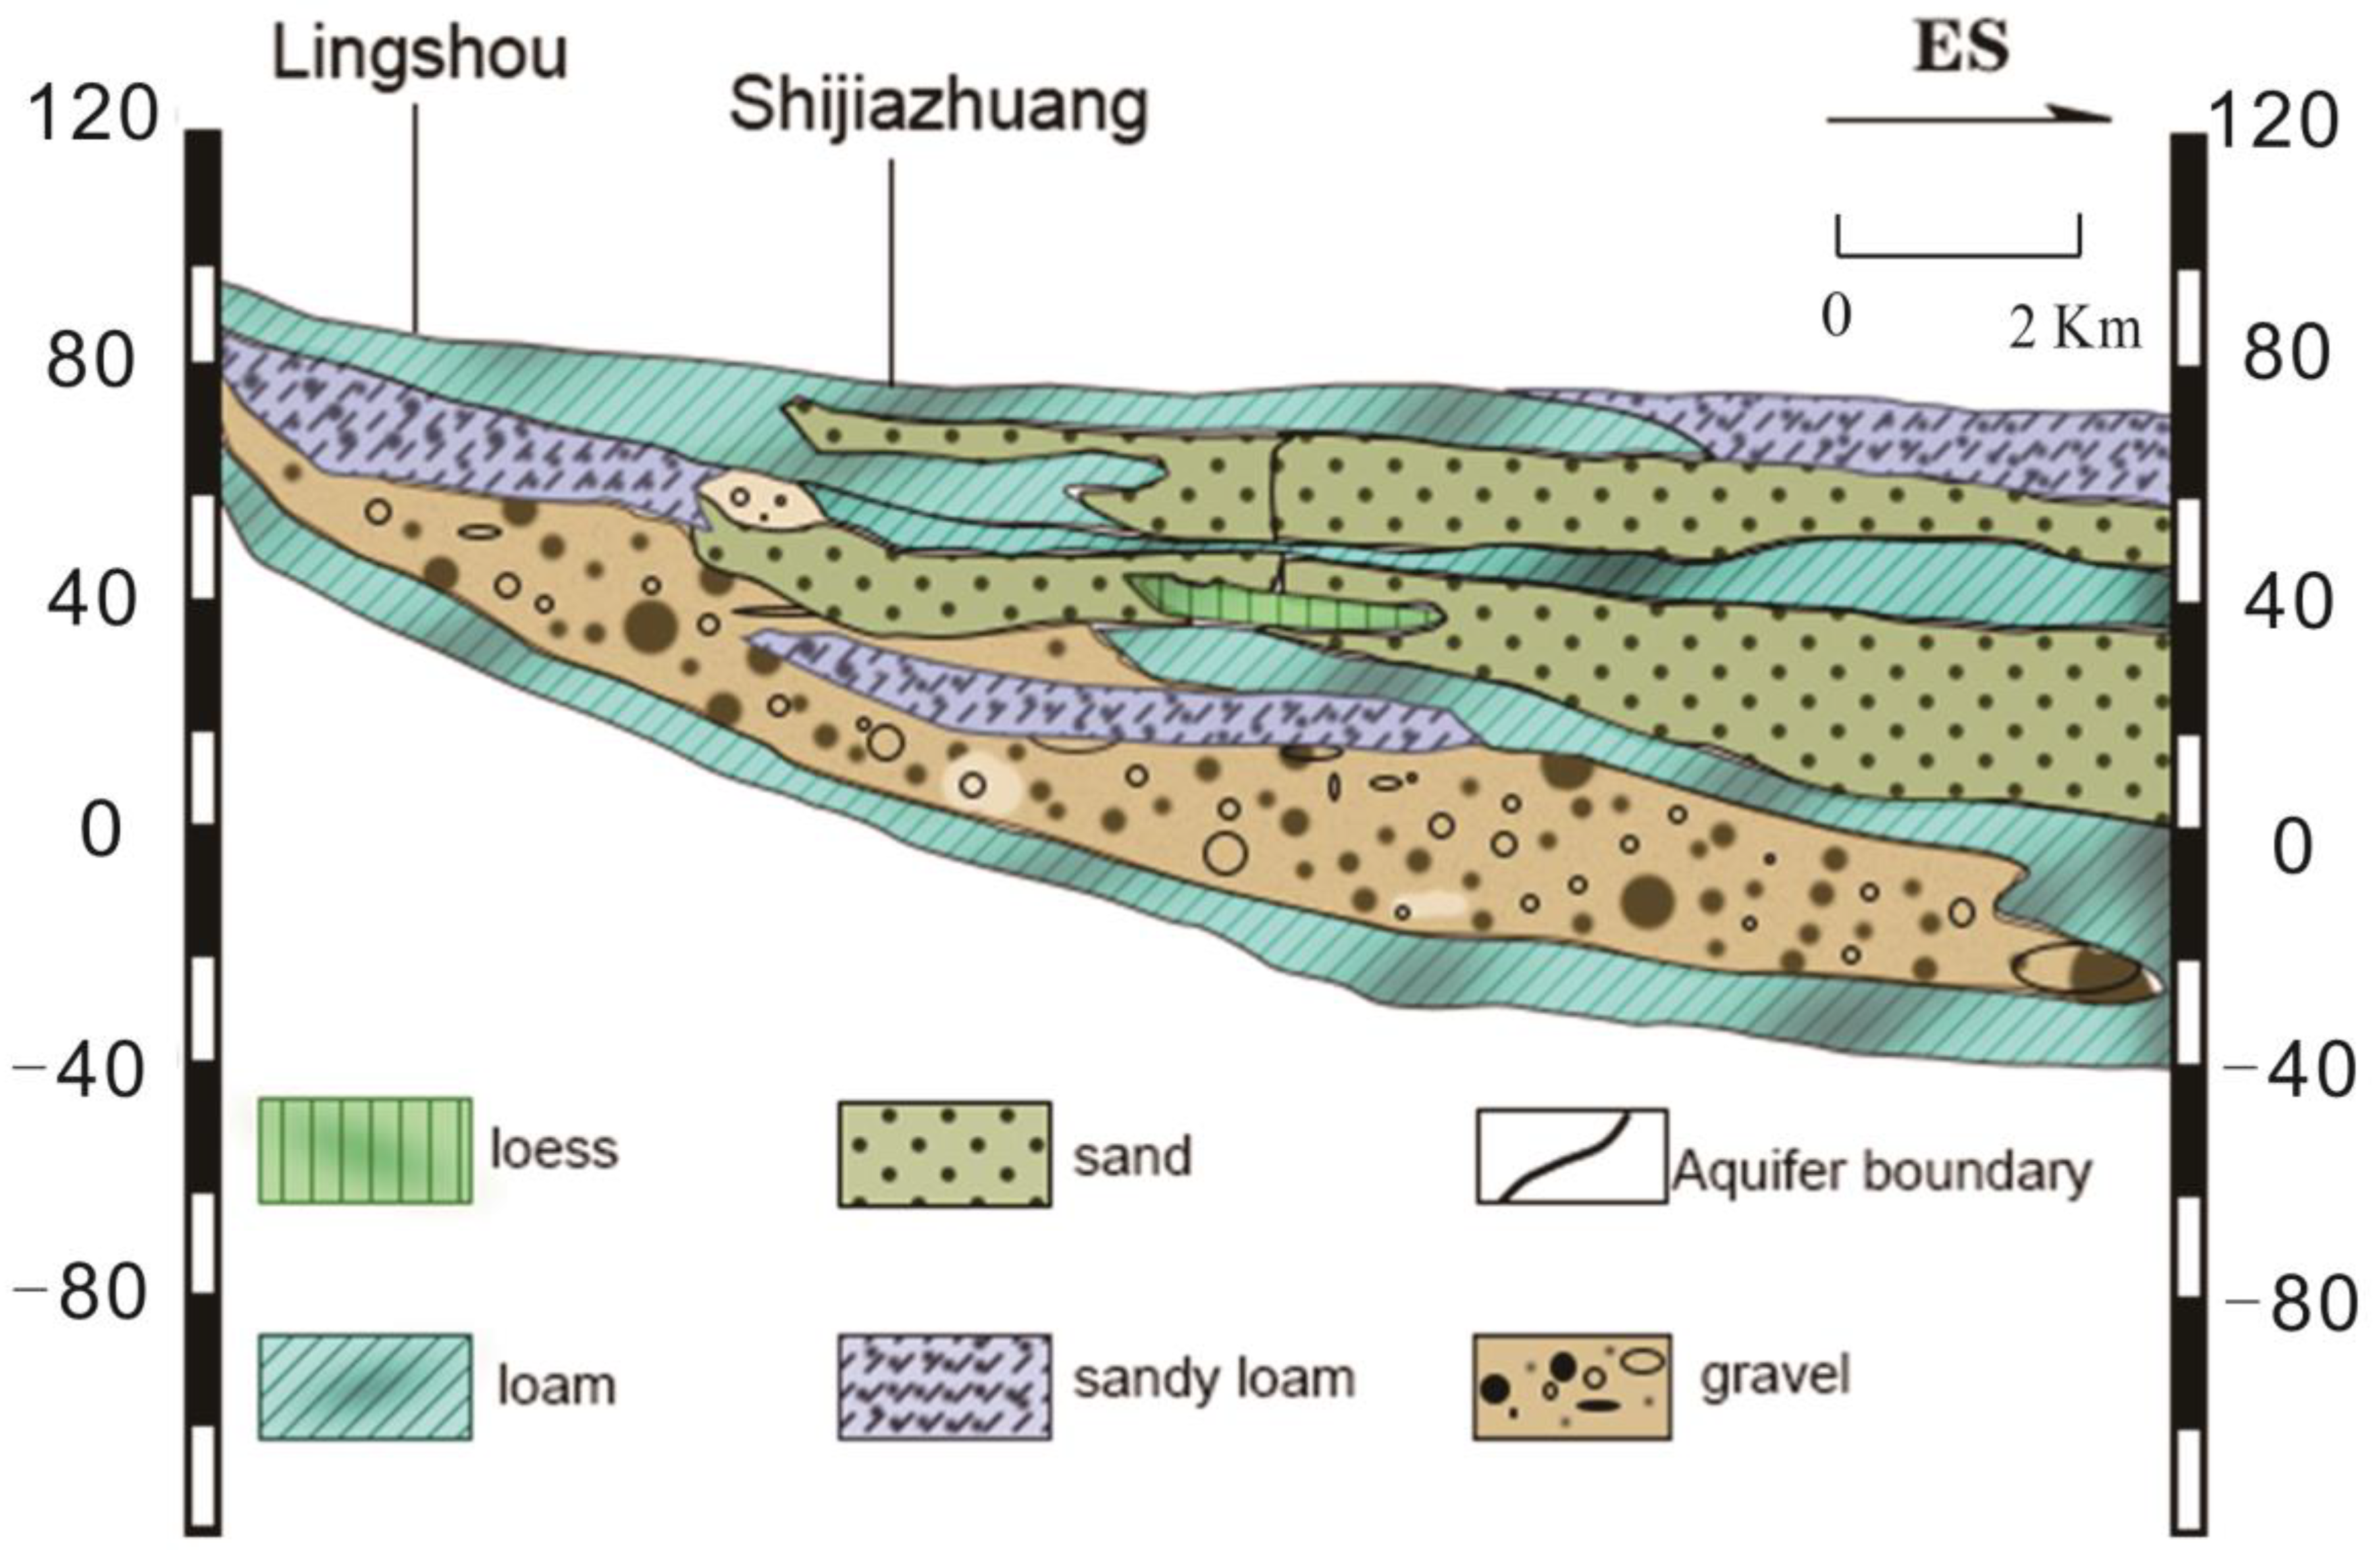
The groundwater in this section is a phreatic, slightly confined water aquifer group composed of the Holocene (Q4) and Upper Pleistocene (Q33) sediments. The aquifer primarily consists of quaternary cobbles, gravel, sand, laminated or lensed loam, and sandy loam. The aquifer is mainly composed of pebbles and gravel sand, and its upper part is dry. The southeast of the region has a thinning interlaced sedimentary zone, where the vadose zone is mainly composed of cohesive soil. In accordance with the drilling core test results and previous studies, the aquifer contains calcite, dolomite, rock salt, gypsum, and mirabilite [35,36,37,38]. The water table depth in this area is mainly 8.2–40.1 m. The bottom interface depth is generally 40–60 m. It is a single and two-layer aquifer structure, with good water permeability, and the water conductivity is more than 5000 m2/d. The sources of groundwater recharge mainly include atmospheric precipitation, lateral runoff, reservoir channel leakage, and channel infiltration recharge. In accordance with the local government policy, groundwater has not been exploited in recent years for level restoration [39]. Near the river bed, there are continuous sand, gravel, pebble layers, and partially viscous clay lens. The upper part is mainly fine sand and medium-coarse sand, with a thickness of 5–22 m and large permeability, which provides a great infiltration condition. In addition, the near-mountain plains are connected with the water bodies of mountain valleys and plains, and the lateral runoff conditions are good. The salinity of groundwater is less than 1 g/L. With the gradual transition of the southeast alluvial fans to the inter-fan and front-fan zones, the thickness of the aquifer decreases, the medium particles become finer, the clay layers of varying thickness are sandwiched between the layers, and the water permeability and water conductivity are significantly reduced (Figure 2).
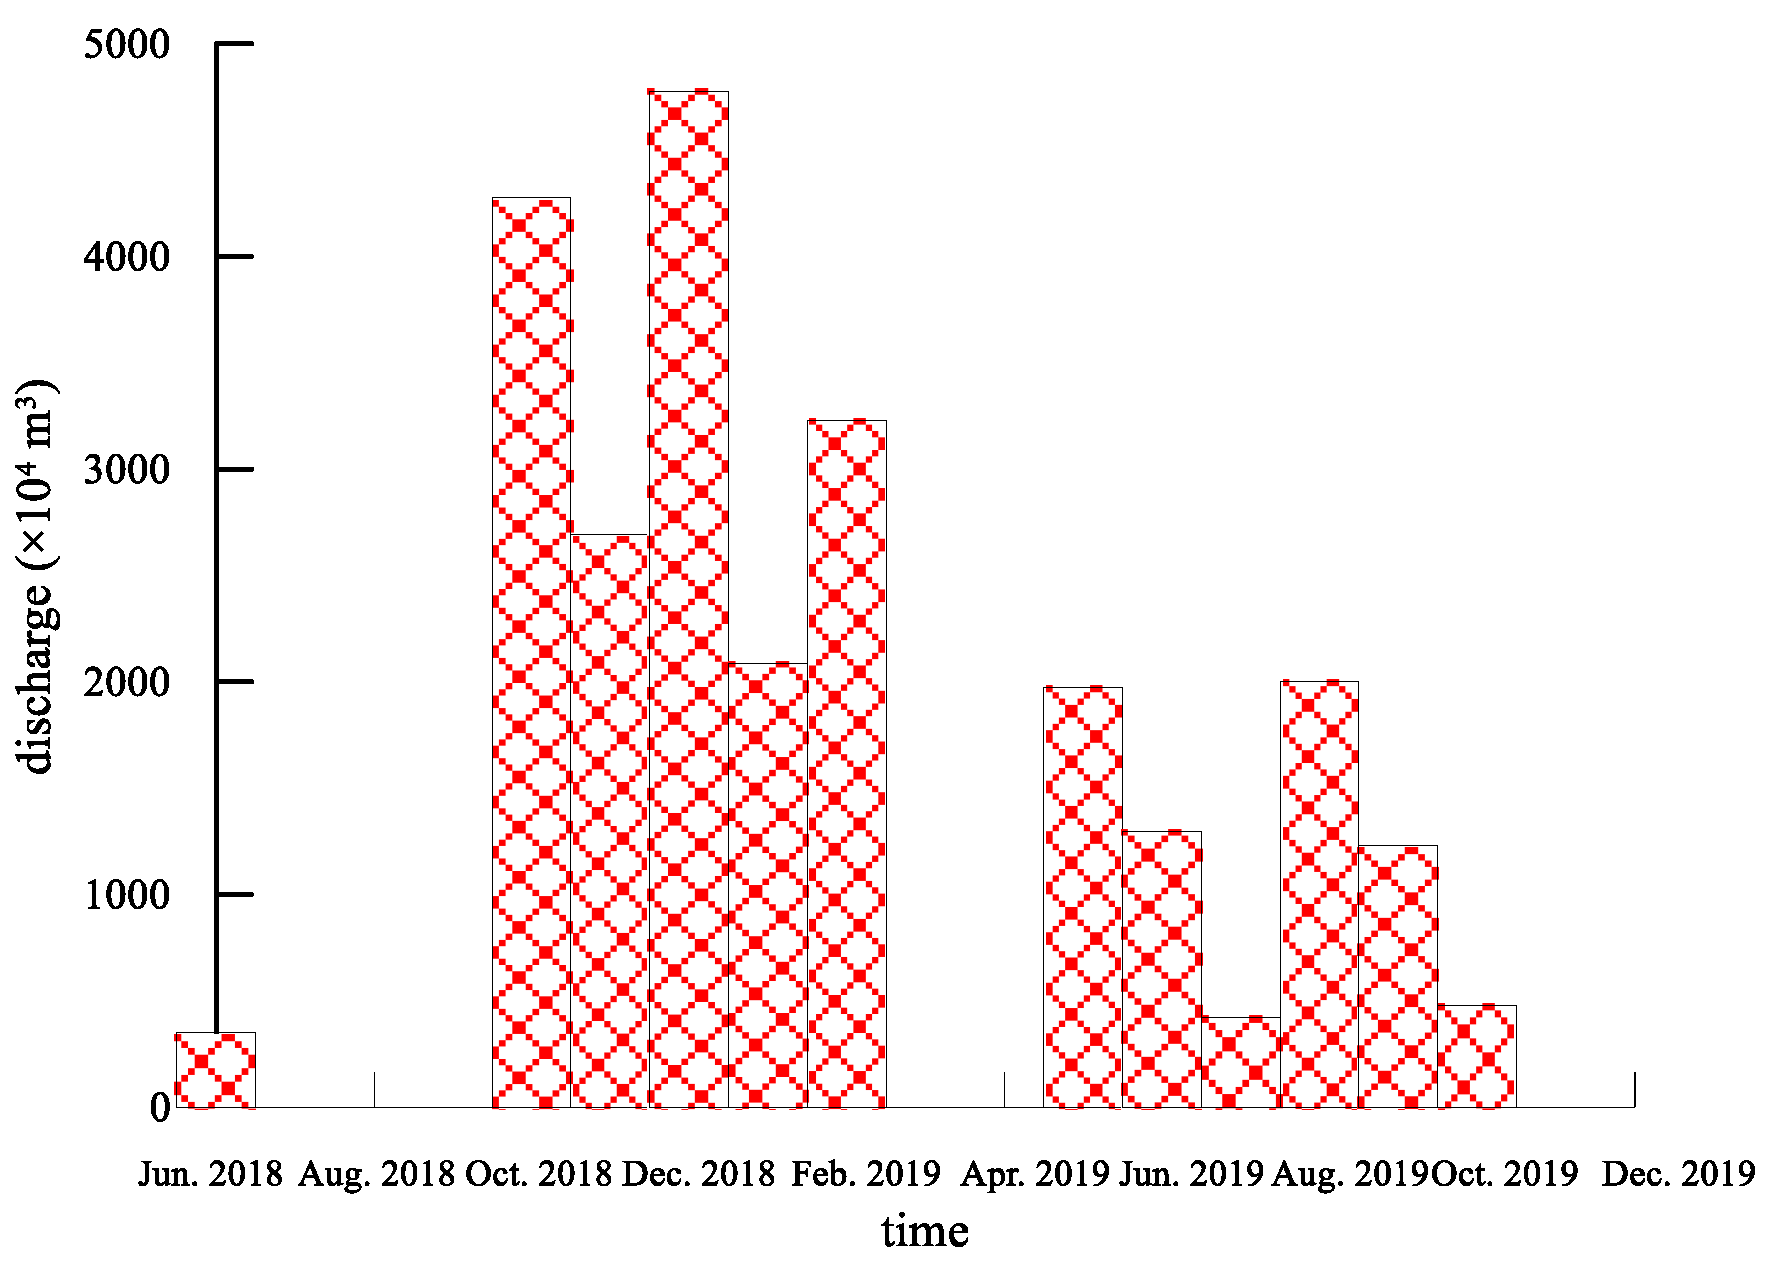
With a severe drought condition in the Hutuo river, the study area is mainly recharged by the discharge of the Huangbizhuang Reservoir that implements a non-sustainable water drainage measure. The water drainage operation is carried out within a few months before the rainy season. Most of the water released leaks into the groundwater layer through the river channel, while the rest continues to flow to the downstream area. Hence, the study area is considered as the infiltration site. From 2018 to 2020, water had been intermittently recharged in the upper of the Hutuo River. The amount of monthly reservoir water discharge is shown in Figure 3. In June 2018, the amount of reservoir discharge was 352 × 104 m3. From October 2018 to February 2019, the discharge of reservoir water reached its peak, of which the maximum discharge was 0.478 × 10⁸ m3 in December 2018. The total amount of water discharge in 2018 was 1.21 × 10⁸ m3. Draining was not observed in March, April, November, and December of 2019. The maximum amount of water discharge and the total water discharge were 0.323 × 10⁸ m3 and 1.21 × 10⁸ m3, respectively, in 2019. The reservoir water release in 2019 was 900 × 104 m3 more than that in 2018. From June 2018 to December 2019, the total accumulated water release of the reservoir was 2.51 × 10⁸ m3, with an average monthly replenishment of 0.13 × 10⁸ m3.

3. Materials and Methods

3.1. Water Sample Collection

To research the changes in the chemical characteristics of groundwater caused by BRF of reservoir water, the reservoir water samples and groundwater samples at four different periods were collected. Their locations are shown in Figure 1. The reservoir water samples were collected in November 2018. The groundwater sampling time was June 2018 (pre-recharge), November 2018 (early recharge), May 2019 (intermediate recharge), and October 2019 (late recharge), and a total of 51 samples were collected. The groundwater samples were taken from wells for domestic and agricultural purposes, with a depth range of 35–70 m. The length of screen pipes in all sampling wells ranged from 1 to 10 m, and each sampling well had only one screen pipe rather than multiple screens. The distance between the bottom of the screen pipe and the total well depth ranged from 10 to 20 m in the study area. The samples were collected using pumps installed in these wells. Prior to sampling, several water volumes were removed. The polyethylene sampling bottles were purged with ultrapure water and subsequently rinsed thrice with local groundwater samples. For routine anion and cation determination, 1.5 L groundwater was collected. For trace element detection, 500 mL groundwater samples were collected, and to adjust pH < 2, 1:1 HNO3 was added.

3.2. Analysis and Testing

On-site water chemistry parameters were monitored using calibrated instruments. Total dissolved solids (TDS), temperature, DO, and pH of the water samples were measured on-site. The stopping criterion was the steady state of the measured values.
The cations K+, Na+, Ca2+, and Mg2+ were analyzed using inductively coupled plasma (ICP-900, Thermo, Waltham, MA, USA). The anions Cl, SO42− and NO3 were analyzed using ion chromatography (ICS-900, Dionex, Sunnyvale, CA, USA), and the anions HCO3 and CO32− were analyzed using on-site titration. HCO3 concentrations in all groundwater samples were determined by the titration method using 0.0048 M H2SO4; methyl orange endpoint titration was adopted with a final pH of 4.2–4.4. CO32− concentrations were also analyzed by titration; phenolphthalein was used as an indicator of endpoint titration. The charge balance errors for all the samples were within 10%. The samples taken were sent to the Groundwater Mineral Water and Environmental Supervising and Testing Center of the Ministry of Natural Resources for testing.

4. Results

4.1. Hydrochemical Characteristics of Groundwater

The on-site water quality parameters such as pH and TDS of groundwater samples, as well as the analysis data of major ion compositions, are shown in Table 1. The average pH value of groundwater decreased from 7.82 to 7.69 (June 2018–October 2019), the maximum decreased from 8.10 to 7.85, and the medium value decreased from 7.86 to 7.67. The average TDS value of groundwater decreased from 737 mg/L to 710 mg/L (June 2018–October 2019), and the maximum decreased from 1183 mg/L to 1009 mg/L. The average concentration of TDS (mg/L) in June 2018 (pre-recharge) was 737 mg/L, which was reduced to 632 mg/L in November 2018 (early recharge), and then rebounded to a higher level of 753 mg/L in November 2019 (late recharge). DO and temperature changed slightly, and the average temperature and DO are approximately 14 °C and 7.3.
The overall distribution of the chemical types of groundwater in the study area is given by the average values of ion contents. Bicarbonate and sulfate water is the main type and their content is much higher than that of the other ions. The calcium and magnesium ion content is substantially larger than that of the other cations. Irrespective of the recharge, the general order of abundance of the major cations was Ca2+, Mg2+, Na+, and K+, whereas the abundance of major anions was that HCO3 and SO42− far exceeded Cl. The June 2018 (pre-recharge) concentrations of major ions were the highest, whereas those of November 2018 (the early recharge) were the lowest. From November 2018 (early recharge) to October 2019 (late recharge), the concentrations of major ions increased gradually. From June 2018 (pre-recharge) to October 2019 (late recharge), the mean concentrations of HCO3- varied from 270.48 to 298.3 mg/L, and those of Mg2+ varied from 39.65 to 45.01 mg/L. The concentration of Mg2+ and HCO3 in the late recharge period is higher than that in the pre-recharge period, whereas it is the opposite for the other ions.
To minimize the seasonal variation of nitrate, the comparison was between the same seasons of the years. After recharging, the average concentration of nitrate in groundwater increased by 12.15 mg/L from 54.19 mg/L (June 2018, pre-recharge) to 66.34 mg/L (May 2019, intermediate recharge). Except for H1-07 and H1-19, the nitrate content of other wells decreased from June 2018 to May 2019. H1-19 was located in the farmer’s yard, and there was a sudden increase of nitrate caused by human pollution. Therefore, anthropogenic factors led to an increase in nitrate content.

4.2. Hydrochemical Facies

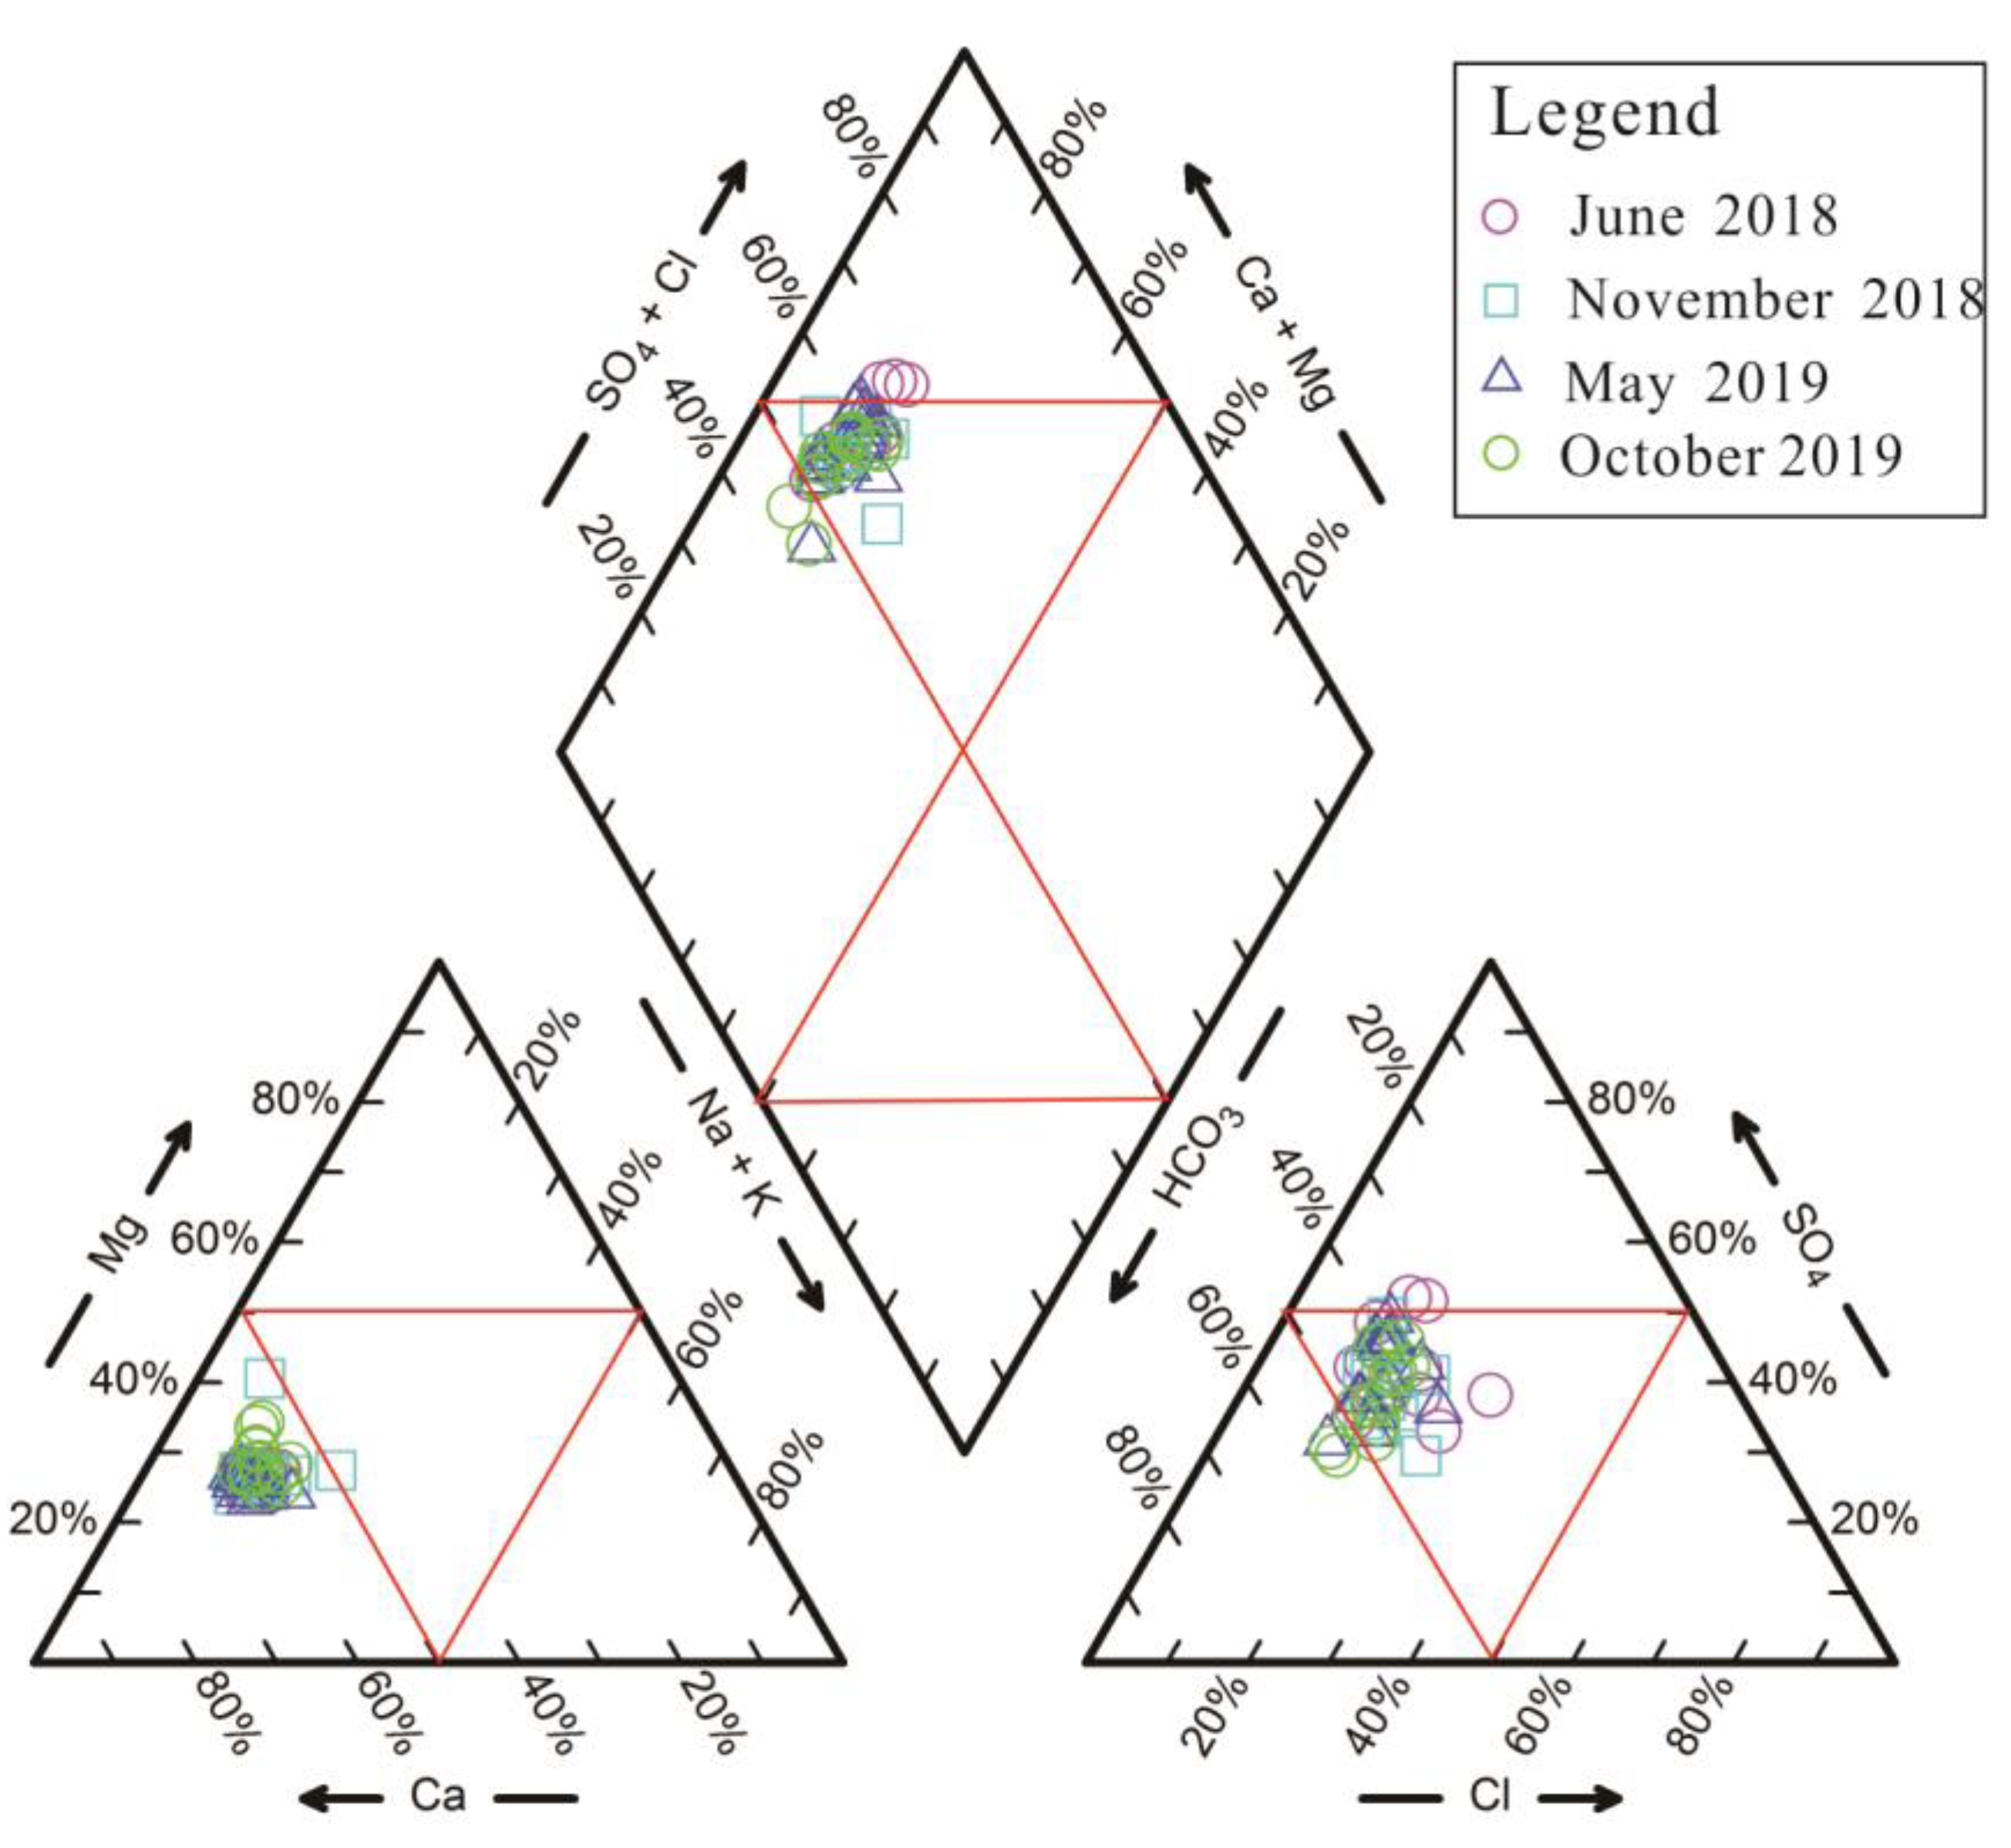
The Piper diagram has not been disturbed by human subjective factors [40], and is a common method to identify the main ion composition of water chemistry [41,42]. Piper plots are created using the main ion data for groundwater in the study area (Figure 4). Two samples in October 2019 (late recharge) and one sample in May 2019 (intermediate recharge) are scattered in the zone of the left lower triangle predominated by the bicarbonate-type. Two samples in June 2018 (pre-recharge) are scattered in the zone of the upper triangle where the sulfate-type predominates. The central diamond plot provides important information to discriminate between separate groups of samples. Most samples are scattered in the mixed-type zone, and such samples are the most common in groundwater chemistry in the recharge period. From June 2018 (pre-recharge) to October 2019 (late recharge), groundwater types in the study area were mainly Ca-Mg-HCO3-SO4 and Ca-Mg-SO4-HCO3, with no obvious change in chemistry. The results of the Piper plot reveal Ca2+ and Mg2+ as the main groundwater cations in the study area, and the Ca2+ content is the highest. Cation contents follow the order Ca2+ > Mg2+ > Na+ + K+. The anions are mainly HCO3 and SO42−.
The above analysis detected a slight change in the ion concentration of the study area after recharge. The follow-up of this study focuses on the above indicators to analyze the hydrochemical effects of groundwater after recharge. A small change was noticed in groundwater composition after recharge; therefore, the average recharge period (the average concentration of November 2018, May 2019, and October 2019) and June 2018 (pre-recharge) data were selected for principal component analysis to identify the control factors and scientifically deduce the water chemistry reaction caused by the recharge.

5. Discussion

Water–rock interactions and mixed interaction are the most important factors affecting the hydrogeochemical processes [43,44]. The test results of hydrogeochemistry are important data for studying its evolution mechanisms [45,46,47]. During the reservoir water recharge by RBF, groundwater is influenced by the mixed dilution of recharge water and water–rock interaction [48,49,50,51]. This study of groundwater through hydrogeochemistry can clarify the formation mechanisms and evolution of groundwater hydrochemical characteristics.

5.1. Hydrogeochemical Processes

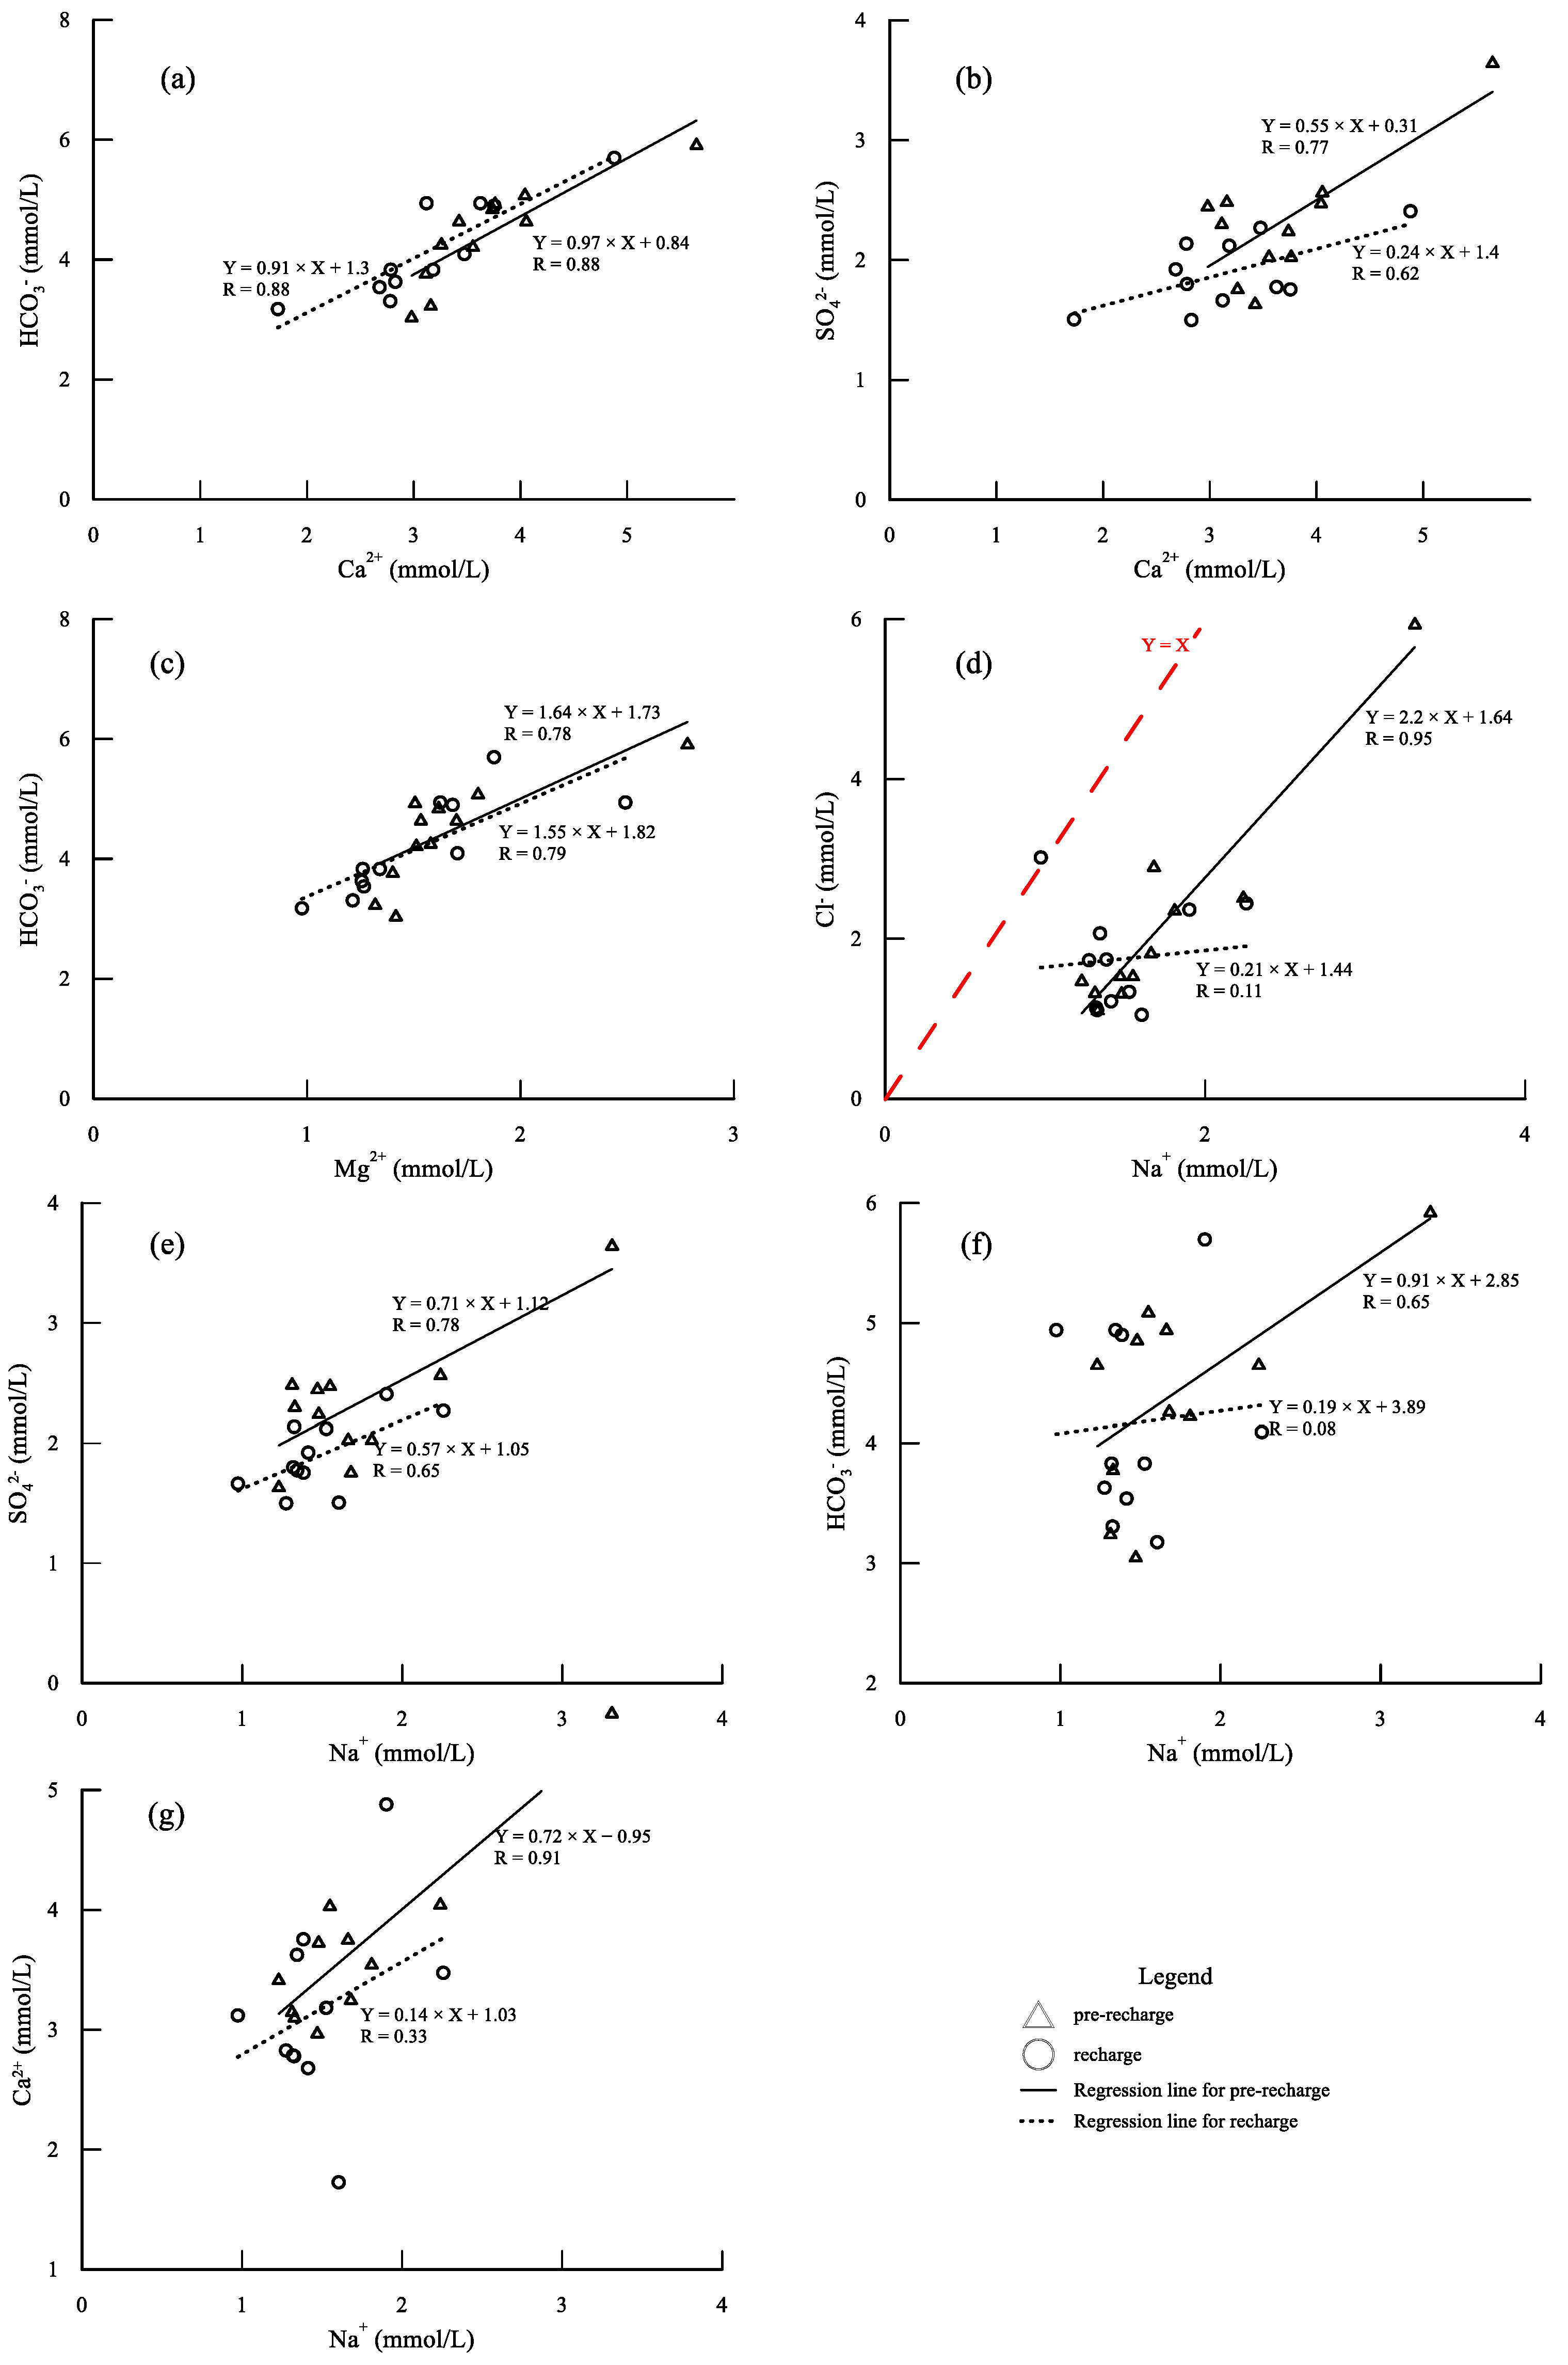
The correlation between anions and cations and changes of the correlation coefficient can be used to reasonably speculate geochemical processes such as rock–water interaction [52,53]. In accordance with the drilling core test results and previous studies, the aquifer contains calcite, dolomite, rock salt, gypsum, and mirabilite in the study area [35,36,37,38]. The scale relationship of the main ions is plotted (Figure 5), and the correlation coefficients between different ions for each group of water samples are obtained. The scatter plot of Ca2+ and HCO3 (Figure 5a) shows that the two groups of groundwater samples, pre-recharge (R = 0.88) and recharge (R = 0.88), are strongly correlated. These two groups of water samples may have experienced weathering and dissolution of calcite, and this hydrogeochemical process can be expressed as R1. The scatter plots for Ca2+ and SO42− (Figure 5b) exhibit well-correlated groundwater samples for the pre-recharge (R = 0.77) group. Weathering and dissolution of gypsum during the formation of groundwater in this group is a highly important hydrogeochemical process, and the reaction is expressed as R2. The scatter plot of Mg2+ and HCO3 (Figure 5c) demonstrates two well-correlated groups of groundwater samples, pre-recharge (R = 0.78) and recharge (R = 0.79). The sample may have undergone dolomite dissolution, and the expression for this reaction is R3. The scatter plot for Na+ and HCO3 (Figure 5f) shows that pre-recharge (R = 0.65) is slightly correlated, whereas the pre-recharge groundwater (R = 0.91) is well correlated between Ca2+ and Na+ (Figure 5g). The pre-recharge groundwater group experiences calcite dissolution and cation exchange. That is, Ca2+ in groundwater exchanges the adsorbed Na+ during rock formation. The correlation between Na+ and SO42− in the pre-recharge groundwater group (R = 0.78) is good (Figure 5e). The dissolution of mirabilite may affect the distribution of chemical elements in the pre-recharge groundwater group. The dissolution reaction equation for mirabilite is shown in R4. The pre-recharge groundwater group (R = 0.95) has strong correlations in the scatter plots for Na+ and Cl (Figure 5d). The dissolution of salt rock also occurs in this group and is expressed as Equation R5.
CaCO3 + CO2 + H2O = Ca2+ + 2HCO3
CaSO4 = Ca2+ + SO42−
CaMg(CO3)2 + 2CO2 + 2H2O = Ca2+ + Mg2+ + 4HCO3
Na2SO4·10H2O = 2Na+ + SO42− + 10H2O
NaCl = Na+ + Cl
There is a strong correlation between Na+ and Cl, which indicates the main source of Na+ and Cl to be the dissolution of halite. In theory, the ratio of Na+ and Cl contents thus obtained should be 1:1, but most of the groundwater sampling points in this area are located in the lower right of the line y = x (Figure 5d). This means Na+ content in the groundwater samples is greater than the Cl content. This is because Ca2+ and Mg2+ in the water are exchanged with Na+ adsorbed in the rock formation, and the content of Na+ in the water is more than that of Cl. The equation for this reaction is R6.
Ca2+ (in water) + 2Na+ (clay bound) = 2 Na+ (in water) + Ca2+ (clay bound)
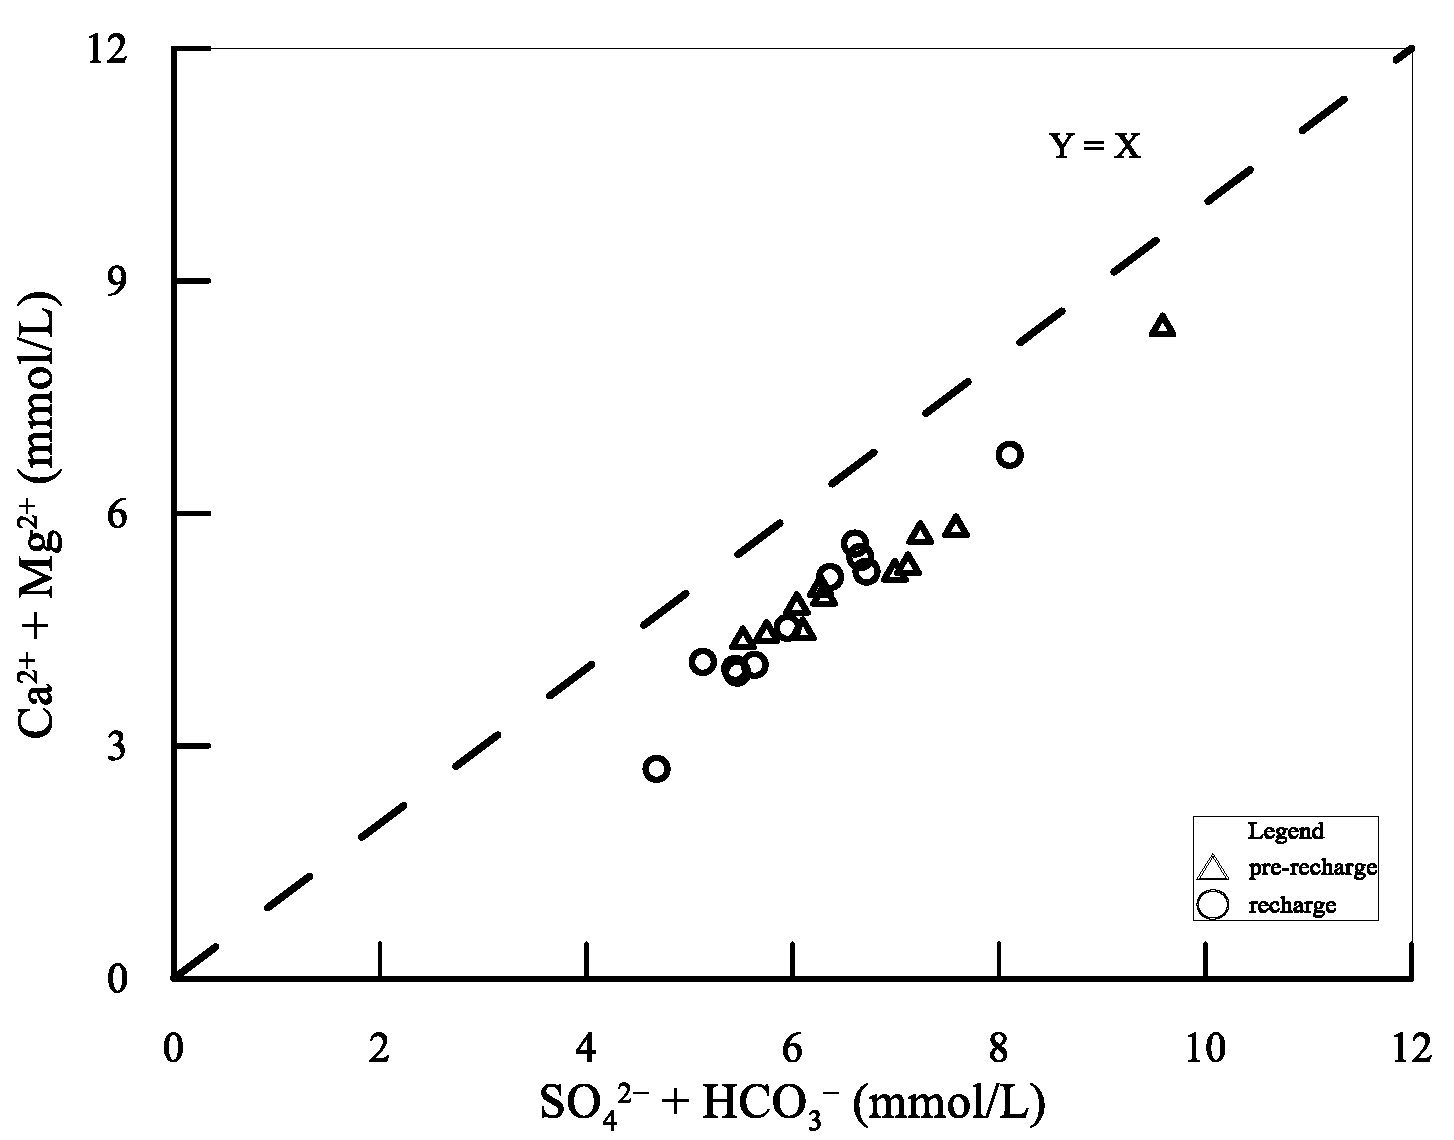
Ratio plots were used to further investigate the origins of the ions and the major hydrogeochemical processes. If the ions are controlled only by the dissolution of gypsum and carbonate rocks, (SO42− + HCO3) and (Ca2+ + Mg2+) are equal [54,55]. The (SO42− + HCO3) and (Ca2+ + Mg2+) ion proportional relationship should be located at the 1:1 line in the scatter plot (Figure 6). If y = x, the curve represents the dissolution line of carbonatite and gypsum. The water sample points in Figure 6 tend to be distributed downward, and almost all the points fall into the area with a relatively high content of (SO42− + HCO3). This indicates the occurrence of pronounced cation exchange in this area, that is, the ion exchange of Ca2+ + Mg2+ dissolved in water and Na+ is adsorbed by clay.
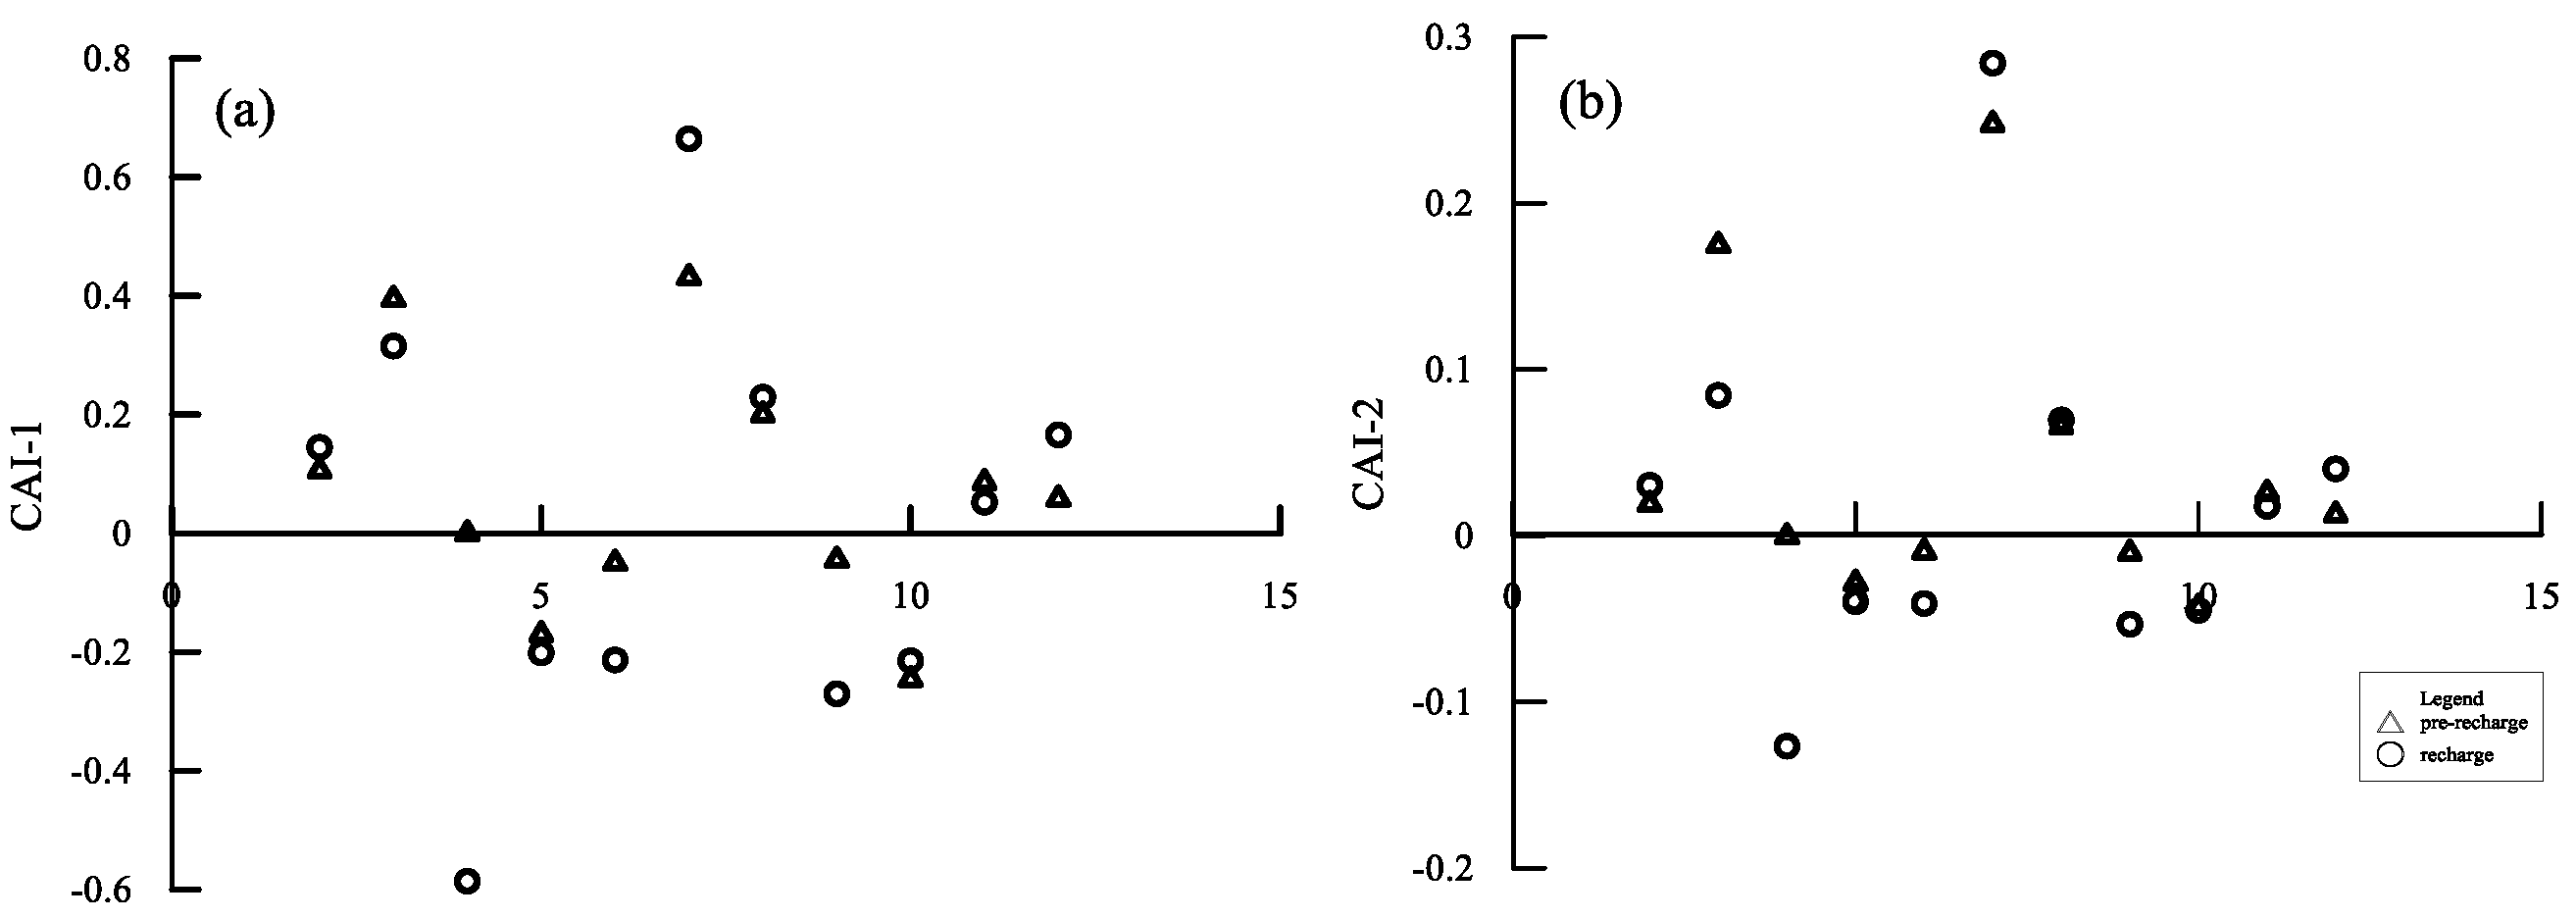
Chloro-alkaline indices (CAI) can be used to characterize the strength of ion exchange during the chemical evolution of groundwater [52], with the expressions R7 and R8. A negative index means Ca2+ or Mg2+ in groundwater is ion-exchanged with Na+ in the aqueous medium. If the ratio is positive, then Na+ in groundwater is ion-exchanged with Ca2+ or Mg2+ in the aqueous medium. The magnitude of the absolute value of the chlor-alkali index can also characterize the strength of the ion exchange.
CAI _ 1 = Cl ( Na + +   K + ) Cl
CAI _ 2 = Cl Na + +   K + SO 4 2 + HCO 3 - + CO 3 2 + NO 3
Figure 7 shows the changes in CAI-1 and CAI-2 indices for the two groups of water sampling points. Most of the water sample points are greater than 0 from the perspective of the CAI index, except for a few points where indices are less than 0. Some pre-recharge and few recharge points are ion exchange between Ca2+ or Mg2+ in the groundwater and Na+ in the aqueous medium, and most of the points are ion exchange between Na+ in the groundwater and Ca2+ or Mg2+ in the aqueous medium. The average values of CAI-1 and CAI-2 of the water sampling points reveal that the pre-recharge samples are slightly lower than that of the recharge group, and the intensity of ion exchange in the recharge stage is higher than that of the pre-recharge stage.
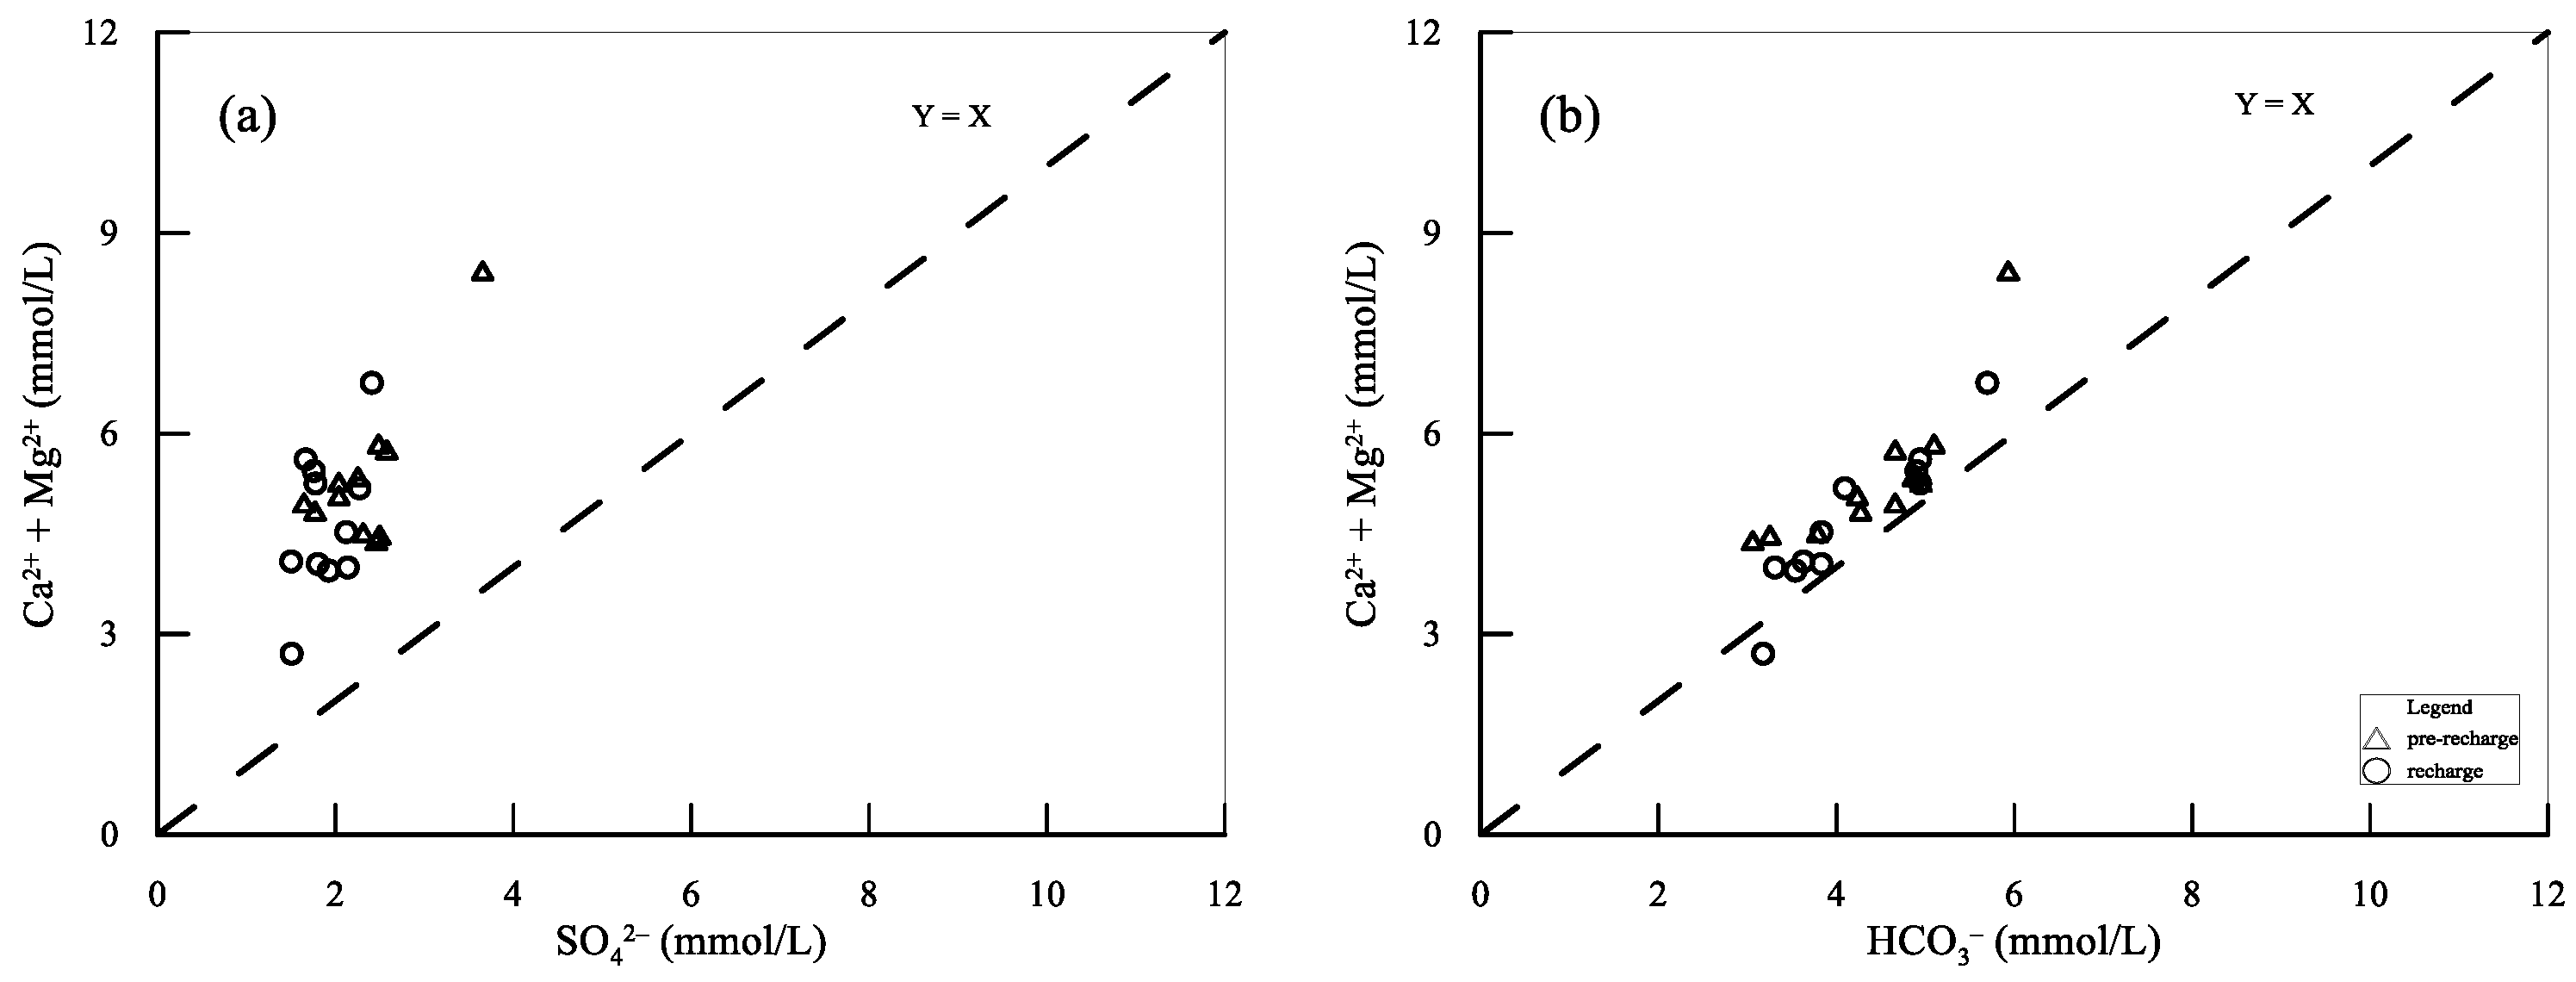
Samples close to the 1:1 equilibrium line in (Ca2+ + Mg2+)/(HCO3) and (Ca2+ + Mg2+)/(SO42–) are obvious evidence to conclude that Ca2+ and Mg2+ in the groundwater mainly come from sulfate dissolution [55,56,57]. The samples are mostly distributed above the straight line 1:1 (Figure 8). This indicates the occurrence of short-term dilution after the recharge of the reservoir, and also an increase in the salt leaching and filtration of groundwater, in addition to the cation exchange effect.
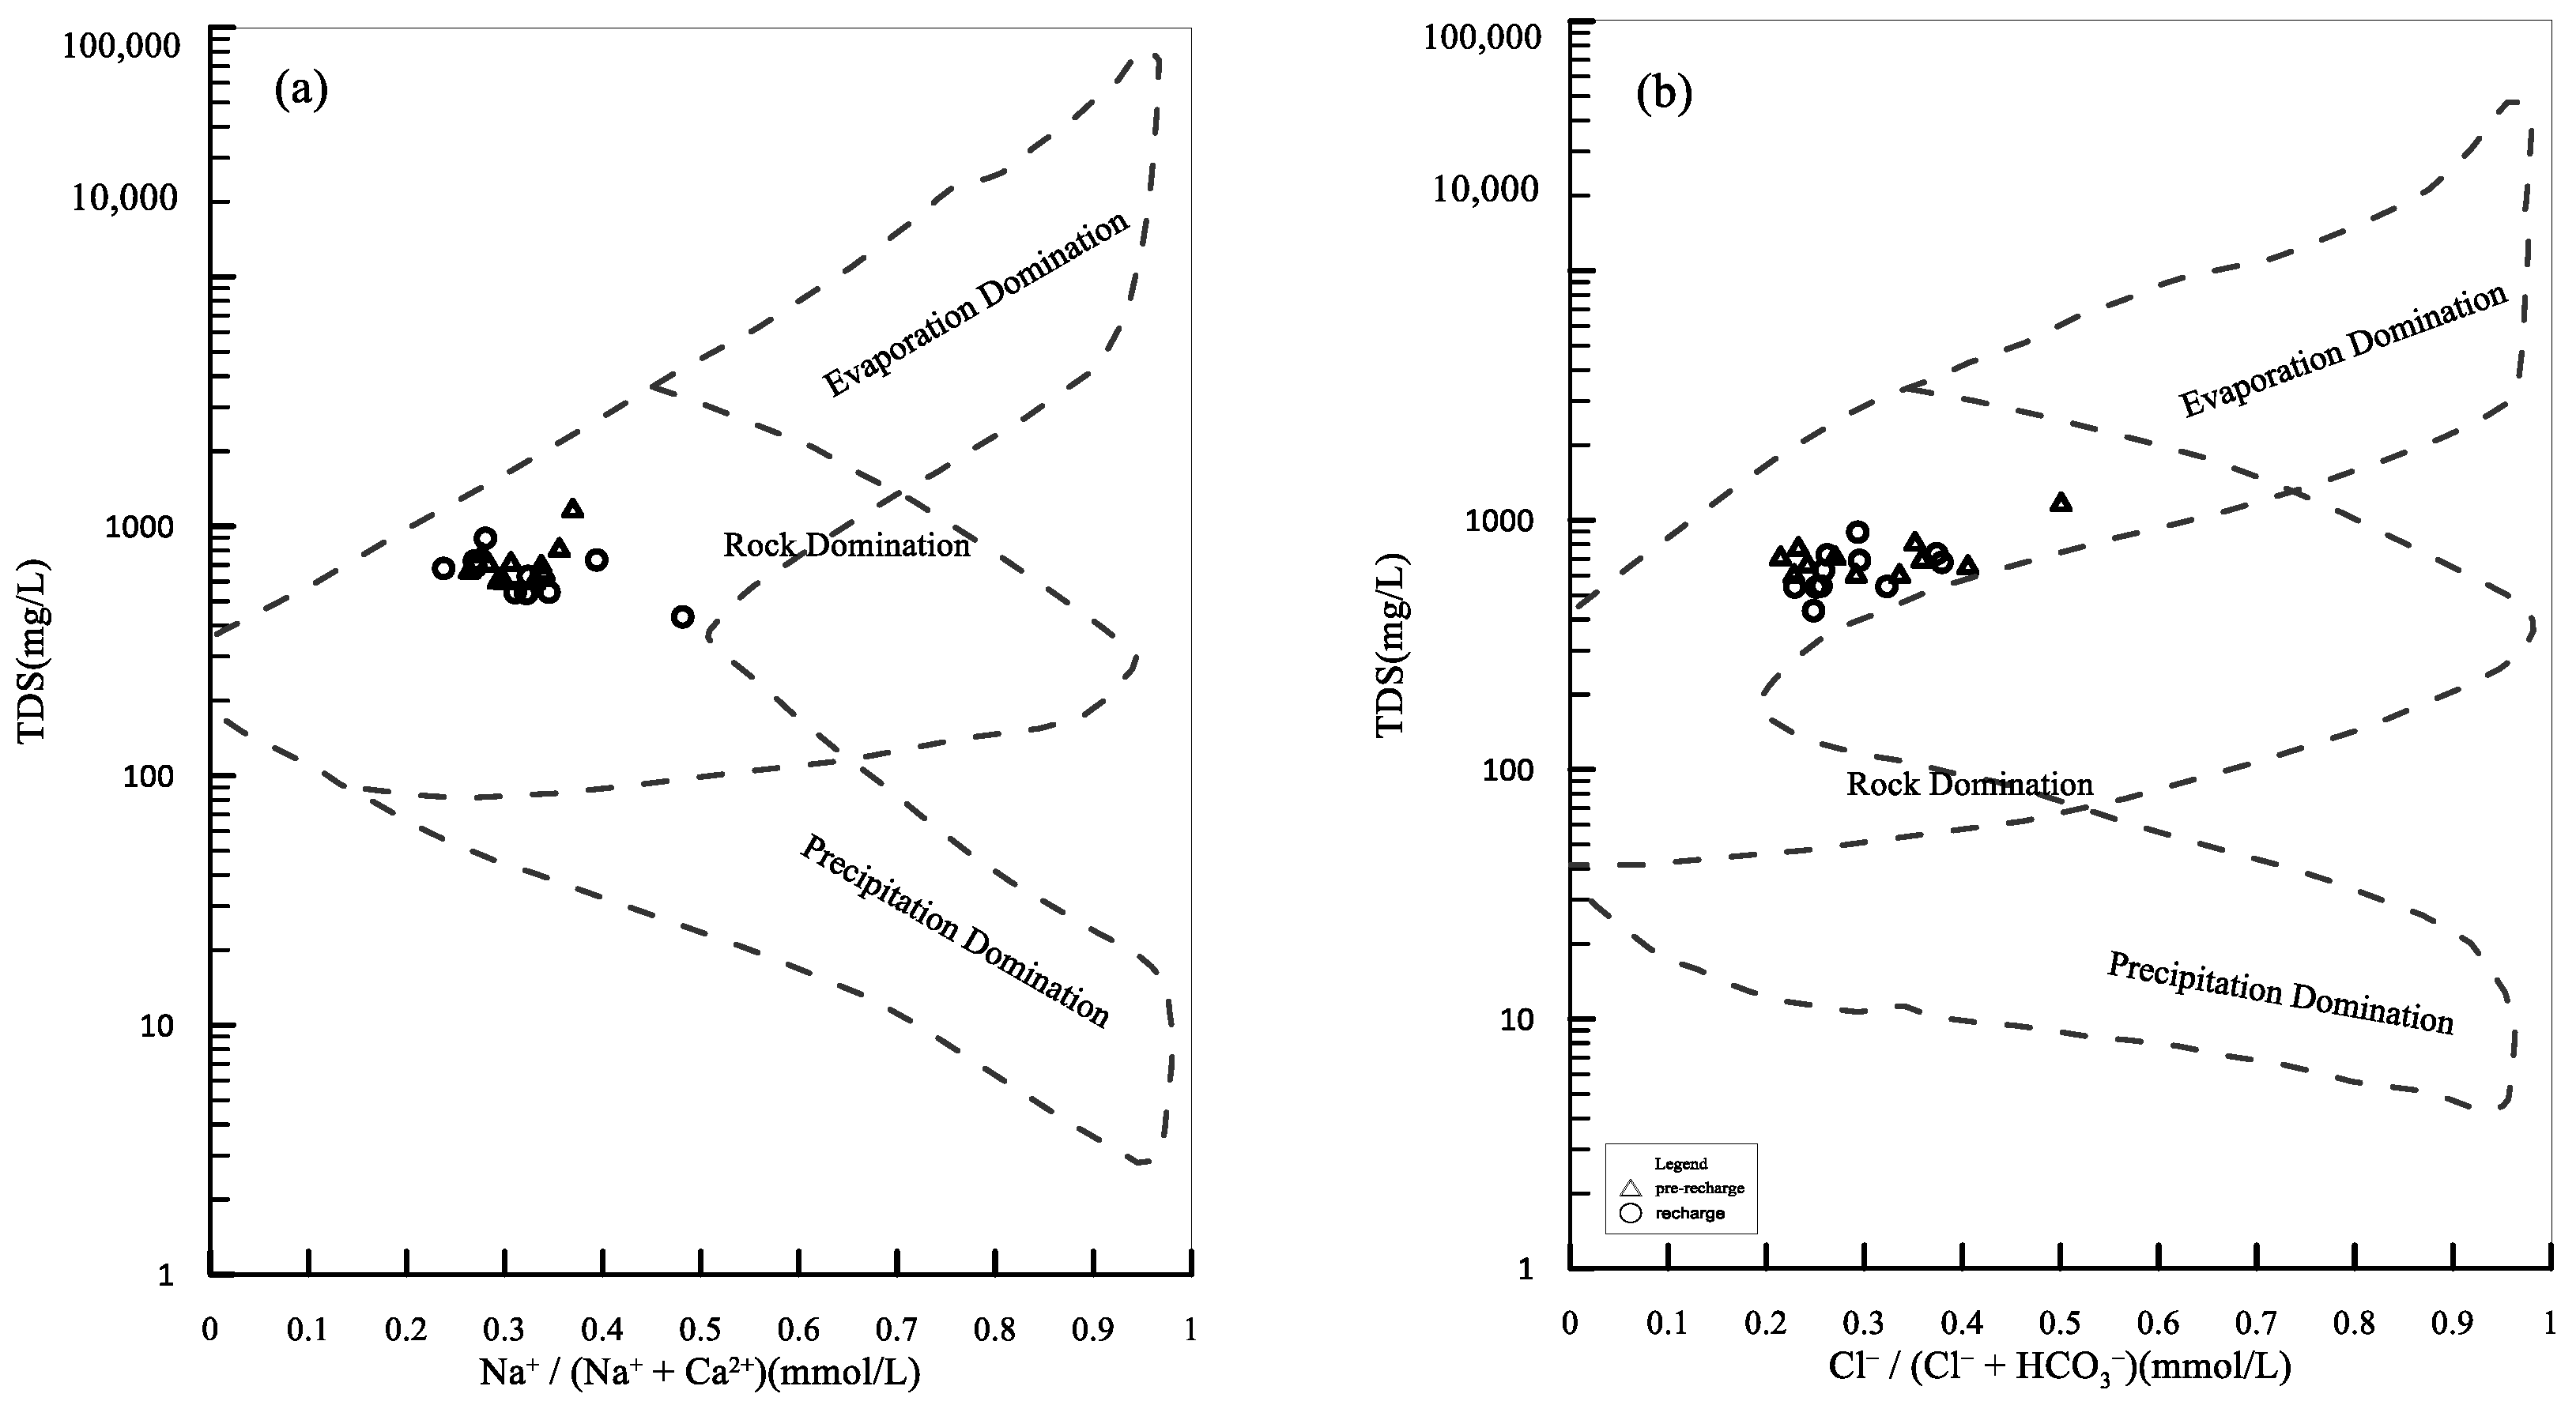
Gibbs [58] divided the chemical effects of groundwater into three categories by comparing the relationship between Na+/(Ca2+ + Na+) and TDS and between Cl/(Cl + HCO3) and TDS: “evaporation control type,” “water-rock interaction type,” and “precipitation control type.” Many researchers have used Gibbs diagrams to study the sources of water chemical components and to analyze the formation mechanisms of water chemistry [59,60,61]. The Gibbs diagram for the study area was drawn (Figure 9), and the main controlling factors of the groundwater hydrochemical composition were analyzed. All points are in the area controlled by water–rock interaction. The formation of regional hydrochemical types is predominantly controlled by water–rock interactions, and evaporation has little impact on water regional hydrochemical types.
Principal component analysis was performed on the pre-recharge and recharge data, and the correlation matrix was found using the Kaiser–Meyer–Olkin (KMO) test. The test results reveal the suitability of the two groups of data for principal component analysis (Table 2). Table 2 illustrates that in pre-recharge, F1 accounts for 65.58% of the total variance and is characterized by the association with TDS, Na+, Ca2+, Mg2+, SO42−, and Cl. The correlation coefficients were all above 0.85, but the correlation with HCO3 was weak (the correlation coefficient is as low as 0.32). Hence, F1 can be a direct reason for the increase in TDS concentration in groundwater. F1 appears as the dissolution of gypsum and halite and the ion exchange process which plays a dominant role in groundwater pre-recharge. F2 contributes to 23.32% of the total variance, which depicts a significant positive correlation with HCO3. F2 has a low correlation with other components that characterize the groundwater hydrochemical environment and indicates only the dissolution of carbonate. In the recharge period, F1 had a direct positive correlation with Na+, Mg2+, TDS, Ca2+, Cl, and HCO3. The correlation coefficient with HCO3 increased from 0.32 to 0.92, and the variance contribution of F1 is 61.75%, which is 3.83% lower than pre-recharge. This indicates the dissolution of carbonates such as calcite and dolomite. If other factors such as groundwater pressure extraction or human activities are excluded, the presumed reason for the reduced correlation coefficient can be the short-term dilution effect of the reservoir’s supplementary on groundwater.
For F1, the correlation coefficient of HCO3 increased from 0.32 (pre-recharge) to 0.92 (recharge), whereas the SO42− correlation coefficient decreased from 0.85 (pre-recharge) to 0.24. This indicates the dissolution of dolomite and calcite and the mixed dilution of recharge water. For F2, the SO42− correlation coefficient increased from −0.18 to 0.82. This is because the groundwater chemical reaction was affected during recharge, resulting in the dissolution of mirabilite.

5.2. The Change of Groundwater Quality during Water Recharge

A mixing model with the help of the MIX module in the PHREEQC software was established. Research on water chemistry changes under mixing ratios was studied. By setting different mixing ratio schemes, the software’s own phreeqc.dat database is used to calculate the saturation index and the amount of mineral phase transfer. The scenario at the beginning of the simulation is set to a 9:1 ratio of groundwater to recharge water, and the ratio of recharge water is gradually increased until the final simulation. Set June 2018 (pre-recharge) groundwater samples as the groundwater sample and reservoir water as the recharge sample. The specific mixing plan is shown in Table 3.
Cation exchange adsorption in the recharge area is weakened, and mixing also promotes Na+ and Cl entering groundwater in recharge with an increase in the proportion of recharge water. The concentration change trend of the same ion components in different ratios is compared (Table 4). This reveals a gradual decrease in the ion concentration of each component in the mixed groundwater and the dilution effect as the main factor during the recharge process.
The saturation index of mineral phases in each mixed solution calculated by different mixing schemes can be used to analyze the changing trend of the water–rock reaction after recharge. The saturation index of all minerals decreases gradually with the increase of water recharge proportion (Table 5). This results in the increase of mixing proportion in the unsaturated dissolution of all minerals, in which the saturation index (negative value) of dolomite and halite decreases significantly. When the proportion of recharge water between calcite and dolomite is 10–30%, the saturation index is more than 0 (positive value); therefore, the mixed solution is still saturated and insoluble for calcite and dolomite. When the proportion of recharge water increases to 40%, the saturation index suddenly changes to negative. As the proportion of recharge water continues to increase, calcite and dolomite become unsaturated. Consequently, the continuation of the recharge process promotes mineral dissolution.

6. Conclusions

This study focused on the river bank filtration (RBF site at the upper of the Hutuo River Alluvial Plain, North China, and reasonably analyzed the hydrochemical changes of groundwater during the period of bank infiltration recharge. From June 2018 (pre-recharge) to October 2019 (late recharge), groundwater in the study area was mainly of type Ca–Mg–HCO3–SO4 and Ca–Mg–SO4–HCO3, with no obvious change in chemistry. As the concentration of various ions in groundwater decreased, the short-term dilution effect of groundwater recharge temporarily improved its quality. Anthropogenic factors lead to the increase of nitrate content in some wells. Reservoir water recharge will further promote groundwater–rock reaction and filtration by RBF. The ion proportional relationship diagram and principal component analysis demonstrate the dissolution of calcite, dolomite, gypsum, mirabilite, and halite in the pre-recharge stage. The recharge stage mainly experienced the dissolution of calcite and dolomite. The ion-pair scatter plot of Na+ and Cl and the chlor-alkali index reveal cation exchange as one of the main hydrogeochemical processes in the study area. Some pre-recharge and few recharge points are ion exchange between Ca2+ or Mg2+ in the groundwater and Na+ in the aqueous medium, and most of the points are ion exchange between Na+ in the groundwater and Ca2+ or Mg2+ in the aqueous medium. The intensity of ion exchange in the recharge stage was higher than that of the pre-recharge stage. The research of water chemistry changes under mixing ratios discloses the dilution effect as the main factor during the recharge process. Calcite and dolomite become unsaturated as the proportion of recharge water continues to increase, which in turn, promotes mineral dissolution.
The results of this study are promising and suggest a successful application of the combination of these techniques to decipher the characteristics and impacts of intrinsic changes for using reservoir water to recharge groundwater by RBF. The quantity and quality of local groundwater resources can be increased by the reservoir water supplement in RBF.

Author Contributions

Wrote the manuscript, B.Z., L.C. and Y.L. (Yasong Li); designed the research, B.Z. and Y.Z.; processed the data, L.C. and Y.L. (Yaci Liu); contributed to the theoretical interpretation of the results, B.Z., X.K. and Y.Z.; supervised the project, Y.L. (Yasong Li), Y.L. (Yaci Liu), C.L., X.K. and Y.Z.; All authors have read and agreed to the published version of the manuscript.

Funding

The research work was financially supported by the National Water Pollution Control and Treatment Science and Technology Major Project (No. 2018ZX07109-004), with contributions by the China Geological Survey project, Grant/Award Number DD201903034, and National Natural Science Foundation of China, Grant/Award Number: 41907175. The authors gratefully acknowledge the Institute of Geophysical and Geochemical Exploration, Chinese Academy of Geological Sciences (AS2020Y04), for financial support.

Data Availability Statement

The data that support the findings of this study are available within the article.

Acknowledgments

The authors gratefully acknowledge Peng-Fei Han and Dong Zhang for their guidance and revision of the paper.

Conflicts of Interest

The authors declare no competing interest.

References

  1. Regnery, J.; Li, D.; Lee, J.; Smits, K.M.; Sharp, J.O. Hydrogeochemical and microbiological effects of simulated recharge and drying within a 2D meso-scale aquifer. Chemosphere 2020, 241, 9. [Google Scholar] [CrossRef] [PubMed]
  2. Regnery, J.; Gerba, C.P.; Dickenson, E.R.V.; Drewes, J.E. The importance of key attenuation factors for microbial and chemical contaminants during managed aquifer recharge: A review. Crit. Rev. Environ. Sci. Technol. 2017, 47, 1409–1452. [Google Scholar] [CrossRef]
  3. Dillon, P.; Stuyfzand, P.; Grischek, T.; Lluria, M.; Pyne, R.D.G.; Jain, R.C.; Bear, J.; Schwarz, J.; Wang, W.; Fernandez, E.; et al. Sixty years of global progress in managed aquifer recharge. Hydrogeol. J. 2019, 27, 1–30. [Google Scholar] [CrossRef] [Green Version]
  4. Zhu, Y.; Zhai, Y.; Du, Q.; Teng, Y.; Wang, J.; Yang, G. The impact of well drawdowns on the mixing process of river water and groundwater and water quality in a riverside well field, Northeast China. Hydrol. Process. 2019, 33, 945–961. [Google Scholar] [CrossRef]
  5. Cao, Y.; Wei, Y.; Fan, W.; Peng, M.; Bao, L. Experimental study of land subsidence in response to groundwater withdrawal and recharge in Changping District of Beijing. PLoS ONE 2020, 15, e0232828. [Google Scholar] [CrossRef] [PubMed]
  6. Dillon, P.; Toze, S.; Page, D.; Vanderzalm, J.; Bekele, E.; Sidhu, J.; Rinck-Pfeiffer, S. Managed aquifer recharge: Rediscovering nature as a leading edge technology. Water Sci. Technol. 2010, 62, 2338–2345. [Google Scholar] [CrossRef]
  7. Hu, B.; Teng, Y.; Zhai, Y.; Zuo, R.; Li, J.; Chen, H. Riverbank filtration in China: A review and perspective. J. Hydrol. 2016, 541, 914–927. [Google Scholar] [CrossRef]
  8. Massmann, G.; Nogeitzig, A.; Taute, T.; Pekdeger, A. Seasonal and spatial distribution of redox zones during lake bank filtration in Berlin, Germany. Environ. Geol. 2007, 54, 53–65. [Google Scholar] [CrossRef]
  9. Yuan, J.; Dyke, M.I.V.; Huck, P.M. Water reuse through managed aquifer recharge (MAR): Assessment of regulations/guidelines and case studies. Water Pollut. Res. J. Can. 2016, 51, 357–376. [Google Scholar] [CrossRef]
  10. Hiscock, K.M.; Grischek, T. Attenuation of groundwater pollution by bank filtration. J. Hydrol. 2002, 266, 139–144. [Google Scholar] [CrossRef] [Green Version]
  11. Grischek, T.; Bartak, R. Riverbed clogging and sustainability of riverbank filtration. Water 2016, 8, 604. [Google Scholar] [CrossRef] [Green Version]
  12. Ganot, Y.; Holtzman, R.; Weisbrod, N.; Russak, A.; Katz, Y.; Kwtzman, D. Geochemical processes during managed aquifer recharge with desalinated seawater. Water Resour. Res. 2018, 54, 978–994. [Google Scholar] [CrossRef]
  13. Kurki, V.; Lipponen, A.; Katko, T. Managed aquifer recharge in community water supply: The Finnish experience and some international comparisons. Water Int. 2013, 38, 774–789. [Google Scholar] [CrossRef]
  14. Bartak, R.; Page, D.; Sandhu, C.; Grischek, T.; Saini, B.; Mehrotra, I.; Chakresh, K.J.; Narayan, C. Ghosh Application of risk-based assessment and management to riverbank filtration sites in India. J. Water Health 2015, 13, 174–189. [Google Scholar] [CrossRef] [PubMed]
  15. Daess, L.W.; Andrade-Tafoya, P.D.; Lafarga-Moreao, J.; Mahlknecht, J.; van Geldern, R.; Beramendi-Orosco, L.E.; Barth, J.A.C. Groundwater recharge sites and pollution sources in the wine-producing Guadalupe Valley (Mexico): Restrictions and mixing prior to transfer of reclaimed water from the US-México border. Sci. Total Environ. 2020, 713, 136715. [Google Scholar] [CrossRef]
  16. Wang, D.; Yu, J.; Wang, P.; Zhu, B. Shallow Groundwater Chemistry Characteristics and Their Controlling Factors in the Ejina Delta. South-to-North Water Diversion. Water Sci. Technol. 2013, 11, 51–55. (In Chinese) [Google Scholar]
  17. Zhu, Y.; Zhai, Y.; Teng, Y.; Wang, G.; Du, Q.; Wang, J.; Yang, G. Water supply safety of riverbank filtration wells under the impact of surface water-groundwater interaction: Evidence from long-term field pumping tests. Sci. Total Environ. 2020, 711, 135141. [Google Scholar] [CrossRef]
  18. AlBassam, M.A.; Awad, H.S.; Al Alawi, J.A. DurovPlot: A computer program for processing and plotting hydrochemical data. Ground Water 1997, 35, 362–367. [Google Scholar] [CrossRef]
  19. Boving, T.B.; Patil, K.; D’Souza, F.; Barker, S.F.; McGuinness, S.L.; O’Toole, J.; Sinclair, M.; Forbes, A.B.; Leder, K. Performance of riverbank filtration under hydrogeologic conditions along the upper Krishna River in Southern India. Water 2019, 11, 12. [Google Scholar] [CrossRef] [Green Version]
  20. Li, C.; Li, B.; Bi, E. Characteristics of hydrochemistry and nitrogen behavior under long-term managed aquifer recharge with reclaimed water: A case study in north China. Sci. Total Environ. 2019, 668, 1030–1037. [Google Scholar] [CrossRef]
  21. Yu, Y.; Song, X.; Zhang, Y.; Zheng, F.; Liu, L. Impact of reclaimed water in the watercourse of Huai River on groundwater from Chaobai River basin, Northern China. Front. Earth Sci. 2016, 11, 643–659. [Google Scholar] [CrossRef]
  22. Pan, W.; Huang, Q.; Huang, G. Nitrogen and organics removal during riverbank filtration along a reclaimed water restored river in Beijing, China. Water 2018, 10, 491. [Google Scholar] [CrossRef] [Green Version]
  23. Horriche, F.J.; Benabdallah, S. Assessing aquifer water level and salinity for a managed artificial recharge site using reclaimed water. Water 2020, 12, 341. [Google Scholar] [CrossRef] [Green Version]
  24. Sprenger, C.; Lorenzen, G.; Hulshoff, I.; Grutzmacher, G.; Ronghang, M.; Pekdeger, A. Vulnerability of bank filtration systems to climate change. Sci. Total Environ. 2011, 409, 655–663. [Google Scholar] [CrossRef] [PubMed]
  25. Munz, M.; Oswald, S.E.; Schaefferling, R.; Lensing, H.-J. Temperature-dependent redox zonation, nitrate removal and attenuation of organic micropollutants during bank filtration. Water Res. 2019, 162, 225–235. [Google Scholar] [CrossRef]
  26. Guyennon, N.; Salerno, F.; Portoghese, I.; Romano, E. Climate Change Adaptation in a Mediterranean Semi-Arid Catchment: Testing Managed Aquifer Recharge and Increased Surface Reservoir Capacity. Water 2017, 9, 689. [Google Scholar] [CrossRef] [Green Version]
  27. Xanke, J.; Liesch, T.; Goeppert, N.; Klinger, J.; Gassen, N.; Goldscheider, N. Contamination risk and drinking water protection for a large-scale managed aquifer recharge site in a semi-arid karst region, Jordan. Hydrogeol. J. 2017, 25, 1795–1809. [Google Scholar] [CrossRef]
  28. Zammouri, M.; Brini, N. Efficiency of artificial groundwater recharge, quantification through conceptual modelling. Water Resour. Manag. 2020, 34, 3345–3361. [Google Scholar] [CrossRef]
  29. Groeschke, M.; Frommen, T.; Taute, T.; Schneider, M. The impact of sewage-contaminated river water on groundwater ammonium and arsenic concentrations at a riverbank filtration site in central Delhi, India. Hydrogeol. J. 2017, 25, 2185–2197. [Google Scholar] [CrossRef]
  30. Li, Y.; Zhang, Z.; Fei, Y.; Chen, H.; Qian, Y.; Dun, Y. Investigation of quality and pollution characteristics of groundwater in the Hutuo River Alluvial Plain, North China Plain. Environ. Earth Sci. 2016, 75, 581. [Google Scholar] [CrossRef]
  31. Zhang, X.; He, J.; He, B.; Sun, J. Assessment, formation mechanism, and different source contributions of dissolved salt pollution in the shallow groundwater of Hutuo River alluvial-pluvial fan in the North China Plain. Environ. Sci. Pollut. Res. 2019, 26, 35742–35756. [Google Scholar] [CrossRef] [PubMed]
  32. Zhang, Q.; Wang, H.; Wang, L. Tracing nitrate pollution sources and transformations in the over-exploited groundwater region of north China using stable isotopes. J. Contam. Hydrol. 2018, 218, 1–9. [Google Scholar] [CrossRef]
  33. Zhang, Q.; Wang, H.; Wang, Y.; Yang, M.; Zhu, L. Groundwater quality assessment and pollution source apportionment in an intensely exploited region of northern China. Environ. Sci. Pollut. Res. 2017, 24, 16639–16650. [Google Scholar] [CrossRef] [PubMed]
  34. GB/T 14848-2017; Quality Standard for Ground Water. Standardization Administration of the PRC: Beijing, China, 2017; p. 20. (In Chinese)
  35. Su, X.; Xu, W.; Du, S. Responses of groundwater vulnerability to artificial recharge under extreme weather conditions in Shijiazhuang City, China. J. Water. Supply Res. T. 2014, 63, 224–238. [Google Scholar] [CrossRef]
  36. Tian, X.; Meng, S.; Cui, X.; Zhang, X.; Zhang, Z.; Fei, Y. Hydrochemical Effect of Groundwater Recharge in Over-Exploited Area of Hutuo River Basin. Res. Environ. Sci. 2021, 34, 629–636. (In Chinese) [Google Scholar]
  37. He, P. Primary Analysis of Groundwater Circumstances Influence of Huangbizhuang Village Reservoir Waterproof Project to the Hutuo River Alluvium. Ground Water 2009, 31, 121–123. (In Chinese) [Google Scholar]
  38. Men, G. Design flood analysis of Huangbizhuang Reservoir downstream river channel. Water Sci. Eng. Technol. 2015, 4, 25–28. (In Chinese) [Google Scholar]
  39. Zheng, Y.; Vanderzalm, J.; Hartog, N.; Escalante, E.F.; Stefan, C. The 21st century water quality challenges for managed aquifer recharge: Towards a risk-based regulatory approach. Hydrogeol. J. 2022, 31, 189. [Google Scholar] [CrossRef]
  40. Piper, A.M. A Graphic Procedure in the Geochemical Interpretation of Water Analysis; United States Department of the Interior, Geological Survey, Water Resources Division, Ground Water Branch: Washington, DC, USA; CRC Press: Boca Raton, FL, USA, 1953; p. 63. [Google Scholar]
  41. Zhai, Y.; Zheng, F.; Zhao, X.; Xia, X.; Teng, Y. Identification of hydrochemical genesis and screening of typical groundwater pollutants impacting human health: A case study in Northeast China. Environ. Pollut. 2019, 252, 1202–1215. [Google Scholar] [CrossRef]
  42. Kang, X.; Niu, Y.; Yu, H.; Gou, P.; Hou, Q.; Lu, X.; Wu, Y. Effect of rainfall-runoff process on sources and transformations of nitrate using a combined approach of dual isotopes, hydrochemical and Bayesian model in the Dagang River basin. Sci. Total Environ. 2022, 837, 1–11. [Google Scholar] [CrossRef]
  43. Appelo, C.A.J.; Willemsen, A. Geochemical calculations and observations on salt water intrusions, I. A combined geochemical/minxing cell model. J. Hydrol. 1987, 94, 313–330. [Google Scholar] [CrossRef]
  44. Duan, R.; Li, P.; Wang, L.; He, X.; Zhang, L. Hydrochemical characteristics, hydrochemical processes and recharge sources of the geothermal systems in Lanzhou City, northwestern China. Urban Clim. 2022, 43, 1–15. [Google Scholar] [CrossRef]
  45. Su, Y.; Zhu, G.; Feng, Q.; Li, Z.; Zhang, F. Environmental isotopic and hydrochemical study of groundwater in the Ejina Basin, northwest China. Environ. Geol. 2009, 58, 601–614. [Google Scholar] [CrossRef]
  46. Bekele, E.; Zhang, Y.; Donn, M.; McFarlane, D. Inferring groundwater dynamics in a coastal aquifer near wastewater infiltration ponds and shallow wetlands (Kwinana, Western Australia) using combined hydrochemical, isotopic and statistical approaches. J. Hydrol. 2019, 568, 1055–1070. [Google Scholar] [CrossRef]
  47. Noble, J.; Ansari, M.A. Isotope hydrology and geophysical techniques for reviving a part of the drought prone areas of Vidarbha, Maharashtra, India. J. Hydrol. 2019, 570, 495–507. [Google Scholar] [CrossRef]
  48. Wang, Z.; Yin, J.; Pu, J.; Wang, P.; Liang, X.; Yang, P.; He, Q.; Gou, P.; Yuan, D. Integrated understanding of the Critical Zone processes in a subtropical karst watershed (Qingmuguan, Southwestern China): Hydrochemical and isotopic constraints. Sci. Total Environ. 2020, 749, 141257. [Google Scholar] [CrossRef]
  49. Dugga, P.; Pervez, S.; Tripathi, M.; Siddiqui, M.N. Spatiotemporal variability and source apportionment of the ionic components of groundwater of a mineral-rich tribal belt in Bastar, India. Groundw. Sustain. Dev. 2020, 10, 100356. [Google Scholar] [CrossRef]
  50. Hou, G.; Zhao, M.; Wang, Y. Groundwater Investigation in the Ordos Basin; China Geological Survey: Beijing, China, 2006. (In Chinese) [Google Scholar]
  51. Kong, X.; Wang, S.; Liu, B.; Sun, H.; Sheng, Z. Impact of water transfer on interaction between surface water and groundwater in the lowland area of North China Plain. Hydrol. Process. 2018, 32, 2044–2057. [Google Scholar] [CrossRef]
  52. Guo, X.; Zuo, R.; Wang, J.; Meng, L.; Teng, Y.; Shi, R.; Gao, X.; Ding, F. Hydrogeochemical Evolution of Interaction Between Surface Water and Groundwater Affected by Exploitation. Groundwater 2019, 57, 430–442. [Google Scholar] [CrossRef]
  53. Liu, J.; Gao, Z.; Wang, Z.; Xu, X.; Su, Q.; Wang, S.; Qu, W.; Xing, T. Hydrogeochemical processes and suitability assessment of groundwater in the Jiaodong Peninsula, China. Environ. Monit. Assess. 2020, 192, 17. [Google Scholar] [CrossRef]
  54. Lasaga, A.C. Chemical kinetics of water–rock interactions. J. Geophys. Res. 1984, 89, 4009–4025. [Google Scholar] [CrossRef]
  55. Wu, J.; Li, P.; Qian, H.; Duan, Z.; Zhang, X. Using correlation and multivariate statistical analysis to identify hydrogeochemical processes affecting the major ion chemistry of waters: A case study in Laoheba phosphorite mine in Sichuan, China. Arab. J. Geosci. 2014, 7, 3973–3982. [Google Scholar] [CrossRef]
  56. Liu, Y.; Fei, Y.; Meng, S.; Cui, X. Hydrochemical evolution of groundwater and soils in the water-level-fluctuation zone. Environ. Earth Sci. 2019, 78, 12. [Google Scholar] [CrossRef]
  57. Han, Y.; Zhai, Y.; Guo, M.; Cao, X.; Lu, H.; Li, J.; Wang, S.; Yue, W. Hydrochemical and isotopic characterization of the impact of water diversion on water in drainage channels, groundwater, and Lake Ulansuhai in China. Water 2021, 13, 3033. [Google Scholar] [CrossRef]
  58. Gibbs, R.J. Mechanisms controlling world water chemistry. Science 1970, 170, 1088–1090. [Google Scholar] [CrossRef] [PubMed]
  59. Marghade, D.; Malpe, D.B.; Zade, A.B. Major ion chemistry of shallow groundwater of a fast growing city of Central India. Environ. Monit. Assess. 2012, 184, 2405–2418. [Google Scholar] [CrossRef]
  60. Xing, L.; Guo, H.; Zhan, Y. Groundwater hydrochemical characteristics and processes along flow paths in the North China Plain. J. Asian Earth Sci. 2013, 70–71, 250–264. [Google Scholar] [CrossRef]
  61. Pant, R.R.; Zhang, F.; Rehman, F.U.; Wang, G.; Ye, M.; Zeng, C.; Tang, H. Spatiotemporal variations of hydrogeochemistry and its controlling factors in the Gandaki River Basin, Central Himalaya Nepal. Sci. Total Environ. 2018, 622–623, 770–782. [Google Scholar] [CrossRef]
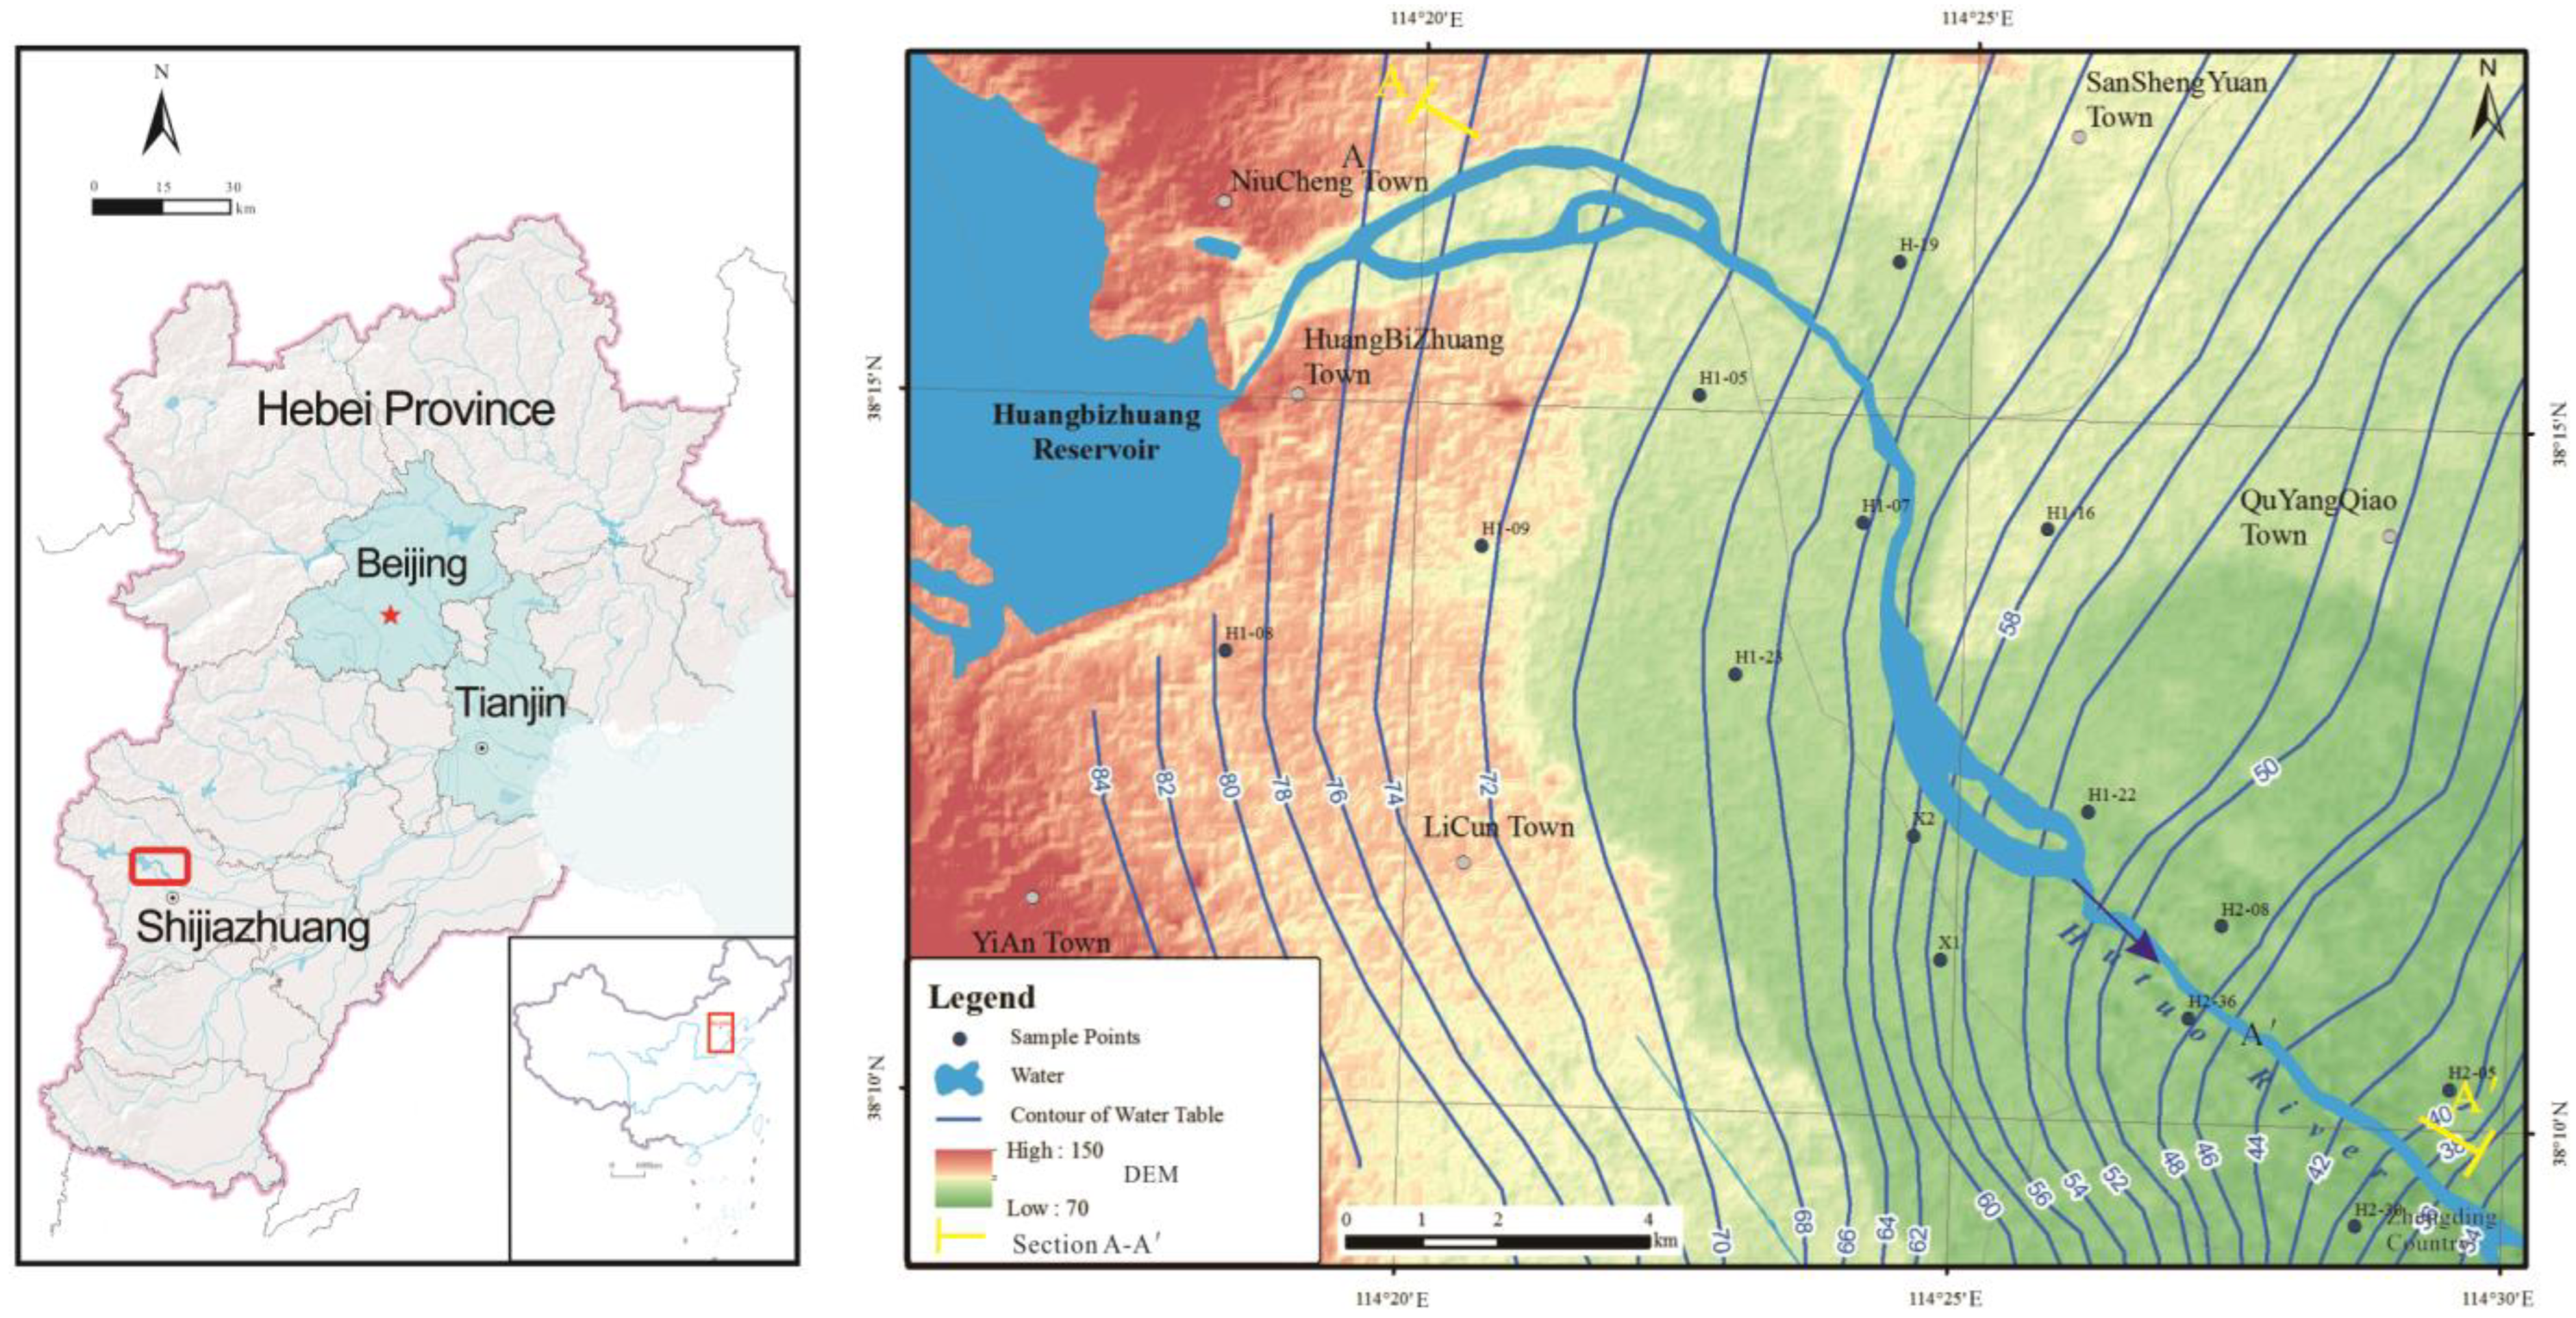
Figure 1. Scope of the study area.
Water 15 01343 g001
Figure 2. Hydrogeological profile of Section A-A′.
Water 15 01343 g002
Figure 3. Amount of monthly reservoir discharge.
Water 15 01343 g003
Figure 4. Piper diagram of groundwater in four stages of the recharge area.
Water 15 01343 g004
Figure 5. Relationship between the main ion pairs in groundwater. (a) Relationship between Ca2+ and HCO3. (b) Relationship between Ca2+ and SO42−. (c) Relationship between Mg2+ and HCO3. (d) Relationship betweenNa+ and Cl. (e) Relationship betweenNa+ and SO42−. (f) Relationship between Na+ and HCO3. (g) Relationship between Na+ and Ca2+.
Water 15 01343 g005
Figure 6. Scatter plot of the correlation between SO42− + HCO3 and Ca2+ + Mg2+.
Water 15 01343 g006
Figure 7. Changes in CAI-1 and CAI-2 of water samples. (a) CAI-1 in the two groups of water samples. (b) CAI-2 in the two groups of water samples.
Water 15 01343 g007
Figure 8. Correlation comparison of (Ca2+ + Mg2+)/HCO3 and (Ca2+ + Mg2+)/SO42−. (a) Relationship between SO42− and (Ca2+ + Mg2+). (b) Relationship between HCO3 and (Ca2+ + Mg2+).
Water 15 01343 g008
Figure 9. Gibbs diagram of the research area. (a) The relationship between Na+/(Na+ + Ca2+) and TDS. (b) The relationship between Cl/(Cl + HCO3) and TDS.
Water 15 01343 g009
Table 1. Concentrations of Inorganic Ions of Samples (mg/L).
TimeJune 2018November 2018May 2019October 2019
Number of Sample Points11111414
Inorganic IonsMaxMinMeanMedianMaxMinMeanMedianMaxMinMeanMedianMaxMinMeanMedian
K+3.671.722.652.704.091.512.652.543.191.102.702.823.180.992.712.87
Na+76.1528.2739.8735.6351.9222.3934.1231.8252.2628.7237.9837.3352.6230.1238.6237.32
Ca2+226.00119.20148.15142.20195.2069.10126.68124.80207.6095.07152.17156.05217.5199.90148.58147.02
Mg2+66.7931.6739.6536.8159.8023.4336.4332.1956.6924.6239.1240.6170.8429.3145.0139.82
Cl210.6039.6677.1254.75106.8037.1161.8161.27110.0038.4267.7867.59109.5140.7168.9968.79
SO4-350.80157.90224.47221.90231.10144.00182.00172.80263.00143.90218.41223.05255.70140.60207.10210.55
HCO3361.90186.60270.48284.30347.50193.70254.45233.70441.00206.00302.46296.00480.38196.93317.13298.37
CO32-NDNDNDNDNDNDNDNDNDNDNDNDNDNDNDND
NO3-99.0221.8154.1956.53103.8010.5145.4535.68149.804.3566.3466.00152.903.9466.6669.93
DO7.983.357.327.398.03.347.237.358.04.047.287.067.993.567.317.38
TDS118361073770389543363263010455057457381088547753714
pH8.107.617.827.867.947.517.727.757.737.317.507.517.937.457.697.67
temperature15.811.913.814.314.215.512.114.114.515.911.413.914.3
Note: ND—not detected.
Table 2. Results of Principal Component Analysis.
TimePre-RechargeRecharge
FactorsFac_1Fac_2Fac_1Fac_2
Na+0.900.330.940.38
Ca2+0.890.350.850.55
Mg2+0.870.280.95−0.14
Cl0.880.110.880.09
SO42−0.85−0.180.240.82
HCO30.320.810.920.33
TDS0.920.390.890.58
Kaiser–Meyer–Olkin Measure of Sampling Adequacy0.710.68
Cumulative variance (%)65.5888.9061.7583.02
Table 3. Recharge Schemes with Different Mixing Ratios.
Water TypeMixing Ratio
Groundwater0.90.80.70.60.50.40.30.20.1
Recharge Water0.10.20.30.40.50.60.70.80.9
Table 4. Simulation Results of Main Ion Components in Different Ratios (mg/L).
G:R9:18:27:36:45:54:63:72:81:9
Na+38.3437.0335.734.3933.0531.7430.4129.1127.76
HCO3248.27236.62224.97213.26201.48189.71177.82165.81153.65
Mg2+32.71231.229.68828.17626.66425.15223.623222.096820.568
Ca2+122.36115.4108.44101.4894.5287.4880.4873.466.32
SO42−216161.37155.71150.05144.29138.62132.86127.11121.34
Note: G:R—the ratio of Groundwater (G): Recharge water (R).
Table 5. Simulation Results of SI in Different Ratios.
G:R9:18:27:36:45:54:63:72:81:9
calcite0.030.030.02−0.02−0.1−0.21−0.36−0.59−0.96
dolomite0.050.060.02−0.07−0.23−0.47−0.8−1.27−2.04
gypsum−0.08−0.16−0.25−0.35−0.47−0.6−0.75−0.95−1.2
halite−0.23−0.48−0.76−1.05−1.42−1.85−2.37−3.07−5.23
mirabilite−2.04−2.12−2.21−2.34−2.49−2.65−2.79−2.92−3.21
Note: G:R—the ratio of Groundwater (G): Recharge water (R).
Disclaimer/Publisher’s Note: The statements, opinions and data contained in all publications are solely those of the individual author(s) and contributor(s) and not of MDPI and/or the editor(s). MDPI and/or the editor(s) disclaim responsibility for any injury to people or property resulting from any ideas, methods, instructions or products referred to in the content.