1. Introduction
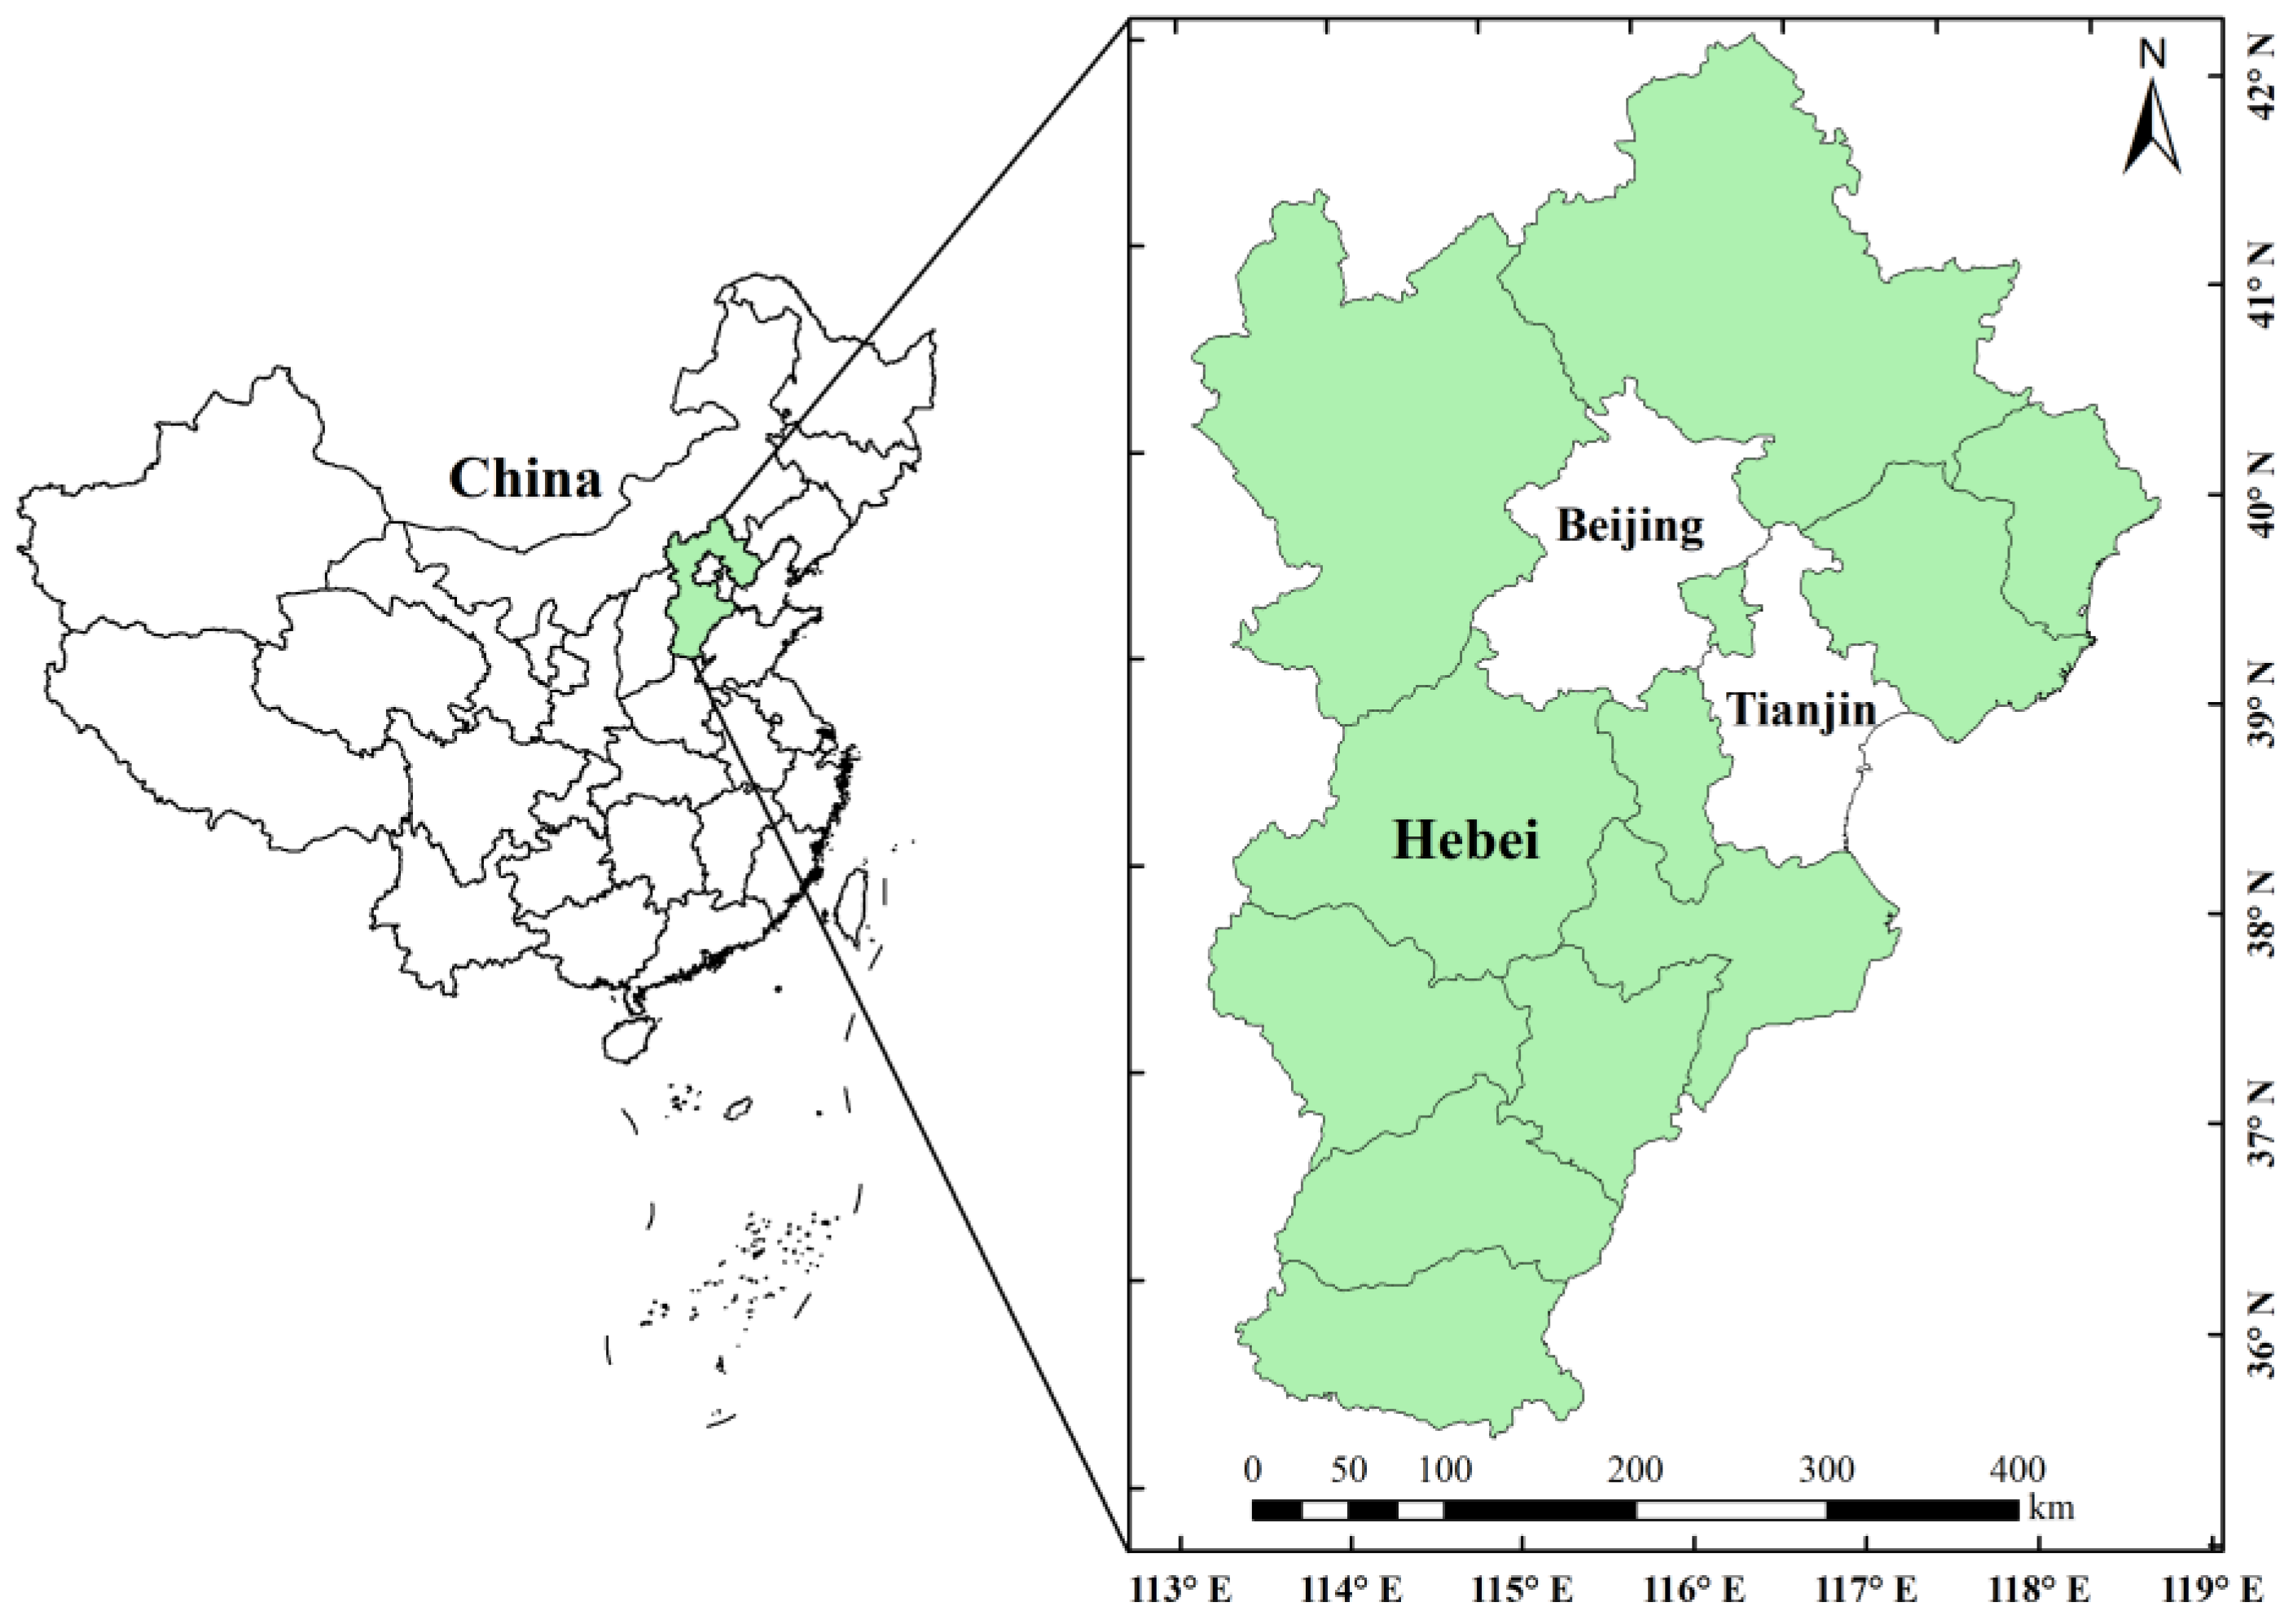
In recent years, the shortage of water resources has been prominent in Hebei Province. The per capita water resources of Hebei Province are 149.3 m
3, which is significantly less than the national per capita amount of 2062.9 m
3. It is one of the provinces with the most serious water resource problems in China. The average burial depth of the shallow groundwater increased from 9.32 m in 1986 to 18.18 m in 2019 [
1]. The surface water is insufficient to support the production and domestic water demands, resulting in serious groundwater exploitation. The water resource issues in Hebei Province have been aggravated by agglomeration, urbanization, and population growth [
2]. The water environment and water resources in Hebei Province are facing increasing pressure [
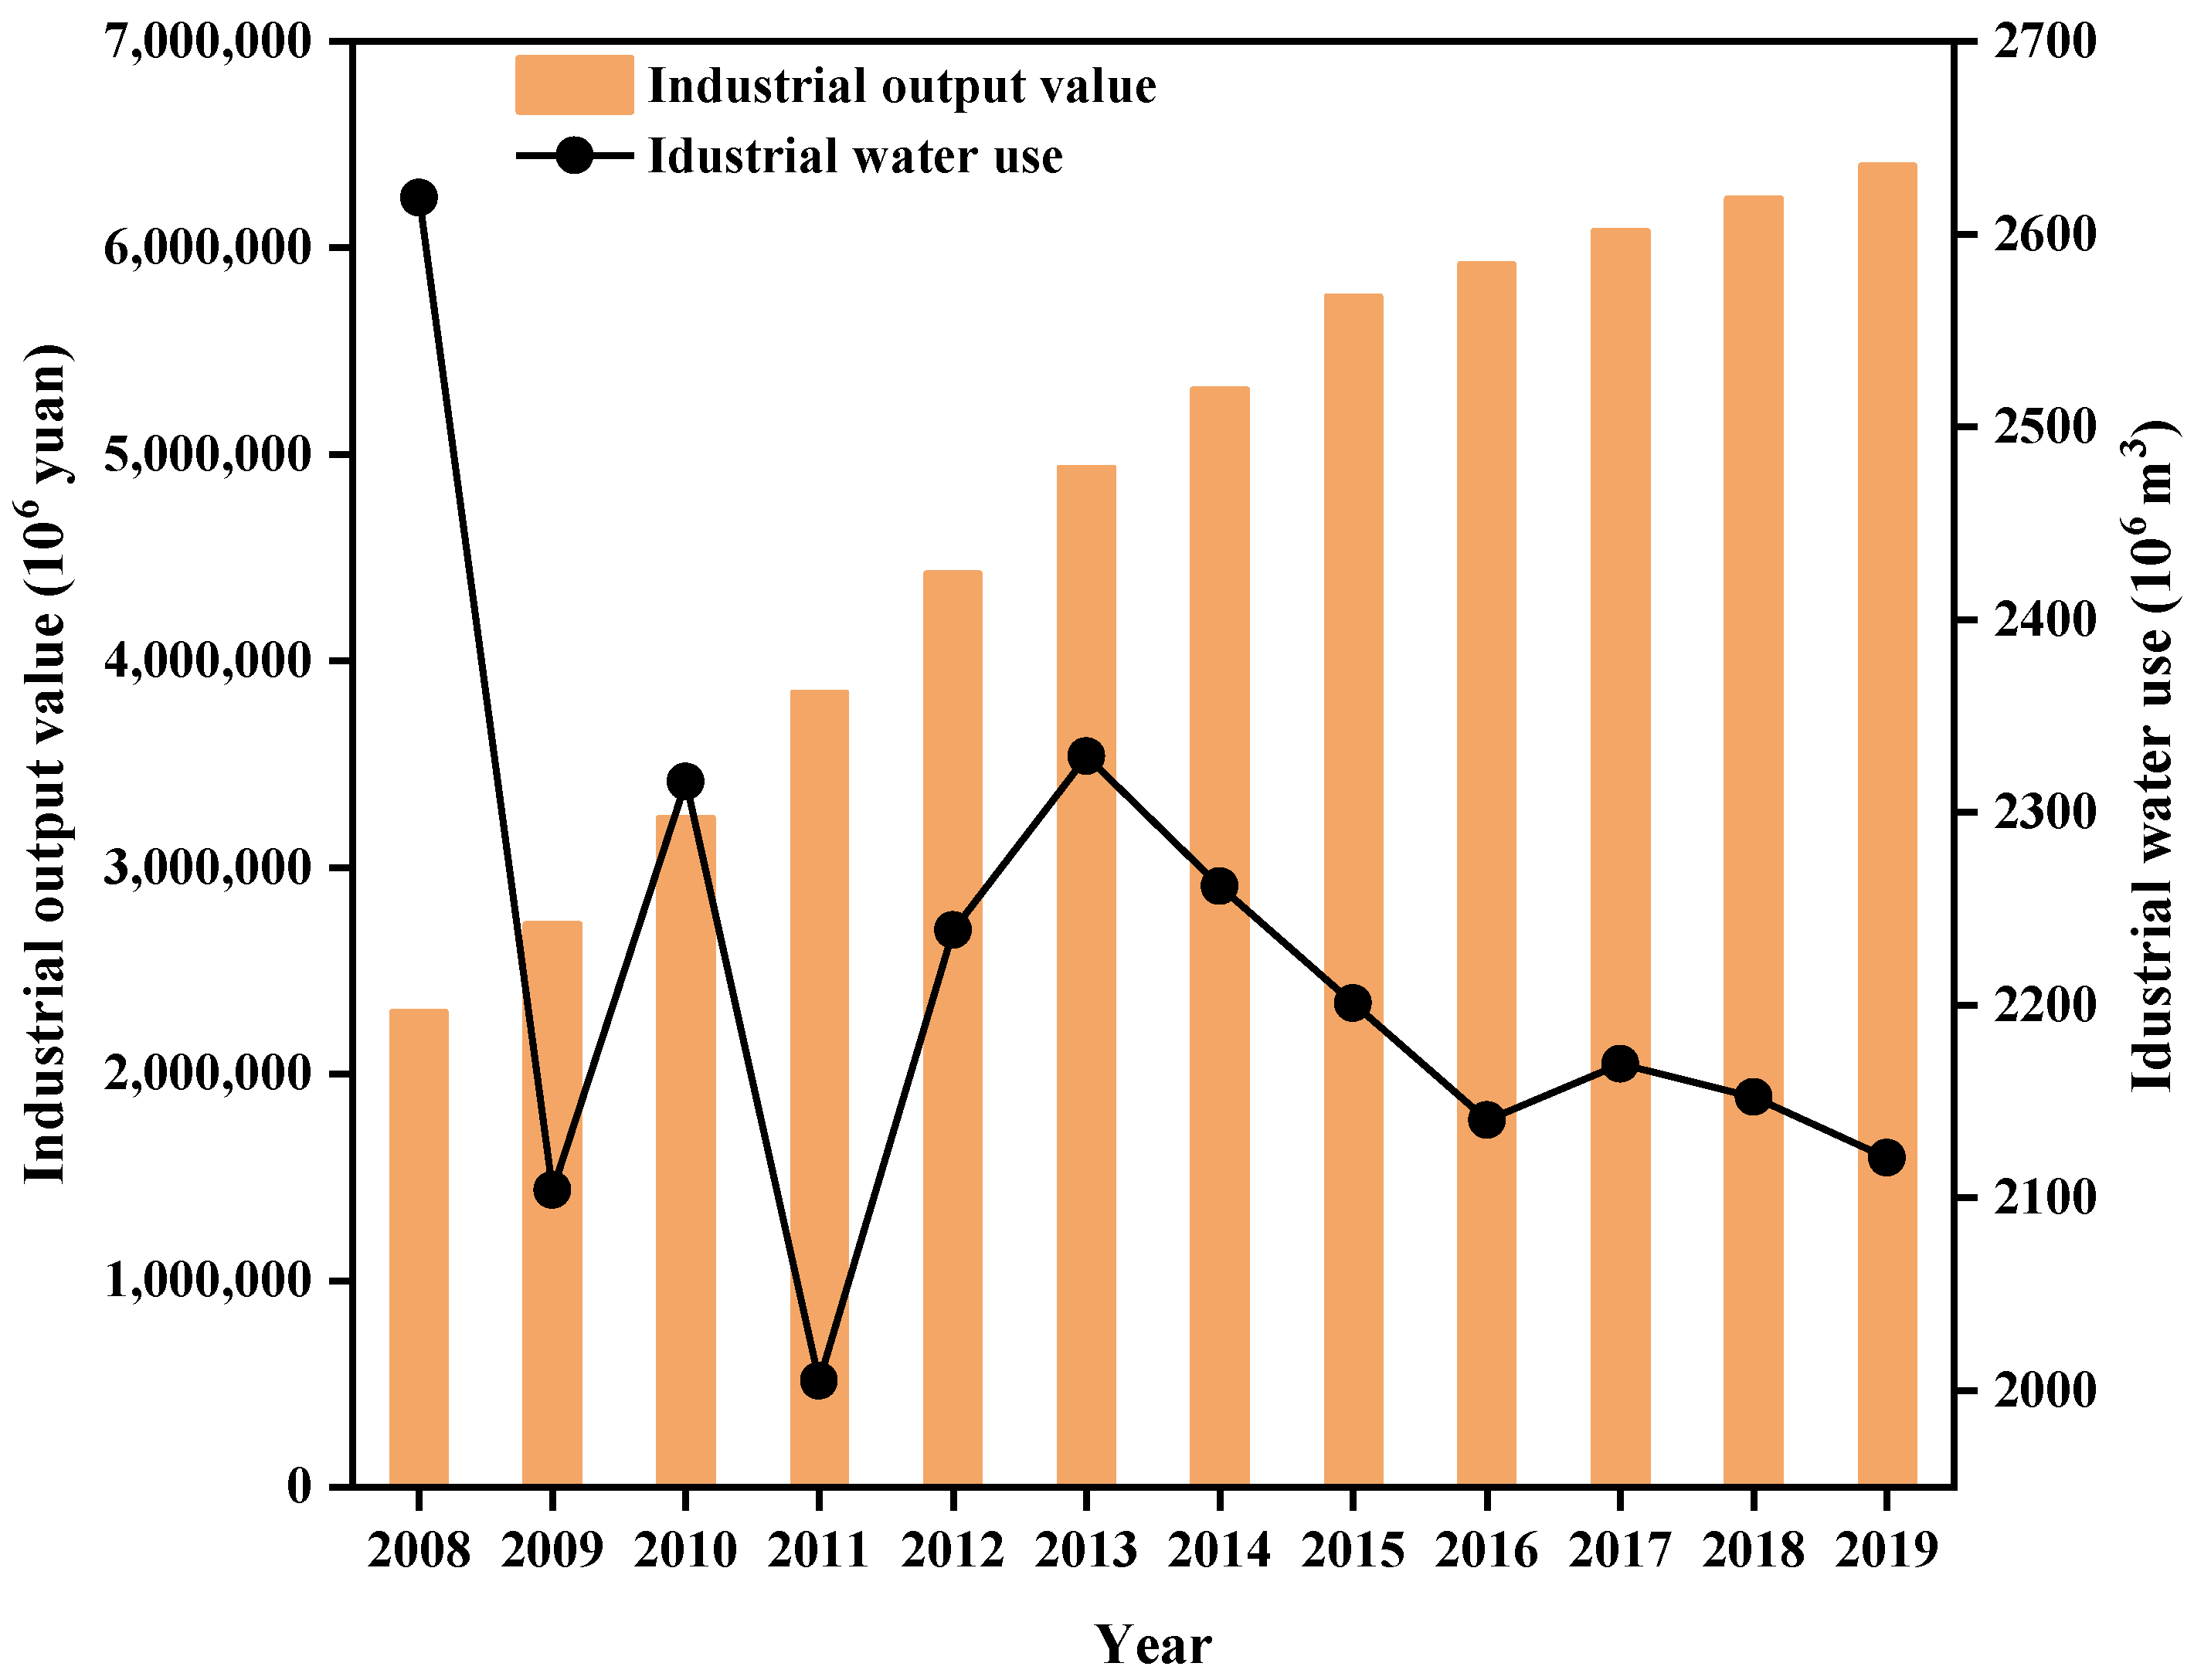
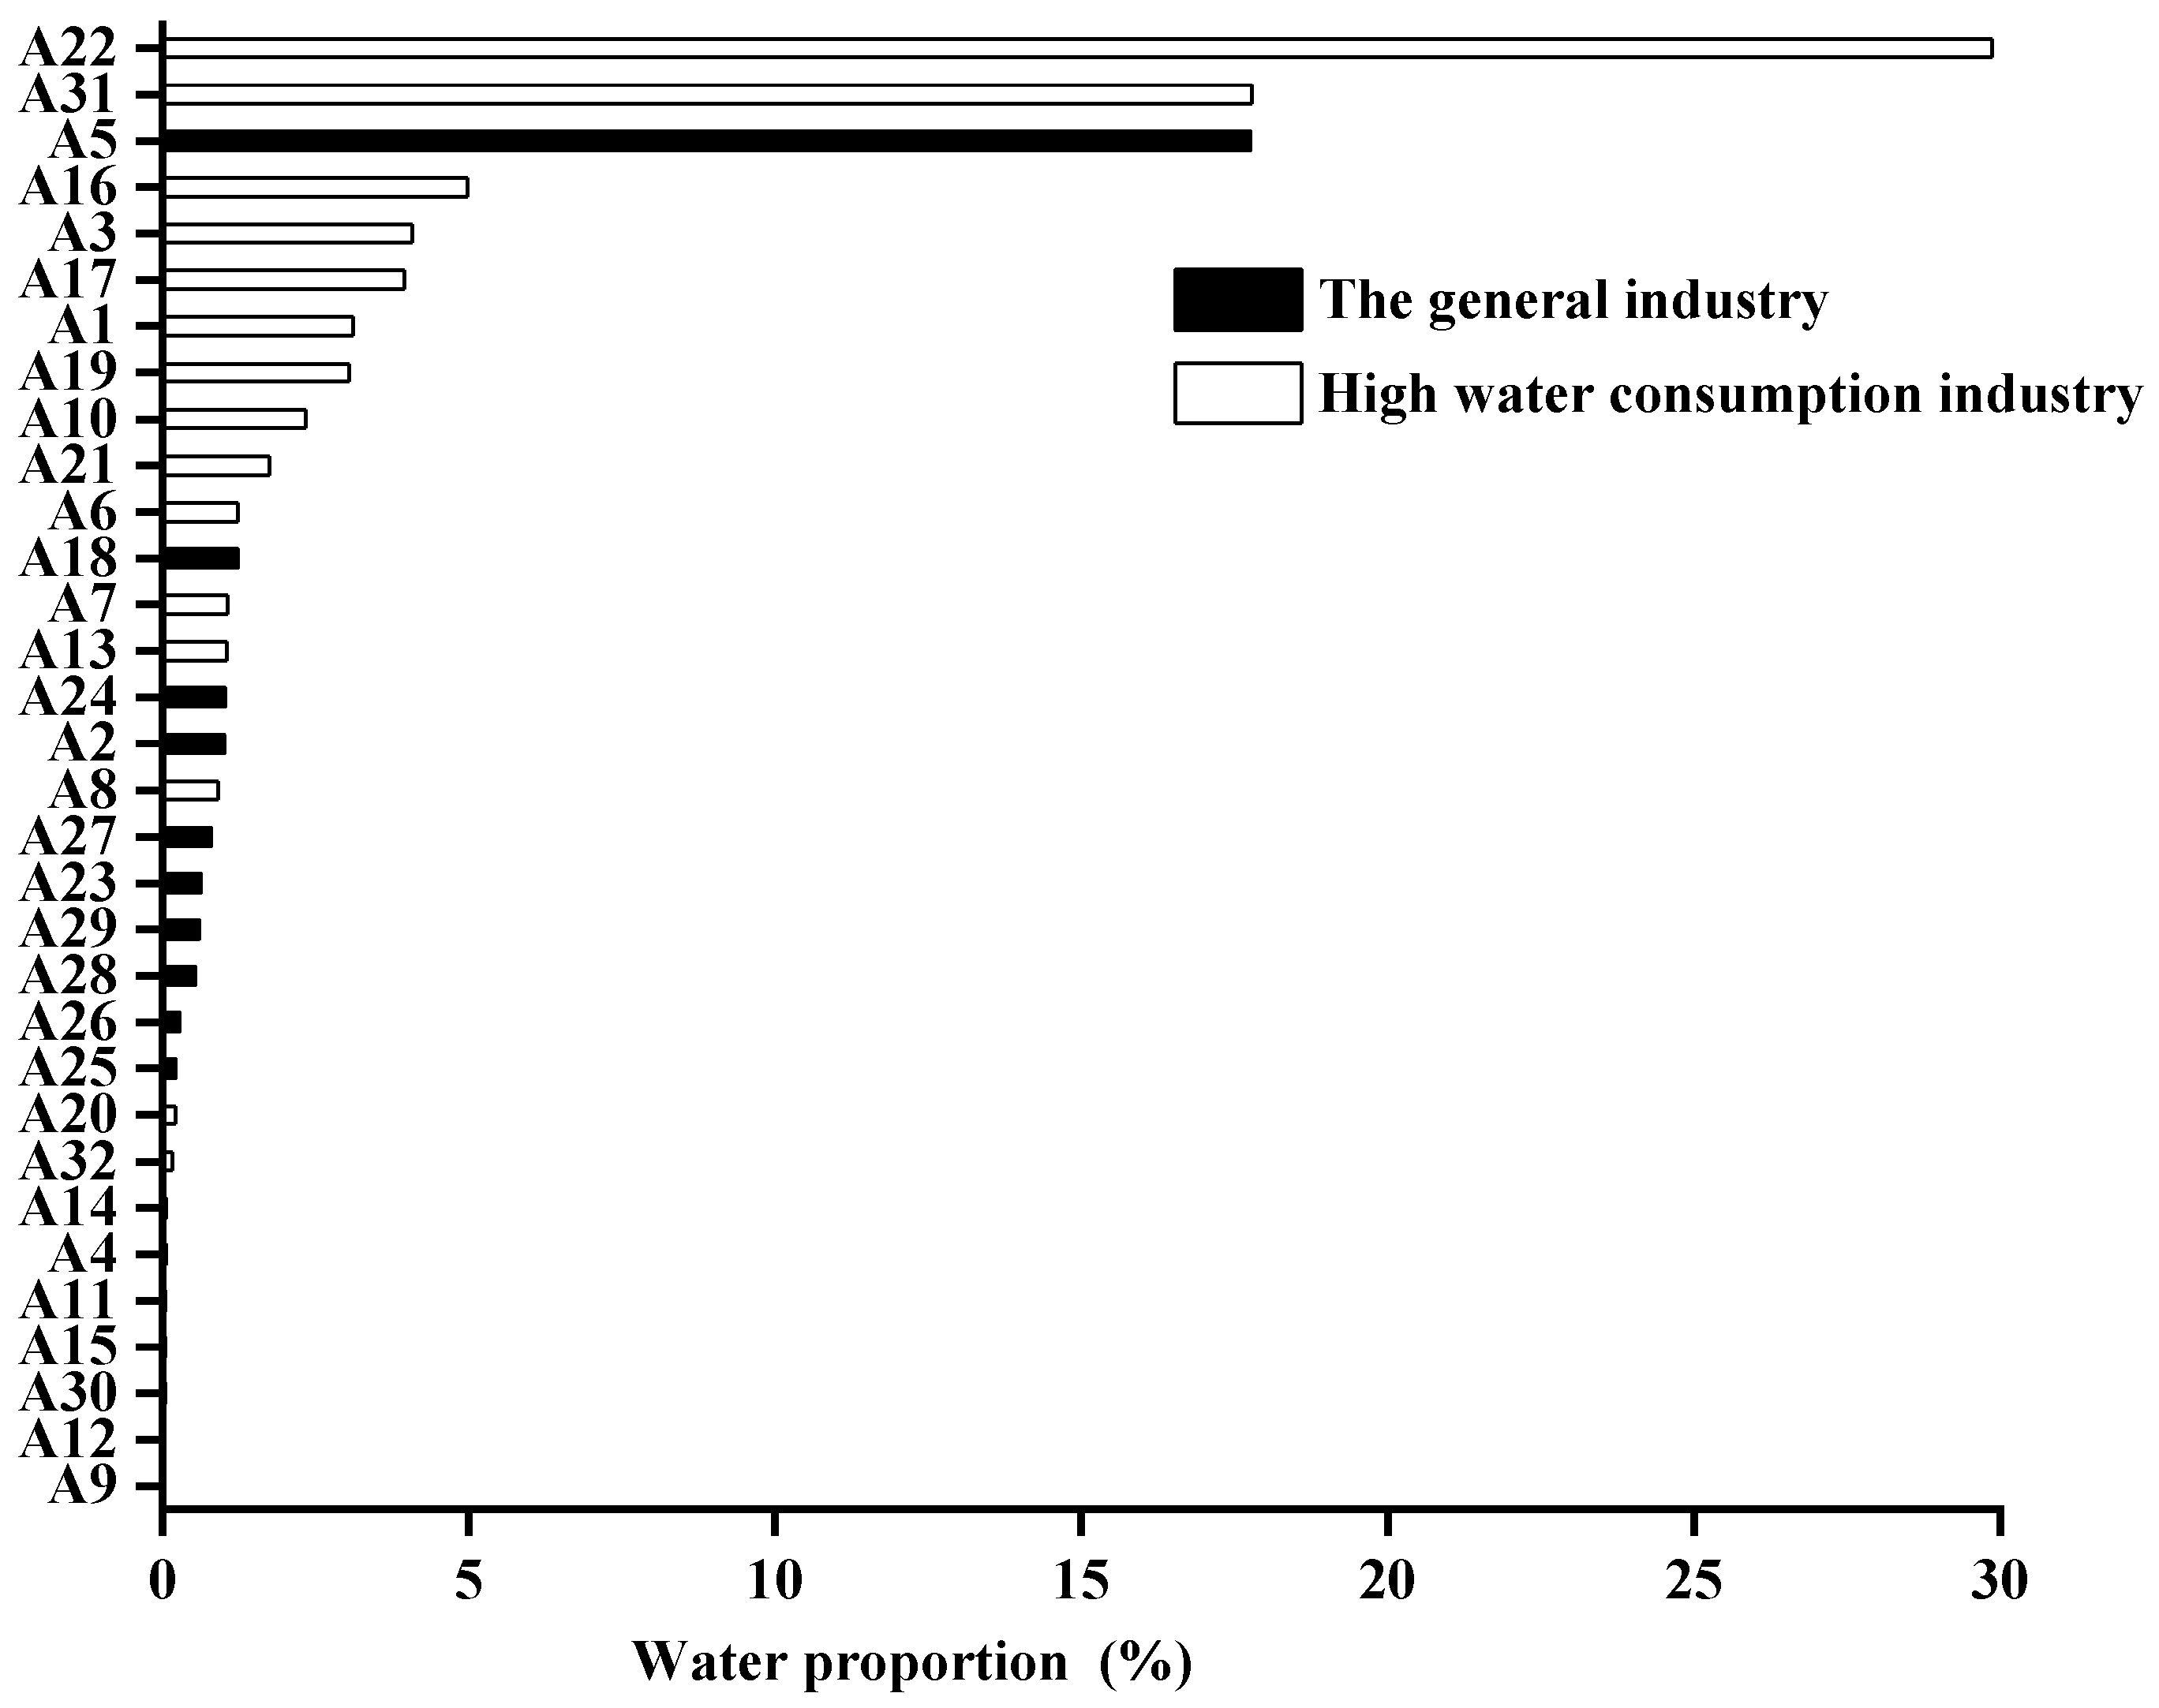
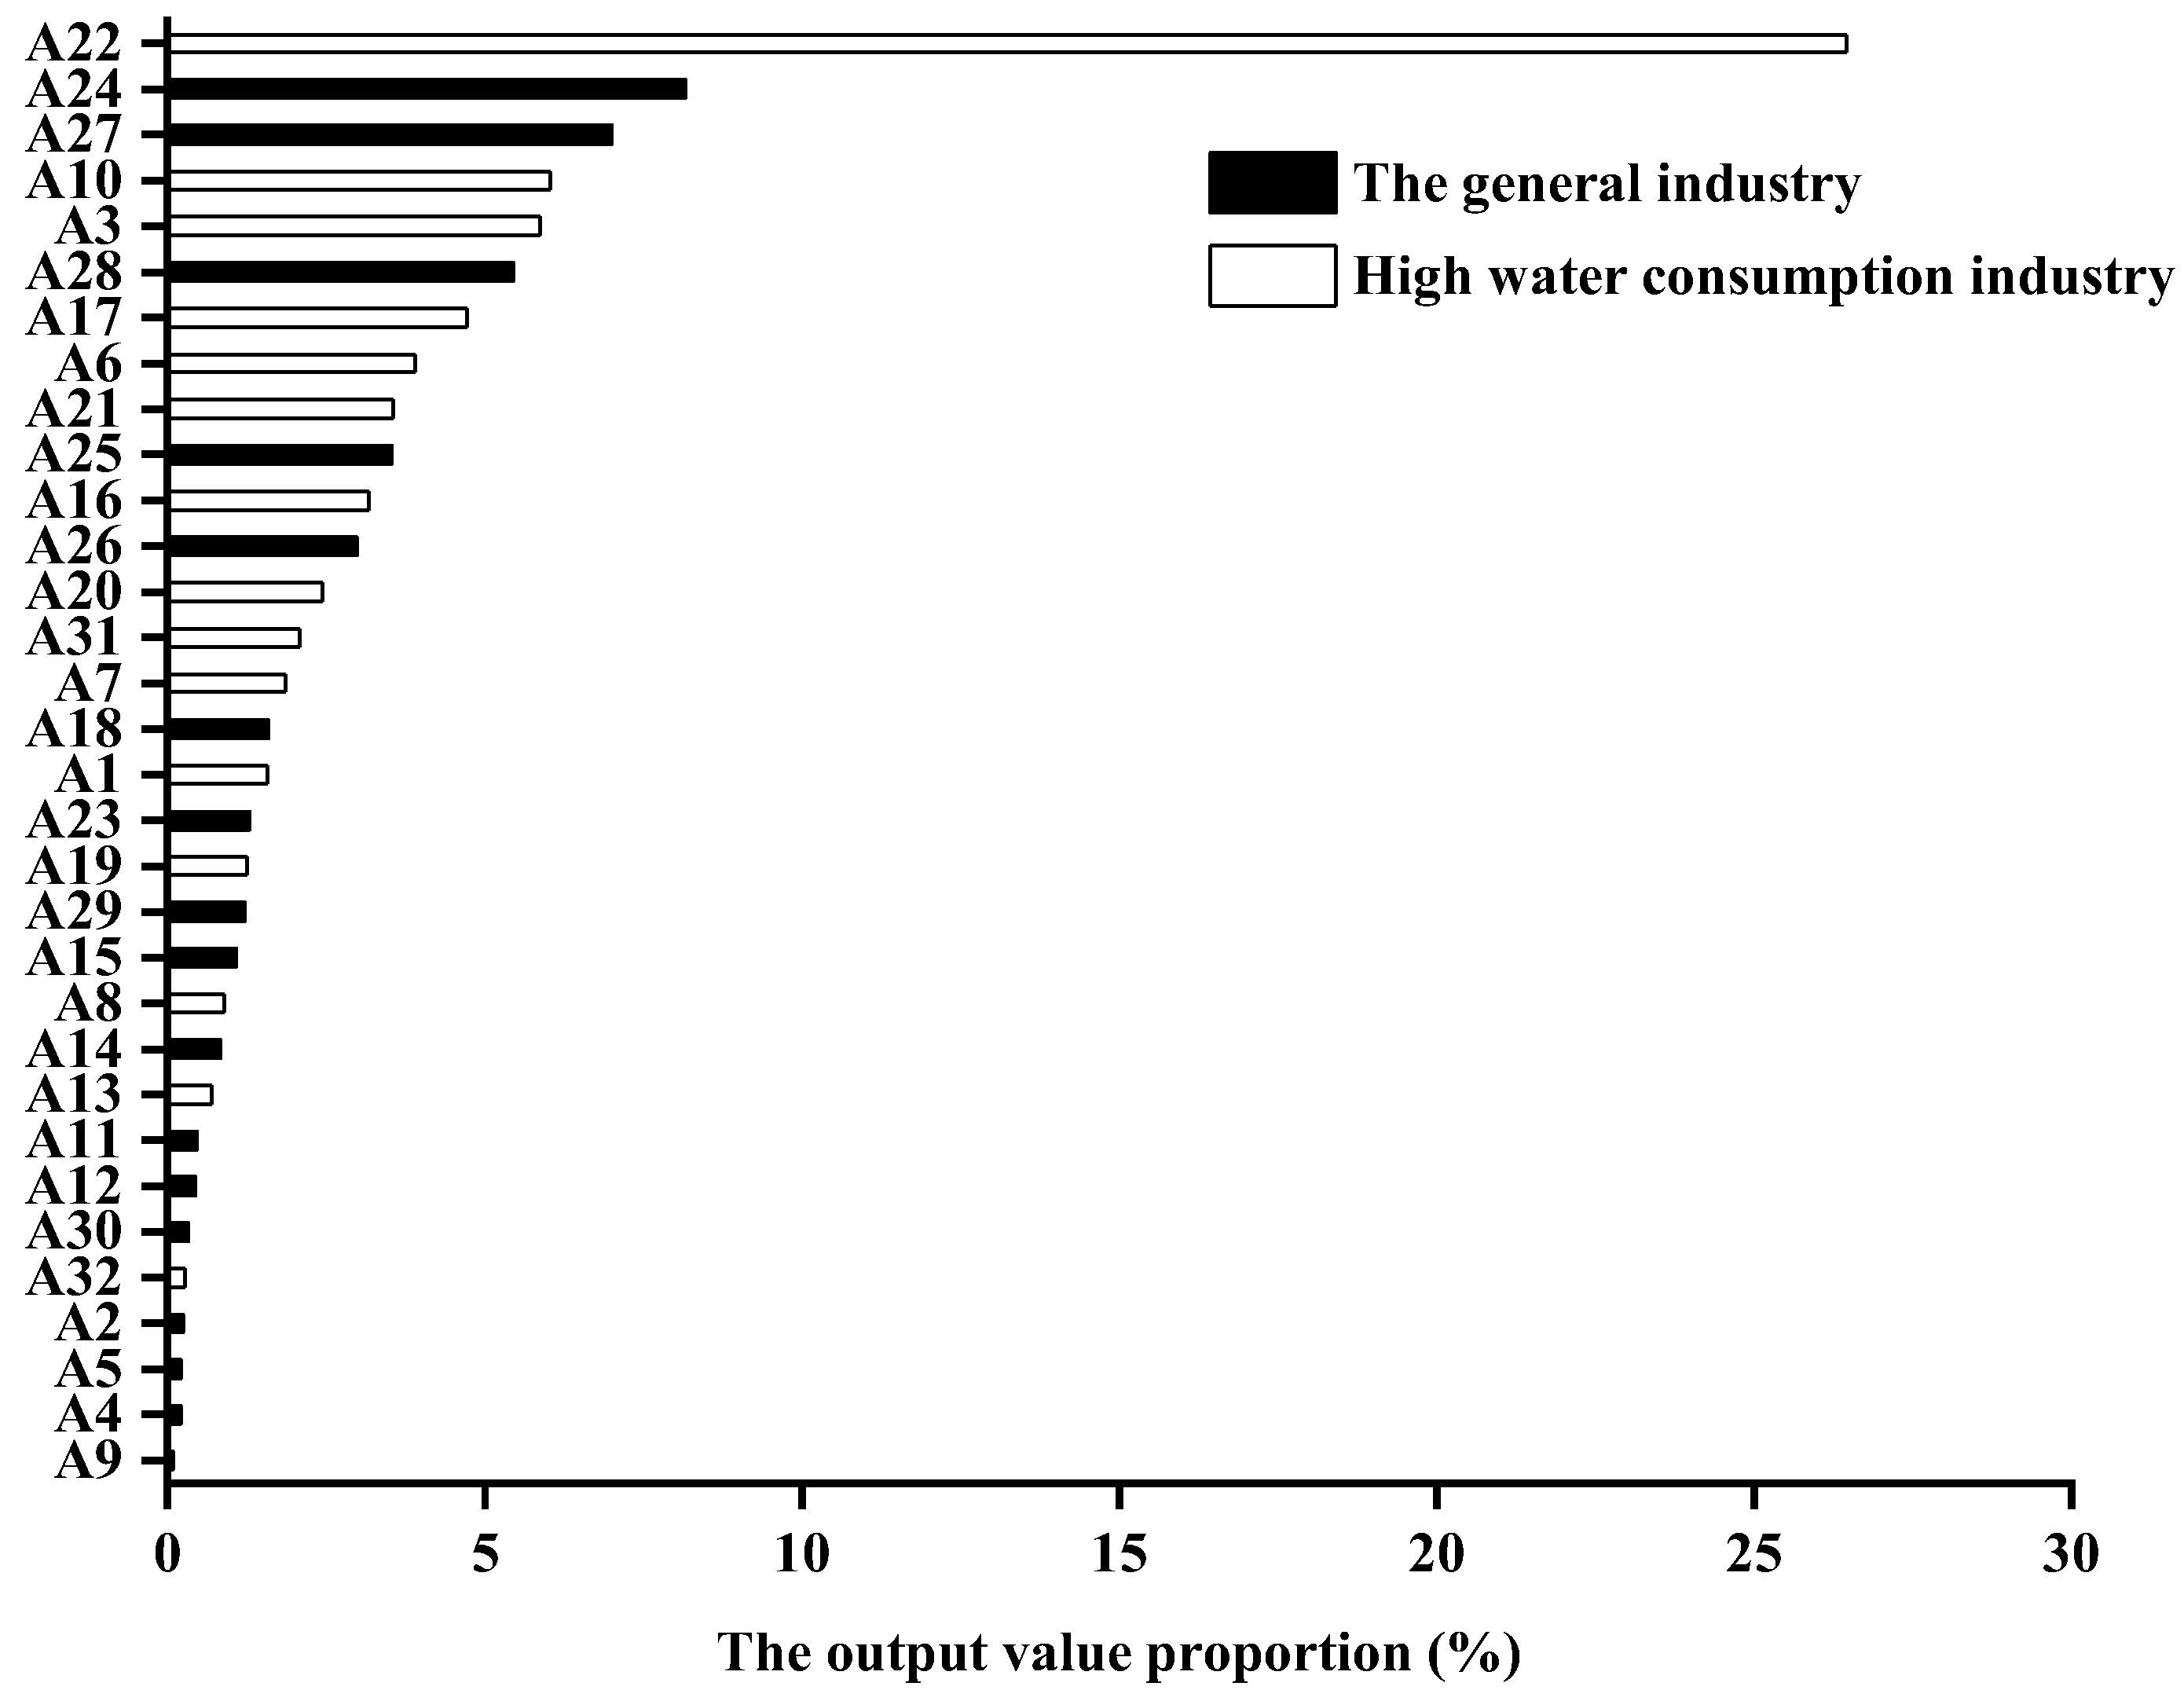
3]. There are still many problems with industrial water use, mainly due to the disparity between the industrial structure and the water resource carrying capacity and the large gap in the water use efficiencies of the various sectors. In Hebei Province, the high water consumption industries accounted for more than 70% of the total industrial water use and more than 60% of the total industrial output value. Therefore, it is worth analyzing the driving mechanism of industrial water use and considering the inter-industry heterogeneity.
For the past few years, the government has permanently attached great importance to the issue of water resources. The central government has increased the intensity of water diversion from the middle line of the South-to-North Water Diversion to Hebei Province. In 2018 and 2020, 2.24 and 3.65 billion m
3 of water was transferred to Hebei, respectively [
4]. Although this effectively reduced the groundwater exploitation to a certain extent and relieved Hebei Province’s water crisis, it was far from reversing the fundamental condition of the water shortage. Hebei Province also formulated a series of policies. In 2019, the government formulated the Beijing–Tianjin–Hebei Industrial Water-Saving Action Plan, which required the water use per 10,000 yuan of industrial added value in the Beijing–Tianjin–Hebei region to be less than 10.3 m
3. However, in Hebei Province it was 15.7 m
3. In addition, compared with the water intensity control target in the 14th Five-Year Plan [
5], the industrial water efficiency in Hebei Province was still 16.20% short of the target. Based on the water issues in Hebei Province, many studies have been conducted. Zheng et al. [
6] found that industrial distribution had a greater impact on the groundwater extraction. In addition, many studies on the relationship between industrial water use and the economy and industrial restructuring have been conducted [
7,
8]. Liu et al. [
9] showed that industrial restructuring was beneficial to improving water and energy efficiency. Wu et al. [
7] found that the correlation between the added industrial value and the industrial water use was poor. However, these studies were more biased toward overall industry analysis, downplaying the impact of the internal structure, especially the impact of the industrial structure on water use. Therefore, in this study, we further analyzed the driving mechanisms of the industrial water use changes from the sectoral perspective.
To date, many scholars have conducted extensive research on the driving mechanisms of industrial water use changes [
10,
11]. First, in terms of the research content, more studies have focused on the relationship between water use and economic development, the industrial structure, and technological progress [
12,
13]. Zhang et al. [
14] explored the effects of the economic scale, industrial structure, and water use efficiency on industrial water use in Tianjin. Lu et al. [
15] quantitatively analyzed the factors influencing water use change and found that technology and economic development were the main factors. Long et al. [
16] argued that the intensity effect reduced water resource consumption. Yang and Chen [
17] concluded that structural and technological factors inhibited the growth of water consumption. Compared with previous studies, Wang et al. [
18] took environmental protection factors into consideration. Several scholars also explored the relationship between water resource utilization and energy consumption [
19,
20] and carbon emissions [
21]. Zhao et al. [
22] studied the water–soil–energy–carbon relationship, and their results showed that the economic output of water resources can contribute to carbon emissions. Babel et al. [
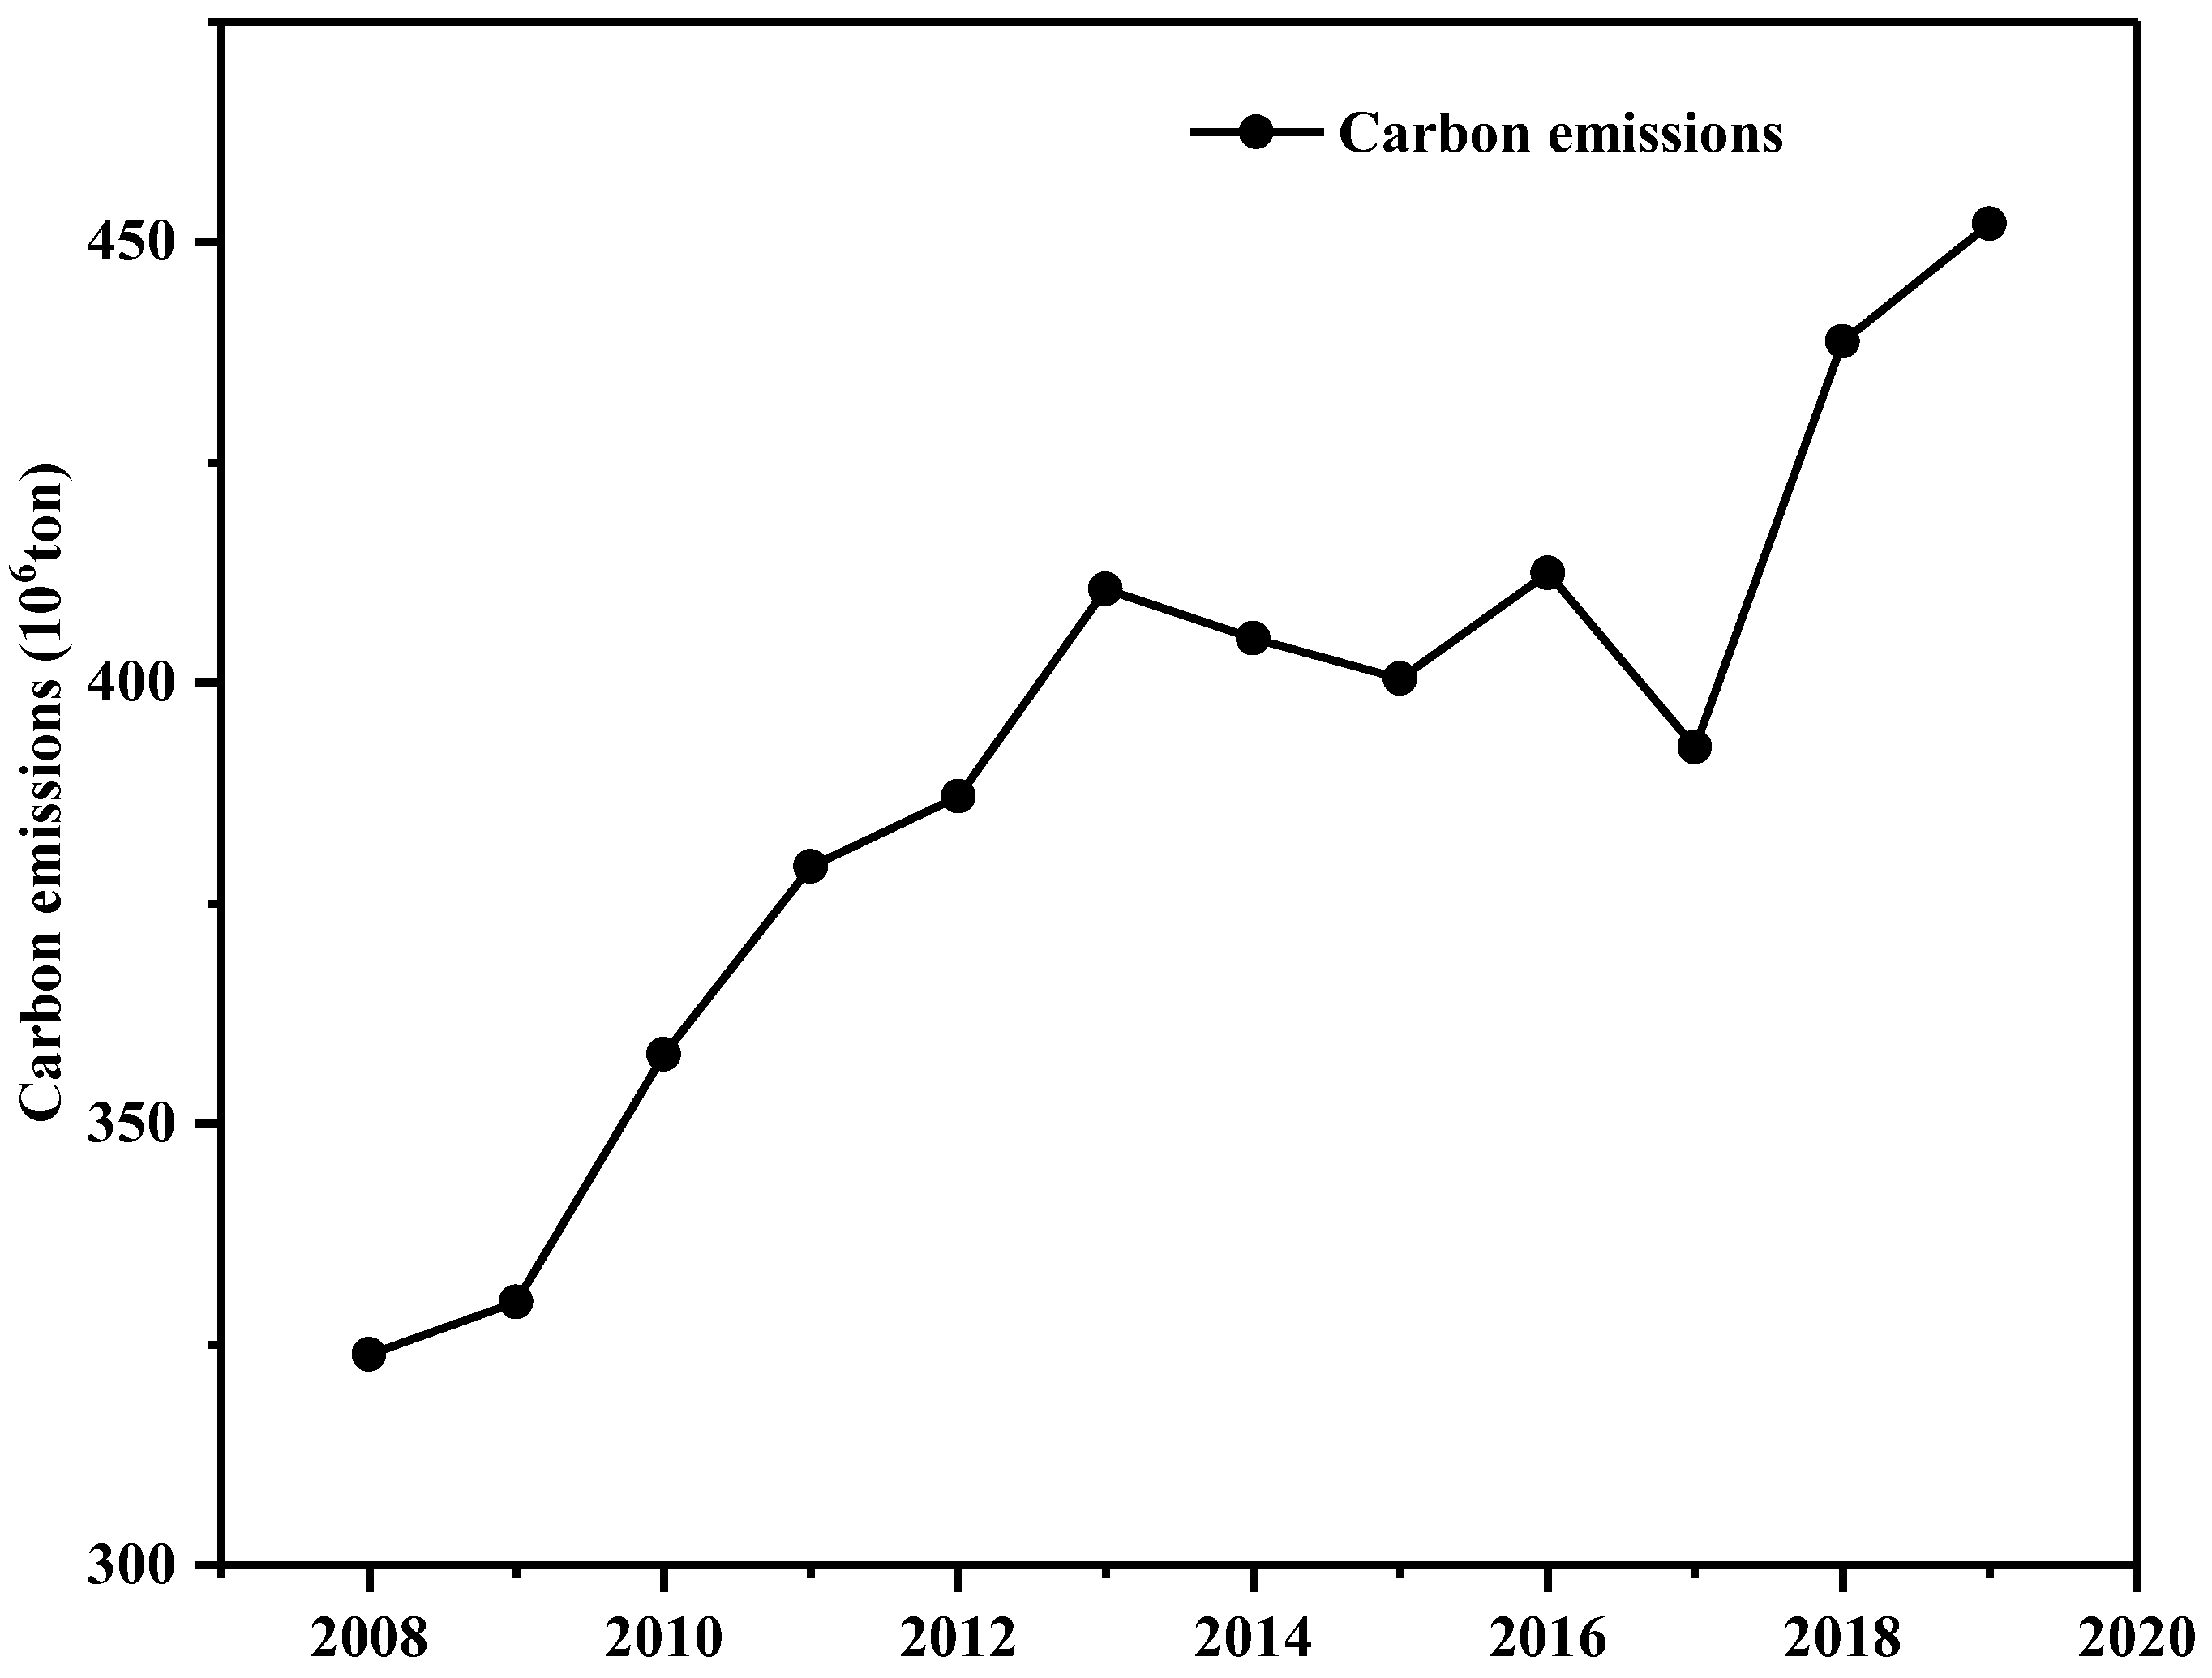
23] found a significant positive correlation between water and carbon emissions in the automotive manufacturing industry. Considering the double carbon target proposed by China, Hebei Province, as an important part of the capital economic circle, is bound to respond positively and achieve carbon peaking and carbon neutrality. With the implementation of the carbon emission policy, the change in the carbon emissions will also affect the change in the industrial water use in Hebei Province. Second, in terms of research methods, the linear regression method [
23], gray correlation analysis method [
14], structural decomposition method (SDA) [
24], and logarithmic mean divisia index method (LMDI) [
25] have been more often used to analyze the factors influencing water use changes and carbon emissions. By contrast, the SDA method and LMDI method can quantify the degree of the influences among the factors. However, the LMDI method has no residuals, good decomposition, and strong adaptability. Moreover, it can dynamically analyze the changes in different periods. Zhang et al. [
25] used the LMDI method to analyze the drivers of agricultural water use in the middle reaches of the Heihe River during different periods. Wu et al. [
26] analyzed the drivers of water consumption in the Xinjiang Uygur Autonomous Region. In addition, this method has been widely applied in the field of water resources and carbon emissions in recent years [
27]. This method can examine the direction and extent of each driver’s effect on the overall goal. Therefore, in this study, the LMDI method was used to dynamically analyze the changes in the industrial water use and its drivers in Hebei Province.
According to previous studies, the main factors affecting industrial water use can be summarized as industrial economic growth, industrial structure, and industrial water efficiency; however, the impact of carbon emissions on industrial water use has been less quantitatively studied. Previous research on industrial water use changes was mainly based on analysis from the perspective of individual industries or sectors. The industry classification was rough and could not fully reflect the changes in the water use in the internal sectors. The contributions of this study are as follows. First, the LMDI method was chosen to analyze the driving factors of industrial water use in Hebei Province from 2008 to 2019, avoiding the influence of the residual values, making the results more accurate, and enriching the literature on the drivers of industrial water use. Second, the industrial sub-sector perspective was examined, focusing on the industry differences of industrial water use changes. Third, the traditional LMDI method was refined, carbon emission factors were introduced, and the impact of carbon emissions on industrial water use was quantitatively analyzed. Therefore, in this study, the industrial sectors were taken as the entry point and carbon factors were introduced based on the traditional LMDI method to analyze the driving factors of industrial water use in Hebei Province from 2008 to 2019. We aimed to provide basic support and a reference for subsequent studies in Hebei Province and even other regions, as well as for the formulation of industrial water conservation and carbon reduction policies.
4. Results and Analysis
4.1. Overall Decomposition Analysis
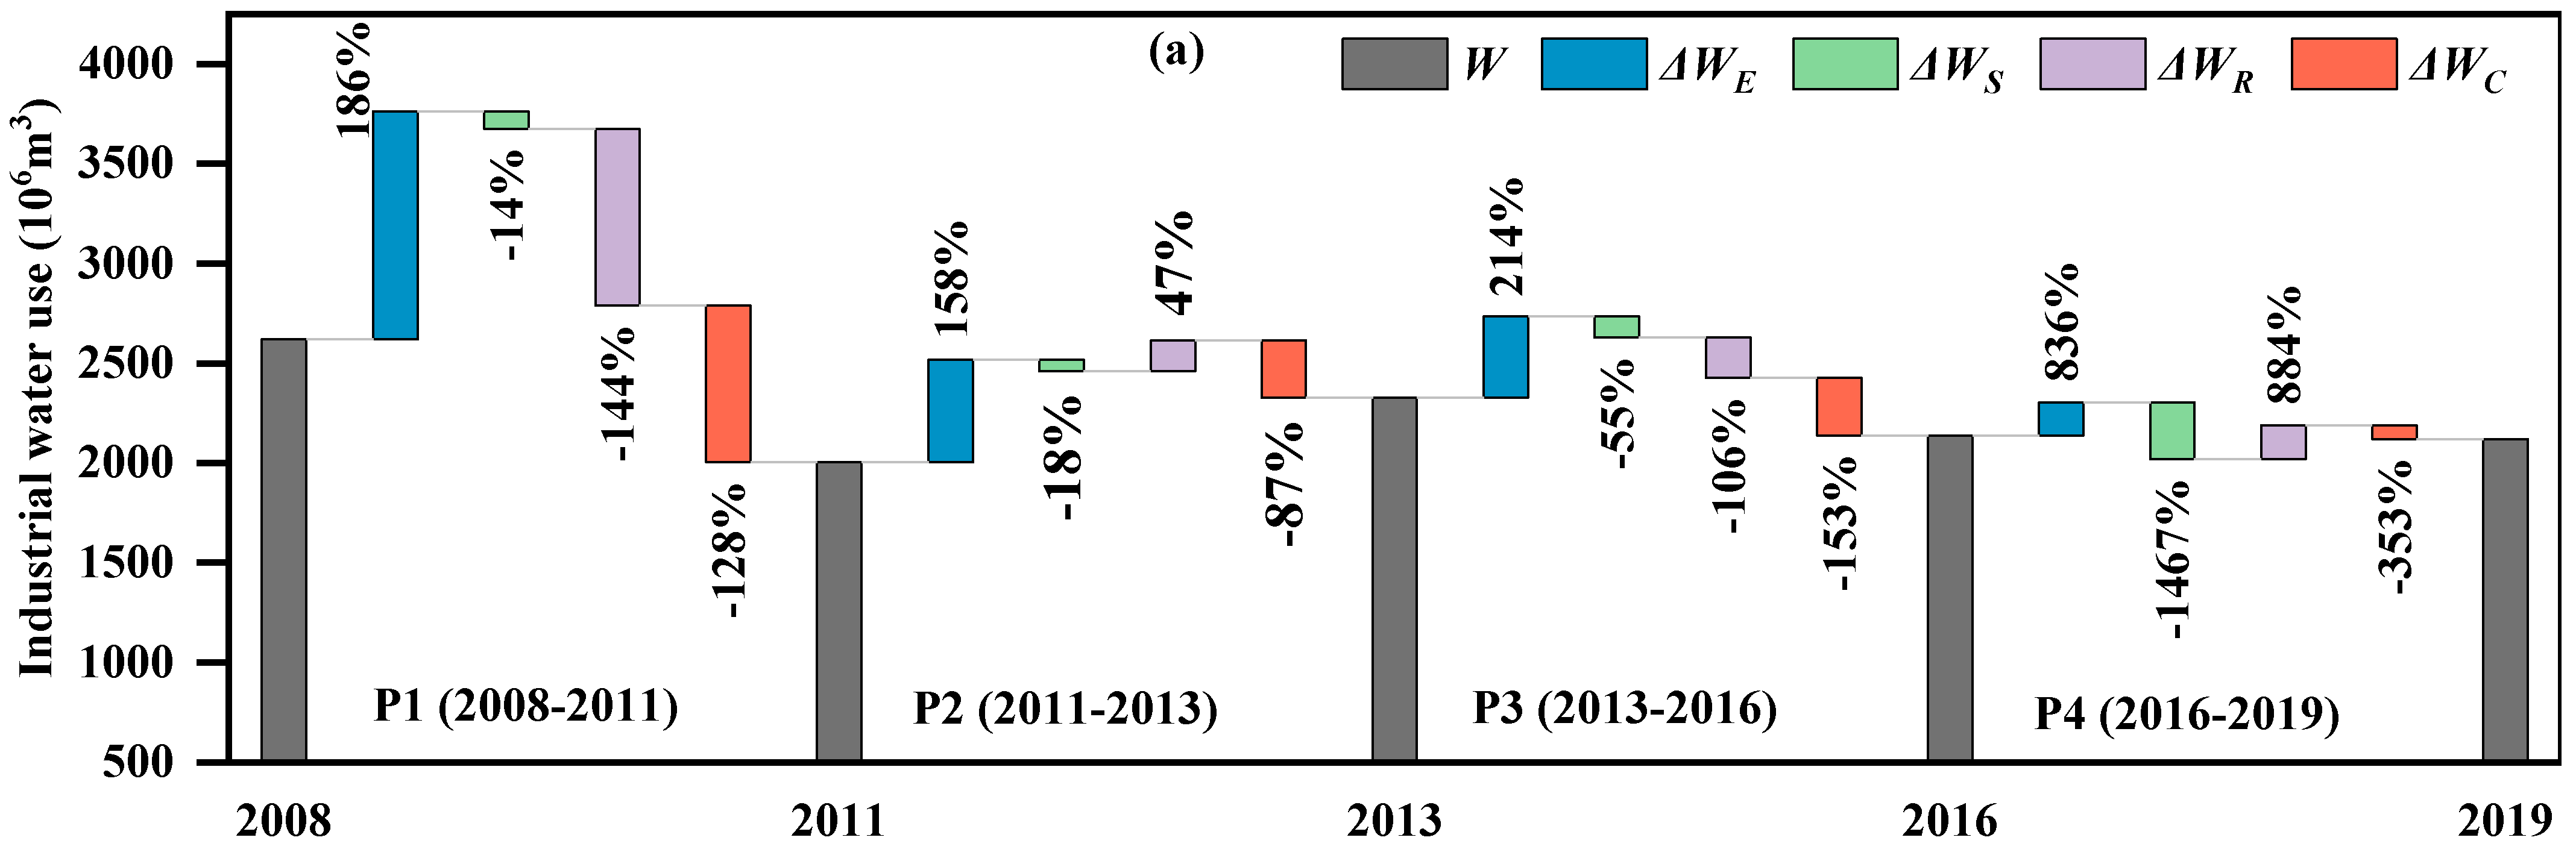
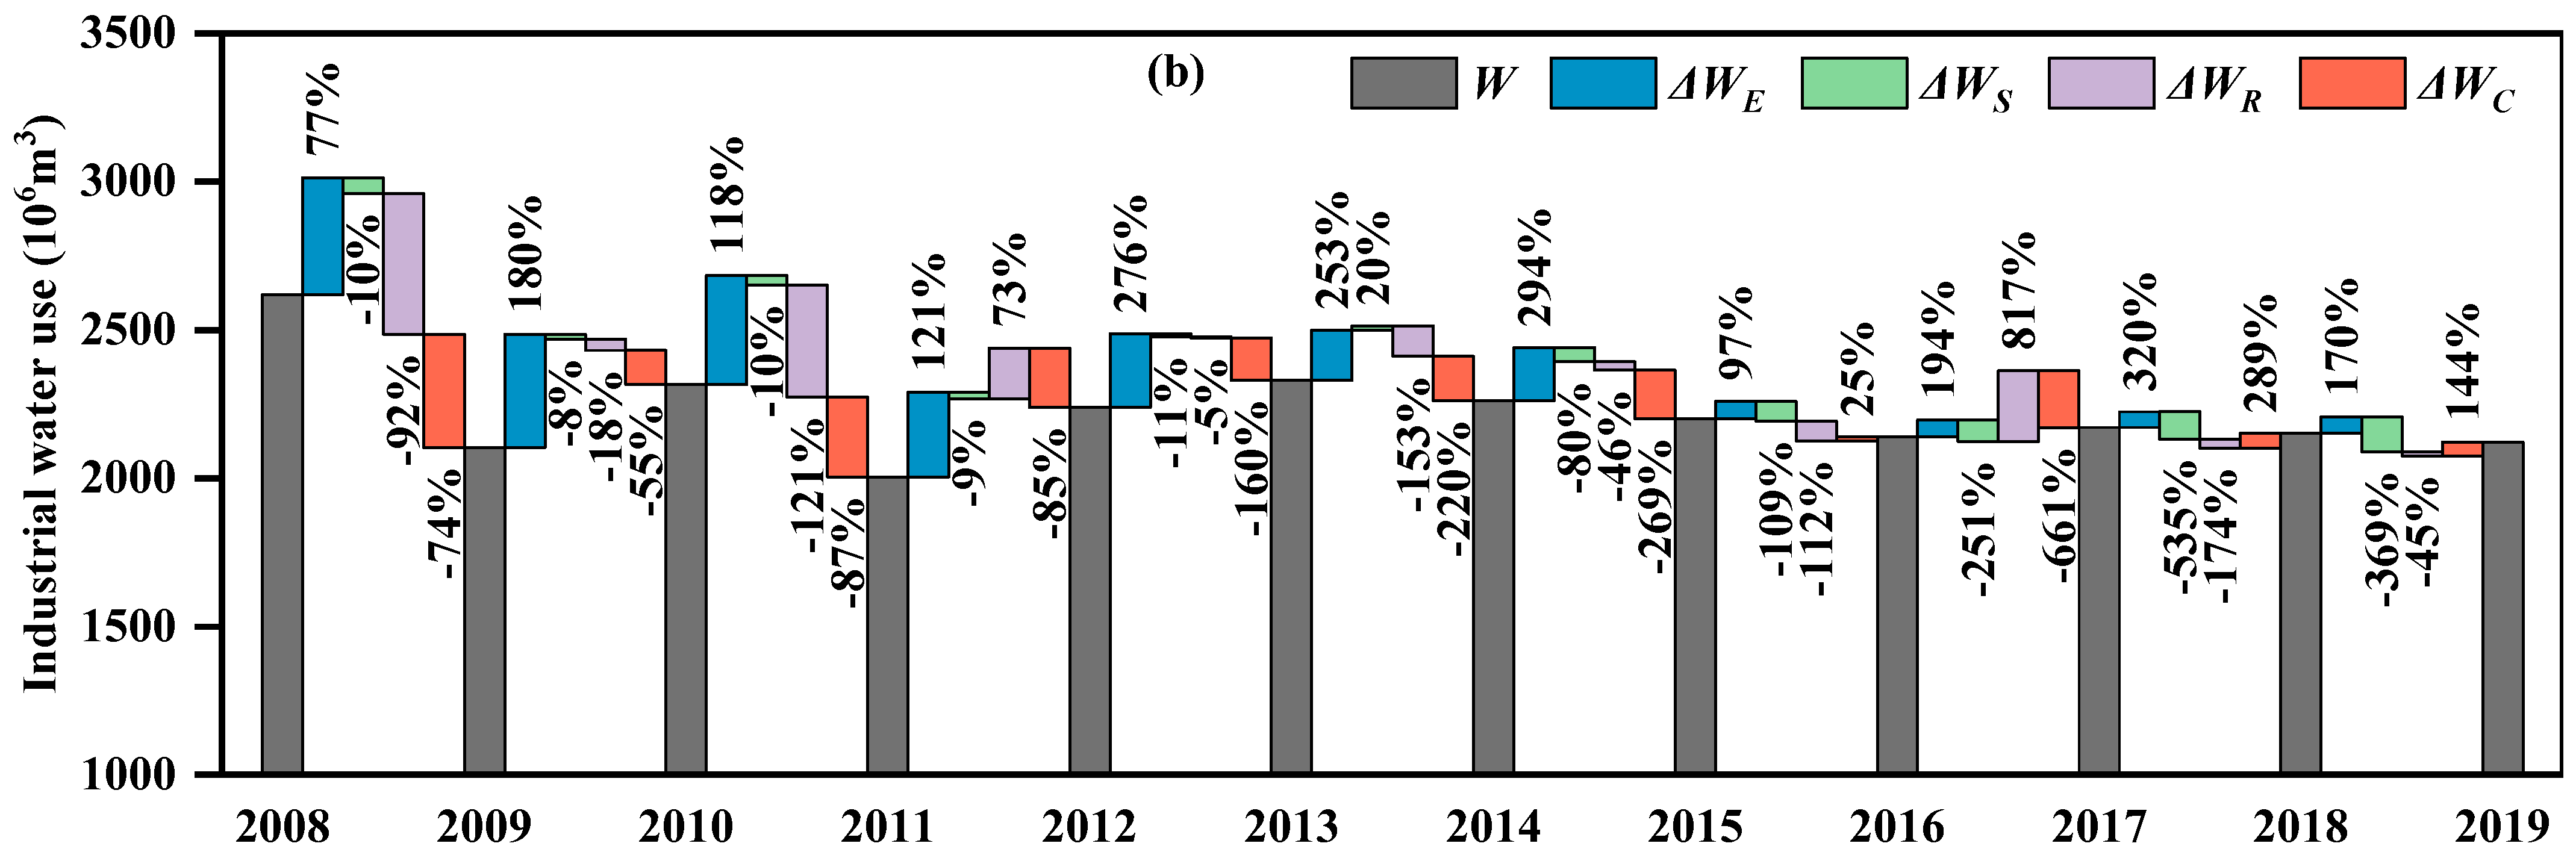
In this study, the change in the industrial water use in Hebei Province from 2008 to 2019 was decomposed into the economic scale effect, industrial structure effect, water–carbon effect, and carbon emission effect according to the above formula.
Figure 7 illustrates the decomposition results.
Analyzed in terms of the cumulative effect, the carbon emission efficiency played a key role in reducing industrial water use, with a cumulative reduction of 1425 million m3, accounting for −286.11%. The water–carbon effect and the industrial structure effect had the next highest effects, with reductions of 763 and 533 million m3, respectively. The contribution rates of these two effects were −153.19% and −106.93%, respectively. The cumulative reduction in the industrial water use was greater than the increase in the economic effect, resulting in a reduction in industrial water use in Hebei Province. Except for a few years, the water–carbon effect, the industrial structure effect, and the carbon emission effect were negative, indicating that these factors had a negative driving effect on the growth of the industrial water use. The economic scale effect was always positive, indicating that the economic scale effect promoted the growth of industrial water use.
According to the multi-year time scale analysis, the economic effect during 2008–2011 and 2016–2019 was 1143 and 163 million m3, respectively, with a diminishing role in promoting industrial water growth. Based on the annual time scale analysis, the industrial water use was stimulated with an average annual increase of 205 million m3 due to the economic scale effect. The industrial water use growth in 2009–2010, 2011–2012, and 2012–2013 was determined, and the economic effect dominated the growth of industrial water use during these periods. Analysis of the multi-year time scale revealed that during 2008–2011 to 2016–2019, the industrial structure effect was −86 and −285 million m3, respectively. As for the absolute value of the contribution rate, it exhibited an increasing trend, indicating that the industrial structure effect gradually strengthened the inhibition effect of the industrial water use. However, the contribution of the industrial structure effect was smaller than those of the carbon emission effect and the water–carbon effect. Before 2014, the water-saving effect of the industrial structure effect was not obvious, and the carbon emission effect and the water–carbon effect were dominant. After 2014, the water-saving capacity of the industrial structure effect began to emerge.
In 2008–2009, the water–carbon effect was reduced by 476 million m
3, which was nine times the industrial structure effect. This result indicates that the water–carbon relationship was coordinated and was more effective in reducing industrial water use. The water–carbon relationship deteriorated, resulting in a decrease in water savings from 887 million m
3 in 2008–2011 to 201 million m
3 in 2013–2016. The water savings decreased significantly by about 77%, and the carbon emission effect decreased from 785 to 69 million m
3. The change in the water reduction reflected the diminishing roles of the water–carbon effect and the carbon-emission effect in curbing the growth of industrial water use. The dampening effect of the carbon emissions effect also reflects the significant dampening effect of technological progress on industrial water use. In addition, the sum of the water–carbon effect and the carbon emission effect reflects the impact of the industrial water use efficiency. The sum of these two effects gradually changed from a negative to a positive value, indicating that increasing water use efficiency can significantly reduce water use. However, due to the limitations of technological development, technological advancements cannot infinitely enhance water use efficiency [
30].
4.2. Sectoral Decomposition Analysis
4.2.1. Total Effect
To obtain a better understanding of the features of the water use throughout the total industry, the factors influencing the water use were examined from the sector perspective.
Figure 8 and
Figure 9 present the findings of the factor decomposition for each industrial sector in the analysis.
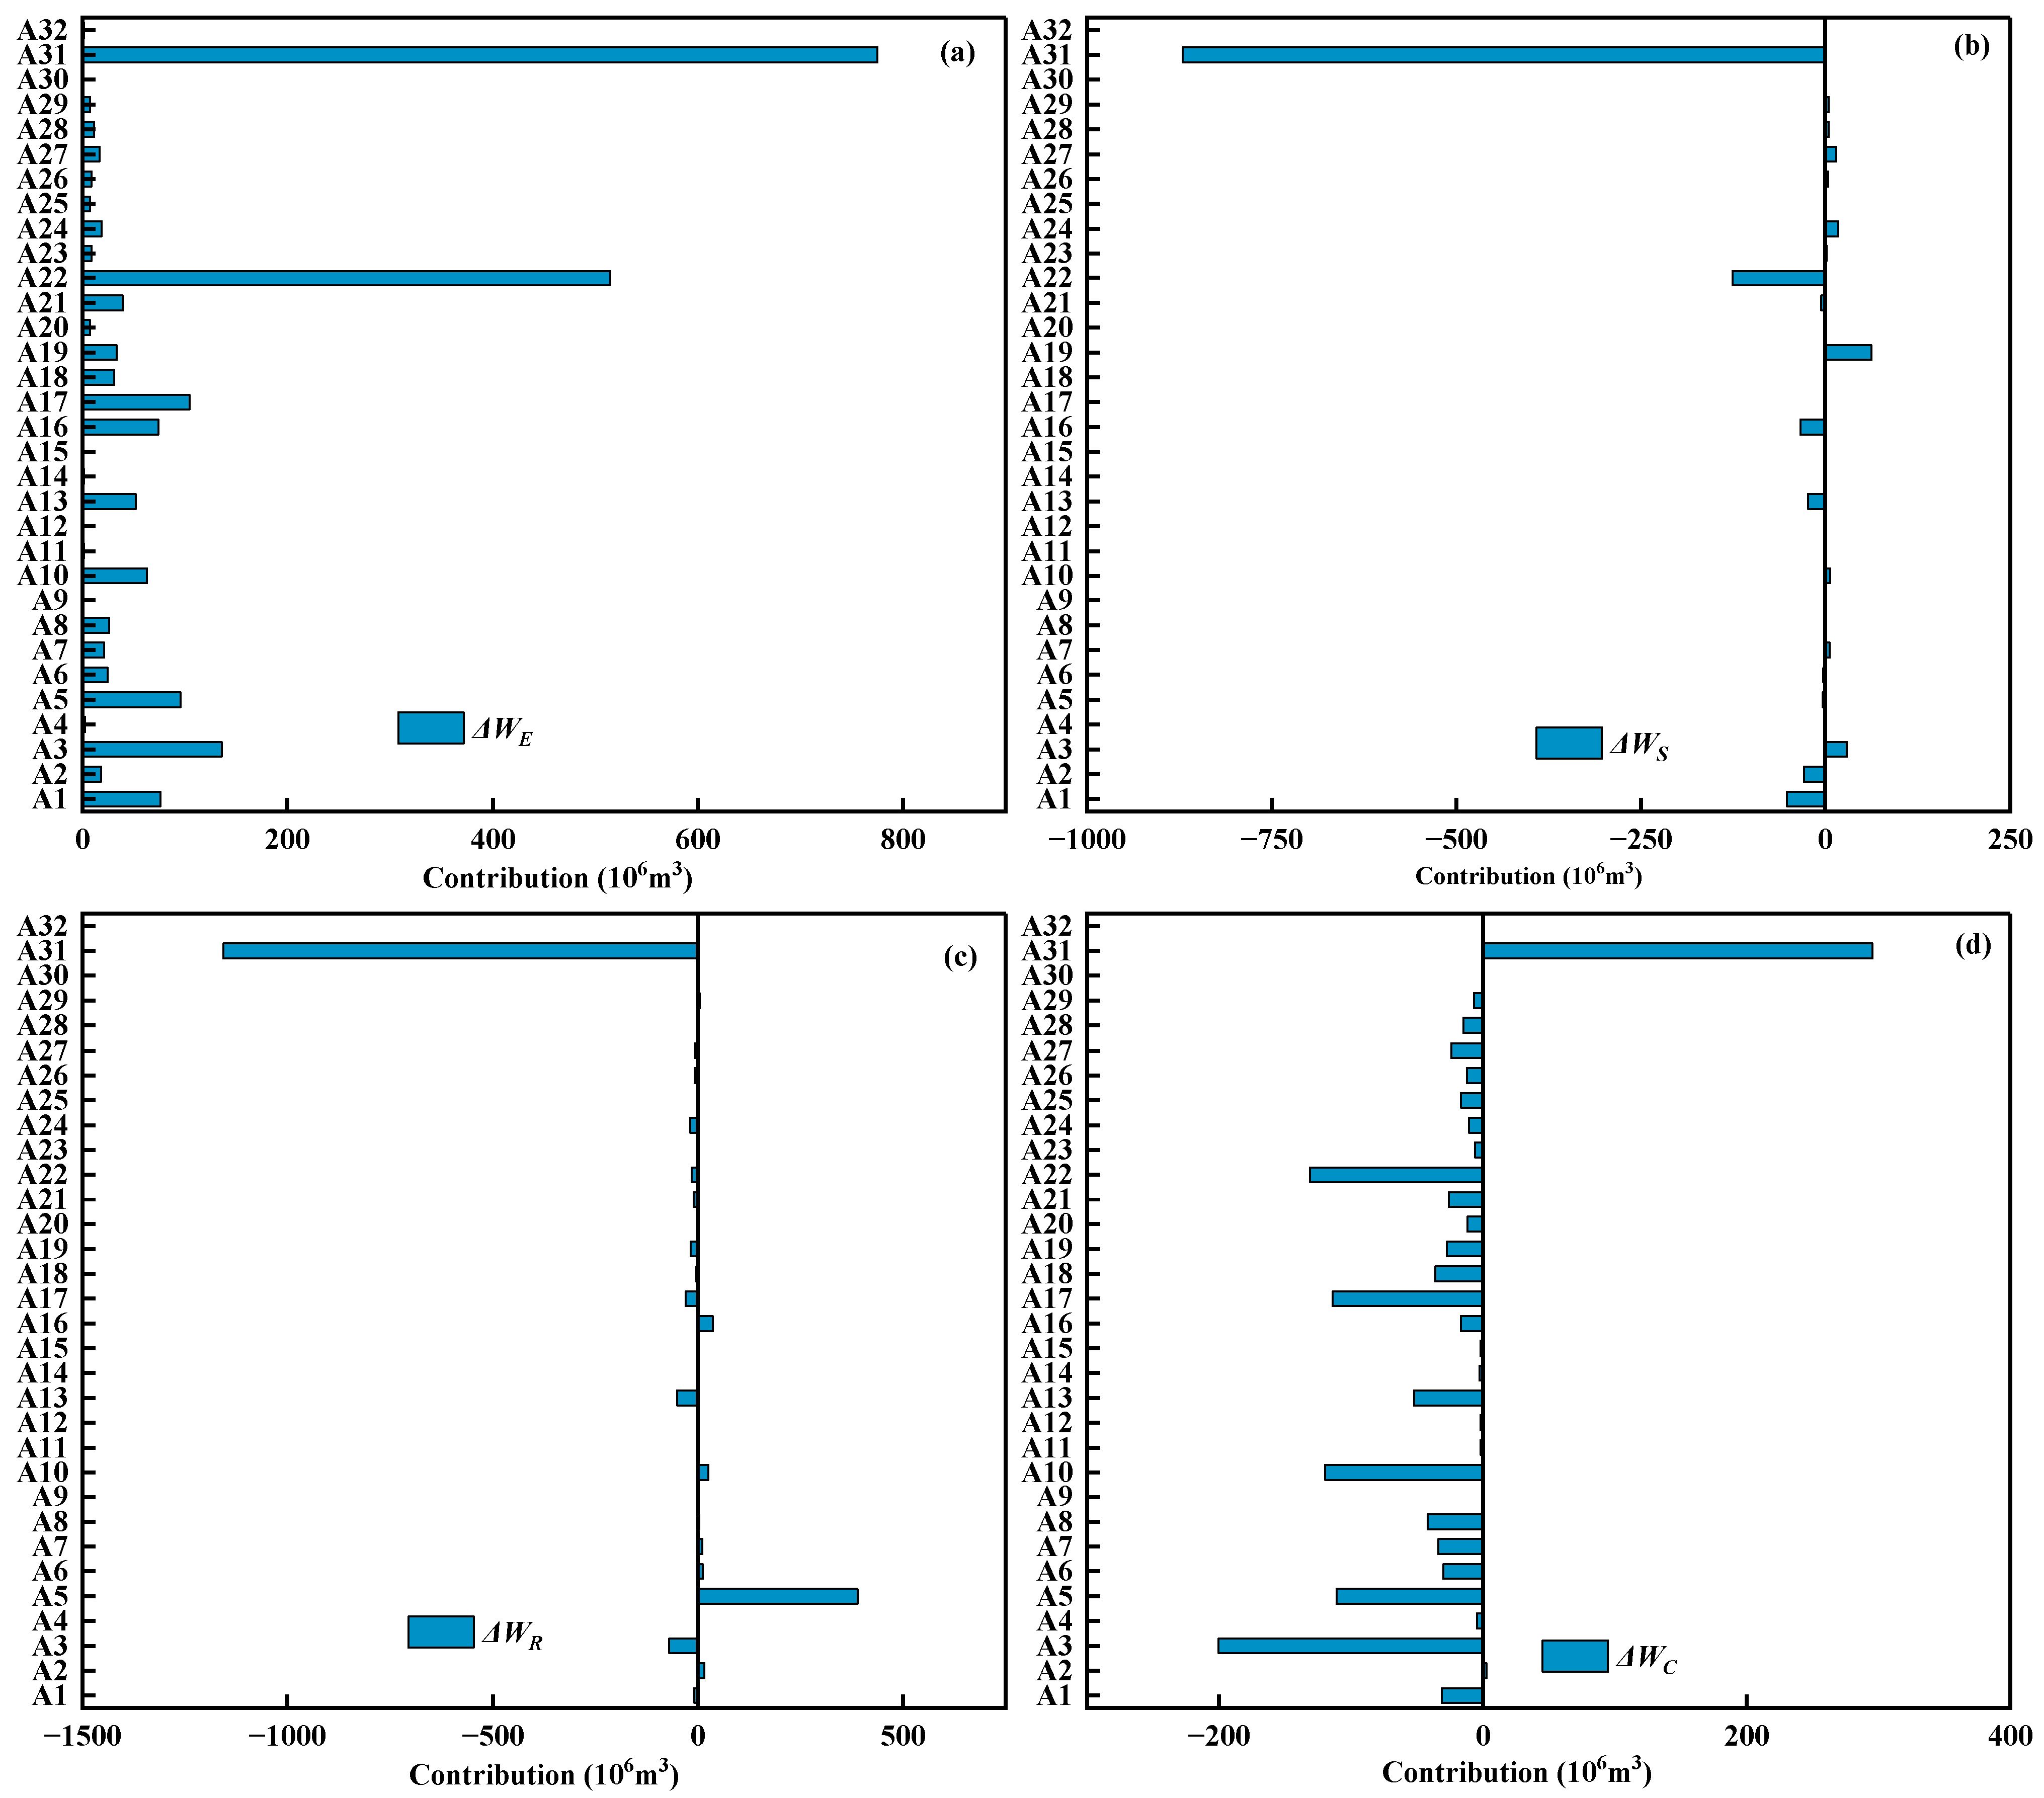
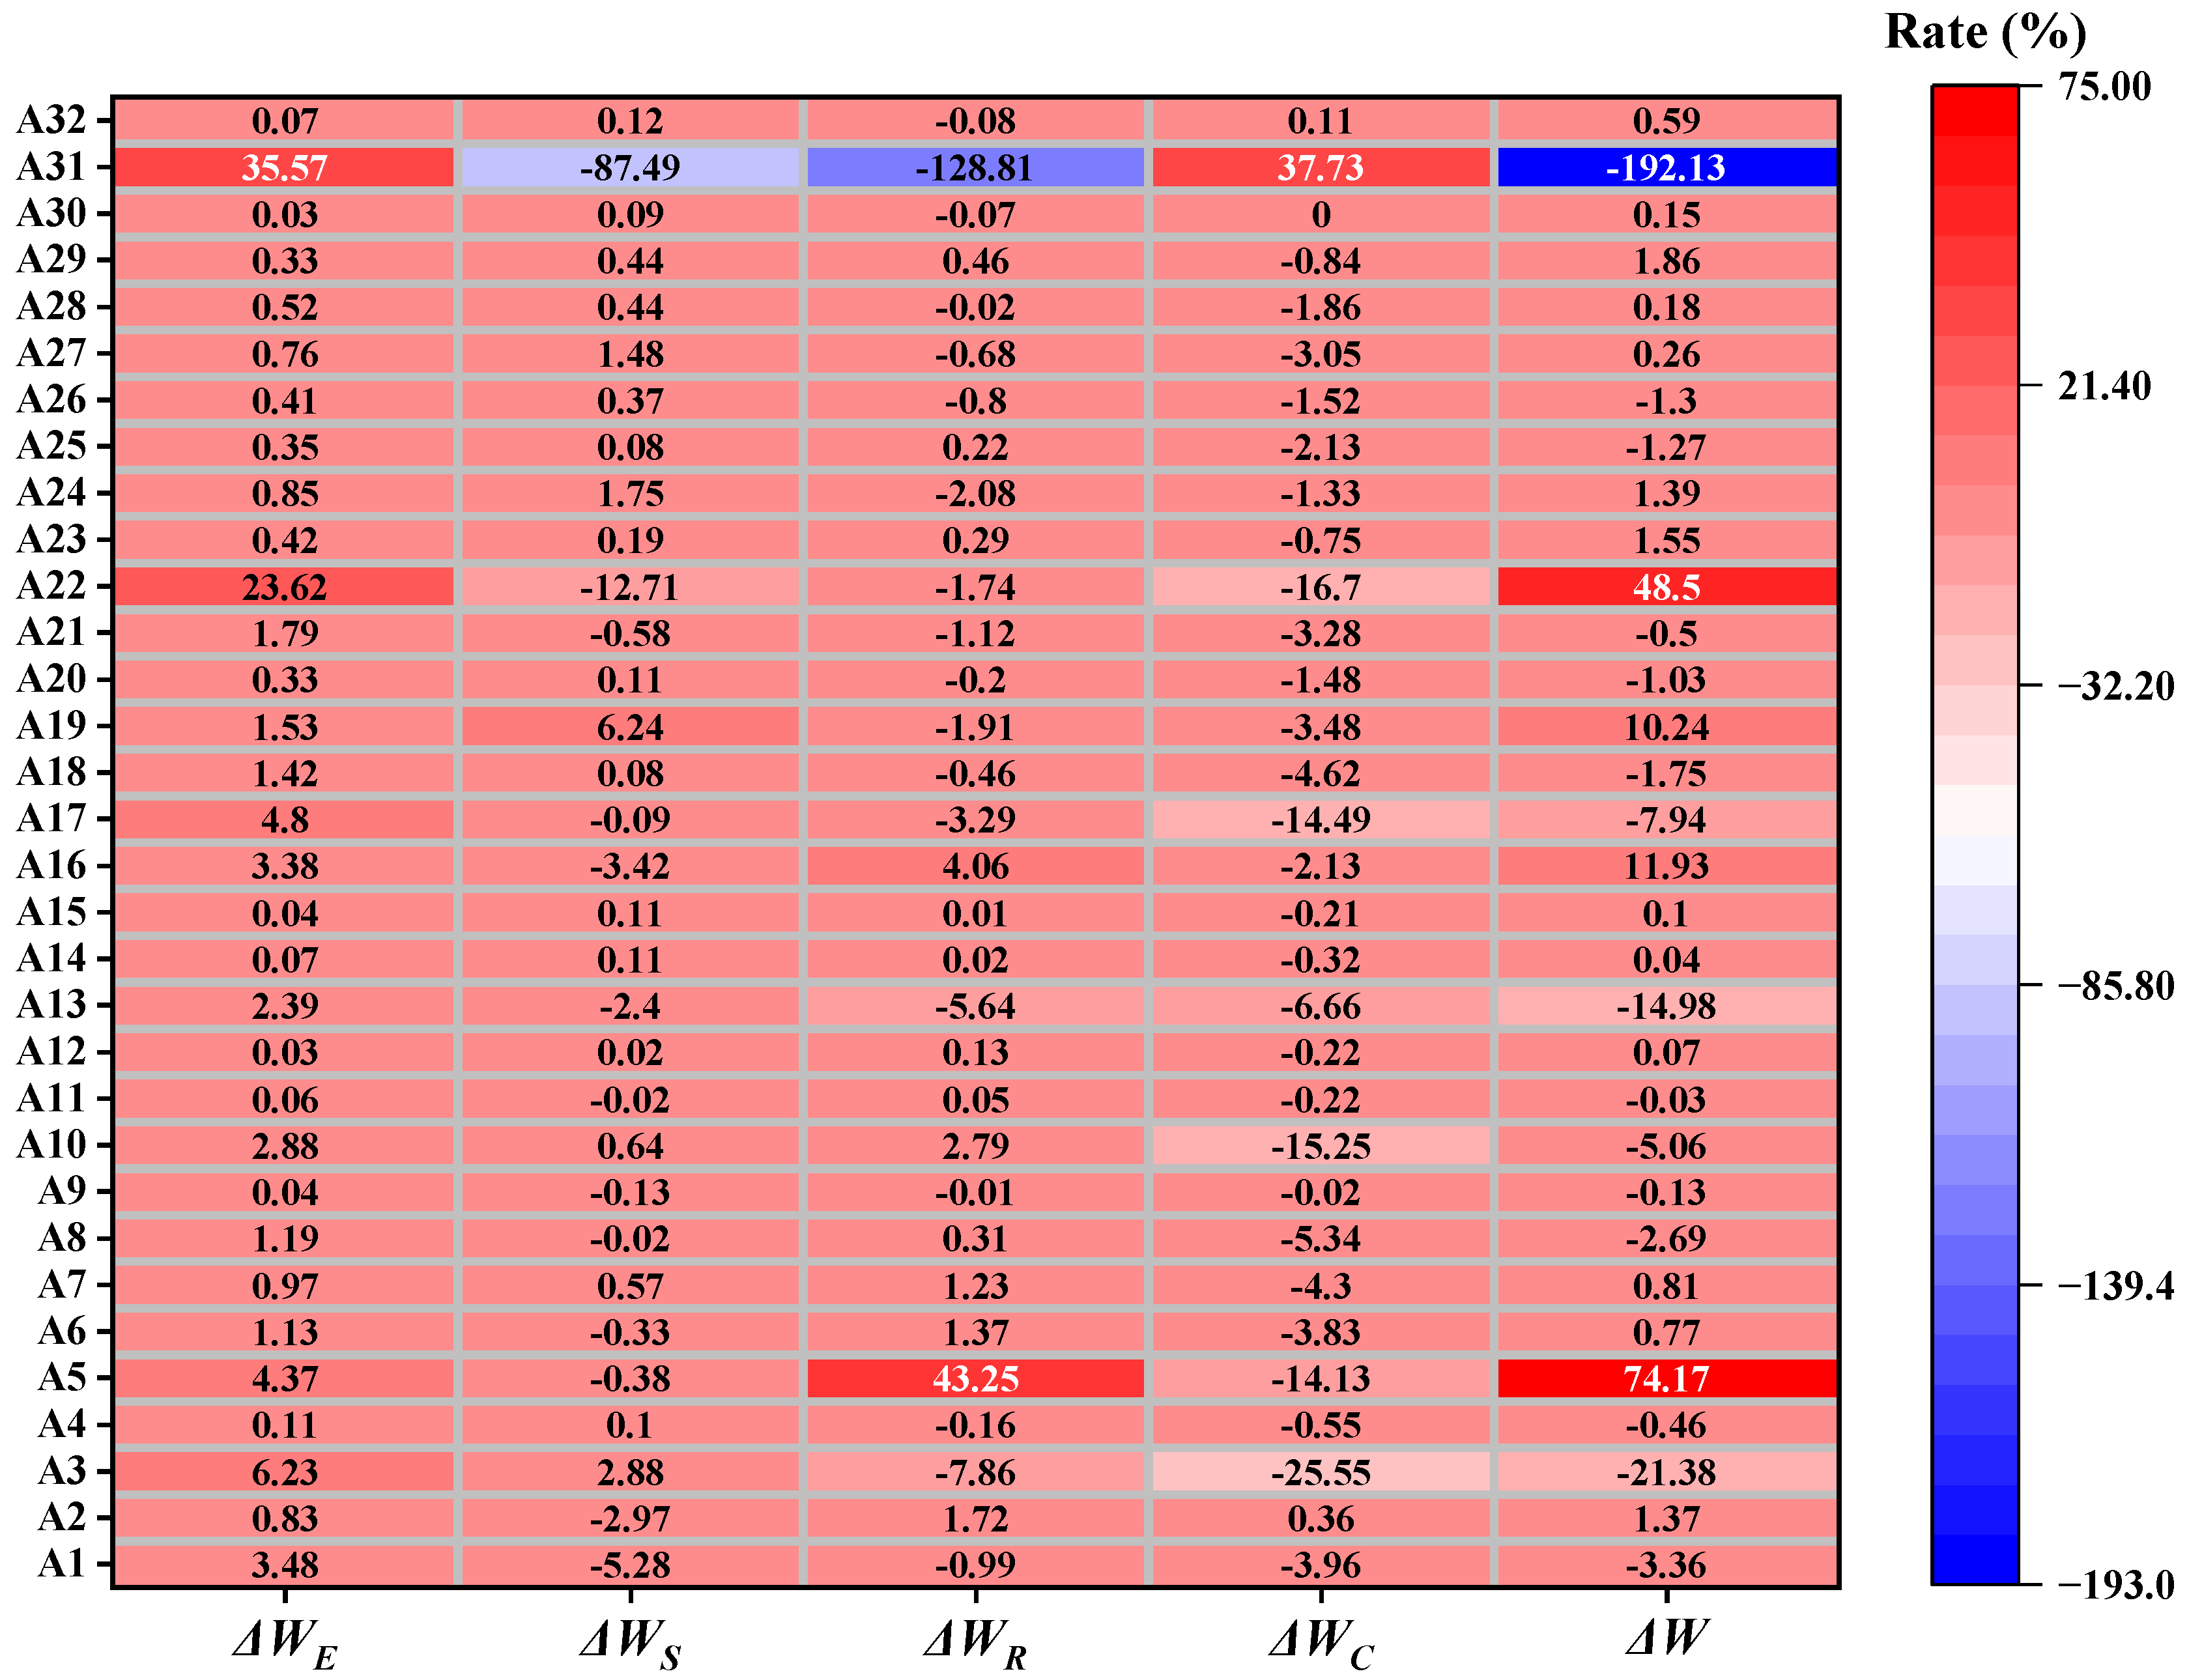
In terms of the total effect of the industrial sectors, 15 sectors in Hebei Province were negative from 2008 to 2019, of which nine were high water consumption industries. The production and supply of the electric power and heat power sector (A31) and the ferrous metal mining sector (A3) made the largest contributions to the reduction in water use, with contributions of −192.13% and −21.38%, respectively. The total effect of 17 sectors was positive, of which six were high water consumption industries. The non-metallic mining and processing sector (A5) and the ferrous metal smelting and rolling processing sector (A22) were the main industries that promoted the increase in water use, with contributions of 74.17% and 48.50%, respectively. These findings show that in recent years, the industrial structure of Hebei Province has gradually shifted to low water consumption industries. The proportion of water use in most traditional high water consumption industries has decreased, but the proportion of water use in some traditional industries still increased, such as A6 and A7. This was significantly related to the developed agriculture and the heavy industrial structure, and it also indirectly reflects the strong dependence of industrial development on agriculture in Hebei Province [
11].
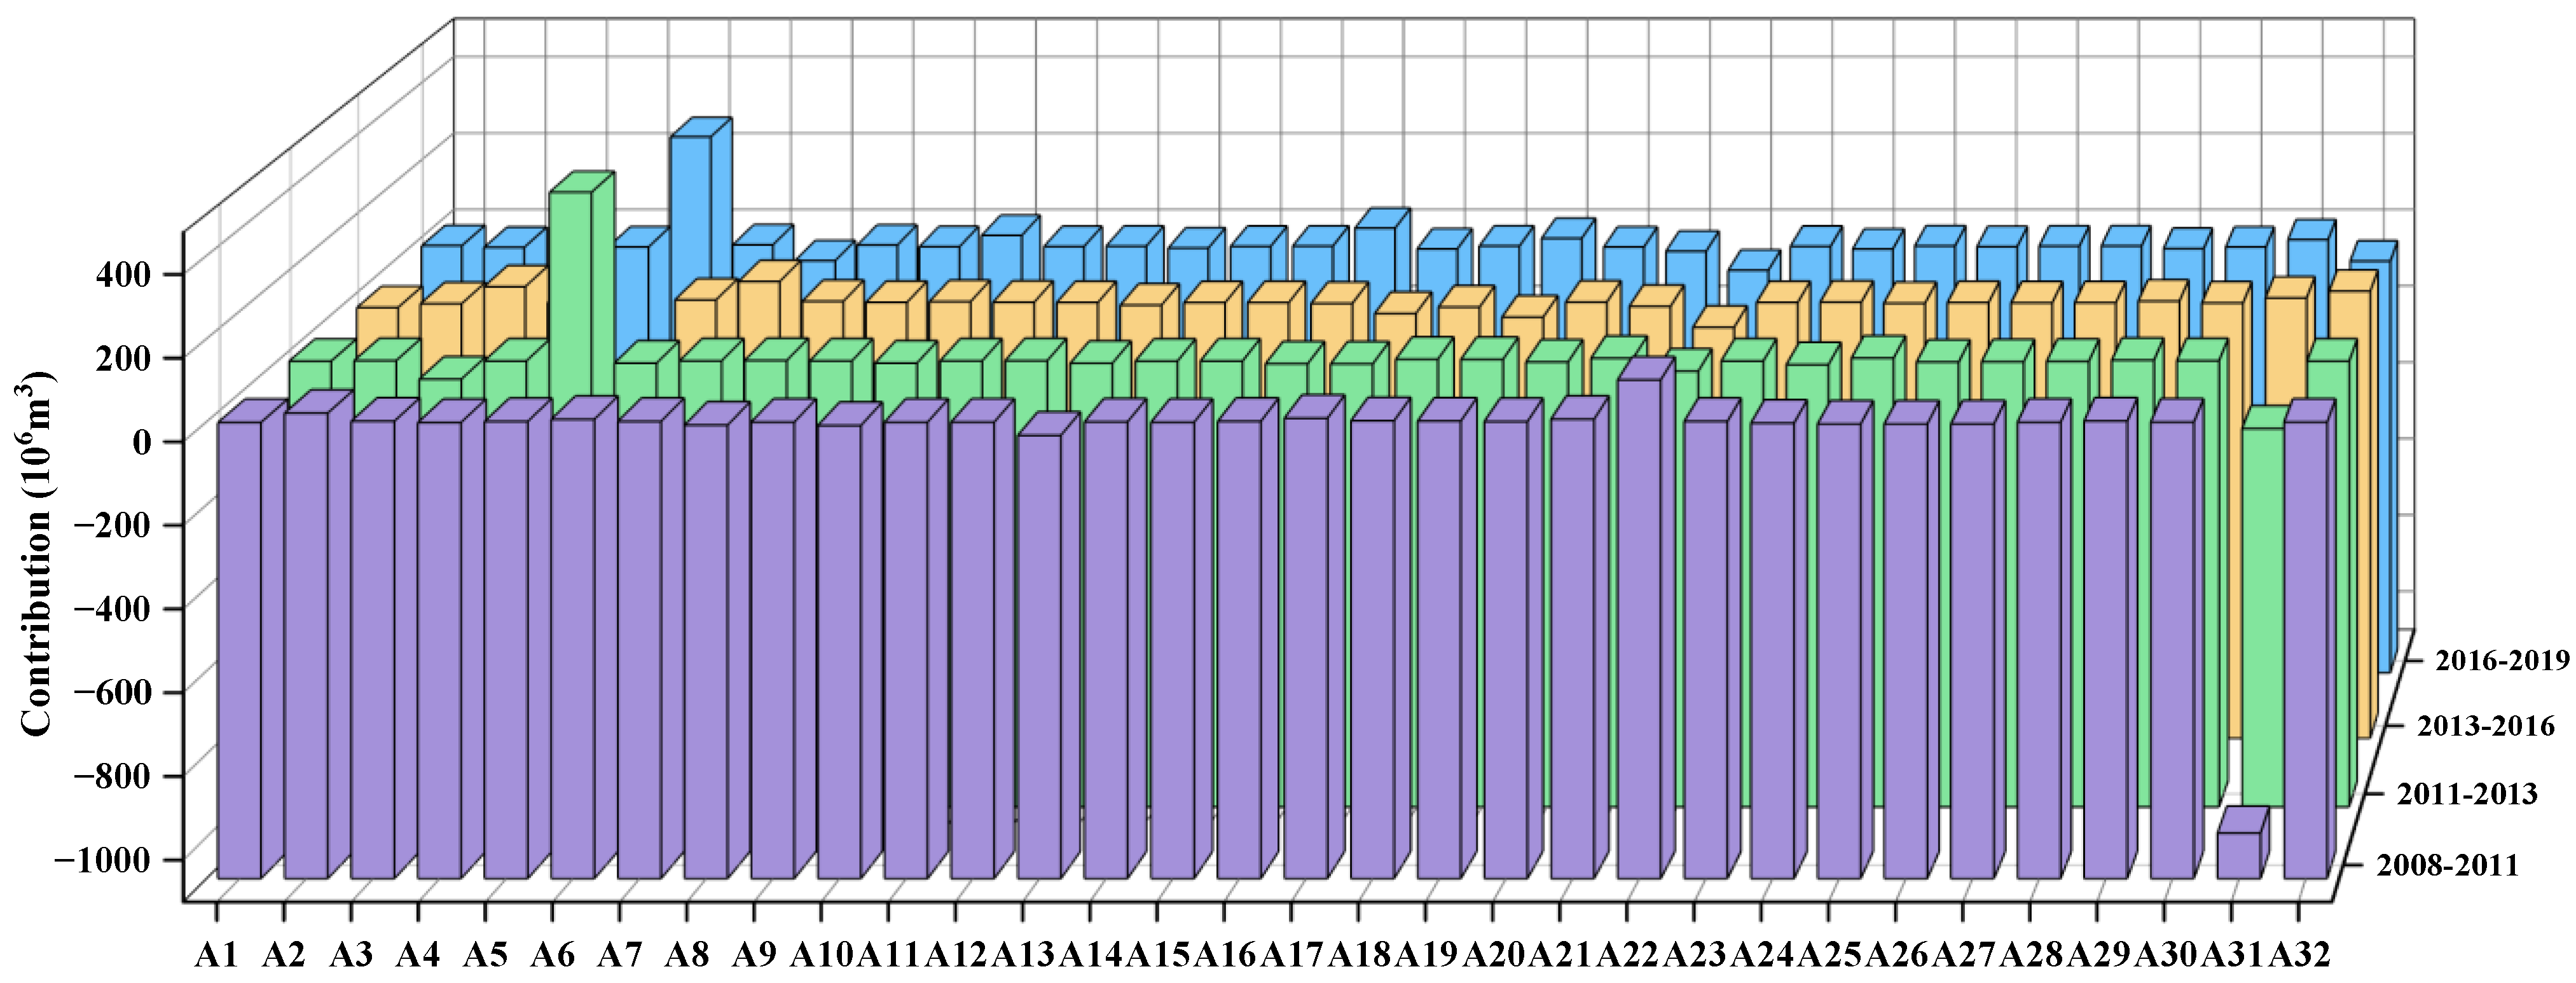
4.2.2. Economic Scale Effect
Figure 10 and
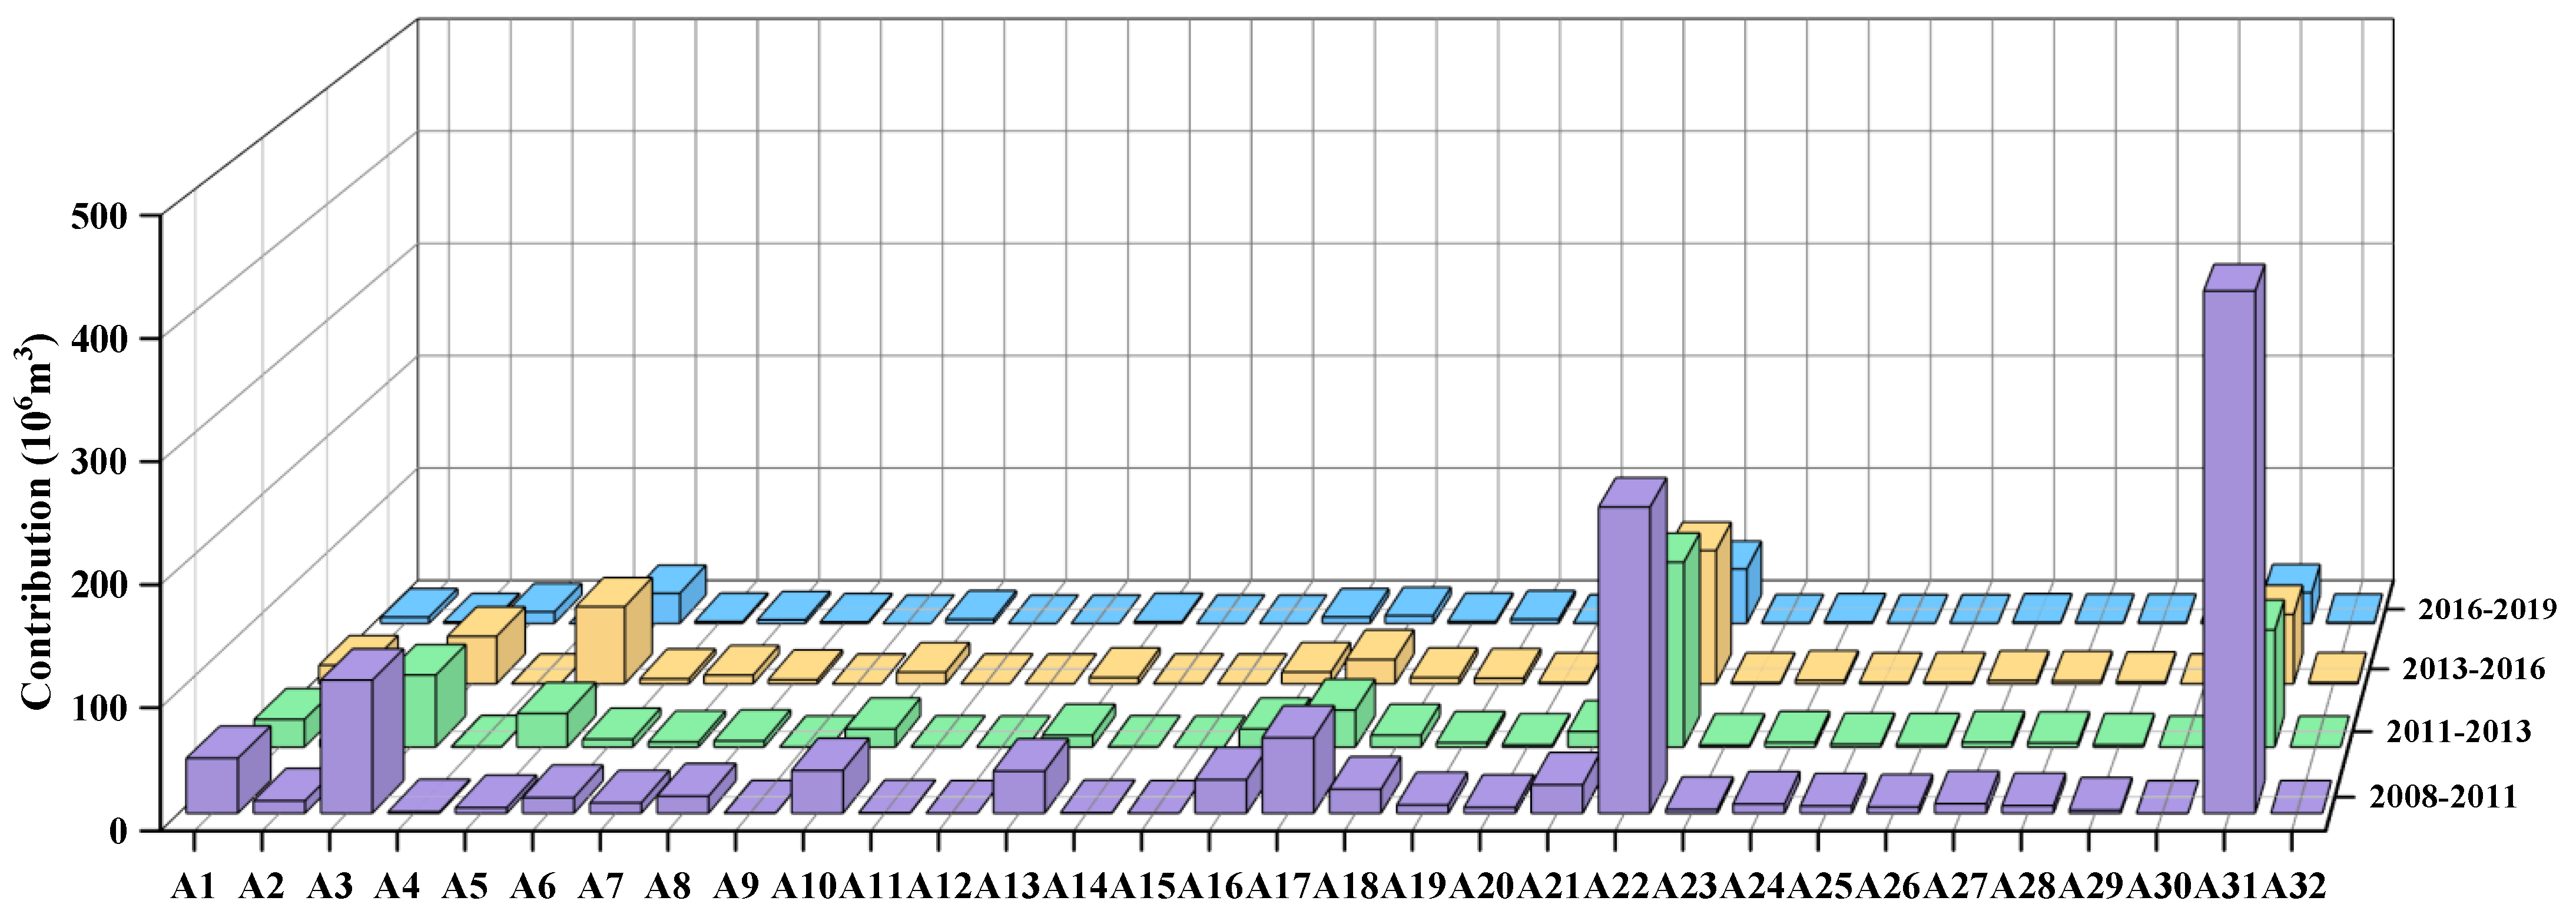
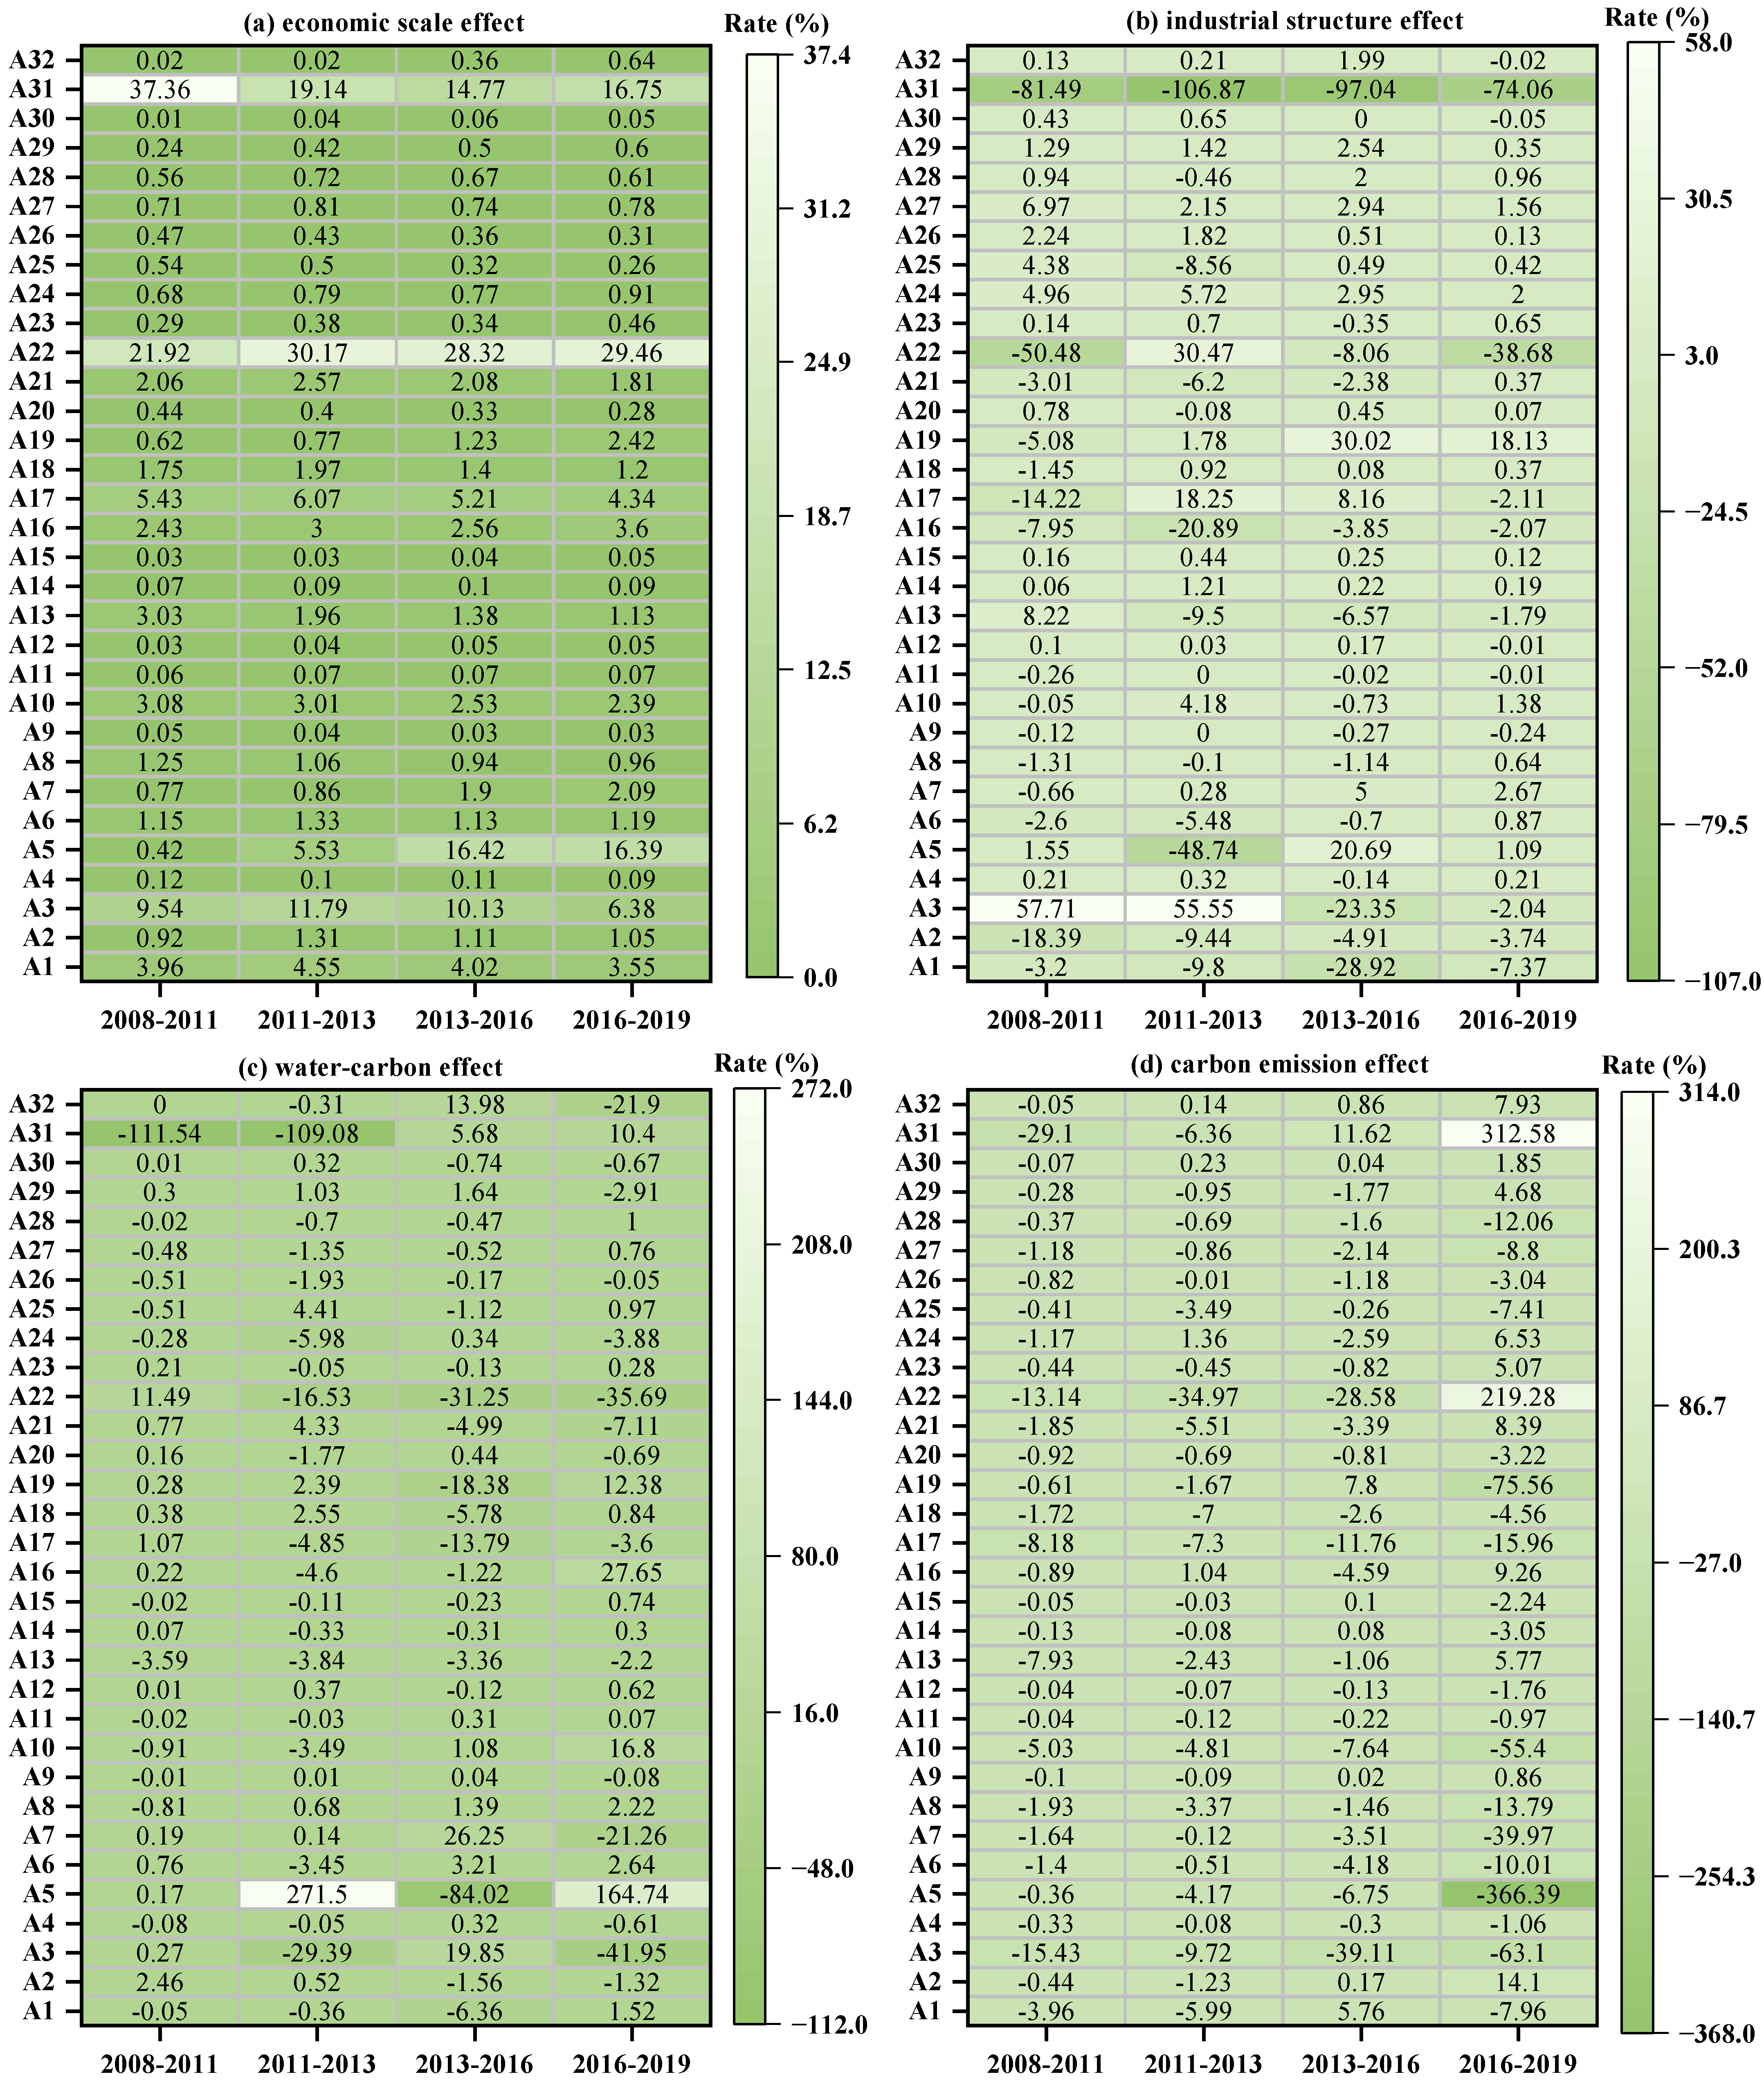
Figure 11 show that the expansion of the economic scale in the different periods in each sector promoted the growth of industrial water use. The influence of the economic scale on industrial water use weakened in the production and supply of electric power and heat power sector (A31) (down from 37.36% to 16.75%), the ferrous metal mining sector (A3) (down from 9.54% to 6.38%), and the chemical raw materials and chemical products manufacturing sector (A17) (down from 5.43% to 4.34%). These findings indicate that the water conservation policy issued by Hebei Province has restricted the scale expansion of these industries, causing the impact of their expansion on water use to gradually weaken. However, the contribution to the industrial water use increased in the non-metallic mining and processing sector (A5) (up from 0.42% to 16.39%), the chemical fiber manufacturing sector (A19) (up from 0.62% to 2.42%), and the ferrous metal smelting and rolling processing sector (A22) (up from 21.92% to 29.46%). This indicates that the economic expansion of these industries, especially the high water-consuming industries, promoted the growth of water use and was not conducive to water conservation. The contributions of the economic effects of the remaining industries only changed slightly. This indicates that there were obvious differences in the economic effects of the various industries. Limiting the scale expansion of the major water-consuming industries can effectively reduce industrial water use. In particular, the economic scale effect increased the industrial water use the most significantly in the production and supply of electric power and heat power sector (A31) and the ferrous metal smelting and rolling processing sector (A22). During the study period, the economic effects of these two sectors drove average increases in the water use of 153.09 and 141.97 million m
3, respectively. Their contributions were 27.54% and 25.54%, respectively. These two industries were also the two industries with the greatest impact on the economic effect, exhibiting high water consumption characteristics.
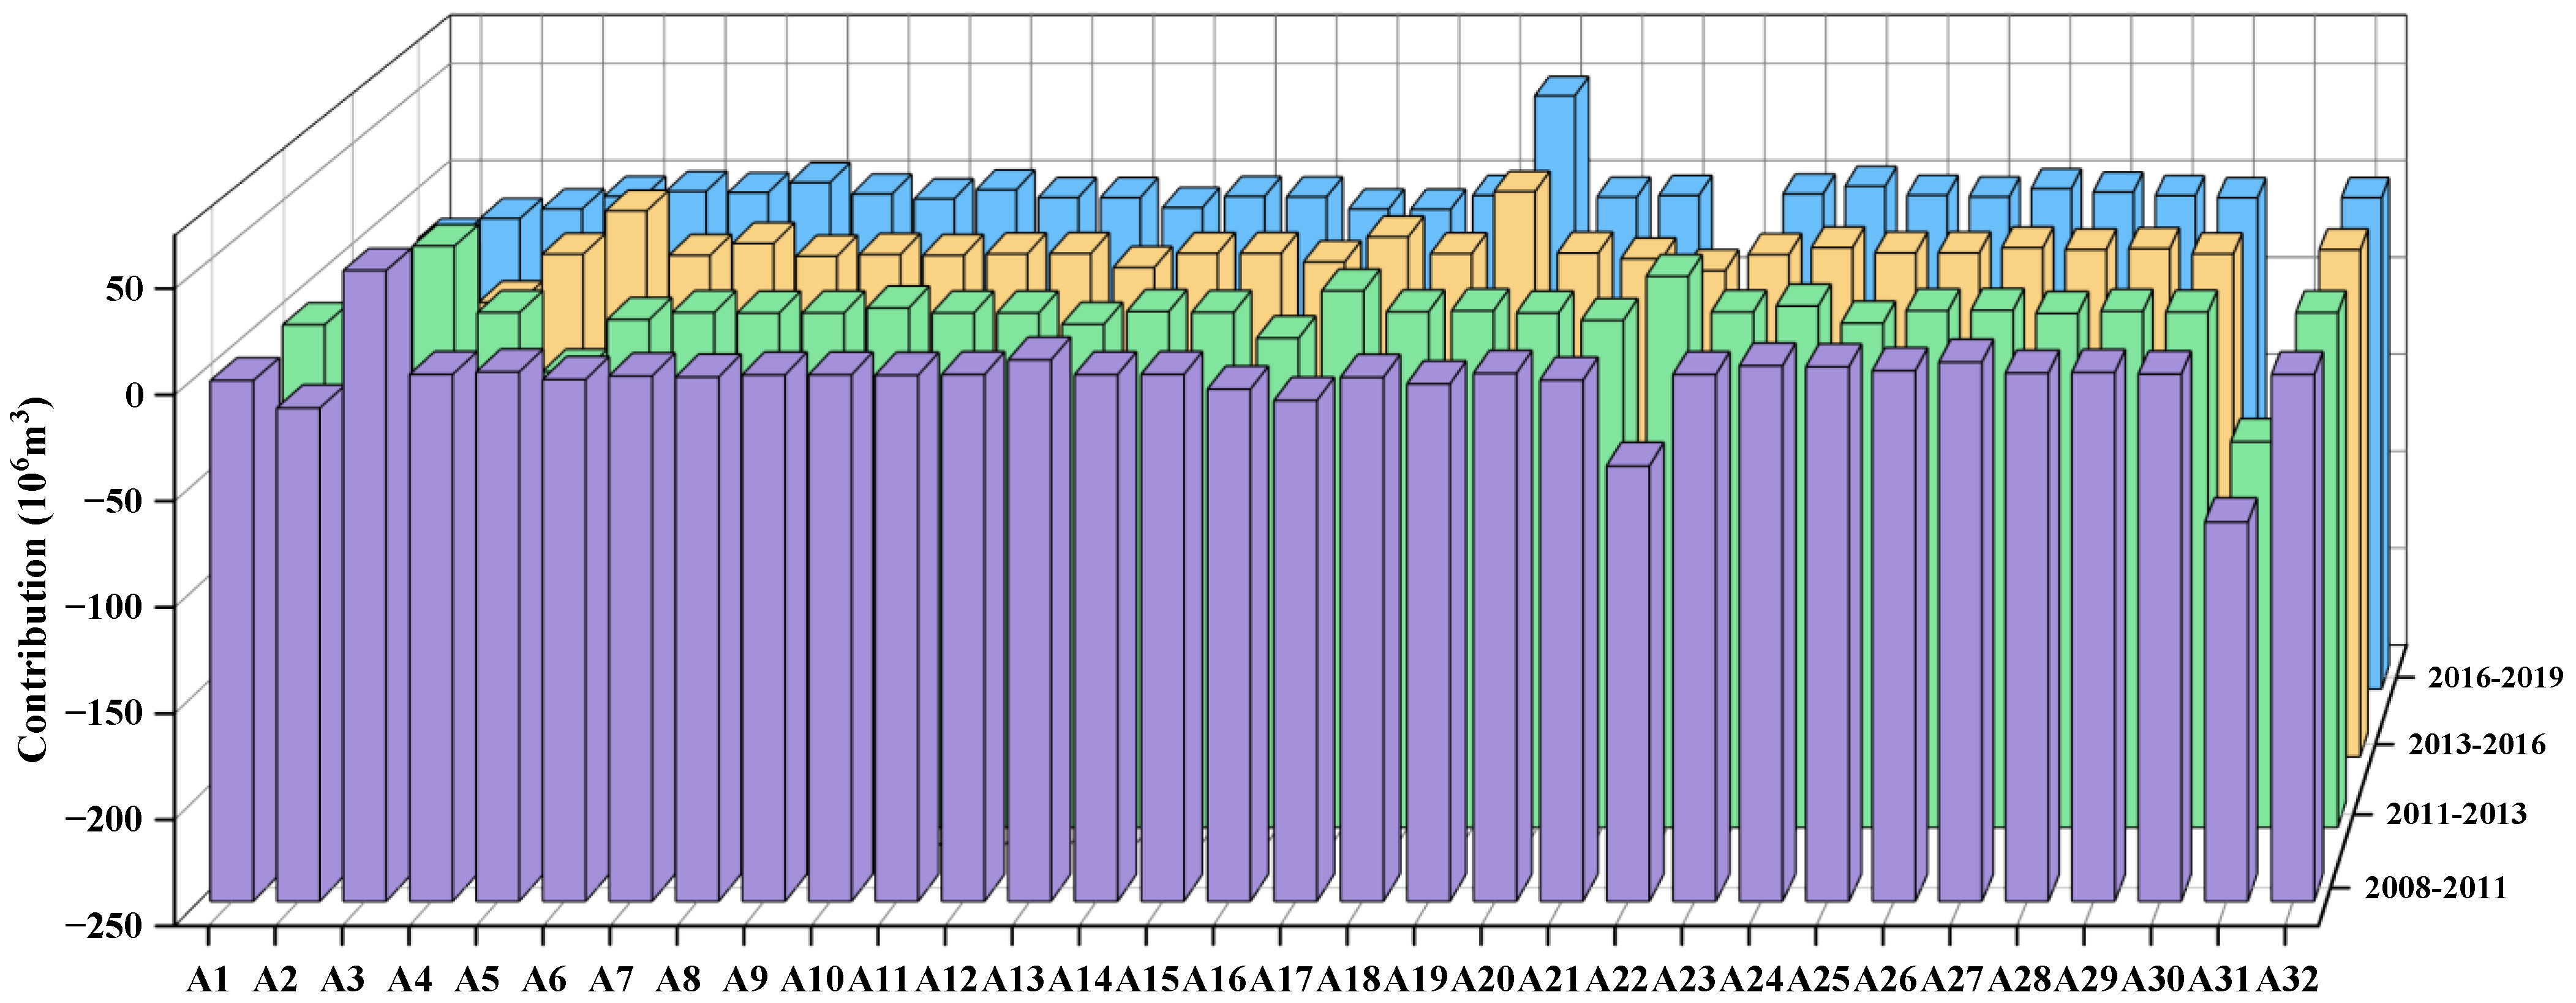
4.2.3. Industrial Structure Effect
Figure 11 and
Figure 12 show that the industrial structure effect was unstable, and proper industrial restructuring can achieve a better water-saving effect. During 2008–2011, 15 sectors were affected by the industrial restructuring, and their structural effects had a dampening effect on the growth of the industrial water use. The production and supply of electric power and heat power sector (A31) had the greatest inhibitory effect, reducing water use by 69.91 million m
3, with a contribution of −81.49%. The primary industries that contributed to the growth of the industrial water use were the ferrous metal mining sector (A3), with an increase of 49.51 million m
3 and a contribution of 57.71%. During 2011–2013, 13 sectors had negative structural effects. The production and supply of electric and heat power sector (A31) still had the largest inhibitory effect, with a contribution of −106.87%. However, two sectors (A22 and A17) changed from inhibition to promotion, and their contribution rates changing from −50.48% to 30.47% and from −14.22% to 18.25%, respectively. During 2013–2016, the structural effects acted as a damper in 16 sectors. After 2013, the production and supply of electricity power and heat power sector (A31) remained the most influential. The chemical fiber manufacturing sector (A19) gradually become the main industry in which structural factors inhibited the growth of the industrial water use.
Overall, the industrial structure effects of the different sectors on the water use growth varied over time. The high water consumption industries were the objects of long-term critical industrial adjustment. Most of the industrial structure effects during the different periods were negative, exhibiting an excellent water-saving effect. In particular, the relatively high proportion of water reduction in the production and supply of electricity and heat power sector (A31) indicates that its industrial restructuring achieved a good result. However, the industrial structure effect of these sectors (A5, A10, and A17) exhibited greater fluctuations, alternating between promoting and inhibiting the water-saving effect. In addition, according to the contribution of each sector during 2016–2019, the contribution of the industrial structure effect to the overall structural effect was low in all industries, except for A31 and A22.
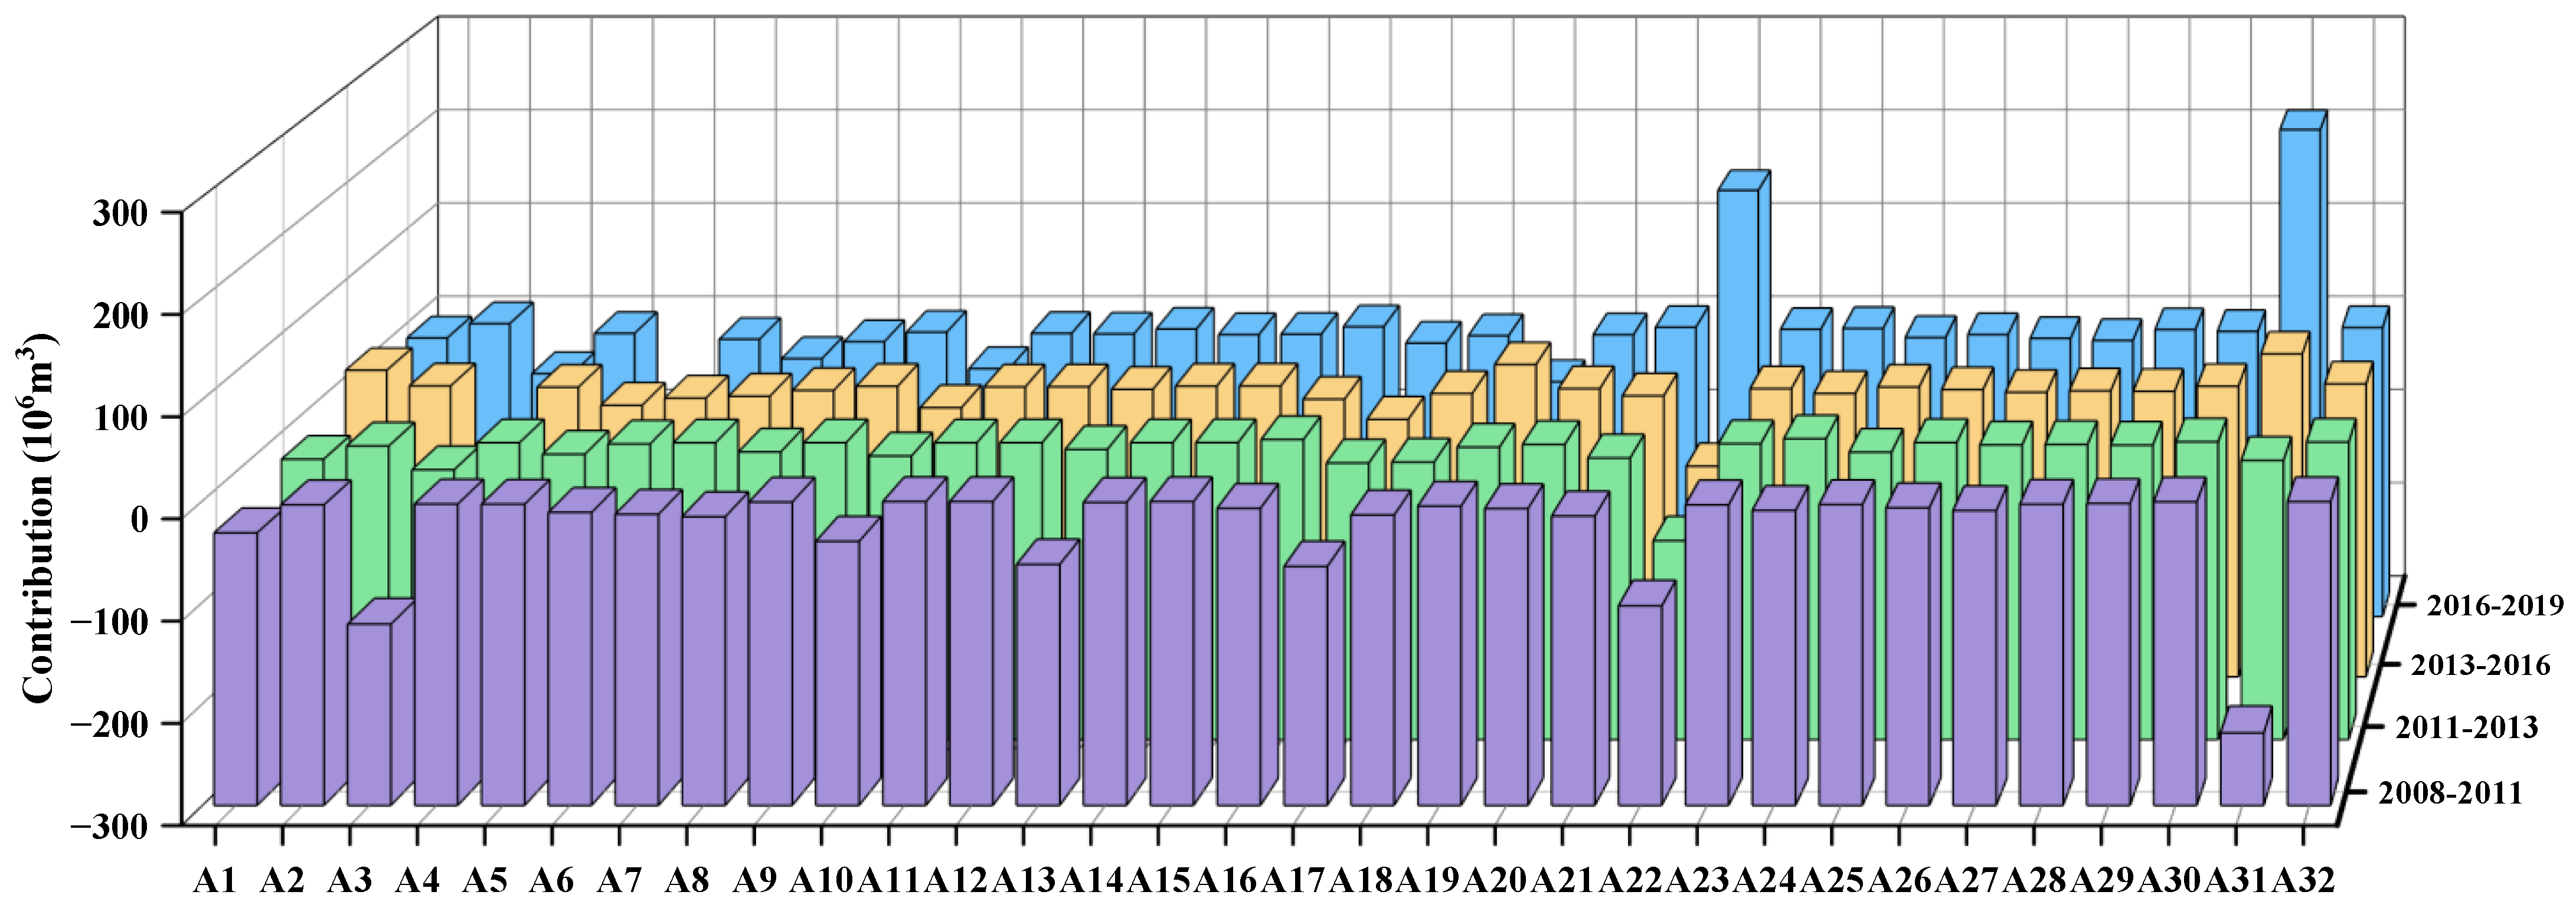
4.2.4. Water–Carbon Effect
As shown in
Figure 11 and
Figure 13, the water–carbon effect was unstable between the sectors, with more drastic changes in individual sectors. In particular, the production and supply of electricity and heat power sector (A31) exhibited the greatest change in the technology effect, changing from negative to positive values. Its contribution changed from −111.54% to 10.40%. The ferrous metal smelting and rolling processing sector (A22) exhibited the next greatest change (from 11.49% to 35.69%). The more water-intensive industries had positive water–carbon effects, mainly including the food industries (A6, A7, and A8), the textile sector (A10), and the petroleum processing, coking, and nuclear fuel processing sector (A16). The water–carbon factors of these industries increased, which contributed to the growth of the water use. The same change occurred in the non-metallic mining and processing sector (A5). The water–carbon nexus was directly related to the water use and carbon emissions. When the carbon emissions decreased and the water use increased, the water–carbon factor increased, such as in the food manufacturing industry (A7); however, when the decrease in the carbon emissions was less than the reduction in the water use, the water–carbon factor increased, such as in the wine, beverage, and refined tea manufacturing industry (A8). Therefore, carbon reduction and water conservation efforts should be coordinated, and one cannot be achieved without the other.
4.2.5. Carbon Emission Effect
As can be seen from
Figure 11 and
Figure 14, the number of industries with positive carbon emission effects gradually increased, indicating that the inhibiting effect of the carbon emission effect on water use gradually decreased. From 2008 to 2011, the water use of the production and supply of electric power and heat power sector (A31) decreased by 228.27 million m
3, with a contribution of −29.10%. This was the main industry in terms of water use reduction. However, after 2013, the carbon effect became positive. It seems to have reached the limit of its carbon emission efficiency. In addition, there were positive and negative alternations in the ferrous metal smelting and rolling processing sector (A22) and the petroleum processing, coking, and nuclear fuel processing sector (A16). The ferrous metal smelting and rolling processing sector (A22) was the first to increase and then decrease, and it seems that there is less room to improve its carbon emission efficiency. However, the petroleum processing, coking, and nuclear fuel processing sector (A16) made the largest contribution to the water use reduction (−4.59%), and there was a great deal of room for improvement in its carbon emission efficiency. In addition, the carbon emission effects of some sectors gradually increased their inhibiting effect on the growth of water use (e.g., A1, A6, A7, A8, A10, A17, A19, and A20).
4.3. Major Industries
By analyzing the driving factors of each industrial sector, the different industries were classified into four types based on the total effect of each industry [
35]: strongly promoting industries, weakly promoting industries, strongly inhibiting industries, and weakly inhibiting industries. The strongly promoting and inhibiting industries and their main driving factors of industrial water use change in Hebei Province are shown in
Table 2. The total of 1254.72 million m
3 of water use reduction was driven by the strongly inhibiting industries, which was almost equal to the 1265.47 million m
3 reduction by all the inhibiting industries. The increase in water use driven by the strongly promoting sectors was 760.31 million m
3, which was almost equal to the total increase. This shows that the strongly promoting and strongly inhibiting industries were the primary industries that affected the change in the industrial water use and are the industries that need to be focused on in industrial water conservation construction and management in Hebei Province.
In terms of the main influencing factors, the carbon emission effect was the main inhibiting factor, while the water–carbon effect and the industrial structure effect were the second most important. The strongly inhibiting and strongly promoting industries were mainly high carbon and high water consumption industries, and they were the main industries leading to the change in industrial water consumption in recent years. This indicates that industries with high carbon emissions require large amounts of water consumption. From the previous sectoral analysis, it is possible to consider reducing carbon emissions and improving carbon efficiency in terms of structural adjustment, thus improving the water efficiency and further saving industrial water. For example, the chemical raw materials and chemical products manufacturing sector (A17) should pay attention to the inhibiting effect of the structural effects, and it can optimize the industrial structure with water and carbon saving as constraints. For industries with dominant carbon emission efficiency effects, emission reduction and water conservation management should be considered. The key driver of the strongly promoting industries was the economic effect. In this regard, the scale of its development should be gradually restricted, and the proportion of these industries should be adjusted to slow down the increase in the pressure of industrial water use. By analyzing the drivers of the strongly promoting industries, key factors can be effectively identified and corresponding measures can be formulated. For example, the petroleum processing, coking, and nuclear fuel processing sector (A16) should focus on improving water use efficiency, while the chemical fiber manufacturing industry (A19) should pay attention to structural adjustment.
5. Discussion
In this paper, the industrial water efficiency was decomposed into the carbon emission efficiency and water–carbon relationship factor, and the sum of these two factors demonstrated that improving the carbon emission efficiency and improving the water–carbon relationship can improve the industrial water use efficiency. Therefore, controlling carbon emissions can significantly curb the growth of industrial water use. This result is supported by the findings of Su et al. [
36]. However, Ji et al. [
37] found that the economic output benefits of water use can curb the growth of carbon emissions. This can be compared with the results of this study to show that industrial water use and carbon emissions are mutually influential. Currently, carbon emissions are being reduced through technological advances to improve energy efficiency. There is also a reduction of carbon emissions through industrial restructuring. Su et al. [
36] suggested optimizing the industrial structure by limiting high carbon and high water consumption industries. However, the goal of industrial restructuring is not only water saving [
38], and carbon reduction is also one of its goals. Some researchers have concluded that the water use efficiency factor [
14] and the industrial structure factor [
30] are the factors that contribute to the inhibition of the increase in industrial water use, while the economic scale factor [
19] is the promoting factor, which is consistent with the conclusions of this study.
The decomposition results of this study show that the contribution of Hebei’s industrial structure effect to curbing the industrial water use is still relatively small, and the industrial structure effect is not fully effective. Li et al. [
8] found that the industrial restructuring in Hebei Province has a significant water-saving potential. Shang et al. [
38] found that water conservation-oriented industrial restructuring in Tianjin should focus on sectors A22 and A21. However, in this study, it was found that sectors A16, A17, and A19 should also be focused on. In addition, by decomposing the results for the industries, it was found that the water use of the sectors is heterogeneous. Various drivers played different roles in the different sectors, resulting in great heterogeneity in the water use of the different sectors. For example, compared with sector A31, the structural effect of sector A5 was less inhibited and the water–carbon relationship was not coordinated, resulting in increased water use in sector A5. The different industries should take targeted measures to adjust their water use.
Compared with existing methods, the LMDI method can quantify the degree to which the carbon emissions, industrial economic scale, and industrial structure affect industrial water use. This method also provides a new tool for analyzing water–carbon relationships. If sufficient data are available, this method is also applicable to the analysis of water–carbon or water–energy relationships in other regions. Based on the additivity of regional water use, the method can also be applied to multiple regions simultaneously to analyze the impact of water use in different subregions on the entire region. In this study, the impact of industrial carbon emissions on industrial water use was quantified, but no deeper link was found between them, which will be the focus of further research.
6. Conclusions
Based on the analysis of the current situation of the water resources and industrial structure in Hebei Province, in this study, the factors of the industrial water use during 2008–2019 were decomposed using the LMDI model and the contributions of the driving factors were quantitatively assessed. The following conclusions were drawn. Overall, the industrial water consumption in Hebei Province decreased during 2008–2019, but the rate of decrease gradually slowed down. The economic effect was the contributing factor, with a cumulative contribution of 446.23% during 2008–2019. However, the carbon emission effect (−286.11%), the water–carbon effect (−153.19%), and the industrial structure effect (−106.93%) were the main factors responsible for the decrease in the industrial water use.
Based on the results of the sectoral decomposition, the expansion of the economic scales of the different industries promoted the growth of industrial water use to different degrees. For example, the water use of sectors A31 and A30 increased by 774.93 and 0.55 million m3, respectively. In addition, although industrial restructuring had a great potential to reduce water use, the industrial structure effect was uncertain and unstable, and the industrial structure effect was highly variable in some industries. The deteriorating water–carbon relationship promoted the growth of industrial water use, and carbon reduction and water conservation should be coordinated and synchronized. The industries with high carbon emissions also used more water. The improvement of the carbon emission efficiency and water–carbon relationship can increase industrial consumption and thus reduce the industrial water demand. The results of the sectoral decomposition show that the high water use industries had the greatest impact on the industrial water use (−171.14%). In addition, the carbon emissions effect of each industry made a significant contribution to the industrial water demand. The strongly promoting sectors (A5, A22, A16, A19, A23, A24, A2, A7, and A6) were the ten most relevant contributing sectors to the increase in industrial water use, with a combined contribution of 760.31 million m3 during 2008–2019.
Based on the above decomposition results, the changes in the water use and the driving forces in the different sectors were not consistent. Based on this, we propose several policy recommendations. First, attention should be paid to the research and development of water-saving technologies in low water efficiency sectors, and the carbon emission efficiency should be improved to reduce water consumption. These sectors (including A2, A5, A16, and A32) have a low water–carbon relationship, as well as a low carbon emission efficiency, and are also high water consumption sectors, so their water consumption should be reduced by accelerating technological progress oriented toward water and carbon saving, and more resources should be invested in research and development to improve production technology. Second, the structure of the industrial water use should be optimized and an industrial structure that is compatible with the carrying capacity of the water resources should be achieved. These sectors (e.g., A22, A2, A19, and A16) should adjust their industrial structure, accelerate the upgrading of high water-consuming industries, and reduce the proportion of high water consumption industries, i.e., reducing and eliminating high water-consuming industries with an excess capacity, such as the iron and steel and petrochemical industries. Combined with the current strategic opportunity for synergistic development in the Beijing–Tianjin–Hebei region, Hebei Province should introduce and develop low water consumption and high value-added industries. Finally, compared with reducing the economic scale of these sectors (e.g., A3, A22, and A31), it is more important to improve their water efficiency via measures such as increasing low-carbon technology innovation and investment in the renovation of water-saving equipment.


 ,
, 


