Abstract
Serious soil and water loss affects the economy and the living quality of the population in faulted basins. Since 2002, China has carried out large-scale ecological restoration projects in karst areas. However, the karst faulted basins have experienced complex climatic changes, which makes it difficult to assess the ecological restoration effects quantitatively. Using the improved Budyko model, basin factor (n) and sediment content factor (C) were divided into climate influence and ecological restoration influence by second-order approximation, and the change ratio of climate influence and ecological restoration on sediment yield and loss was quantitatively calculated in the representative basin of the Nandong Underground River System (NURS). This was carried out in order to effectively distinguish the effects of climate change and ecological restoration on runoff and sediment change in the NURS. Furthermore, this study sought to understand the mechanism of runoff and sediment change and to evaluate the ecological restoration in the faulted basin to provide a scientific basis for the next stage of soil and water conservation policy formulation. The results showed that: (1) Using Pettitt to test the abrupt change of water and sediment in the NURS from 1987 to 2018, we found that 2002 was the abrupt change year of water and sediment in the basin. Before and after the mutation, the runoff and sediment yield decreased significantly, with the change rates of −15.5% and −51.8%, respectively. The decrease in precipitation and the increase in E0 were not significant, which were −4.5% and 1.4% respectively. (2) By calculating the correlation coefficient and the double logarithm function, it was found that the maximum temperature is the main climatic factor affecting the underlying surface factor n, and precipitation is the main climatic factor affecting the sediment concentration c. (3) Climate change reduced runoff by 77.6%. Ecological restoration has reduced sediment by 51.3 percent. The sensitivity of runoff to maximum temperature was 3.61. The sensitivity of grain yield to precipitation and NDVI was 5.37 and 3.26, respectively. The results show that climate is the main factor of runoff reduction, and ecological restoration is the main factor of sediment reduction. Ecological restoration has greatly reduced sediment production, and ecological engineering has made remarkable progress. However, the reduction of runoff caused by climate change should be paid more attention. The results of these studies will help to better formulate land use management policies for soil and water conservation.
1. Introduction
Since the 1980s, governments around the world have taken various ecological restoration measures. The greening degree of vegetation has been increasing [1], mainly distributed in China, India, the European Union and other regions [2]. Large-scale afforestation has been shown to reduce river flows in the semi-arid Loess Plateau in northern China [3] and partly contributed to the recent drought in southwest China [4]. However, the regional dynamics of greening change are not consistent. Deforestation in Southeast Asia [5] and the Amazon [6] intensifies runoff and soil erosion. In addition, the steady decline of glacier area due to climate change since the beginning of the 21st century will significantly increase river flow [7]. According to relevant studies, climate change has caused significant changes in runoff and sediment in Europe [8], Asia [9], America [10] and other places. Therefore, the change in the global hydrological system caused by climate and vegetation cover has gradually become a research hotspot up to the present [11].
The karst area in southwest China is the largest continuous karst zone in the world, and one of the regions facing the most serious soil erosion in China [12]. Since 2002, China has carried out ecological projects in karst areas of southwest China. A large number of studies have found that the ecological recovery in karst areas with different landforms has been remarkable, the degree of stony desertification has decreased, and the per capita living standard has increased [13]. The faulted basin area, which serves as an ecological barrier in the upper reaches of the Pearl River, has experienced a significant decline in runoff and sediment yield in recent years [14]. However, the region has experienced dramatic changes in climate since the beginning of the 21st century, with precipitation decreasing and temperatures increasing, and notably the worst drought once in a hundred years in 2009 [4]. Therefore, it is difficult to determine whether changes in runoff and sediment are due to ecological restoration or complex climatic changes.
Climate and underlying surfaces are considered to be the two major driving factors that lead to changes in the hydrological cycle [15]. Precipitation and precipitation intensity directly affect the production of runoff and sediment [16], while temperature directly changes the evapotranspiration of the surface and influences the hydrological cycle [17]. Ecological restoration projects increase vegetation cover, and the implementation of vegetation restoration can change soil hydrological function [18] to affect runoff and sediment yield [19]. In addition, precipitation and temperature can indirectly affect runoff through their effects on vegetation [20]. Therefore, the need to clearly distinguish the effects of climate and ecological engineering on runoff and sediment yield is an urgent and complex issue.
At present, the main methods are the empirical pairing method, hydrologic statistics method, hydrologic model method, neural network and other methods for studying runoff and sediment in river basins [21]. Basin pairing requires a large amount of measured data and finding consistent meteorological conditions, which is difficult to achieve for medium and large basins [22]. Although the neural network method can effectively simulate the relationship between runoff and sediment and corresponding factors, it is difficult to define the complex mechanism and cause of the influence [23]. Traditional hydrological modeling methods require large amounts of data and various parameters, which will increase the uncertainty of the system [21]. The relationship between water and heat balance based on the theoretical framework of the Budyko hypothesis has clear physical significance and easy data access, which has been widely used to attribute the change of river flow to the influence of climate and basin changes [24,25]. In current Budyko framework studies, the underlying surface factor n is usually regarded as the influence of human and other non-climatic factors on runoff and sediment yield. However, attributing changes in the underlying surface factor (n) solely to human activities may be unreasonable, as climatic factors may also play an important role in influencing this parameter [26]. Therefore, the reasons for the change in the underlying surface factor n include not only human factors, but also hydroclimatic variables [27]. Jiang and Ning found that the catchment characteristic parameters were very sensitive to the combined effects of climate and artificial factors [28,29]. Saha et al. also proved that the assumption that the underlying surface factor n is independent of climate variable is not valid by analytical derivation of the functional form of the Budyko equation [30]. How to effectively separate the climate and ecological restoration of the underlying surface factor n is a difficult problem in current research [31].
In order to effectively distinguish the impact of climate change and ecological restoration on water and sediment change, the Budyko framework was improved in this paper, and the underlying surface factor (n) changes were attributed to the influence of climate factors and ecological factors, and the elasticity of the two factors on underlying surface factor (n) was calculated respectively. Sediment yield is divided into runoff and the elasticity of sediment concentration (C), which in turn is affected by land cover and climate. The elasticity of climate and ecological factors on the underlying surface factor (n) and sediment concentration (C) was found by using the double logarithm function, so as to quantitatively calculate the influence of ecological restoration and climate change on runoff and sediment in the faulted basin [28].
The Nandong Underground River System (NURS) has become a typical basin of the studied faulted basin due to its remarkable basin–mountain difference and complete topographic conditions. As the only outlet of the whole basin system, the south cave entrance has complete water and sediment data. In addition, the NURS is also the economic center of southern Yunnan and the seat of Honghe Prefecture. It is urgent to thoroughly reveal the evolutionary trend of climate and hydrological factors and quantitatively distinguish the contribution of climate and ecological restoration to water and sediment [32]. Li et al. evaluated the changes of soil and water loss and sediment yield at different slope positions in the closed basin of the faulted basin, and found that the main driving factors of Cs137 concentration distribution and erosion rate were microtopographic changes, strong slope, and intensive tillage [33]. Wang et al. found that human activities had a gradual and profound influence on the interannual characteristics of runoff in a faulted basin [34]. Li et al. found that the decrease in rainfall not only reduced the intensity of surface soil erosion, but also reduced the flow and velocity of underground rivers, and reduced the yield capacity of suspended solids [35]. However, before the study, the studies on water and sediment lack quantitative attribution analysis, and do not satisfactorily explain whether the reduction of water and sediment is due to climate change or ecological restoration, so it is impossible to evaluate the contribution of ecological restoration to water and sediment [31]. Therefore, this paper selected the Nandong Underground River System as the research object, adopted the improved Budyko framework method, quantified the contribution of climate and ecological restoration to runoff and sediment, and reasonably evaluated the effect brought by ecological restoration. It provides a theoretical basis for decision makers to take corresponding measures.
2. Materials and Methods
2.1. Study Region
The NURS is located in south-central Yunnan Province (Figure 1). The longitude is 23°23′–23°50′ N, the latitude is 103°25′–103°60′, and the altitude is 1067–2730 m [14]. The whole river basin spans the three cities of Mengzi, Kaiyuan and Gejiu within the scope of Honghe Prefecture, and the yieldation is convenient. It is the traffic artery between Yunnan and Southeast Asian countries such as Vietnam. The basin belongs to the South Asian tropical monsoon climate. The average annual temperature is 16.1 °C, the extreme maximum temperature is 38.2 °C, the extreme minimum temperature is −4.9 °C, the average annual rainfall is 834.2 mm, and the average annual evaporation is 2114 mm. The precipitation from June to October accounts for about 70% of the whole year. NURS is a typical faulted basin with basin–mountain structure. The Mengzi, Caoba and Dazhuang basins are distributed in the middle of the basin like beads, and the mountains are distributed around the basin, with a significant difference between the basins and mountains. The elevation of the basin is about 1100–1300 m, and the elevation of the mountains is 1800–2200 m. The highest point is Dahei mountain in the northwest at 2700 m above sea level. In the karst peak cluster area of the plateau, the pre-Cenozoic strata are mainly composed of carbonate rocks. The area of pure thick limestone and dolomite of the Middle Triassic Gejiu Formation is about 1000 square kilometers. The subsidence basin is mainly composed of Cenozoic loose rocks. Located at the boundary of the Kang–Yunnan rhombus plate, the basin is composed of a series of inclined slip active fault bundles, which are dominated by normal faults. Coupled with complex tectonic movements of multiple stages, favorable conditions for karst development are formed. The karst development in the area is strong, the surface karst zone is thick, and the vertical development depth can reach hundreds of meters underground. The surface karst forms in the surface karst zone are mostly small karst forms such as stone bud, dissolved groove, dissolved trace and dissolved groove. The development of underground karst is generally relatively uniform, mainly composed of micro-karst forms with small size and large number, crisscrossed and densely developed, which are mainly composed of mesh-like solution gaps and dense dissolution pores, etc. The main forms are solution gaps, solution pores and small karst caves, some of which are filled with muddy matter to varying degrees. The mountainous area is the main water collection region, where water enters water caves through small depressions, into the underground pipeline, mainly through vertical seepage, and then into the underground main channel; the main channel from the mountain to the bottom of the basin more than 100 m. Soil and water loss is serious and the rate of bedrock exposure is high in the underground river system.
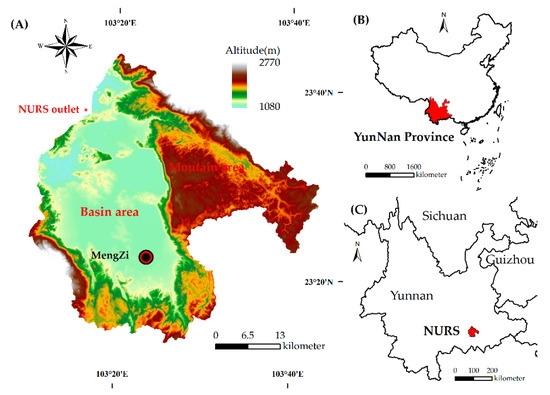
Figure 1.
NURS is located in China: (A) Map of NURS, (B) Yunnan is located in China, and (C) NUSR is located in Yunnan.
2.2. Data
Meteorological data was obtained from the China Meteorological Service Center (http://www.data.cma.cn/ accessed on 5 July 2020). The hydrological data came from the Bureau of Hydrology and Water Resources of Honghe Prefecture, Yunnan Province (Sampling method: Runoff was obtained by section method at the hydrological station of NURS outlet, water samples were collected by 500 mL standard water bottle, and sand transport was calculated by drying and filtration). NDVI was obtained from Landsat data downloaded from Geospatial Data Cloud after calibration and registration 30 m (http://www.gscloud.cn/ accessed on 6 June 2021), as shown in Table 1.

Table 1.
Data and Resolution.
2.3. Method
2.3.1. Detection of Abrupt Point
Pettitt test is a nonparametric trend test for determining change points, which can be used to test the abrupt points of the time series of meteorological or hydrological elements, so as to divide the research period into multiple stages. For a given meteorological or time series , it can be divided into two groups of series and , and Mann–Whitney’s statistics are calculated using Equation (1):
The sgn() function is as follows in Equation (2):
If the absolute value of Sj,n reaches the maximum jt0 in a certain year, then the year is the abrupt change year of meteorological or hydrological sequence, as in Equation (3):
Significance level p value of Pettitt test can be determined by the following Equation (4):
2.3.2. Budyko Framework
The sensitivity of runoff to climate change and ecological restoration was calculated by Choudhury–Yang Equation (5) based on the Budyko framework. Compared with mathematical statistical methods commonly used in hydrological analysis, the Choudhury–Yang equation has clear physical meaning, simple calculation method, and takes into account the effect of watershed spatial heterogeneity, so it has been widely used in runoff sensitivity analysis [36]; the formula is as follows:
In the above equation, R is runoff, P is precipitation, E0 is potential evapotranspiration, and n is underlying surface factor, which is generally affected by ground cover factors, watershed area, and climate.
The underlying surface factor (n) is generally affected by ground cover factors, watershed area, and climate. When the Budyko model is applied on a long-term scale (≥10 years), the changes in watershed water storage can be ignored [37]. In this paper, the study period was from 1987 to 2018. In order to make the underlying surface factor (n) more accurate, an 11-year moving window period was established for a meteorological and hydrological series to establish the relationship between climate change and ecological restoration on (n) [28].
Potential evaporation E0 adopts the Penman formula recommended by FAO, which has completed physical mechanism and strong adaptability. A large number of studies have proved the applicability of the Penman–Monteith formula in China [38]. The calculation formula is as follows in Equation (6):
Day is step length, where, is potential evapotranspiration; is the net radiation on crop surface; is soil heat flux; is the average daily temperature at a height of 2 m; is the wind speed at a height of 2 m; is saturated water vapor pressure difference; is the slope of saturated water vapor pressure curve; is the hygrometer constant.
The daily values of the NURS during 1987–2018 were calculated by inputting meteorological parameters such as minimum temperature, maximum temperature, coordinate elevation, average wind speed, saturated water vapor pressure and sunshine duration through the Penman computer program.
2.3.3. Runoff Elasticity and Variation
The elastic method attributes annual discharge changes on a multi-year scale to changes in annual precipitation, annual potential evaporation rate, and watershed properties, as in Equation (7):
While climate and vegetation change have an impact on n, suppose NDVI is the impact of watershed characteristics on n, and x is the impact of climate change on (n). Then, the elasticity of NDVI and x factor on sediment concentration can be obtained by using the double logarithm function [28,38]. According to the formula Equation (8), it can be obtained:
a and b are the elasticity of NDVI and x, and the parameters a, b and w1 can be obtained by regression. In this paper, climate factor x was screened by correlation with n, and the screening factors were precipitation (P), potential evapotranspiration (E0), maximum air temperature (Tmax), minimum air temperature (Tmin), mean air temperature (Tmean), temperature difference (Td), precipitation erosivity (Pe) and aridity index (AI). Therefore, the elasticity of R can be divided into Equation (9):
The elasticity of climate to R is Equation (10):
The elasticity of ecological restoration to R is Equation (11):
The proportion of runoff change caused by climate change is Equation (12):
The proportion of runoff change caused by ecological restoration is Equation (13):
2.3.4. Elasticity and Change of Sediment Yield
Sediment yield is affected by runoff and sediment concentration Equation (14):
Therefore, the relative trend value of sediment yield modulus should be the sum of the relative trend of sediment concentration and runoff, as in Equation (15):
We can divide it by elasticity in Equation (16):
and are the elasticity of runoff and sediment concentration to sediment yield, respectively. Assuming that NDVI is the influence of watershed characteristics on sediment concentration, and z is the influence of climate change on sediment concentration, the elasticity of NDVI and z factors on sediment concentration can be obtained by using the double logarithm function in Equation (17):
c and d are the elasticity of NDVI and z, and the parameters c, d and w2 can be obtained by regression. Climate factor z is screened by correlation with C, and the screening factors include precipitation (P), total precipitation greater than 1 mm (>1 TP), average precipitation greater than 1 mm (>1 AVGP), total precipitation greater than 10 mm (>10 TP), average precipitation greater than 10 mm (>10 AVGP), total precipitation greater than 30 mm (>30 TP), average precipitation greater than 30 mm (>30 AVGP) and aridity index (AI). The elasticity of sediment yield s can be divided into Equation (18):
The elasticity of climate to S is Equation (19):
The elasticity of ecological restoration to S is Equation (20):
The proportion of sediment yield change caused by climate change is Equation (21):
The proportion of sediment yield change caused by ecological restoration is Equation (22):
3. Result
3.1. Hydrological and Meteorological Changes
The Pettitt method was used to detect the abrupt trend of runoff and sediment during the study period. As shown in Figure 2, the runoff Pettitt value in 2002 and 2003 was the highest, reaching a significant level (p < 0.05). The Pettitt value of 2000 and 2002 was the highest, which was very significant (p < 0.01). Therefore, we take 2002 as the year when runoff and sediment yield in the basin changed abruptly, and 2002 is the year when ecological engineering started in the southwest karst.
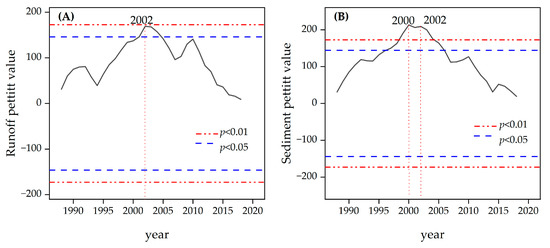
Figure 2.
Pettit detection trends of runoff and sediment yield: (A), Runoff time series. (B), Sediment time series.
Further, we set 1987–2002 as the pre-change period and 2002–2018 as the post-change period to quantitatively study the contribution of climate change and ecological restoration to runoff and sediment yield in the Nandong underground river basin system after the change. The variation trends of annual precipitation, E0, runoff, and sediment are shown in Figure 3. It can be found that during the variation period, precipitation, runoff, and sediment yield decrease, with sediment yield decreasing by 51.8%, runoff decreasing by 15.5%, and precipitation decreasing by 4.5%. E0 has an increasing trend in the change period, with an increasing proportion of 1.4%, and the specific variation is shown in (Table 2).
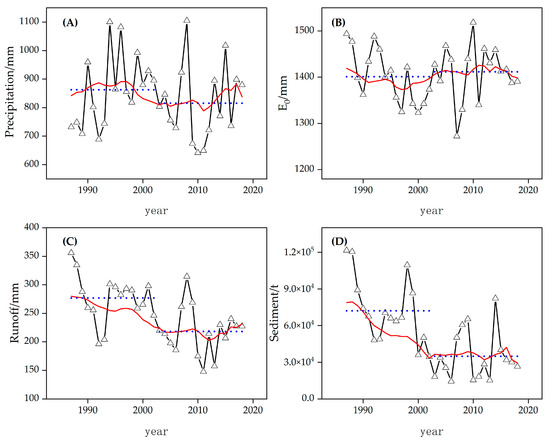
Figure 3.
Changing trends of hydrological and meteorological characteristics of the NURS: (A) precipitation, (B) E0, (C) runoff, and (D) sediment. The black curve is the annual change point plot, the red curve is the 11-year window moving average, and the blue dot is the mean before and after the change. Each hollow triangle has annual values for hydrological and meteorological data.
Table 2.
Hydrological and meteorological trends before and after abrupt change.
3.2. Sensitivity Assessment and Quantitative Analysis of Runoff Changes
The correlation between the underlying surface factor (n) and climate change and NDVI is shown in Figure 4. In the NURS, the n factor is highly correlated with NDVI, Tmax, and Tmin, and the correlation index R2 is 0.504, 0.418, and 0.481, respectively.
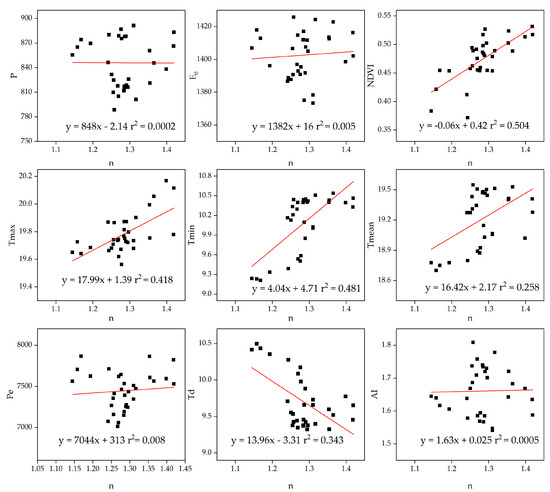
Figure 4.
Correlation between climate change and ecological restoration on underlying surface factor (n): precipitation (P), potential evapotranspiration (E0), maximum air temperature (Tmax), minimum air temperature (Tmin), mean air temperature (Tmean), temperature difference (Td), precipitation erosivity (Pe) and aridity index (AI). The red line is the correlation trend of each factor and n value of the year, and the black box is the corresponding n value of each factor of the year.
The results are shown in (Table 3). When using NDVI and Tmin as the double logarithm function of underlying surface factor (n), the constant w1 was not significant (p > 0.05), while the significance level of NDVI and Tmin factors (p < 0.05), and the R2 was 0.61. Using NDVI and Tmax as the double logarithm function of the underlying surface factor (n), the significance level of the constant w1 was (p < 0.05), while the significance level of NDVI and Tmax was (p < 0.01), and the R2 was 0.61. Therefore, the study takes NDVI as the ecological restoration factor affecting the underlying surface factor (n), and Tmax as the climate factor affecting the underlying surface factor (n).
Table 3.
Elasticity and significance of logarithmic function of climate change and ecological restoration on watershed factor (n).
According to the Budyko elasticity calculation, the elasticity and changes of ecological restoration and climate factors on runoff are shown in Table 4. When precipitation increases by 10%, runoff increases by 18.8%; when E0 increases by 10%, runoff decreases by 8.8%; when NDVI increases by 10%, runoff decreases by 4%; when Tmax increases by 10%, runoff increases by 36.1%.
Table 4.
Elasticity and change of runoff induced by climate change and ecological restoration.
In the change period, the decrease in rainfall reduced the runoff by 20.5 mm, accounting for 51.2%; the increase in E0 reduced the runoff by 3 mm, accounting for 7.5%; the increase in NDVI reduced the runoff by 10.5 mm, accounting for 26.1%; the increase in maximum temperature reduced the runoff by 7.6 mm, accounting for 18.9%. To sum up, climate change resulted in a runoff reduction of 31.1 mm, accounting for 77.6%, while ecological restoration resulted in a runoff reduction of 10.5 mm, accounting for 26.1%. The calculation error is 3.6%.
3.3. Sensitivity Assessment and Quantitative Analysis of Sediment Changes
The correlation between sediment concentration C and climate change and ecological restoration is shown in Figure 5, and the correlation coefficient R2 between the NURS sediment concentration C and NDVI is 0.4. Among the climatic factors, sediment concentration C has a high correlation with P and >1 AVGP, R2 being 0.21 and 0.22, respectively. Using sediment concentration C as y, NDVI is a double logarithmic function of P and >1 AVGP, respectively, and the results are shown in Table 5.
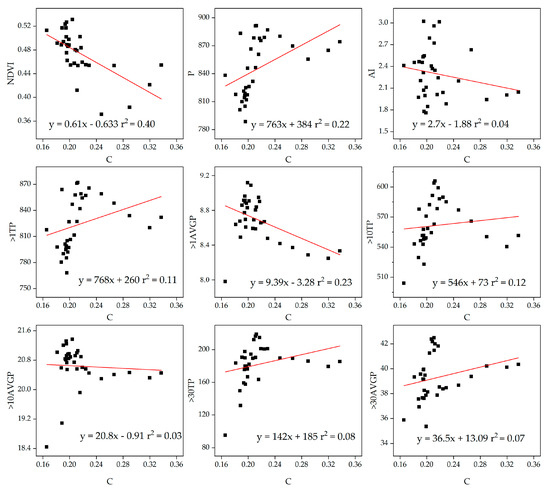
Figure 5.
Correlation between climate change and ecological restoration on sediment concentration C: precipitation (P), total precipitation greater than 1 mm (>1 TP), average precipitation greater than 1 mm (>1 AVGP), total precipitation greater than 10 mm (>10 TP), average precipitation greater than 10 mm (>10 AVGP), total precipitation greater than 30 mm (>30 TP), average precipitation greater than 30 mm (>30 AVGP) and aridity index (AI). The red line is the correlation trend of each element and C value of the year, and the black box is the corresponding C value of each element of the year.
Table 5.
Elasticity and significance of logarithmic function of climate change and ecological restoration on sediment concentration C.
Using NDVI and P as the double logarithm function of sediment concentration C, the significance level of w2 and NDVI (p < 0.01), and the significance level of P (p < 0.05), R2 is 0.51. Using NDVI and >1 AVGP as the double logarithm function of sediment concentration C, although the significance level of NDVI (p < 0.01), the significance level of constant w2 and >1 AVGP (p > 0.05), R2 is 0.46. Therefore, the study takes NDVI as an ecological restoration factor affecting sediment concentration C, and P as a climate factor affecting sediment concentration C.
The contribution of runoff and sediment concentration to sediment yield is 19.8% and 80.2%, respectively. The elasticity of runoff to sediment yield is 0.82 and the elasticity of sediment concentration is 2.93. According to the Budyko elasticity calculation, the elasticity and changes of climate and ecological factors on sediment yield are shown in Table 6. Runoff increases by 10%, sediment yield increases by 8.2%, sediment concentration increases by 10%, and sediment yield increases by 29.3%. When precipitation increases by 10%, sediment yield increases by 53.7%, E0 increases by 10%, and sediment yield decreases by 7.2%. When maximum temperature increases by 10%, sediment yield decreases by 29.7%, and when NDVI increases by 10%, sediment yield decreases by 32.6%.
Table 6.
Elasticity and change of sediment induced by climate change and ecological restoration.
In the change period, the decrease in precipitation led to a decrease of 13,138 t, accounting for 35.3%, the increase in E0 led to a decrease of 550 t, accounting for 7.5%, the increase in Tmax led to a decrease of 1398 t, accounting for 3.8%, and the increase in NDVI led to a decrease of 19,127 t, accounting for 51.3%. Climate change resulted in a decrease of 150,86T in sediment yield, resulting in a decrease of 40.5%, and ecological restoration resulted in a decrease of 19,127 t in sediment yield, accounting for 51.3%. The calculation error is 8.2%.
4. Discussion
4.1. Differences with Previous Models
Based on the improved Budyko model, this paper analyzes the contribution rate of climate change and ecological restoration to water and sediment in the NURS, and divides the underlying surface factor n and sediment concentration C into two parts: ecological restoration and climate change using the correlation coefficient and double logarithm function method. We found that in the NURS, vegetation change and Tmax increase are two important aspects of the underlying surface factor (n) change. Precipitation and NDVI are two important factors that lead to the increase in sediment concentration (C).
Vegetation change can significantly alter river runoff by altering hydrological processes such as vegetation transpiration, soil evaporation and interception evaporation, thus affecting water availability in a basin [39]. Xu et al. believed that the increase in the underlying surface factor n was mainly attributable to reforestation in soil and water conservation practices in the past 30 years, and partly attributable to climate change [40]. Wang et al. found that extreme temperature has a more significant effect on climate change [41]. Similarly, in the NURS watershed, we found that air temperature has a great influence on the underlying surface, especially the increase in maximum air temperature, which may be related to the opening and closing of vegetation transpiration pores [42], or increase the soil water deficit and change the functional form of vegetation [43]. As a result, the runoff in the basin decreases.
Higher precipitation is usually associated with more soil loss [16] because precipitation increases soil moisture, resulting in soil moisture saturation or crusts, reduced permeability, and increased erosion. In addition, higher precipitation will increase sediment yield capacity. Studies have shown that with the increase in rainfall, sediment will increase exponentially, thus increasing sediment concentration C [44]. Ecological restoration increases NDVI, changes the composition of surface vegetation, and affects the process of sediment generation and yield [45].
The introduction of a double logarithm function to divide the underlying surface factor n and sediment concentration C into climate change and ecological restoration will increase the error range of the second-order approximation calculation of Budyko. However, the error is well controlled in our study. The error of runoff is only 2.8%, and the error of sediment yield is 8.2%, which is within the acceptable range of the study. The next step is to find out the ecological and climatic factors that have more influence on the underlying surface factor n and sediment concentration C, improve the correlation index R2 and reduce the error. In addition, potential evapotranspiration is also affected by vegetation distribution, and there is a synergistic effect between climate and vegetation. In long-term studies, coevolution cannot be ignored [20]. Especially in the context of climate change, climate stationarity is no longer a valid assumption [46]. To achieve this, detailed hydrological data sets are also needed to address vegetation effects at fine spatio-temporal scales [20].
4.2. Variation of Runoff and Sediment Yield
Since 2002, China has carried out ecological projects in karst areas of southwest China. As an ecological barrier in the upper reaches of the Pearl River, the runoff and sediment yield have decreased significantly in recent years. At the same time, using Pettitt detection, we found that 2002 was also the mutation point of the NURS runoff and sediment yield. During the change period, runoff decreased by 15.5% and sediment discharge decreased by 51.8%. We found that the decrease in precipitation, the increase in temperature and evaporation, and the increase in NDVI resulted in the decrease in runoff and sediment yield in the NURS.
At present, studies on the effects of climate change and vegetation restoration on water and sediment are mostly conducted in China, Southeast Asia, America and other regions [21]. Sun et al. found that landscape engineering measures played a major role in the reduction of runoff and sediment in the Loess Plateau in the past 20 years, with the contribution ratio of runoff reduction reaching 94.7% and sediment transport reduction ratio reaching 62.8% [47]. Wang et al. separated the impact of vegetation restoration on runoff change in 413 river basins in the United States, and found that vegetation restoration had the greatest impact on the high plain area, resulting in an average reduction of about 30% in river flow, up to 120% [48]. Xue et al. finds that climate change and human activities will greatly reduce the runoff and sediment transport to the sea via the Mekong River, which will lead to coastal erosion in the Red River Delta [49].
Climate change is the main factor of runoff change in the Pearl River Basin, and human activities led to a sharp reduction of sediment in the basin [50,51]. In the NURS, which is also located in the Pearl River Basin, climate change is the main reason for runoff reduction, accounting for 77.6% of the runoff change, and ecological restoration accounts for 26.1% of the runoff change. Ecological restoration was the main cause of sediment discharge decrease, accounting for 51.3% of sediment discharge change. According to the study of Ye et al., the annual runoff change in the karst canyon area is the direct result of climate change, accounting for 71.5–85.6%, and ecological restoration is the main reason for the reduction in river sediment transport, accounting for 67.2~107.5% [52]. Li et al. took seven small karst drainage basins in southwest China as the research object. It was found that runoff is mainly affected by precipitation, sediment production is mainly affected by human activities, and ecological restoration has a certain reduction effect on sediment production (sediment production is negatively correlated with the vegetation normalization index) [39]. These studies are similar to our findings.
Compared with the non-karst areas in the north, climate has a greater influence on runoff in the karst areas in southwest China. The main reason is that the initial value of vegetation cover in northern China is low and the runoff coefficient is large. Rainfall penetrate easily into karst fissures in southern karst areas, and groundwater flow is the main factor affecting runoff and infiltration [53]. The above studies show that the karst basin is more vulnerable to the water–sediment pressure brought by climate change than non-karst basins [54].
4.3. Elasticity of Runoff and Sediment Yield
In the NURS, the sensitivity of runoff to temperature was 3.61 and that to precipitation was 1.88. In the context of global warming, increasing temperature will seriously reduce runoff. Relevant studies show that the temperature will continue to rise by the end of the 21st century, posing a huge challenge to the allocation of water resources in the NURS [55]. The sensitivity of sediment yield to precipitation is high, and the elasticity is up to 5.37, indicating that the increase in precipitation will greatly increase the sediment yield. The current arid climate is also an important reason for the significant reduction in the NURS sediment yield during the change period.
The sensitivity of runoff to NDVI was −0.4, and the sensitivity of sediment content to NDVI was 3.26. We found that ecological restoration played an important role in reducing sediment yield in the NURS watershed, but had a very weak effect on runoff reduction. Many scholars have suggested slowing down the implementation of vegetation restoration projects in order to maintain the status quo of vegetation restoration. Otherwise, large-scale afforestation will have a negative impact on the ecological environment [11,56]. Among them, one of the most important manifestations is the possibility of reducing the runoff in the basin [40].
Zhang et al. believes that vegetation greening will reduce the ratio of available water to available energy and improve the water storage capacity of soil [31]. If the temperature rises, the evapotranspiration of water in soil will be accelerated, that is to say, the rise of temperature during vegetation restoration will more easily lead to the decrease in runoff. It is proved that the underlying surface has linkage ability with climate change [57]. This also explains why runoff in the NURS is so sensitive to the elasticity of air temperature. We found that in the NURS, ecological restoration reduced runoff very slightly, but effectively controlled sediment yield. Therefore, more attention should be paid to the reduction in runoff caused by climate change [58].
5. Conclusions
The Pettitt mutation was used to analyze the series changes of runoff and sediment yield in the basin from 1987 to 2018. The contribution of climate change and ecological restoration to runoff change was quantified based on the improved Budyko hydrothermal coupled equation theory, and the elasticity of climate change and ecological restoration factors to runoff and sediment yield was analyzed. The main conclusions are as follows: (1) 2002 is the year of abrupt change in runoff and sediment yield. Before and after the mutation, the runoff and sediment yield decreased significantly, with the change ratio of −15.5% and −51.8%. The decrease in precipitation and the increase in E0 were not significant, the proportions were −4.5% and 1.4%, respectively. (2) Tmax and NDVI were the main factors affecting the underlying surface factor n, while precipitation and NDVI were the main factors affecting sediment concentration C. (3) Climate change reduced runoff by 77.6%; ecological restoration reduced sediment by 51.78%. The sensitivity of runoff to the maximum temperature was 3.61. The sensitivity of sediment yield to precipitation and NDVI was 5.37 and 3.26, respectively. Climate change is the main factor of runoff reduction, and ecological restoration is the main factor of sediment reduction. We believe that in the NURS, the effect of ecological restoration is worth looking forward to. Although the increase in NDVI will reduce the runoff, the elasticity of runoff to NDVI (−0.4) is not large, which is much smaller than the elasticity of sediment discharge to NDVI (3.26). Ecological restoration has effectively controlled sediment yield, but the reduction in runoff caused by climate change should be paid more attention.
Author Contributions
P.L. is the lead author of the article, responsible for writing it and producing the images. Z.J. and Y.L. proposed the topic selection and research direction. Y.L. and F.L. analyzed the data and the overall framework design of the article. Y.S. and X.Y. has revised the format of the article. All authors have read and agreed to the published version of the manuscript.
Funding
This work was supported by the Key Laboratory Construction Project of Guangxi (No. 19-185-7), the National Key Research and Development Program of China (No. 2016YFC0502503), the Youth Foundation of National Natural Science Foundation of China (No. 41502342) and the General Project of National Natural Science Foundation of China (No. 41471447).
Data Availability Statement
The data are not publicly available due to further research.
Acknowledgments
Thanks to the Nandong Underground River System research team. We would also like to thank all reviewers and editors for their constructive and insightful comments.
Conflicts of Interest
The authors declare no conflict of interest.
References
- Piao, S.; Wang, X.; Park, T.; Chen, C.; Lian, X.; He, Y.; Bjerke, J.W.; Chen, A.; Ciais, P.; Tommervik, H.; et al. Characteristics, drivers and feedbacks of global greening. Nat. Rev. Earth Environ. 2020, 1, 14–27. [Google Scholar] [CrossRef]
- Chen, C.; Park, T.; Wang, X.; Piao, S.; Xu, B.; Chaturvedi, R.K.; Fuchs, R.; Brovkin, V.; Ciais, P.; Fensholt, R.; et al. China and India lead in greening of the world through land-use management. Nat. Sustain. 2019, 2, 122–129. [Google Scholar] [CrossRef] [PubMed]
- Fu, B.; Wang, S.; Liu, Y.; Liu, J.; Liang, W.; Miao, C. Hydrogeomorphic Ecosystem Responses to Natural and Anthropogenic Changes in the Loess Plateau of China. Annu. Rev. Earth Planet. Sci. 2017, 45, 223–243. [Google Scholar]
- Qiu, J. China drought highlights future climate threats. Nature 2010, 465, 142–143. [Google Scholar] [CrossRef] [PubMed]
- Zhao, B.; Lei, H.; Yang, D.; Yang, S.; Santisirisomboon, J. Runoff and sediment response to deforestation in a large Southeast Asian monsoon watershed. J. Hydrol. 2022, 606, 127432. [Google Scholar] [CrossRef]
- Qin, Y.; Xiao, X.; Dong, J.; Zhang, Y.; Wu, X.; Shimabukuro, Y.; Arai, E.; Biradar, C.; Wang, J.; Zou, Z.; et al. Improved estimates of forest cover and loss in the Brazilian Amazon in 2000–2017. Nat. Sustain. 2019, 2, 764–772. [Google Scholar] [CrossRef]
- Immerzeel, W.W.; van Beek, L.P.H.; Konz, M.; Shrestha, A.B.; Bierkens, M.F.P. Hydrological response to climate change in a glacierized catchment in the Himalayas. Clim. Change 2012, 110, 721–736. [Google Scholar] [CrossRef]
- Donnelly, C.; Greuell, W.; Andersson, J.; Gerten, D.; Pisacane, G.; Roudier, P.; Ludwig, F. Impacts of climate change on European hydrology at 1.5, 2 and 3 degrees mean global warming above preindustrial level. Clim. Change 2017, 143, 13–26. [Google Scholar] [CrossRef]
- Sorg, A.; Bolch, T.; Stoffel, M.; Solomina, O.; Beniston, M. Climate change impacts on glaciers and runoff in Tien Shan (Central Asia). Nat. Clim. Change 2012, 2, 725–731. [Google Scholar] [CrossRef]
- Bates, P.D.; Quinn, N.; Sampson, C.; Smith, A.; Wing, O.; Sosa, J.; Savage, J.; Olcese, G.; Neal, J.; Schumann, G.; et al. Combined Modeling of US Fluvial, Pluvial, and Coastal Flood Hazard Under Current and Future Climates. Water Resour. Res. 2021, 57, e2020WR028673. [Google Scholar] [CrossRef]
- Luo, Y.; Yang, Y.; Yang, D.; Zhang, S. Quantifying the impact of vegetation changes on global terrestrial runoff using the Budyko framework. J. Hydrol. 2020, 59. [Google Scholar] [CrossRef]
- Jiang, Z.; Lian, Y.; Qin, X. Rocky desertification in Southwest China: Impacts, causes, and restoration. Earth-Sci. Rev. 2014, 132, 1–12. [Google Scholar] [CrossRef]
- Lan, F.; Zhao, Y.; Jiang, Z.; Yu, Y.; Li, Y.; Caballero-Calvo, A.; Senciales González, J.M.; Rodrigo-Comino, J. Exploring long-term datasets of land use, economy, and demography variations in karst wetland areas to detect possible microclimate changes. Land Degrad. Dev. 2022, 33, 2743–2756. [Google Scholar] [CrossRef]
- Li, Y.Q.; Jiang, Z.C.; Chen, Z.H.; Yu, Y.; Lan, F.N.; Shan, Z.J.; Sun, Y.J.; Liu, P.; Tang, X.B.; Rodrigo-Comino, J. Anthropogenic Disturbances and Precipitation Affect Karst Sediment Discharge in the Nandong Underground River System in Yunnan, Southwest China. Sustainability 2020, 12, 6. [Google Scholar] [CrossRef]
- Huang, P.; Song, J.; Wu, Q.; Sun, H.; Mao, R.; Cheng, D.; Zhang, J.; Shi, Y. The ecohydrological effects of climate and landscape interactions within the Budyko framework under non-steady state conditions. Catena 2022, 217, 106481. [Google Scholar] [CrossRef]
- Zabaleta, A.; Meaurio, M.; Ruiz, E.; Antiguedad, I. Simulation climate change impact on runoff and sediment yield in a small watershed in the basque country, northern Spain. J. Environ. Qual. 2014, 43, 235–245. [Google Scholar] [CrossRef]
- Wang, D.; Wu, L. Similarity of climate control on base flow and perennial stream density in the Budyko framework. Hydrol. Earth Syst. Sci. 2013, 17, 315–324. [Google Scholar] [CrossRef]
- Yang, Y.Y.; Li, Z.B.; Li, P.; Ren, Z.P.; Gao, H.D.; Wang, T.; Xu, G.C.; Yu, K.X.; Shi, P.; Tang, S.S. Variations in runoff and sediment in watersheds in loess regions with different geomorphologies and their response to landscape patterns. Environ. Earth Sci. 2017, 76, 11. [Google Scholar] [CrossRef]
- Good, S.P.; Noone, D.; Bowen, G. Water Resources. Hydrologic connectivity constrains partitioning of global terrestrial water fluxes. Science 2015, 349, 175–177. [Google Scholar] [CrossRef]
- Gan, G.; Liu, Y.; Sun, G. Understanding interactions among climate, water, and vegetation with the Budyko framework. Earth-Sci. Rev. 2021, 212, 103451. [Google Scholar] [CrossRef]
- Zeng, F.; Ma, M.-G.; Di, D.-R.; Shi, W.-Y. Separating the Impacts of Climate Change and Human Activities on Runoff: A Review of Method and Application. Water 2020, 12, 2201. [Google Scholar] [CrossRef]
- Harman, C.; Troch, P.A. What makes Darwinian hydrology “Darwinian”? Asking a different kind of question about landscapes. Hydrol. Earth Syst. Sci. 2014, 18, 417–433. [Google Scholar] [CrossRef]
- Liu, Q.J.; Zhang, H.Y.; Gao, K.T.; Xu, B.; Wu, J.Z.; Fang, N.F. Time-frequency analysis and simulation of the watershed suspended sediment concentration based on the Hilbert-Huang transform (HHT) and artificial neural network (ANN) methods: A case study in the Loess Plateau of China. Catena 2019, 179, 107–118. [Google Scholar] [CrossRef]
- Zhou, S.; Yu, B.; Huang, Y.; Wang, G. The complementary relationship and generation of the Budyko functions. Geophys. Res. Lett. 2015, 42, 1781–1790. [Google Scholar] [CrossRef]
- Wang, H.; Lv, X.; Zhang, M. Sensitivity and attribution analysis based on the Budyko hypothesis for streamflow change in the Baiyangdian catchment, China. Ecol. Indic. 2021, 121, 107221. [Google Scholar] [CrossRef]
- Yang, D.; Sun, F.; Liu, Z.; Cong, Z.; Ni, G.; Lei, Z. Analyzing spatial and temporal variability of annual water-energy balance in nonhumid regions of China using the Budyko hypothesis. Water Resour. Res. 2007, 43, W04426. [Google Scholar] [CrossRef]
- Zhang, D.; Liang, K.; Nie, R.; Gu, R. Estimation of evapotranspiration and sensitivity to climate and the underlying surface based on the Budyko Framework. Resour. Sci. 2016, 38, 1140–1148. [Google Scholar]
- Jiang, C.; Xiong, L.; Wang, D.; Liu, P.; Guo, S.; Xu, C.-Y. Separating the impacts of climate change and human activities on runoff using the Budyko-type equations with time-varying parameters. J. Hydrol. 2015, 522, 326–338. [Google Scholar] [CrossRef]
- Ning, T.; Zhou, S.; Chang, F.; Shen, H.; Li, Z.; Liu, W. Interaction of vegetation, climate and topography on evapotranspiration modelling at different time scales within the Budyko framework. Agric. For. Meteorol. 2019, 275, 59–68. [Google Scholar] [CrossRef]
- Saha, A.; Joseph, J.; Ghosh, S. Climate controls on the terrestrial water balance: Influence of aridity on the basin characteristics parameter in the Budyko framework. Sci. Total Environ. 2020, 739, 139863. [Google Scholar] [CrossRef]
- Zhang, D.; Liu, X.; Bai, P. Different Influences of Vegetation Greening on Regional Water-Energy Balance under Different Climatic Conditions. Forests 2018, 9, 412. [Google Scholar] [CrossRef]
- Liu, P.; Jiang, Z.; Li, Y.; Lan, F.; Sun, Y. Landscape Pattern Changes Affect Runoff and Sediment Yield in the Nandong Underground River System in Southwest China. Sustainability 2023, 15, 835. [Google Scholar] [CrossRef]
- Li, Y.Q.; Jiang, Z.C.; Yu, Y.; Shan, Z.J.; Lan, F.N.; Yue, X.F.; Liu, P.; Gyasi-Agyei, Y.; Rodrigo-Comino, J. Evaluation of soil erosion and sediment deposition rates by the (137)Cs fingerprinting technique at different hillslope positions on a catchment. Environ. Monit. Assess. 2020, 192, 717. [Google Scholar] [CrossRef] [PubMed]
- Wang, S.; Li, J.; Pu, J.; Huo, W.; Zhang, T.; Huang, S.; Yuan, D. Impacts of climate change and human activities on the interannual flow changes in a typical karst subterranean river, South China. J. Nat. Resour. 2019, 34, 759–770. [Google Scholar] [CrossRef]
- Li, J.; Pu, J.; Zhang, T.; Xiong, X.; Wang, S.; Huo, W.; Yuan, D. Measurable sediment discharge from a karst underground river in southwestern China: Temporal variabilities and controlling factors. Environ. Earth Sci. 2020, 79, 90. [Google Scholar] [CrossRef]
- Yang, H.; Yang, D.; Lei, Z.; Sun, F. New analytical derivation of the mean annual water-energy balance equation. Water Resour. Res. 2008, 44, W03410. [Google Scholar] [CrossRef]
- Gerrits, A.M.J.; Savenije, H.H.G.; Veling, E.J.M.; Pfister, L. Analytical derivation of the Budyko curve based on rainfall characteristics and a simple evaporation model. Water Resour. Res. 2009, 45, W04403. [Google Scholar] [CrossRef]
- Ningqi, N.; Jiaxin, X.; Xiaomang, L.; Kaiwen, W.; Wei, T. Multi-source data quality assessment based on the index of runoff sensitivity to climate change. Acta Geogr. Sin. 2022, 77, 2280–2291. [Google Scholar] [CrossRef]
- Jackson, R.B.; Jobbagy, E.G.; Avissar, R.; Roy, S.B.; Barrett, D.J.; Cook, C.W.; Farley, K.A.; le Maitre, D.C.; McCarl, B.A.; Murray, B.C. Trading water for carbon with biological carbon sequestration. Science 2005, 310, 1944–1947. [Google Scholar] [CrossRef]
- Xu, X.; Yang, D.; Yang, H.; Lei, H. Attribution analysis based on the Budyko hypothesis for detecting the dominant cause of runoff decline in Haihe basin. J. Hydrol. 2014, 510, 530–540. [Google Scholar] [CrossRef]
- Wang, W.G.; Xing, W.Q.; Shao, Q.X.; Yu, Z.B.; Peng, S.Z.; Yang, T.; Yong, B.; Taylor, J.; Singh, V.P. Changes in reference evapotranspiration across the Tibetan Plateau: Observations and future projections based on statistical downscaling. J. Geophys. Res.-Atmos. 2013, 118, 4049–4068. [Google Scholar] [CrossRef]
- Yu, Y.; Zhao, W.; Martinez-Murillo, J.F.; Pereira, P. Loess Plateau: From degradation to restoration. Sci. Total. Environ. 2020, 738, 140206. [Google Scholar] [CrossRef]
- Vicente-Serrano, S.M.; Beguería, S.; López-Moreno, J.I. A Multiscalar Drought Index Sensitive to Global Warming: The Standardized Precipitation Evapotranspiration Index. J. Clim. 2010, 23, 1696–1718. [Google Scholar] [CrossRef]
- Yu, Y.; Zhu, R.; Ma, D.; Liu, D.; Liu, Y.; Gao, Z.; Yin, M.; Bandala, E.R.; Rodrigo-Comino, J. Multiple surface runoff and soil loss responses by sandstone morphologies to land-use and precipitation regimes changes in the Loess Plateau, China. Catena 2022, 217, 106477. [Google Scholar] [CrossRef]
- Yu, Y.; Loiskandl, W.; Kaul, H.-P.; Himmelbauer, M.; Wei, W.; Chen, L.; Bodner, G. Estimation of runoff mitigation by morphologically different cover crop root systems. J. Hydrol. 2016, 538, 667–676. [Google Scholar] [CrossRef]
- Milly, P.C.D.; Betancourt, J.; Falkenmark, M.; Hirsch, R.M.; Kundzewicz, Z.W.; Lettenmaier, D.P.; Stouffer, R.J.; Dettinger, M.D.; Krysanova, V. On Critiques of “Stationarity is Dead: Whither Water Management?”. Water Resour. Res. 2015, 51, 7785–7789. [Google Scholar] [CrossRef]
- Sun, P.; Wu, Y.; Wei, X.; Sivakumar, B.; Qiu, L.; Mu, X.; Chen, J.; Gao, J. Quantifying the contributions of climate variation, land use change, and engineering measures for dramatic reduction in streamflow and sediment in a typical loess watershed, China. Ecol. Eng. 2020, 142, 105611. [Google Scholar] [CrossRef]
- Wang, D.; Hejazi, M. Quantifying the relative contribution of the climate and direct human impacts on mean annual streamflow in the contiguous United States. Water Resour. Res. 2011, 47, W00J12. [Google Scholar] [CrossRef]
- Xue, Z.; Liu, J.P.; Ge, Q. Changes in hydrology and sediment delivery of the Mekong River in the last 50 years: Connection to damming, monsoon, and ENSO. Earth Surf. Process. Landf. 2011, 36, 296–308. [Google Scholar] [CrossRef]
- Wei, X.; Cai, S.; Ni, P.; Zhan, W. Impacts of climate change and human activities on the water discharge and sediment load of the Pearl River, southern China. Sci. Rep. 2020, 10, 16743. [Google Scholar] [CrossRef]
- Yang, L.; Zhao, G.; Tian, P.; Mu, X.; Tian, X.; Feng, J.; Bai, Y. Runoff changes in the major river basins of China and their responses to potential driving forces. J. Hydrol. 2022, 607, 127536. [Google Scholar] [CrossRef]
- Ye, X.; Xu, C.-Y.; Zhang, Z. Comprehensive analysis on the evolution characteristics and causes of river runoff and sediment load in a mountainous basin of China’s subtropical plateau. J. Hydrol. 2020, 591, 125597. [Google Scholar] [CrossRef]
- Liu, J.; Zhang, Q.; Zhang, Y.; Chen, X.; Li, J.; Aryal, S.K. Deducing Climatic Elasticity to Assess Projected Climate Change Impacts on Streamflow Change across China. J. Geophys. Res.-Atmos. 2017, 122, 10197–10214. [Google Scholar] [CrossRef]
- Liu, M.; Xu, X.; Wang, D.; Sun, A.Y.; Wang, K. Karst catchments exhibited higher degradation stress from climate change than the non-karst catchments in southwest China: An ecohydrological perspective. J. Hydrol. 2016, 535, 173–180. [Google Scholar] [CrossRef]
- Wu, C.; Hu, B.X.; Huang, G.; Wang, P.; Xu, K. Responses of runoff to historical and future climate variability over China. Hydrol. Earth Syst. Sci. 2018, 22, 1971–1991. [Google Scholar] [CrossRef]
- Zhang, S.; Yang, Y.; McVicar, T.R.; Yang, D. An Analytical Solution for the Impact of Vegetation Changes on Hydrological Partitioning Within the Budyko Framework. Water Resour. Res. 2018, 54, 519–537. [Google Scholar] [CrossRef]
- Zhang, S.; Li, Z.; Hou, X.; Yi, Y. Impacts on watershed-scale runoff and sediment yield resulting from synergetic changes in climate and vegetation. Catena 2019, 179, 129–138. [Google Scholar] [CrossRef]
- Bonan, G.B. Forests and climate change: Forcings, feedbacks, and the climate benefits of forests. Science 2008, 320, 1444–1449. [Google Scholar] [CrossRef]


Disclaimer/Publisher’s Note: The statements, opinions and data contained in all publications are solely those of the individual author(s) and contributor(s) and not of MDPI and/or the editor(s). MDPI and/or the editor(s) disclaim responsibility for any injury to people or property resulting from any ideas, methods, instructions or products referred to in the content. |
© 2023 by the authors. Licensee MDPI, Basel, Switzerland. This article is an open access article distributed under the terms and conditions of the Creative Commons Attribution (CC BY) license (https://creativecommons.org/licenses/by/4.0/).