Article

Optimal Dietary Protein/Energy Ratio and Phosphorus Level on Water Quality and Output for a Hybrid Grouper (Epinephelus lanceolatus ♂ × Epinephelus fuscoguttatus ♀) Recirculating Aquaculture System

1
Laboratory for Marine Fisheries Science and Food Production Processes, Key Laboratory of Sustainable Development of Marine Fisheries, Ministry of Agriculture and Rural Affairs, Yellow Sea Fisheries Research Institute, Chinese Academy of Fishery Sciences, Qingdao 266071, China
2
Marine Science and Technology, Zhejiang Ocean University, Zhoushan 316022, China
3
Huanghai Aquaculture Co., Ltd., Haibin West Road, Yantai 265100, China
*
Authors to whom correspondence should be addressed.
These authors contributed equally to this work.
Water 2023, 15(7), 1261; https://doi.org/10.3390/w15071261
Submission received: 27 February 2023 / Revised: 19 March 2023 / Accepted: 21 March 2023 / Published: 23 March 2023
(This article belongs to the Section Water, Agriculture and Aquaculture)

Abstract

:
In a recirculating aquaculture system (RAS), feed is critical to the growth of fish and is the main source of nutrient pollutants in aquaculture water. An eight-week feeding trial was conducted to investigate the role of feed on the growth efficiency of hybrid grouper (Epinephelus lanceolatus ♂ × Epinephelus fuscoguttatus ♀) and water quality in a RAS. Five commercial feeds with different respective dietary protein/energy (P/E) ratios and available phosphorus levels were selected (LNLP, 31.97 g/MJ, 0.96%; LNMP, 32.11 g/MJ, 1.54%; MNLP, 36.26 g/MJ, 0.98%; MNMP, 36.53 g/MJ, 1.58%; and HNP, 41.54 g/MJ, 1.97%). The results showed that HNP had the highest growth efficiency and MNLP provided the best economic benefit. The trend in water quality within 6 h after feeding was similar among the five groups. The relative concentrations of ammonia nitrogen, total nitrogen, active phosphate, and total phosphorus reached a maximum 2 h after feeding, and the relative concentration of nitrite reached a maximum 1 h after feeding. The high P/E ratio feed increased the concentrations of total ammonia nitrogen and nitrite nitrogen. The total ammonia nitrogen concentration in HNP was much higher than those in the other treatments. The dietary P/E ratio had no significant effect on total nitrogen concentration. High dietary phosphorus levels increased the total phosphorus concentration in the water, but no significant effect on the active phosphate concentration was observed. Considering the growth efficiency, economic benefit, and water quality, it can be concluded that MNLP is the most suitable feed for RAS breeding hybrid grouper. The results of this study supplement the gap on the effects of feed on RAS water quality and provide data support for the sustainable development of RAS industry.

1. Introduction

Aquaculture—the cultivation of fish, shellfish, and aquatic animals—is the fastest-growing food sector in the world [1]. Due to the stagnation of the fishing industry, aquaculture is regarded as the only available solution to further improve the production of seafood worldwide. Traditional aquaculture systems have adverse impacts on the environment, including water quality and secondary pollution, thus causing serious damage to aquatic resources, which is not conducive to the sustainable development of aquaculture [2]. The expansion of the aquaculture industry must rely on a sustainable production model.
The recirculating aquaculture system (RAS) is system in which aquaculture water is treated and (partially) reused [3]. Aquaculture water goes through a series of biological, physical, and chemical purification processes to remove some of the pollutants in the water and then, returns to the pond or tank. RAS allows fish to be raised in a land-based, indoor, controlled environment to minimize direct interaction between the production process and the environment. Since Saeki (1958) proposed the basic theory of an RAS [4], the design of recirculating aquaculture systems increasingly improved [5,6,7,8]. RAS, once mainly concentrated in Europe and other developed regions, is now increasingly common worldwide [9,10,11]. In recent years, China vigorously promoted the development of the RAS industry, which is regarded as the transformative direction of green development in the aquaculture industry [12].
The RAS is becoming increasingly advanced, but its market share in aquaculture is still small. One main factor hindering its large-scale adoption is the high investment cost of RAS equipment and the long economic return cycle [13]. Simple systems are unstable and difficult to manage, whereas complex systems increase the investment costs and are difficult to put into actual production [11,14]. Feed is the main source of nutrient pollutants in RAS. Developing a suitable feeding strategy is a more direct and simple regulatory approach that can reduce the discharge of nutrient pollutants in water for an existing system, thus reducing the demand for water exchange, improving the stocking density, and reducing aquaculture wastewater discharge without increasing the initial investment cost. In addition, the nutrient composition of feed directly affects the growth efficiency of fish, which, in turn, affects the economic benefit of the RAS industry [15,16]. Therefore, the RAS industry requires more precise feeding strategies than those of traditional aquaculture models.
Ammonia and nitrite are the main pollutants in the water of the RAS. Ammonia is converted to nitrate by nitrification in the bioreactor, and nitrite is the byproduct of nitrification. The tolerance to nitrogen pollutants varies according to fish species. The general maximum tolerance for NH3 is 0.01–0.5 mg/L and that for NO2-N is approximately 0.2–5.0 mg/L [17,18]. Phosphorus is also a pollutant in water, which cannot be ignored. Although fish have a high tolerance to phosphorus, phosphorus pollution of the environment threatens the sustainability of RAS [19,20]. The labile phosphate is typically considered a limiting nutrient in the water [21,22]. In the past, there were many studies on the relationship between feed formula and the concentration of nutrient pollutants in aquaculture water under traditional aquaculture. The dietary protein/energy (P/E) ratio and phosphorus level are the key factors affecting the excretion of dissolved nutrient pollutants by fish [23]. For example, reducing the P/E ratio can reduce the discharge of dissolved nitrogen waste [24,25]. When the absorption level of phosphorus was maintained below the maximum growth requirement of fish, only a small amount of dissolved phosphorus was excreted [26]. Typically, feed that contains high nitrogen and phosphorus levels leads to higher growth efficiency. Therefore, many studies formulated feed strategies for different fish species such as genetically modified tilapia, juvenile tuna, and juvenile rainbow trout that consider both growth efficiencies and nitrogen and phosphorus pollutant excretion [27,28,29]. RAS is enclosed and has a capacity to purify water [9]. The total amount of water is limited and so, the concentration of various pollutants in the water varies greatly after feeding. Exploring changes in water quality over time after feeding is helpful for water quality management in RAS.
Hybrid grouper, male Epinephelus. fuscoguttatus (Forsskål, 1775) × female Epinephelus. lanceolatus (Bloch, 1790), is a type of saltwater fish [30]. It can be cultured at 19–34 °C [31], and was widely cultivated in China in recent years [32]. With the advantages of rapid growth, high nutritional value, and economic value, hybrid grouper is very suitable for growing in an RAS [33]. However, there are few studies on the feed strategies for hybrid grouper, and there is a lack of feed strategies suitable for breeding hybrid grouper in RAS. The RAS feed strategy that considers both nutrient requirements and water quality improvement may be different from the traditional aquaculture model. There is still a gap in knowledge related to the effect of the dietary protein/energy ratio and phosphorus level on the growth efficiency and dissolved nutrient pollutant excretion of hybrid grouper in RAS. The purpose of this study was to investigate the relationship between dietary P/E ratio and phosphorus and nutrient pollutants in the water of hybrid grouper RAS. Five commercial feeds for grouper with different dietary protein/energy ratios and phosphorus levels were selected to explore the concentration changes of nutrient pollutants in RAS water after feeding and the effects of different diets on RAS water quality. Under the premise of ensuring the nutritional requirements of hybrid grouper and the economic benefits of RAS, the five diets were evaluated from the water quality performance.

2. Materials and Methods

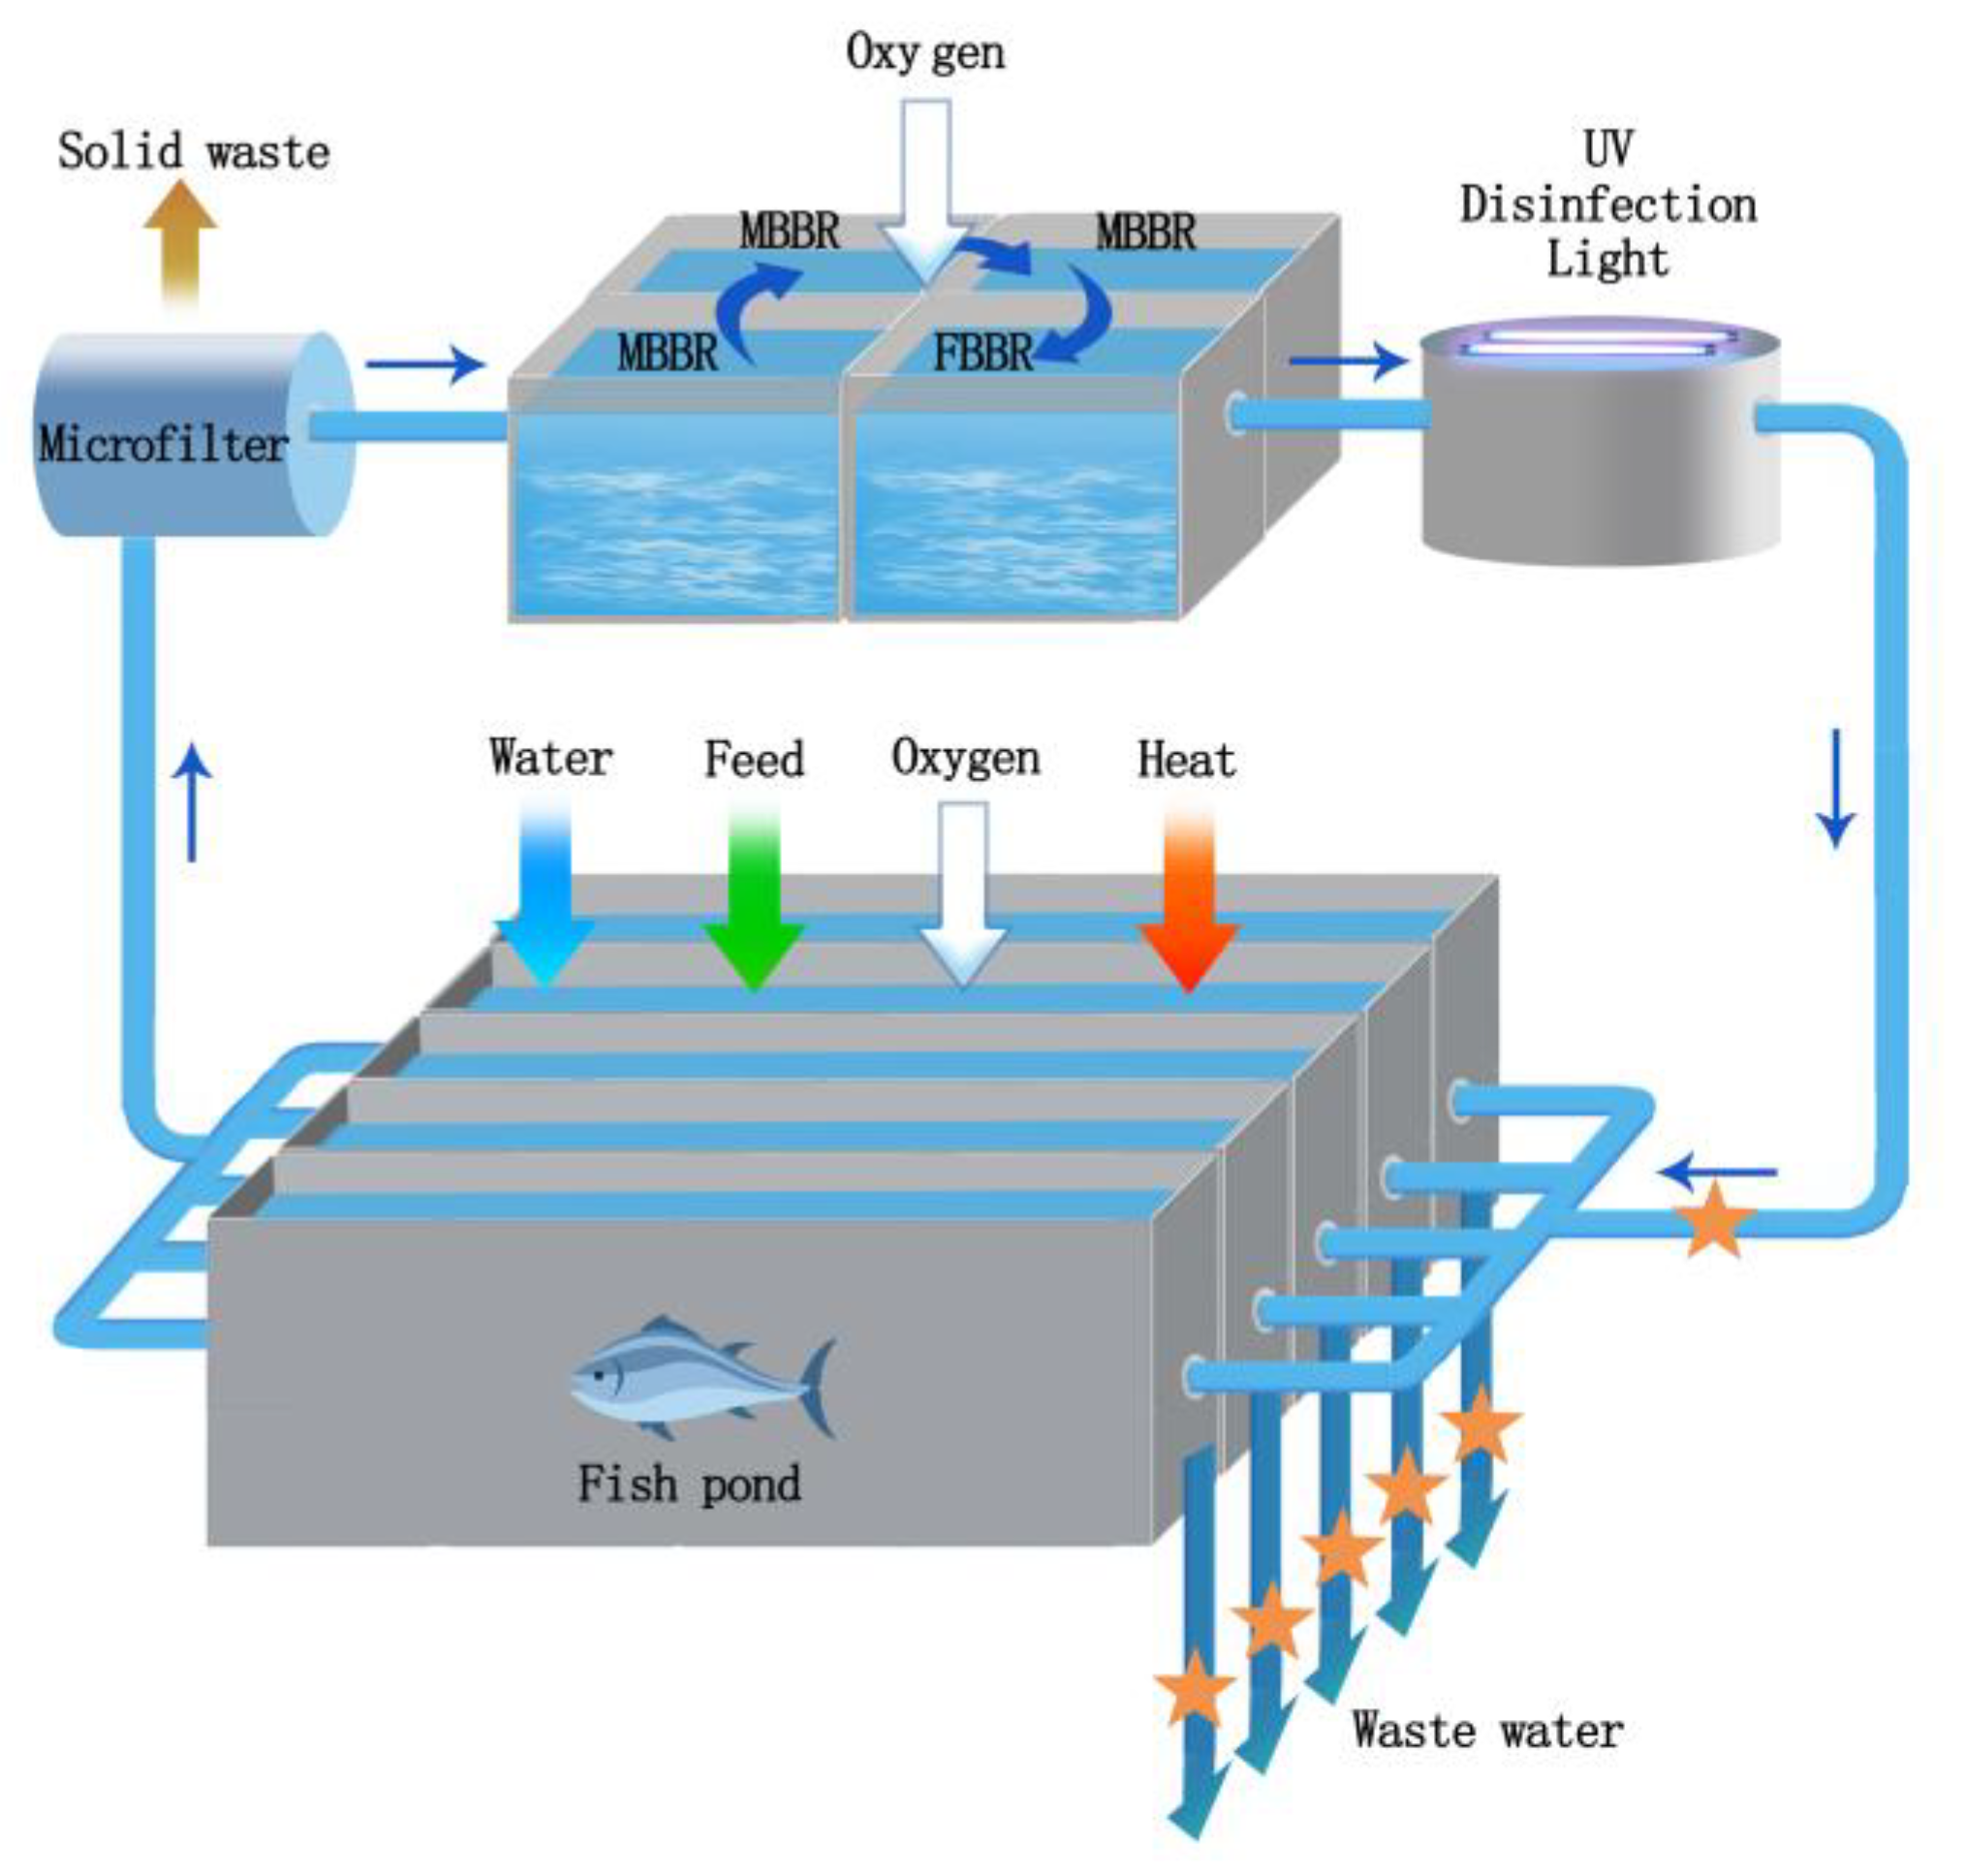
2.1. Recirculating Aquaculture System

The RAS consisted of a microfilter (Huixin, China), four-stage biofilm reactors, pipe aeration equipment, five heating pipes, six flow meters, and a UV area (Figure 1). The biofilm reactor consisted of three moving bed biofilm reactors (MBBR) using polypropylene filters as microbial carriers and one fixed bed biofilm reactor (FBBR) using plastic brushes as microbial carriers. The culture mode of nitrifying bacteria was natural biofilm formation. Each biofilm reactor had an area of 20 m2 and a depth of 2 m. Ammonia was converted to nitrite and then, to nitrate in the biofilm reactors [9,18]. The ammonia nitrogen removal efficiency was approximately 44.6–55.2%, and the nitrite removal efficiency was approximately 11.9–15.3% in the whole experiment period. Five cement fish tanks were connected to the RAS, and each tank had an area of 50 m2, a maximum depth of 2 m, and an effective depth of 1.5 m. The pipeline aerator oxygenates the biofilm reactors and the fish tanks. Each of the five fish tanks were heated by one of the five heating pipes to maintain the water temperature over 19 °C [31]. Flowmeters were installed at the water outlet of each tank and in front of the microfilter to monitor the water velocity of the RAS. The circulating flow of system water was 0.18 L/s. The daily water exchange capacity with the outside was about 10% of the total water volume in the system: make-up sea water entered the five tanks at the same rate (12 mL/s); 2 h after feeding, 5 m2 of water was discharged from each tank at one time. A YSI multiparameter water quality meter (ProDSS, Ohio, USA) was used to monitor the temperature, dissolved oxygen, pH, and salinity of the fish tank. These environmental parameters were adjusted by regulating aeration, opening the heating pipe, controlling water exchange, and other measures to maintain stability. During the experiment, the temperature of each fish tank was kept between 19.2 and 21.8 °C, the dissolved oxygen was kept between 5.7 and 6.2 mg/L, the pH was kept between 7.60 and 7.97, and the salinity was kept between 29.1 and 31.4 ppt. The RAS was running stably for 3 months prior to the experiment.

2.2. Experimental Subject

The hybrid groupers (E. fuscoguttatus ♀ × E. lanceolatus ♂) selected for the experiment came from the same batch. The seedling fish were bred by Huanghai Aquaculture Co., Ltd. (Haiyang, Shandong, China). The hybrid groupers were of similar size (approximately 108.55 g) and randomly divided into 5 groups with 5000 fish per group.

2.3. Experimental Feeds

Five commercial feeds with different respective dietary P/E ratios and available phosphorus levels were selected and analyzed (LNLP, 31.97 g/MJ, 0.96%; LNMP, 32.11 g/MJ, 1.54%; MNLP, 36.26 g/MJ, 0.98%; MNMP, 36.53 g/MJ, 1.58%; and HNP, 41.54 g/MJ, 1.97%). The main components of the five feeds were fish meals (Table 1). The specific crude content of the five feeds was determined by experiment. The available phosphorus content was calculated using a slope ratio assay [34]. The diets were stored at −20 °C before use. The five experimental groups were named according to the feed used. The daily feeding amount for each group was 8 kg divided into two feedings (8:00 a.m. and 3:00 p.m.). The feed was weighed and recorded before manual feeding. If there was a feed surplus, the remaining feed was removed, counted, and then, calculated by multiplying the amount of feed surplus by the average weight of feed particles to determine the total feed intake. Dead fish were immediately picked out and weighed to calculate feed coefficient [35].

2.4. Experimental Design and Sample Analysis

The experiment lasted for 8 weeks, from 12 November 2021 to 7 January 2022. Feeding was stopped within 24 h before and after the experiment, and 50 fish were randomly selected from each group and anesthetized with eugenol and weighed to calculate growth efficiency and economic benefits [36]. The water quality experiment was divided into two stages. To determine the change in water quality with time after feeding, the first stage of the experiment was designed to measure the changes in relative concentrations of total ammonia nitrogen (TAN), nitrite nitrogen (NO2-N), total nitrogen (TN), labile phosphate (PO4-P), and total phosphorus (TP) in the water within 6 h after feeding. The second-stage experiment was designed to detect and compare the long-term water quality of each experimental group.
The first stage of the water quality experiment was carried out on the first day of the experiment after weighing the fish. Water samples were collected at the drainage pipe of each fish tank and recorded as the control at 0 h. The fish were then fed after the sampling. Subsequent samples were taken at 0.25 h, 0.5 h, 1 h, 2 h, 4 h, and 6 h after feeding. The concentrations of TAN, NO2-N, TN, PO4-P, and TP in the water were measured, and the concentrations at 0 h were subtracted from these concentrations. The resulting values represent the relative concentration changes of TAN, NO2-N, TN, PO4-P, and TP within 6 h after feeding [37].
The second stage was from day 7 to day 56. The first seven days were spent domesticating the hybrid groupers. Every three days, water samples were collected from the drainage outlet of each fish tank 2 h after feeding for water quality assessment. The measured variables included the TAN, NO2-N, TN, PO4-P, and TP concentrations in the water [38,39].
The concentration of TAN was measured using the hypobromite oxidation method, the concentration of NO2-N was measured by naphthalene ethylenediamine spectrophotometry, the concentration of PO4-P was measured by phosphomolybdenum blue extraction spectrophotometry, and the concentrations of TN and TP were measured using the potassium persulfate oxidation method. The specific experimental operation was performed according to Chinese national standards (GB/T12763.4-2007, GB17378.4-2007).

2.5. Calculations and Statistics

2.5.1. Calculation of Growth Efficiency

Growth and feed utilization parameters were calculated as follows [35]:
Survival (%) = 100% × final survival number/initial survival number.
Grazing rate (%) = 100% × (total feeding amount − residual feed amount)/total feeding amount = 100% × total feed intake/total feeding amount
Feed coefficient ratio (FCR) = total feed intake/(final weight − initial weight).
Weight gain rate (WGR, %) = 100% × (final weight − initial weight)/initial weight.
Specific growth rate (SGR, % d−1) = 100% × [ln (final weight) − ln (initial weight)]/time.
The economic evaluation of the experimental diet was carried out by calculating the feed cost (unit = yuan) required to produce 1 kg of live-weight fish [40]. The calculation formula is as follows:
Feed cost kg−1 weight gain (FCWG, yuan·kg−1) = FCR × cost kg−1 feed.

2.5.2. Statistical Methods

SPSS software (version 26) was used to conduct one-way analysis of variance (ANOVA) for growth data and univariate ANOVA (main effects model) for water quality data. Significant differences in the groups (p ˂ 0.05) were determined using Tukey’s multiple range test. Values are presented as the mean ± STDEV (standard deviation).

3. Results

3.1. Growth Efficiency

The survival rates of all experimental groups were between 98.15 and 99.09%, and the grazing rates were between 96.71 and 98.22% (Table 2). The dietary P/E ratio and phosphorus level had no remarkable effect on survival rate or grazing rate (p > 0.05). The weight gain rate and specific growth rate of HNP (97.28 ± 1.44%, 1.21 ± 0.01%/d) were highest, and those of MNLP and MNMP were higher than LNLP and LNMP (p < 0.05). The feed coefficient of LNLP (1.17 ± 0.03) was higher than LNMP (1.02 ± 0.04), while that of LNMP was higher than MNLP (0.81 ± 0.02) and MNMP (0.80 ± 0.01) (p < 0.05). The feed coefficient of HNP was lowest (p < 0.05). The lowest feed cost per kilogram of weight gain was observed for MNLP, while HNP had the highest feed cost per kilogram of weight gain (p < 0.05).

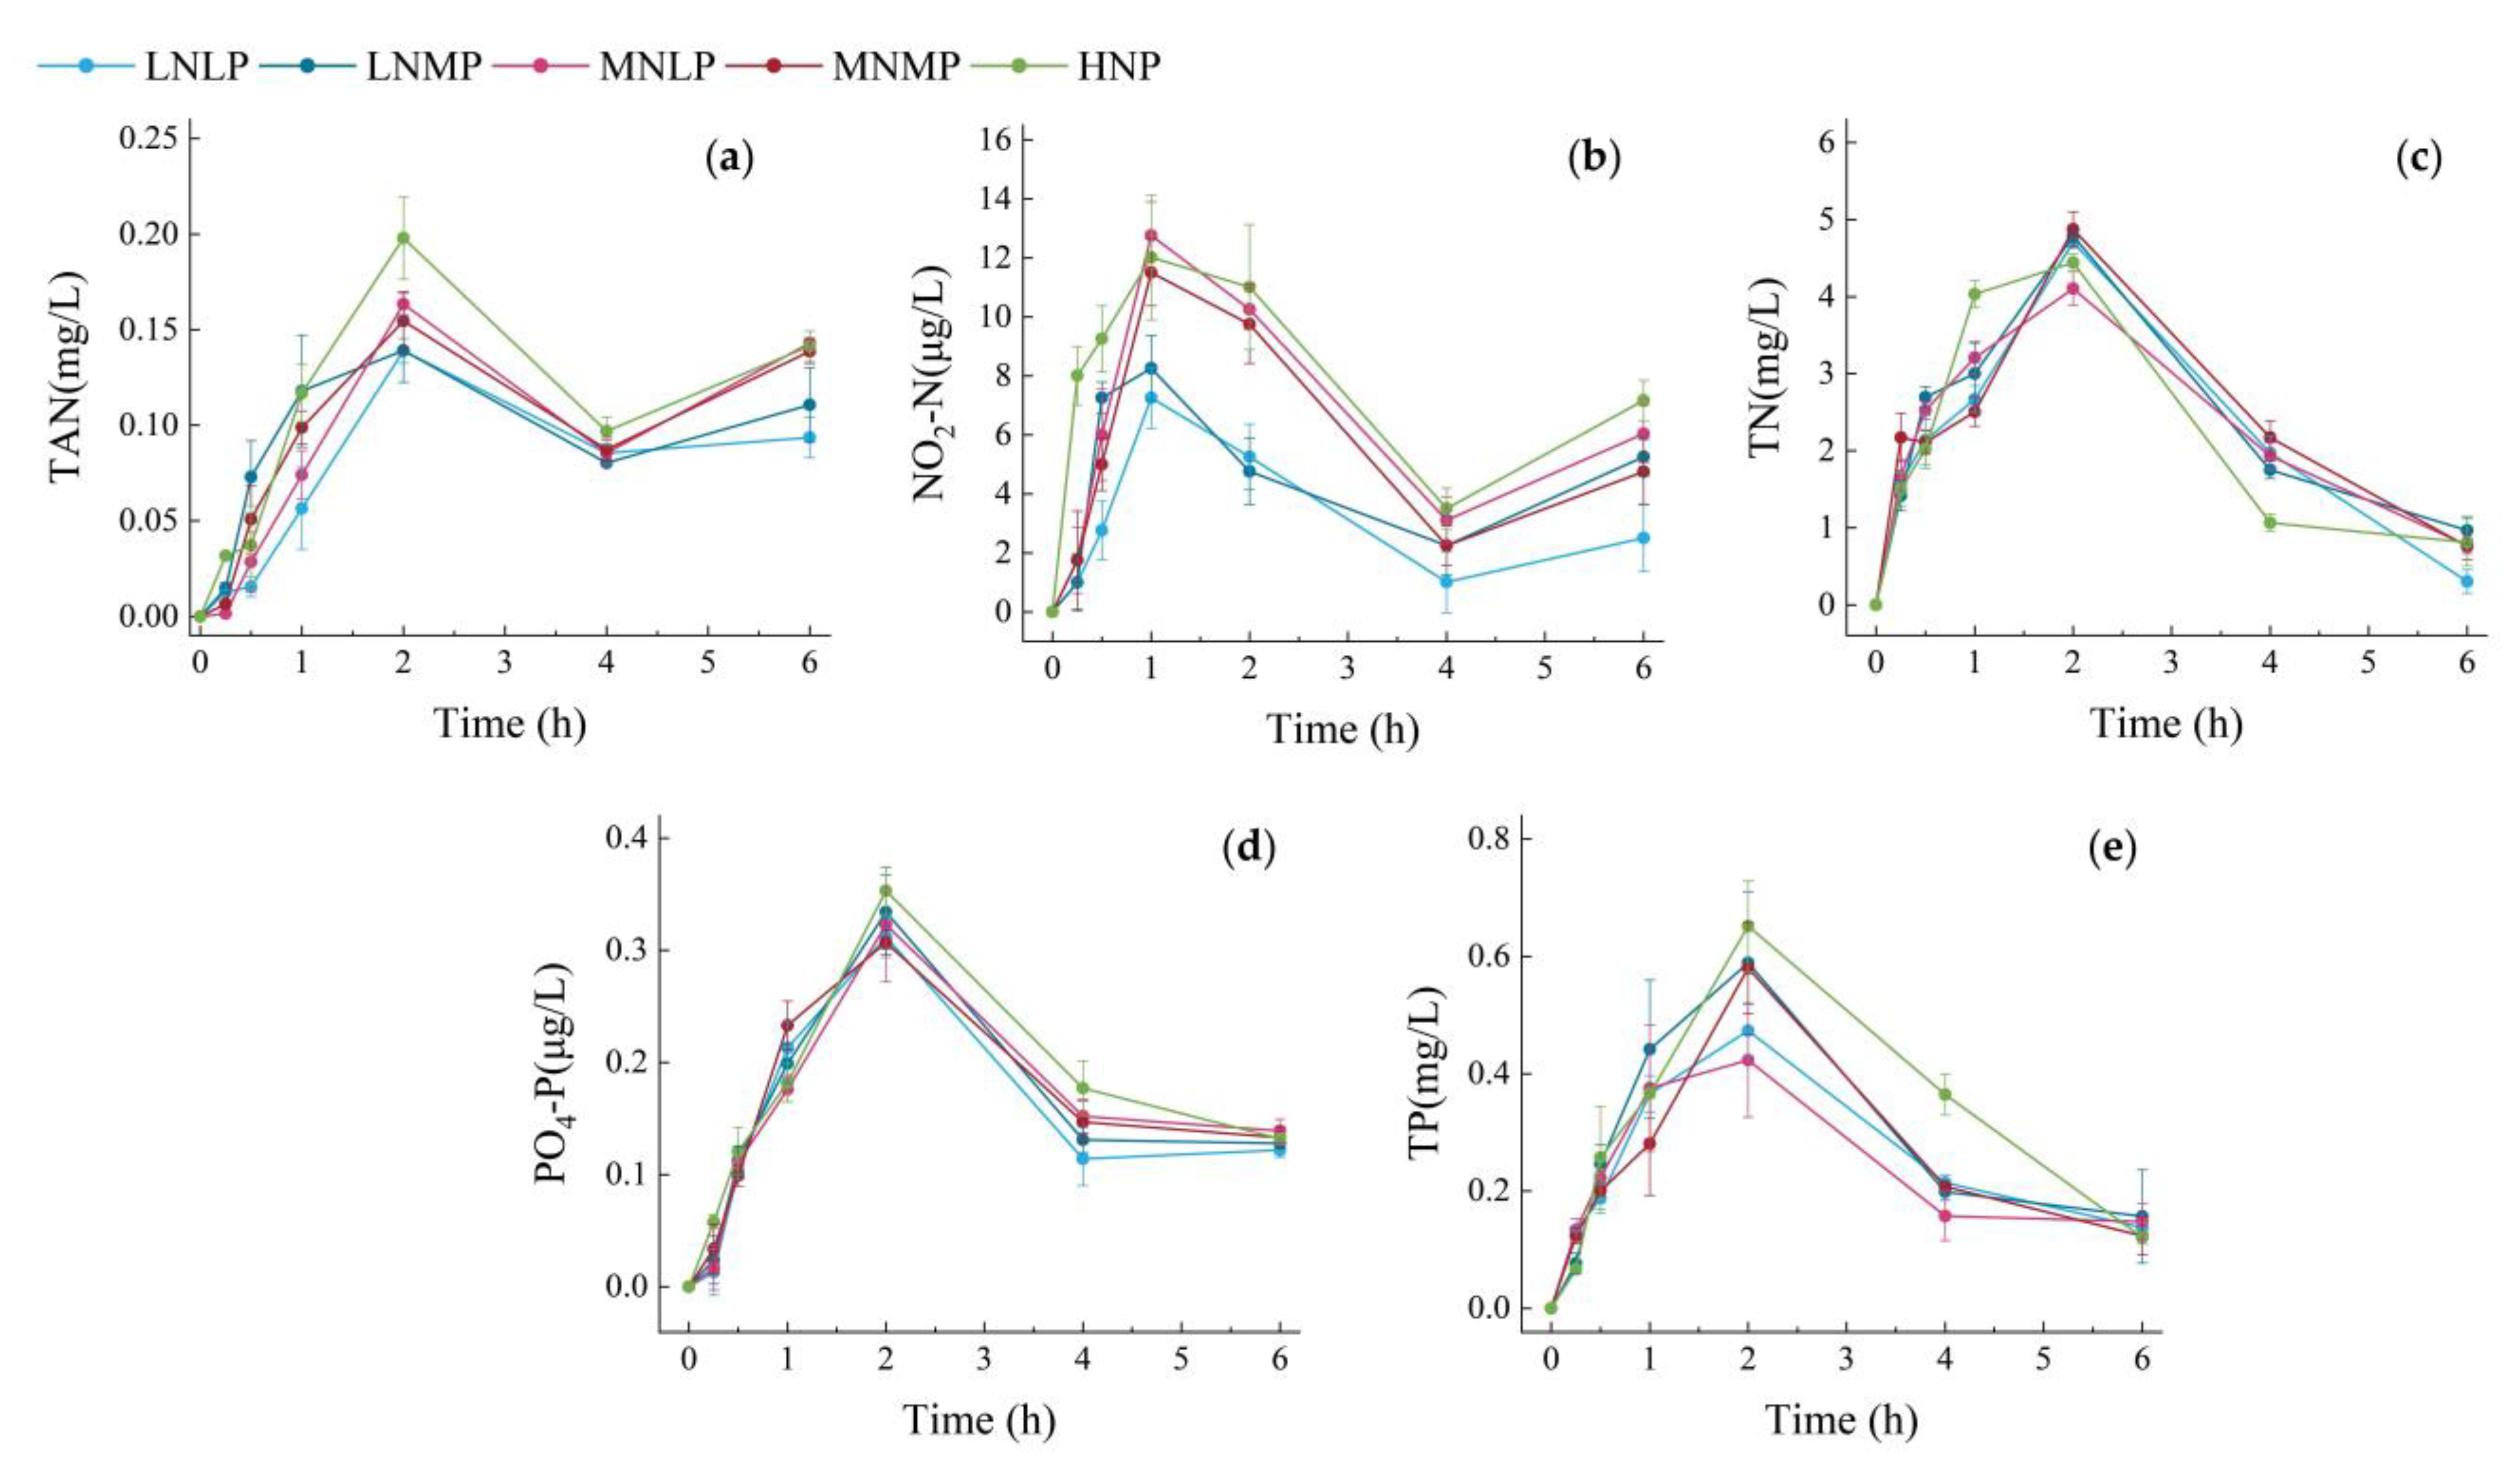
3.2. Changes in Water Nutrient Pollutants over Time within 6 h after Feeding

The trend in the relative concentrations of nutrient pollutants was roughly similar for the five experimental groups (Figure 2). The relative concentrations of TAN, TN, PO4-P, and TP reached a maximum at 2 h. NO2-N reached a maximum at 1 h and remained at a high level at 2 h. The relative maximum concentrations were TAN, 0.20 mg/L; TN, 4.87 mg/L; and TP, 0.65 mg/L. However, the relative concentrations of NO2-N and PO4-P changed little. The maximum relative concentration of NO2-N was 12.76 μg/L and that of PO4-P was 0.35 μg/L. After reaching their maximums, the relative concentrations of TAN and NO2-N increased again at 6 h, the PO4-P remained at a moderate level, TN and TP continued to decrease to a low level.

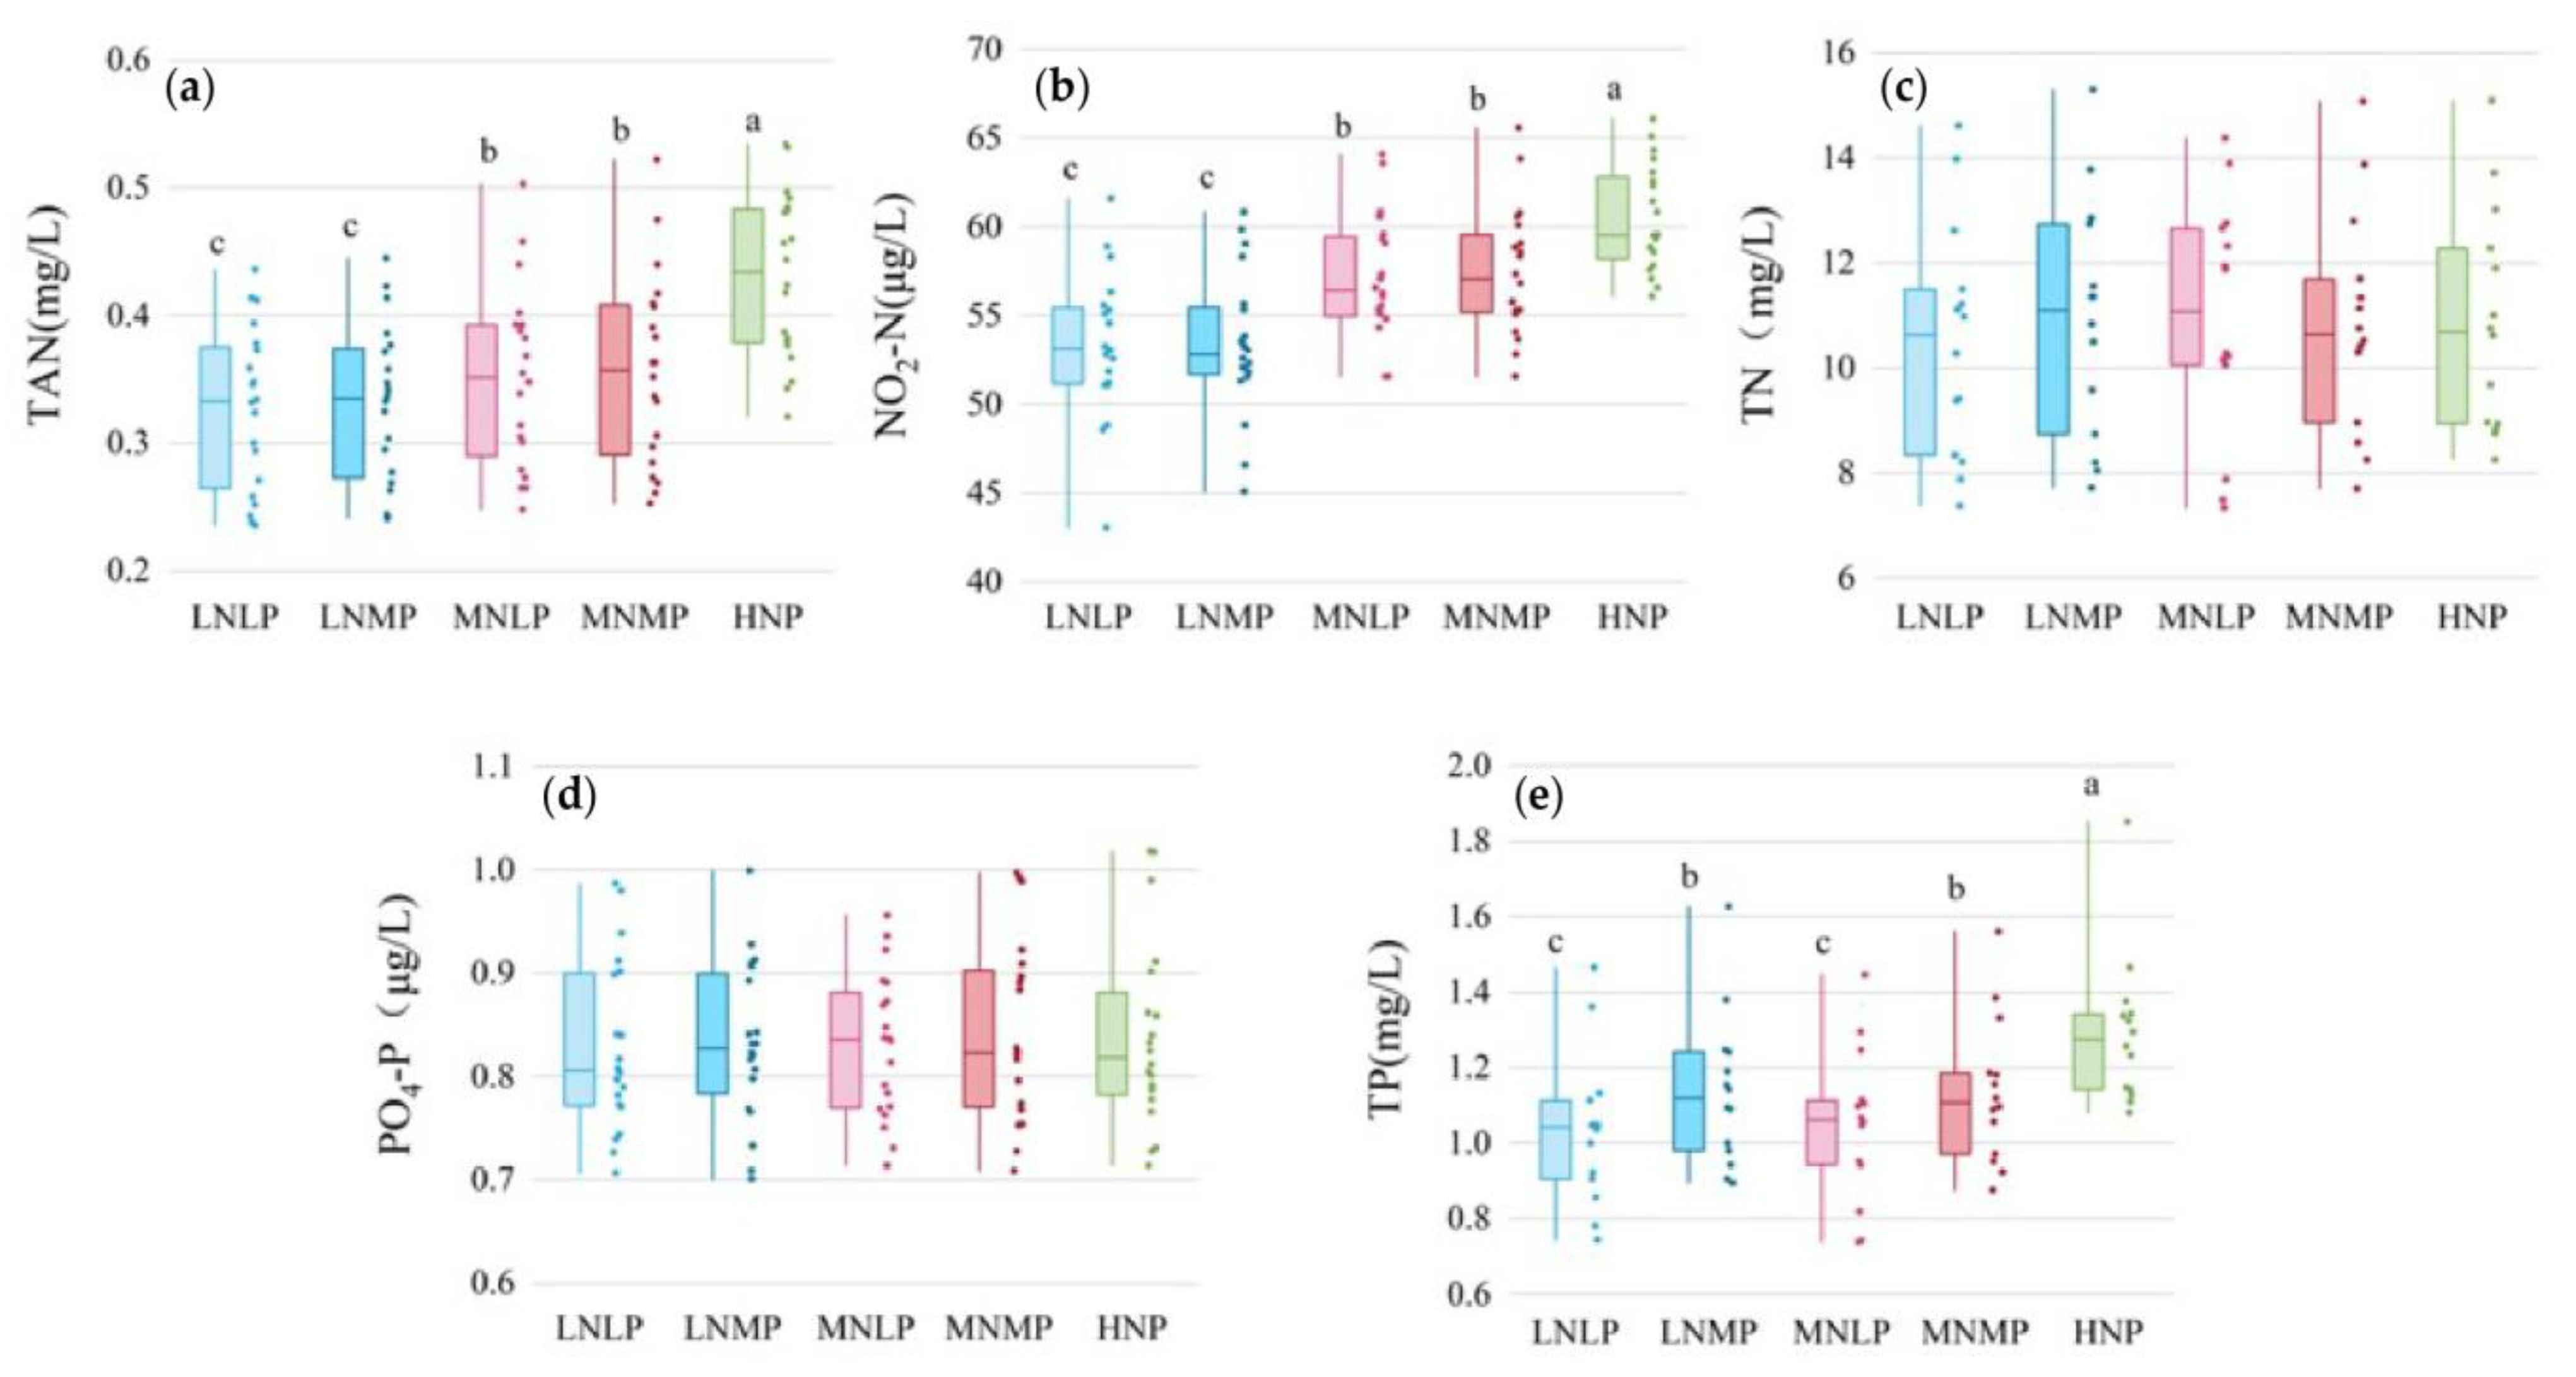
3.3. Concentrations of Nutrient Pollutants in Water during the Entire Experimental Period

Regarding nitrogen pollutants, the difference between TAN and NO2-N was significantly observed between diets with different P/E ratio levels (p < 0.05), the concentrations of TAN and NO2-N were significantly increased by increasing the dietary P/E ratio (Figure 3). It is worth noting that the TAN concentration of the HNP group was much higher than those of the other four groups (21.67~31.64%), and the TAN concentration of the HNP group was close to or exceeded the limit concentration (0.5 mg/L) for part of the time. There was no difference among the five treatments for the total nitrogen concentration (p > 0.05). For phosphorus pollutants, there was no significant difference in the concentration of labile phosphate of the water among the five groups (p > 0.05). However, significant differences in total phosphorus concentration were observed among the treatments with different dietary available phosphorus levels (p < 0.05). The total phosphorus concentration in water of LNLP and MNLP was significantly lower than that of LNMP and MNMP (p < 0.05). The total phosphorus concentration of HNP was the highest among the five treatments (p < 0.05).

4. Discussion

4.1. Growth Performance and Feed Utilization

After an 8-week feeding trial, increasing the P/E ratio in the same phosphorus level diet can bring significant growth efficiency advantages (LNLP and MNLP, LNMP and MNMP). However, weight gain rate and specific growth rate were basically at the same level among the diets with the same P/E ratio and different phosphorus levels, and only LNLP and LNMP had significant differences in feed coefficient ratio. It is well known that the increase in dietary P/E ratio can improve the growth efficiency of fish. Jiang et al. (2016) found that feed with the same fat content and high protein level could significantly improve the growth efficiency of hybrid grouper [41]. The study of Gomez-Montes et al. (2003) showed that with the same energy and different protein contents, the growth efficiency of juvenile abalone in the high P/E ratio group was significantly higher than that of the low P/E ratio group [42]. The improvement of growth efficiency with high P/E ratio feed was also proven to apply to Chinese perch, striped perch, rainbow trout, and many other species [43,44,45]. This is consistent with the results of this study. The increase in dietary phosphorus levels can also increase the growth performance of fish. However, after meeting the maximum phosphorus demand of fish, the increase in dietary phosphorus level could not continue to improve the growth efficiency, such as juvenile Pelteobagrus fulvidraco (0.90%), Lateolabrax maculatus (1.51%), and Bidyanus bidyanus (0.71%) [46,47,48]. This explained why there was no significant difference in growth efficiency among the experimental groups with the same dietary P/E ratio and different phosphorus levels. The maximum phosphorus requirement of hybrid grouper may be less than or equal to 0.96%. Although the high nutrient feed HNP had the highest WGR, SGR and the lowest FCR, the increase in feed cost resulted in the highest feed cost kg−1 weight gain (20.92 ± 0.60 yuan/kg). From the perspective of economic benefits, MNLP (13.00 ± 0.32 yuan/kg) was a better choice in RAS.

4.2. The Change of Water Quality after Feeding

In this study, the relative concentrations of TAN and NO2-N both had two peaks, the two peaks of TAN were observed at 2 h and 6 h after feeding, while the peaks of NO2-N appeared at 1 h and 6 h after feeding. These results indicated that in a 20℃ RAS, the excretion of dissolved nitrogen waste of hybrid grouper mainly began 0.5 h after feeding and reached its peak at 2 h. Parallel observations were informed in juvenile big-bellied seahorse, Hippocampus abdominalis [49]. The peak TAN excretion of big-bellied occurred at 4–6 h and 12–14 h after feeding. In comparison, the relative concentration of NO2-N reached its first peak in 0.5–1 h, which was faster than TAN, and then, remained at a high level at 1–2 h. Nitrite is an intermediate product of the nitrification reaction, in which ammonia is first converted to nitrite and nitrite is then converted to nitrate [50,51]. After feeding, the amount of ammonia nitrogen secreted by fish gradually increased, and nitrite as a byproduct of nitrification reaction also increased [9,52]. When the rate of the nitration reaction reaches its limit, the concentration of nitrite reached its maximum [5,9,53], whereas the fish are still accelerating the secretion of ammonia, and thus, the concentration of TAN continued to rise. This process may explain why the concentration of NO2-N in water reached its maximum faster than that of TAN.
According to the data in this study, the relative concentration variation trend of TN and TP after feeding was basically the same: reached a maximum value at 2 h and then, gradually decreased at a relatively uniform rate. Similarly, PO4-P began to decrease after reaching the maximum value at 2 h, but the relative concentration at 4 h and 6 h was basically at the same level. The RAS used in this study did not have the ability to remove nitrogen and phosphorus, like most of the RAS used in production [54]. TN and TP concentration control was mainly dependent on the exchange with the outside [8,54]. The daily amount of nitrogen and phosphorus waste entering RAS reached equilibrium with the amount of nitrogen and phosphorus waste contained in the water removed by water exchange (10% of the total water in the system). This meant that the concentrations of TN (7.386–15.297 mg/L) and TP (0.743–1.852 mg/L) in the system would accumulate at higher levels [9,55]. In this study, supplementary water continued to flow into the fish tank at the same rate (12 mL/s). Two hours after feeding, PO4-P, TN, and TP continued to decrease in response to water exchange. The fish continued to import PO4-P into the water through urine [26], and so, the active phosphate concentration did not decrease further after four hours. However, due to the high concentration of TN and TP, although the fish continue to excrete dissolved nitrogen and phosphorus pollutants into the water [26], their concentrations still cannot be prevented from being diluted by water exchange.

4.3. Effects of Diets with Different P/E Ratios and Phosphorus Levels on RAS Water Quality

The feed strategy of adjusting the dietary P/E ratio aimed to add nonprotein energy, reduce the consumption of amino acids, and improve the utilization rate of nitrogen. For most fish, reducing the dietary P/E ratio to 18–20 g/MJ can effectively reduce the excretion of dissolved nitrogen waste [26,42]. Based on the water quality results throughout the experimental period, the TAN concentration increased with increasing dietary P/E ratio (p < 0.05). A reduction in nitrogen excretion by high levels of dietary P/E ratio was also widely observed in other fish species such as spiny lobster [56], Litopenaeus stylirostris [57], and European sea bass [58]. In particular, the TAN concentration of HNP was significantly higher than that in other groups (21.67~31.64%). The gaps between the MN and LN groups were relatively small (6.45–9.10%). This result may be caused by the balance between the rate of ammonia secretion by fish and the rate of ammonia removal by the RAS [9]. After feeding, the fish continuously secreted ammonia nitrogen into the water, which rapidly increased the ammonia nitrogen concentration [59]. At the same time, part of the water in the tank entered the purification system, which reduced the ammonia nitrogen concentration through the biofilm reactors, and then, returned to the tank [9]. When the ammonia nitrogen discharge rate was lower than or close to the system treatment capacity, the two were in dynamic balance, and the ammonia nitrogen concentration was maintained at a stable level [60]. Therefore, there was relatively little difference in the TAN concentration between LN and MN. The reason why TAN concentration in water of HNP group was much higher than that of LN group and MN group may be that the ammonia excretion rate of fish exceeded the nitrogen-loading rates of the system.
Given that the increase in the dietary P/E ratio can significantly promote growth efficiency, the use of feed with a high P/E ratio within the RAS treatment range can improve growth efficiency and ensure that the TAN concentration is maintained at an acceptable level [26]. When the feed P/E ratio causes the excretion of ammonia nitrogen to exceed the treatment capacity of the RAS, it will cause the rapid accumulation of TAN. In this experiment, the average concentration of TAN in the HNP group was 0.431 mg/L, and the TAN concentration exceeded 0.52 mg/L twice and 0.48 mg/L six times. However, China’s national standards stipulate that the total ammonia nitrogen in culture water should not exceed 0.52 mg/L at the temperature (20 °C) and pH (8) at which this experiment was conducted [61]. This is not conducive to long-term aquaculture and restricts further improvement of the breeding density of hybrid grouper in RAS.
In this study, there was no significant difference in the concentration of labile phosphate among the five groups of feeds with three different phosphorus levels (p > 0.05). It may be that the hybrid grouper requires more phosphorus for growth, and the daily excretion of labile phosphate through urine is low. Previous research showed that the labile phosphate in water mainly comes from dissolved phosphate excreted by fish through urine [9]. When digestible phosphorus levels are below the maximum growth requirement of the fish, only trace amounts of phosphate are eliminated through urine. The maximum growth requirement of phosphorus varies from fish to fish [26]. For hybrid grouper, the regulation of feed phosphorus limited influence on the accumulation rate of labile phosphate under the RAS aquaculture mode, as the growth phosphorus requirement of hybrid grouper is high, and the daily excretion of active phosphate is very small compared with the concentration of active phosphate accumulated in the RAS.
In contrast to that of labile phosphate, the total phosphorus concentration was significantly different between groups with different levels of dietary phosphorus. The TP concentration in the aquaculture water increased with increasing dietary phosphorus levels (p < 0.05). This result is partially equivalent to that previously reported by [62], which observed that Takifugu rubripes, which has a high demand for phosphorus for growth, the increase in feed phosphorus levels would also increase the concentrations of total phosphorus in aquaculture water. It was speculated that the difference mainly came from the undigested phosphorus in the feed. In addition to dissolved labile phosphate, the total phosphorus in aquaculture water also includes undigested granular phosphorus mainly from feces and feed [63,64]. The data of this study proved that low phosphorus feed could effectively alleviate the accumulation of TP in RAS.
At present, there is little information about the effects of P/E ratio and phosphorus level of feed on RAS water purification capacity, and studies are apparently needed on this research topic.

5. Conclusions

In the RAS, the dietary P/E ratio and phosphorus level had significant effects on fish growth and concentrations of TAN, NO2-N, and TP in water. The main nutrient pollutants in water reached the maximum 2 h after feeding, and the nitrite concentration reached the maximum 1 h after feeding. Given the effects of dietary P/E ratio and phosphorus level on growth efficiency, economic benefit, and water quality, feed with an intermediate P/E ratio and low phosphorus level (such as MNLP) is more suitable for long-term use in RAS.
This study provided data support for the management of water nutrient pollutants in RAS and the application of specific feed for RAS.

Author Contributions

Conceptualization, X.F. and H.Y.; experiment, X.F.; funding acquisition, H.Y., Z.C. and Z.X.; data curation, X.F.; formal analysis, H.H.; investigation, H.C. and Y.B.; writing—original draft, X.F.; writing—review and editing, X.F., H.Y., Z.C. and H.H.; supervision, Z.C., K.Q. and H.H. All authors have read and agreed to the published version of the manuscript.

Funding

This study was supported by the National Key Research and Development Program of China (2020YFD0900603, 2019YFD0900500), Public Welfare Research Plan of Zhejiang Province “Study on the key technology of artemia cultivation using desalination brine” (LGF18D060001), and the Basic Scientific Research Business Fee Project of China Academy of Fishery Sciences (2020TD49). We are grateful to the Yellow Sea Fisheries Research Institute of the Chinese Academy of Fishery Sciences and Huanghai Aquaculture Co., Ltd. for their support with this study.

Data Availability Statement

Not applicable.

Conflicts of Interest

The authors declare no conflict of interest.

References

  1. FAO. The State of World Fisheries and Aquaculture; Food and Agriculture Organization of the United Nations: Rome, Italy, 2022. [Google Scholar]
  2. Tom, A.P.; Jayakumar, J.S.; Biju, M.; Somarajan, J.; Ibrahim, M.A. Aquaculture wastewater treatment technologies and their sustainability: A review. Energy Nexus 2021, 4, 100022. [Google Scholar] [CrossRef]
  3. Rosenthal, H.; Castell, J.D.; Chiba, K.; Forster, J.R.M.; Hilge, V.; Hogendoorn, H.; Wickins, J. Flow-Through and Recirculation Systems; EIFAC; Food & Agriculture Org.: Rome, Italy, 1986; Volume 100. [Google Scholar]
  4. Saeki, A. Studies on fish culture in the aquarium of closed-circulating system. Its fundamental theory and standard plan. Bull. Jpn. Soc. Sci. Fish. 1958, 23, 684–695. [Google Scholar] [CrossRef] [Green Version]
  5. Liu, W.; Xu, B.; Tan, H.; Zhu, S.; Luo, G.; Shitu, A.; Wan, Y. Investigating the conversion from nitrifying to denitrifying water-treatment efficiencies of the biofloc biofilter in a recirculating aquaculture system. Aquaculture 2022, 550, 737817. [Google Scholar] [CrossRef]
  6. Liu, Y.; Guo, L.; Gao, P.; Yu, D.; Yao, Z.; Gao, M.; Zhao, Y.; Jin, C.; She, Z. Thermophilic bacteria combined with alkyl polyglucose pretreated mariculture solid wastes using as denitrification carbon source for marine recirculating aquaculture wastewater treatment. Sci. Total Environ. 2021, 792, 148447. [Google Scholar] [CrossRef]
  7. Rubio-Rincon, F.J.; Lopez-Vazquez, C.M.; Welles, L.; van Loosdrecht, M.C.M.; Brdjanovic, D. Cooperation between Candidatus Competibacter and Candidatus Accumulibacter clade I, in denitrification and phosphate removal processes. Water Res. 2017, 120, 156–164. [Google Scholar] [CrossRef]
  8. Burut-Archanai, S.; Eaton-Rye, J.J.; Incharoensakdi, A.; Powtongsook, S. Phosphorus removal in a closed recirculating aquaculture system using the cyanobacterium Synechocystis sp. PCC 6803 strain lacking the SphU regulator of the Pho regulon. Biochem. Eng. J. 2013, 74, 69–75. [Google Scholar] [CrossRef]
  9. Li, H.; Cui, Z.; Cui, H.; Bai, Y.; Yin, Z.; Qu, K. Hazardous substances and their removal in recirculating aquaculture systems: A review. Aquaculture 2023, 569, 739399. [Google Scholar] [CrossRef]
  10. Luo, J.; Sun, Z.; Lu, L.; Xiong, Z.; Cui, L.; Mao, Z. Rapid expansion of coastal aquaculture ponds in Southeast Asia: Patterns, drivers and impacts. J. Environ. Manag. 2022, 315, 115100. [Google Scholar] [CrossRef]
  11. Badiola, M.; Mendiola, D.; Bostock, J. Recirculating Aquaculture Systems (RAS) analysis: Main issues on management and future challenges. Aquac. Eng. 2012, 51, 26–35. [Google Scholar] [CrossRef] [Green Version]
  12. Ministry of Agriculture and Rural Affairs. Several Opinions on Accelerating the Green Development of Aquaculture Industry. Fish. China 2019, 6, 12–13. [Google Scholar]
  13. Ahmed, N.; Turchini, G.M. Recirculating aquaculture systems (RAS): Environmental solution and climate change adaptation. J. Clean. Prod. 2021, 297, 126604. [Google Scholar] [CrossRef]
  14. Waite, R.; Beveridge, M.; Brummett, R.; Castine, S.; Chaiyawannakarn, N.; Kaushik, S.; Mungkung, R.; Nawapakpilai, S. Improving Productivity and Environmental Performance of Aquaculture; World Resources Institute: Washington, DC, USA, 2014. [Google Scholar]
  15. Fudge, M.; Higgins, V.; Vince, J.; Rajaguru, R. Social acceptability and the development of commercial RAS aquaculture. Aquaculture 2023, 568, 739295. [Google Scholar] [CrossRef]
  16. Kankainen, M.; Setälä, J.; Berrill, I.K.; Ruohonen, K.; Noble, C.; Schneider, O. How to measure the economic impacts of changes in growth, feed efficiency and survival in aquaculture. Aquac. Econ. Manag. 2012, 16, 341–364. [Google Scholar] [CrossRef]
  17. Gutierrez-Wing, M.T.; Malone, R.F. Biological filters in aquaculture: Trends and research directions for freshwater and marine applications. Aquac. Eng. 2006, 34, 163–171. [Google Scholar] [CrossRef]
  18. Yang, L.; Chou, L.S.; Shieh, W.K. Biofilter treatment of aquaculture water for reuse applications. Water Res. 2001, 35, 3097–3108. [Google Scholar] [CrossRef]
  19. Costigan, E.M.; Oehler, M.A.; MacRae, J.D. Phosphorus recovery from recirculating aquaculture systems: Adsorption kinetics and mechanism. J. Water Process Eng. 2022, 49, 102992. [Google Scholar] [CrossRef]
  20. Mortula, M.M.; Gagnon, G.A. Alum residuals as a low technology for phosphorus removal from aquaculture processing water. Aquac. Eng. 2007, 36, 233–238. [Google Scholar] [CrossRef]
  21. Jin, J.; Chu, Z.; Ruan, R.; Liu, W.; Chen, X.; Li, C. Phosphorus Absorption and Excretion in Hybrid Sturgeon (Huso dauricus ♀ × Acipenser schrenckii ♂) Intubated with Different Ca/P Ratios. Fishes 2022, 7, 138. [Google Scholar] [CrossRef]
  22. Tórz, A.; Burda, M.; Półgęsek, M.; Sadowski, J.; Nędzarek, A. Transformation of phosphorus in an experimental integrated multitrophic aquaculture system using the media filled beds method in plant cultivation. Aquac. Environ. Interact. 2022, 14, 1–14. [Google Scholar] [CrossRef]
  23. Kong, W.; Huang, S.; Yang, Z.; Shi, F.; Feng, Y.; Khatoon, Z. Fish feed quality is a key factor in impacting aquaculture water environment: Evidence from incubator experiments. Sci. Rep. 2020, 10, 187. [Google Scholar] [CrossRef] [Green Version]
  24. Green, J.A.; Hardy, R.W. The effects of dietary protein: Energy ratio and amino acid pattern on nitrogen utilization and excretion of rainbow trout Oncorhynchus mykiss (Walbaum). J. Fish Biol. 2008, 73, 663–682. [Google Scholar] [CrossRef]
  25. Kaushik, S.J. Nutritional strategies for the reduction of aquaculture wastes. In FOID’ 94, Proceedings of the Third International Conference on Fisheries and Ocean Industrial Development for Productivity Enhancement of the Coastal Waters; National Fisheries University of Pusan: Pusan, Korea, 3-4 June 1994; pp. 115–132. [Google Scholar]
  26. Cho, C.Y.; Bureau, D.P. A review of diet formulation strategies and feeding systems to reduce excretory and feed wastes in aquaculture. Aquac. Res. 2001, 32, 349–360. [Google Scholar] [CrossRef]
  27. Basto-Silva, C.; Enes, P.; Oliva-Teles, A.; Capilla, E.; Guerreiro, I. Dietary protein/carbohydrate ratio and feeding frequency affect feed utilization, intermediary metabolism, and economic efficiency of gilthead seabream (Sparus aurata) juveniles. Aquaculture 2022, 554, 738182. [Google Scholar] [CrossRef]
  28. Thirunavukkarasar, R.; Kumar, P.; Sardar, P.; Sahu, N.P.; Harikrishna, V.; Singha, K.P.; Shamna, N.; Jacob, J.; Krishna, G. Protein-sparing effect of dietary lipid: Changes in growth, nutrient utilization, digestion and IGF-I and IGFBP-I expression of Genetically Improved Farmed Tilapia (GIFT), reared in Inland Ground Saline Water. Anim. Feed. Sci. Technol. 2022, 284, 115150. [Google Scholar] [CrossRef]
  29. Dalsgaard, J.; Ekmann, K.S.; Pedersen, P.B.; Verlhac, V. Effect of supplemented fungal phytase on performance and phosphorus availability by phosphorus-depleted juvenile rainbow trout (Oncorhynchus mykiss), and on the magnitude and composition of phosphorus waste output. Aquaculture 2009, 286, 105–112. [Google Scholar] [CrossRef]
  30. Othman, A.R.; Kawamura; Senoo; Fui, F.C. Effects of different salinities on growth, feeding performance and plasma cortisol level in hybrid TGGG (tiger grouper, Epinephelus fuscoguttatus × giant grouper, Epinephelus lanceolatus) juveniles. Int. Res. J. Biol. Sci. 2015, 4, 15–20. [Google Scholar]
  31. Zhang, Z.; Yang, Z.; Ding, N.; Xiong, W.; Zheng, G.; Lin, Q.; Zhang, G. Effects of temperature on the survival, feeding, and growth of pearl gentian grouper (female Epinephelus fuscoguttatus × male Epinephelus lanceolatus). Fish. Sci. 2018, 84, 399–404. [Google Scholar] [CrossRef]
  32. Jiang, S.; Wu, X.; Li, W.; Wu, M.; Luo, Y.; Lu, S.; Lin, H. Effects of dietary protein and lipid levels on growth, feed utilization, body and plasma biochemical compositions of hybrid grouper (Epinephelus lanceolatus ♂ × Epinephelus fuscoguttatus ♀) juveniles. Aquaculture 2015, 446, 148–155. [Google Scholar] [CrossRef]
  33. Tan, X.; Sun, Z.; Liu, Q.; Ye, H.; Zou, C.; Ye, C.; Wang, A.; Lin, H. Effects of dietary ginkgo biloba leaf extract on growth performance, plasma biochemical parameters, fish composition, immune responses, liver histology, and immune and apoptosis-related genes expression of hybrid grouper (Epinephelus lanceolatus ♂ x Epinephelus fuscoguttatus ♀) fed high lipid diets. Fish Shellfish Immunol. 2018, 72, 399–409. [Google Scholar] [CrossRef]
  34. Gillis, M.B.; Norris, L.C.; Heuser, G.F. Studies on the Biological Value of Inorganic Phosphates: One Figure. J. Nutr. 1954, 52, 115–125. [Google Scholar] [CrossRef]
  35. Saleh, N.E.; Wassef, E.A.; Kamel, M.A.; El-Haroun, E.R.; El-Tahan, R.A. Beneficial effects of soybean lecithin and vitamin C combination in fingerlings gilthead seabream (Sparus aurata) diets on; fish performance, oxidation status and genes expression responses. Aquaculture 2022, 546, 737345. [Google Scholar] [CrossRef]
  36. Ye, H.; Zhou, Y.; Su, N.; Wang, A.; Tan, X.; Sun, Z.; Ye, C. Effects of replacing fish meal with rendered animal protein blend on growth performance, hepatic steatosis and immune status in hybrid grouper (Epinephelus fuscoguttatus ♀ × Epinephelus lanceolatus ♂). Aquaculture 2019, 511, 734203. [Google Scholar] [CrossRef]
  37. Wang, H.; Li, Y.; Cheng, K.; Xia, S.; Wang, M.; Sun, G. The feature and rule of change of growth and feed intake of Cynoglossus semilaevis and water quality in industrial culture with recirculation aquaculture system. J. Hydroecology 2009, 30, 52–59. [Google Scholar] [CrossRef]
  38. Puigagut, J.; Angles, H.; Chazarenc, F.; Comeau, Y. Decreasing phosphorus discharge in fish farm ponds by treating the sludge generated with sludge drying beds. Aquaculture 2011, 318, 7–14. [Google Scholar] [CrossRef]
  39. Li, C.; Zhang, B.; Luo, P.; Shi, H.; Li, L.; Gao, Y.; Wu, W.M. Performance of a pilot-scale aquaponics system using hydroponics and immobilized biofilm treatment for water quality control. J. Clean. Prod. 2019, 208, 274–284. [Google Scholar] [CrossRef]
  40. Khalil, H.S.; Mansour, A.T.; Goda, A.M.A.; Omar, E.A. Effect of selenium yeast supplementation on growth performance, feed utilization, lipid profile, liver and intestine histological changes, and economic benefit in meagre, Argyrosomus regius, fingerlings. Aquaculture 2019, 501, 135–143. [Google Scholar] [CrossRef]
  41. Jiang, S.; Wu, X.; Luo, Y.; Wu, M.; Lu, S.; Jin, Z.; Yao, W. Optimal dietary protein level and protein to energy ratio for hybrid grouper (Epinephelus fuscoguttatus ♀ × Epinephelus lanceolatus ♂) juveniles. Aquaculture 2016, 465, 28–36. [Google Scholar] [CrossRef]
  42. Gómez-Montes, L.; García-Esquivel, Z.; D’Abramo, L.R.; Shimada, A.; Vásquez-Peláez, C.; Viana, M.T. Effect of dietary protein: Energy ratio on intake, growth and metabolism of juvenile green abalone Haliotis fulgens. Aquaculture 2003, 220, 769–780. [Google Scholar] [CrossRef]
  43. Ahmed, I.; Ahmad, I. Effect of dietary protein levels on growth performance, hematological profile and biochemical composition of fingerlings rainbow trout, Oncorhynchus mykiss reared in Indian himalayan region. Aquac. Rep. 2020, 16, 100268. [Google Scholar] [CrossRef]
  44. Alam, M.S.; Liang, X.; Liu, L. Indirect effect of different dietary protein to energy ratio of bait fish mori diets on growth performance, body composition, nitrogen metabolism and relative AMPK & mTOR pathway gene expression of Chinese perch. Aquac. Rep. 2020, 16, 100276. [Google Scholar] [CrossRef]
  45. Woods, L.C., III; Yust, D.; McLeod, C.; Subramanyam, M. Effects of dietary protein: Energy ratio on weight gain, body composition, serum glucose and triglyceride levels, and liver function of striped bass. Water Sci. Technol. 1995, 31, 195–203. [Google Scholar] [CrossRef]
  46. Zhang, J.; Zhang, S.; Lu, K.; Wang, L.; Song, K.; Li, X.; Zhang, C.; Rahimnejad, S. Effects of dietary phosphorus level on growth, body composition, liver histology and lipid metabolism of spotted seabass (Lateolabrax maculatus) reared in freshwater. Aquac. Fish. 2022, 8, 528–537. [Google Scholar] [CrossRef]
  47. Luo, Z.; Tan, X.Y.; Liu, X.; Wang, W.M. Dietary total phosphorus requirement of juvenile yellow catfish Pelteobagrus fulvidraco. Aquac. Int. 2010, 18, 897–908. [Google Scholar] [CrossRef]
  48. Yang, S.; Lin, T.; Liu, F.; Liou, C. Influence of dietary phosphorus levels on growth, metabolic response and body composition of juvenile silver perch (Bidyanus bidyanus). Aquaculture 2006, 253, 592–601. [Google Scholar] [CrossRef]
  49. Wilson, Z.; Carter, C.G.; Purser, G.J. Nitrogen budgets for juvenile big-bellied seahorse Hippocampus abdominalis fed Artemia, mysids or pelleted feeds. Aquaculture 2006, 255, 233–241. [Google Scholar] [CrossRef]
  50. Preena, P.G.; Rejish Kumar, V.J.; Singh, I.S.B. Nitrification and denitrification in recirculating aquaculture systems: The processes and players. Rev. Aquac. 2021, 13, 2053–2075. [Google Scholar] [CrossRef]
  51. Sahariah, B.P.; Chakraborty, S. Kinetic analysis of phenol, thiocyanate and ammonia-nitrogen removals in an anaerobic-anoxic-aerobic moving bed bioreactor system. J. Hazard. Mater. 2011, 190, 260–267. [Google Scholar] [CrossRef]
  52. Lu, J.; Zhang, Y.; Wu, J.; Wang, J. Nitrogen removal in recirculating aquaculture water with high dissolved oxygen conditions using the simultaneous partial nitrification, anammox and denitrification system. Bioresour. Technol. 2020, 305, 123037. [Google Scholar] [CrossRef]
  53. Krumins, V.; Ebeling, J.; Wheaton, F. Part-day ozonation for nitrogen and organic carbon control in recirculating aquaculture systems. Aquac. Eng. 2001, 24, 231–241. [Google Scholar] [CrossRef]
  54. Van Rijn, J.; Tal, Y.; Schreier, H.J. Denitrification in recirculating systems: Theory and applications. Aquac. Eng. 2006, 34, 364–376. [Google Scholar] [CrossRef]
  55. Yoram, B.; Eddie, C.; Iliya, G.; Michael, K.; van Rijn, J. Phosphorus removal in a marine prototype, recirculating aquaculture system. Aquaculture 2003, 220, 313–326. [Google Scholar] [CrossRef]
  56. Wang, S.; Carter, C.G.; Fitzgibbon, Q.P.; Codabaccus, B.M.; Smith, G.G. Effect of dietary protein on energy metabolism including protein synthesis in the spiny lobster Sagmariasus verreauxi. Sci. Rep. 2021, 11, 11814. [Google Scholar] [CrossRef] [PubMed]
  57. Gauquelin, F.; Cuzon, G.; Gaxiola, G.; Rosas, C.; Arena, L.; Bureau, D.P.; Cochard, J.C. Effect of dietary protein level on growth and energy utilization by Litopenaeus stylirostris under laboratory conditions. Aquaculture 2007, 271, 439–448. [Google Scholar] [CrossRef] [Green Version]
  58. Peres, H.; Oliva-Teles, A. Effect of dietary protein and lipid level on metabolic utilization of diets by European sea bass (Dicentrarchus labrax) juveniles. Fish Physiol. Biochem. 2001, 25, 269. [Google Scholar] [CrossRef]
  59. Yadata, G.W.; Ji, K.; Liang, H.; Ren, M.; Ge, X.; Yang, Q. Effects of dietary protein levels with various stocking density on growth performance, whole body composition, plasma parameters, nitrogen emission and gene expression related to TOR signaling of juvenile blunt snout bream (Megalobrama ambylcephala). Aquaculture 2020, 519, 734730. [Google Scholar] [CrossRef]
  60. Ramli, N.M.; Verreth, J.A.J.; Yusoff, F.M.; Nurulhuda, K.; Nagao, N.; Verdegem, M.C. Integration of algae to improve nitrogenous waste management in recirculating aquaculture systems: A review. Front. Bioeng. Biotechnol. 2020, 8, 1004. [Google Scholar] [CrossRef]
  61. GB 11607-89; Water Quality Standard for Fisheries. China National Standardization Management Committee: Beijing, China, 1990.
  62. Xu, H.; Zhang, X.; Wei, Y.; Sun, B.; Jia, L.; Liang, M. Effects of dietary phosphorus level and stocking density on tiger puffer Takifugu rubripes: Growth performance, body composition, lipid metabolism, deposition of phosphorus and calcium, serum biochemical parameters, and phosphorus excretion. Aquaculture 2020, 529, 735709. [Google Scholar] [CrossRef]
  63. Jaxion-Harm, J. Effects of dietary phospholipids on early stage Atlantic Salmon (Salmo salar) performance: A comparison among phospholipid sources. Aquaculture 2021, 544, 737055. [Google Scholar] [CrossRef]
  64. Sugiura, S.H.; Hardy, R.W. Environmentally-friendly feeds. In Encyclopedia of Aquaculture; Stickney, R.R., Ed.; John Wiley & Sons, Inc.: New York, NJ, USA, 2000; pp. 299–310. [Google Scholar]
Figure 1. Schematic diagram of the RAS used in this study. Sampling locations are marked with stars.
Water 15 01261 g001
Figure 2. Time variations in water quality parameters within 6 h after feeding. (a) Total ammonia nitrogen, (b) nitrite nitrogen, (c) total nitrogen, (d) labile phosphate, and (e) total phosphorus.
Water 15 01261 g002
Figure 3. Boxplots for the water quality parameters of the five experimental groups within 8 weeks. (a) Total ammonia nitrogen, (b) nitrite nitrogen, (c) total nitrogen, (d) labile phosphate, and (e) total phosphorus. To eliminate the interference caused by periodic fluctuation of the purification efficiency of the biological filter, the experimental group and time were used as fixed factors, and the effect of feed on water quality parameters was studied using univariate ANOVA (main effects model) and a Tukey’s test. The different lowercase letters in the same picture represent significant differences at p ˂ 0.05. The absence of letters indicates no significant difference between treatments.
Water 15 01261 g003
Table 1. Composition of the experimental feeds.
Feed
LNLPLNMPMNLPMNMPHNP
Main component
Fish meal
Shrimp meal
Squid meal
Soybean meal
Fish oil
Flour
Minerals
Vitamins
Proximate Composition
Crude Protein %49.7750.3153.1252.9958.40
Crude Fat %12.8212.719.59.499.52
Total Phosphorus %1.481.981.512.022.43
Available Phosphorus %0.961.540.981.581.97
Crude Fiber %0.910.591.521.900.88
Moisture %6.826.816.576.816.36
Crude Ash %10.4212.5712.8015.9216.31
Metabolic Energy MJ/kg15.0015.0414.5614.4814.06
P/E g/MJ31.9732.1136.2636.5341.54
Feed cost yuan/kg13.5017.0015.518.0029.00
Notes: LNLP indicates low P/E and low phosphorus feed; LNMP indicates low P/E and middle phosphorus feed; MNLP indicates middle P/E and low phosphorus feed; MNMP indicates middle P/E and middle phosphorus feed; HNP indicates high P/E and high phosphorus feed. The “√” mark in the table indicates the component is present.
Table 2. Growth performance and feed utilization efficiency of hybrid grouper (E. fuscoguttatus ♀ × E. lanceolatus ♂) fed experimental diets for 8 weeks.
GroupsSurvival %GR %IW gFW gFCRWGR %SGR % d−1FCWG yuan kg−1
LNLP98.15 ± 1.3298.22 ± 0.81105.13 ± 20.04165.87 ± 36.26 d1.17 ± 0.03 a57.78 ± 1.34 c0.81 ± 0.02 c16.07 ± 0.35 c
LNMP98.83 ± 0.7197.23 ± 0.92112.40 ± 20.16180.80 ± 45.01 c1.02 ± 0.04 b60.93 ± 3.98 c0.85 ± 0.04 c17.91 ± 0.70 b
MNLP98.81 ± 0.6096.71 ± 1.08110.70 ± 18.88194.03 ± 30.50 b0.81 ± 0.02 c77.00 ± 4.24 b1.02 ± 0.04 b13.00 ± 0.32 e
MNMP98.31 ± 0.8497.85 ± 0.76109.30 ± 18.03197.23 ± 36.38 b0.80 ± 0.01 c80.46 ± 1.59 b1.05 ± 0.02 b14.65 ± 0.24 d
HNP99.09 ± 0.9297.58 ± 0.39105.20 ± 15.08207.53 ± 20.38 a0.70 ± 0.02 d97.28 ± 1.44 a1.21 ± 0.01 a20.92 ± 0.60 a
Notes: Values are the mean of three replicates ± STDEV (standard deviation). The different lowercase letters in a row represent significant differences at p ˂ 0.05. Means with the same letters or an absence of letters indicate no significant difference between treatments. GR, grazing rate; IW, initial weight; FW, final weight; FCR, feed coefficient ratio; WGR, weight gain rate; SGR, specific growth rate; FCWG, feed cost kg−1 weight gain.
Disclaimer/Publisher’s Note: The statements, opinions and data contained in all publications are solely those of the individual author(s) and contributor(s) and not of MDPI and/or the editor(s). MDPI and/or the editor(s) disclaim responsibility for any injury to people or property resulting from any ideas, methods, instructions or products referred to in the content.

