Article

Spatial and Multivariate Statistical Analyses of Human Health Risk Associated with the Consumption of Heavy Metals in Groundwater of Monterrey Metropolitan Area, Mexico

by
Edrick Ramos
1,*,†,
Raja Karim Bux
2,3,†,
Dora Ileana Medina
4,*,
Héctor Barrios-Piña
1 and
Jürgen Mahlknecht
1
1
Tecnologico de Monterrey, School of Science and Engineering, Campus Monterrey, Monterrey 64849, Mexico
2
Tecnologico de Monterrey, School of Science and Engineering, Campus Estado de México, Atizapan de Zaragoza 52926, Mexico
3
National Centre of Excellence in Analytical Chemistry, University of Sindh, Jamshoro 76080, Pakistan
4
Tecnologico de Monterrey, Institute of Advanced Materials for Sustainable Manufacturing, Monterrey 64849, Mexico
*
Authors to whom correspondence should be addressed.
These authors contributed equally to this work and designated as co-first authors.
Water 2023, 15(6), 1243; https://doi.org/10.3390/w15061243
Submission received: 15 February 2023 / Revised: 9 March 2023 / Accepted: 14 March 2023 / Published: 22 March 2023
(This article belongs to the Topic Health Risk Assessment of the Trace and Macro Elements)

Abstract

:
Groundwater is the main source of drinking water supply in most urban environments around the world. The content of potentially toxic elements is increasing in many groundwater systems owing to inadequate groundwater recharge, aquifer overexploitation, natural source release, or various anthropogenic activities that lead to groundwater quality degradation. The ingestion of groundwater contaminated with potentially toxic elements has been reported to have harmful health effects. This study aimed to assess the presence of several potentially toxic elements (Al, As, B, Cr, Cu, Fe, Mn, and Zn) in groundwater of the Monterrey metropolitan area in Northern Mexico and the carcinogenic and noncarcinogenic human health risks associated with exposure. Multivariate statistics and geospatial analysis were applied to identify the causative determinants that modify the groundwater quality along the metropolitan area. Mean concentrations of trace metals remained below drinking water standards and World Health Organization guidelines. The risk of harmful effects on human health due to ingestion of all eight metal(loid)s in groundwater was assessed as 2.52 × 10⁻² for adults and 2.16 × 10⁻² for children, which can be considered as negligible chronic risk and a very low cancer risk. However, the risks of oral consumption of Cr being carcinogenic to children and adults were 7.9 × 10⁻³ and 9.2 × 10⁻⁴, respectively. As these values exceeded the target risk of 1 × 10⁻⁴, it can thus be considered “unacceptable”.

1. Introduction

Groundwater plays an important role globally because it aids in welfare, economic development, agricultural production, and industrial manufacture in almost every country [1]. Therefore, ensuring a steady supply of high-quality water is crucial for promoting societal wellbeing, achieving environmental sustainability, and improving economic growth in urban environments. Urban groundwater flow systems and all critical city elements have recently become major sources of concern in arid and semiarid regions, where groundwater is typically a valuable water source [2]. Groundwater requires special attention because of the environmental pollution caused by inappropriate wastewater disposal in urban environments [3,4,5]. A significant problem is the lack of proper disposal of heavy metals, which pose a serious threat to the environment and human health if found present beyond acceptable limits [6,7,8]. Elevated social and economic costs are drawn from groundwater degradation due to metal pollutants. Their low removal ratios make them extremely persistent when they percolate into aquifers [9,10].
Since 2000, research into potentially toxic elements (PTEs) contamination in groundwater have been led by China and the United States as main contributors of the topic [11]. Numerous researchers have developed and applied heavy metal risk assessment indices to assess the potential hazards of these contaminants in groundwater resources [12,13,14,15]. PTEs may increase in groundwater systems owing to inadequate groundwater recharge, aquifer overexploitation, natural source release (water–rock interactions, mineral leaching, etc.), or various anthropogenic activities that lead to groundwater quality degradation (e.g., agriculture, industry, mining, and wastewater runoff and seepage) [16,17]. Although some metals, such as Cr, Cu, and Fe, serve as micronutrients to preserve human health, they can also be toxic if ingested in concentrations that exceed acceptable levels. Nevertheless, exposure to high concentrations of these metals does not necessarily result in toxicity in the body; rather, heavy metal accretion occurs over time in body tissues, reaching toxic levels that are above the acceptable limits. Therefore, environmental researchers have primarily focused on using groundwater to perform human health risk assessments, because it is the main source of drinking water supply in most urban environments around the world [1,18].
Cause–effect dynamics of groundwater quality have been assessed for PTE pollution in Mexico [19,20]. Groundwater quality has deteriorated because of contaminant infiltration in urban areas driven by intensive extraction and poor wastewater management, and these contaminants include detectable concentrations of As, B, Ba, Cu, F, Fe, Li, Mn, Sr, and Zn as well as high concentrations of SO42−, Ca2+, and Mg2+. Exposure to these contaminants has been associated with the induction of oxidative stress, which causes direct DNA damage in the human body [21]. Arsenic enters groundwater through the following routes: (1) the natural route, where water–rock interactions result in ion exchange and the dissolution of minerals that contain As; (2) the anthropogenic route, which involves mining activities, industrial wastes, and agrochemical wastes [22,23]. Geogenic contamination of shallow groundwater from arsenic involves the leaching of As from As-rich rocks and sediments in alluvial aquifers originating from tectonic events [24,25,26,27]. In addition, the quantity of As released from minerals into groundwater depends on the mineral types, pH, redox conditions, and other potential ions that enhance As desorption from secondary minerals (such as clays and Fe oxyhydroxides) [28,29]. Other processes such as hydrochemical dissolution of Fe-rich sediments and aqueous complexation from carbonates have been reported as factors of As release and mobility in groundwater [7,30]. PTEs, including As, Cd, Cr, and Pb, can cause short-term memory loss, learning disabilities, coordination issues, an increased risk of cardiovascular disease, various cancer types, and gastrointestinal, renal, respiratory, pulmonary, reproductive, and hematological damages; they can also cause death in the worst case [31,32,33]. Therefore, periodical monitoring of PTE concentrations is required to determine their sources and assess their potential risks [27].
It is vital for decision makers to comprehend the hydrogeochemistry of their area for ensuring access to clean and safe water by its population and safeguarding their groundwater reservoirs [34,35,36,37]. Thus, scientists from all over the world have combined field data collection, geostatistics, and health risk assessments to determine the spatial distribution, temporal patterns, and potential health effects of heavy metals in urban aquifers [38,39,40]. The use of bivariate analysis, principal component analysis (PCA), and hierarchical cluster analysis (HCA) in conjunction with geographic information systems (GISs) has been pragmatic in analyzing and determining the impact of natural and anthropogenic constraints on heavy metal concentrations in groundwater [41,42,43,44].
The area of Monterrey Metropolitan Area (MMA), the second-largest city in Mexico (5.3 million inhabitants), has grown from 65,000 ha in 2009 to 177,000 ha in 2021 (172%) [45]. This means that agricultural lands have been converted into residential, commercial, and industrial plots. It is vital to evaluate how historical pollution effects may represent a risk of harm to current inhabitants given changes in land use practices and population redistribution. This study aimed to assess the carcinogenic and noncarcinogenic human health risks associated with exposure to metal(loid)s in groundwater used for consumption. Spatial and multivariate assessment tools were used to quantify and approximately identify harmful environmental risk sources and risk agents of health consequences caused by PTE exposure in urban environments. The findings of this study may assist local environmental and water authorities in modifying pollution regulations, evaluating metal recovery, and revising the groundwater management plan in place.

2. Materials and Methods

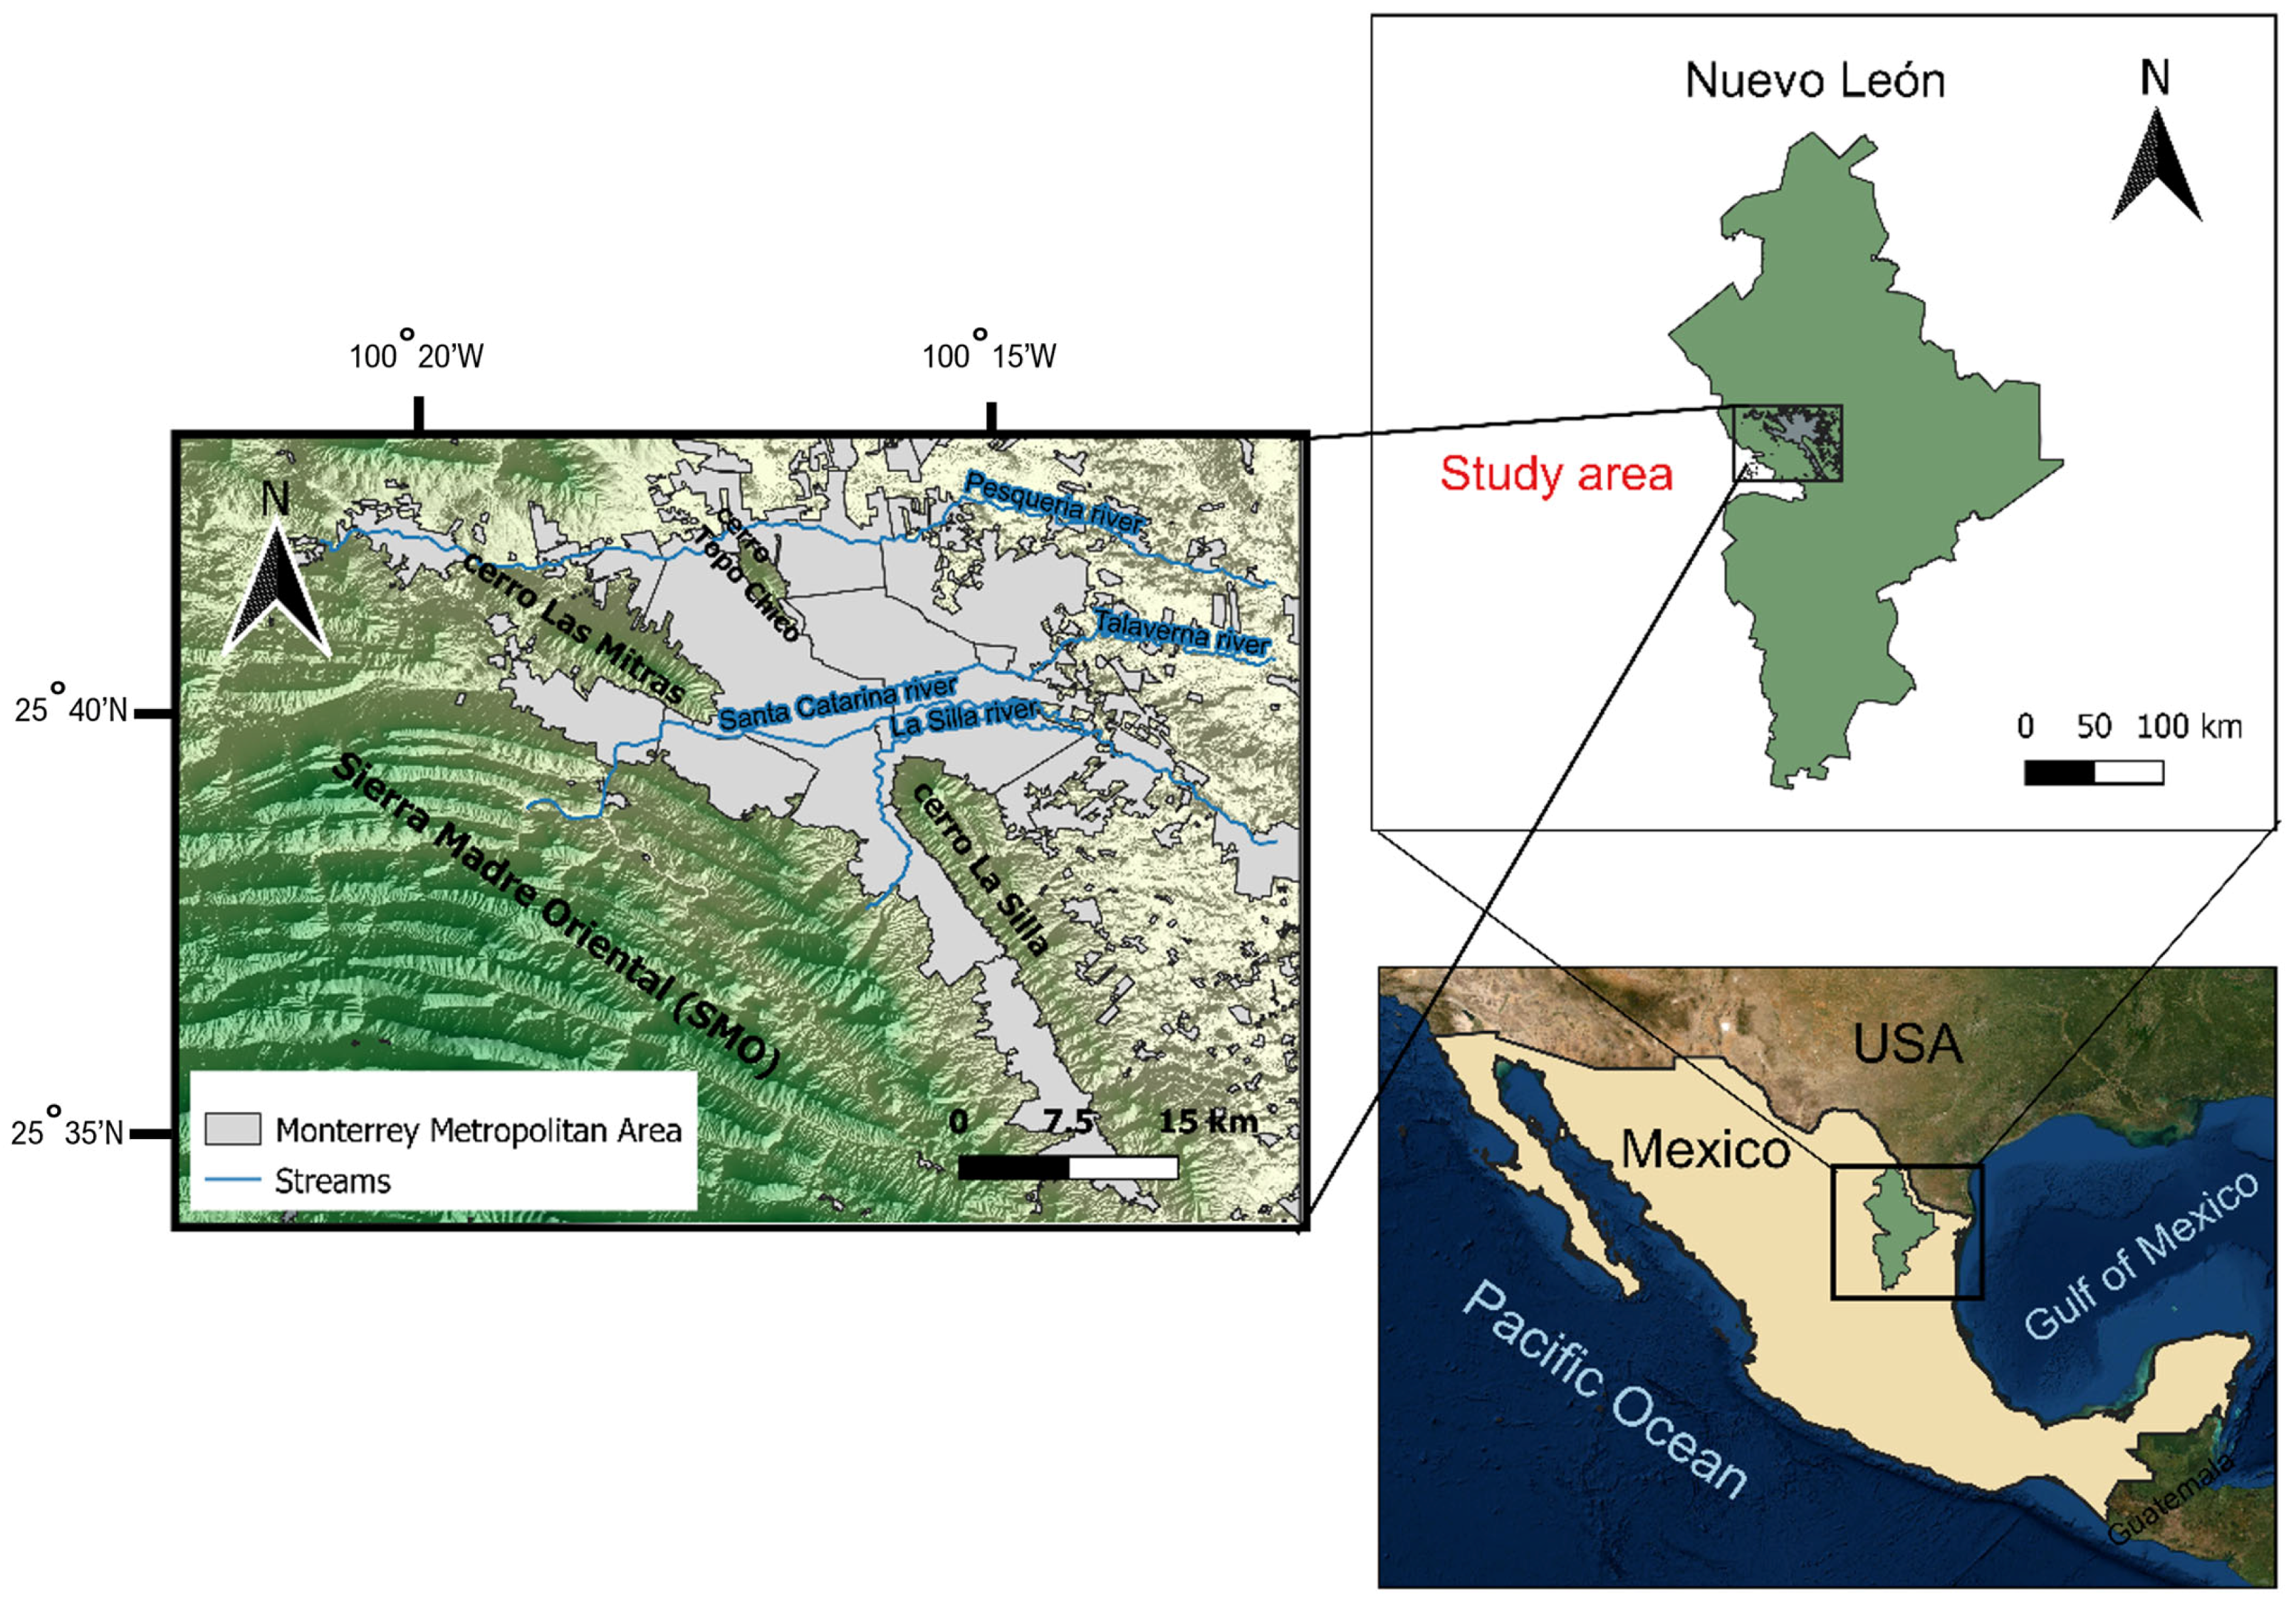
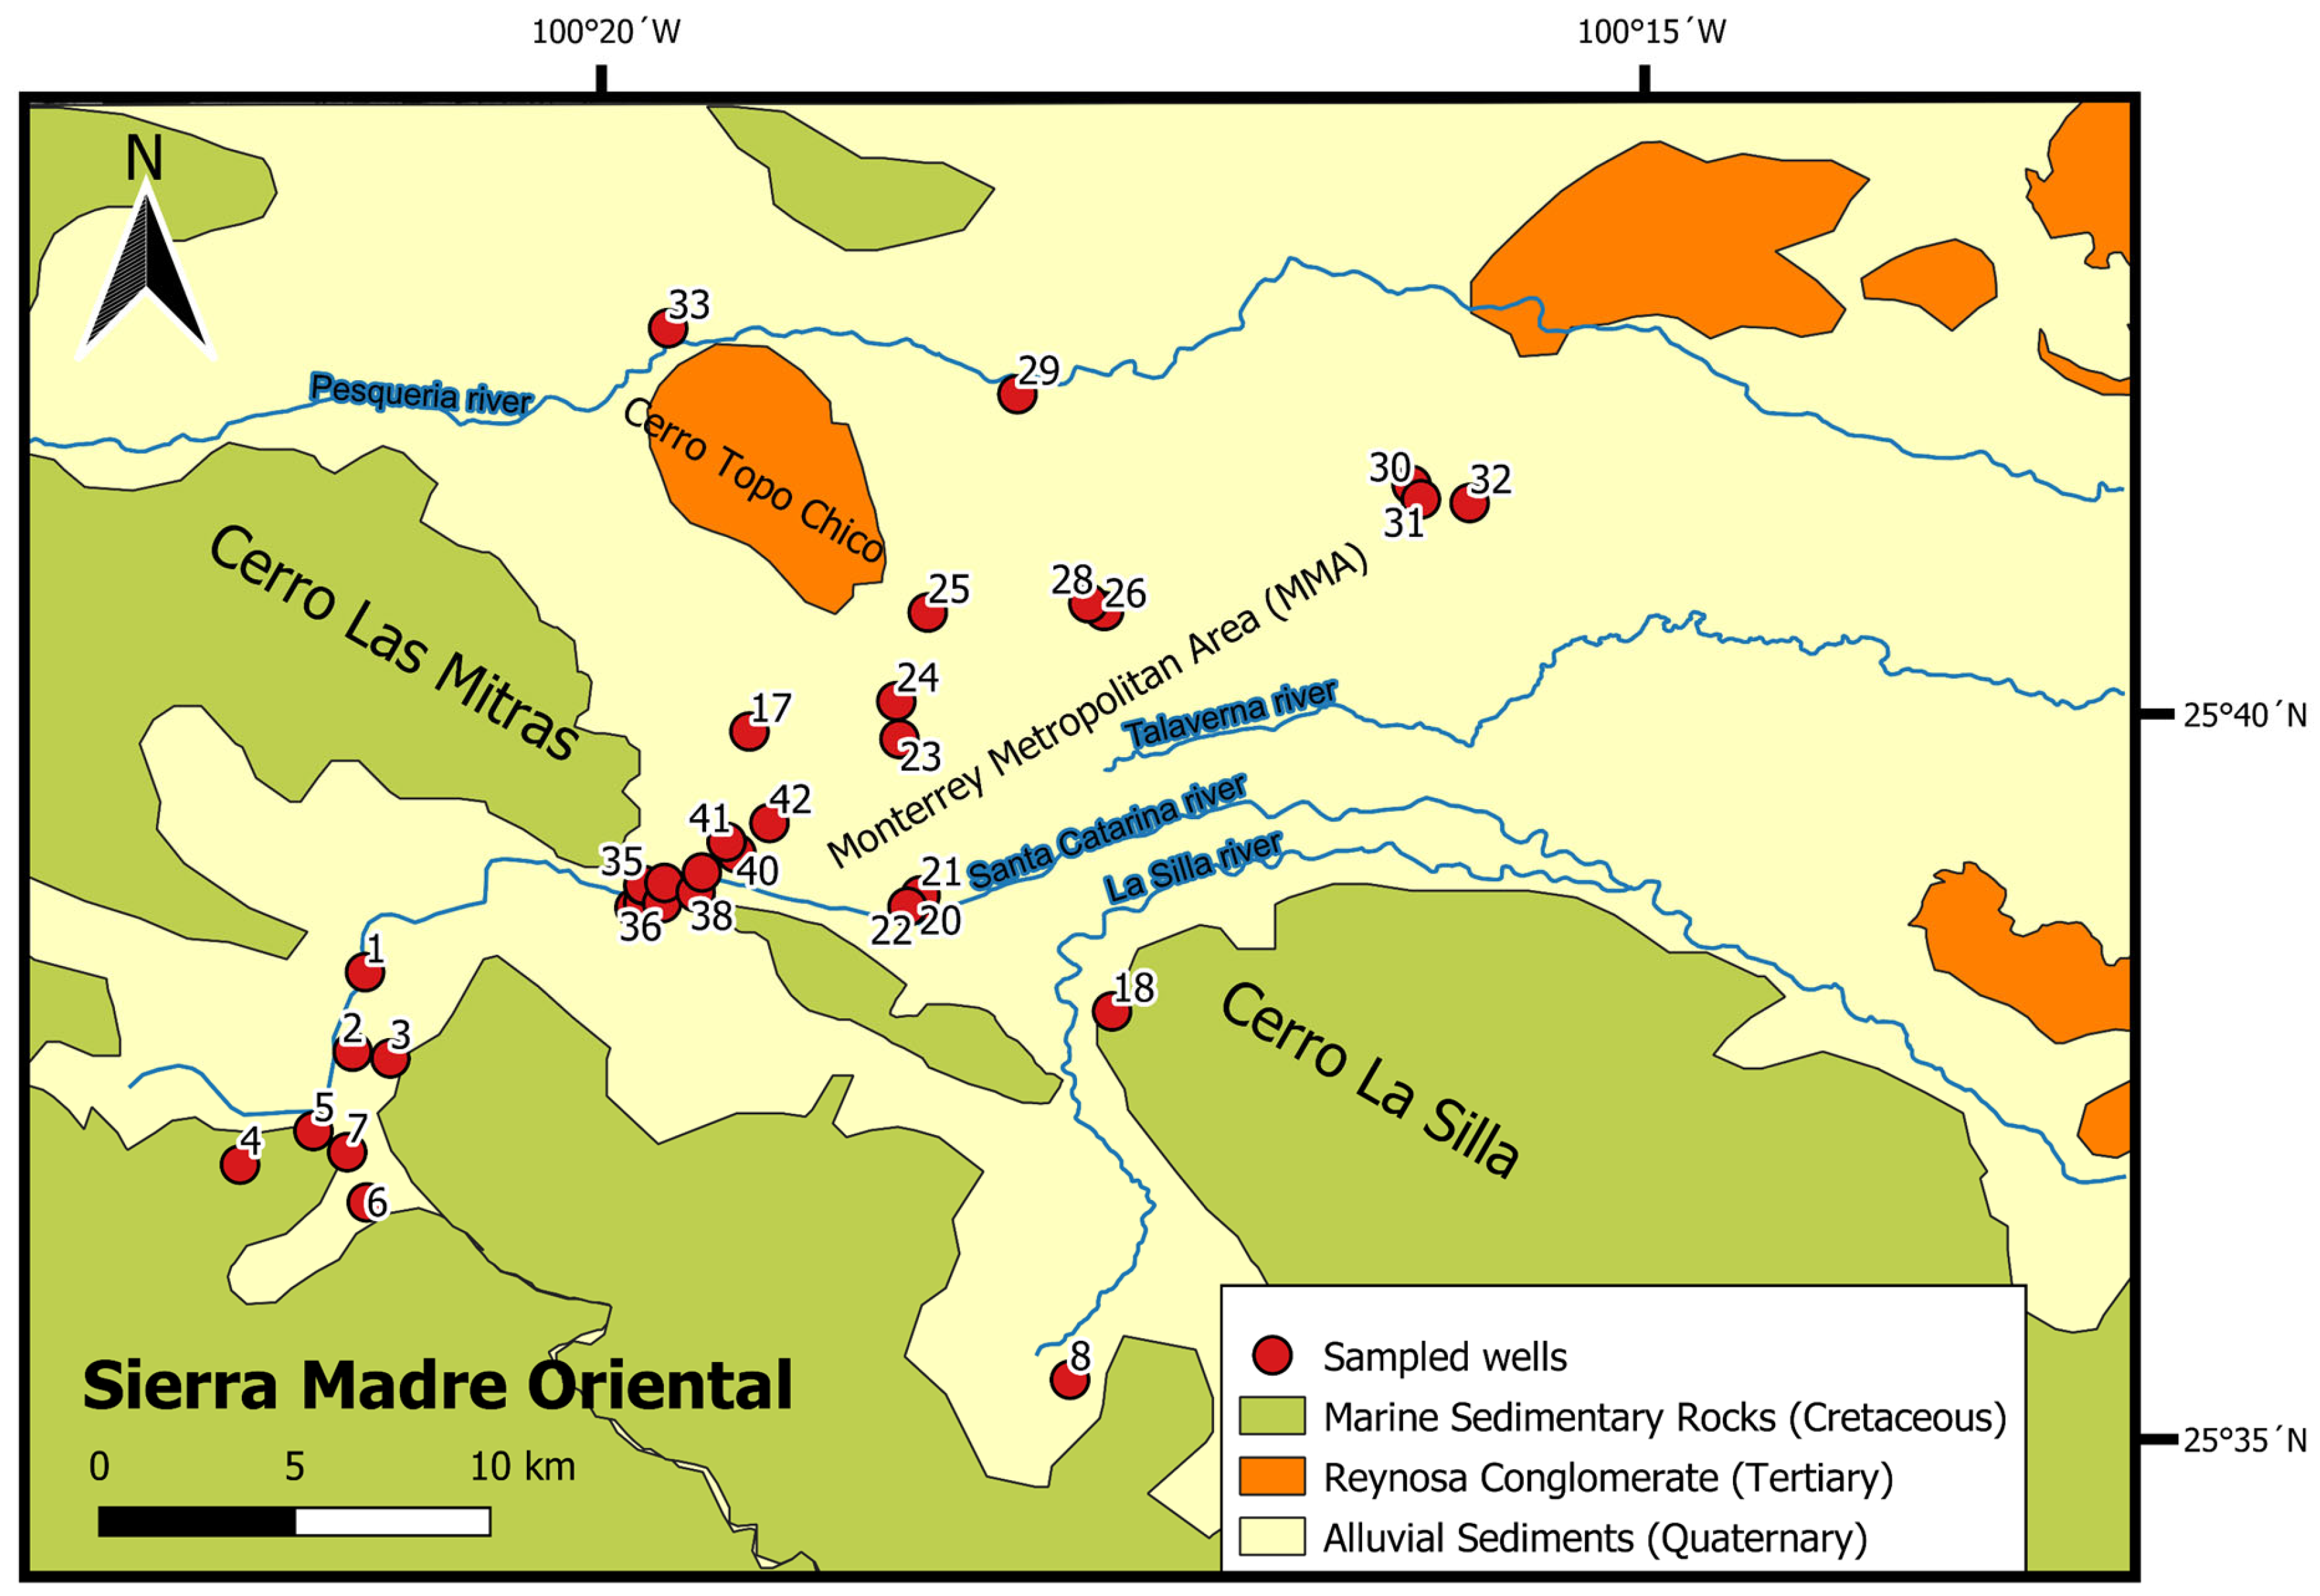
2.1. Study Area and Regional Geology

The study area included the urban and peri-urban areas of the MMA in Nuevo Leon state in Northeastern Mexico (Figure 1). The city is surrounded by several hills and iconic mountains, including La Silla (southeast), Las Mitras (west), and Topo Chico (northwest), with elevations ranging from 260 to 3000 m above sea level. It consists of 13 municipalities, making it the second most populated city in Mexico (5.3 million inhabitants) and one of the metropolitan areas with the highest economic growth rates [46]. The climate is semiarid with a mean annual precipitation and temperature of 622 mm and 22.7 °C, respectively [47].
Historically, between 40 and 60% of urban water supply for MMA has been provided by groundwater sources, consisting of several well fields or aquifers [48,49]. The main aquifers referred in this study are Buenos Aires wellfield (BA), the Santiago system (SA), and the Monterrey Metropolitan zone (MZ). The geology of the study area is described along the Sierra Madre Oriental as a mixture of limestone, conglomerates, and shales that governs the BA and SA aquifers [50,51].
The area under study (Figure 2) borders on the south-southwest by the Sierra Madre Oriental (SMO). Previous studies have identified a 2–3 km thick sedimentary belt that contains a mix of carbonates, shales, evaporites, and siliciclastic rocks dating from the Mesozoic to Cenozoic [48]. The lower Cretaceous units consist of alternate limestone-dolomite with flint lenses. In addition, Pb-Zn lenticular structure ore veins on fault-confined irregular bodies and dissolution caverns associated with hydrothermal solutions along faults have been identified in confining rock formations from the lower Cretaceous [50]. The Cu on these units is associated with calcareous breccias and karst cavities. The corresponding mineralogy for these sequences is galena, sphalerite, oxides, calcite, pyrite, chalcopyrite, magnetite, goethite, and clay minerals [50]. The Buenos Aires wellfield is an area mainly composed by clastic marine sedimentary rocks; thus, it is considered a semi-confined aquifer related to these Mesozoic geological sequences and is located by the foothills (between 700 and 1000 masl) of the SMO. The MMA lies in the mountain front of the SMO where limestones and shales from the Upper Cretaceous outcrop as sedimentary rocks along the valley borders. Layers of gypsum with a mixture of iron ores are interlayered with silty-limestone and lutites with bentonitic horizons [50]. Conglomerates of calcareous fragments in a sand matrix from the Tertiary (Reynosa fm) are identified along the Cerro Topo Chico and other areas along the northeast section of the MMA. The aquifer governing the MZ is in the valley along the central section of the region consisting mainly of shales around the border of the valley with fluvial and alluvial sediments dominating the valley’s subsurface [48,52]. The origin of these sediments concurs with deposition during accumulation and erosion cyclic changes depositing sediments along the channels and riverbeds of the Catarina and la Silla rivers [48]. As a result, this shallow aquifer is constituted by gravelly sand, sand, silt, and alluvial sediments.

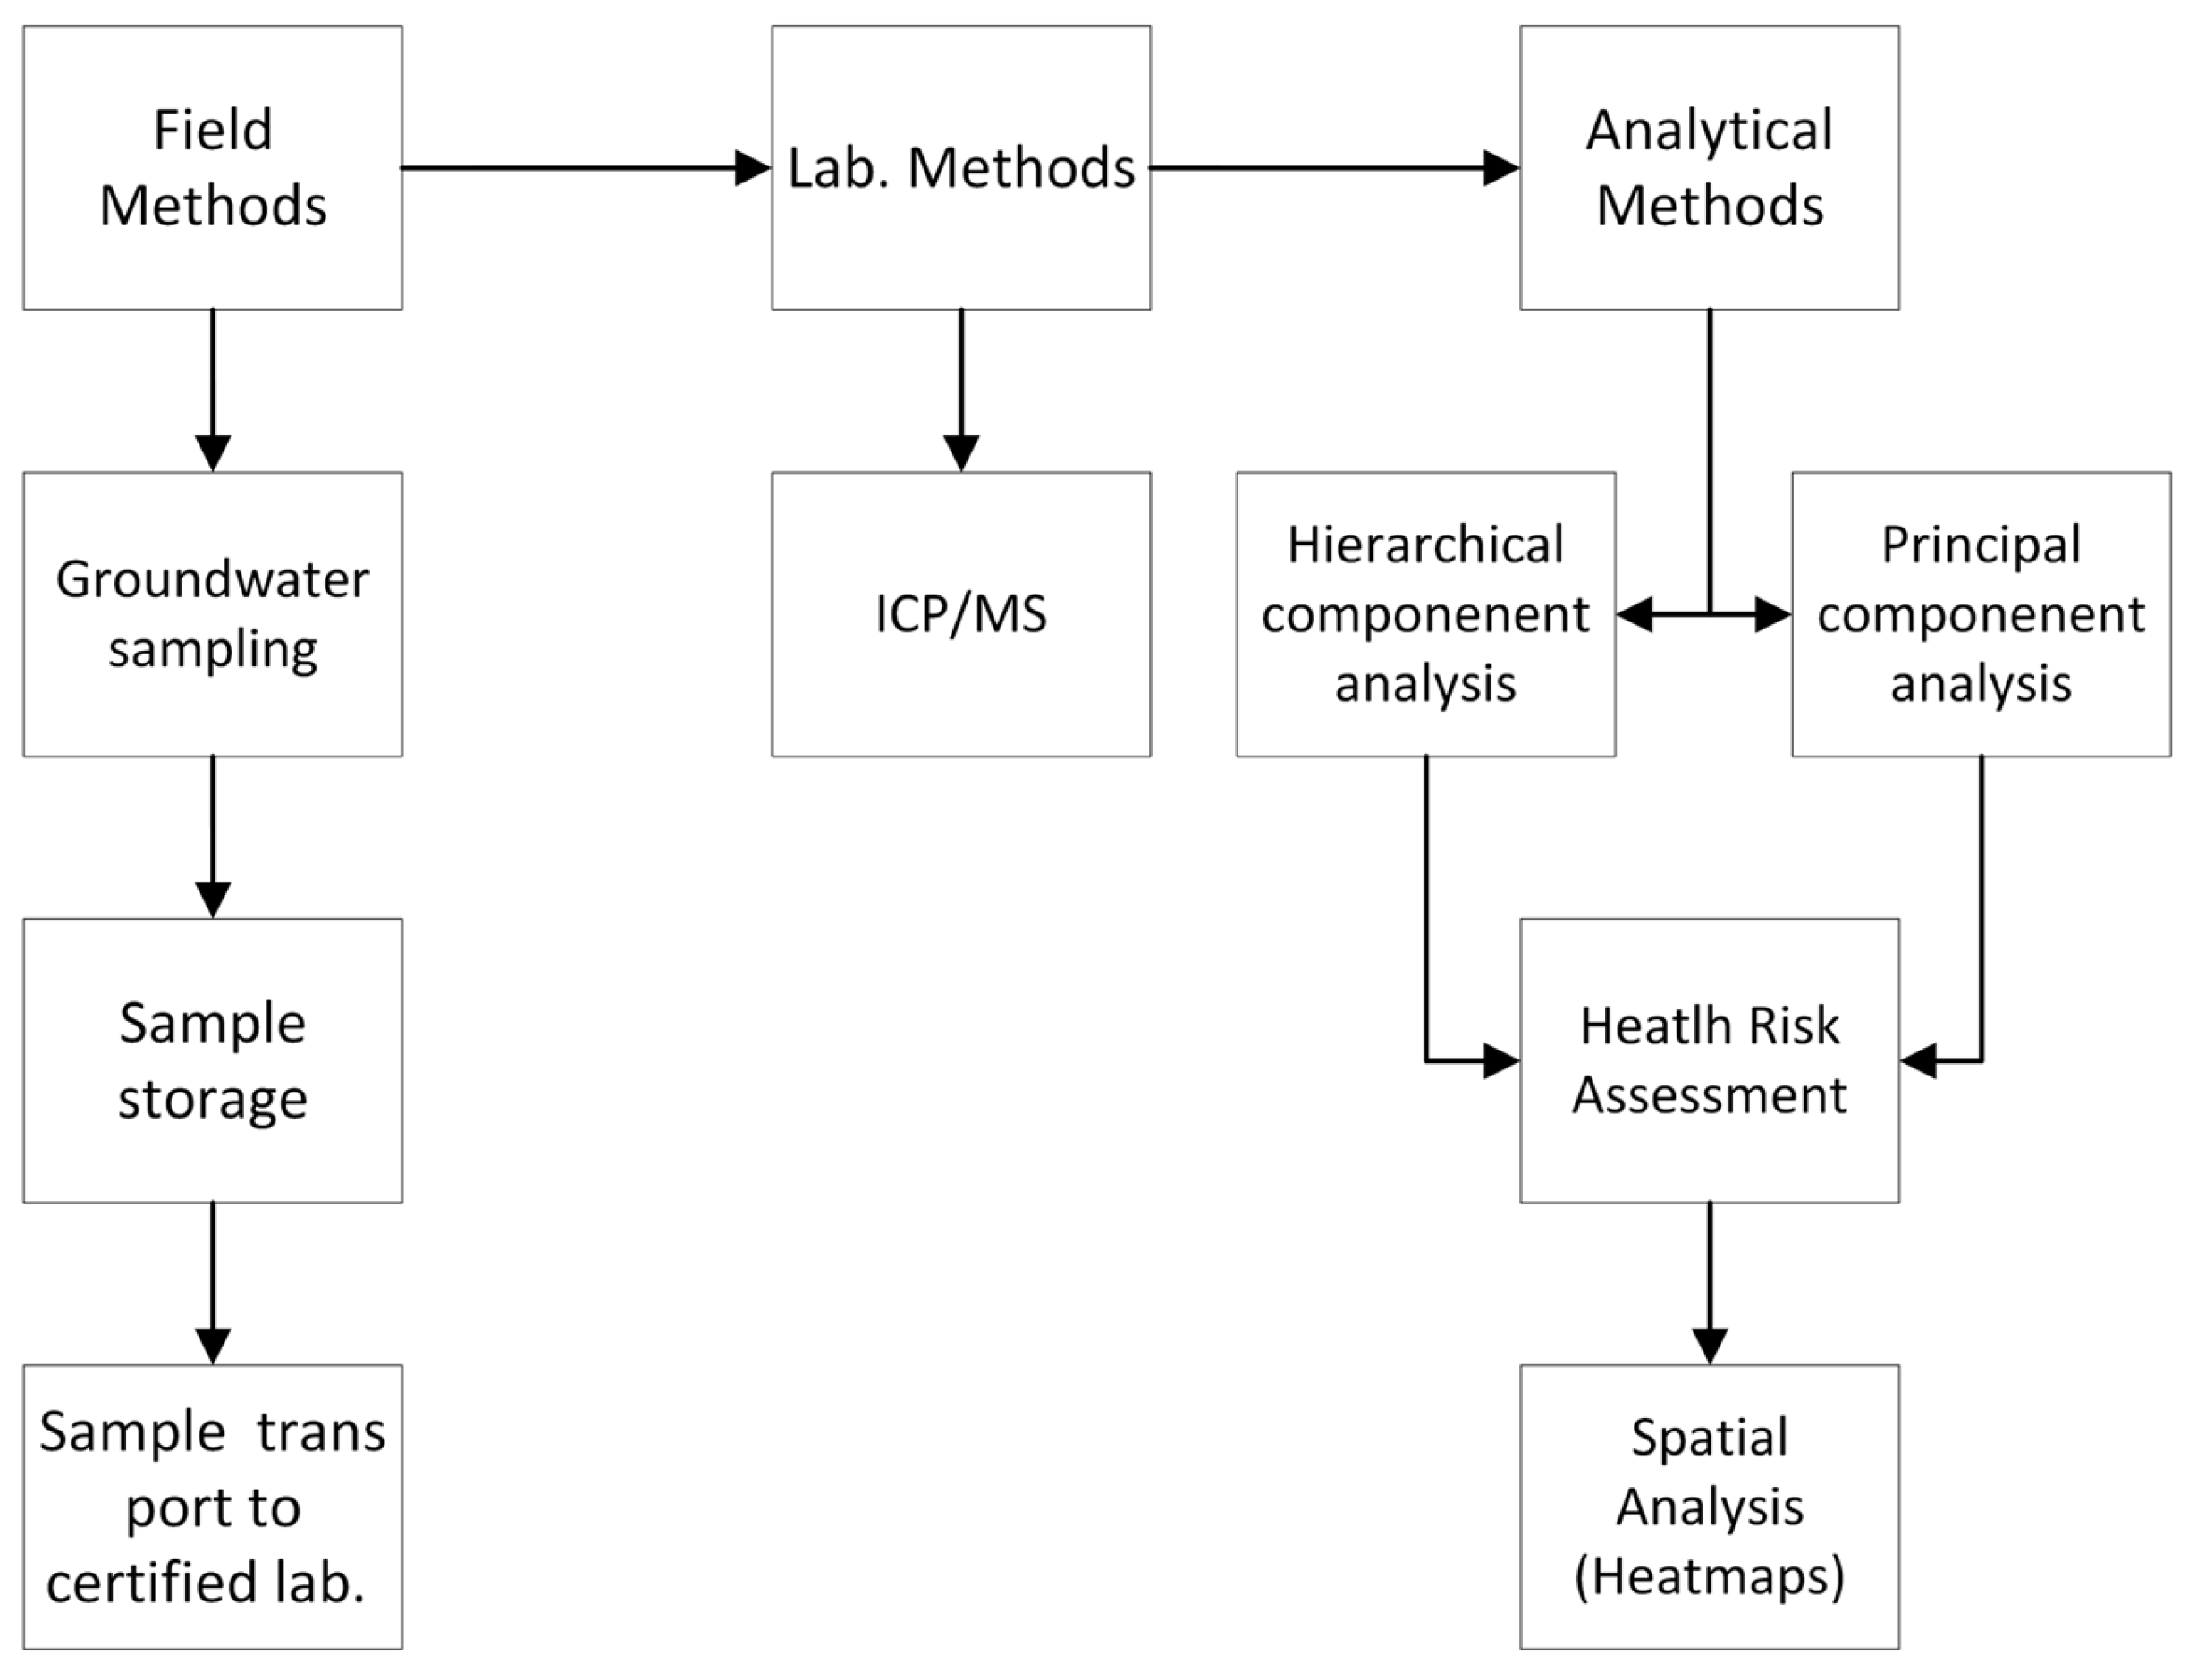
2.2. Sampling and Laboratory Analyses

Groundwater samples (n = 42) were collected from wells connected to Servicio de Agua y Drenaje de Monterrey (water and sanitation utility) in the urban and peri-urban areas of the MMA in early November 2020. Every well was equipped with pre-installed pumps. Field parameters, including the pH, temperature, electrical conductivity, oxidation–reduction potential (ORP), dissolved oxygen (DO), and total dissolved solids, were measured onsite using pre-calibrated electrodes (YSI® Professional Plus, Yellow Springs, OH, USA). Groundwater samples were filtered through 0.45 µm pore-size nitrate cellulose membrane filters. After filtration, the water samples were stored in high-density polyethylene sampling bottles, which were pre-washed and pre-rinsed before use. All groundwater samples were stored at 4 °C (constant temperature) until being shipped to the laboratory. A flowchart of the methods conducted in this research is shown in Figure 3.
Groundwater chemical analyses were performed by Activation Laboratories Ltd. Ancaster, ON, Canada. Selected elements (Al, As, B, Cr, Cu, Fe, Mn, and Zn) were measured by inductively coupled plasma mass spectrometry (ICP-MS) through a Perkin Elmer SCIEX ELAN 600 ICP/MS (PerkinElmer Life and Analytical Sciences, Shelton, CT, USA) instrument. One blank and two water standards were tested upon initial and end of analyses during trace element determinations. The accuracy of the ICP-MS method for the groundwater samples was measured by applying the international geostandard SRM-1640 (trace elements in natural water—certified by the National Institute of Standards and Technology NIST). The systematic differences between the reference values and the measurements of the mentioned standard were lower than 9%. The detection limits for the trace element analysis are reported in Table A1 (Appendix A).

2.3. Statistical and Geospatial Analyses

A descriptive statistical analysis was used to determine the relationship between the concentrations of elements in groundwater. Two multivariate statistical methods, HCA and PCA, were performed in this study using SPSS 26 [53]. The dataset was standardized using the z-score value. The HCA method is an effective mechanism for genetically classifying groundwater samples [54,55]. The resulting clusters or groups are displayed in a dendrogram plot to demonstrate how the measured element concentrations are divided into several groups based on the dissimilarities between the element contents in the groundwater samples in terms of unique characteristics. To classify wells with different metal contents in the MMA, an HCA was performed using the Euclidean distance and Ward’s method, which uses variance analysis to estimate the distance between the clusters.
Factor analyses such as PCA are mathematical tools for displaying the variation present within a dataset. Two-dimensional or three-dimensional visual projections of the samples are constructed using axes as factors (principal components, PCs). Each component is a linear combination that retains some of the factor correlations. It can be said that the iterative calculation holds as much variation from the original dataset as possible. Hence, PC1 explains the data variation better than PC2, PC2 explains the data variation better than PC3, and so forth. In this study, the number of PCs was determined using the Kaiser criterion, which states that eigenvalues greater than “1” are considered “significant” in the PCA.
The ArcGIS 10.5 software was used to develop individual heavy metal location heatmaps for the MMA [56]. The inverse distance weighting (IDW) is a well-known deterministic method for multivariate interpolation often used as a geostatistical tool for analyzing the distribution of groundwater pollutants in many groundwater quality assessments [57,58,59,60]. This method delineates an area for each pollutant by employing its default equation to calculate the inverse distance values raised to the second power to predict the values of an unsampled location. The location heatmaps display the spatial distribution of each element from the sampling locations and pollution index around the MMA. Spatial mapping was used to predict the pollution levels in the areas where groundwater samples could not be taken.

2.4. Human Health Risk Assessment

Risk assessment is the systematic process of determining the probability that a certain degree of harmful health effects would occur over time. The estimate of the health risk associated with each metal(loid) is based on a quantitative assessment of the hazard levels, and the consumption of carcinogenic and noncarcinogenic metals in groundwater is commonly reported as the average daily dose (ADD) [61]. The dose ingested through the considered pathway was calculated using Equation (1), which was modified by the US Environmental Protection Agency [54].
ADD = C   ×   IR   ×   EF   ×   ED BW   ×   AT ,
where ADD is the average daily dose of metal(loid)s ingested through drinking water (mg/kg/day), C is the average concentration of metal(loid)s in the water (mg/L), IR is the water ingestion rate (L/day), EF is the exposure frequency (day/year), ED is the exposure duration (year), BW is the body weight (kg), and AT is the averaging time (day). Their values were obtained from the USEPA [62].
Equation (2) was used to determine the noncarcinogenic risk of metal(loid)s based on the hazard quotient (HQ), which compares the ADD with a reference dose (RfD):
HQ = ADD R f D ,
where RfD was obtained from the USEPA noncarcinogenic risk characterization [63]. An exposed person is safe if HQ ≤ 1, as RfD is the intended maximum daily intake of toxic metal(loid)s, which is unlikely to cause harmful effects on a person’s health. If HQ > 1, there may be noncarcinogenic health effects.
The hazard index (HI) was calculated by summing up all the measured HQs of metal(loid)s to assess overall noncarcinogenic effects on drinking water, as shown in Equation (3). The HI indicates the possibility of a harmful effect on human health [54].
HI = i 1 n HQi ,
where HQi is the HQ of an individual metal(loid), HI is the hazard index for all the studied metal(loid)s, and n is the number of metal(loid)s, which is 8 in this study.
Equation (4) was used to evaluate the carcinogenic risk, and the method of De Miguel et al. [64] was used for a detailed calculating process. The calculated value represents the probability of a person developing any type of cancer throughout their life owing to exposure to metals. According to the USEPA, the acceptable or tolerable range of carcinogenic risk is 10−6 to 10−4 [65].
Cancer risk = ADD × SF,
After Equation (1), ADD is a 70-year (in mg/kg/day) averaged daily intake, and SF is the slope factor expressed in (mg/kg/day)−1. The SF was obtained from the USEPA carcinogenic risk characterization [63,66].

3. Results and Discussion

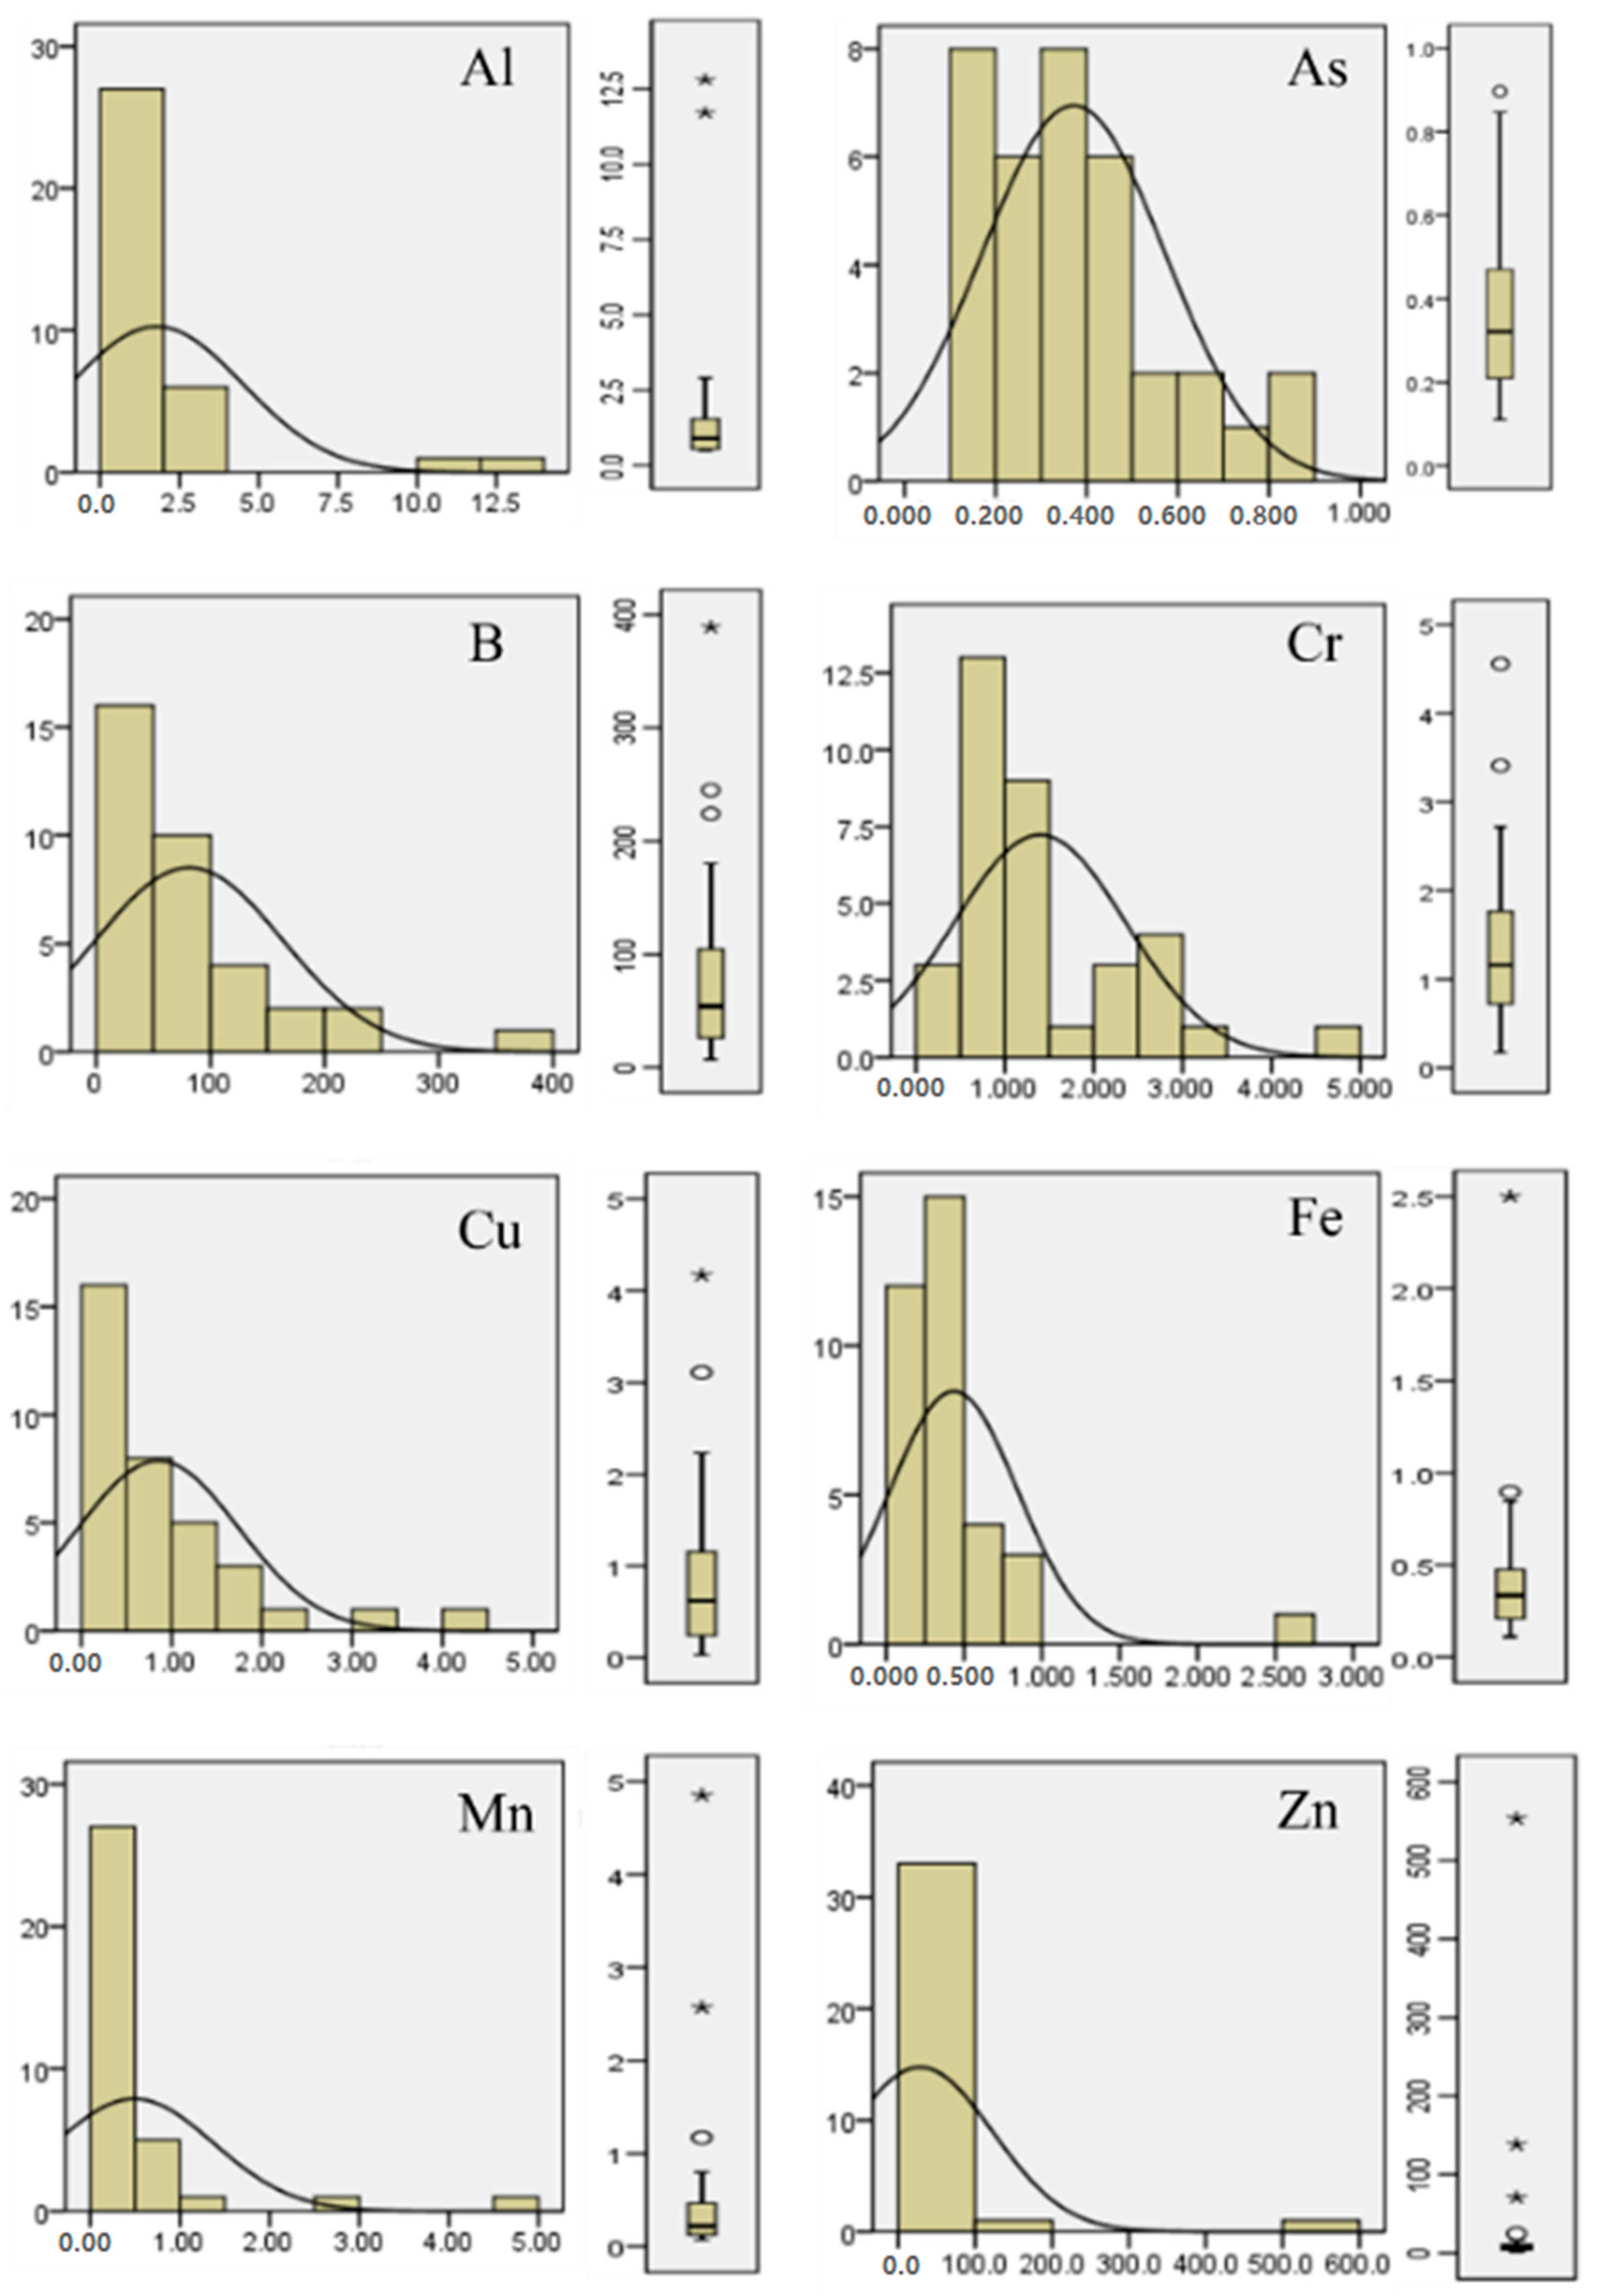
3.1. Metal Concentrations

Table 1 presents a statistical summary of concentrations of the eight studied metal(oid) elements in the groundwater of MMA. These concentrations were compared with the US EPA [67], Mexican standard [68], as well as WHO guidelines for drinking water [69]. It shows that metal concentrations in groundwater samples from the MMA did not exceed the permissible limits established, neither by the mentioned regulations nor WHO guidelines for drinking water.
The aluminum concentration ranged from 0.30 to 12.8 µg/L, As from 0.07 to 0.90 µg/L, B from 7.0 to 389.0 µg/L, Cr from 0.18 to 4.56 µg/L, Cu from 0.01 to 4.17 µg/L, Fe from 0.9 to 20.4 µg/L, Mn from 0.07 to 4.85 µg/L, and Zn from 0.9 to 553.0 µg/L. The trend in skewness, kurtosis, and Shapiro–Wilk tests (Table 1) makes it evident that none of the parameters were normally distributed. In general, the distribution of the metal(oids) had a significantly right-skewed tail (positive values > 1) and was leptokurtic or had a high peakedness (value > 3). The Shapiro–Wilk test of normality with a confidence interval of 95% as well as histograms and box plots (Figure 3) confirm that the elements were not normal distributed. The statistical tests indicate that anthropogenic activities affected the groundwater of MMA, especially for Al, Mn, and Zn. Regarding these elements, the standard deviation was significantly higher than the average.

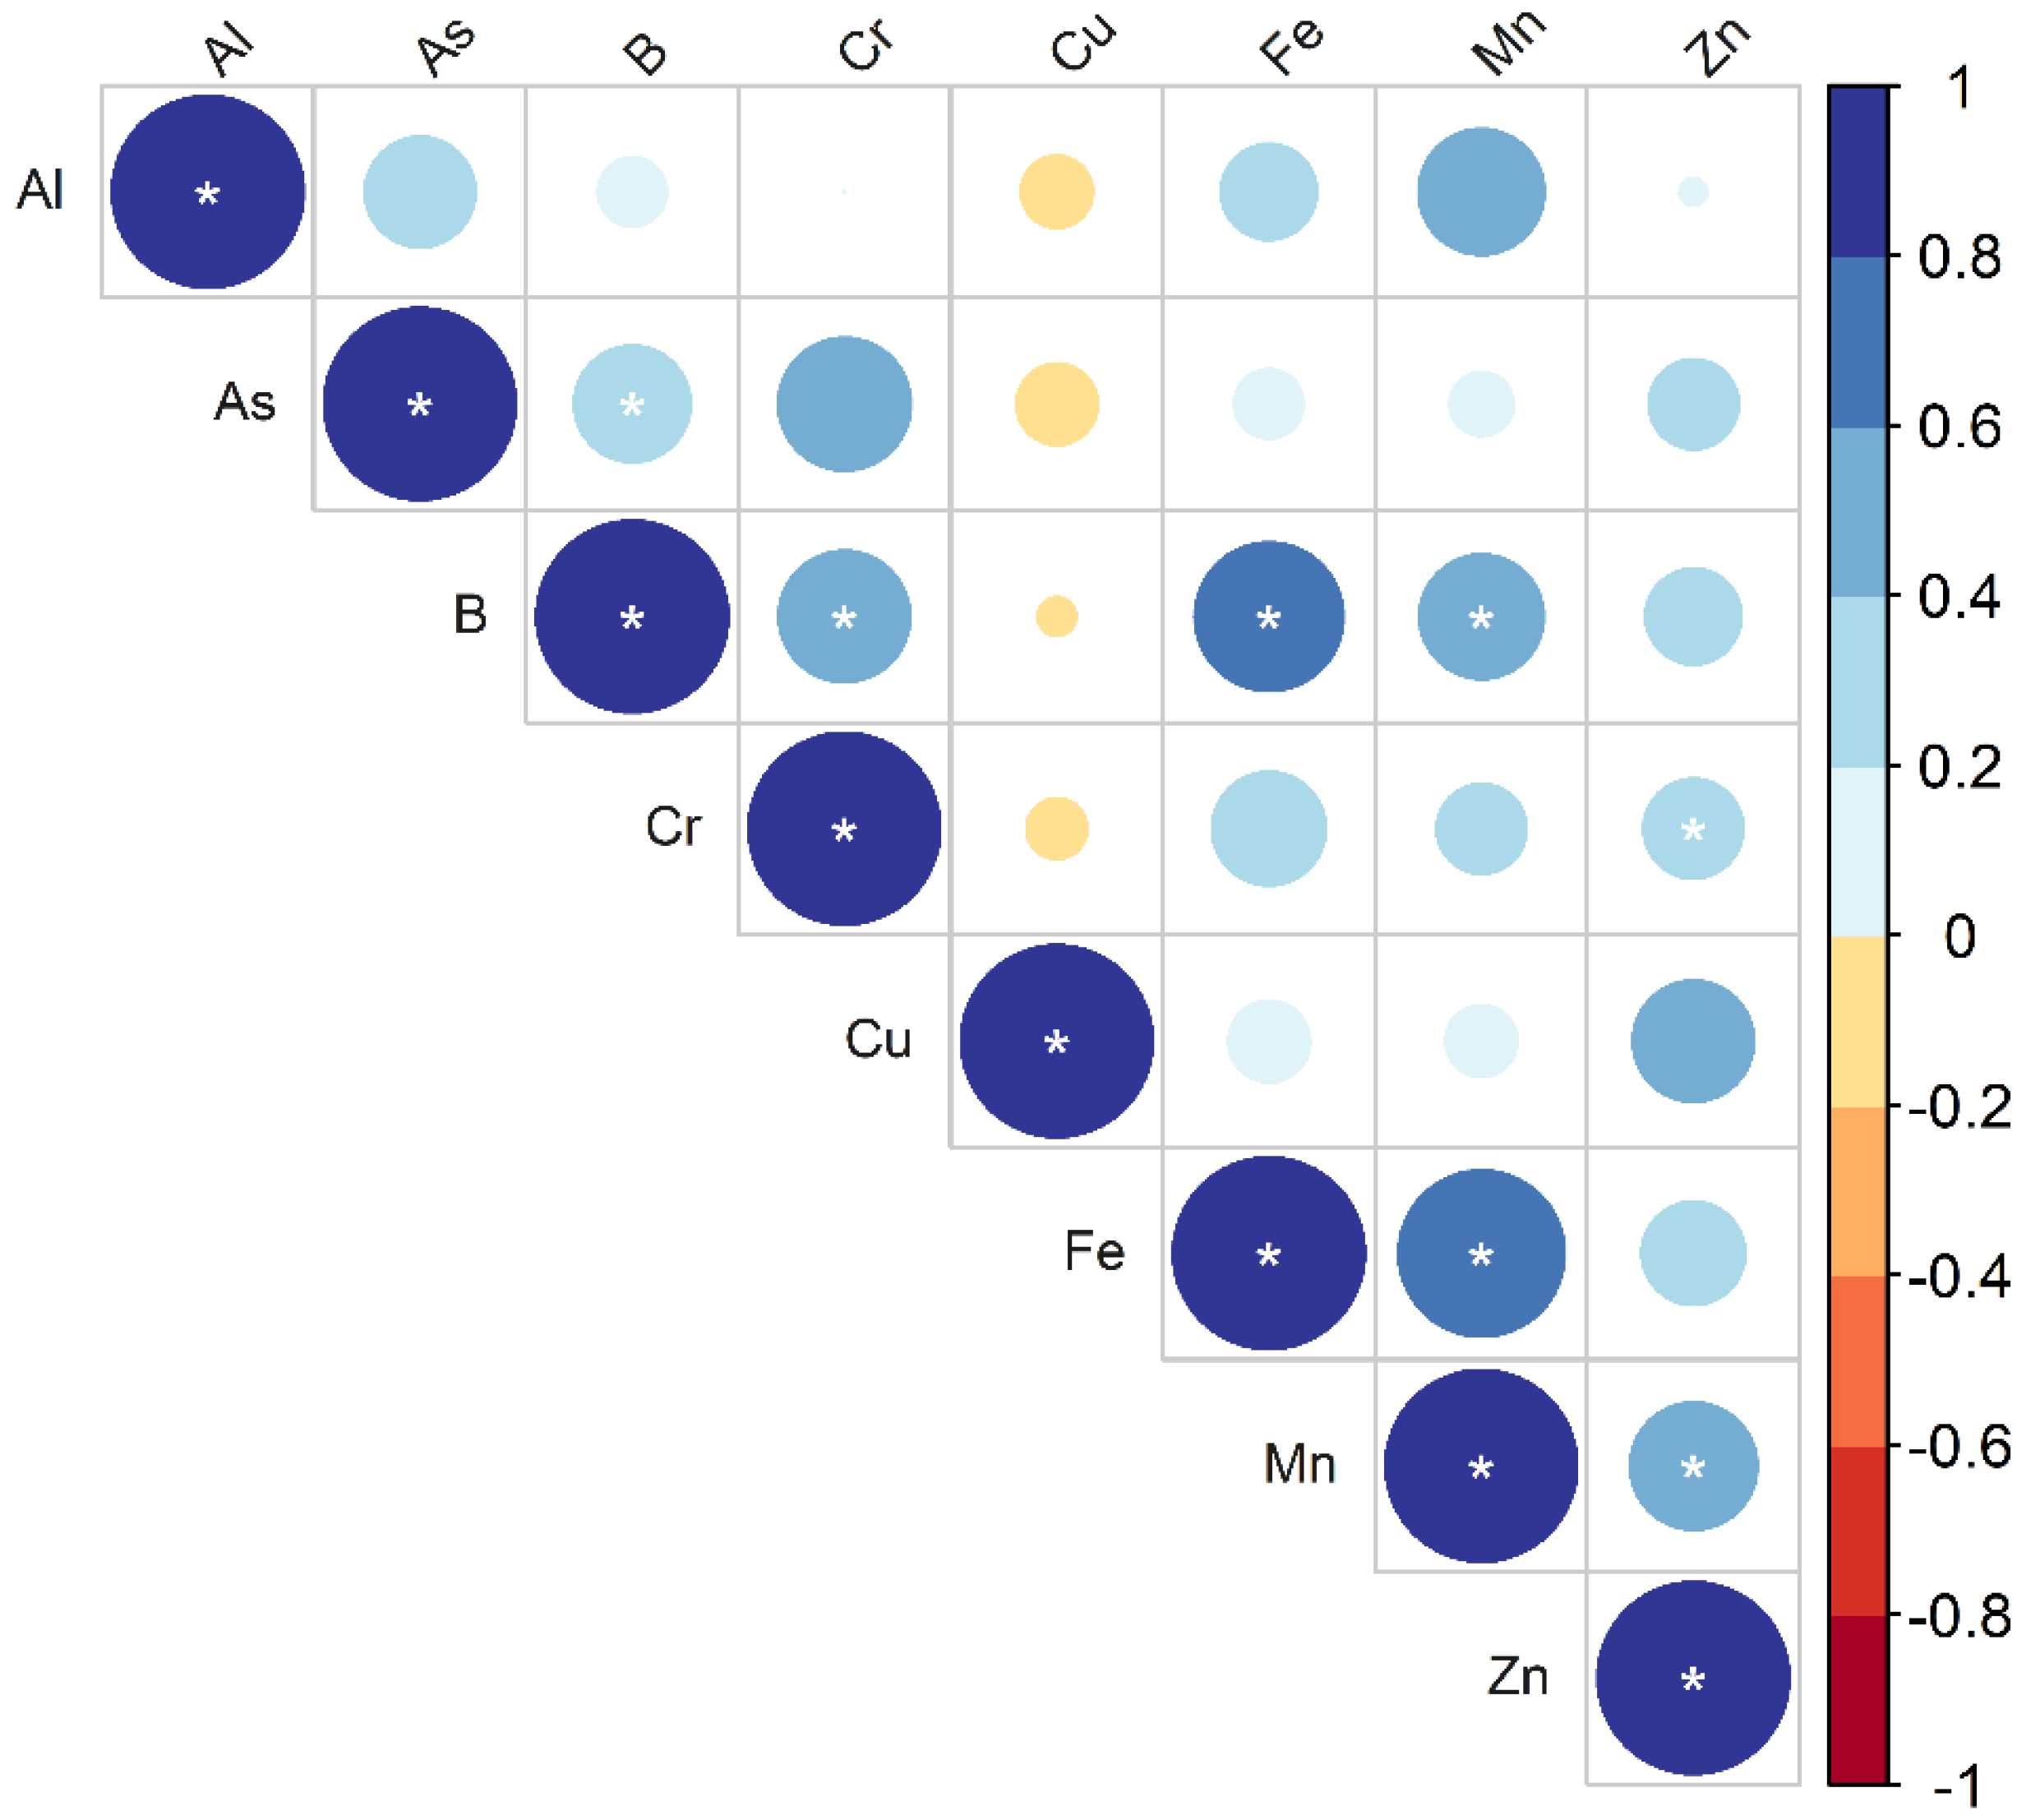
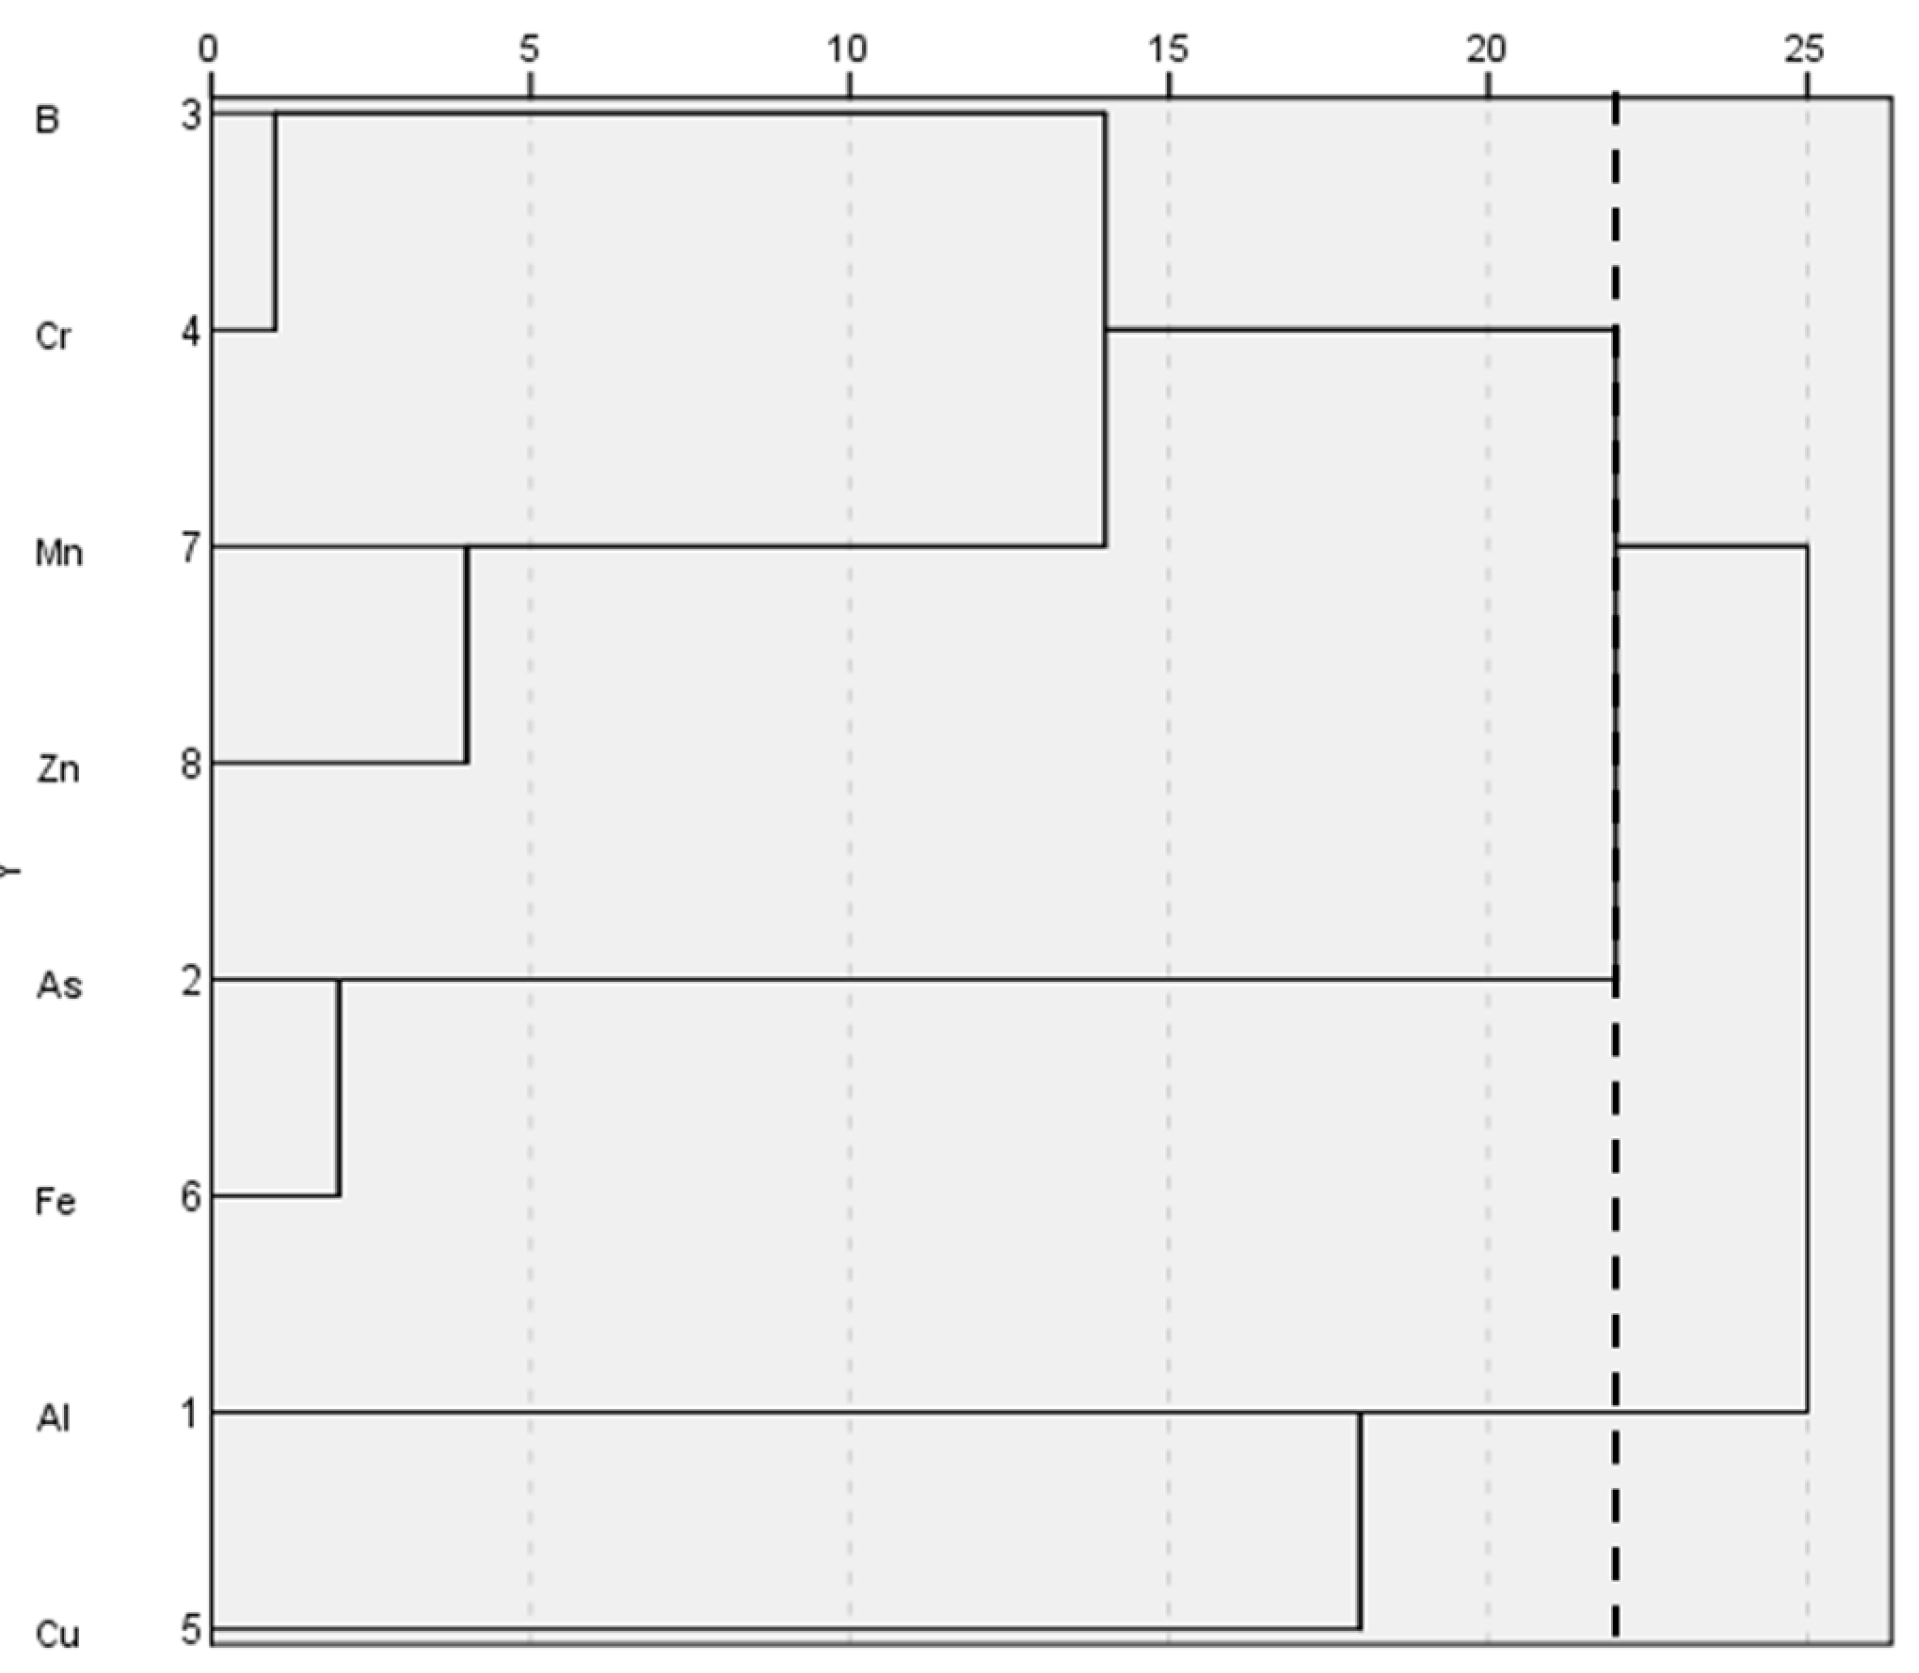
3.2. Clustering and Correlations

The Spearman correlation was studied to determine the relationship between the elements presented in Figure 4. The correlation analysis provided details of the metals and their sources; a high correlation among the metal concentrations indicated that there was a common origin in the area. The correlation between elements revealed highly significant (p < 0.001) relationships between the following: Al-Mn (r = 0.329; p = 0.034), As-Cr (r = 0.480; p = 0.001), B-Cr (r = 0.470; p = 0.002), B-Fe (r = 0.596; p = 0.000), B-Mn (r = 0.423; p = 0.005), Cu-Zn (r = 0.400; p = 0.009), Fe-Mn (r = 0.753; p = 0.000), and Mn–Zn (r = 0.437; p = 0.004). Similarly, significant correlations (p < 0.05) were found between the following elements: Al–As (r = 0.329; p = 0.034), As-B (r = 0.367; p = 0.017), and Fe-Cr (r = 0.352; p = 0.022). All the three groups of the eight elements had an almost negative correlation with each other, indicating that they originated from different sources.
HCA was used to further trace the correlation, confirming that there were three clusters of metal associations, with B, Cr, Mn, and Zn integrating the first cluster; As and Fe composing the second cluster; Al and Cu representing the third cluster; a phenom line is drawn at 22 for identifying such groups (Figure 5). The results obtained from the hierarchical dendrogram were consistent with the Spearman correlation results.

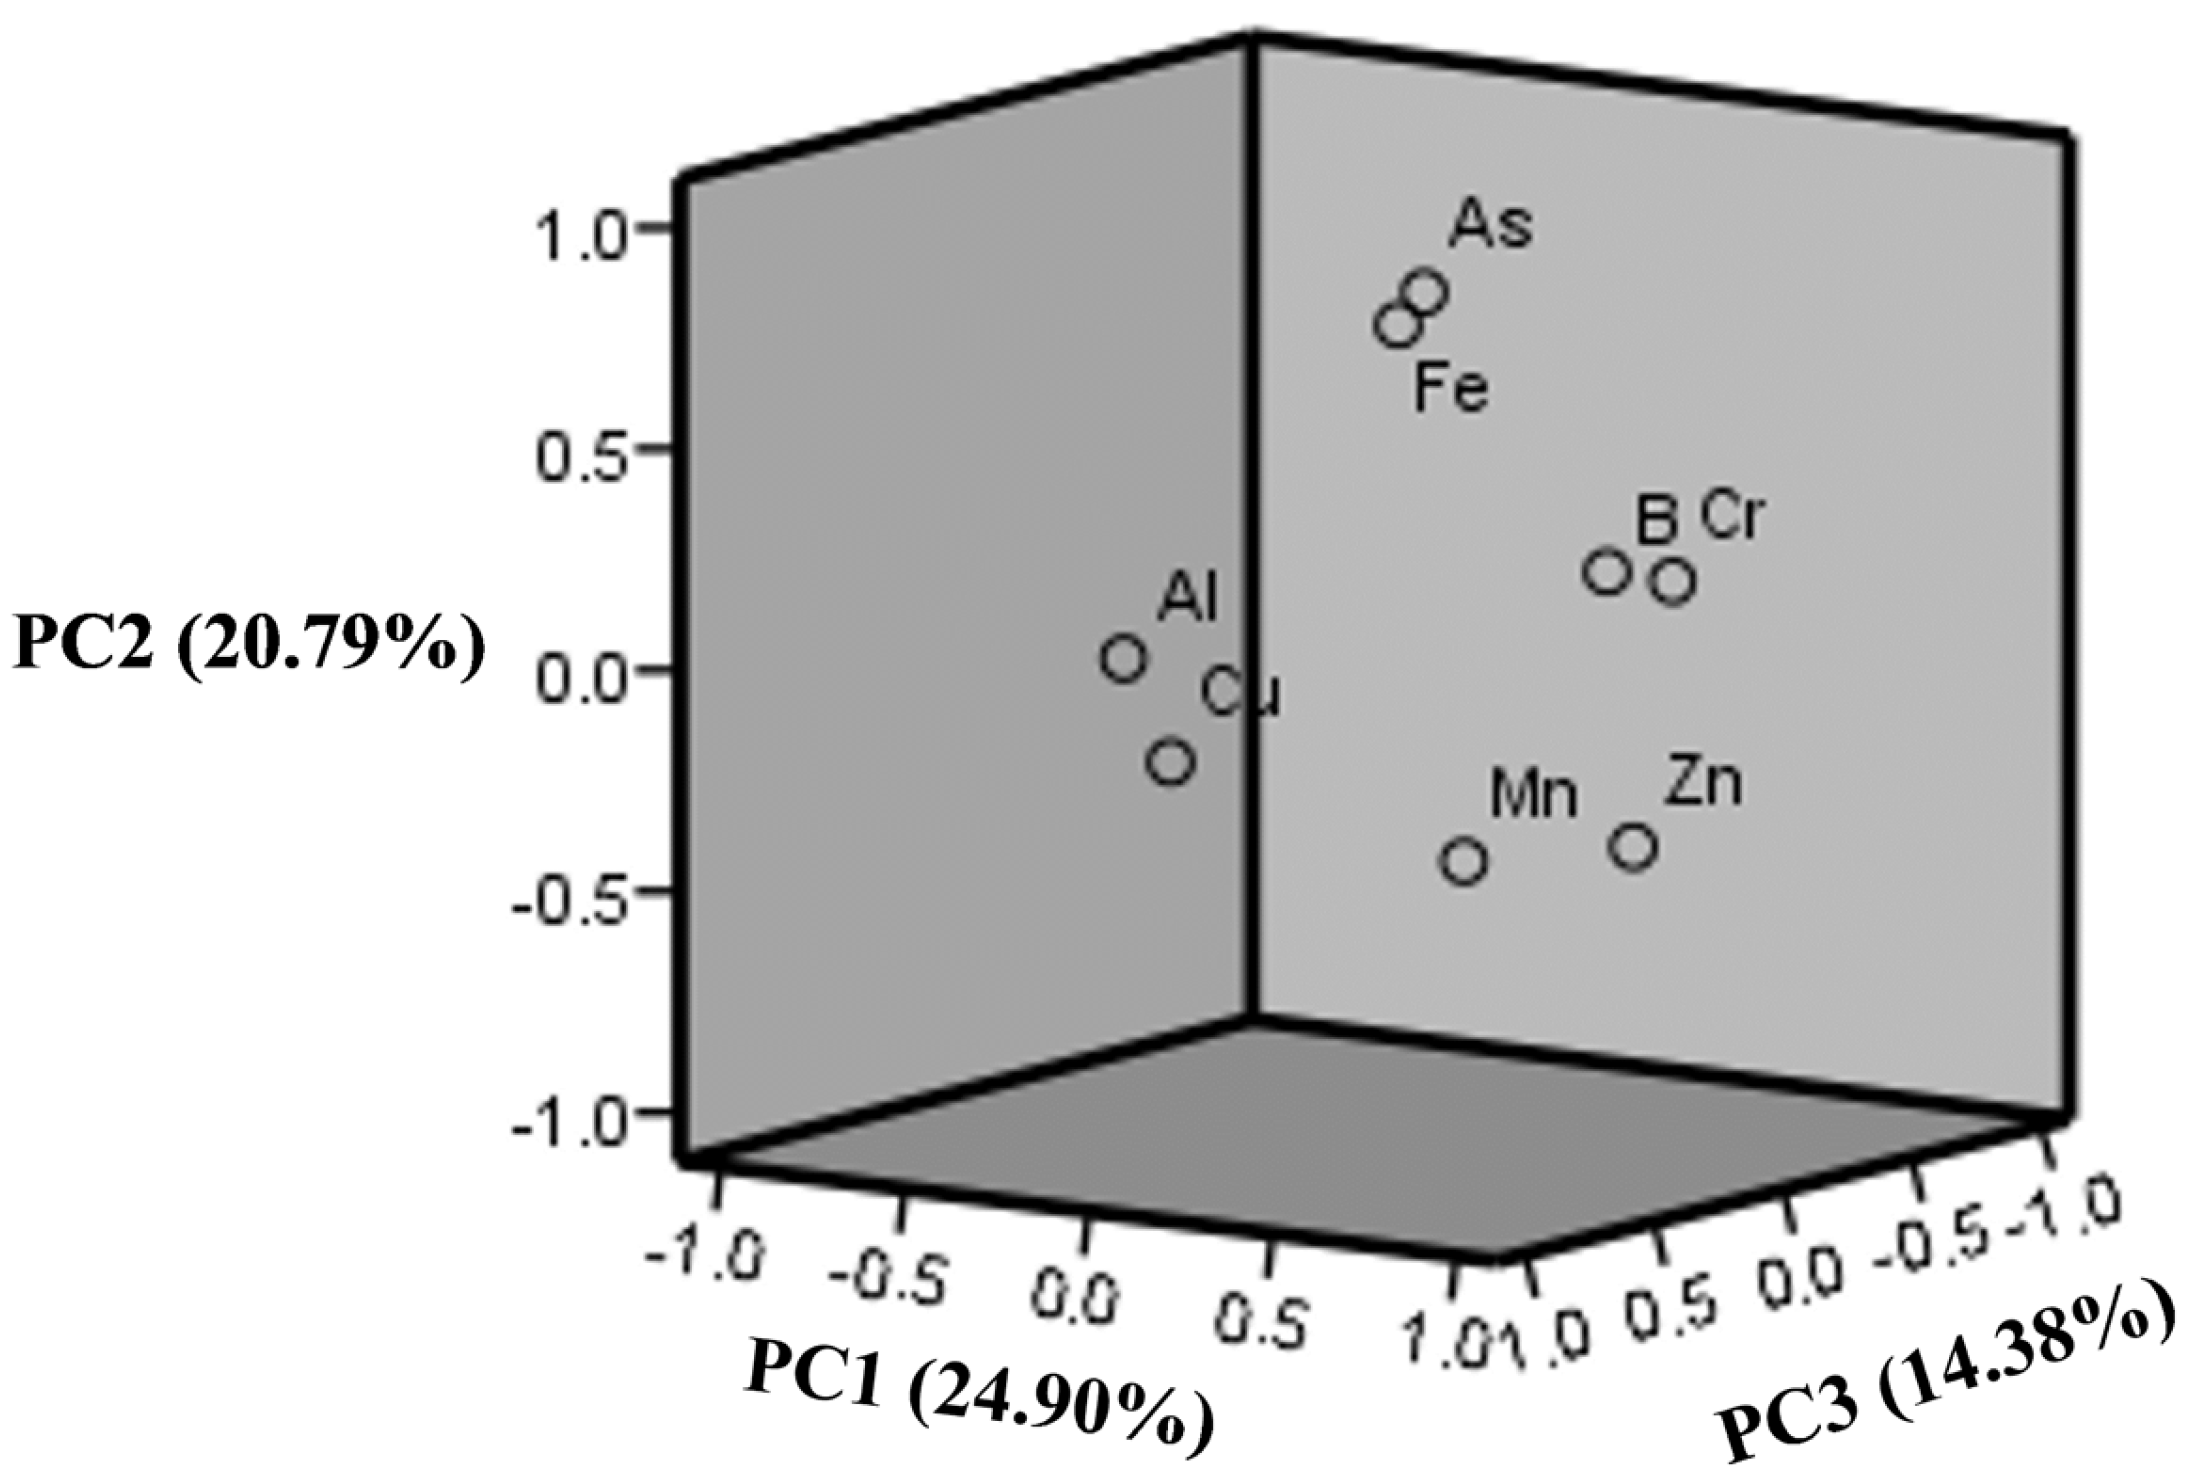
3.3. Principal Components Analysis

The PCA was used to study the factor extraction when the eigenvalue was greater than 1, and the varimax rotation was combined with Kaiser normalization. The extracted factors explained the variance and PC loadings, simplifying the interpretation. Bartlett’s test of sphericity and the Kaiser–Meyer–Olkin (KMO) test were used to test the sampling suitability. The results of Bartlett’s test (p < 0.001) and the KMO test (0.312) confirmed that PCA was suitable for the dataset.
Table 2 displays the As, B, Cr, Cu, Fe, Mn, and Zn elements in the 42 samples determined by PCA. It can be observed that the three PCs with eigenvalues greater than 1 were extracted from the dataset, with a cumulative variance of 60.07%. The first PC explained a variance of 24.90%, indicating high PC loadings for B, Cr, Mn, and Zn. The second PC (As and Fe) had a variance of 20.79%, while the third PC (Al and Cu) had a variance of 14.38%. The PCA results were consistent with the cluster analysis results, which revealed that the three clusters were separated by the same groups of elements (Figure 6).
These associations can be referred in terms of the hydrochemical characteristics of the area [55]. Typically, the mineral contents quantified in sampled groundwater are related to dissolution from predominant materials in the soils of an area. For this case, the presence of carbonates and gypsum of marine origin explains a correlation between sulphate, calcium, and magnesium, as shown in previous studies [48,70]. A possible origin of As can be traced to sulfides from pyrite found in the mineralogical content of the units along the SMO.

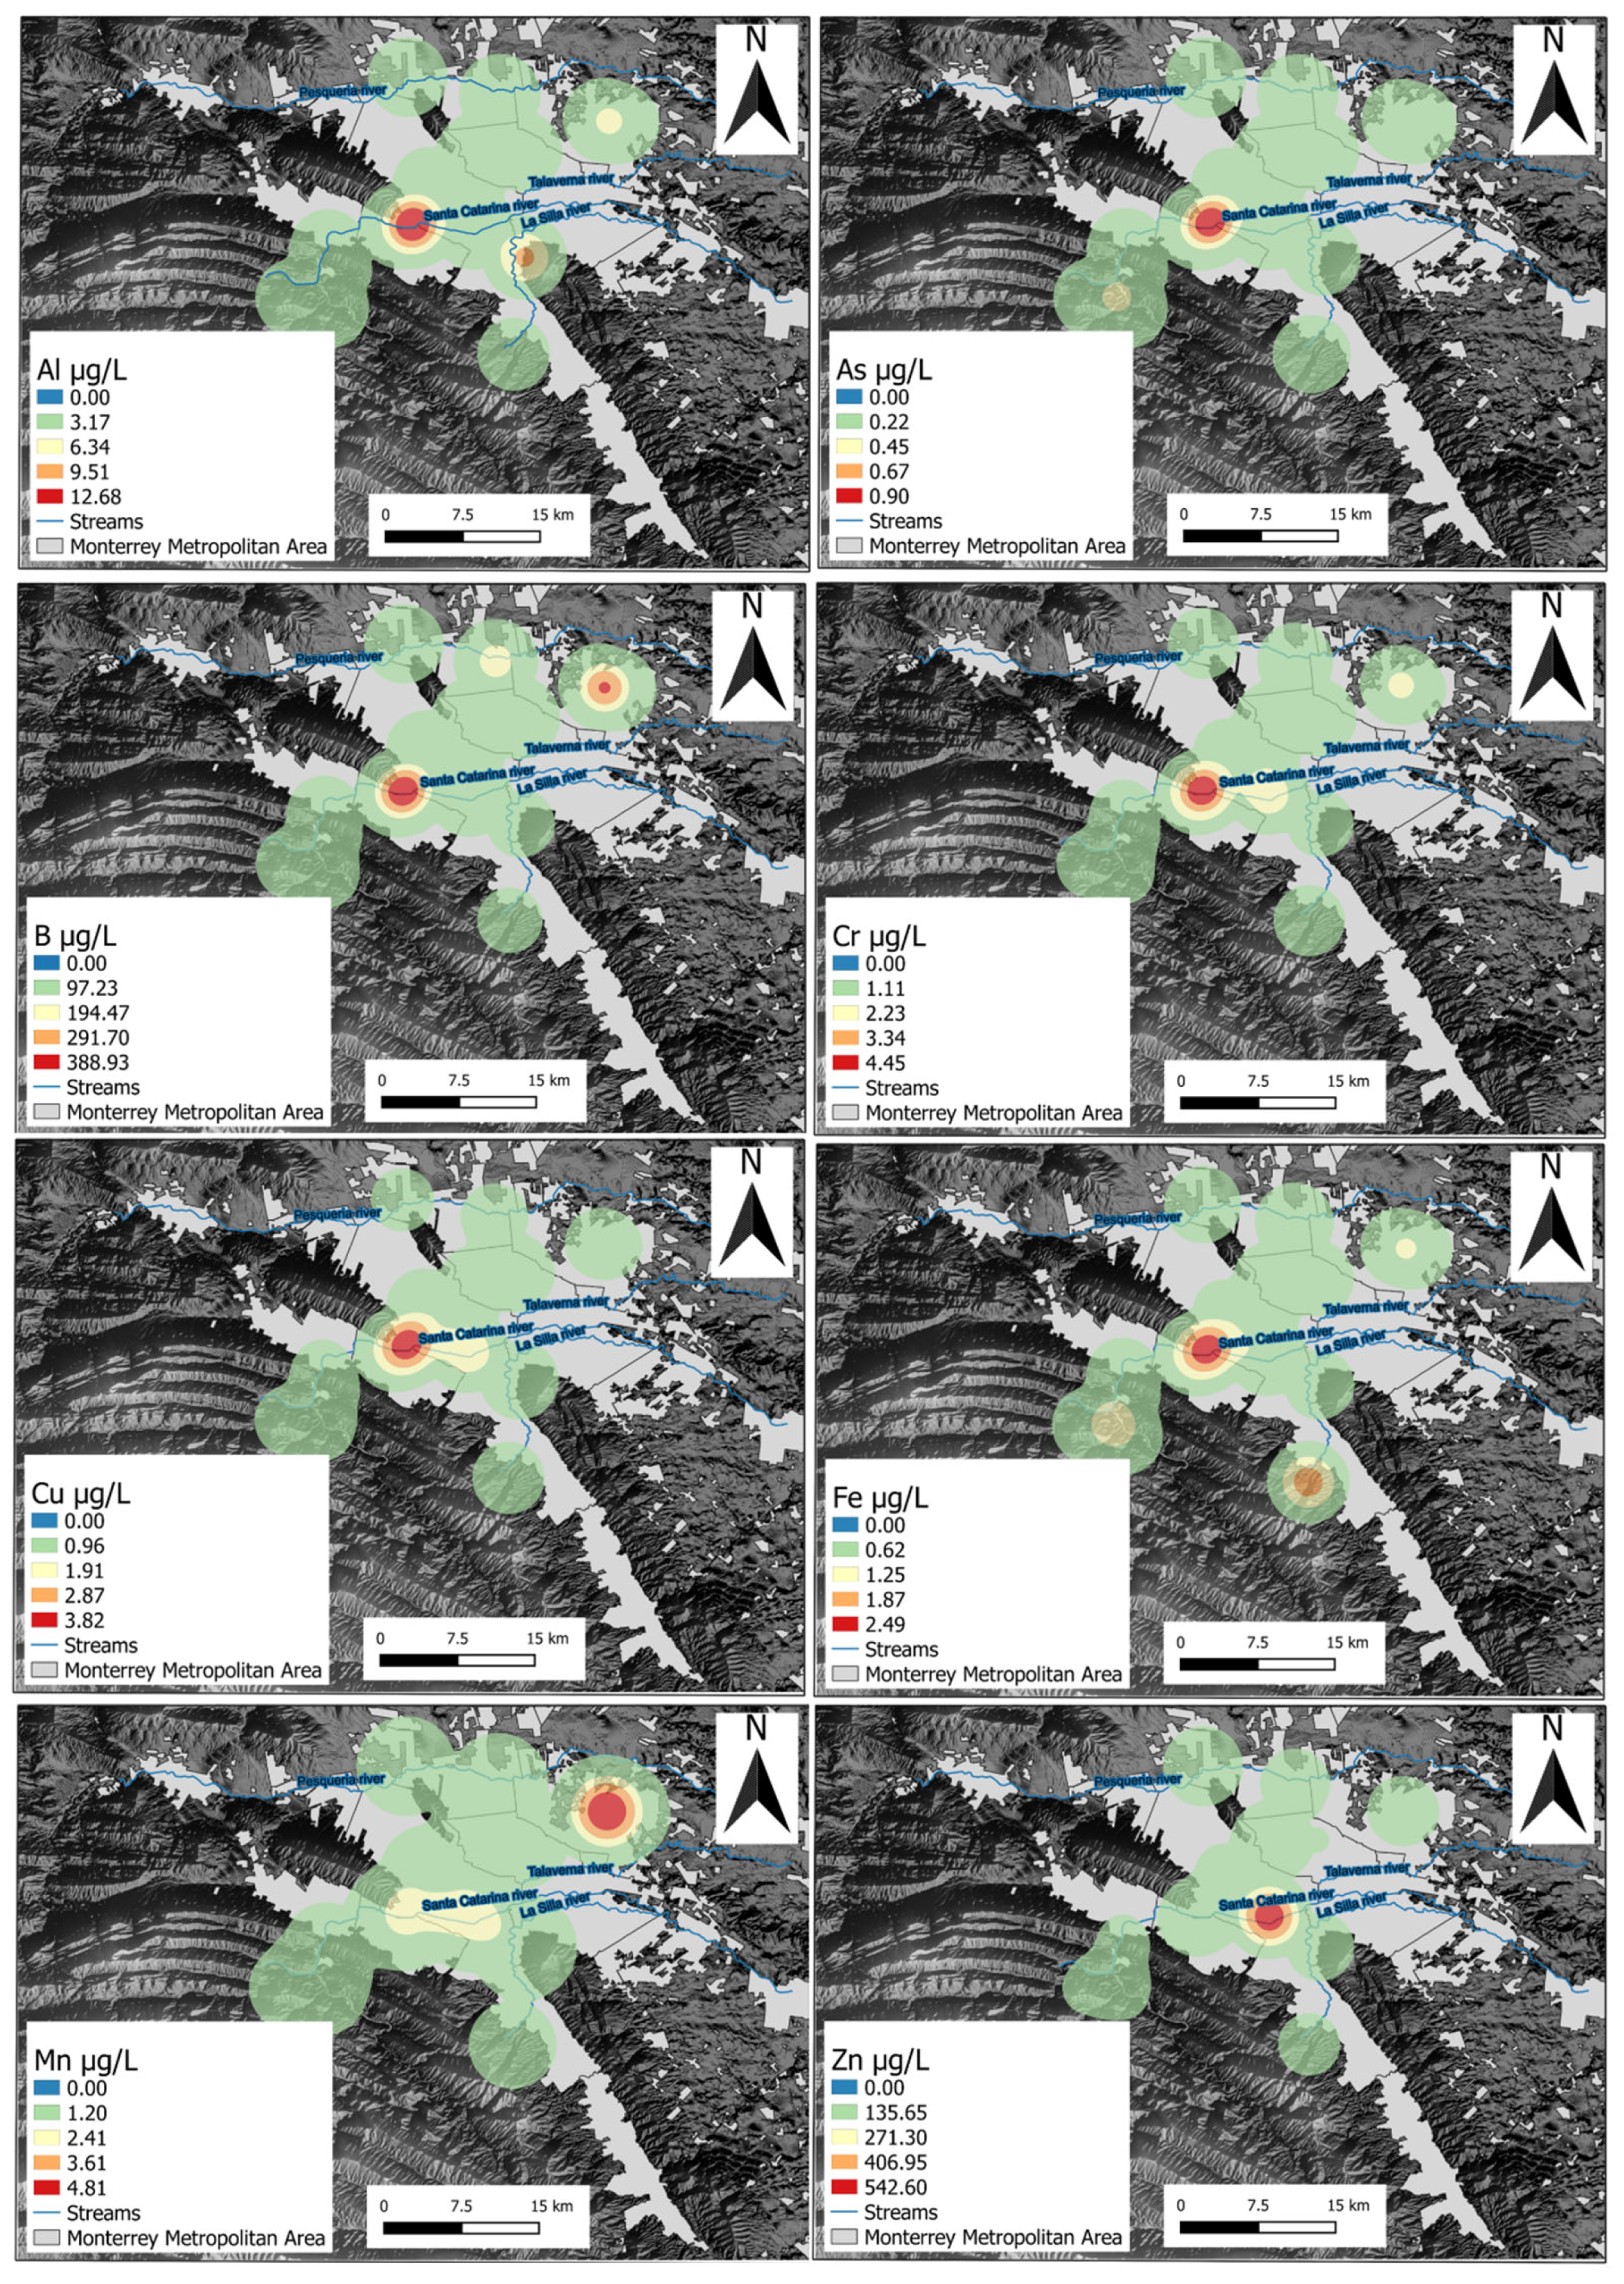
3.4. Mapping and Spatial Analyses

The spatial distribution of the heavy metals revealed that the west section of the Monterrey urban area had greater heavy metal concentrations (Figure 7). The geospatial trends revealed that the Al, As, B, Cr, Cu, and Fe concentrations were higher in the Monterrey/San Pedro municipal limit area than in the suburbs of the city, indicating their anthropogenic origin. Mineral dissolution and different geochemical processes determine the composition of trace elements. The mean concentration values of the studied area were found lower than the mean concentrations of metals in groundwater found in other dry environments such as the Neyshabur Plain, Iran (As 2.0 µg/L, Cr 2.78 µg/L, Cu 5.95 µg/L, Fe 6.81 µg/L, and Zn 2.37 µg/L), mainly because groundwater in that region is in contact with volcanic, subvolcanic intrusions, and hydrothermal breccias (which can be rich in such elements) [71,72]. Similarly, mean metal concentrations in MMA groundwater were lower than those found in urbanized areas such as Hong Kong (As 0.42 µg/L, Cr 0.71 µg/L, Cu 1.16 µg/L, Mn 2.72 µg/L, and Zn 40.8 µg/L), a region dominated by granite bedrock and felsic volcanic rocks [73]. An exception was identified with Cr (1.32 µg/L), which was found higher in MMA. Close to similar concentrations of Cr (0.63–1.57 µg/L) were recorded in the Mocorito River Aquifer in Mexico and attributed in part to natural weathering and/or industrial inputs such as PVC plastic use, motor oils, batteries, and metallic finishing industries [45]. Typically, silicates contain trace elements. However, these can be associated with carbonate and evaporitic minerals [74]. Processes such as surface sorption/desorption, ion exchange, and precipitation/dissolution control trace element concentrations in groundwater [75]. Contrarily, Mn and Zn concentrations were found higher in other areas compared to the previous metal(oid)s, indicating their trace abundance in the Monterrey area.
Sources of these metal tracers can be geogenic and anthropogenic. Rock–water interactions and rock weathering can be attributed to geogenic sources. The highest concentrations of B were found to the southwest and north-eastern section of the MMA. Rock weathering and the concurrent dissolution of boron were identified as probable sources of B-rich groundwaters from carbonates rocks in Estonia [76]. Concentrations of B in groundwater widely vary, but generally, B concentrations in aquatic environments are associated with anthropogenic contributions [77]. The urban effluents on the western section of the MMA may cause higher B concentrations as it is used as bleaching agents containing B as micronutrients from B-rich wastewaters are considered important contributors of B to groundwater environments [78,79]. Additionally, this is consistent with septic tracers as there are several wastewater treatment plants that operate in the northernmost section of the city.
Similarly, Cr can be attributed to residential waste, traffic, paints and pigments, pottery, and paper printing [80]. Elevated concentrations of Cr in five tannery locations were found in the region of Deyang City, China. Dye-waste and paint shops were some of the main contributors of this metal into groundwater [81]. In addition, Cr adheres to soil particles, hence having limited mobility from soil to groundwater as it occurs naturally in rocks, animals, plants, soil, and gases [82]. Eighteen paint shops were located in the MMA area with the highest Cr concentrations. Therefore, wastewater originating from these paint shops mix with urban wastewater that could potentially percolate into the urban aquifer, causing pollution with Cr in groundwater.
High positive loads for As appear to be associated with the redox process controlling the solubility of As and Fe from geogenic and anthropogenic sources in MMA groundwater. The maximum As concentration was found to be 0.90 µg/L and was present in the city area of the MMA. The moderate correlation between As and Fe may be a consequence of reductive dissolution from sewage wastewater, triggering the release of geogenic As-rich-Fe(oxy)hydroxides [83,84]. The highest Zn concentration (553 µg/L) was found in the city’s center, which is the area with the highest traffic flow. Sources of Zn are attributed to metallurgical activities related to industrial processes such as fabric printing, electroplating, and painting industries. Other activities deriving Zn into groundwater are compost material, agrochemicals, and traffic emissions, particularly from vehicle tires [1,85,86]. Sources of Mn along the northeastern section of the MMA can be attributed to agricultural practices, fertilizers, sewage, and animal waste disposal [87]. The Cu concentration ranged from 0.03 µg/L to 4.17 µg/L, while the Al concentration ranged from 0.50 µg/L to 12.80 µg/L. The positive relationship derived from PC3 indicate significant differences between the three groups of waters for Al and Cu concentrations. This suggests that Al and Cu have a low mobility in groundwater from which its solubility can be controlled by similar geochemical processes. Similar results have been found in groundwater supplied to the suburbs of Beijing, China where Al and Cu originate from the crust or are formed from carbonate mineral weathering and leaching of the host rock aquifers [88,89].

3.5. Human Health Risk Assessment

An empirical model of human health risk assessment was obtained from the USEPA and used to calculate the risk that metal(loid)s in groundwater pose to children and adults [62]. The human health risk assessment identifies pollutant(s), assesses the dose–response, appraises exposure, and characterizes risk [79]. Metal(loid) contamination affects humans through their mouths, skin, and noses when they are exposed to metals. The oral route is considered the most critical among all groundwater metal(loid) contamination routes [51].
The noncarcinogenic risk HQs of the eight metal(loid)s were lower than the suggested HQ threshold of 1 for adults and children, indicating that the metal(loid)s do not individually cause severe noncancer-related health effects. The harmful health risks of ingesting all eight metal(loid)s in the groundwater sample were calculated using the HI, and the results were 2.52 × 10⁻² for adults and 2.16 × 10⁻² for children. These results are also considered a negligible chronic risk and a very low cancer risk.
The HI values for children and adults varied from 0.0043 to 0.1404 and 0.0050 to 0.1641, respectively (Figure 8). The International Agency for Research on Cancer and the Integrated Risk Information System of the USEPA both consider some of the metal(loid)s found in the groundwater samples in this study (i.e., As and Cr) to be carcinogenic to humans [56,59]; therefore, the As and Cr concentrations in groundwater were studied for carcinogenic risk assessments. According to the geometric mean of the study area, the risks of oral consumption of As being carcinogenic to children and adults were 1.55 × 10⁻⁵ and 2.65 × 10⁻⁶, respectively, while those of Cr were 7.9 × 10⁻³ and 9.2 × 10⁻⁴, respectively (Figure 9a,b). As the cancer risk exceeded the target risk of 1 × 10⁻⁴ in Cr for adults and children, it can thus be considered “unacceptable” [61].
The sample collection season is one reason that might influence the obtained results of Cr concentrations found in groundwater, which indicates that the permissible limits of the drinking water standards were not exceeded. The higher carcinogenic risk in a few of the wells that was calculated in this study area may be due to the high intake of water by the inhabitants owing to their occupation and the local climate. Further investigations are needed for comparing the heavy metal concentrations in two sampling periods along the studied area.
As the study area is warm, it has a higher regular water consumption than regions with cold climate conditions. However, climate and weather play an important role in how heavy metals migrate in aqueous environments, especially in groundwater. Therefore, a limitation of this study was that that was just a one-time sampling event, so the interpretation would be only valid for the dry season. A second field campaign during the rainy summer season could help to make the interpretation more robust that could lead to identifying other metalloid pollution sources in MMA groundwaters.

4. Conclusions

Heavy metal concentrations, distributions, and potential sources in groundwater of Monterrey Metropolitan Area were assessed as well as the health risks for humans through consumption. Significant correlations on the source origins of B, Cr, Mn, Zn, As, Fe, Al, and Cu were observed in groundwater due to geogenic processes and anthropogenic activities. While Cr has been attributed to geogenic sources such as ophiolites and mafic rocks in other areas, this was not the case for the geological background of our studied area. Therefore, Cr concentrations can be attributed to anthropogenic processes occurring at the surface. Multivariate statistical tools and geospatial analysis were applied to identify the causative determinants that modify the groundwater quality along the MMA. The observed heavy metal content in drinking water apparently contradicted the risk assessment findings. While none of the metal(oids) reached permissible limits established by drinking water standards, the cancer risk of Cr was higher than the target risk of 1 × 10⁻⁴ for Cr, which is considered unacceptable for human consumption under USEPA guidelines. However, local authorities must ensure that Cr levels remain below any hazardous limit to the population. Better awareness about Cr contents in groundwater and their contaminant sources along the MMA’s groundwater reservoirs needs to be generated by water authorities. Residents who drink groundwater from private wells in the area should be informed about the harmful risks of drinking water directly from the source. Yet, the city’s potable network must ensure that water is contaminant-free from Cr and As sources prior to distribution to its consumers. Local authorities should be encouraged to treat groundwater and find alternative sources of water for drinking and cooking in order to minimize approximated noncarcinogenic and carcinogenic HIs. Heavy metal pollution index applicability coupled with multivariate statistical analysis were highlighted to ascertain the health risk from heavy metal pollution. Future research will consider the expansion of the sampling period and could also include other potential PTEs to further comprehend the contaminant evolution of MMA groundwater resources. The groundwater monitoring program for groundwater quality in Monterrey must be strengthened and older pipelines, especially in the downtown area, repaired to ensure quality water needed for satisfying MMA’s groundwater demands and avoiding future implications.

Author Contributions

All authors contributed equally to recruiting and reviewing papers for this editorial. R.K.B. and E.R. conceptualized and coordinated this effort. E.R. and R.K.B. wrote the first draft of this editorial. R.K.B. and E.R. worked the methodology and sampling. J.M., H.B.-P. and D.I.M. conducted reviewing and editing. All authors contributed by revising and editing for this editorial. All authors have read and agreed to the published version of the manuscript.

Funding

This research was funded by Consejo Nacional de Ciencia y Tecnología (CONACyT, No. 312558) and Sistema Nacional de Investigadores. Complementary funding was obtained by the Chair of Circular Economy of Water FEMSA at Tecnologico de Monterrey. FEMSA had no role in the study design, data collection and analysis, publishing decision, or preparation of the manuscript.

Data Availability Statement

Document provided for Peer Review.

Acknowledgments

The authors are grateful for the assistance provided by the colleagues Juan Antonio Torres-Martinez, Jaime Dueñas-Moreno, Diego Padilla-Reyes, and Christian Narváez for their guidance, fieldwork, and laboratory analyses.

Conflicts of Interest

The authors declare no conflict of interest.

Appendix A

Table A1. Reported detection lit for ICP-MS analysis for trace metals in groundwater samples of this study.
Detection LimitAl (µg/L)As (µg/L)B (µg/L)Cr (µg/L)Cu (µg/L)Fe (µg/L)Mn (µg/L)Zn (µg/L)
0.60.0330.50.20.20.10.5

References

  1. Bhutiani, R.; Kulkarni, D.B.; Khanna, D.R.; Gautam, A. Water quality, pollution source apportionment and health risk assessment of heavy metals in groundwater of an industrial area in North India. Expo. Health 2016, 8, 3–18. [Google Scholar] [CrossRef]
  2. Kumar, P.; Bansod, B.K.; Debnath, S.K.; Thakur, P.K.; Ghanshyam, C. Index-based groundwater vulnerability mapping models using hydrogeological settings: A critical evaluation. Environ. Impact Assess. Rev. 2015, 51, 38–49. [Google Scholar] [CrossRef]
  3. Pratap, B.; Kumar, S.; Purchase, D.; Bharagava, R.N.; Dutta, V. Practice of wastewater irrigation and its impacts on human health and environment: A state of the art. Int. J. Environ. Sci. Technol. 2021, 20, 2181–2196. [Google Scholar] [CrossRef]
  4. Sharma, P.; Pandey, A.K.; Kim, S.-H.; Singh, S.P.; Chaturvedi, P.; Varjani, S. Critical review on microbial community during in-situ bioremediation of heavy metals from industrial wastewater. Environ. Technol. Innov. 2021, 24, 101826. [Google Scholar] [CrossRef]
  5. Singh, D.D.; Thind, P.S.; Sharma, M.; Sahoo, S.; John, S. Environmentally Sensitive Elements in Groundwater of an Industrial Town in India: Spatial Distribution and Human Health Risk. Water 2019, 11, 2350. [Google Scholar] [CrossRef] [Green Version]
  6. Adebayo, A.S.; Akinola, B.S.; Adeyemi, A.F. Groundwater contamination and human health risk assessment in Ikire community, Osun State, Nigeria. Sustain. Water Resour. Manag. 2021, 7, 83. [Google Scholar] [CrossRef]
  7. Lima, I.Q.; Ramos, O.E.R.; Muñoz, M.O.; Tapia, M.I.C.; Aguirre, J.Q.; Ahmad, A.; Maity, J.P.; Islam, T.; Bhattacharya, P. Geochemical mechanisms of natural arsenic mobility in the hydrogeologic system of Lower Katari Basin, Bolivian Altiplano. J. Hydrol. 2021, 594, 125778. [Google Scholar] [CrossRef]
  8. Madhav, S.; Raju, N.J.; Ahamad, A. A study of hydrogeochemical processes using integrated geochemical and multivariate statistical methods and health risk assessment of groundwater in Trans-Varuna region, Uttar Pradesh. Environ. Dev. Sustain. 2021, 23, 7480–7508. [Google Scholar] [CrossRef]
  9. Kalhor, K.; Ghasemizadeh, R.; Rajic, L.; Alshawabkeh, A. Assessment of groundwater quality and remediation in karst aquifers: A review. Groundw. Sustain. Dev. 2019, 8, 104–121. [Google Scholar] [CrossRef]
  10. Li, J.; Li, F.; Liu, Q.; Song, S.; Zhang, Y.; Zhao, G. Impacts of Yellow River Irrigation Practices on Trace Metals in Surface Water: A Case Study of the Henan-Liaocheng Irrigation Area, China. Hum. Ecol. Risk Assess. Int. J. 2014, 20, 1042–1057. [Google Scholar] [CrossRef]
  11. Papazotos, P. Potentially toxic elements in groundwater: A hotspot research topic in environmental science and pollution re-search. Environ. Sci. Poll. Res. 2021, 28, 47825–47837. [Google Scholar] [CrossRef]
  12. Bux, R.K.; Haider, S.I.; Batool, M.; Solangi, A.R.; Memon, S.Q.; Shah, Z.-U.; Moradi, O.; Vasseghian, Y. Natural and anthropogenic origin of metallic contamination and health risk assessment: A hydro-geochemical study of Sehwan Sharif, Pakistan. Chemosphere 2022, 300, 134611. [Google Scholar] [CrossRef]
  13. Mohammadi, A.A.; Zarei, A.; Majidi, S.; Ghaderpoury, A.; Hashempour, Y.; Saghi, M.H.; Alinejad, A.; Yousefi, M.; Hosseingholizadeh, N.; Ghaderpoori, M. Carcinogenic and non-carcinogenic health risk assessment of heavy metals in drinking water of Khorramabad, Iran. Methodsx 2019, 6, 1642–1651. [Google Scholar] [CrossRef]
  14. Tokatli, C. Health risk assessment of toxic metals in surface and groundwater resources of a significant agriculture and industry zone in Turkey. Environ. Earth Sci. 2021, 80, 156. [Google Scholar] [CrossRef]
  15. Vaiphei, S.P.; Kurakalva, R.M. Comprehensive assessment of groundwater quality using heavy metal pollution indices and geospatial technique: A case study from Wanaparthy watershed of upper Krishna River basin, Telangana, India. Environ. Earth Sci. 2021, 80, 594. [Google Scholar] [CrossRef]
  16. Garau, M.; Garau, G.; Diquattro, S.; Roggero, P.P.; Castaldi, P. Mobility, bioaccessibility and toxicity of potentially toxic elements in a contaminated soil treated with municipal solid waste compost. Ecotoxicol. Environ. Saf. 2019, 186, 109766. [Google Scholar] [CrossRef]
  17. Kishor, R.; Purchase, D.; Saratale, G.D.; Saratale, R.G.; Ferreira, L.F.R.; Bilal, M.; Chandra, R.; Bharagava, R.N. Ecotoxicological and health concerns of persistent coloring pollutants of textile industry wastewater and treatment approaches for environmental safety. J. Environ. Chem. Eng. 2021, 9, 105012. [Google Scholar] [CrossRef]
  18. Khan, S.; Shah, I.A.; Muhammad, S.; Malik, R.N.; Shah, M.T. Arsenic and heavy metal concentrations in drinking water in Pakistan and risk assessment: A case study. Hum. Ecol. Risk Assess. Int. J. 2015, 21, 1020–1031. [Google Scholar] [CrossRef]
  19. Ocampo-Astudillo, A.; Garrido-Hoyos, S.E.; Salcedo-Sánchez, E.R.; Martínez-Morales, M. Alteration of Groundwater Hydro-Chemistry due to Its Intensive Extraction in Urban Areas from Mexico. In Water Availability and Management in Mexico; Springer: Cham, Switzerland, 2020; pp. 77–97. [Google Scholar]
  20. Sánchez, E.R.S.; Hoyos, S.E.G.; Esteller, M.V.; Morales, M.M.; Astudillo, A.O. Hydrogeochemistry and water-rock interactions in the urban area of Puebla Valley aquifer (Mexico). J. Geochem. Explor. 2017, 181, 219–235. [Google Scholar] [CrossRef]
  21. Rehman, K.; Fatima, F.; Waheed, I.; Akash, M.S.H. Prevalence of exposure of heavy metals and their impact on health conse-quences. J. Cell. Biochem. 2018, 119, 157–184. [Google Scholar] [CrossRef]
  22. Hughes, M.F.; Beck, B.D.; Chen, Y.; Lewis, A.S.; Thomas, D.J. Arsenic Exposure and Toxicology: A Historical Perspective. Toxicol. Sci. 2011, 123, 305–332. [Google Scholar] [CrossRef] [Green Version]
  23. Navarro, O.; González, J.; Júnez-Ferreira, H.; Bautista, C.-F.; Cardona, A. Correlation of Arsenic and Fluoride in the Groundwater for Human Consumption in a Semiarid Region of Mexico. Procedia Eng. 2017, 186, 333–340. [Google Scholar] [CrossRef]
  24. Yadav, S.K.; Ramanathan, A.L.; Kumar, M.; Chidambaram, S.; Gautam, Y.P.; Tiwari, C. Assessment of arsenic and uranium co-occurrences in groundwater of central Gangetic Plain, Uttar Pradesh, India. Environ. Earth Sci. 2020, 79, 154. [Google Scholar] [CrossRef]
  25. Karunanidhi, D.; Subramani, T.; Roy, P.D.; Li, H. Impact of groundwater contamination on human health. Environ. Geochem. Health 2021, 43, 643–647. [Google Scholar] [CrossRef]
  26. Fuoco, I.; Marini, L.; De Rosa, R.; Figoli, A.; Gabriele, B.; Apollaro, C. Use of reaction path modelling to investigate the evolution of water chemistry in shallow to deep crystalline aquifers with a special focus on fluoride. Sci. Total. Environ. 2022, 830, 154566. [Google Scholar] [CrossRef] [PubMed]
  27. Alarcón-Herrera, M.T.; Gutiérrez, M. Geogenic arsenic in groundwater: Challenges, gaps, and future directions. Curr. Opin. Environ. Sci. Health 2022, 27, 100349. [Google Scholar] [CrossRef]
  28. Spaur, M.; Lombard, M.A.; Ayotte, J.D.; Harvey, D.E.; Bostick, B.C.; Chillrud, S.N.; Navas-Acien, A.; Nigra, A.E. Associations between private well water and community water supply arsenic concentrations in the conterminous United States. Sci. Total. Environ. 2021, 787, 147555. [Google Scholar] [CrossRef]
  29. Fuoco, I.; De Rosa, R.; Barca, D.; Figoli, A.; Gabriele, B.; Apollaro, C. Arsenic polluted waters: Application of geochemical modelling as a tool to understand the release and fate of the pollutant in crystalline aquifers. J. Environ. Manag. 2021, 301, 113796. [Google Scholar] [CrossRef]
  30. Vega, M.A.; Kulkarni, H.V.; Johannesson, K.H.; Taylor, R.J.; Datta, S. Mobilization of co-occurring trace elements (CTEs) in arsenic contaminated aquifers in the Bengal basin. Appl. Geochem. 2020, 122, 104709. [Google Scholar] [CrossRef]
  31. Dhaliwal, S.S.; Singh, J.; Taneja, P.K.; Mandal, A. Remediation techniques for removal of heavy metals from the soil contami-nated through different sources: A review. Environ. Sci. Poll. Res. 2020, 27, 1319–1333. [Google Scholar] [CrossRef]
  32. Sobhanardakani, S.; Tayebi, L.; Hosseini, S.V. Health risk assessment of arsenic and heavy metals (Cd, Cu, Co, Pb, and Sn) through consumption of caviar of Acipenser persicus from Southern Caspian Sea. Environ. Sci. Pollut. Res. 2018, 25, 2664–2671. [Google Scholar] [CrossRef]
  33. Wuana, R.A.; Okieimen, F.E. Heavy Metals in Contaminated Soils: A Review of Sources, Chemistry, Risks and Best Available Strategies for Remediation. ISRN Ecol. 2011, 2011, 402647. [Google Scholar] [CrossRef] [Green Version]
  34. Qiao, D.; Wang, G.; Li, X.; Wang, S.; Zhao, Y. Pollution, sources and environmental risk assessment of heavy metals in the surface AMD water, sediments and surface soils around unexploited Rona Cu deposit, Tibet, China. Chemosphere 2020, 248, 125988. [Google Scholar] [CrossRef]
  35. Singh, N. Climate Change and Human Right to Water: Problems and Prospects. In The Human Right to Water; Springer: Cham, Switzerland, 2016; pp. 83–103. [Google Scholar] [CrossRef]
  36. Stumpp, C.; Żurek, A.J.; Wachniew, P.; Gargini, A.; Gemitzi, A.; Filippini, M.; Witczak, S. A decision tree tool supporting the assessment of groundwater vulnerability. Environ. Earth Sci. 2016, 75, 1057. [Google Scholar] [CrossRef]
  37. Yang, J.; Ye, M.; Tang, Z.; Jiao, T.; Song, X.; Pei, Y.; Liu, H. Using cluster analysis for understanding spatial and temporal patterns and controlling factors of groundwater geochemistry in a regional aquifer. J. Hydrol. 2020, 583, 124594. [Google Scholar] [CrossRef]
  38. Bux, R.K.; Haider, S.I.; Mallah, A.; Solangi, A.R.; Moradi, O.; Karimi-Maleh, H. Spatial analysis and human health risk as-sessment of elements in ground water of District Hyderabad, Pakistan using ArcGIS and multivariate statistical analysis. Environ. Res. 2022, 210, 112915. [Google Scholar] [CrossRef]
  39. García-Gil, A.; Epting, J.; Garrido, E.; Vazquez-Suñe, E.; Lázaro, J.M.; Navarro, J.Á.S.; Huggenberger, P.; Calvo, M.Á.M. A city scale study on the effects of intensive groundwater heat pump systems on heavy metal contents in groundwater. Sci. Total Environ. 2016, 572, 1047–1058. [Google Scholar] [CrossRef]
  40. Ravindra, K.; Mor, S. Distribution and health risk assessment of arsenic and selected heavy metals in Groundwater of Chan-digarh, India. Environ. Poll. 2019, 250, 820–830. [Google Scholar] [CrossRef]
  41. Arslan, H.; Turan, N.A. Estimation of spatial distribution of heavy metals in groundwater using interpolation methods and multivariate statistical techniques; its suitability for drinking and irrigation purposes in the Middle Black Sea Region of Turkey. Environ. Monit. Assess. 2015, 187, 516. [Google Scholar] [CrossRef]
  42. Elumalai, V.; Brindha, K.; Lakshmanan, E. Human Exposure Risk Assessment Due to Heavy Metals in Groundwater by Pollution Index and Multivariate Statistical Methods: A Case Study from South Africa. Water 2017, 9, 234. [Google Scholar] [CrossRef] [Green Version]
  43. Farzaneh, G.; Khorasani, N.; Ghodousi, J.; Panahi, M. Assessment of surface and groundwater resources quality close to mu-nicipal solid waste landfill using multiple indicators and multivariate statistical methods. Int. J. Environ. Res. 2021, 15, 383–394. [Google Scholar] [CrossRef]
  44. Paul, R.; Brindha, K.; Gowrisankar, G.; Tan, M.L.; Singh, M.K. Identification of hydrogeochemical processes controlling groundwater quality in Tripura, Northeast India using evaluation indices, GIS, and multivariate statistical methods. Environ. Earth Sci. 2019, 78, 470. [Google Scholar] [CrossRef]
  45. Rivera-Hernández, J.R.; Green-Ruiz, C.R.; Pelling-Salazar, L.E.; Flegal, A.R. Monitoring of As, Cd, Cr, and Pb in groundwater of Mexico’s Agriculture Mocorito River Aquifer: Implications for risks to human health. Water Air Soil Poll 2021, 232, 291. [Google Scholar] [CrossRef]
  46. INEGI—Instituto Nacional de Estadística y Geografía. Censo de Población y Vivienda 2020. 2021. Available online: https://censo2020.mx/ (accessed on 12 May 2022).
  47. CONAGUA (Comision Nacional del Agua). Actualización de la Disponibilidad Media Anual en el Aquífero Área Metropolitana de Monterrey (1906). Estado de Nuevo León, México. 2020. Available online: https://sigagis.conagua.gob.mx/gas1/Edos_Acuiferos_18/nleon/DR_1906.pdf (accessed on 10 May 2022).
  48. Mora, A.; Mahlknecht, J.; Rosales-Lagarde, L.; Hernández-Antonio, A. Assessment of major ions and trace elements in groundwater supplied to the Monterrey metropolitan area, Nuevo León, Mexico. Environ. Monit. Assess. 2017, 189, 394. [Google Scholar] [CrossRef] [Green Version]
  49. Aguilar-Barajas, I.; Orozco, A.I.R. Agua para Monterrey Logros, retos y Oportunidades para Nuevo León y México; Tecnologico de Monterrey: Monterrey, Mexico, 2022; Available online: https://repositorio.tec.mx/handle/11285/642843 (accessed on 12 May 2022).
  50. Servicio Geológico Mexicano (SGM). Carta Geológico-Minera Monterrey G14-7; 1mapa, escala 1:250,000 Pachuca; Servicio Geológico Mexicano: Hidalgo, Mexico, 2008; Available online: http://mapserver.sgm.gob.mx/Cartas_Online/geologia/72_G14-7_GM.pdf (accessed on 12 May 2022).
  51. CONAGUA (Comision Nacional del Agua). Actualización de la Disponibilidad Media Anual en el Aquífero Campo Buenos Aires. (1907). Estado de Nuevo León, México. 2015. Available online: https://www.gob.mx/cms/uploads/attachment/file/103159/DR_1907.pdf (accessed on 10 May 2022).
  52. Jasso, J.A.S. Estudio Geotécnico-Geofísico del Comportamiento Dinámico del Subsuelo para el área Metropolitana de Monterrey, Nuevo León, México. Ph.D. Thesis, Universidad Autónoma de Nuevo León, San Nicolás de los Garza, NL, Mexico, 2014. [Google Scholar]
  53. IBM Corp. IBM SPSS Statistics for Windows; Version 26.0; IBM Corp.: Armonk, NY, USA, 2019. [Google Scholar]
  54. Rao, N.S.; Rao, P.S.; Varma, D.D. Spatial variations of groundwater vulnerability using cluster analysis. J. Geol. Soc. India 2013, 81, 685–697. [Google Scholar] [CrossRef]
  55. Torres-Martínez, J.A.; Mora, A.; Knappett, P.S.; Ornelas-Soto, N.; Mahlknecht, J. Tracking nitrate and sulfate sources in groundwater of an urbanized valley using a multi-tracer approach combined with a Bayesian isotope mixing model. Water Res. 2020, 182, 115962. [Google Scholar] [CrossRef]
  56. ESRI. ArcGIS Desktop, Release 10; Environmental Systems Research Institute: Redlands, CA, USA, 2011. [Google Scholar]
  57. Chen, L.; Feng, Q. Geostatistical analysis of temporal and spatial variations in groundwater levels and quality in the Minqin oasis, Northwest China. Environ. Earth Sci. 2013, 70, 1367–1378. [Google Scholar] [CrossRef]
  58. Kashyap, R.; Verma, K.S.; Uniyal, S.K.; Bhardwaj, S.K. Geospatial distribution of metal(loid)s and human health risk as-sessment due to intake of contaminated groundwater around an industrial hub of northern India. Environ. Monit. Assess. 2018, 190, 136. [Google Scholar] [CrossRef]
  59. Lima, I.Q.; Ramos, O.R.; Muñoz, M.O.; Aguirre, J.Q.; Duwig, C.; Maity, J.P.; Sracek, O.; Bhattacharya, P. Spatial dependency of arsenic, antimony, boron and other trace elements in the shallow groundwater systems of the Lower Katari Basin, Bolivian Altiplano. Sci. Total. Environ. 2020, 719, 137505. [Google Scholar] [CrossRef]
  60. Satapathy, D.R.; Salve, P.R.; Katpatal, Y.B. Spatial distribution of metals in ground/surface waters in the Chandrapur district (Central India) and their plausible sources. Environ. Geol. 2009, 56, 1323–1352. [Google Scholar] [CrossRef]
  61. U.S. EPA (U.S. Environmental Protection Agency). Guidelines for Human Exposure Assessment. (EPA/100/B-19/001); Risk Assessment Forum; U.S. EPA: Washington, DC, USA, 2019. Available online: https://www.epa.gov/sites/default/files/2020-01/documents/guidelines_for_human_exposure_assessment_final2019.pdf (accessed on 6 July 2022).
  62. U.S. EPA (U.S. Environmental Protection Agency). Risk Assessment Guidance for Superfund Volume I: Human Health Eval-uation Manual (Part E, Supplemental Guidance for Dermal Risk Assessment). (EPA/540/R/99/005). Final Report. Washington, DC, USA. Available online: https://www.epa.gov/risk/risk-assessment-guidance-superfund-rags-part-e (accessed on 6 July 2022).
  63. U.S. EPA (US Environmental Protection Agency). A Risk Assessment–Multi Way Exposure Spread Sheet Calculation Tool. Available online: https://www.epa.gov/wqc/human-health-water-quality-criteria-and-methods-toxics#methodology (accessed on 6 July 2022).
  64. De Miguel, E.; Iribarren, I.; Chacón, E.; Ordoñez, A.; Charlesworth, S. Risk-based evaluation of the exposure of children to trace elements in playgrounds in Madrid (Spain). Chemosphere 2007, 66, 505–513. [Google Scholar] [CrossRef]
  65. Clay, D. Role of the Baseline Risk Assessment in Superfund Remedy Selection Decisions; Memorandum from D. R. Clay, OSWER 9355.0-30; United States Environmental Protection Agency: Washington, DC, USA, 1991. [Google Scholar]
  66. U.S. EPA (U.S. Environmental Protection Agency). Exposure Factors Handbook. (EPA/600/R-09/052F). Final Report. Washington, DC, USA. Available online: https://cfpub.epa.gov/ncea/risk/recordisplay.cfm?deid=236252 (accessed on 6 July 2022).
  67. U.S. EPA (U.S. Environmental Protection Agency). Drinking Water Standards and Health Advisories. (EPA 822-F-18-001). Washington, DC, USA, 2018. Available online: https://www.epa.gov/system/files/documents/2022-01/dwtable2018.pdf (accessed on 6 July 2022).
  68. Norma Oficial Mexicana NOM-127-SSA1-2021; Agua para uso y Consumo Humano: Límites Permisibles de la Calidad del Agua. Diario Oficial de la Federación: México City, México. Available online: https://www.dof.gob.mx/nota_detalle.php?codigo=5650705&fecha=02/05/2022#gsc.tab=0 (accessed on 29 July 2022).
  69. World Health Organization. Guidelines for Drinking-Water Quality: Fourth Edition Incorporating the First Addendum; World Health Organization: Geneva, Switzerland, 2017; Available online: https://www.who.int/publications/i/item/9789241549950 (accessed on 10 September 2022).
  70. Ghiasvand, A.; Karimpour, M.; Shafaroudi, A.M.; Shahri, M.H. Age and origin of subvolcanic rocks from NE Iran: Link between magmatic “flare-up” and mineralization. Geochemistry 2018, 78, 254–267. [Google Scholar] [CrossRef]
  71. Saleh, H.N.; Panahande, M.; Yousefi, M.; Asghari, F.B.; Conti, G.O.; Talaee, E.; Mohammadi, A.A. Carcinogenic and Non-carcinogenic Risk Assessment of Heavy Metals in Groundwater Wells in Neyshabur Plain, Iran. Biol. Trace Elem. Res. 2019, 190, 251–261. [Google Scholar] [CrossRef]
  72. Jeung, C.M.; Jiao, J.J. Heavy metal and trace element distributions in groundwater in natural slopes and highly urbanized spaces in Mid-Levels area, Hong Kong. Water Res. 2006, 40, 753–767. [Google Scholar]
  73. Fusswinkel, T.; Wagner, T.; Wenzel, T.; Wälle, M.; Lorenz, J. Evolution of unconformity-related MnFeAs vein mineralization, Sailauf (Germany): Insight from major and trace elements in oxide and carbonate minerals. Ore Geol. Rev. 2013, 50, 28–51. [Google Scholar] [CrossRef]
  74. Kumar, M.; Nagdev, R.; Tripathi, R.; Singh, V.B.; Ranjan, P.; Soheb, M.; Ramanathan, A. Geospatial and multivariate analysis of trace metals in tubewell water using for drinking purpose in the upper Gangetic basin, India: Heavy metal pollution index. Groundw. Sustain. Dev. 2019, 8, 122–133. [Google Scholar] [CrossRef]
  75. Karro, E.; Uppin, M. The occurrence and hydrochemistry of fluoride and boron in carbonate aquifer system, central and western Estonia. Environ. Monit. Assess. 2013, 185, 3735–3748. [Google Scholar] [CrossRef]
  76. Neal, C.; Williams, R.J.; Bowes, M.J.; Harrass, M.C.; Neal, M.; Rowland, P.; Wickham, H.; Thacker, S.; Harman, S.; Vincent, C.; et al. Decreasing boron concentrations in UK rivers: Insights into reductions in detergent formulations since the 1990s and within-catchment storage issues. Sci. Total. Environ. 2010, 408, 1374–1385. [Google Scholar] [CrossRef]
  77. Hasenmueller, E.A.; Criss, R.E. Multiple sources of boron in urban surface waters and groundwaters. Sci. Total. Environ. 2013, 447, 235–247. [Google Scholar] [CrossRef]
  78. Gesels, J.; Dollé, F.; Leclercq, J.; Jurado, A.; Brouyère, S. Groundwater quality changes in peri-urban areas of the Walloon region of Belgium. J. Contam. Hydrol. 2021, 240, 103780. [Google Scholar] [CrossRef]
  79. Wagh, V.M.; Panaskar, D.B.; Mukate, S.V.; Gaikwad, S.K.; Muley, A.A.; Varade, A.M. Health risk assessment of heavy metal contamination in groundwater of Kadava River Basin, Nashik, India. Model. Earth Syst. Environ. 2018, 4, 969–980. [Google Scholar] [CrossRef]
  80. Guo, S.-S.; Xu, Y.-H.; Yang, J.-Y. Simulating the migration and species distribution of Cr and inorganic ions from tanneries in the vadose zone. J. Environ. Manag. 2021, 288, 112441. [Google Scholar] [CrossRef] [PubMed]
  81. Alam, M.; Rais, S.; Aslam, M. Hydrochemical investigation and quality assessment of ground water in rural areas of Delhi, India. Environ. Earth Sci. 2012, 66, 97–110. [Google Scholar] [CrossRef]
  82. Groeschke, M.; Frommen, T.; Taute, T.; Schneider, M. The impact of sewage-contaminated river water on groundwater am-monium and arsenic concentrations at a riverbank filtration site in central Delhi, India. Hydrogeol. J. 2017, 25, 2185. [Google Scholar] [CrossRef]
  83. Aithani, D.; Jyethi, D.S.; Siddiqui, Z.; Yadav, A.K.; Khillare, P. Source apportionment, pollution assessment, and ecological and human health risk assessment due to trace metals contaminated groundwater along urban river floodplain. Groundw. Sustain. Dev. 2020, 11, 100445. [Google Scholar] [CrossRef]
  84. Li, X.; Poon, C.-S.; Liu, P.S. Heavy metal contamination of urban soils and street dusts in Hong Kong. Appl. Geochem. 2001, 16, 1361–1368. [Google Scholar] [CrossRef]
  85. Suzuki, K.; Yabuki, T.; Ono, Y. Roadside Rhododendron pulchrum leaves as bioindicators of heavy metal pollution in traffic areas of Okayama, Japan. Environ. Monit. Assess. 2009, 149, 133–141. [Google Scholar] [CrossRef]
  86. Ramesh, K.; Elango, L. Groundwater quality and its suitability for domestic and agricultural use in Tondiar river basin, Tamil Nadu, India. Environ. Monit. Assess. 2012, 184, 3887–3899. [Google Scholar] [CrossRef]
  87. Xiao, J.; Wang, L.; Deng, L.; Jin, Z. Characteristics, sources, water quality and health risk assessment of trace elements in river water and well water in the Chinese Loess Plateau. Sci. Total. Environ. 2019, 650, 2004–2012. [Google Scholar] [CrossRef]
  88. Bai, M.; Zhang, C.; Bai, Y.; Wang, T.; Qu, S.; Qi, H.; Zhang, M.; Tan, C.; Zhang, C. Occurrence and Health Risks of Heavy Metals in Drinking Water of Self-Supplied Wells in Northern China. Int. J. Environ. Res. Public Health 2022, 19, 12517. [Google Scholar] [CrossRef]
  89. Giri, S.; Singh, A.K. Spatial distribution of metal(loid)s in groundwater of a mining dominated area: Recognising metal(loid) sources and assessing carcinogenic and non-carcinogenic human health risk. Int. J. Environ. Anal. Chem. 2016, 96, 1313–1330. [Google Scholar] [CrossRef]
Figure 1. Location Map of the study area.
Water 15 01243 g001
Figure 2. Map showing sample locations in the study area.
Water 15 01243 g002
Figure 3. Schematic flow chart of research methods.
Water 15 01243 g003
Figure 4. Frequency histograms and box plots of metal(oid)s.
Water 15 01243 g004
Figure 5. Spearman correlation plot of metals in MMA groundwater. Note: * means significant correlation at the 0.05 level (two-tailed).
Water 15 01243 g005
Figure 6. Hierarchical dendrogram for metals (Centroid Method).
Water 15 01243 g006
Figure 7. Principal loadings of three principal components after varimax rotation.
Water 15 01243 g007
Figure 8. Spatial distribution of concentration of Al, As, B, Cr, Cu, Fe, Mn, and Zn.
Water 15 01243 g008
Figure 9. (a) Spatial distribution of Hazard index in children; (b) Spatial distribution of Hazard index in adults.
Water 15 01243 g009
Table 1. Statistical summary of concentrations of trace metals in MMA groundwater and permissible limits according to referred standards and WHO guidelines.
Concentration (µg/L)SkewnessKurtosisOutlierspDrinking Water (µg/L)
Avg.Std. Dev.MedianMinimumMaximum(S-W Test)WHO (2022)Secretaria de Salud (2021)U.S. EPA (2018)
Al1.532.540.800.3012.803.8314.8811.7, 12.84.27 × 10−11200 *200200 ***
As0.340.200.300.070.901.171.060.901.07 × 10−31010 **10 ****
B70.3178.9342.507.00389.02.155.71224, 389, 2458.76 × 10−72400--
Cr1.320.911.050.184.561.613.072.7, 2.7, 4.56, 2.72, 3.411.07 × 10−45050100 ***
Cu0.810.840.570.014.172.206.044.17, 3.111.834 × 10−6200020001000 ***
Fe5.243.863.800.9020.401.874.8714.2, 20.42.976 × 10−5-300300 ***
Mn0.470.830.210.074.854.2620.431.17, 1.35, 2.57, 4.855.43 × 10−118015050 ***
Zn24.4786.625.750.90553.05.8736.0024.7, 553, 138, 70.73.59 × 10−13--5000 ***
Notes: p-values of Shapiro–Wilk test for normality of raw data. For values higher than 0.05, distribution is normal. * Recommended limit to ensure optimum coagulation process in drinking-water plants. ** Gradual compliance for arsenic according to the population size. Cities with >500,000 inhabitants (e.g., Monterrey) are after one year of the entry in force of the standard, those with 50,000–500,000 inhabitants are after three years, and those with <50,000 inhabitants are after six years [68]. *** Secondary drinking water regulations (SDWRs): Non-enforceable federal guidelines regarding cosmetic effects or aesthetic effects of drinking water. **** Maximum contaminant level (MCL): The highest level of a contaminant that is allowed in drinking water.
Table 2. Total variance explained for heavy metal contents.
ComponentInitial EigenvaluesExtraction Sums of Squared LoadingsRotation Sums of Squared Loadings
Total% of VarianceCumulative %Total% of VarianceCumulative %Total% of VarianceCumulative %
11.99224.90024.9001.99224.90024.9001.93724.21824.218
21.66320.79245.6931.66320.79245.6931.68621.07145.289
31.15014.37760.0701.15014.37760.0701.18314.78260.070
40.95611.94972.019
50.91211.40483.423
60.6848.55091.973
70.4755.93797.910
80.1672.090100.000
Disclaimer/Publisher’s Note: The statements, opinions and data contained in all publications are solely those of the individual author(s) and contributor(s) and not of MDPI and/or the editor(s). MDPI and/or the editor(s) disclaim responsibility for any injury to people or property resulting from any ideas, methods, instructions or products referred to in the content.

