Article

Evaporation-Assisted Humidification–Dehumidification Cycles for Desalination Application in Tropical and Subtropical Regions

1
Date Palm Research Center of Excellence, King Faisal University, Al-Ahsa 31982, Saudi Arabia
2
Agricultural and Biosystems Engineering Department, Faculty of Agriculture, Menoufia University, Shebin El Koum 32514, Egypt
3
Department of Food and Nutrition Sciences, College of Agricultural and Food Sciences, King Faisal University, Al-Ahsa 31982, Saudi Arabia
4
Department of Agricultural Engineering, Faculty of Agricultural Sciences & Technology, Bahauddin Zakariya University, Multan 60800, Pakistan
*
Authors to whom correspondence should be addressed.
Water 2023, 15(6), 1125; https://doi.org/10.3390/w15061125
Submission received: 13 February 2023 / Revised: 6 March 2023 / Accepted: 13 March 2023 / Published: 15 March 2023
(This article belongs to the Special Issue Advanced Technology for Desalination and Water Purification)

Abstract

:
The present study aims to evaluate the performance of evaporation-assisted humidification–dehumidification (E-HDH) desalination, specifically direct evaporative (DE-HDH), indirect evaporative (IE-HDH), and Maisotsenko evaporative (ME-HDH) systems. To achieve this, a thermodynamic modeling approach is utilized, which incorporates the wet bulb effectiveness method, psychrometric relationships of humid air, and equations that govern heat and mass balance. The key performance indicators of the studied E-HDH desalination systems are estimated concerning operating parameters. The results show that the ME-HDH system is capable of producing a comparatively higher water production rate (WPR) ranging between 0.01 and 7.92 g/s as compared to the DE-HDH and IE-HDH systems. The sensible cooling flux was observed to be high at a dry-bulb temperature (Tdb) of 50 °C and relative humidity (RH) < 0.2, having a value of 5.26 kW for the DE-HDH system, followed by the ME-HDH system (3.23 kW) and the IE-HDH system (3.11 kW) due to relatively high mass flow rates. The latent heat flux was observed to be relatively high in the case of the ME-HDH system. Minimum specific energy consumption was observed from the ME-HDH system, and consequently, a maximum gain output ratio (3.32) was realized. In addition, the study realized that an increment in air velocity and wet bulb effectiveness significantly improves the WPR. In accordance with the climatic conditions of the studied Saudi Arabia cities, it has been realized that Al-Hofuf and Riyadh produce relatively high WPRs with minimum energy consumption. In the case of Al-Hofuf, the average WPR was recorded as 185.51 kg/day, followed by Riyadh (180.33 kg/day). The energy required was estimated to be 0.042 kWh/kg and 0.034 kWh/kg for both cities, accordingly.

1. Introduction

The Earth’s surface is predominantly covered by water, with approximately 71% of its surface area comprising water bodies. According to the United States Geological Survey (USGS), approximately 97.4% of the Earth’s water is saline, consisting of oceans and other saltwater bodies, while only 2.5% is available as a freshwater [1]. However, two-thirds of the freshwater on the planet is trapped in glaciers, snow, and ice, which are inaccessible [2,3]. Since the population has grown at an exponential pace, there has been a considerable rise in freshwater demand, resulting in water scarcity, which will affect nearly five billion people by 2050 [4,5]. Due to increasing demands for freshwater resources and ongoing population expansion, the natural water cycle is becoming increasingly strained [6]. By 2025, projections suggest that half of the world’s population will reside in water-stressed regions, which is a substantial increase from the current figure of approximately one-third [7,8]. On the other hand, per person, the daily water requirement will increase by 3–5-fold [9]. In addition, the Earth’s increasing temperature, high CO2, and greenhouse gas (GHG) emissions have consequently produced historical impacts on rainfall patterns [10], leading to the occurrence of short-term droughts [11,12]. According to recent statistics revealed by the United Nations (UN), the frequency of climate- and weather-related catastrophes has increased by five-fold [13,14]. The need to address global water scarcity requires the development of sustainable water solutions. Desalination is a remarkable approach and/or method to obtain freshwater from the ample seawater in order to satisfy the global thirst [15].
Different desalination methods have been envisioned, implemented, and commercialized at a global scale in the desalination market. In the broader scenario, desalination technologies have been categorized into (i) thermally driven and (ii) and non-thermally driven technologies [16,17]. The thermal technologies include multi-stage flash (MSF) desalination [18,19], multi-effect desalination (MED) [20,21,22], adsorption desalination (AD) [23,24,25], and humidification–dehumidification (HDH) desalination, etc. These technologies require a primary heating source to produce a salt-free water. On the other hand, non-thermal technologies include membrane filtration (MF), reverse osmosis (RO), electrodialysis (ED), and vapor compression (VC), which ultimately require a significant amount of electricity to operate the desalination module. Among thermal desalination technologies, MSF and MED, and among non-thermal desalination technologies, RO are well-matured technologies widely practiced in desalination markets [26,27]. These technologies produce a significantly massive quantity of desalinated water (i.e., 45–65% of the recovery ratio); however, they contain system discrepancies that entail environmental consequences [11]. For instance, it was reported that approximately 10,000 tonnes of oil per year (t/y) is being utilized to produce 1000 cubic meters of freshwater per day (m3/day) which is not expensive but is energy-intensive [28]. Furthermore, CO2 and GHG emissions degrade the climate at a significantly higher pace. MSF contributes 6.9 kg of CO2 per m3 of water (kg CO2/m3), followed by MED (5.5 kg CO2/m3) and RO (3.8 kg CO2/m3) [29]. If current emission rates and climate policies continue, the global temperature is projected to increase by a range of 2.5 to 2.9 °C, as shown in Figure 1. In addition, the concentrated brine produced as a by-product causes aquatic discrepancies [11,30]. In this context, environmentally sustainable, low-cost, nature-based solutions (NBSs) are principally required to confront the water challenges and simultaneously provide environmental stability.
The AD desalination technology could be a potential solution for desalination because of its prominent capability to function with low-grade waste heat or even with renewable energy sources that scavenge heat from the ambient environment. These technologies meet the standards of zero-carbon emission (ZCE) with zero/minimal liquid brine discharge (ZLD) [32]. In AD, the adsorbent material is the vital entity that can mutually have hydrophilic and hydrophobic properties corresponding to the operating temperature and pressure [33,34,35,36]. The freshwater production rate mainly depends upon the adsorption capacity of the adsorbent material and the number of cycles accomplished per day [37,38,39]. HDH desalination is also an NBS, having significant potential to remove salt from seawater. The classification of HDH desalination configurations is presented in Figure 2.
Qasim and Zubair et al. [40] reported that the integration of HDH with AD packed with silica gel as an adsorbent to produce freshwater of 22 kg per hour (kg/h) with an estimated cost of USD 6.34/m3. Khalil et al. [41] reported that a bubble column humidifier–dehumidifier can produce 21 kg/day, having a gain output ratio (GOR) of 0.53. Wu et al. [42] investigated a solar-powered single-effect closed-air open-water heated HDH cycle and found that high temperature degrades the amount of work that could be required from the HDH desalination system. Muthusamy and Sridhar [43] presented a modified HDH cycle to simultaneously boost freshwater output and decrease energy requirements. It was realized that the improved HDH desalination cycle can save up to 40% of power compared to conventional cycles. Müller-Holst et al. [44] used a multi-effect HDH desalination cycle in order to increase the system productivity. Elkader et al. [45] performed experimentation on HDH desalination driven with solar energy and reported the water production capacity of 7.26–11 kg/m2 during summer and 2–3.5 kg/m2 in winter.
The process of humidification primarily involves the utilization of evaporators. Different kinds of evaporators have been investigated for cooling applications [46,47,48]. For instance, Asfahan et al. [49] employed artificial intelligence (AI) to anticipate the performance of direct, indirect, and Maisotsenko evaporators for cooling applications. However, the aforementioned evaporative cooling systems have not been explored to their full potential for desalination, despite having the ability to produce freshwater. In this regard, the present study aims to investigate evaporation-assisted humidification–dehumidification (E-HDH) cycles for desalination. In this context, three brackish/saline water evaporators are studied, termed as direct evaporative humidification–dehumidification (DE-HDH) desalination, indirect evaporative humidification–dehumidification (IE-HDH) desalination, and Maisotsenko evaporative humidification–dehumidification (ME-HDH) desalination, which are distinguished based on their psychrometric renewable energy potentials and operating mechanisms. The prime objective of the present study was to explore the desalination potentials that could be acquired from DE-HDH, IE-HDH, and ME-HDH in accordance with different driving conditions and climatic scenarios. To achieve this, a thermodynamic model was designed which primarily relies on the analytical energy and mass balance equations incorporating the psychrometric properties of saturated dry air streams. The effectiveness method was used to investigate the performance of the evaporators. In addition, the effect of air velocity and the effectiveness of the evaporators were explored, corresponding to freshwater production potential. The key performance indicators such as (i) water production rate (WPR), (ii) cooling flux, (iii) latent heat flux, sensible heat factor (SHF), (iv) latent heat factor (LHF), (v) specific energy consumption (SEC), and (vi) gain output ratio were derived in order to evaluate the system from the perspectives of determining a promising evaporator type for desalination. Furthermore, the analysis was extended to identify the promising regions defined by the Köppen–Geiger climatic classifications. This study contributes to the current understanding of the E-HDH desalination systems and their potential for addressing water scarcity issues.

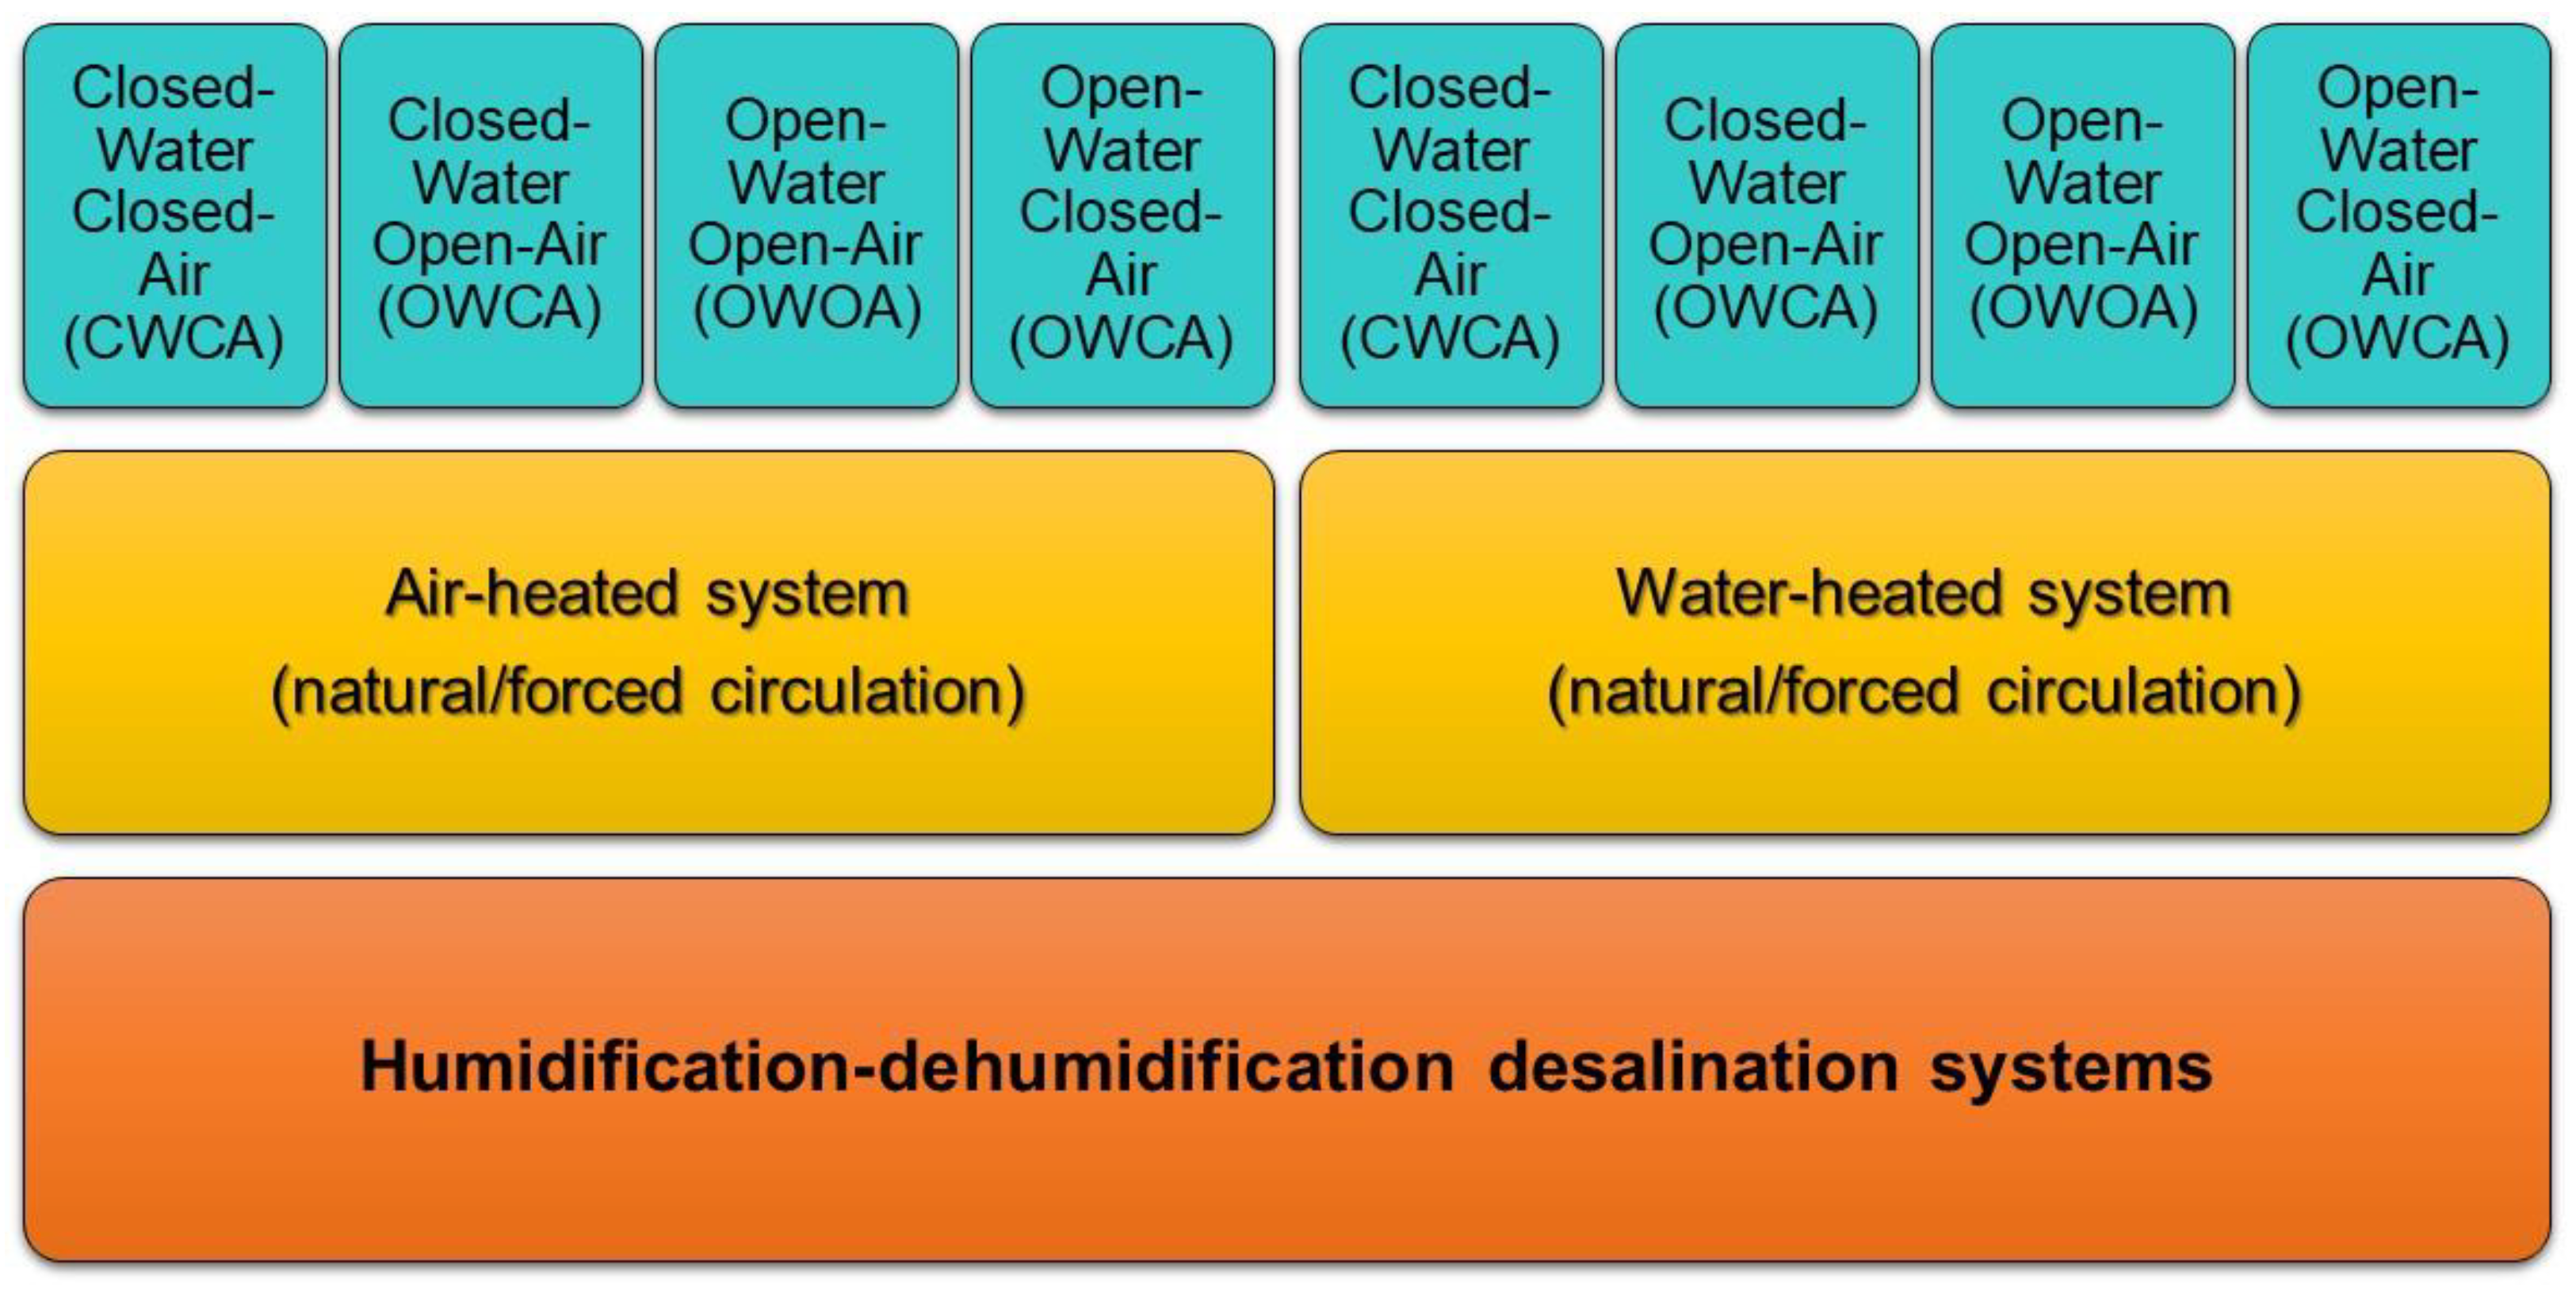
2. Evaporation-Assisted HDH Desalination Cycles

2.1. Direct Evaporative (DE-HDH)

Figure 3 shows the schematic of the DE-HDH desalination system (top) coupled with its psychrometric cycle (lower left). The components of DE-HDH include an air-supplying fan, brine cassette, air channel, and condenser/dehumidifier. The process executes from the supply of the warm air (w1) to the wet channel. The brine cassette acts as a barrier and is placed in the way of the supplied air, as shown in Figure 3 (lower right). The brine cassette contains a wicking media that absorbs the water molecules. The wicking media used in direct evaporative cooling systems include aspen pads, cellulose fiber, jute, cotton fiber, etc. [50]. In the present study, the wet bulb effectiveness of biodegradable cooling pads, locally termed as khus, was considered for the DE-HDH system in order to develop a thermodynamic model, as available via [51]. As the w1 (inlet air state) makes indirect contact with the wicking media, it utilizes sensible heat and evaporates the water molecules. The phase transition from liquid water to water vapor produces a cooling effect, leading to a decrease in the temperature of the supplied air stream (w1) and its approach to the wet-bulb temperature (Twb). However, the magnitude of this temperature reduction depends on the system’s effectiveness. The humidified cooled air state (w2) is established in the wet channel and is then directed to the condenser/dehumidifier. The temperature of the coolant resident in the condenser/dehumidifier should be less than Twb of the w1. The latent heat transformation gradient is established upon direct contact of w2 air with the condenser/dehumidifier, causing it to produce salt-free water via the condensation process. Consequently, a cool dry air state (d1) is obtained and can be utilized in cooling applications.

2.2. Indirect Evaporative (IE-HDH)

The workings of IE-HDH are very similar to the DE-HDH; however, they are distinguished because IE-HDH contains two wet channels and one dry channel, as shown in Figure 4. The system is termed as IEC because of the indirect approach of producing a cooling effect and maintaining the constant humidity ratio (H.R). Like DE-HDH, the cooling capacity of the IE-HDH is the function of the IE system effectiveness and the Twb of the supplied warm air stream (w1). Due to conductive/convective heat transfer between the walls of the wet/dry channels, sensible cooling takes place in the dry channel, whereas the humidification cooling will take place in the wet channel, and the cycle approaches the d1 and w2 states, respectively. However, in the case of IE-HDH, the d1 state of the air stream is again directed to the second wet channel, where humidification cooling happens due to the presence of the brine cassette. As a result, additional humidification cooling occurs, which further lowers the temperature and approaches w3 air states. The w2 and w3 air streams dehumidify to produce freshwater. Figure 4 indicates the configuration of the IE-HDH (top) along with the psychrometric cyclic presentation (lower right).

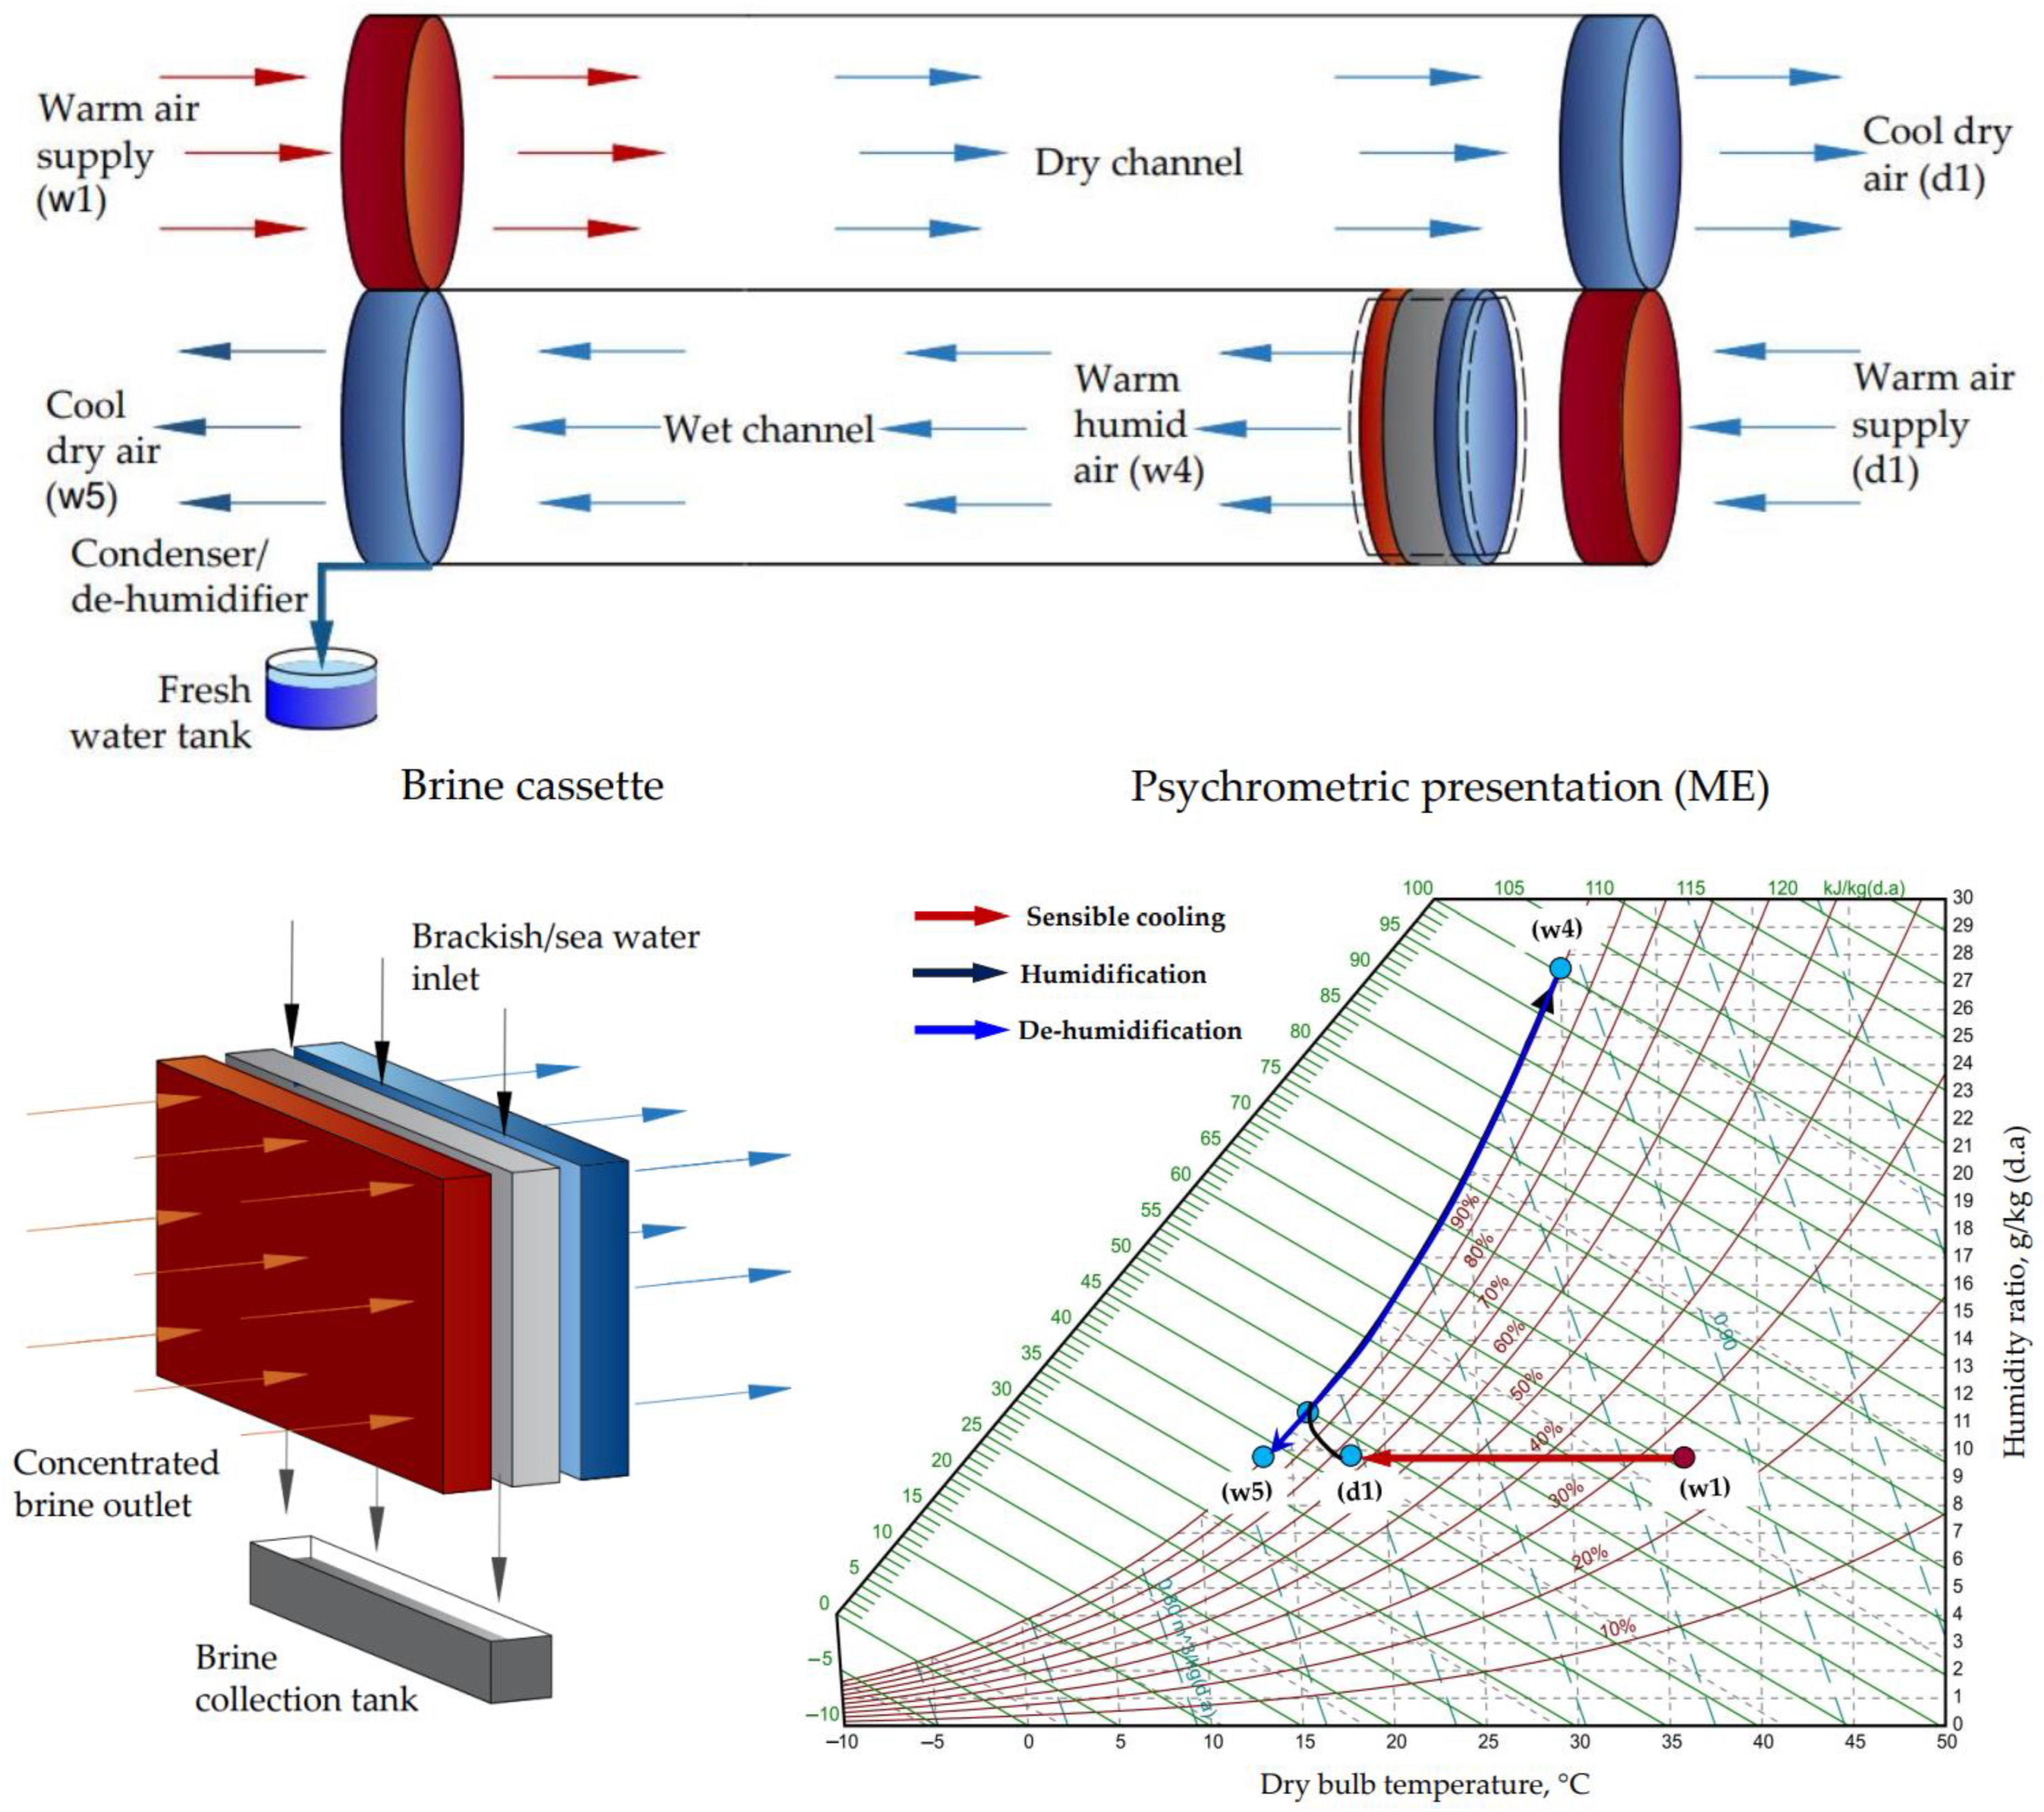
2.3. Maisotsenko Evaporative (ME-HDH)

Several configurations of M-cycle were developed in the past for cooling applications, comprising two channels, three channels, and even more [52,53]. However, in the present study, two channels, a (i) dry channel and (ii) wet channel, were considered to thermodynamically evaluate the system. Figure 5 shows the working schematic of the ME-HDH conception (top) along with its psychrometric presentation. The wet channel contains the brine cassette which allows the supplied air stream to humidify, whereas the dry channel is mainly responsible for producing sensible cooling. As compared to DE-HDH and IE-HDH, ME-HDH has the potential to achieve the dew-point temperature (Tdp) of the supplied warm air; however, this depends upon the system’s effectiveness. The ME-HDH desalination cycle initiates by entering the warm air of state (w1) in the dry channel. Due to convective heat transformation from the wet channel, the w1 air sensibly cools and reaches Tdp, being in state d1. The d1-state air is again directed into the wet channel. Due to the presence of the brine cassette in the wet channel, the air becomes humidified and reaches the w4 state, as shown in the psychrometric cycle of Figure 5 (lower right), while maintaining 100% relative humidity. Once the humidification process is complete, the warm humid air (w4) is directed to the condenser/dehumidifier. The dehumidified water vapors are then collected as salt-free water, and the air stream of the w4 state could be utilized for cooling applications. The extended details relevant to the working of ME-HDH desalination are available via [54].

3. Methodology

The thermodynamic modeling strategy was used to explore the potential of the E-HDH desalination systems based on the effectiveness method, psychrometric relationships, and governing heat and mass balance equations. The effectiveness method is well recognized to determine the performance of evaporative cooling systems [49,55,56,57]. In this regard, the wet bulb effectiveness ( ε wb ) is used for the thermodynamic modeling of the studied DE-HDH, IE-HDH, and ME-HDH systems, as given by Equation (1) to Equation (3), respectively.
ε wb , DEC = T in , w 1 T out , w 2 T in , w 1 T wb , in
ε wb , IEC = T in , w 1 , d 1 T out , w 2 , w 3 T in , w 1 , d 1 T wb , in , w 1 , d 1
ε wb , MEC = T in , w 1 T out , d 1 T in , w 1 T wb , w 1
where T is the dry-bulb temperature (K), and Twb is the wet bulb temperature (K). The subscript in and out refers to the inlet and outlet states, respectively, whereas letters w and d and numeric identities such as 1, 2 and 3 indicate the channel names and points provided on the psychrometric presentation in the previous section for each E-HDH desalination system. The ε wb DE, IE, and ME systems range between 65% and 95%, 45% and 60%, and 65% and 98%, respectively, as shown in Figure 6 and available via [55].
Therefore, in the present study, the ε wb of 95% was taken for the DE-HDH system, 58% for the IE-HDH system, and lastly, 98% for the ME-HDH system. Table 1 provides the physical and operational parameters taken for the E-HDH desalination systems, as available via [51].
Furthermore, the modeling strategy incorporated the HAPropsSI function obtained from CoolProp library [58] to enable the real-time utilization of the thermodynamic properties of the humid air. However, to explore the theoretical desalination potential from the ME-HDH desalination cycle, the estimation of the saturation point (w2 in the psychrometric presentation of the ME-HDH desalination cycle) is quite important. Different strategies are being adopted to determine the w2 point. For instance, the Macline approach [59], Stoitchkov approach [60], and Alonso approach [61] are being investigated based on analytical equations. However, the approaches are coupled with the several limitations and require high computation [59]. Therefore, a simplified approach of the effectiveness method was used based on the experimental results obtained, available via [62], termed as humidity effectiveness, which measured 5.002% based on the Twb. Ideally, it has been observed that, during the humidification process in the secondary channel of the ME-HDH system, the air stream achieves the temperature equivalent to the supplied brackish water temperature along with an RH of 1.0 [52].
Finally, the performance of the E-HDH desalination systems was explored with respect to the climatic scenario of Saudi Arabia. In this regard, three years of hourly Tdb as well RH data were used to estimate the desalination potential of four cities in Saudi Arabia, namely, (i) Al-Hofuf, (ii) Dammam, (iii) Jeddah, and (iv) Riyadh. The hourly Tdb and RH data are provided in Appendix A. However, daily average values of Tdb and RH were utilized for the analysis, accordingly.

4. Results and Discussion

In this section, the performance of the three studied E-HDH desalination concepts is discussed and compared based on the key performance indicators described in subsequent subsections.

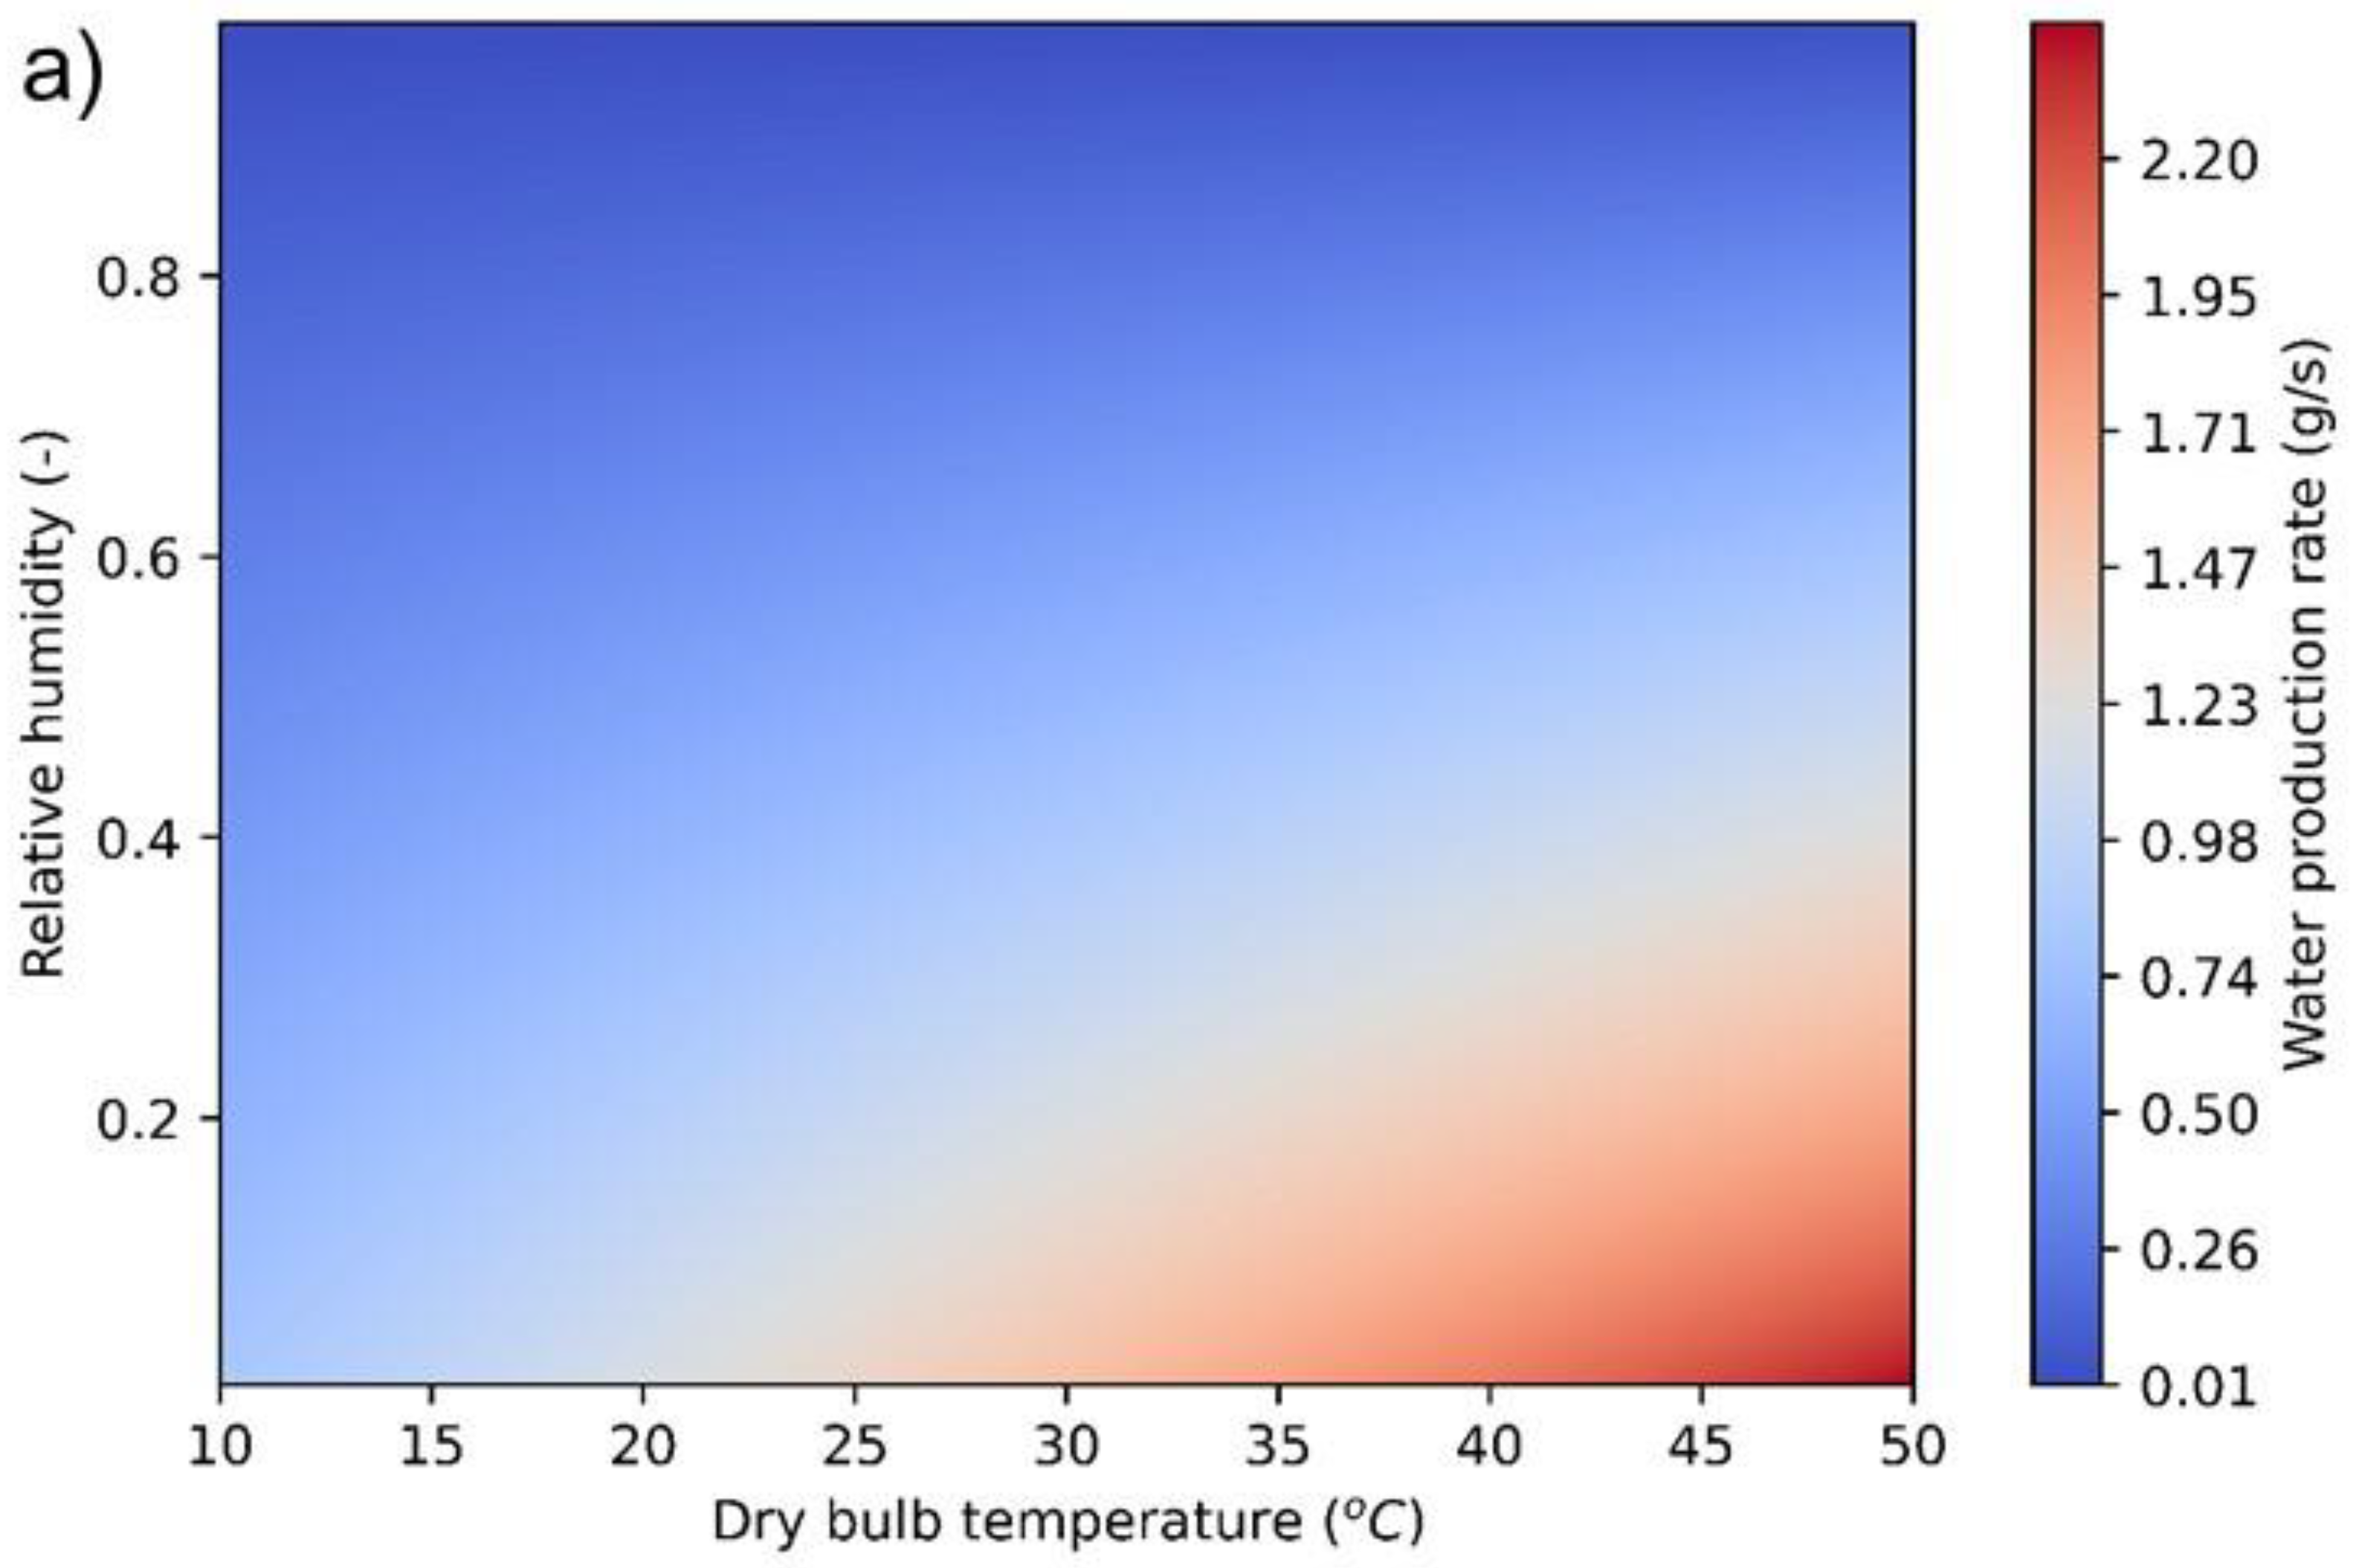
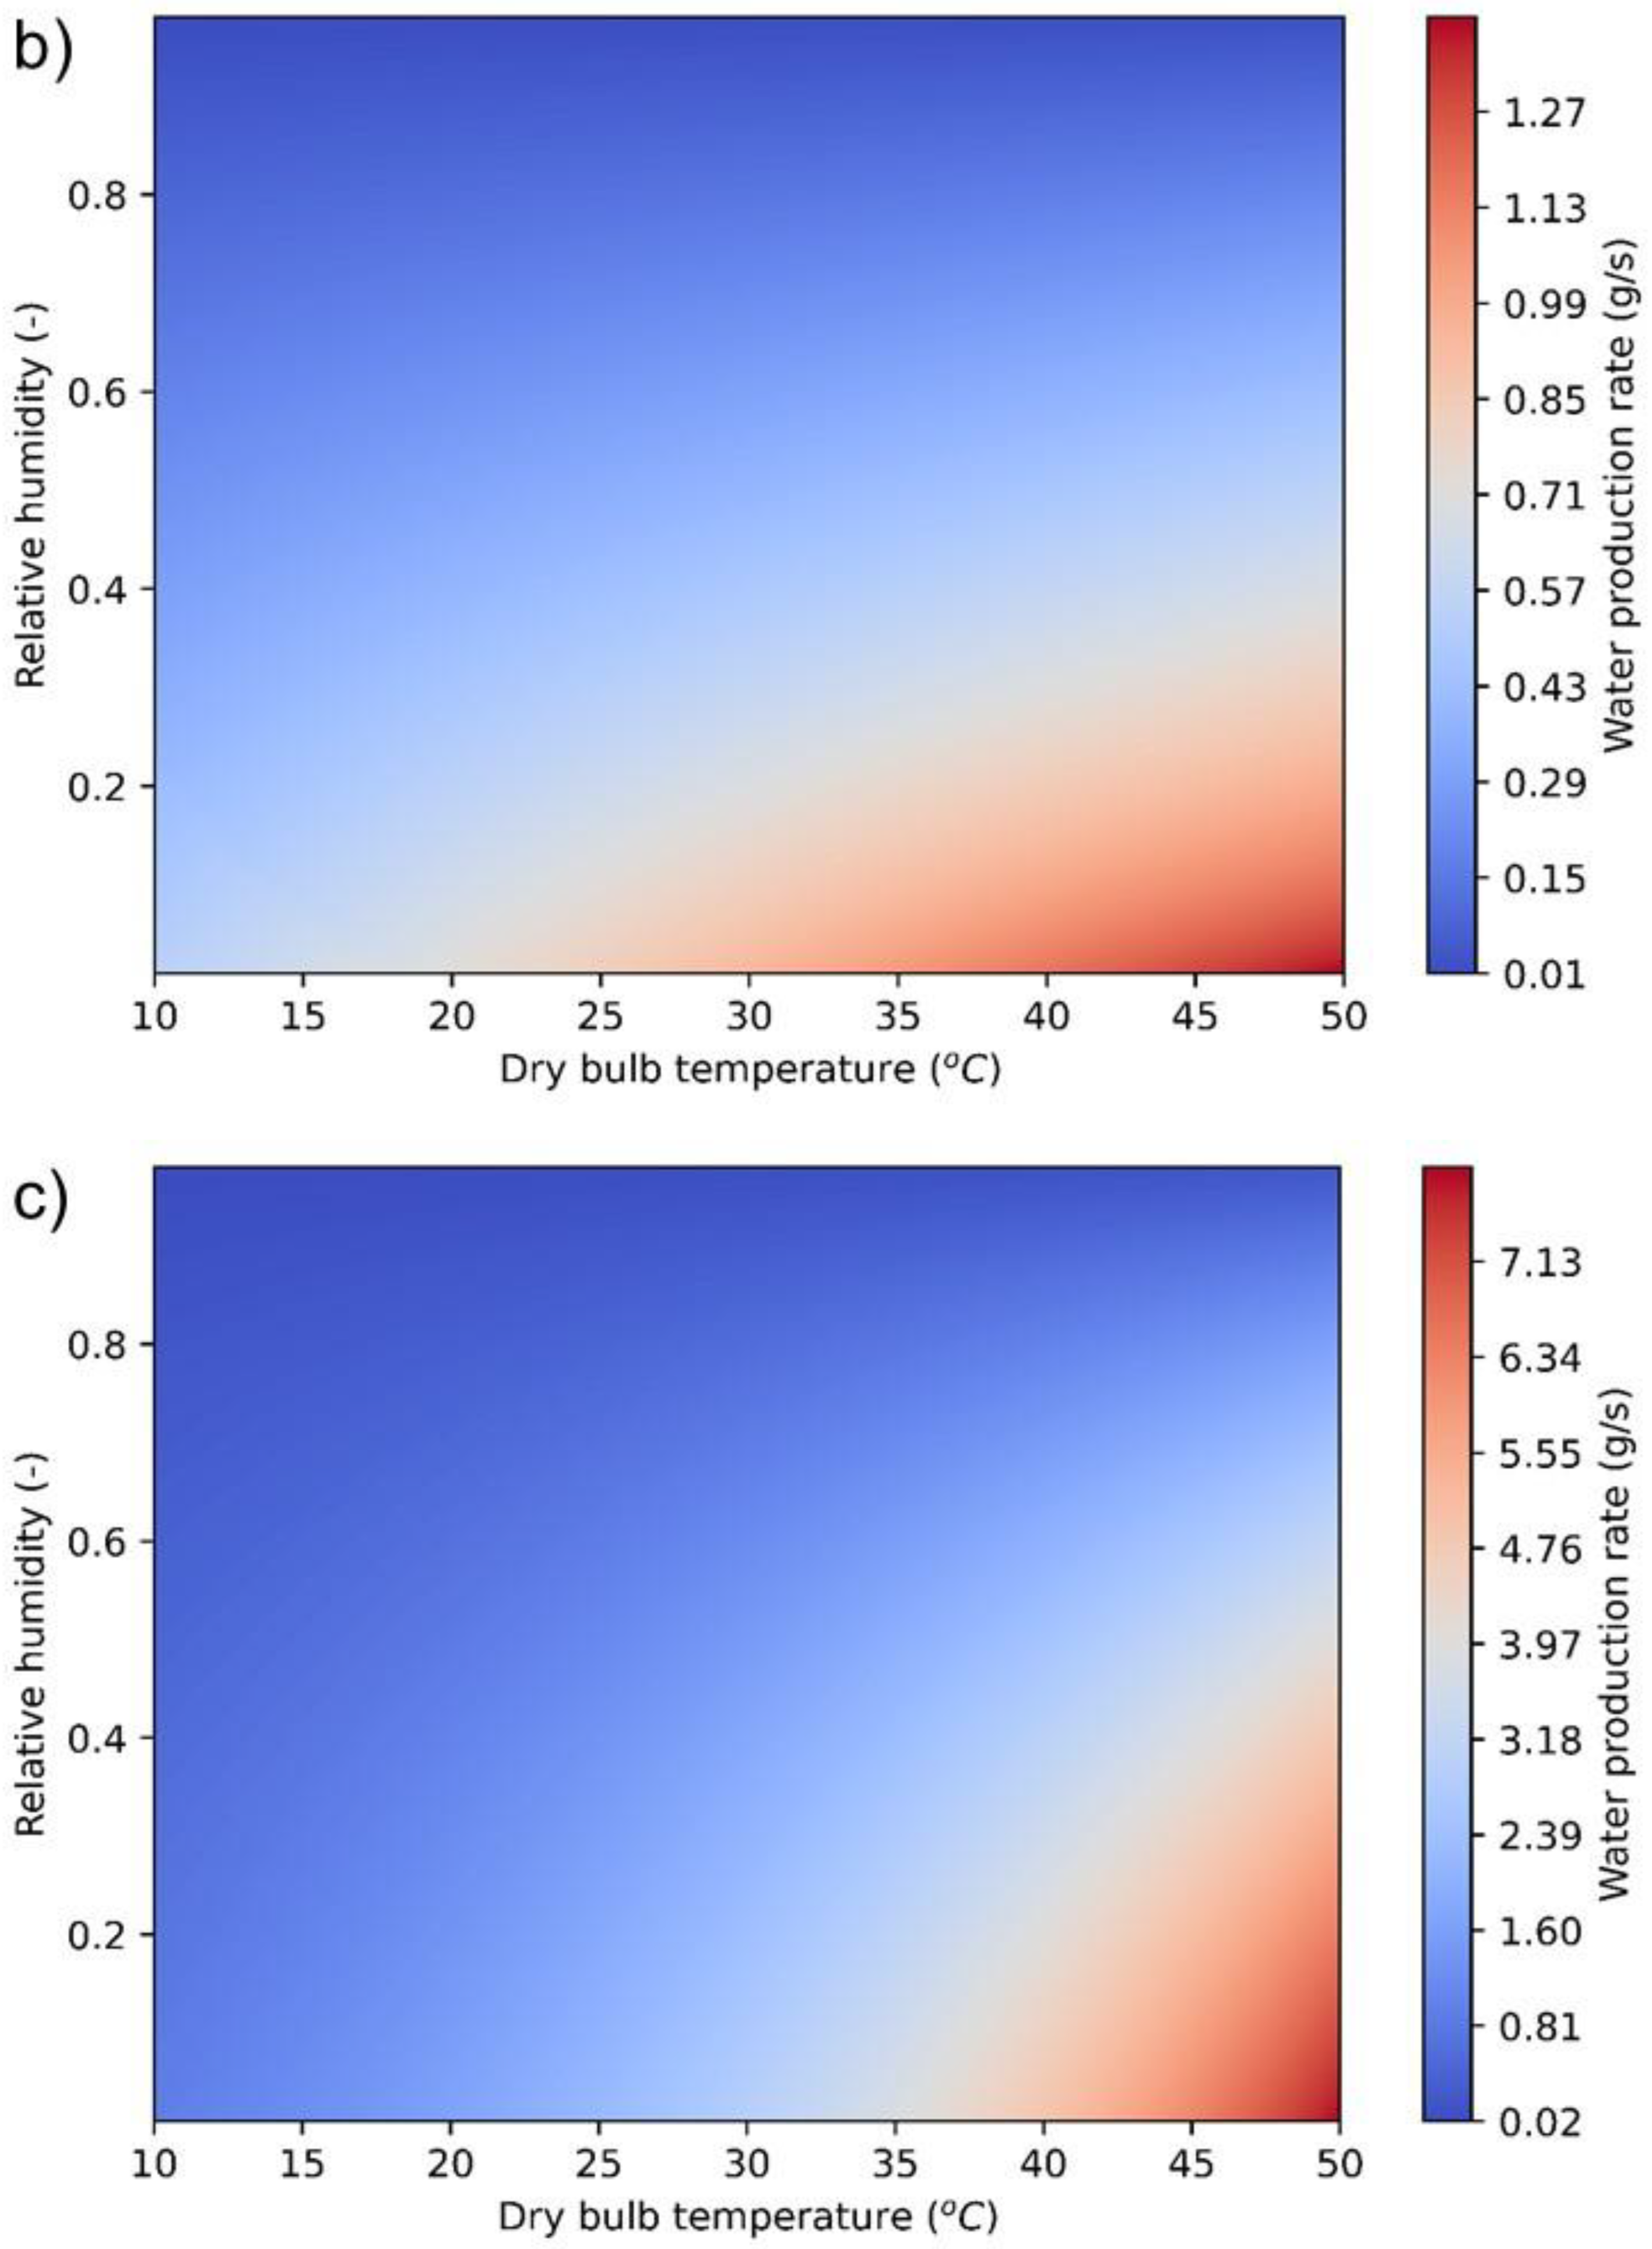
4.1. Water Production Rate

The water production rate (WPR) of the studied E-HDH desalination systems were estimated using Equations (4)–(6) for DE-HDH, IE-HDH, and ME-HDH systems, respectively, as shown:
WPR DE HDH = m ˙ ( x w 2 x d 1 )
WPR IE HDH = m ˙ [ ( x w 2 x d 2 ) + ( x w 3 + x d 4 ) ]
WPR ME HDH = m ˙ ( x w 2 x d 3 )
where m ˙ is the mass flow rate of supplied air (kg/s) and x is the humidity ratio (kg/kg) corresponding to the air channel acronym in the subscripts. The estimated WPR corresponds to changes in Tdb and RH varying from 10 to 50 °C and 0.1 to 1.0, respectively. In addition, the inlet air velocity was taken as 2.0 m/s for the DE-HDH system, whereas for the IE-HDH and ME-HDH systems, 4.0 m/s was selected, as available via [51]. The results are presented in Figure 7. It was realized that the WPR increased with respect to an increase in Tdb and a decrease in RH. For instance, in the case of the DE-HDH system, the WPR was observed to be ~0.98 g/s at a Tdb of 10 °C and RH of 0.1. However, as the Tdb increased to 50 °C, the WPR was estimated to be 2.45 g/s at an RH = 0.1. On the other hand, a WPR approaching the minimum corresponded to an increase in RH values. It was observed that beyond the RH of 0.8, the DE-HDH system had a WPR of 0.01 to 0.12 g/s and was found to be relatively less influential to Tdb. The IE-HDH system had a relatively low WPR compared to the DE-HDH system. Despite having two wet channels in the IE-HDH system, the WPR ranged between 0.01 and 1.41 g/s. This was mainly due to the ε wb , IEC and m ˙ subjected into the wet channels, which were taken less as compared to DE-HDH, as available via [51]. In addition, compared to DE-HDH, the cross-sectional area of the IE-HDH wet channels was 0.25 times lower [51]. Consequently, this influenced the overall productivity of the IE-HDH system. On the other hand, the WPR of the ME-HDH system ranged between 0.02 and 7.92 g/s depending upon the Tdb and RH values, accordingly. Similar results are also available in the literature via [52], thereby disclosing the validity of the modeling strategy followed in the present study. However, it is worth mentioning that ME-HDH was not functional and/or produced a relatively small WPR when the RH values were between 0.75 and 1.0.

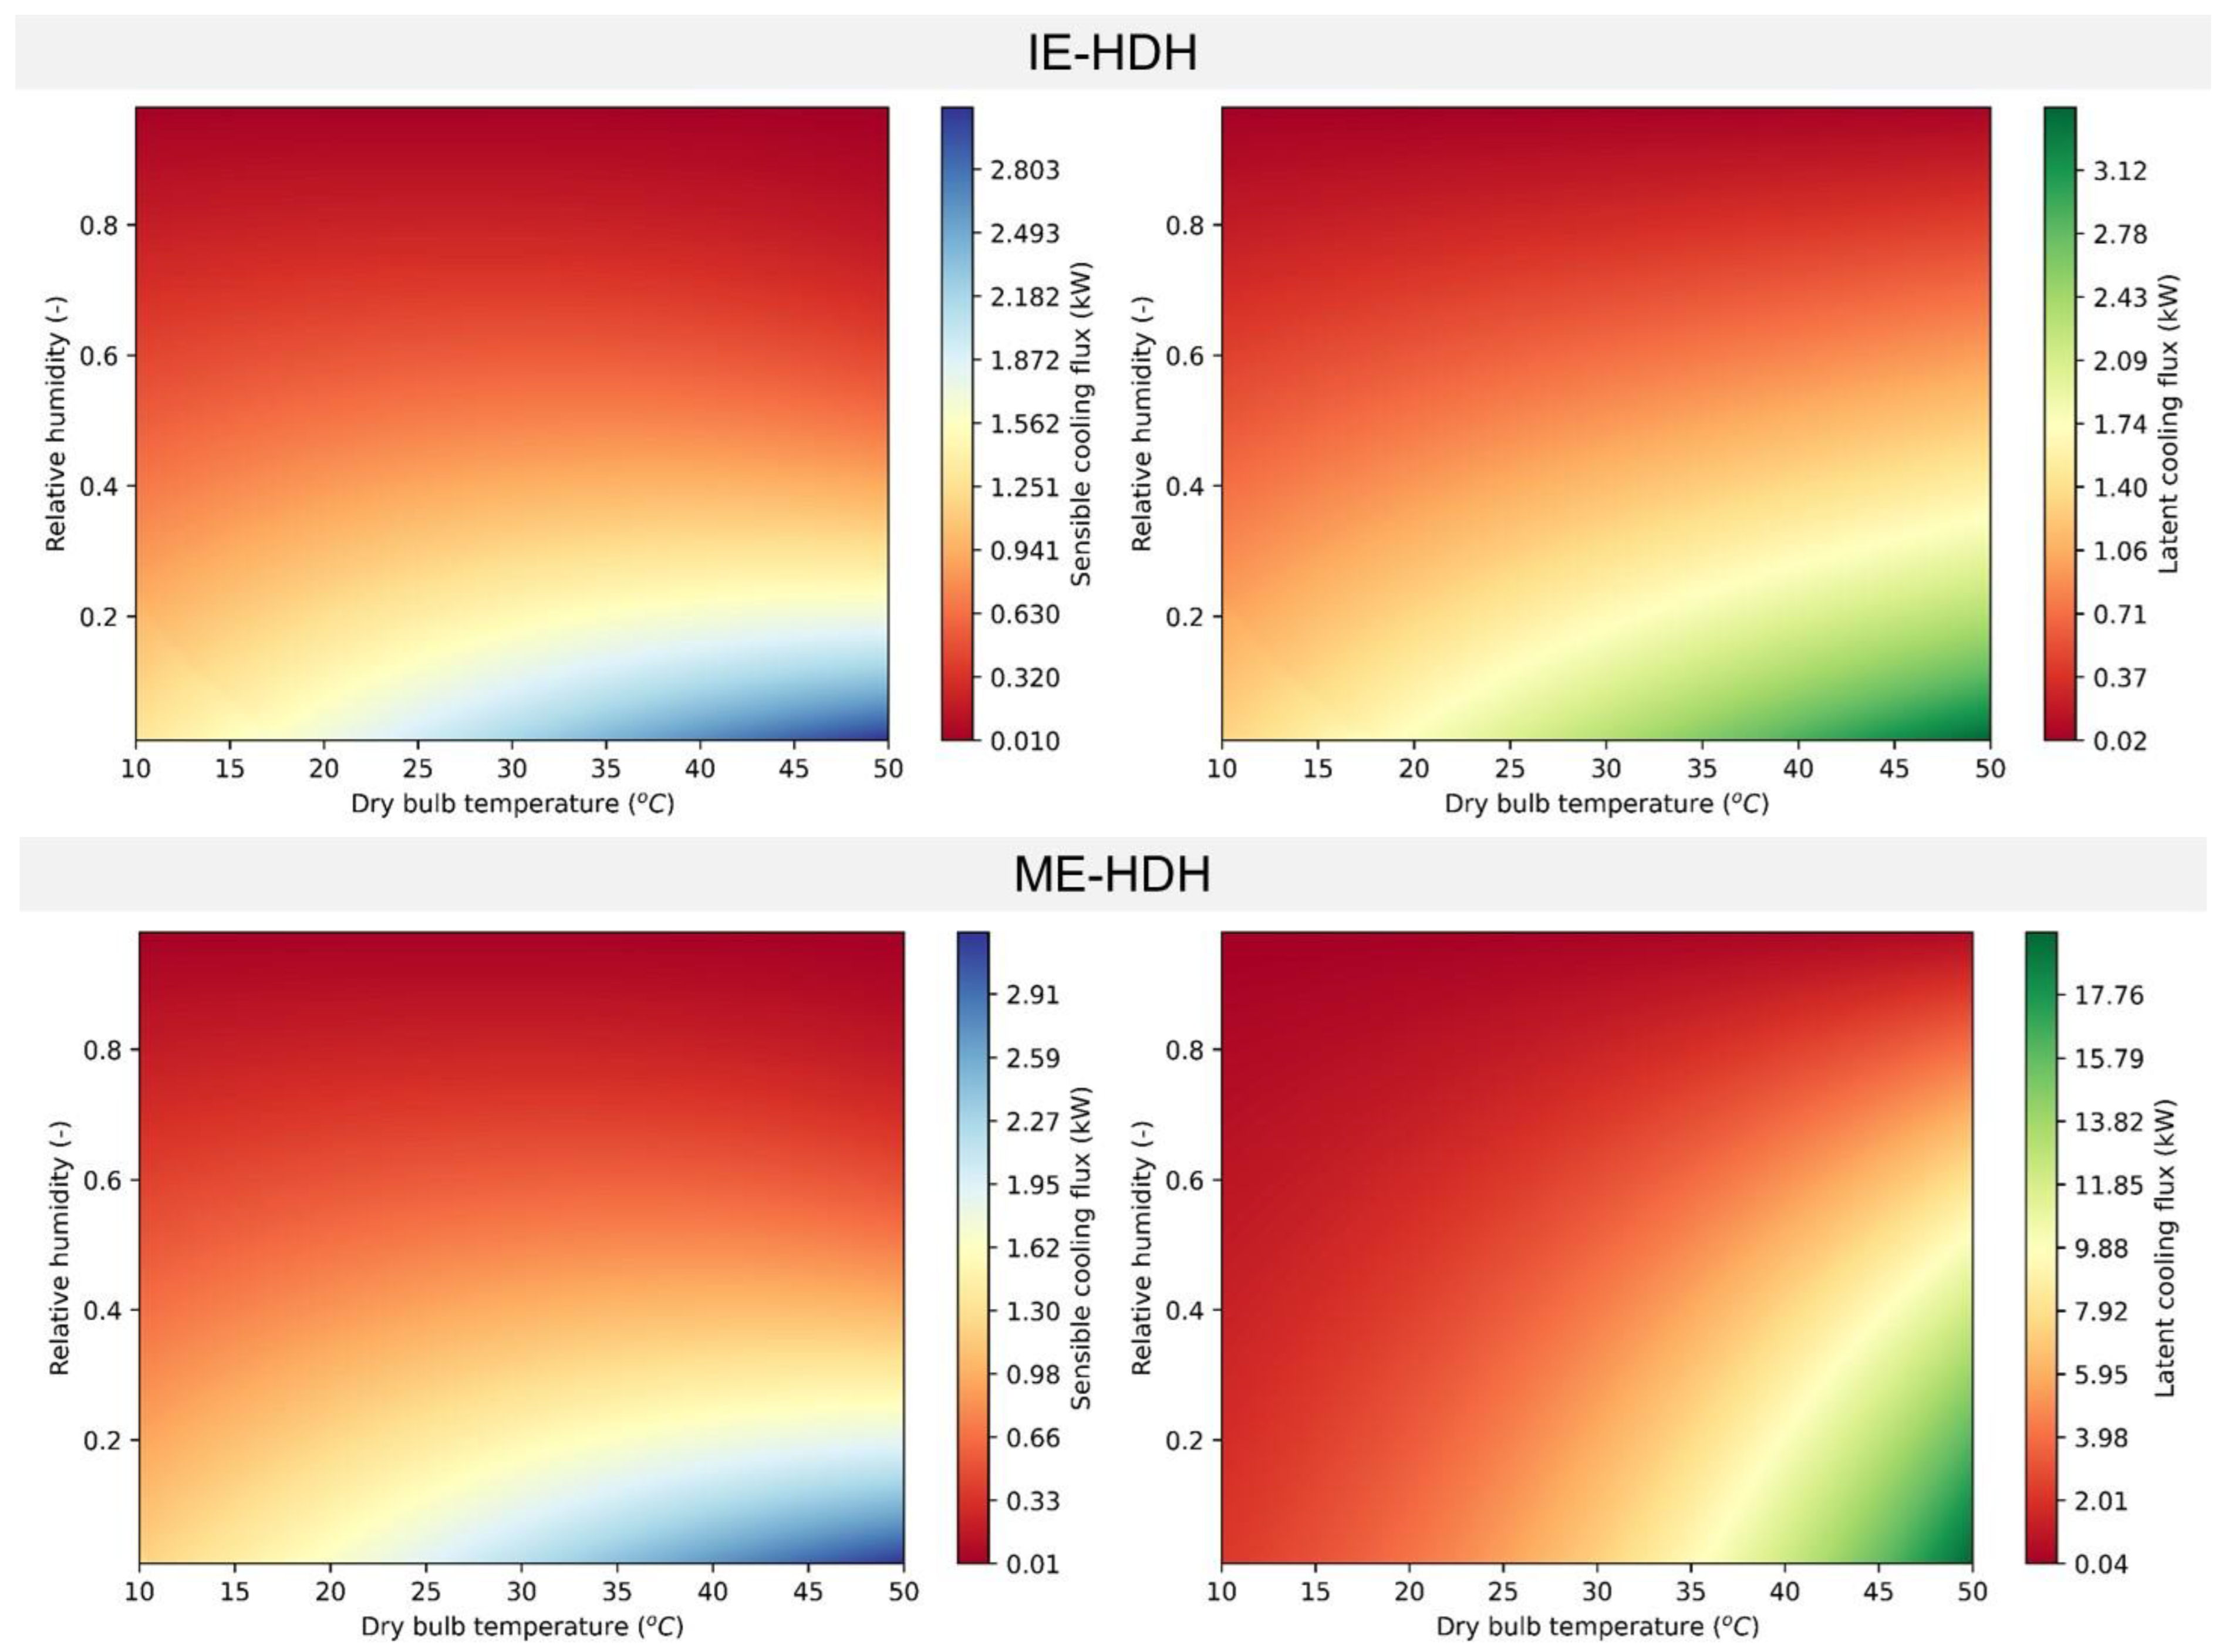
4.2. Sensible and Latent Cooling Fluxes

The sensible cooling flux (Qc,, kW) and latent cooling flux (Qlat, kW) of the studied E-HDH desalination systems were estimated using Equations (7) and (8), as shown:
Q c = m ˙ c p @ T ( T in T out )
Q lat = WPR E HDH ( h fg ) @ T
In Equation (7), cp is the specific heat capacity of air (J/kg.K) changes corresponding to the inlet temperature (Tin, K) and outlet temperature (Tout, K) of the air streams. In Equation (8), Qlat is estimated based on the WPR obtained from each E-HDH system into the latent heat of vaporization (hfg, J/g). The corresponding cp and hfg values are obtained from the CoolProp using the HAPropsSI function. The results of Qc and Qlat are presented in Figure 8 corresponding to changes in Tdb and RH, accordingly. The Qc of all the studied E-HDH increased with respect to increases in Tdb as well as decreases in RH. This is because when the Tdb increased, the water holding capacity of the supplied dry air stream increased, which allowed more saline water to evaporate [63]. On the other hand, an increase in the RH reflected the accomplishment of the water-holding capacity of the supplied air stream, consequently minimizing the mass transport between the saline water cassette and the inlet air stream. For all the studied E-HDH systems, the Qc values approached the minimum value as the RH values increased from 0.8. In the case of the DE-HDH system, the Qc values ranged between 0.02 and 5.26 kW. According to psychrometric concepts of evaporative cooling systems, the ME-HDH system produced the maximum Qc because the dew-point temperature was achieved at a constant humidity ratio. However, in the present scenario, the ME-HDH system produced a relatively lower Qc value ranging between 0.01 and 3.23 kW, followed by the IE-HDH system, as compared to the DE-HDH system. The reason for this is that the ε wb , MEC (98%) of the ME-HDH was nearly close to the ε wb , DEC (95%), and there were also different mass flow rates and cross-sectional areas, as available via [51].
The Qlat in the case of the ME-HDH system was estimated to be 19.73 kW, followed by the DE-HDH system (5.93 kW) and IE-HDH system (3.46 kW) at an inlet Tdb and RH of 50 °C and 0.1, respectively. This is because the air leaving the ME-HDH humidified with the RH value of 1.0 [52,64]. Consequently, high water vapor mass transport was estimated as compared to the DE-HDH and IE-HDH, which followed the isenthalpic process to humidify the air stream.

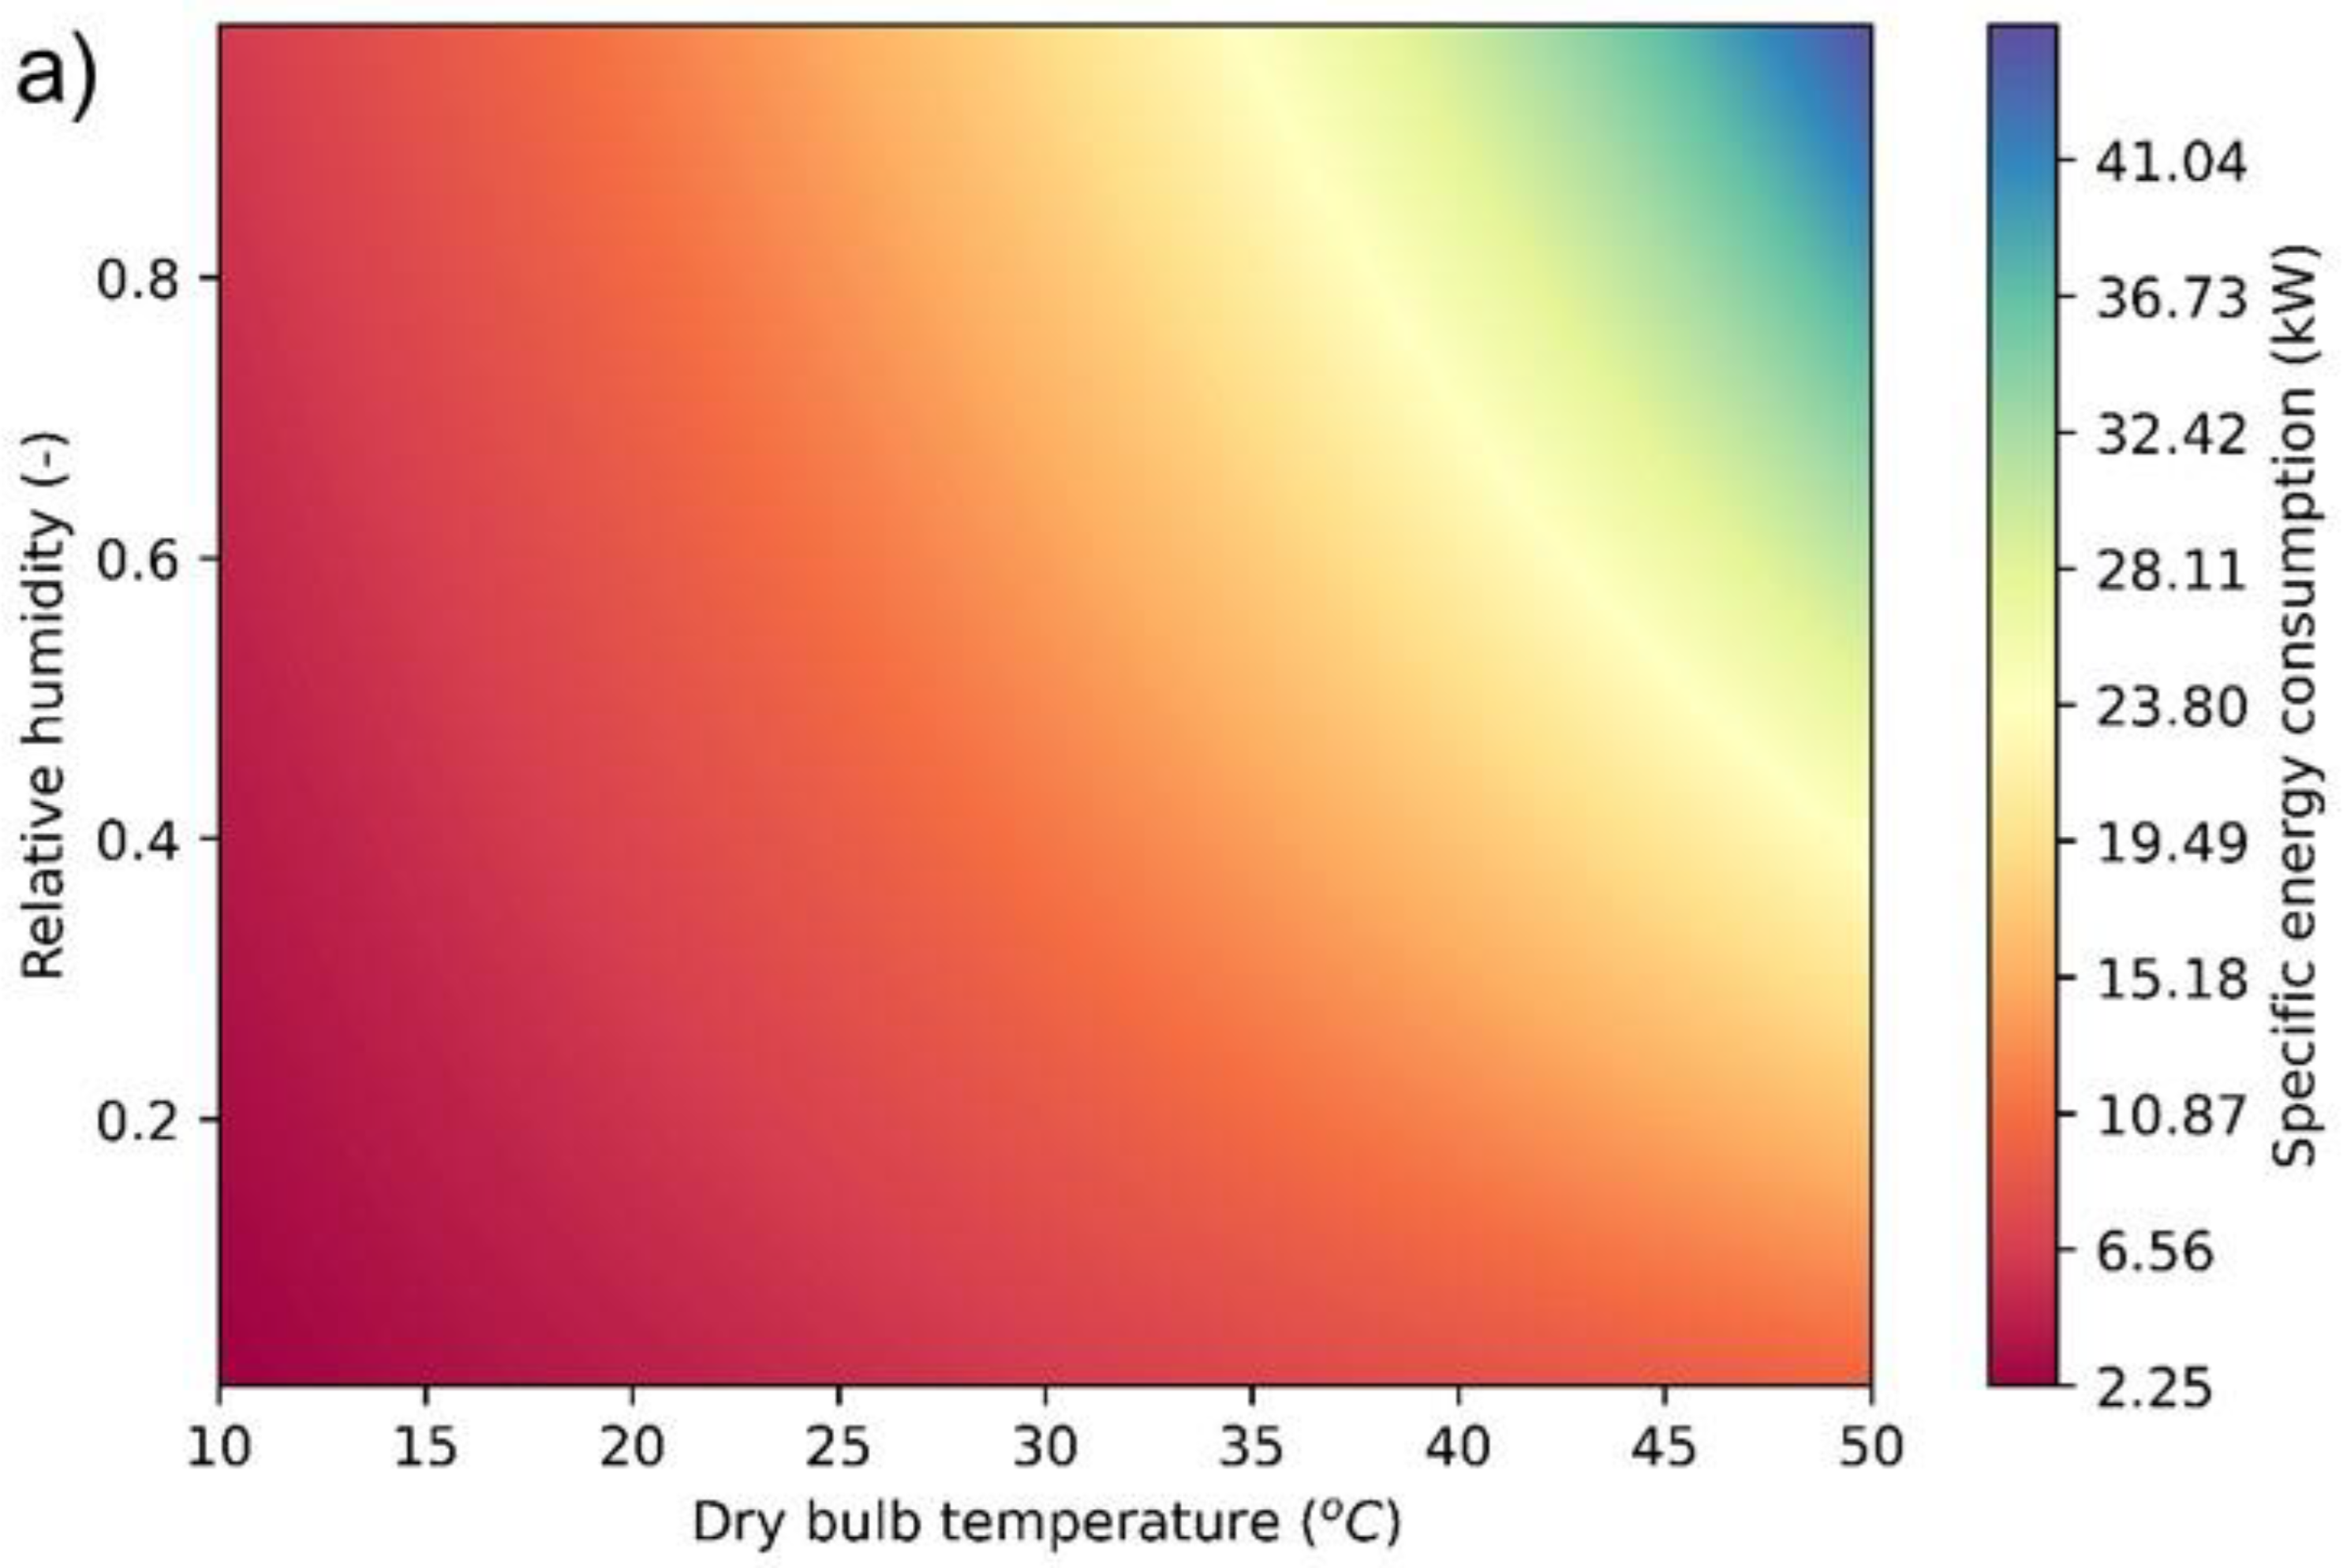
4.3. Specific Energy Consumption

The specific energy consumption (SEC, kW) is the summation of the instantaneous heat supplied (Qh, kW) to the E-HDH desalination system for evaporating the vapor mass, energy consumed by the fan (Qf, kW), as well as the pump (Qp, kW), as given by Equation (9).
SEC = Q h + Q f + Q p
where Qh is determined using Equation (10).
Q h = m ˙ c p @ T ( T in )
The Qf and Qp used in the study were 0.015 kW and 0.010 kW, respectively, as available via [52]. The results presented in Figure 9 correspond to Tdb and RH, accordingly. Figure 9a shows the SEC of the DE-HDH system; however, Figure 9b shows the SEC of both the IE-HDH system and ME-HDH system. The equivalent SEC was estimated for the IE-HDH and/or ME-HDH systems because they had the same number of fans and a pump. Moreover, in the present scenario, the Qh supplied to both systems computed corresponded to Tdb and RH values, accordingly. Consequently, similar results of SEC were identified. From the results, it was realized that the SEC for the DE-HDH system ranged between 2.25 and 45.35 kW, whereas for the IE-HDH and/or ME-HDH system, it ranged between 1.36 and 26.29 kW, corresponding to the Tdb and RH. Similar SEC results are available via [52,65,66]. Generally, the IE-HDH and/or ME-HDH system consumes relatively more SEC because two fans are installed to regulate the air velocities in their channels. However, in the present scenario, the SEC obtained from the DE-HDH system was 1.65 to 1.75-fold higher as compared to the IE-HDH and/or ME-HDH systems because it had relatively high system effectiveness. In addition, the m ˙ also enhanced the overall SEC of the DE-HDH. The trends depict that the RH plays a crucial role in enhancing the overall SEC of the E-HDH desalination system. Thereby, desert regions and subtropical regions are comparatively more favorable for the E-HDH desalination system.

4.4. Sensible and Latent Heat Factors

The sensible heat factor (SHF) and latent heat factor (LHF) are estimated for the studied E-HDH desalination systems using Equations (11) and (12), as shown:
SHF = Q h Q h + Q lat
LHF = Q lat Q lat + Q h
where SHF and LHF explain the proportion of the sensible and latent load available, respectively, in the total energy. It is noteworthy that the sum of SHF and LHF should equal 1.0. Figure 10 shows the SHF (left column) and LHF (right column) of the studied E-HDH desalination systems. It was observed that the SHF for the DE-HDH and IE-HDH system was estimated in the range between 0.17 and 0.49 with respect to Tdb and RH values, accordingly. However, in the case of the ME-HDH system, the SHF was identified in the range between 0.03 and 0.36. On the other hand, the LHF was found to be relatively high (ranging between 0.64 and 0.98) from the ME-HDH system in contrast with the DE-HDH and IE-HDH systems. This implies that the ME-HDH utilized more psychrometric renewable energy to increase the humidity ratio while maintaining the RH of 1.0. Consequently, more latent load was observed as compared to the other studied E-HDH desalination systems. Furthermore, it was observed that an increase in Tdb and RH from their respective data was in response to the decrease in the SHF, and vice versa for LHF.

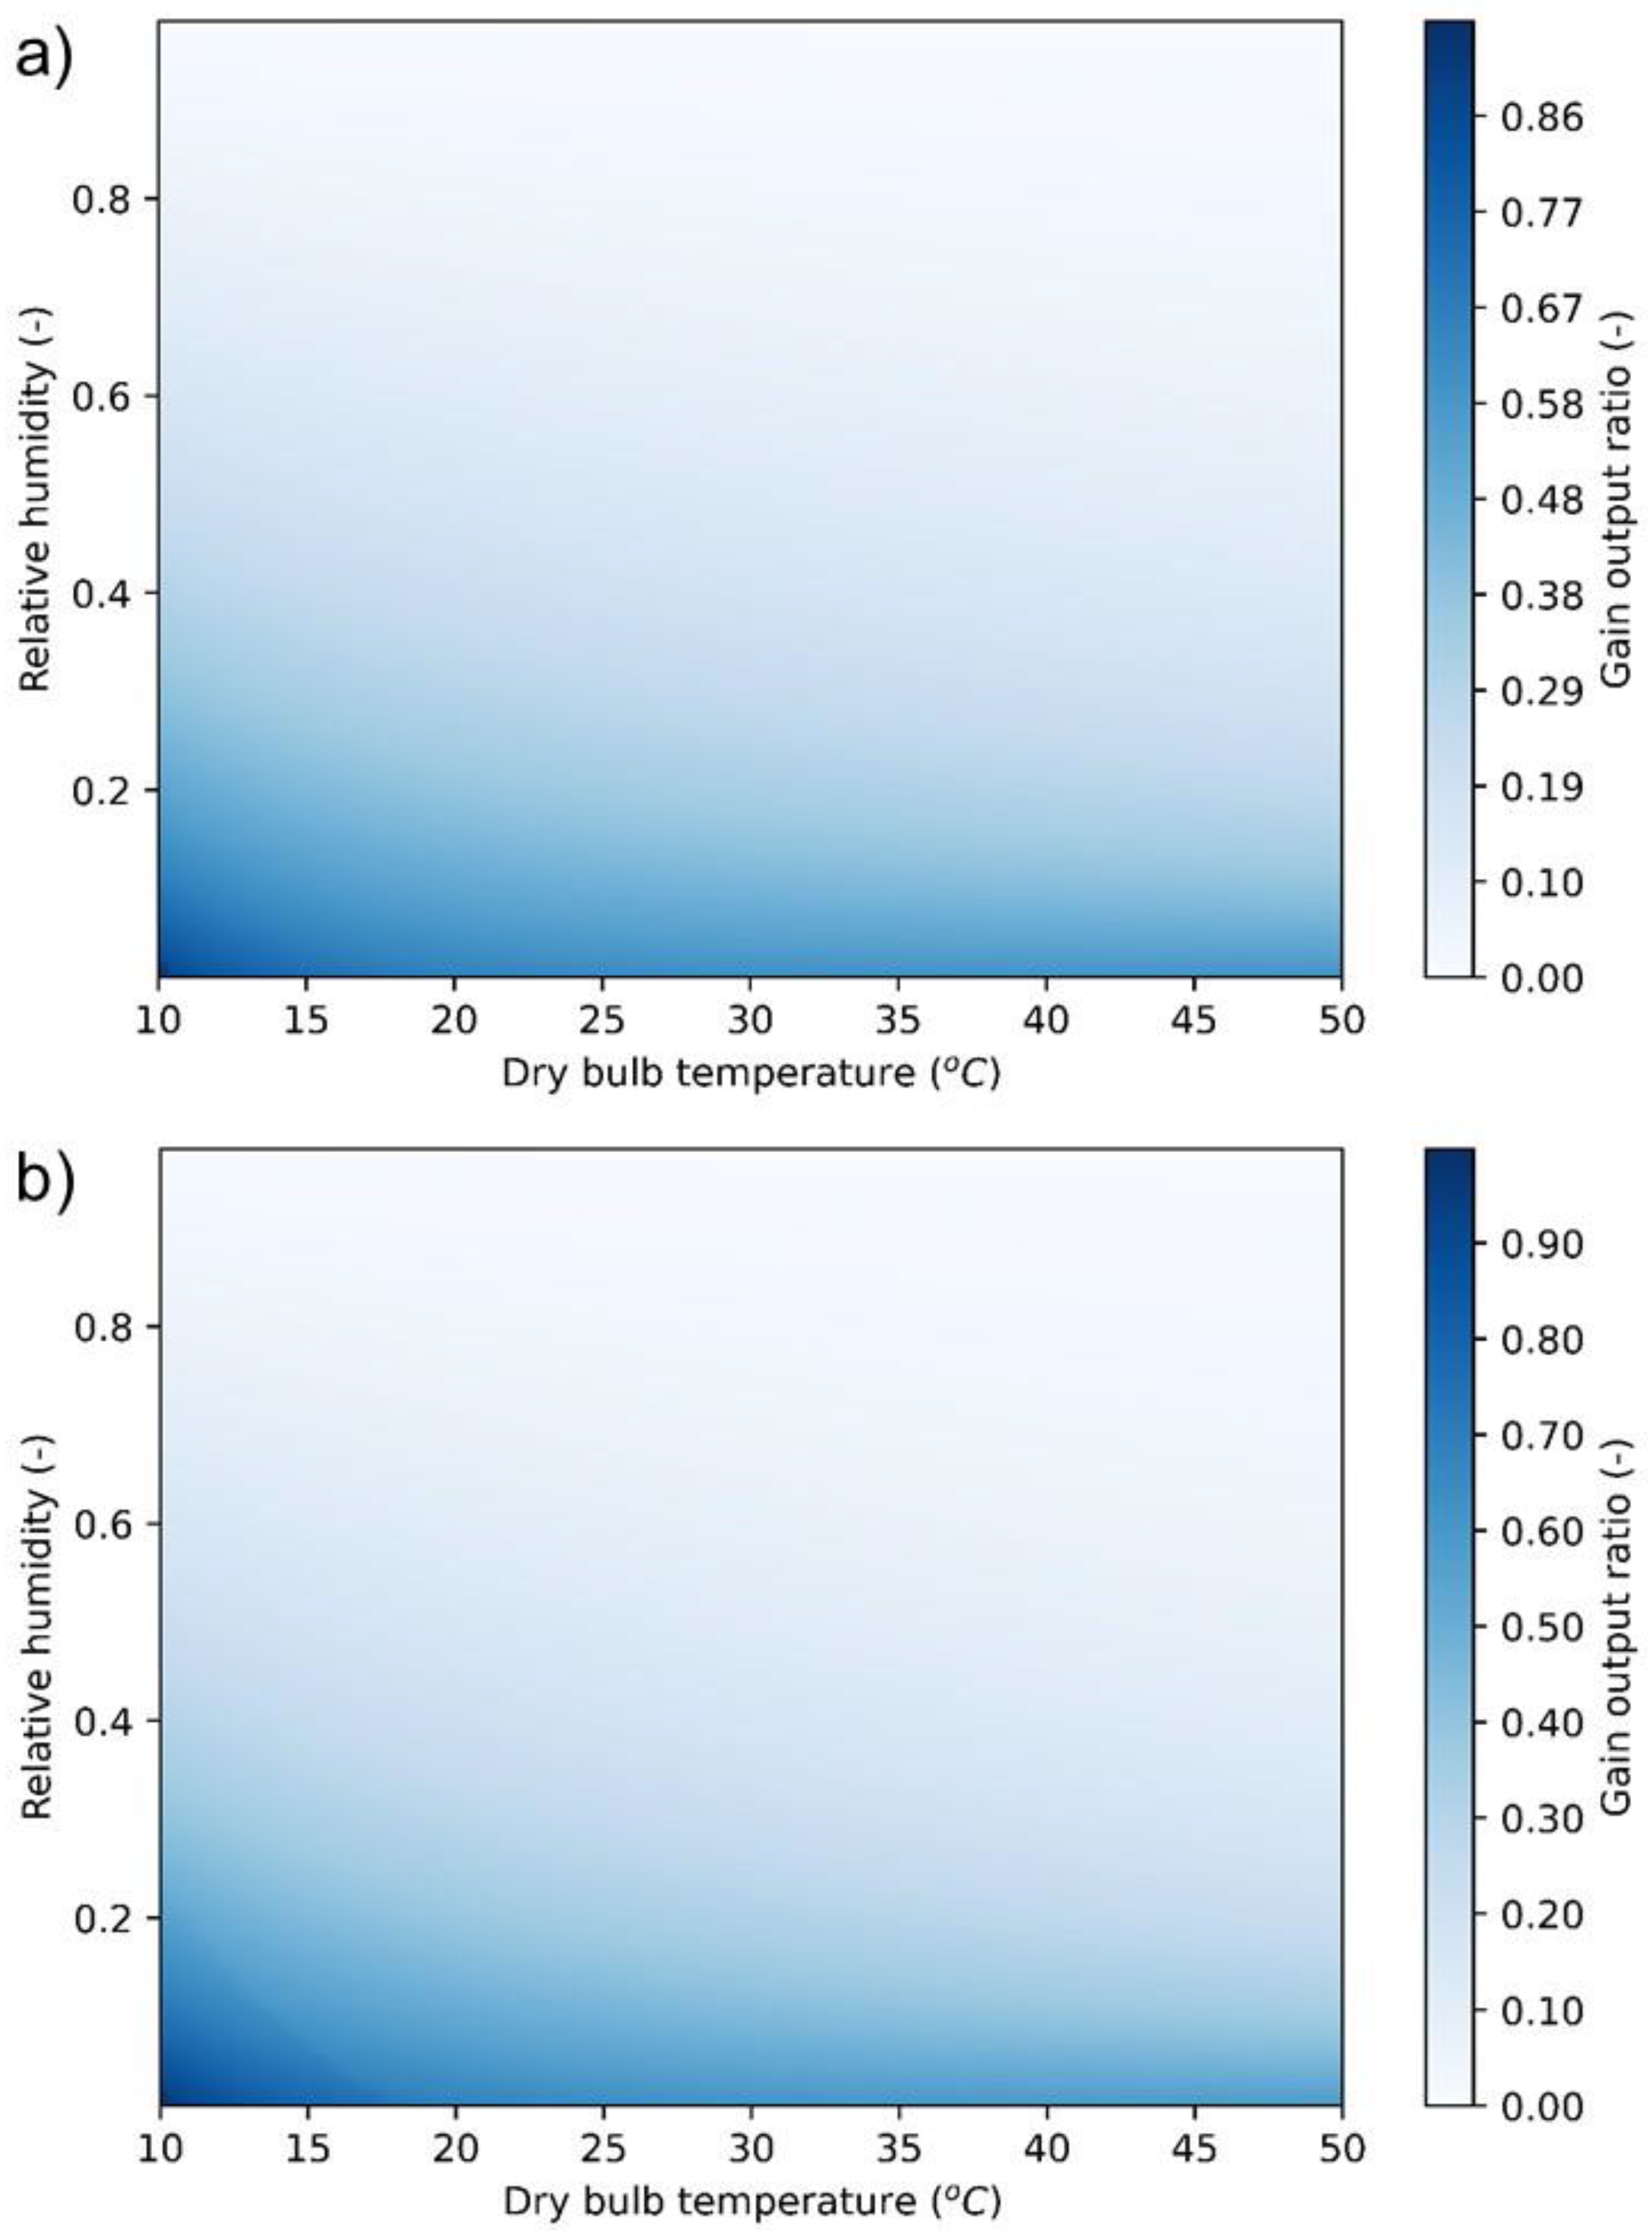
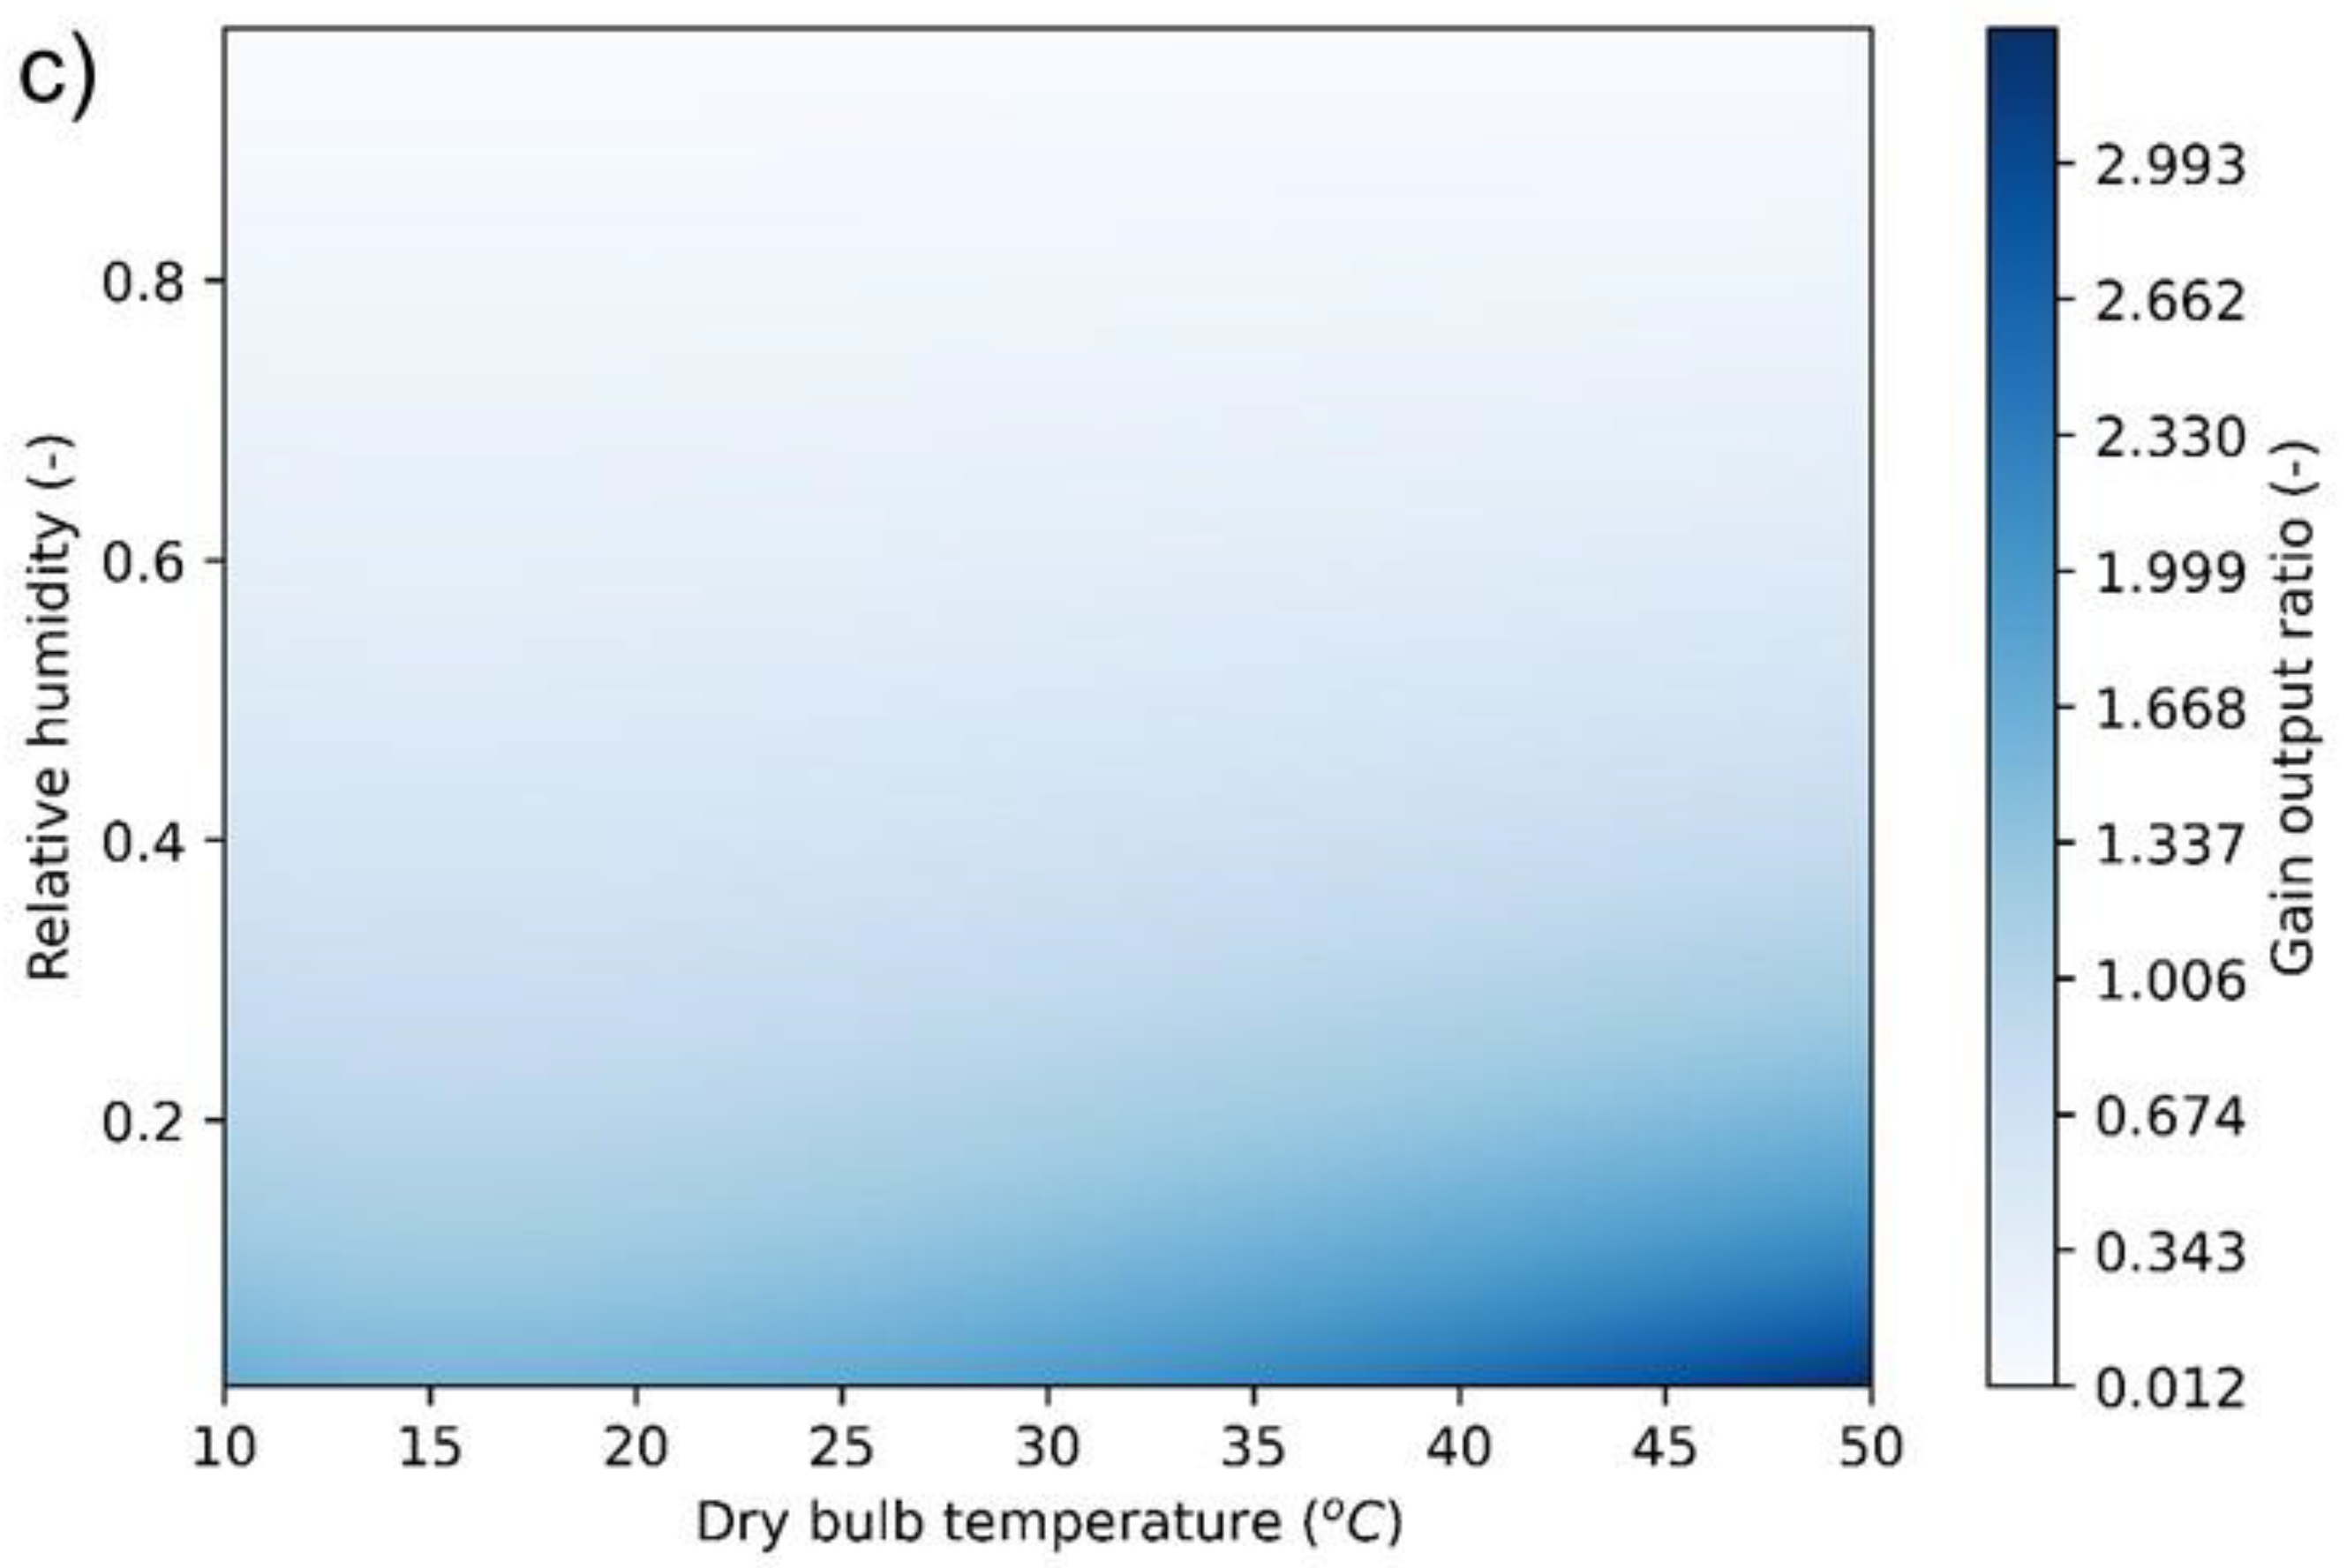
4.5. Gain Output Ratio

The gain output ratio (GOR) refers to the ratio of the latent load required to the total energy utilized for evaporating saline water. The GOR is formulated in Equation (13).
G O R = Q l a t S E C
Figure 11 shows the GOR of the studied E-HDH desalination systems. It was realized that the ME-HDH system showed the maximum GOR ranging between 0.012 and 3.324, followed by the IE-HDH system and DE-HDH system, respectively. Furthermore, it was realized that, corresponding to an increase in Tdb as well as RH, the GOR for DE-HDH and IE-HDH systems decreased because of relatively small Qlat values were produced. Therefore, the maximum GOR values of 0.95 (DE-HDH system) and 1.0 (IE-HDH system) were observed at Tdb < 15 °C and RH < 0.20. On the other hand, the ME-HDH system achieved the maximum GOR at Tdb of >40 °C and RH < 0.15. This was due to the employment of psychrometric renewable energy to accomplish the saturation limit [54]. This implies that the ME-HDH system has the potential to generate a significantly high quantity of desalinated water, followed by the IE-HDH system and DE-HDH. Similar SEC results are available via [52].

4.6. Effect of Velocity and E-HDH System Effectiveness

The performance of the E-HDH desalination system was explored in this section, corresponding to four climatic scenarios based on the Köppen–Geiger climatic classification. The effect of air velocity was estimated to vary from 0.01 m/s to 5.0 m/s for all the studied E-HDH desalination systems when considering the selected Köppen–Geiger climatic conditions. In addition, the effect of ε wb for the E-HDH desalination system was analyzed based on their effectiveness ranges stated in the methodology section. Furthermore, in the case of the ME-HDH system, the humidity effectiveness was also correlated, varying from 1.0 to 10.0%. The results of WPR are presented in Figure 12. First, it was realized that the WPR increased with the increase in air velocity due to more mass flow rate entering the air channels. Secondly, the increase in ε wb improved the WPR. Lastly, the increase in humidity effectiveness also enhanced the WPR. In tropical monsoon climatic conditions, the ME-HDH system produced a comparatively high WPR compared to the DE-HDH system, followed by the IE-HDH system. For all the studied climatic scenarios, the ME-HDH system was found to outperform in terms of WPR. The maximum WPR of 5.14 g/s was computed from the humid subtropical climate, followed by the humid continental climate (3.49 g/s), desert climate (3.75 g/s), and tropical monsoon climate (1.94 g/s). The DE-HDH system produced a nearly equivalent amount of WPR as compared to ME-HDH because of exposure to a high mass flow rate. The IE-HDH system produced the least WPR because it had less ε wb compared to both the DE-HDH and ME-HDH systems.

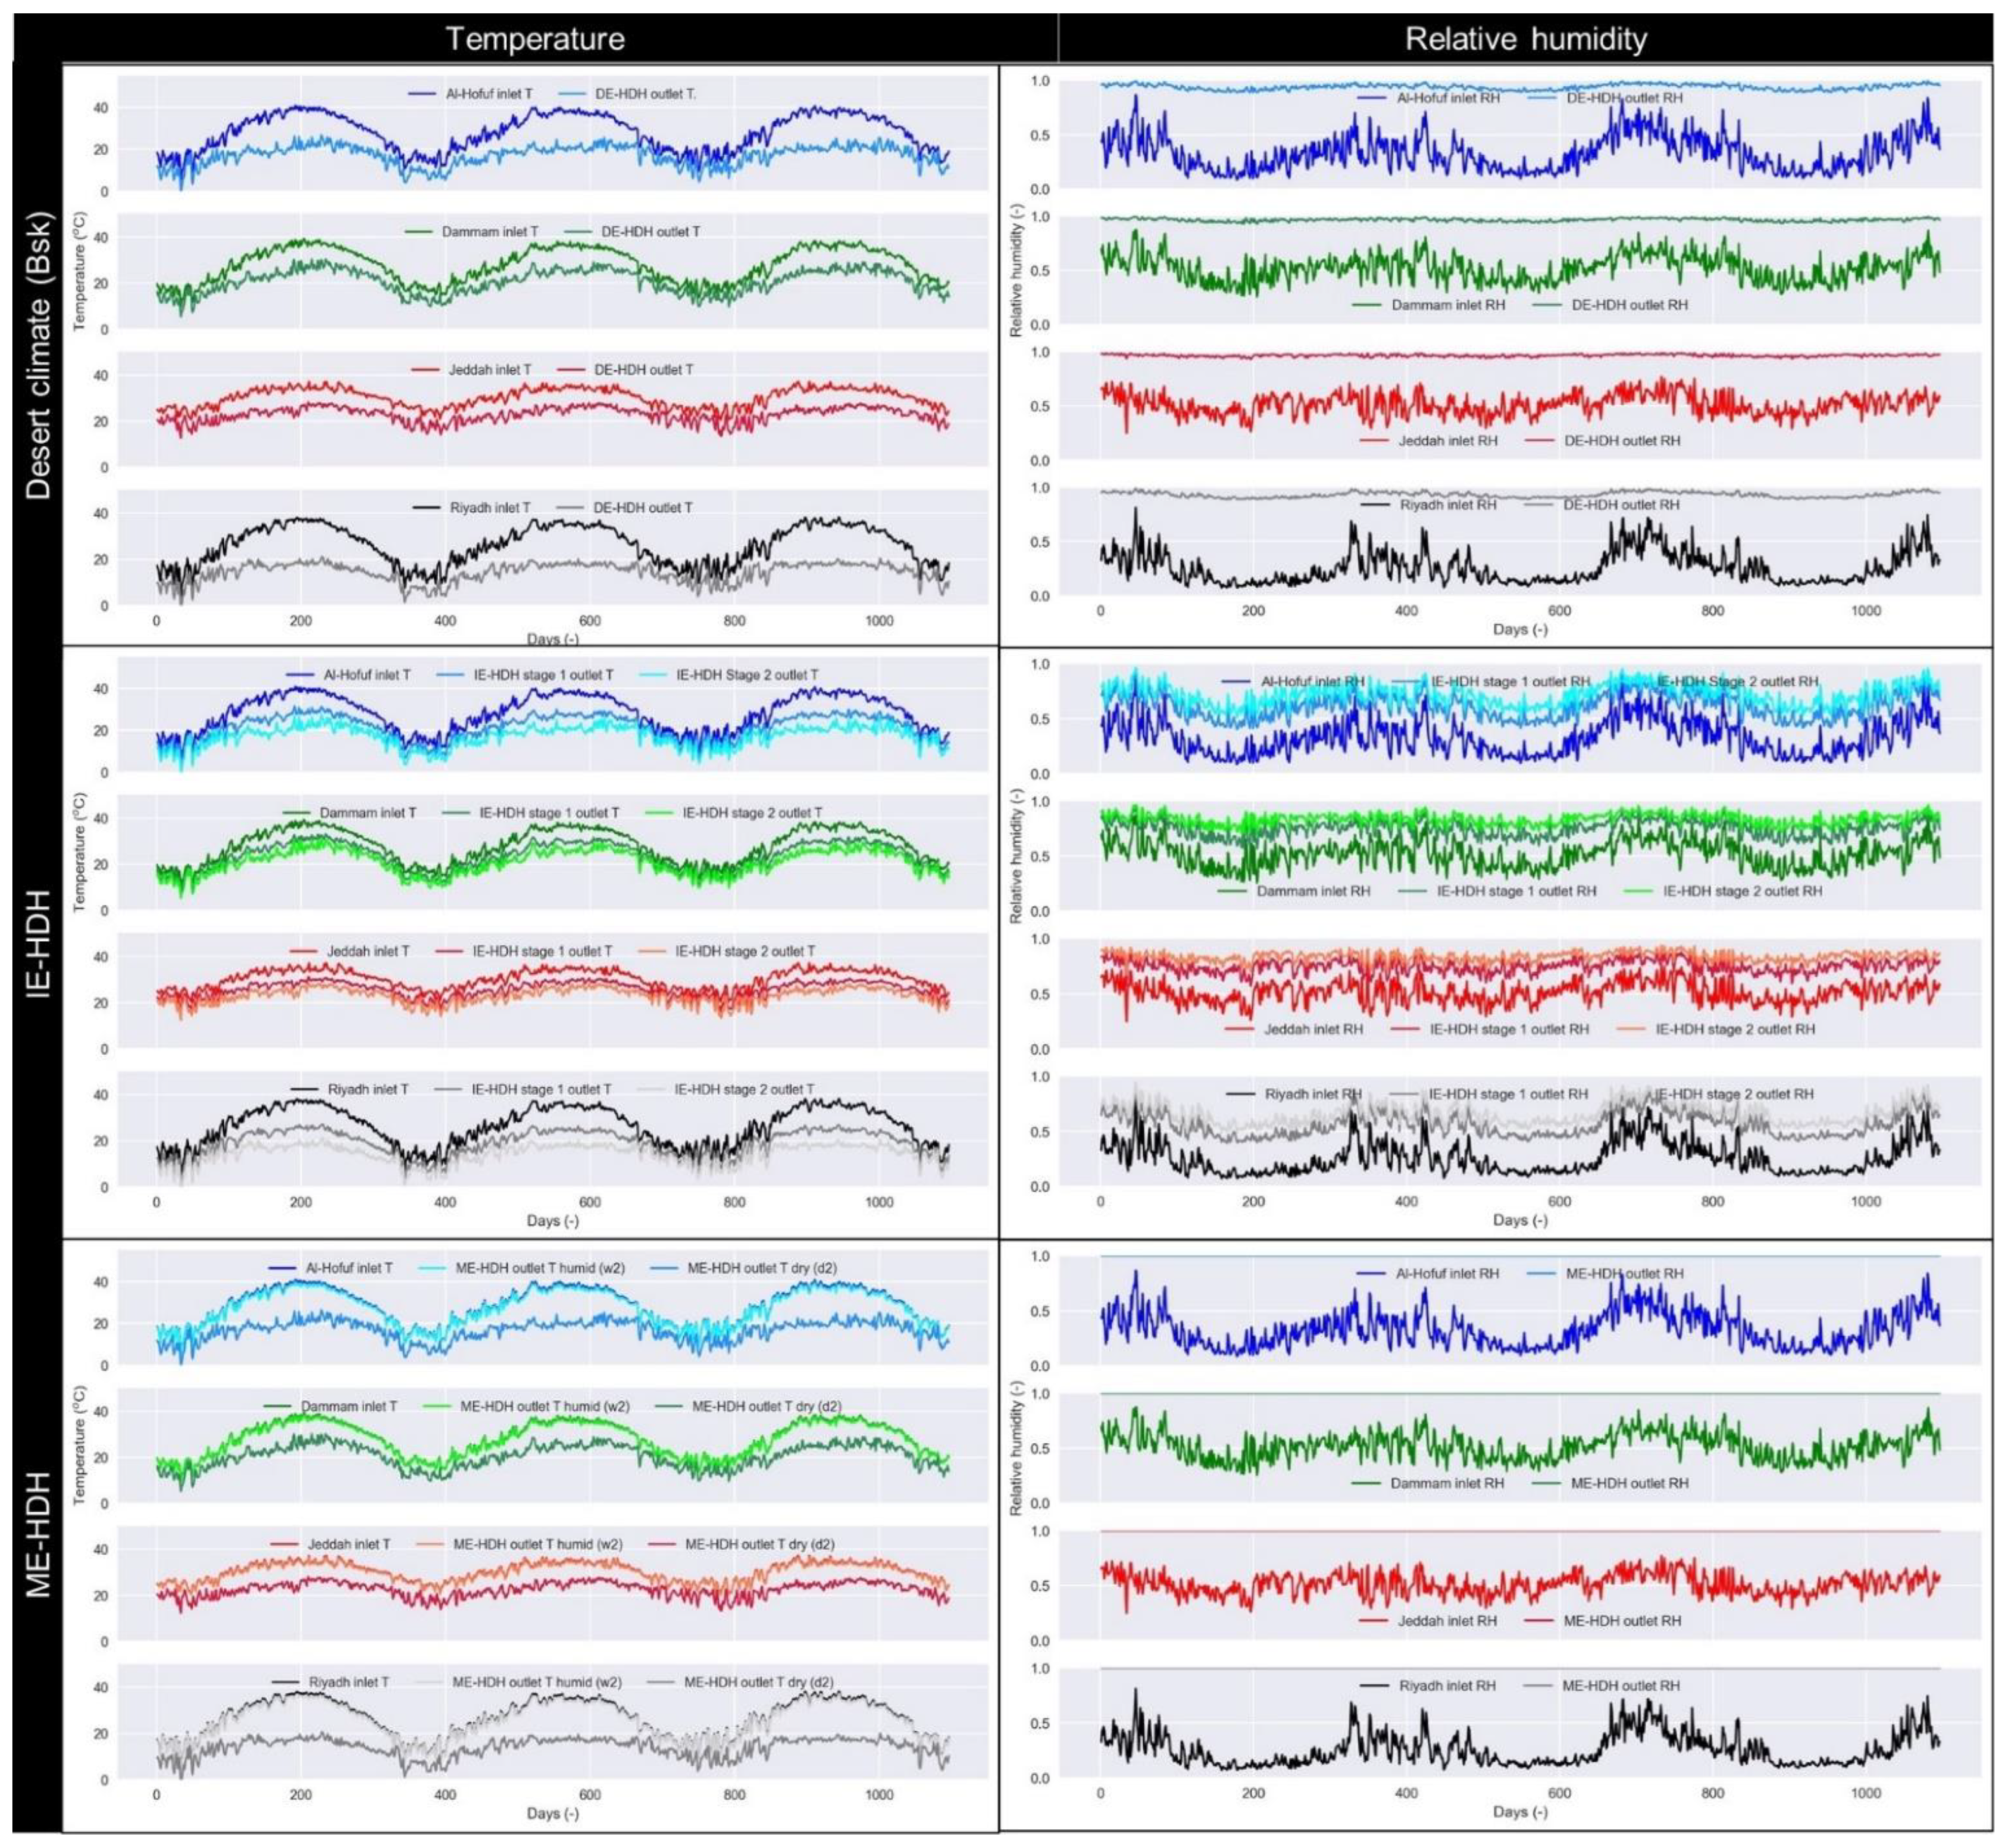
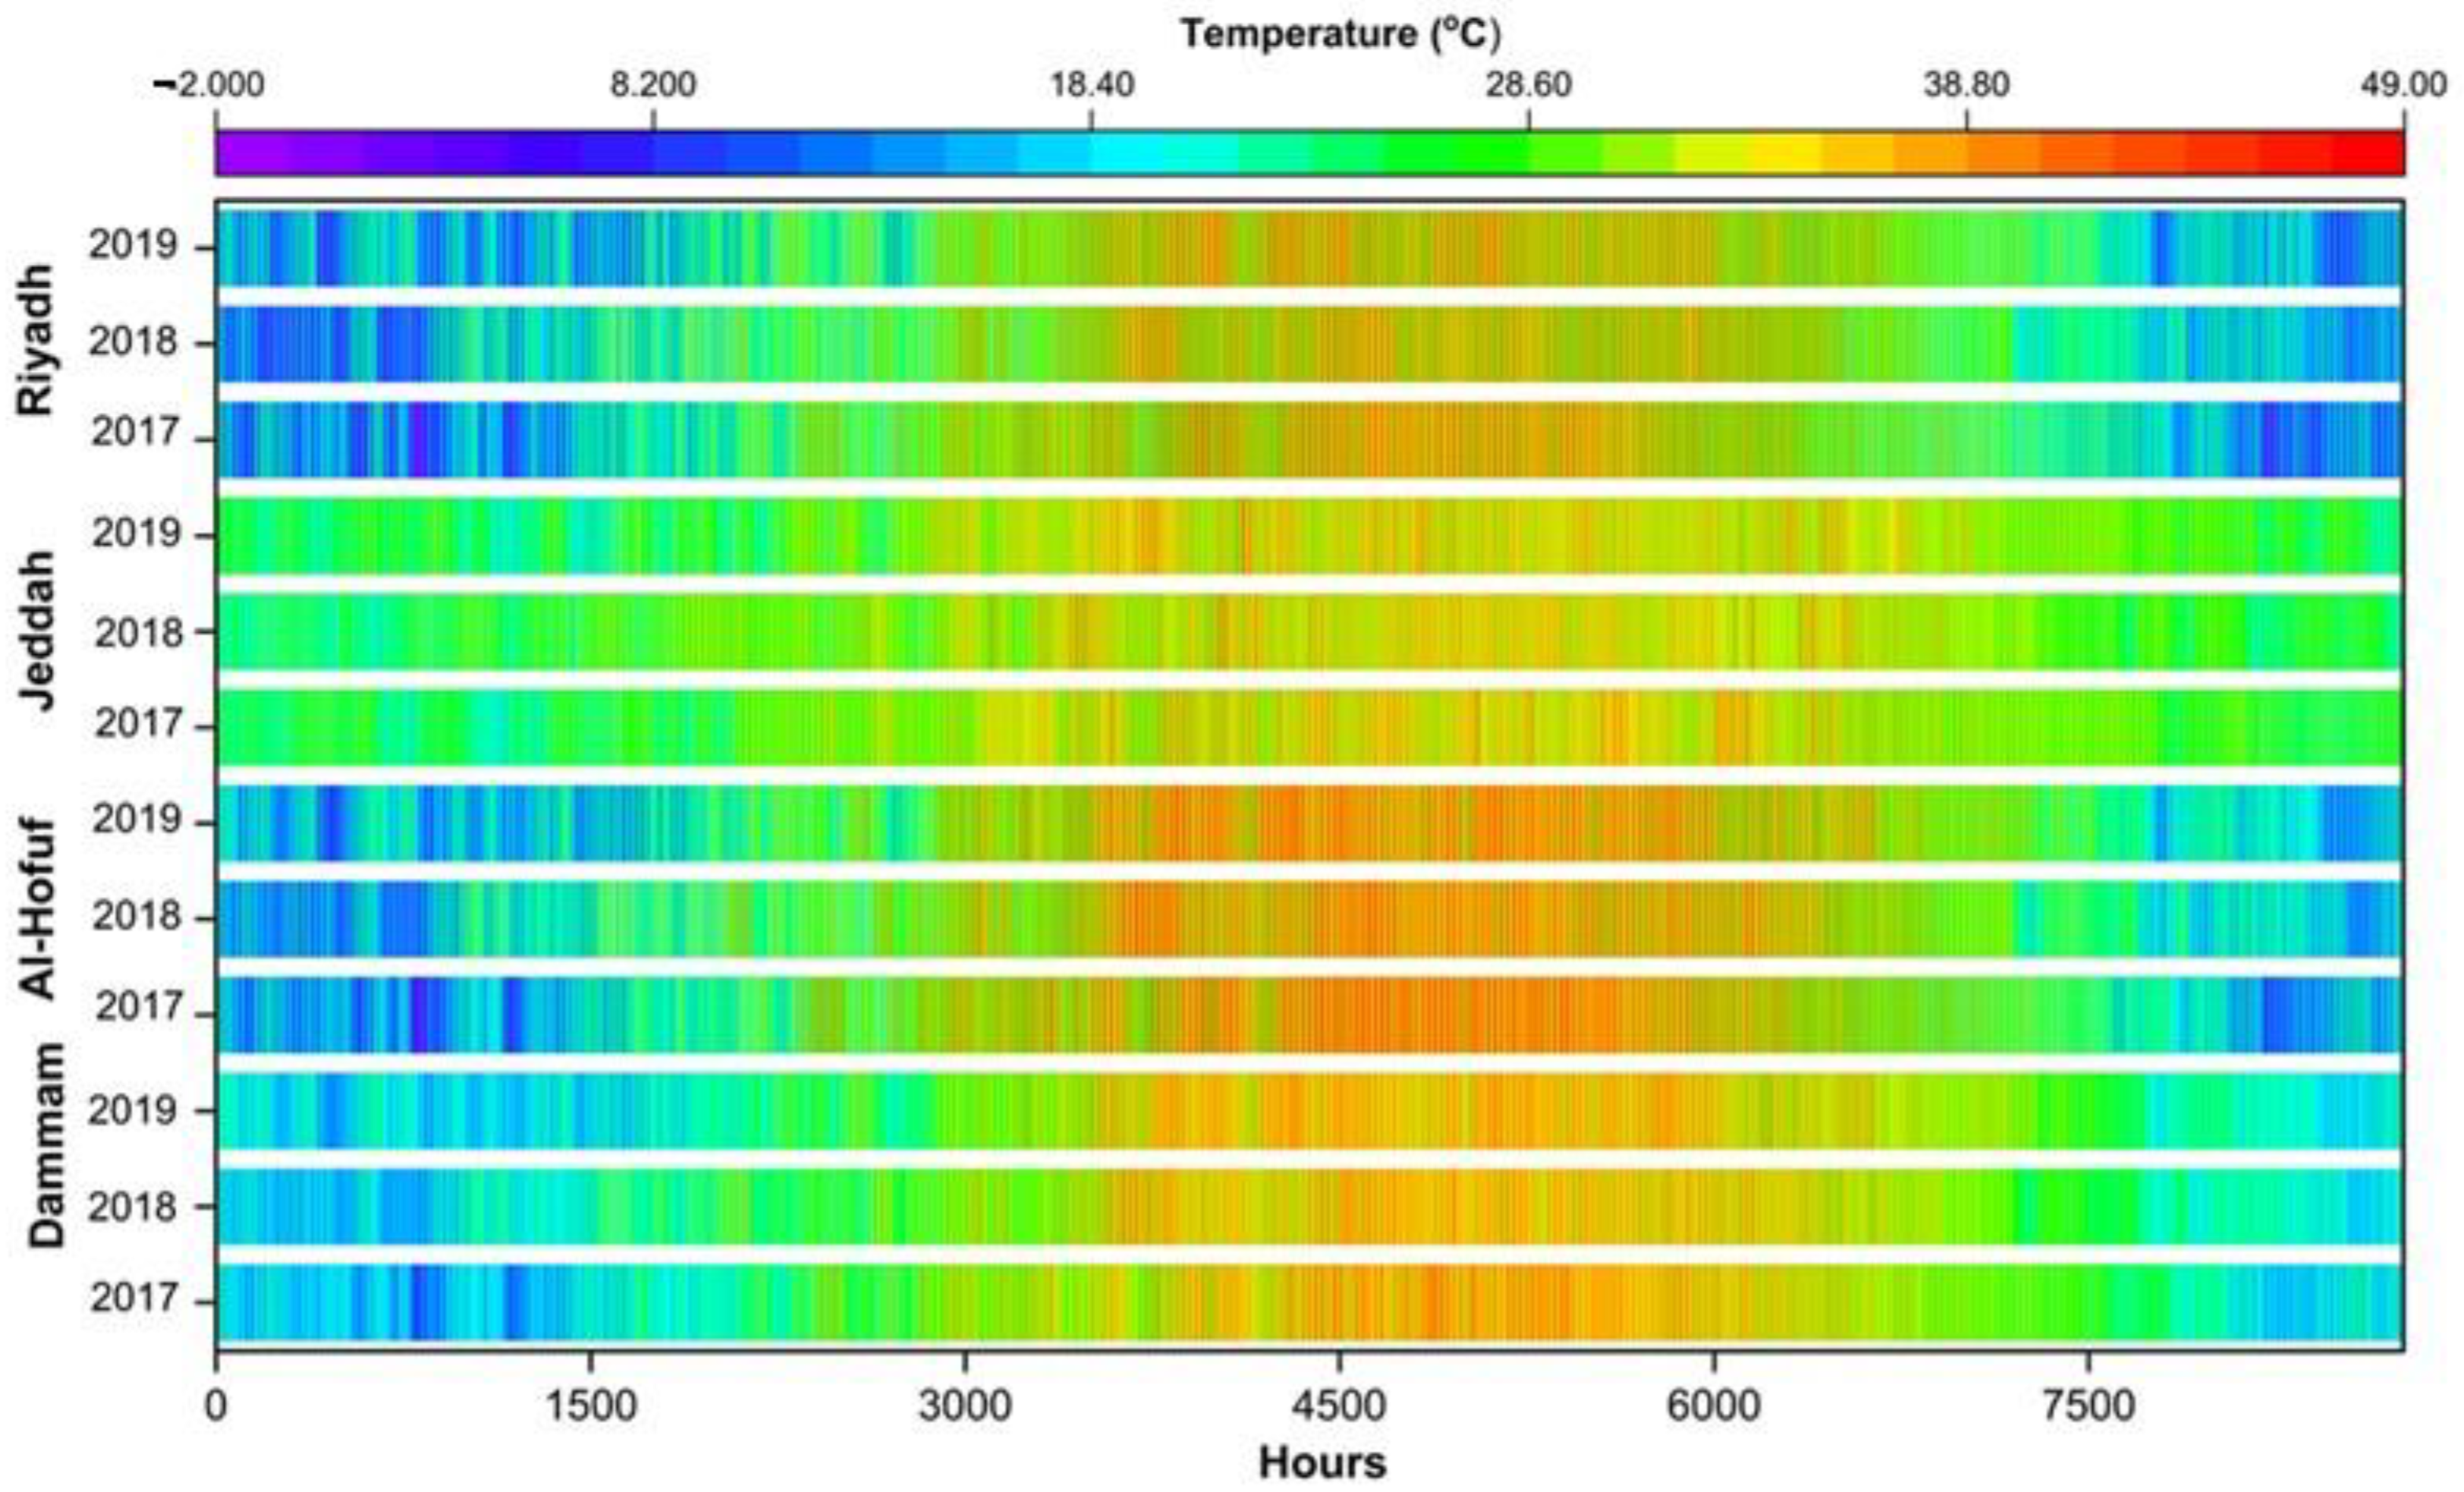
4.7. Performance Comparison against Climatic Conditions of Saudi Arabia

In this section, the performance of the E-HDH desalination system was explored with respect to the climatic scenario of Saudi Arabia. Figure 13 shows the temporal variation in the outlet Tdb (left column) and RH (right) of the studied E-HDH desalination system. On an average basis, the DE-HDH system reduced the outlet air temperature by 8 °C, while the ME-HDH system reduced it to 12 °C. On the other hand, the IE-HDH system reduced the Tdb by 5 °C, which reflects poor heat conduction and relatively low system effectiveness. Similarly, the RH of the studied E-HDH desalination system approached the saturation limit (1.0).
Figure 14 shows the WPR and energy required (ER, kWh/kg) from the studied E-HDH desalination systems, accordingly. The ER was estimated based on the SEC divided by the WPR. The results of the WPR and ER are discussed here on an average basis in order to make a comparison among the studied E-HDH desalination systems as well as among the cities. The results show that the WPR obtained from the DE-HDH system, which was 91.43 kg/day, corresponded to the climatic conditions of the Riyadh followed by Al-Hofuf (86.59 kg/day), Jeddah (63.60 kg/day), and Dammam (60.76 kg/day). Accordingly, the ER was determined to be minimum from Riyadh (0.0972 kWh/kg), and it increased in the case of Al-Hofuf (0.12 kWh/kg), Dammam (0.218 kWh/kg), and Jeddah (0.219 kWh/kg). Similarly, the WPR realized from the IE-HDH system was estimated as 54.31 kg/day from Riyadh, 51.12 kg/day from Al-Hofuf, 38.51 kg/day from Jeddah, and 36.68 kg/day from Dammam. Correspondingly, the ER was estimated to be minimum in the case of Riyadh (0.096 kWh/kg), Al-Hofuf (0.125 kWh/kg), Dammam, and Jeddah (0.21 kWh/kg). The WPR observed to be maximum in the case of ME-HDH system, having values of 180.33 kg/day and 183.51 kg/day from Al-Hofuf and Riyadh, respectively. The WPR obtained from Jeddah and Dammam was observed to be 133.0 kg/day and 126.58 kg/day, respectively. On the other hand, the ER was observed to be in the range between 0.03 and 0.07 kWh/kg. The ME-HDH desalination system demonstrated a significant reduction in energy consumption compared to the MED and MSF systems, with reductions of 5–20% and 10–35%, respectively. Furthermore, this energy-efficient performance was achieved through the utilization of scavenged thermal energy from the environment for the desalination process, which is essentially free. It can be concluded that the ME-HDH system can produce high WPR and minimum ER as compared to the DE-HDH system and IE-HDH system, respectively. For all the studied E-HDH desalination systems, Al-Hofuf and Riyadh climatic conditions are comparatively more suitable to produce desalinated water.

5. Conclusions

Water scarcity is a pressing issue that requires effective solutions, and desalination presents a promising avenue to address this challenge. However, conventional desalination technologies are associated with drawbacks such as high greenhouse gas emissions, system inefficiencies, and significant energy consumption. Low-cost and sustainable desalination systems are principally required in order to accomplish the UN-SDGs. In this regard, the present study aimed to investigate evaporation-assisted humidification–dehumidification (E-HDH) desalination systems based on the effectiveness method. Three E-HDH systems, namely, direct evaporative (DE-HDH), indirect evaporative (IE-HDH), and Maisotsenko evaporative (ME-HDH) configurations, were investigated via utilizing a thermodynamic modeling approach. Performance indicators such as water production rate (WPR), specific energy consumption, (SEC), gain output ratio (GOR), sensible heat factor (SHF), and latent heat factor (LHF) were studied with respect to dry-bulb temperature (Tdb) and relative humidity (RH). The performance of the studied E-HDH desalination systems was explored, corresponding to the climatic scenarios of four cities of Saudi Arabia. According to the results, the ME-HDH can produce the WPR of 0.01 to 7.92 g/s, followed by the DE-HDH system and IE-HDH system, respectively, corresponding to a Tdb of 10 °C to 50 °C and RH of 0.1 to 1.0. The SEC in the case of the ME-HDH system ranged between 1.36 kW and 26.92 kW. The GOR was observed as ~0.95 for both the DE-HDH and IE-HDH systems, while in the case of ME-HDH, it was observed as 3.32. Among the studied cities of Saudi Arabia, Al-Hofuf and Riyadh showed the maximum WPR, having average values of 183.51 and 180.33 kg/day, respectively, in conjunction with employing the ME-HDH system. The energy required was also found to be minimum (0.034 to 0.0421 kWh/kg) in the case of the ME-HDH system. Thereby, it is concluded that the ME-HDH system is comparatively more productive and energy efficient as compared to the studied DE-HDH and IE-HDH systems.

Author Contributions

Conceptualization, M.M., H.M.A. and M.S.; Data curation, M.M., H.M.A. and M.S.; Formal analysis, M.M. and H.M.A.; Funding acquisition, M.M., N.K.A. and M.S.; Investigation, M.M., N.K.A. and M.S.; Methodology, H.M.A. and M.S.; Project administration, M.M. and M.S.; Software, M.M., H.M.A. and M.S.; Supervision, M.S.; Validation, M.M., H.M.A. and M.S.; Visualization, H.M.A., M.S. and M.M.; Writing—original draft, M.M., H.M.A. and M.S.; Writing—review and editing, M.M., N.K.A., H.M.A. and M.S. All authors have read and agreed to the published version of the manuscript.

Funding

This work was supported by the Deanship of Scientific Research, Vice Presidency for Graduate Studies and Scientific Research, King Faisal University, Saudi Arabia [GRANT2573].

Institutional Review Board Statement

Not applicable.

Informed Consent Statement

Not applicable.

Data Availability Statement

The data are contained within the article.

Acknowledgments

The authors gratefully acknowledge the financial support from the Deanship of Scientific Research, Vice Presidency for Graduate Studies and Scientific Research, King Faisal University, Saudi Arabia.

Conflicts of Interest

The authors declare no conflict of interest.

Nomenclature

m ˙ mass flow rate, (kg/s)
cpspecific heat capacity, (J/kg.K)
DE-HDHdirect evaporative HDH
E-HDHevaporation-assisted HDH
GORgain output ratio, (-)
HDHhumidification–dehumidification
IE-HDHindirect evaporative HDH
LHFlatent heat factor, (-)
ME-HDHMaisotsenko evaporative HDH
Qcsensible cooling flux, (kW)
Qfenergy consumed by fan, (kW)
Qhsensible heat supplied, (kJ/s)
Qlatlatent cooling flux, (kW)
Qpenergy consumed by pump, (kW)
RHrelative humidity, (-)
SECspecific energy consumption, (kW)
SHFsensible heat factor, (-)
Ttemperature, (K)
WPR water production rate, (g/s)
x humidity ratio, (kg/kg)
ε system effectiveness, (-)
Subscript
d1, d2cool dry air
dbdry-bulb
dpdew-point
ininlet
outoutlet
w1warm air supply
w2, w3cool humid air
w4warm humid air
w5cool dry air
wbwet-bulb

Appendix A

The hourly based Tdb and RH are provided in Figure A1 and Figure A2, respectively.
Figure A1. Three years hourly based Tdb of four cities of Saudi Arabia.
Water 15 01125 g0a1
Figure A2. Three years hourly based RH of four cities of Saudi Arabia.
Water 15 01125 g0a2

References

  1. The Distribution of Water on, in, and above the Earth|U.S. Geological Survey. Available online: https://www.usgs.gov/media/images/distribution-water-and-above-earth (accessed on 5 March 2023).
  2. UNESCO, UN-Water, 2020; The United Nations World Water Development Report 2020: WATER AND CLIMATE CHANGE; UNESCO: Paris, France, 2020.
  3. Lawal, D.U.; Qasem, N.A.A. Humidification-dehumidification desalination systems driven by thermal-based renewable and low-grade energy sources: A critical review. Renew. Sustain. Energy Rev. 2020, 125, 109817. [Google Scholar] [CrossRef]
  4. Faegh, M.; Behnam, P.; Shafii, M.B. A review on recent advances in humidification-dehumidification (hdh) desalination systems integrated with refrigeration, power and desalination technologies. Energy Convers. Manag. 2019, 196, 1002–1036. [Google Scholar] [CrossRef]
  5. Eghtesad, A.; Salakhi, M.; Afshin, H.; Hannani, S.K. Numerical investigation and optimization of indirect freeze desalination. Desalination 2020, 481, 114378. [Google Scholar] [CrossRef]
  6. Quan, Q.; Liang, W.; Yan, D.; Lei, J. Influences of joint action of natural and social factors on atmospheric process of hydrological cycle in Inner Mongolia, China. Urban Clim. 2022, 41, 101043. [Google Scholar] [CrossRef]
  7. Wang, W.; Xie, S.; Pan, Q.; Dai, Y.; Wang, R.; Ge, T. Air-cooled adsorption-based device for harvesting water from island air. Renew. Sustain. Energy Rev. 2021, 141, 110802. [Google Scholar] [CrossRef]
  8. Mekonnen, M.M.; Hoekstra, A.Y. Sustainability: Four billion people facing severe water scarcity. Sci. Adv. 2016, 1–6. [Google Scholar] [CrossRef]
  9. Santosh, R.; Lee, H.-S.; Kim, Y.-D. A comprehensive review on humidifiers and dehumidifiers in solar and low-grade waste heat powered humidification-dehumidification desalination systems. J. Clean. Prod. 2022, 347, 131300. [Google Scholar] [CrossRef]
  10. Wu, X.; Guo, S.; Qian, S.; Wang, Z.; Lai, C.; Li, J.; Liu, P. Long-range precipitation forecast based on multipole and preceding fluctuations of sea surface temperature. Int. J. Clim. 2022, 42, 8024–8039. [Google Scholar] [CrossRef]
  11. Ayaz, M.; Namazi, M.A.; Din, M.A.U.; Ershath, M.I.M.; Mansour, A.; Aggoune, E.-H.M. Sustainable Seawater Desalination: Current status, environmental implications and future expectations. Desalination 2022, 540, 116022. [Google Scholar] [CrossRef]
  12. Li, J.; Wang, Z.; Wu, X.; Xu, C.-Y.; Guo, S.; Chen, X. Toward Monitoring Short-Term Droughts Using a Novel Daily Scale, Standardized Antecedent Precipitation Evapotranspiration Index. J. Hydrometeorol. 2020, 21, 891–908. [Google Scholar] [CrossRef] [Green Version]
  13. Zhongming, Z.; Linong, L.; Xiaona, Y.; Wangqiang, Z.; Wei, L. Climate and Weather Related Disasters Surge Five-Fold over 50 Years, but Early Warnings Save Lives–WMO Report; United Nations: New York, NY, USA, 2021. [Google Scholar]
  14. Li, J.; Wang, Z.; Wu, X.; Zscheischler, J.; Guo, S.; Chen, X. A standardized index for assessing sub-monthly compound dry and hot conditions with application in China. Hydrol. Earth Syst. Sci. 2021, 25, 1587–1601. [Google Scholar] [CrossRef]
  15. Amy, G.; Ghaffour, N.; Li, Z.; Francis, L.; Linares, R.V.; Missimer, T.; Lattemann, S. Membrane-based seawater desalination: Present and future prospects. Desalination 2017, 401, 16–21. [Google Scholar] [CrossRef]
  16. Khawaji, A.D.; Kutubkhanah, I.K.; Wie, J.-M. Advances in seawater desalination technologies. Desalination 2008, 221, 47–69. [Google Scholar] [CrossRef]
  17. Ghaffour, N.; Missimer, T.M.; Amy, G.L. Technical review and evaluation of the economics of water desalination: Current and future challenges for better water supply sustainability. Desalination 2013, 309, 197–207. [Google Scholar] [CrossRef] [Green Version]
  18. Shahzad, M.W.; Thu, K.; Kim, Y.d.; Ng, K.C. An experimental investigation on MEDAD hybrid desalination cycle. Appl. Energy 2015, 148, 273–281. [Google Scholar] [CrossRef]
  19. El-Dessouky, H.T.; Ettouney, H.M. Multi-Stage Flash Desalination. In Fundamentals of Salt Water Desalination; Elsevier Science: Amsterdam, The Netherlands, 2002. [Google Scholar]
  20. Ng, K.C.; Thu, K.; Oh, S.J.; Ang, L.; Shahzad, M.W.; Bin Ismail, A. Recent developments in thermally-driven seawater desalination: Energy efficiency improvement by hybridization of the MED and AD cycles. Desalination 2015, 356, 255–270. [Google Scholar] [CrossRef]
  21. Shahzad, M.W.; Ng, K.C.; Thu, K. Future sustainable desalination using waste heat: Kudos to thermodynamic synergy. Environ. Sci. Water Res. Technol. 2016, 2, 206–212. [Google Scholar] [CrossRef]
  22. Bataineh, K.M. Multi-effect desalination plant combined with thermal compressor driven by steam generated by solar energy. Desalination 2016, 385, 39–52. [Google Scholar] [CrossRef]
  23. Riaz, N.; Sultan, M.; Miyazaki, T.; Shahzad, M.W.; Farooq, M.; Sajjad, U.; Niaz, Y. A review of recent advances in adsorption desalination technologies. Int. Commun. Heat Mass Transf. 2021, 128, 105594. [Google Scholar] [CrossRef]
  24. Asfahan, H.M.; Sultan, M.; Farooq, M.; Ibrahim, S.M.; Imran, M.; Askalany, A.A.; Shahzad, M.W.; Zhou, Y.; Sajjad, U.; Feng, Y.-Q. Evaluating the emerging adsorbents for performance improvement of adsorption desalination cum cooling system. Int. Commun. Heat Mass Transf. 2023, 142, 106661. [Google Scholar] [CrossRef]
  25. Asfahan, H.M.; Sultan, M.; Miyazaki, T.; Saha, B.B.; Askalany, A.A.; Shahzad, M.W.; Worek, W. Recent development in adsorption desalination: A state of the art review. Appl. Energy 2022, 328, 120101. [Google Scholar] [CrossRef]
  26. Kucera, J. Desalination: Water from Water; John Wiley & Sons: Hoboken, NJ, USA, 2019; ISBN 1119407893. [Google Scholar]
  27. Gebel, J.; Yüce, S. An Engineer’s Guide to Desalination; VGB PowerTech Service GmbH Essen: Essen, Germany, 2008; ISBN 3868750002. [Google Scholar]
  28. Kalogirou, S.A. Seawater desalination using renewable energy sources. Prog. Energy Combust. Sci. 2005, 31, 242–281. [Google Scholar] [CrossRef]
  29. Alnajdi, O.; Wu, Y.; Calautit, J.K. Toward a sustainable decentralized water supply: Review of adsorption desorption desalination (ADD) and current technologies: Saudi Arabia (SA) as a case study. Water 2020, 12, 1111. [Google Scholar] [CrossRef] [Green Version]
  30. Tian, Y.; Yang, Z.; Yu, X.; Jia, Z.; Rosso, M.; Dedman, S.; Zhu, J.; Xia, Y.; Zhang, G.; Yang, J.; et al. Can we quantify the aquatic environmental plastic load from aquaculture? Water Res. 2022, 219, 118551. [Google Scholar] [CrossRef]
  31. Ritchie, H.; Roser, M.; Rosado, P. CO2 and Greenhouse Gas Emissions. Our world in Data 2020. Published Online at OurWorldInData.org. Available online: https://ourworldindata.org/co2-and-greenhouse-gas-emissions (accessed on 5 March 2023).
  32. Panagopoulos, A.; Haralambous, K.-J. Minimal Liquid Discharge (MLD) and Zero Liquid Discharge (ZLD) strategies for wastewater management and resource recovery—Analysis, challenges and prospects. J. Environ. Chem. Eng. 2020, 8, 104418. [Google Scholar] [CrossRef]
  33. Sultan, M.; Miyazaki, T.; Saha, B.; Koyama, S. Steady-state investigation of water vapor adsorption for thermally driven adsorption based greenhouse air-conditioning system. Renew. Energy 2016, 86, 785–795. [Google Scholar] [CrossRef]
  34. Sultan, M.; Miyazaki, T.; Koyama, S. Optimization of adsorption isotherm types for desiccant air-conditioning applications. Renew. Energy 2018, 121, 441–450. [Google Scholar] [CrossRef]
  35. Sultan, M.; El-Sharkawy, I.I.; Miyazaki, T.; Saha, B.B.; Koyama, S.; Maruyama, T.; Maeda, S.; Nakamura, T. Water vapor sorption kinetics of polymer based sorbents: Theory and experiments. Appl. Therm. Eng. 2016, 106, 192–202. [Google Scholar] [CrossRef]
  36. Bai, B.; Rao, D.; Chang, T.; Guo, Z. A nonlinear attachment-detachment model with adsorption hysteresis for suspension-colloidal transport in porous media. J. Hydrol. 2019, 578, 124080. [Google Scholar] [CrossRef]
  37. Dong, H.; Askalany, A.A.; Olkis, C.; Zhao, J.; Santori, G. Hydrothermal stability of water sorption ionogels. Energy 2019, 189, 116186. [Google Scholar] [CrossRef]
  38. Narayan, S.; Harrison, B.; Liang, S.; Evans, M.; Croll, L.; Smith, S. Sorption kinetic studies of water vapour on activated carbon beds. Carbon 2008, 46, 397–404. [Google Scholar] [CrossRef]
  39. Shabir, F.; Sultan, M.; Miyazaki, T.; Saha, B.B.; Askalany, A.; Ali, I.; Zhou, Y.; Ahmad, R.; Shamshiri, R.R. Recent updates on the adsorption capacities of adsorbent-adsorbate pairs for heat transformation applications. Renew. Sustain. Energy Rev. 2019, 119, 109630. [Google Scholar] [CrossRef]
  40. Qasem, N.A.A.; Zubair, S.M. Performance Evaluation of a novel hybrid humidification-dehumidification (Air-Heated) system with an adsorption desalination system. Desalination 2019, 461, 37–54. [Google Scholar] [CrossRef]
  41. Khalil, A.; El-Agouz, S.A.; El-Samadony, Y.A.F.; Abdo, A. Solar water desalination using an air bubble column humidifier. Desalination 2015, 372, 7–16. [Google Scholar] [CrossRef]
  42. Wu, G.; Kutlu, C.; Zheng, H.; Su, Y.; Cui, D. A study on the maximum gained output ratio of single-effect solar humidification-dehumidification desalination. Solar Energy 2017, 157, 1–9. [Google Scholar] [CrossRef]
  43. Muthusamy, C.; Srithar, K. Energy saving potential in humidification-dehumidification desalination system. Energy 2017, 118, 729–741. [Google Scholar] [CrossRef]
  44. Müller-Holst, H. Solar Thermal Desalination Using the Multiple Effect Humidification (MEH)-Method. In Solar Desalination for the 21st Century; Springer: Berlin/Heidelberg, Germany, 2007; pp. 215–225. [Google Scholar]
  45. Abd ElKader, M.; Aref, A.; Moustafa, G.H.; ElHenawy, Y.A. Theoretical and experimental study for a humidification-dehumidification (HD) solar desalination unit. Eng. Res. J. 2010, 33, 119–130. [Google Scholar] [CrossRef] [Green Version]
  46. Sajjad, U.; Abbas, N.; Hamid, K.; Abbas, S.; Hussain, I.; Ammar, S.M.; Sultan, M.; Ali, H.M.; Hussain, M.; Rehman, T.U.; et al. A review of recent advances in indirect evaporative cooling technology. Int. Commun. Heat Mass Transf. 2021, 122, 105140. [Google Scholar] [CrossRef]
  47. Sultan, M.; Miyazaki, T.; Mahmood, M.H.; Khan, Z.M. Solar assisted evaporative cooling based passive air-conditioning system for agricultural and livestock applications. J. Eng. Sci. Technol. 2018, 13, 693–703. [Google Scholar]
  48. Aleem, M.; Hussain, G.; Sultan, M.; Miyazaki, T.; Mahmood, M.H.; Sabir, M.I.; Nasir, A.; Shabir, F.; Khan, Z.M. Experimental Investigation of Desiccant Dehumidification Cooling System for Climatic Conditions of Multan (Pakistan). Energies 2020, 13, 5530. [Google Scholar] [CrossRef]
  49. Asfahan, H.M.; Sajjad, U.; Sultan, M.; Hussain, I.; Hamid, K.; Ali, M.; Wang, C.-C.; Shamshiri, R.R.; Khan, M.U. Artificial Intelligence for the Prediction of the Thermal Performance of Evaporative Cooling Systems. Energies 2021, 14, 3946. [Google Scholar] [CrossRef]
  50. Vala, K.V.; Saiyed, F.; Joshi, D.C. Evaporative Cooled Storage Structures: An Indian Scenario. Trends in Post Harvest Technology, 2, 22–32.—Google Search. 2014. Available online: https://rb.gy/qwtnar (accessed on 5 March 2023).
  51. Raza, H.M.U.; Sultan, M.; Bahrami, M.; Khan, A.A. Experimental investigation of evaporative cooling systems for agricultural storage and livestock air-conditioning in Pakistan. Build. Simul. 2020, 14, 617–631. [Google Scholar] [CrossRef]
  52. Aziz, M.A.; Lin, J.; Mikšík, F.; Miyazaki, T.; Thu, K. The second law analysis of a humidification-dehumidification desalination system using M-cycle. Sustain. Energy Technol. Assess. 2022, 52, 102141. [Google Scholar] [CrossRef]
  53. Dizaji, H.S.; Hu, E.J.; Chen, L. A comprehensive review of the Maisotsenko-cycle based air conditioning systems. Energy 2018, 156, 725–749. [Google Scholar] [CrossRef] [Green Version]
  54. Mahmood, M.H.; Sultan, M.; Miyazaki, T.; Koyama, S.; Maisotsenko, V.S. Overview of the Maisotsenko cycle—A way towards dew point evaporative cooling. Renew. Sustain. Energy Rev. 2016, 66, 537–555. [Google Scholar] [CrossRef]
  55. Raza, H.M.U.; Ashraf, H.; Shahzad, K.; Sultan, M.; Miyazaki, T.; Usman, M.; Shamshiri, R.R.; Zhou, Y.; Ahmad, R. Investigating Applicability of Evaporative Cooling Systems for Thermal Comfort of Poultry Birds in Pakistan. Appl. Sci. 2020, 10, 4445. [Google Scholar] [CrossRef]
  56. Çalişkan, H.; Hepbasli, A.; Dincer, I.; Maisotsenko, V. Thermodynamic performance assessment of a novel air cooling cycle: Maisotsenko cycle. Int. J. Refrig. 2011, 34, 980–990. [Google Scholar] [CrossRef]
  57. Hussain, G.; Aleem, M.; Sultan, M.; Sajjad, U.; Ibrahim, S.M.; Shamshiri, R.R.; Farooq, M.; Khan, M.U.; Bilal, M. Evaluating Evaporative Cooling Assisted Solid Desiccant Dehumidification System for Agricultural Storage Application. Sustainability 2022, 14, 1479. [Google Scholar] [CrossRef]
  58. Bell, I.H.; Wronski, J.; Quoilin, S.; Lemort, V. Pure and Pseudo-Pure Fluid Thermophysical Property Evaluation and the Open-Source Thermophysical Property Library Coolprop. Ind. Eng. Chem Res. 2014, 53, 2498–2508. [Google Scholar] [CrossRef] [Green Version]
  59. Maclaine-Cross, I.L.; Banks, P.J. A General Theory of Wet Surface Heat Exchangers and its Application to Regenerative Evaporative Cooling. J. Heat Transf. 1981, 103, 579–585. [Google Scholar] [CrossRef]
  60. Stoitchkov, N.J.; Dimitrov, G.I. Effectiveness of Crossflow plate heat exchanger for indirect evaporative cooling: Efficacité des échangeurs thermiques à plaques, à courants croises pour refroidissement indirect évaporatif. Int. J. Refrig. 1998, 21, 463–471. [Google Scholar] [CrossRef]
  61. Alonso, J.F.S.J.; Martíez, F.J.R.; Gómez, E.V.; Plasencia, M.A.A.G. Simulation model of an indirect evaporative cooler. Energy Build 1998, 29, 23–27. [Google Scholar] [CrossRef]
  62. Chidnovsky, Y.; Kozlov, A. Integrated Industrial Wastewater Reuse by Heat Recovery; State of California Energy Commission: Sacramento, CA, USA, 2015. [Google Scholar]
  63. Xu, H.; Jiang, S.; Xie, M.X.; Jia, T.; Dai, Y.J. Technical Improvements and perspectives on humidification-dehumidification desalination—A review. Desalination 2022, 541, 116029. [Google Scholar] [CrossRef]
  64. Campos, B.L.d.O.; Costa, A.O.S.d.; Costa Junior, E.F.d. Mathematical modeling and sensibility analysis of a solar humidification-dehumidification desalination system considering saturated air. Solar Energy 2017, 157, 321–327. [Google Scholar] [CrossRef]
  65. Rocchetti, A.; Socci, L. Theoretical and numerical assessment of an enhanced humidification-dehumidification desalination system based on indirect evaporative cooling and vapour compression refrigeration. Appl. Therm. Eng. 2022, 208, 118194. [Google Scholar] [CrossRef]
  66. Tariq, R.; Sheikh, N.A.; Xamán, J.; Bassam, A. An innovative air saturator for humidification-dehumidification desalination application. Appl. Energy 2018, 228, 789–807. [Google Scholar] [CrossRef]
Figure 1. Global greenhouse gas emissions and warming scenarios [31].
Water 15 01125 g001
Figure 2. Classification of the HDH desalination configurations reproduced here from [29].
Water 15 01125 g002
Figure 3. Schematic illustration of DE-HDH desalination cycle (top) entail with their psychrometric presentation (lower left).
Water 15 01125 g003
Figure 4. Schematic illustration of IE-HDH cycle (top) along with the psychrometric presentation (lower left).
Water 15 01125 g004
Figure 5. Schematic illustration of ME-HDH cycle (top) along with the psychrometric presentation (lower left).
Water 15 01125 g005
Figure 6. Temporal variation in wet-bulb effectiveness of DE, IE, and ME obtained from [55].
Water 15 01125 g006
Figure 7. Water production rate of E-HDH desalination systems: (a) DE-HDH, (b) IE-HDH, and (c) ME-HDH corresponding to Tdb and RH.
Water 15 01125 g007aWater 15 01125 g007b
Figure 8. Sensible cooling flux (left side) and latent cooling flux (right side) of the studied E-HDH desalination systems.
Water 15 01125 g008aWater 15 01125 g008b
Figure 9. SEC of the studied E-HDH desalination system, (a) DE-HDH system, and (b) IE-HDH and ME-HDH systems.
Water 15 01125 g009aWater 15 01125 g009b
Figure 10. Sensible heat factor (left side) and latent heat factor (right side) of the studied E-HDH desalination systems.
Water 15 01125 g010
Figure 11. GOR of the studied E-HDH desalination system, (a) DE-HDH system, (b) IE-HDH and (c) ME-HDH systems.
Water 15 01125 g011aWater 15 01125 g011b
Figure 12. Performance of the E-HDH desalination cycle corresponding to Köppen–Geiger climatic classification.
Water 15 01125 g012
Figure 13. Temporal variation in Tdb and RH of the studied E-HDH desalination cycles in accordance with climatic conditions of Saudi Arabia.
Water 15 01125 g013
Figure 14. Temporal variation in WPR and ER of the studied E-HDH desalination cycles in accordance with climatic conditions of Saudi Arabia.
Water 15 01125 g014
Table 1. Physical and operational parameters taken for the studied E-HDH, as available via [51].
Parameters (Units)DE-HDHIE-HDHME-HDH
Width (m)0.250.1270.127
Height (m) 0.20320.2032
Velocity (m/s)2.04.0
Tdb (°C)10 to 50
RH (-)0.1 to 1.0
Wet bulb effectiveness (%)95%58%98%
Fan (Qty)1.02.02.0
Pump (Qty)1.0
Fan power (W)15.0
Pump power (W)10
Disclaimer/Publisher’s Note: The statements, opinions and data contained in all publications are solely those of the individual author(s) and contributor(s) and not of MDPI and/or the editor(s). MDPI and/or the editor(s) disclaim responsibility for any injury to people or property resulting from any ideas, methods, instructions or products referred to in the content.

