Article

Numerical Simulation Study on the Influence of Construction Load on the Cutoff Wall in Reservoir Engineering

1
College of Water Resources & Civil Engineering, China Agricultural University, Beijing 100083, China
2
China Highway Engineering Consultants Corporation, Beijing 100089, China
3
Land and Resources Exploration Center, Hebei Bureau of Geology and Mineral Resources Exploration, Shijiazhuang 050081, China
4
School of Engineering and Technology, China University of Geosciences, Beijing 100083, China
*
Author to whom correspondence should be addressed.
Water 2023, 15(5), 993; https://doi.org/10.3390/w15050993
Submission received: 12 February 2023 / Revised: 2 March 2023 / Accepted: 3 March 2023 / Published: 5 March 2023
(This article belongs to the Special Issue Application of Artificial Intelligence in Hydraulic Engineering)

Abstract

:
Relying on the Beijing-Shijiazhuang Expressway widening project near the impervious wall of a reservoir, this paper uses FLAC3D two-dimensional and three-dimensional numerical simulation methods to establish the whole process model of the impervious wall of the reservoir affected by the construction load of the high-way reconstruction section. The stress and strain state of the cut-off wall in the high-way reconstruction section and the nearby reservoir is simulated in detail, the overall deformation of the cut-off wall in the reservoir is directly reflected, and the interaction and differential deformation between the wall structures are reflected. The safety and stability of the cutoff wall of the reservoir affected by the construction load are evaluated so that various advanced mechanical behaviors of the cutoff wall can be predicted. Research results show that the horizontal displacement value of the wall gradually increases from bottom to top, and the maximum value appears at the top of the wall. The horizontal displacement value of the 1–3 walls is relatively large, with the maximum value of 22.368 mm, and the horizontal displacement value of the 4–10 walls shows little difference. This is on account of the gravity of the backfill, the strata in the whole project area having settled, and the settlement at the bottom of the cut-off wall being 2.542 mm. At the root of the rigid cut-off wall, the compressive stress concentration occurs, with the maximum value between 1.75 MPa and 2.15 MPa. Due to the size of the structure, the maximum tensile stress of 0.237 MPa appears in the local area near the guide wall of the rigid cut-off wall, which will not endanger the rigid cut-off wall because of its small value. The maximum stress in the rigid impervious wall and the plastic impervious wall are 1.90–2.15 MPa and 1.00–1.12 MPa, respectively. Apart from the small tensile stress at the connecting guide wall between the rigid cut-off wall and the plastic concrete cut-off wall, the cut-off wall is under pressure, especially the plastic cut-off wall. Combined with the analysis of the stress state of the wall, it can be determined that the anti-seepage wall (rigid cut-off wall and plastic concrete cut-off wall) is stable and safe during the construction period.

1. Introduction

With the continuous construction and renovation of the surrounding projects of the reservoir [1,2], the two sides and the top surface of the cut-off wall of a reservoir will be affected by the construction disturbance of the backfilling project [3,4,5]. For the upper part of the upcoming large-scale construction and new load project, whether the original cut-off wall can still maintain a stable strength [6,7,8], whether there will be excessive deformation and damage [9,10,11], or whether the cut-off function is affected, reduction or loss [12,13,14,15] are important issues that concern reservoir builders and water protection workers. There are also important issues related to reservoir water storage operations and the safety and stability of cofferdams [16,17,18].
Due to the development of computer performance, the mathematical analysis in rock mechanics has made great progress [19,20,21,22]. Different numerical simulation methods are obtained based on different mathematical models [23,24,25,26], and the finite element method changed from linear to nonlinear. This development [27,28,29,30,31,32] has solved a great problem for rock engineering. With the rapid development of numerical simulation, the academic community also applied this method to study the impact of the construction around the cut-off wall more intuitively [33,34]. Fu Z Q et al. [35] used the linear elastic model to calculate the earth–rock dam and clay concrete cut-off wall of the hydropower station. The pebble and gravel cover layer in the calculation was used by the Duncan–Chang model and obtained the linear elastic characteristics and stress-strain of the cut-off wall. Relying on the Xiongjiagang rock dam project, Han Y [36] established the seepage model of the rock dam using Geo-studio software and analyzed the mechanism of the stability of the seepage wall of the dam. Shepherd D A [9] used the Druker–Prager model to carry out the back analysis and calculation of the measured displacement of the cut-off wall of a hydropower station. The calculation process involved the soil Poisson’s ratio, density, viscous force, friction, angle, and other parameters, focusing on back-calculating the elastic modulus parameters that play a major role. Ma Xiaohua et al. [37,38] studied the influence of the change of elastic modulus on the cut-off wall by increasing the thickness parameter. Relying on the reinforcement project of the Hualiangting Reservoir. Ren Xiang et al. [39,40] simulated the operation process of the dam and analyzed the change rule of the ultra-deep concrete cut-off wall under the dam stress, water pressure, and foundation constraint conditions. Chen Xiaolian et al. [41] used the GMS simulation to study the permeability coefficient and elastic water supply of each aquifer in the research area of a hydropower station in Sichuan, evaluating the cut-off effect. Liang Yan et al. [42] selected Midas to simulate and establish the action model of the change of support conditions on the cut-off wall of the dam foundation of Longkou Station and evaluated the influence of the support stiffness coefficient on the cut-off wall. Li Mingyuan et al. [43] simulated and predicted the immersion degree and scope of the calculation area under the normal water storage level of the Xingan Navigation and Power Project and used cut-off walls and relief well-engineering measures to control the immersion of the reservoir area to evaluate the difference in the effect of immersion treatment on the reservoir area under working conditions. Yasushi Arai et al. [44,45,46] used three-dimensional simulation to analyze the impact of excavation construction on wall deformation and discussed the influence of two excavation sequences and three different wall thicknesses on the results. R. Schafer et al. [47,48] analyzed the influence of the construction sequence of the cut-off wall on the cut-off wall in a soft soil foundation in the numerical calculation and simulated the influence of the coupling effect of groundwater pressure and geo-stress on the wall.
The strength, stability, and deformation of the cut-off wall of the reservoir that has been built under the influence of large-scale construction and new load in the near and upper part are important factors affecting the safety and stability of the reservoir. At present, the academic community mostly focuses on the study of the cut-off performance of the cut-off wall. Yet, there is little systematic research on this aspect. Based on this, this paper, relying on the Beijing-Shijiazhuang Expressway widening project near the impervious wall of a reservoir, uses FLAC3D two-dimensional and three-dimensional numerical simulation methods to establish the whole process model of the impervious wall of the reservoir affected by the construction load of the highway reconstruction section. The stress and strain state of the cut-off wall in the highway reconstruction section and the nearby reservoir is simulated in detail. The overall deformation of the cut-off wall in the reservoir is directly reflected, and the interaction and differential deformation between the wall structures are reflected. The safety and stability of the cut-off wall of the reservoir affected by the construction load are evaluated so that various advanced mechanical behaviors of the cut-off wall can be predicted.

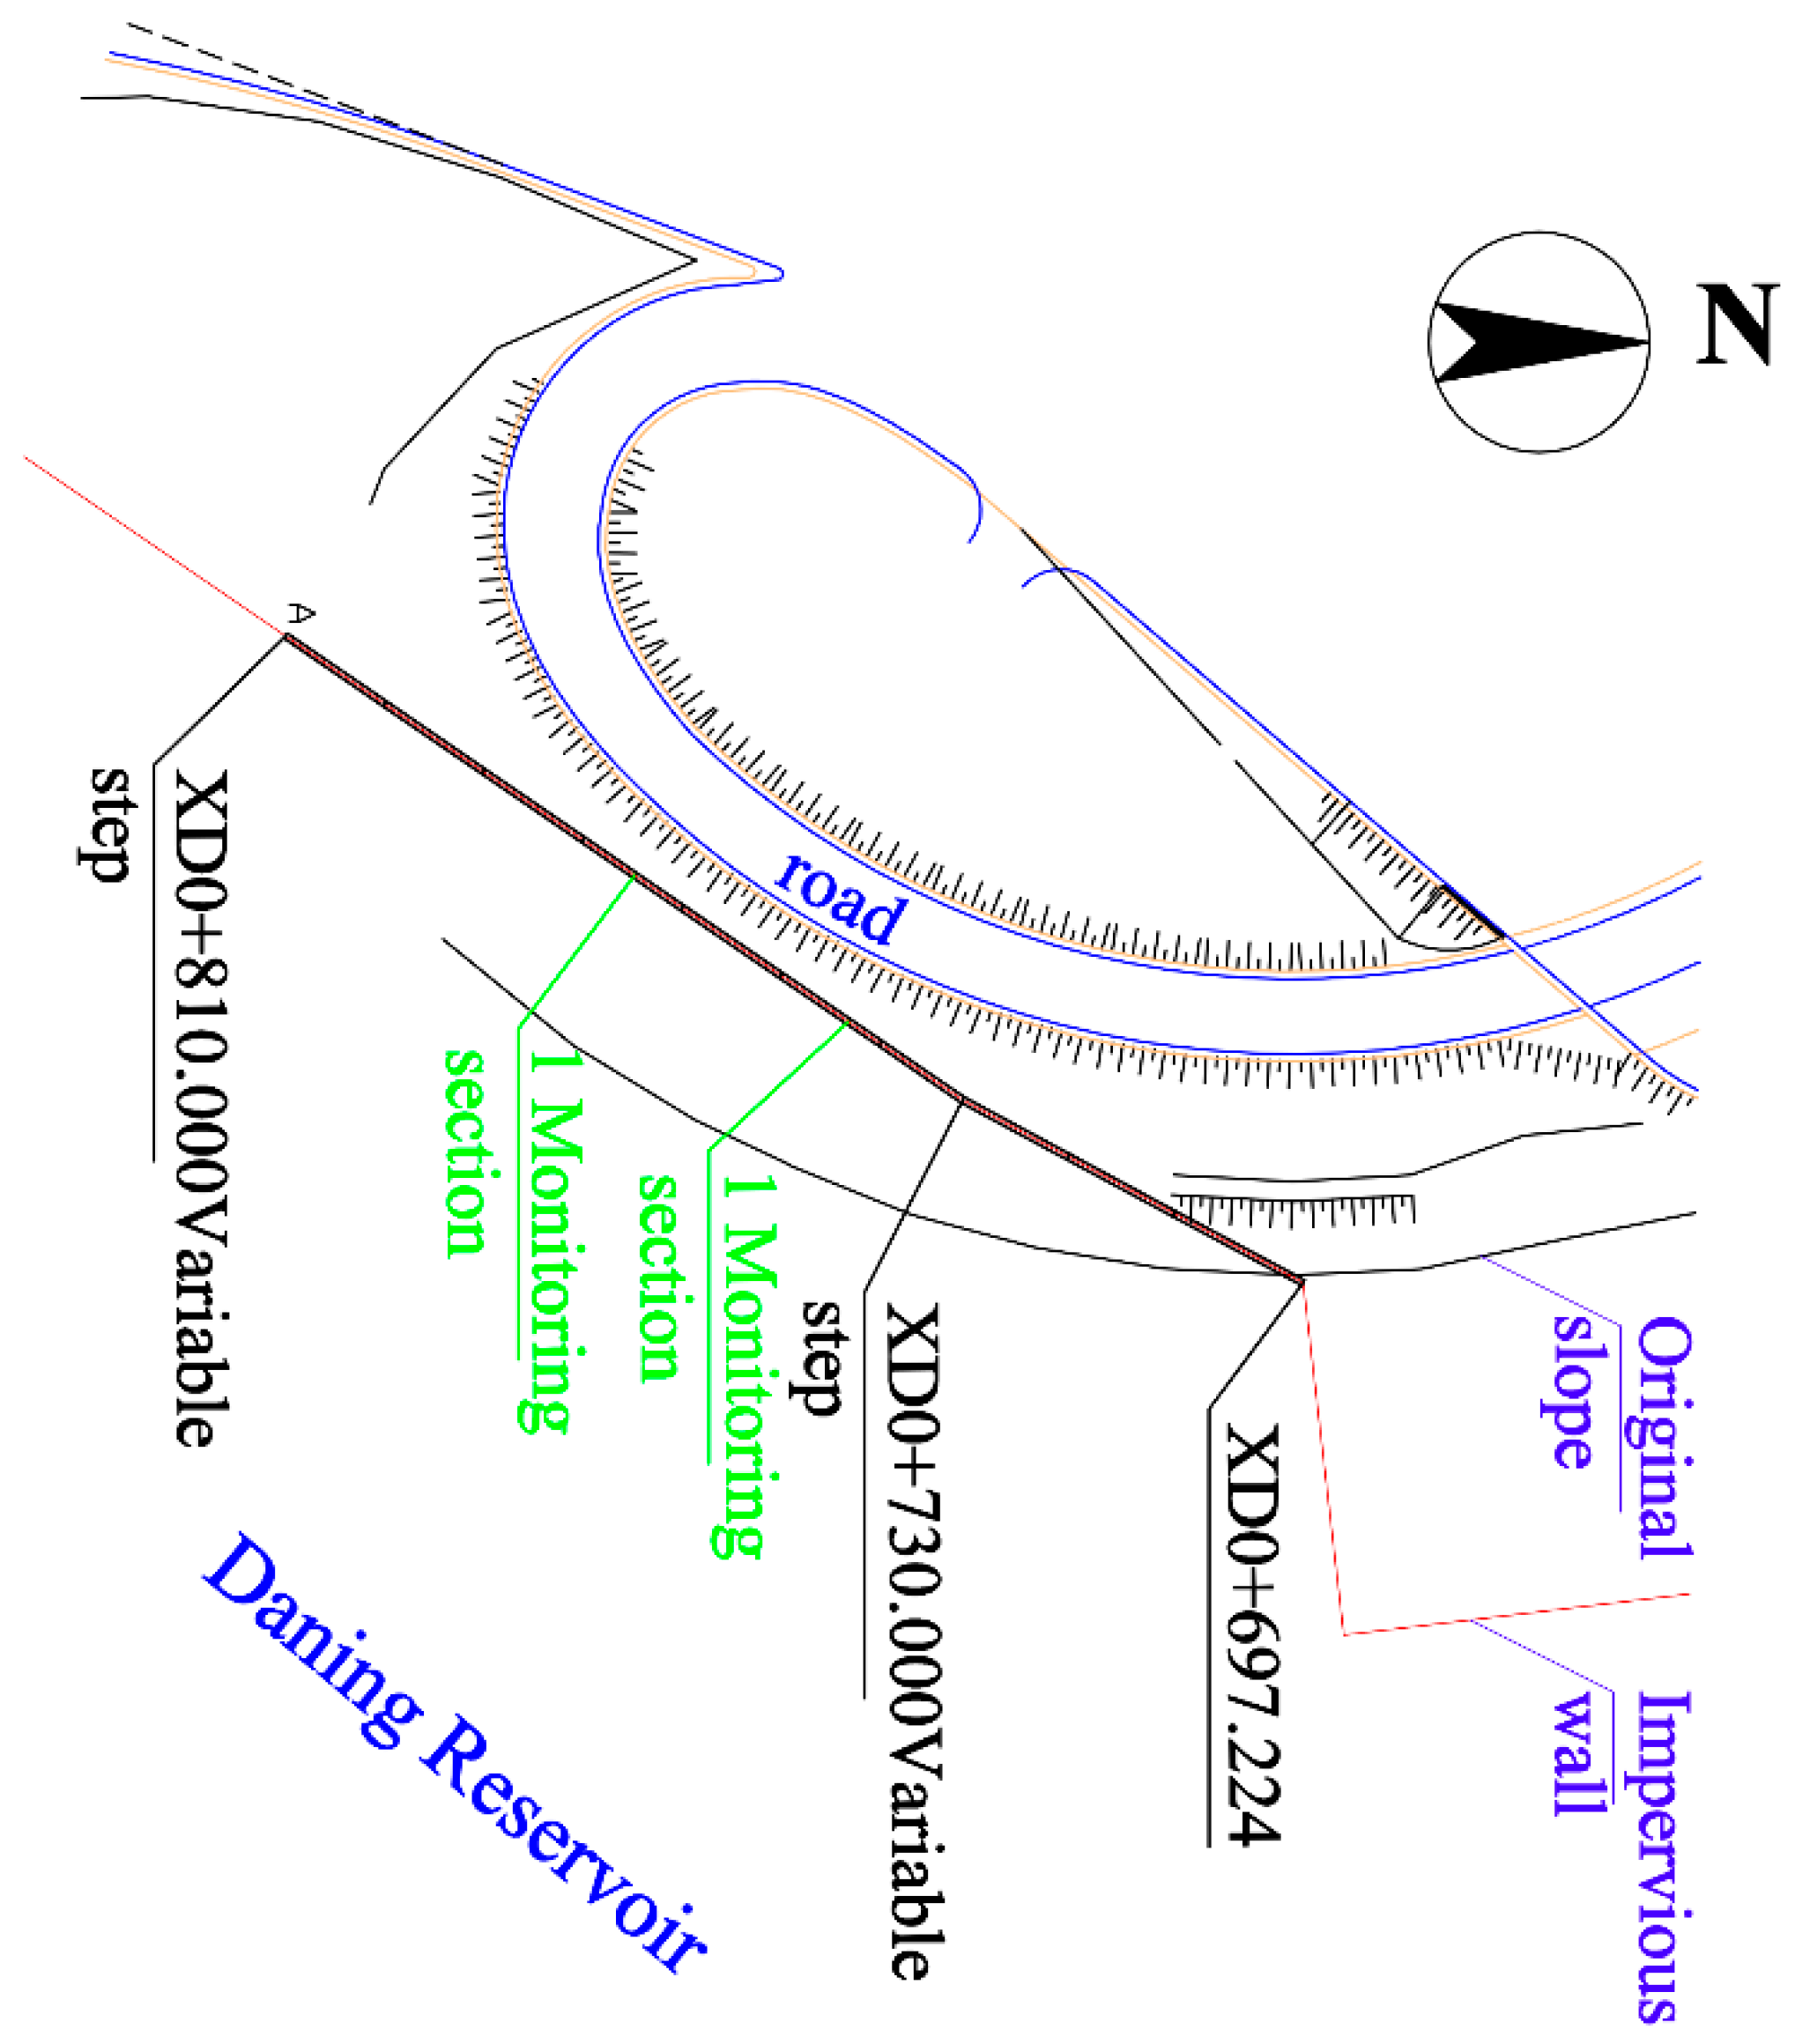
2. Overview of Cut-Off Wall Project

The length of the Jingshi Highway reconstruction project in a section of the reservoir is about 3094 m. The subgrade reconstruction and widening section of a reservoir area of Jingshi Highway are closely parallel to the cut-off wall of the west embankment of a storage reservoir, and the length of the intersection is about 2247 m. The large part is about 114 m long. The cut-off wall of this part is divided into upper and lower parts. The lower part is the original plastic concrete cut-off wall, and the upper part is composed of 10 reinforced concrete walls connected to each other. The joints between the walls are flexible joints, which allow slight movement between the walls.
To more clearly reflect the mechanical effect of the wall affected by the construction, the numerical simulation is based on the two typical monitoring sections selected in the expansion section, as shown in Figure 1 (located at XD0 + 744.000 (the fifth section) and XD0 + 770.000 (the seven section). Sections 1 and 2 are the main research objects, and the numerical calculation and analysis are carried out for these 3 typical sections and the project as a whole. The overall 3D numerical simulation model of the project will include all the walls of the research object, that is, the first to tenth walls from north to south and filling soil (enclosing soil) in the vicinity.
The construction area is located on the platform of the west embankment of a reservoir, which belongs to the geological unit of the Xiaoqing River alluvial plain. The terrain of the site is flat, the ground elevation is about 53.41~55.42 m, slightly inclined from north to south, and the ground slope is about 1.06‰. The anti-seepage wall of the renovation and expansion section of Dujiakan is located on the west embankment platform of a reservoir area, 11 m away from the foot of the slope on the east side of the original Jingshi Expressway. The anti-seepage wall is 0.60 m thick; the wall depth is 9–12.5 m, 2.5 m into semi-cemented bedrock at the bottom of the wall.
It is constructed by two drills and one grasping method. The length of the groove section is 6.2 m and the designed compressive strength of the plastic concrete wall is 2 MPa. The height of the guide wall of the cut-off wall is 1.0 m, the width of the base is 1.0 m, and the height is 0.3 m. The thickness of the guide wall above the base is 0.4 m and it will be poured with C15 reinforced concrete. Plastic concrete anti-seepage walls have been pre-constructed. The rigid anti-seepage wall that will be heightened later is also made of C15 reinforced concrete, the wall thickness is 0.6 m, the wall height is 9–11 m, and the design compressive strength is 15 MPa. The structure between the plastic concrete cut-off wall and the rigid cut-off wall is shown in Figure 2a. The average reinforced concrete wall is 12 m, and each wall is constructed separately. Flexible joints are used between the two walls. The joint structure is shown in Figure 2b.

3. Construction Plan and Calculation Model

3.1. Construction Plan

The simulation analysis shall consider the actual construction process of the project as much as possible. For this reason, the specific construction scheme is given.
(1) Construction scheme of the cut-off wall:
The construction plan of the cut-off wall is mainly divided into two parts. First, the original plastic concrete cut-off wall of the lower part adopts the traditional underground continuous wall construction method, that is, pouring concrete after continuous mechanical groove formation. Second, the upper reinforced concrete wall adopts a formwork pouring form. Considering the safety of the wall, the reinforced concrete wall is divided into upper and lower parts and completed step by step, as shown in Figure 3.
The detailed construction method of the cut-off wall is as follows:
  • Determine the construction position: according to the design drawings, set out the baseline of the cut-off wall;
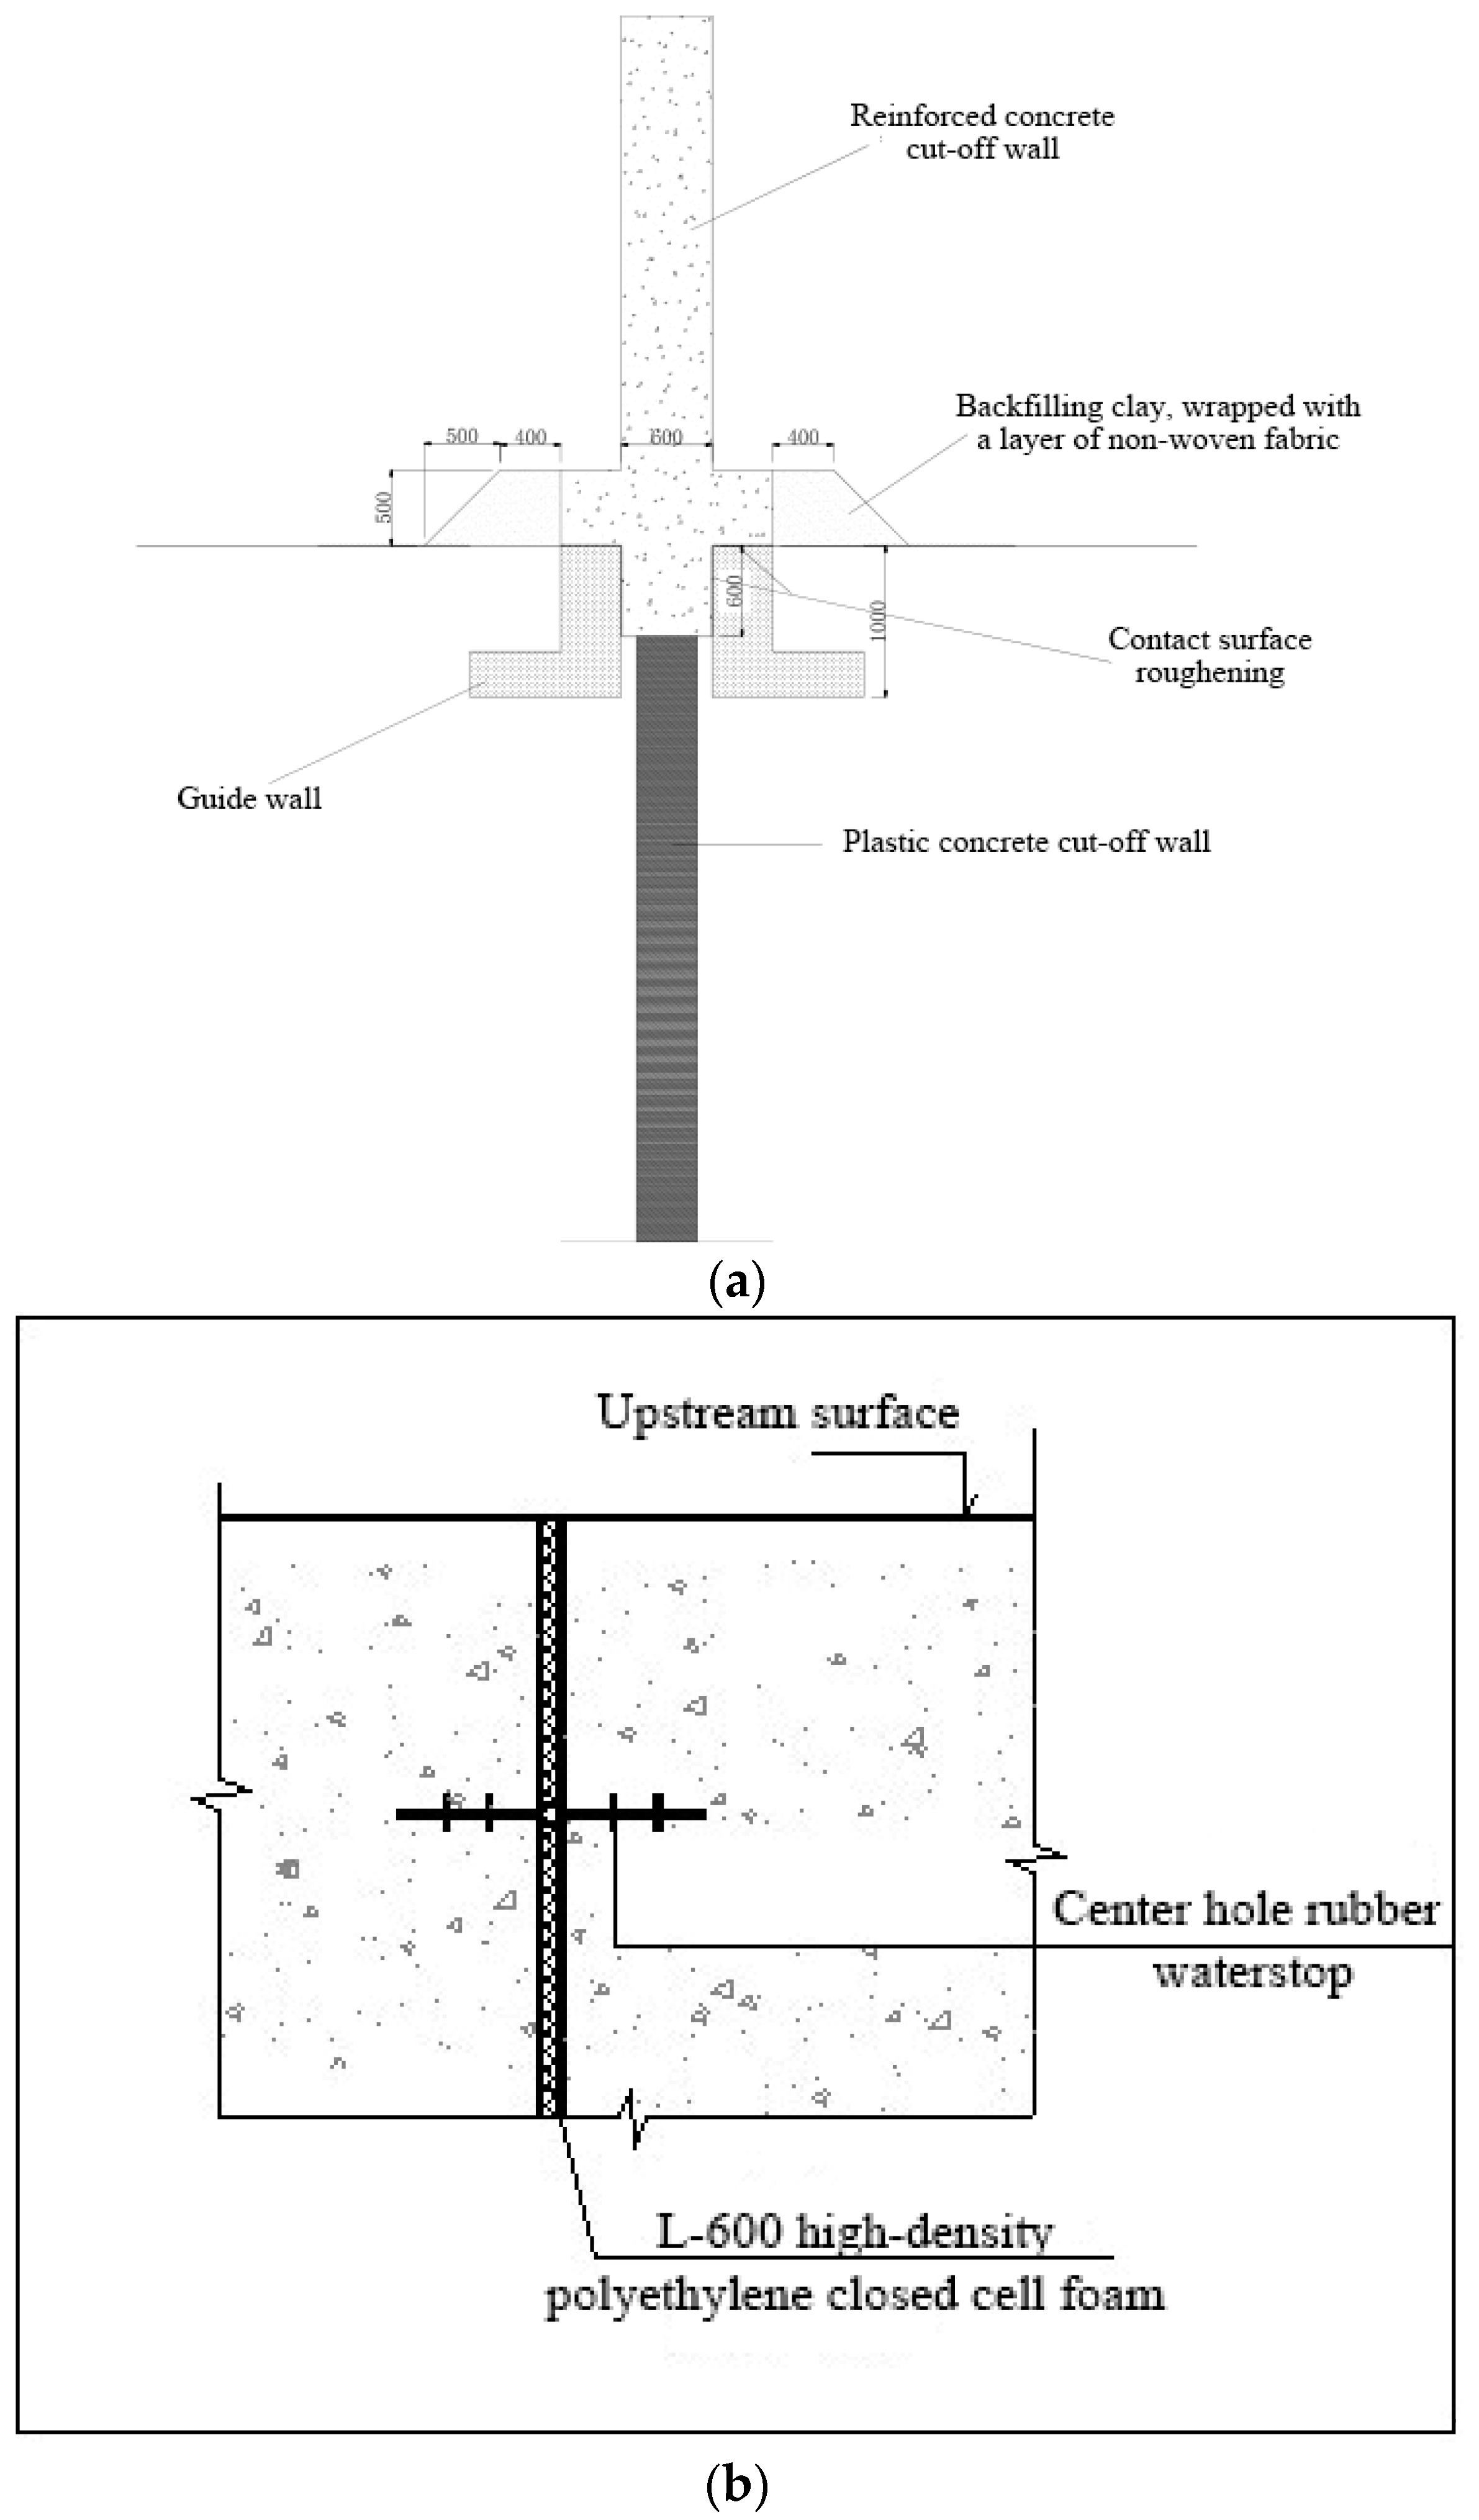
  • Construction guide wall: The guide wall earthwork is excavated along the baseline by trench sections. The excavation depth is based on the wall elevation of each trench section. Support the formwork and pour C15 concrete. The finished guide wall should be at the same height as the surrounding ground surface to facilitate the subsequent movement of the punching and grabbing machinery;
  • Mechanical grooving: Use a punching machine to grab the wall groove section in the guide groove between the guide walls. The length of the groove section is strictly controlled within the specification requirements. Mud is used to protect the hole wall to prevent collapse;
  • Construction of plastic concrete wall: The plastic concrete wall is poured with C2 concrete. The pouring process should be coordinated with the mechanical groove to ensure the quality of the wall at the joint. It is advisable to use a conduit to facilitate the pouring;
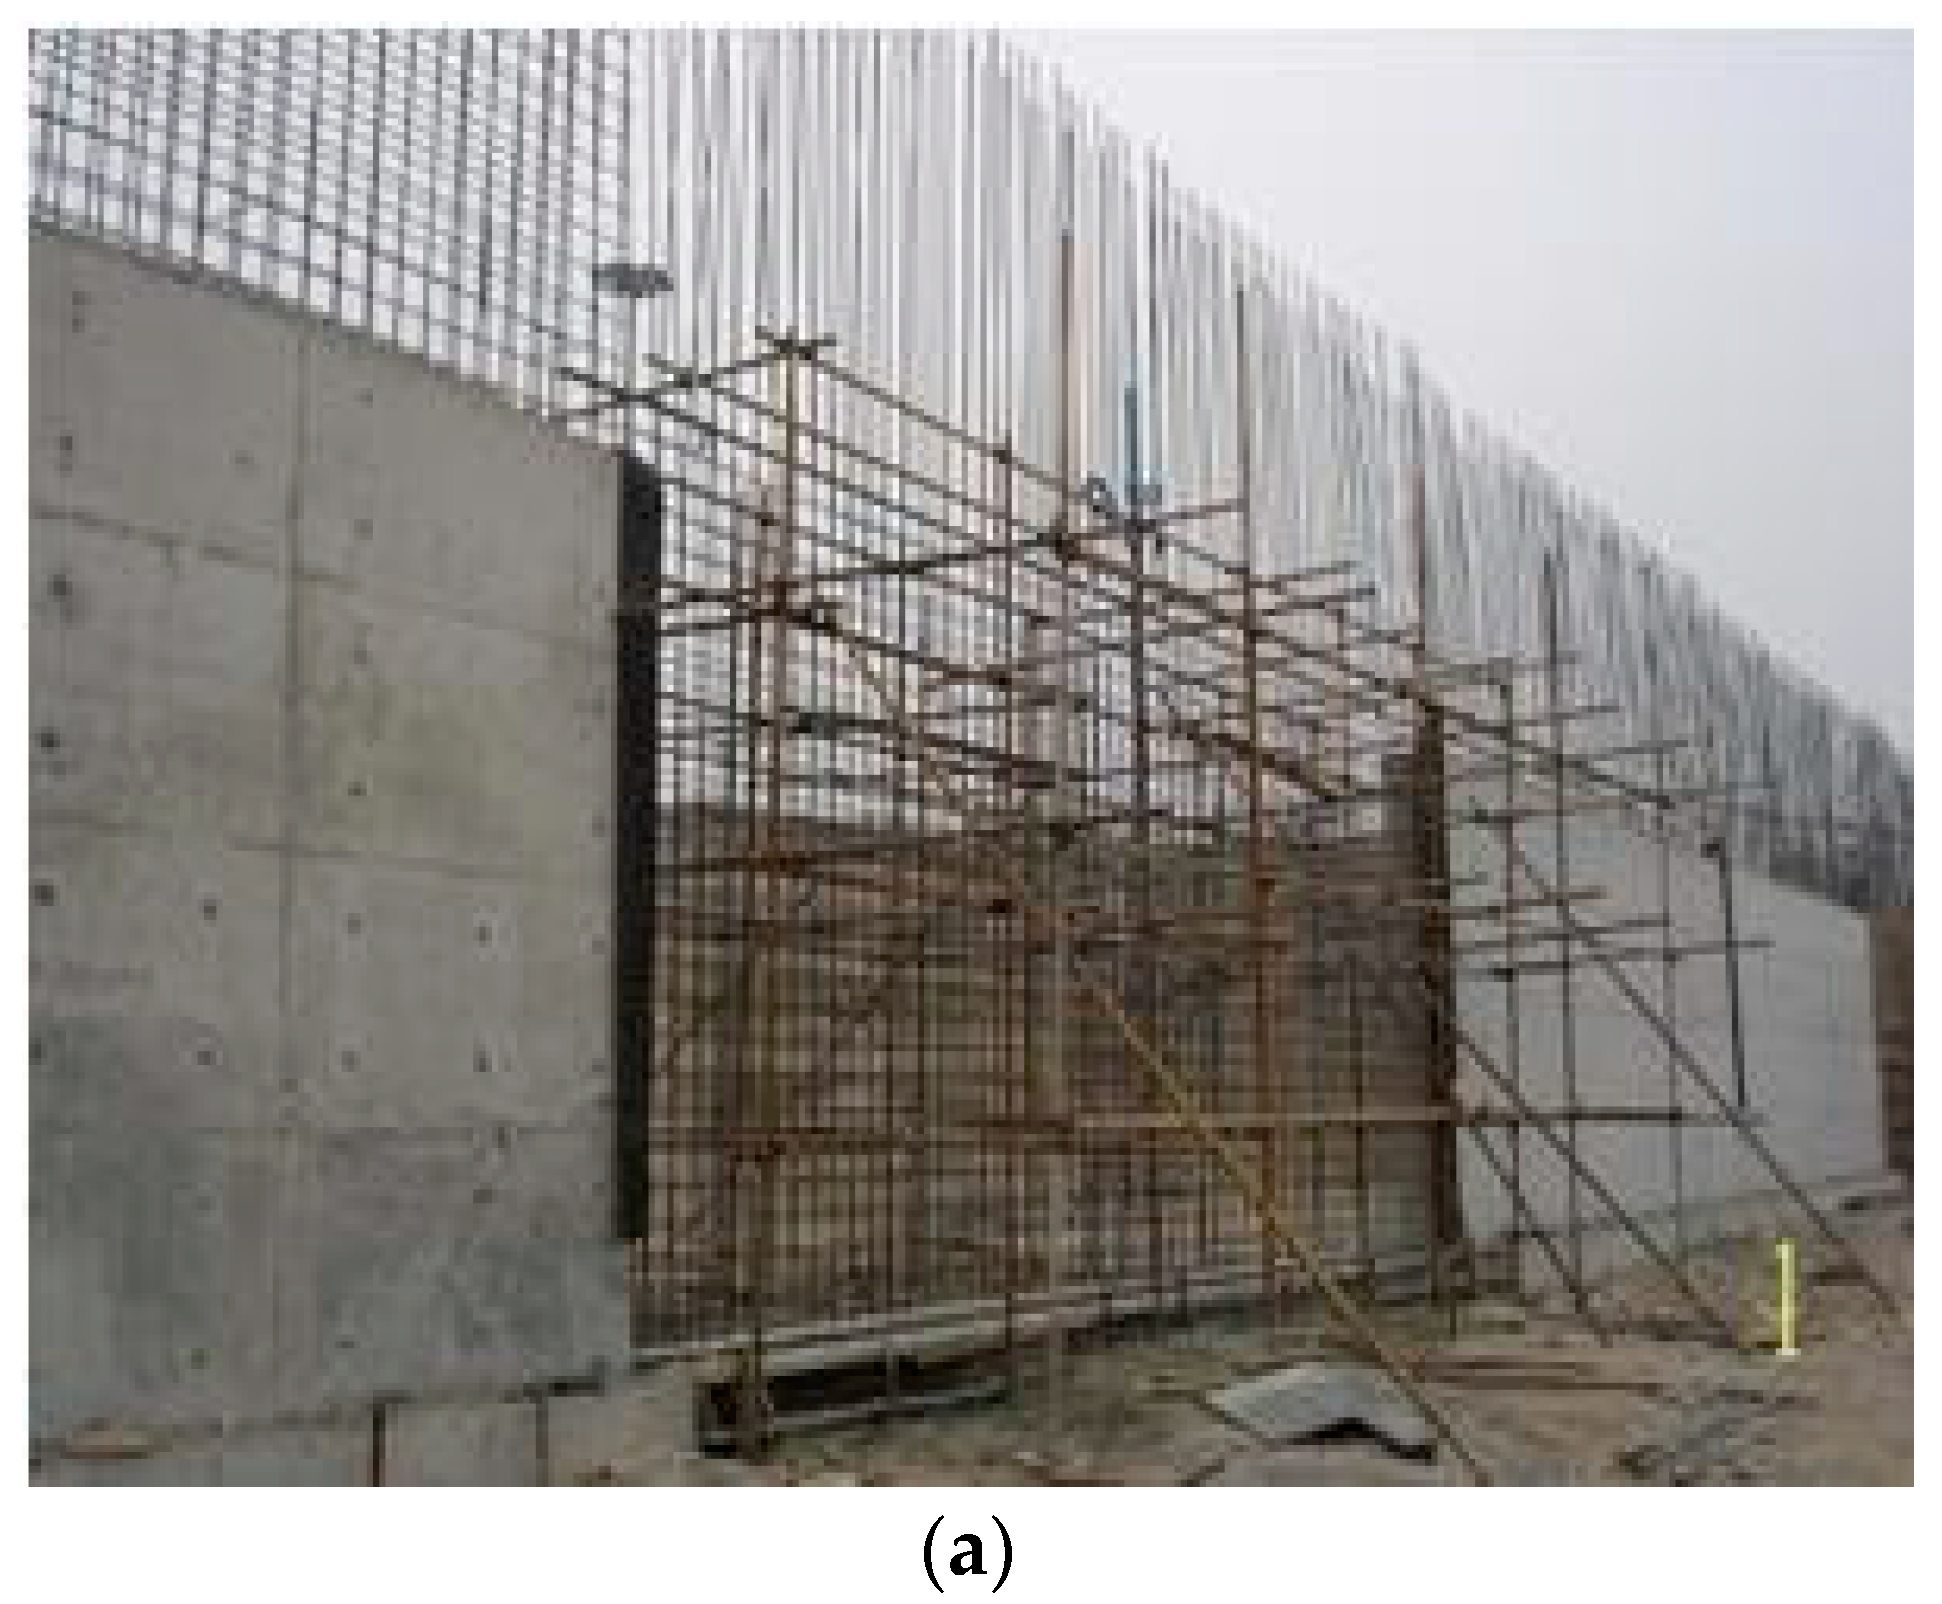
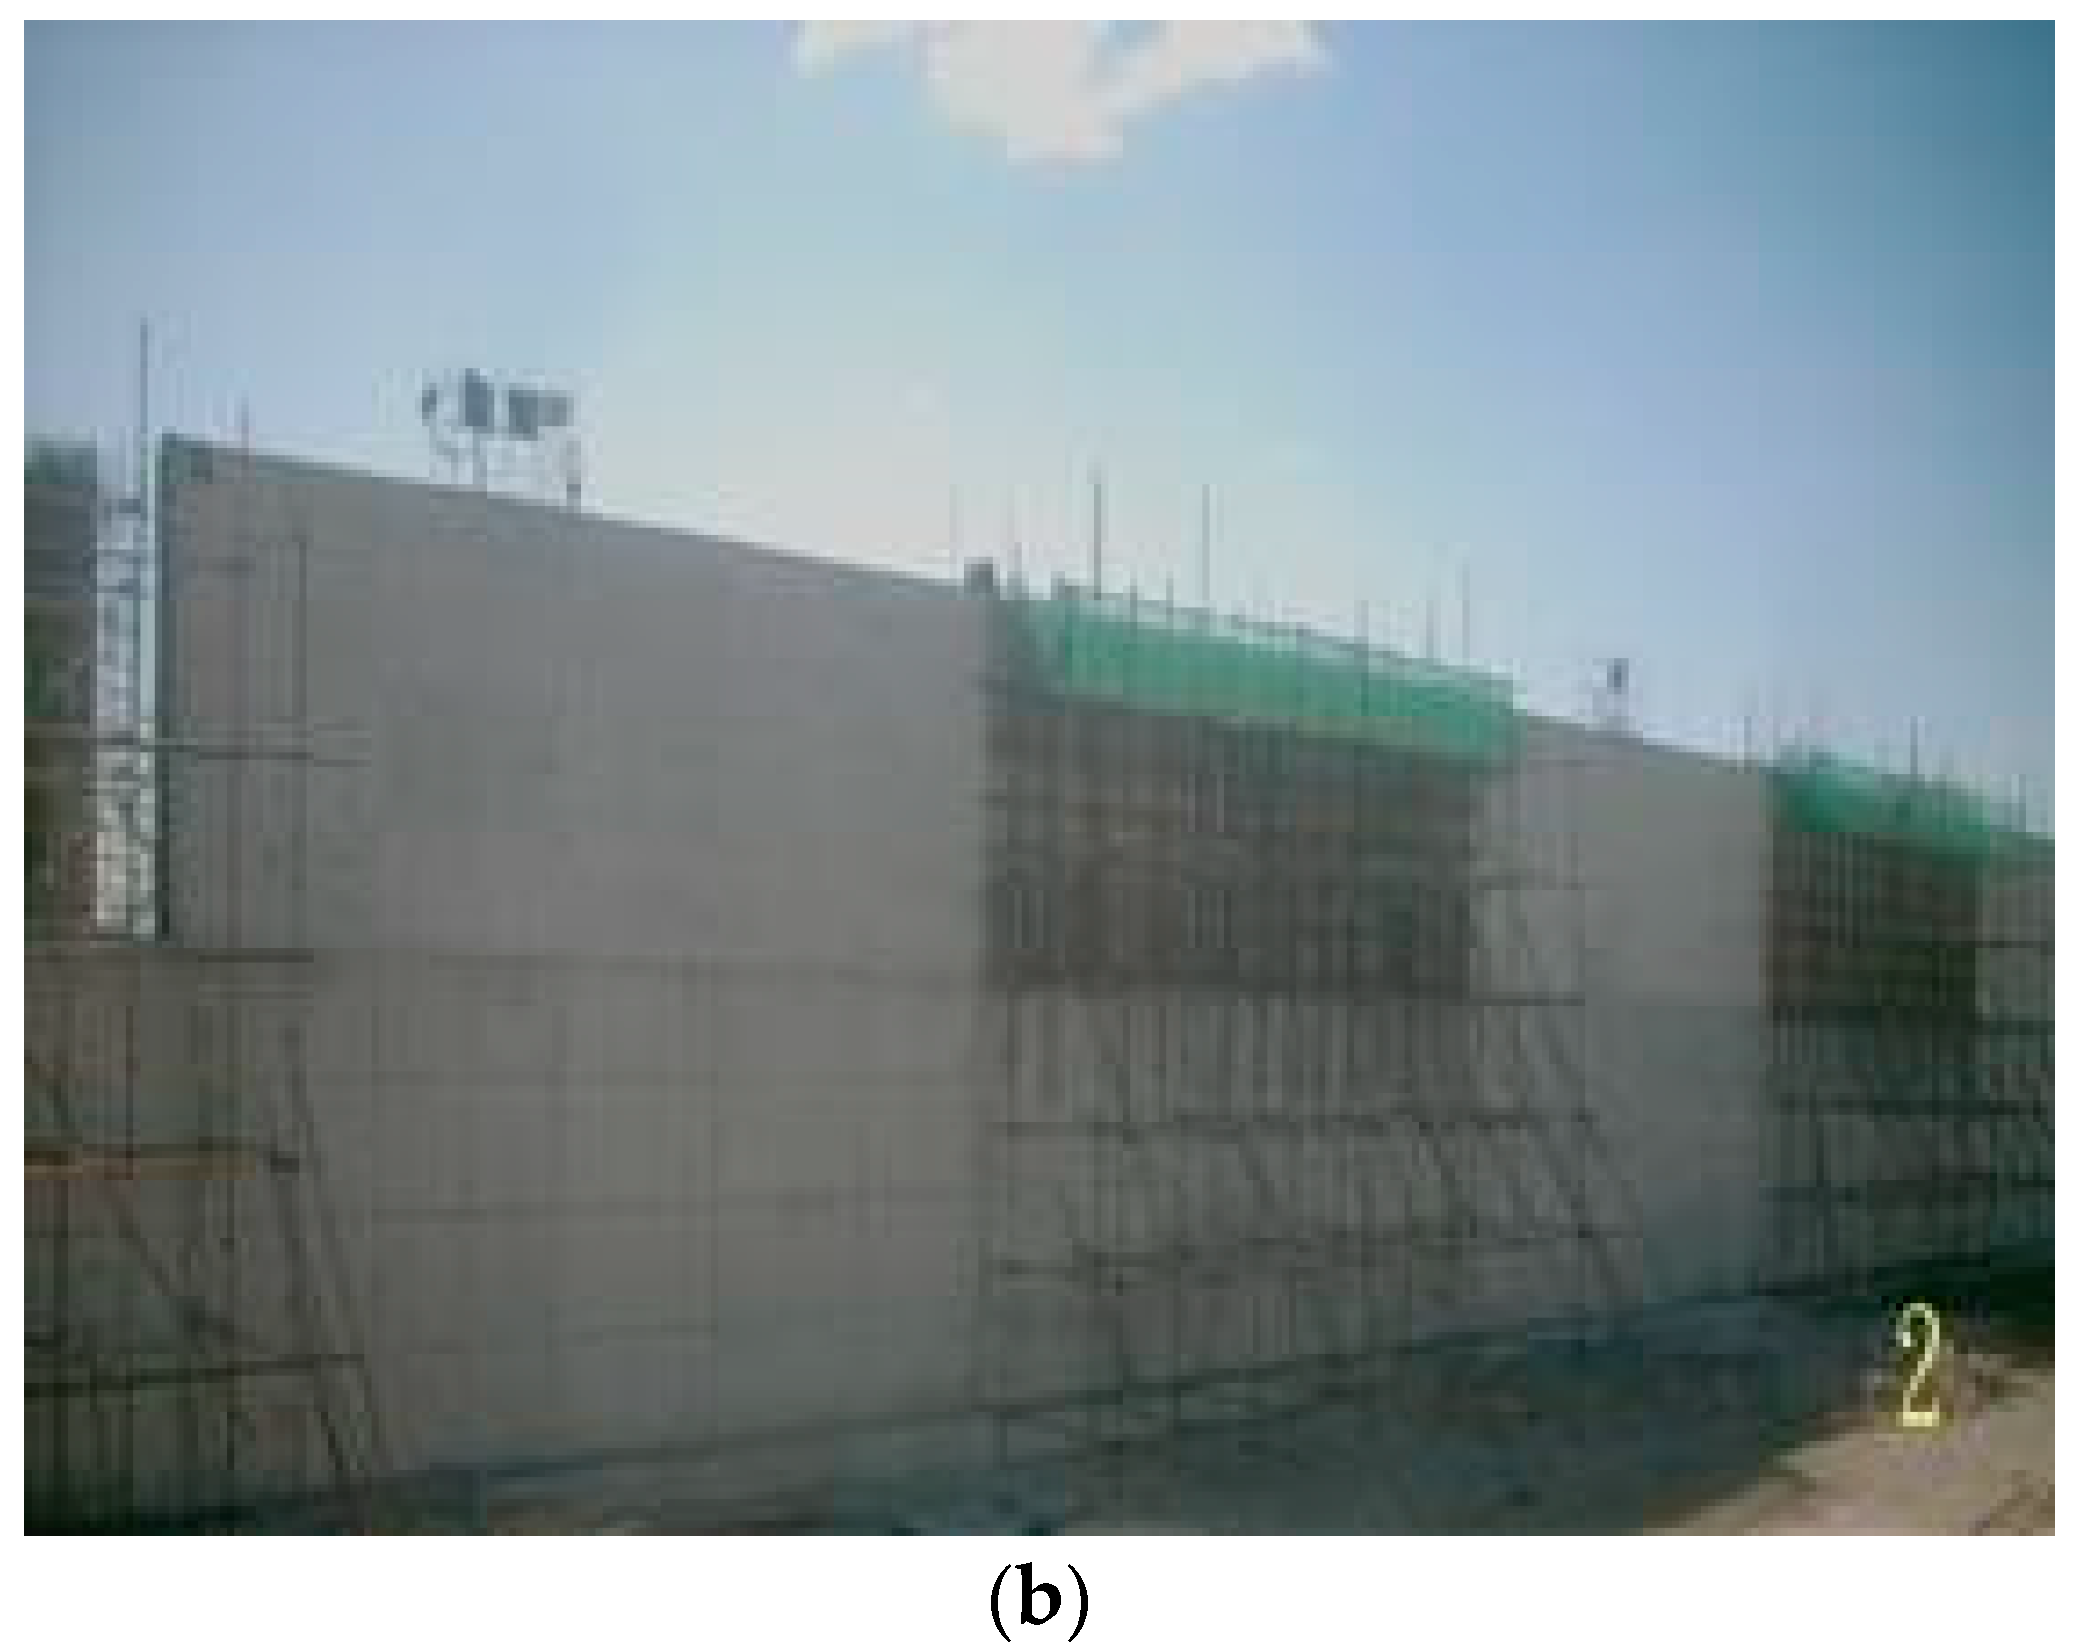
  • Construction of reinforced concrete wall: The reinforced concrete wall is located on the surface, and the concrete label is C15. According to the design size of the wall, the wall formwork is divided into grooves, the rigid cage is bound, and the concrete is poured.
(2) Subgrade construction scheme of Dujiakan toll station:
  • Subgrade backfill both sides of cut-off wall at the same time, the thickness of each layer of fill is about 0.5 m. The thickness after compaction is about 0.3 m;
  • Both sides of the subgrade and impervious wall shall be compacted. Small equipment or manual tamping is used for narrower areas. Large-scale equipment or rolling equipment is used for relatively wide areas.

3.2. Calculation Model

Since the difference in the longitudinal direction of the project is not obvious, consider each monitoring section as a plane strain problem to establish a two-dimensional calculation model. The stress-strain state of the Dujiakan reconstruction and extension section of the Beijing-Shibai Expressway and the related reservoir cut-off wall is simulated in detail. The 3D model mainly shows the overall deformation of the project, considering the joints and conduction between reinforced concrete walls. The impact of the size effect of walls and other structures reflects the interaction and differential deformation between wall structures. The fifth section (1 section) and the seventh section wall (2 section) were selected as the research objects in the analysis.

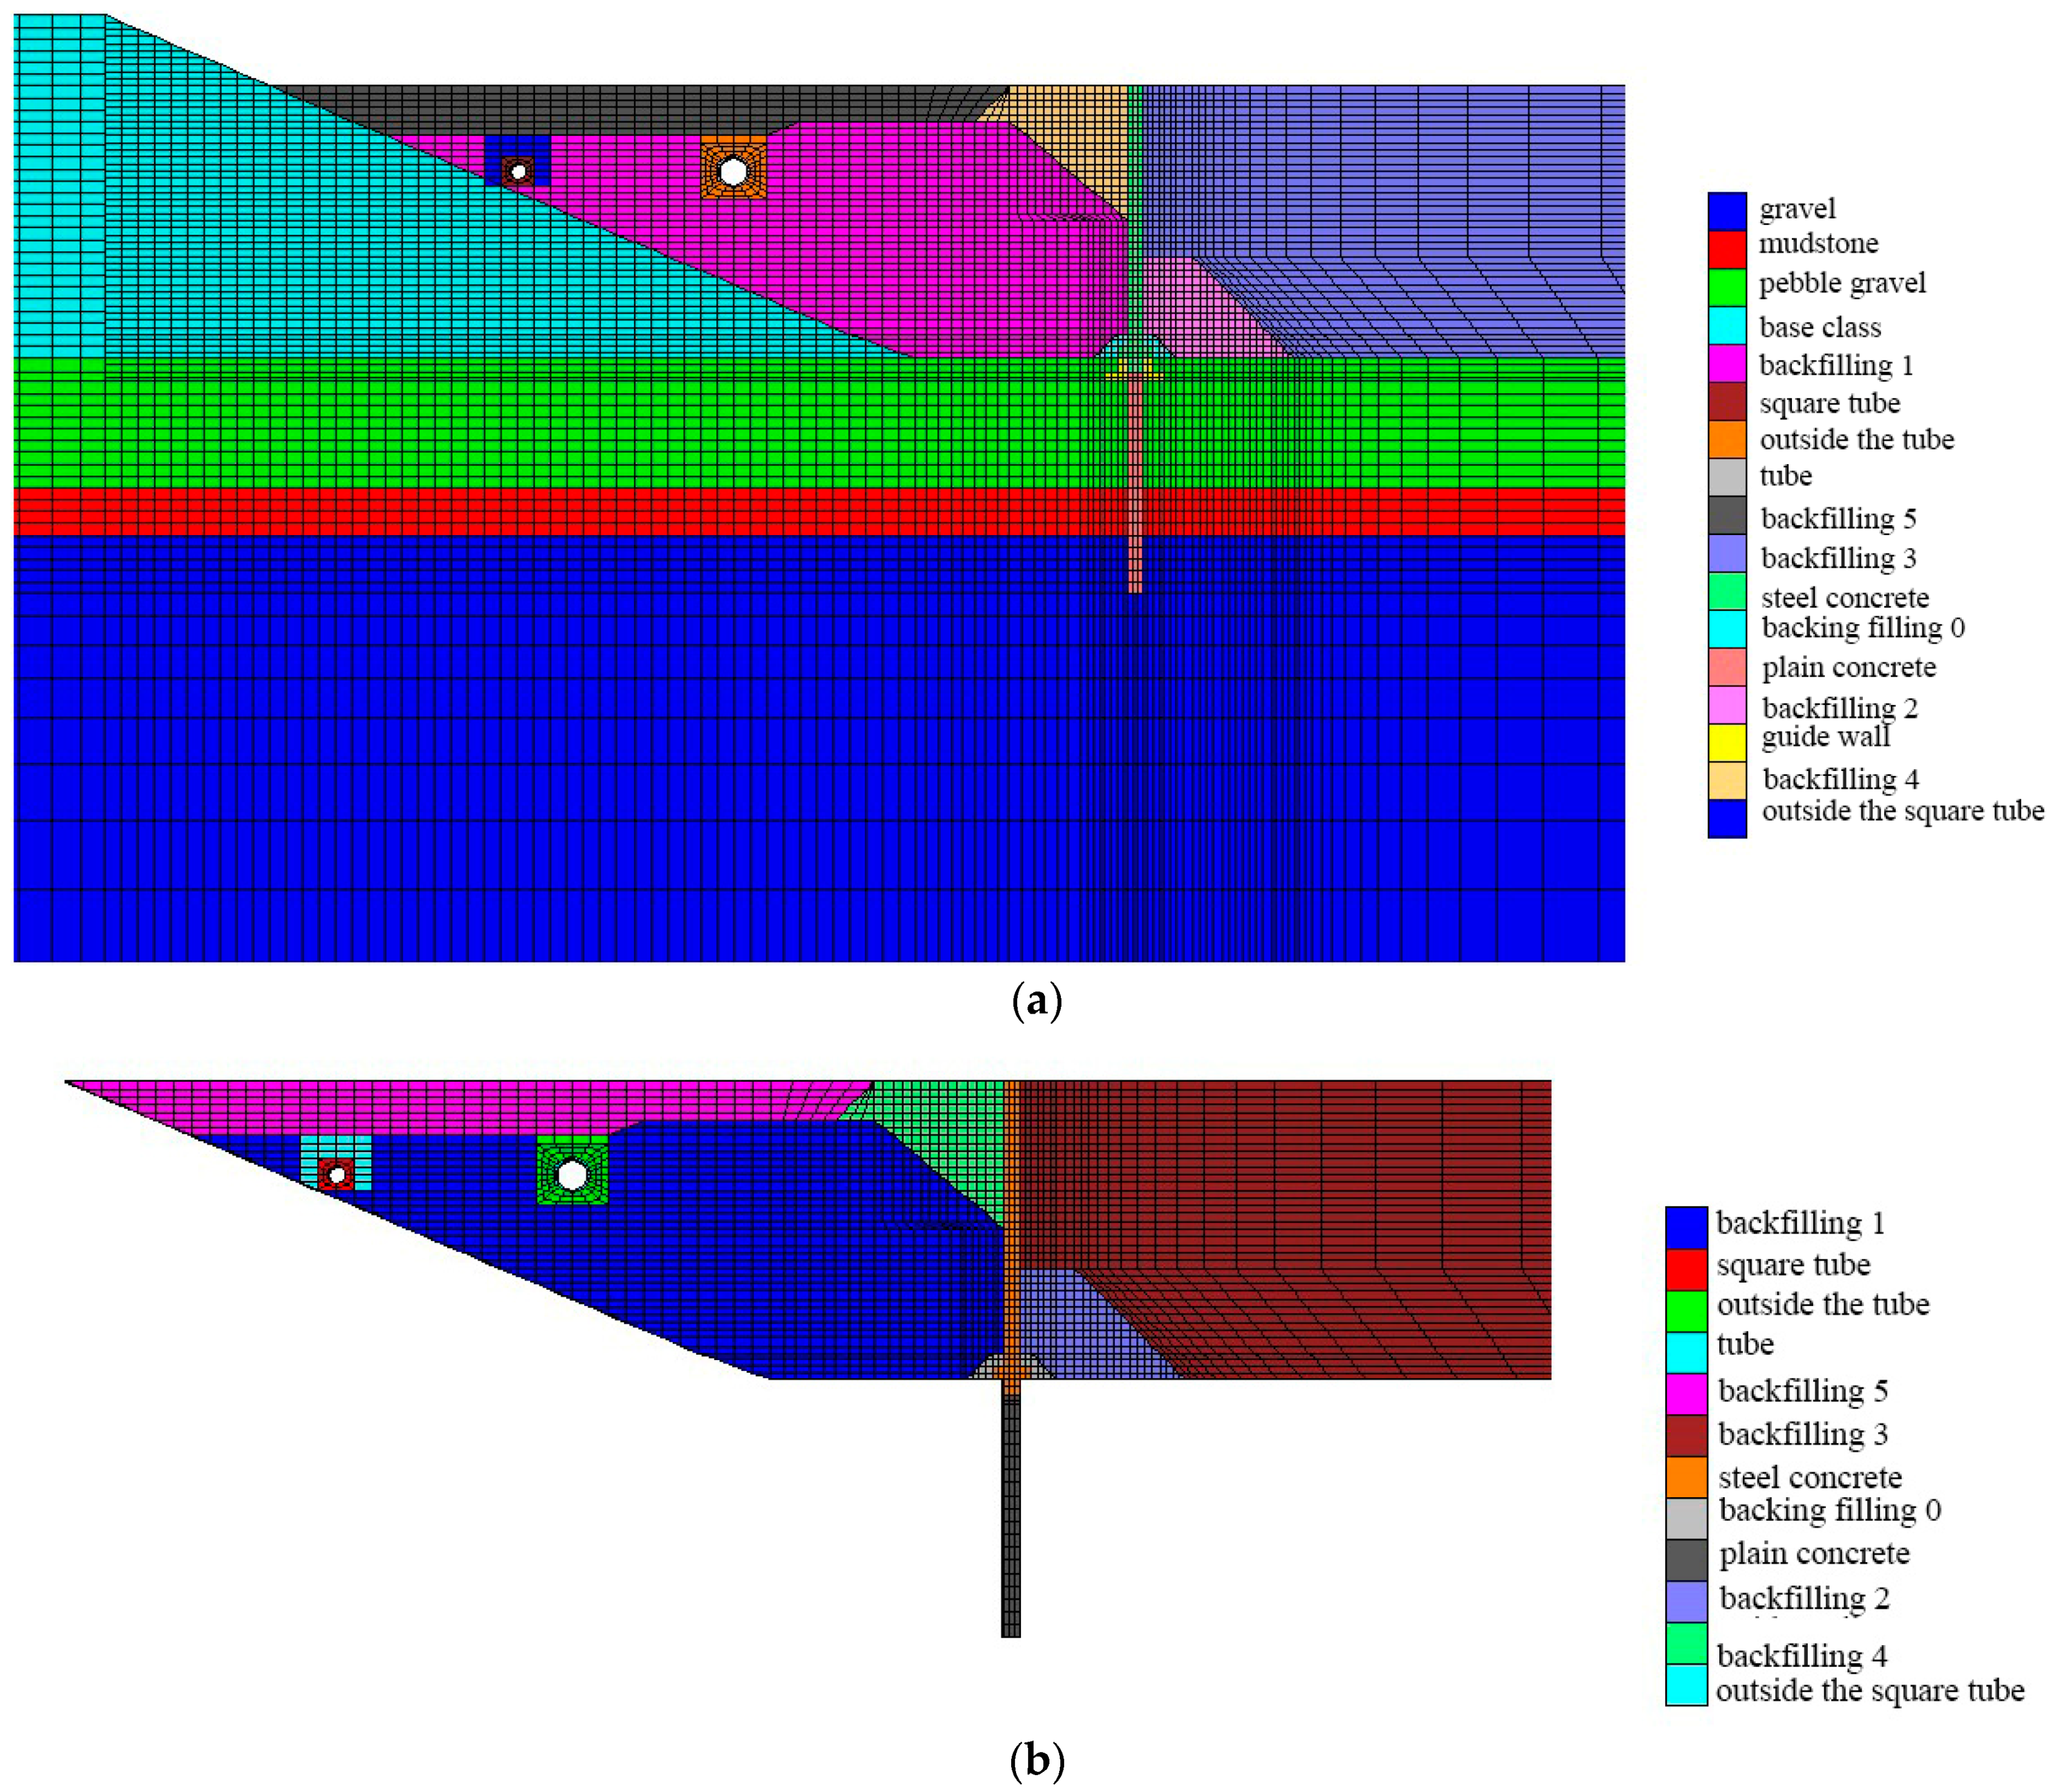
3.2.1. Monitor the Geometric Dimensions of Section Models 1 and 2

The monitoring sections 1 and 2 were located at the fifth trusses and seventh trusses of the wall, respectively. The same calculation model was used for the analysis because of the same geometrical size, backfilling process, and material parameters. The reinforced concrete wall top elevation is 59 m, with a height of 10 m. The plastic concrete wall has a depth of 11.5 m.
The horizontal distance between the slope line of the original Jingshi subgrade and the wall is 11 m, and the model is 116 m long, 2 m wide, and 49.5 m high. The construction sequence consists of pouring reinforced concrete → backfilling 0 → backfilling 1 and backfilling 2 at the same time → excavating and laying the main rainwater pipe → backfilling 3 → backfilling 4, the geometric models of sections 1 and 2 are shown in Figure 4a. Monitoring1, 2 cross-section model grid division, the positional relationship between backfill soil, and cut-off wall are shown in Figure 4b to monitor the relationship between backfill soil and the cut-off wall in sections 1 and 2.

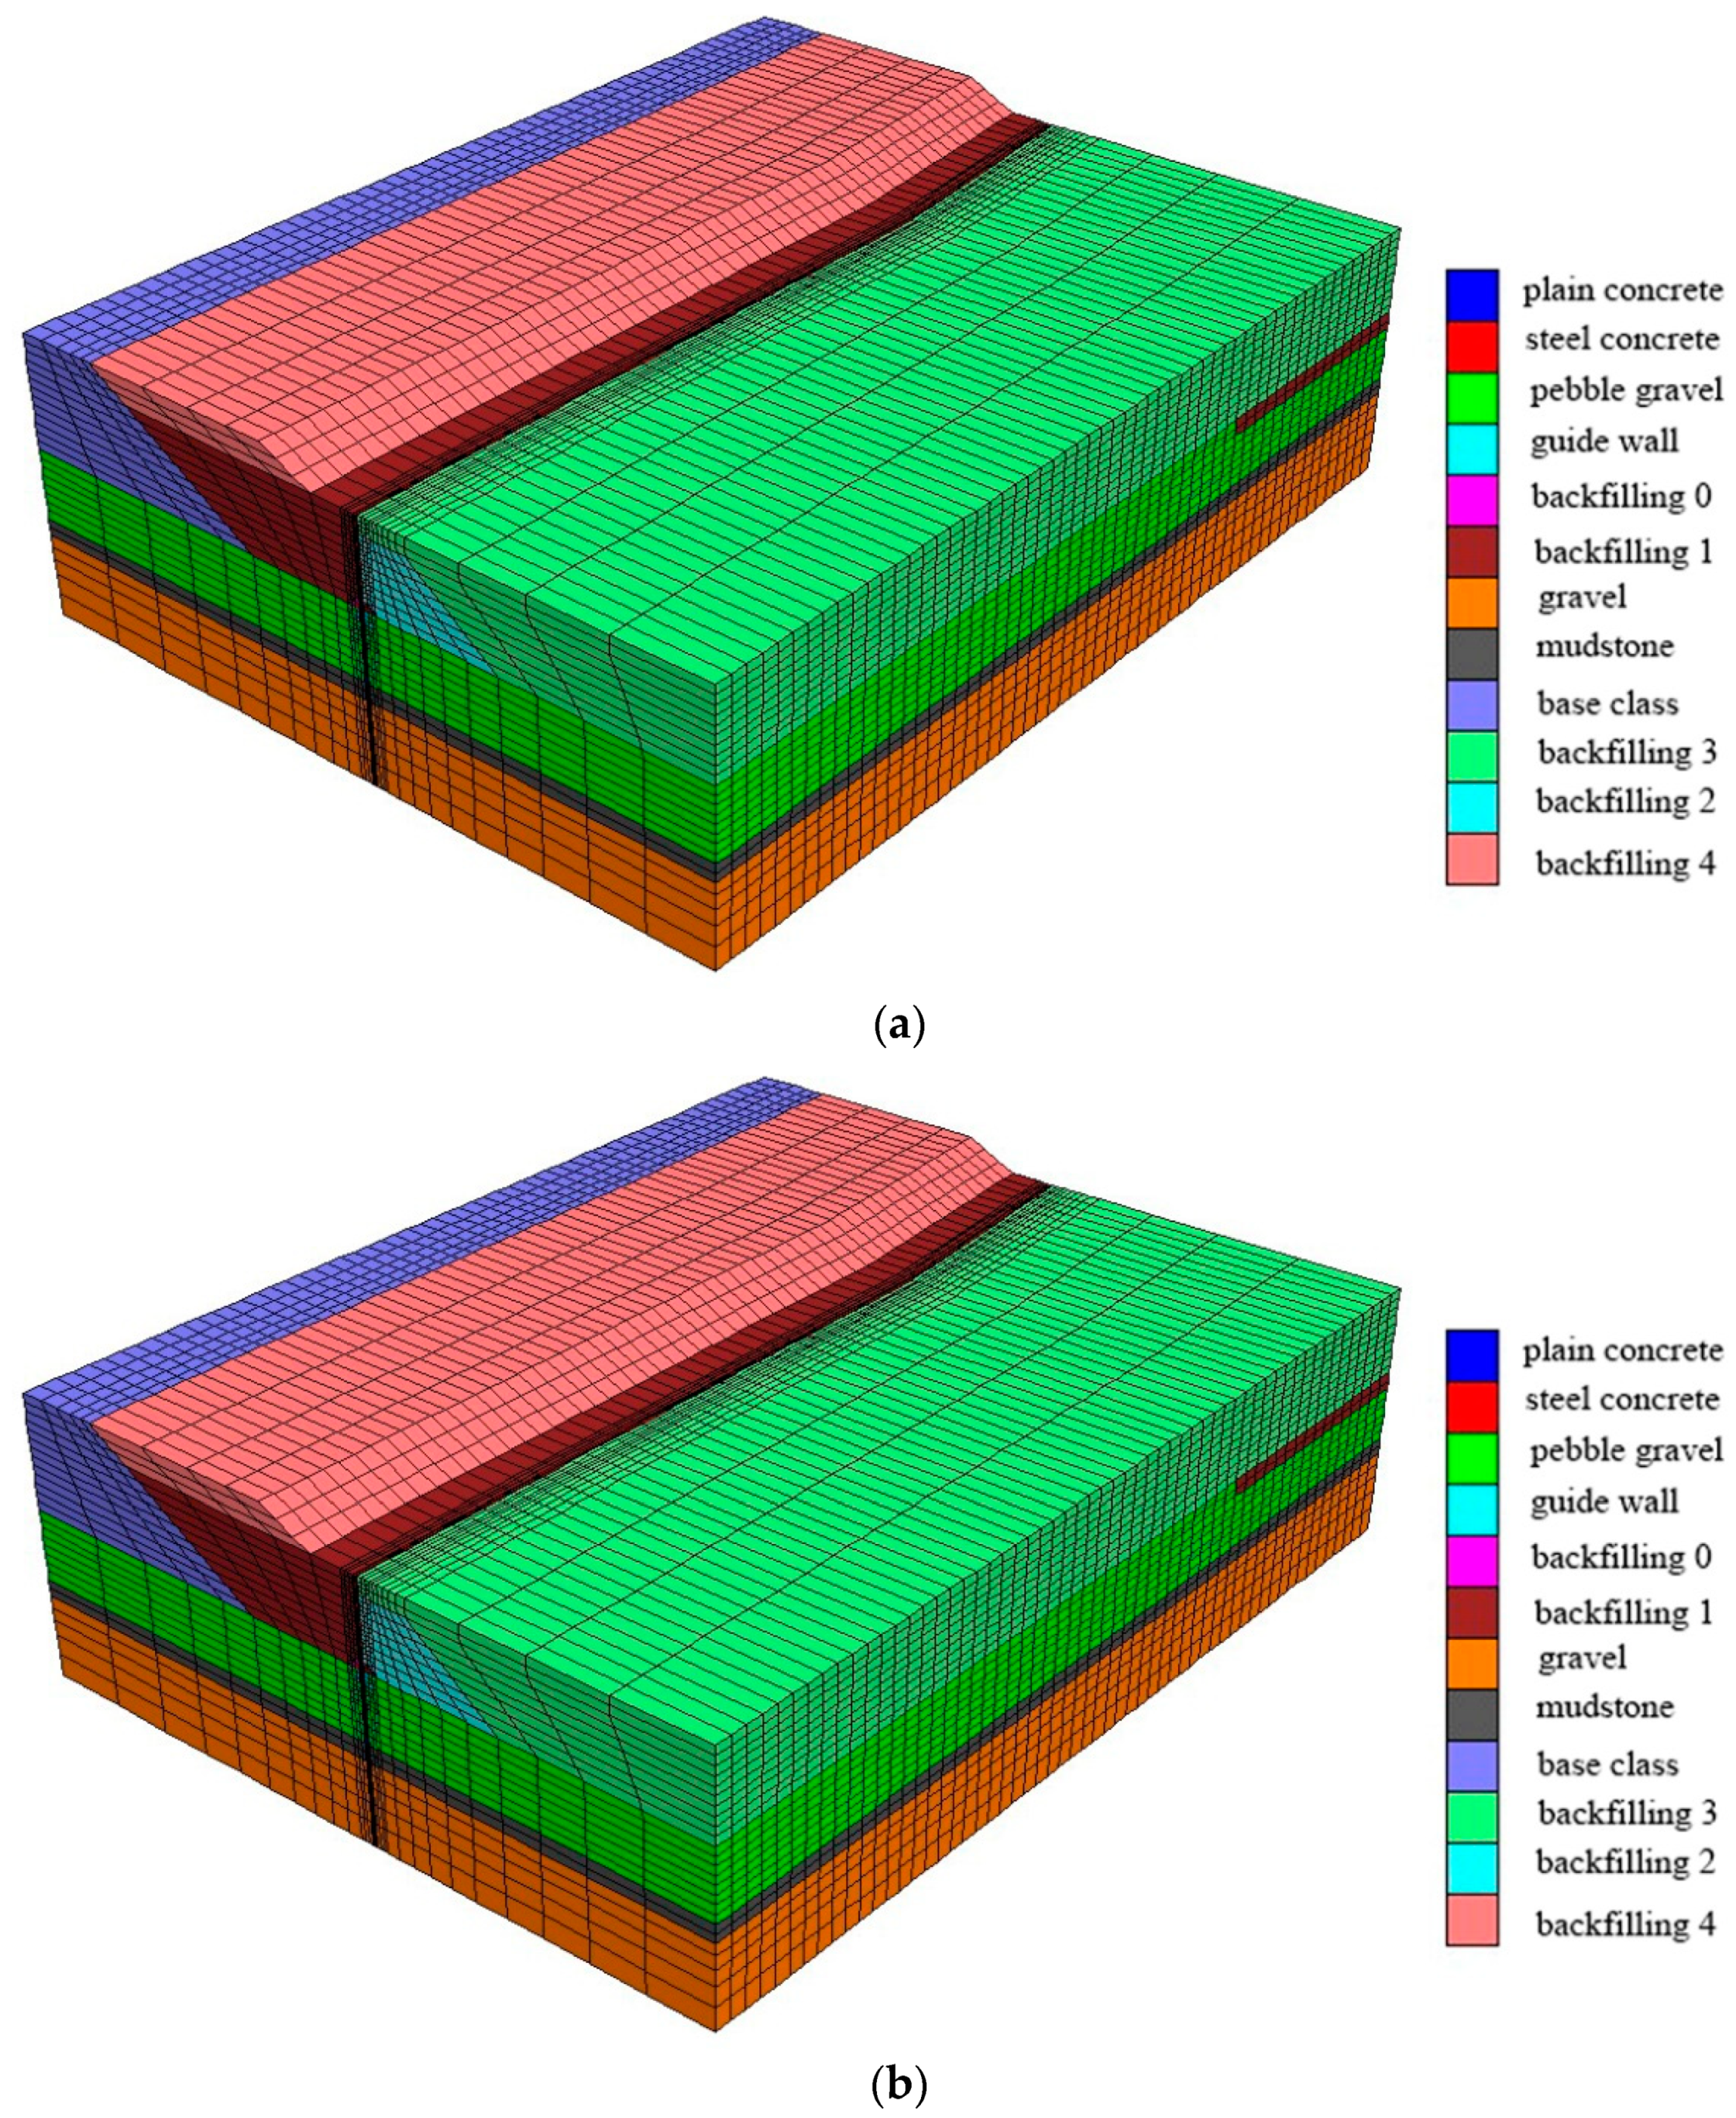
3.2.2. Geometric Dimensions of 3D Cut-Off Wall Model

The 3D model contains all the walls of the research object, from north to south. They are the 1st to 10th wall. The model is 88.1 m long, 114 m wide, and 32 m high. The angle between the 3rd and 4th wall intersections is 174°. The elevation of the top of the reinforced concrete wall is 59 m. Walls 1–3 are 12 m high and walls 4–10 are 10 m high. The elevation of the bottom line of the plastic concrete wall is 37.5 m, of which the height of the 1st–3rd walls is 9.5 m. The height of the tree is 11.5 m. The construction sequence is initial ground stress balance → construction of plastic concrete walls → construction of reinforced concrete walls → backfilling 0→backfilling 1 and backfilling 2 simultaneously → backfilling 3→backfilling 4, as shown in Figure 5a using the grid division of the 3D model. Figure 5b shows the overall grid division of the cut-off wall in the model.
The main construction of this project consists of the filling and rolling process of the embankment of the Jingshi Expressway. Considering the change of the backfilling soil’s physical parameters during the rolling process, the deformation characteristic parameters (bulk modulus, shear modulus) are simulated by the Duncan–Zhang Et-Kt model. As the rolling progresses, the bulk modulus and soil weight gradually increase, so the backfilled soil will have a large displacement at the initial stage of rolling, which is consistent with the actual rolling process.
Displacement constraints are used on each side of the two-dimensional model to limit the boundary horizontal displacement: the bottom surface is a fixed boundary to limit displacement; the top surface and slope are free boundaries; the contact surface element is added between the reinforced concrete wall and the soil.
The backfill soil shall be backfilled sequentially according to the actual construction conditions, and the backfill thickness of each small step shall be 0.3 m, considering the rainwater pipeline construction process during the backfill period. The four sides of the 3D model adopt displacement constraints to fix their horizontal displacement: the bottom surface boundary is fixed to limit the displacement in three directions; the top surface is a private boundary. Compared with the two-dimensional model, the construction process of the backfill is simplified, the thickness of each layer of backfill is 1 m, and the construction impact of the rainwater pipeline is ignored.
In the simulation of the rolling process, according to the actual rolling effect, the process of soil density as it gradually increases is used for simulation. In the process of carrying out the analysis, the density of the soil material is determined according to the instant depth of the fill until it reaches the maximum value (target density) and the rolling process ends.

4. Dynamic Construction Stability Analysis of Cut-Off Wall

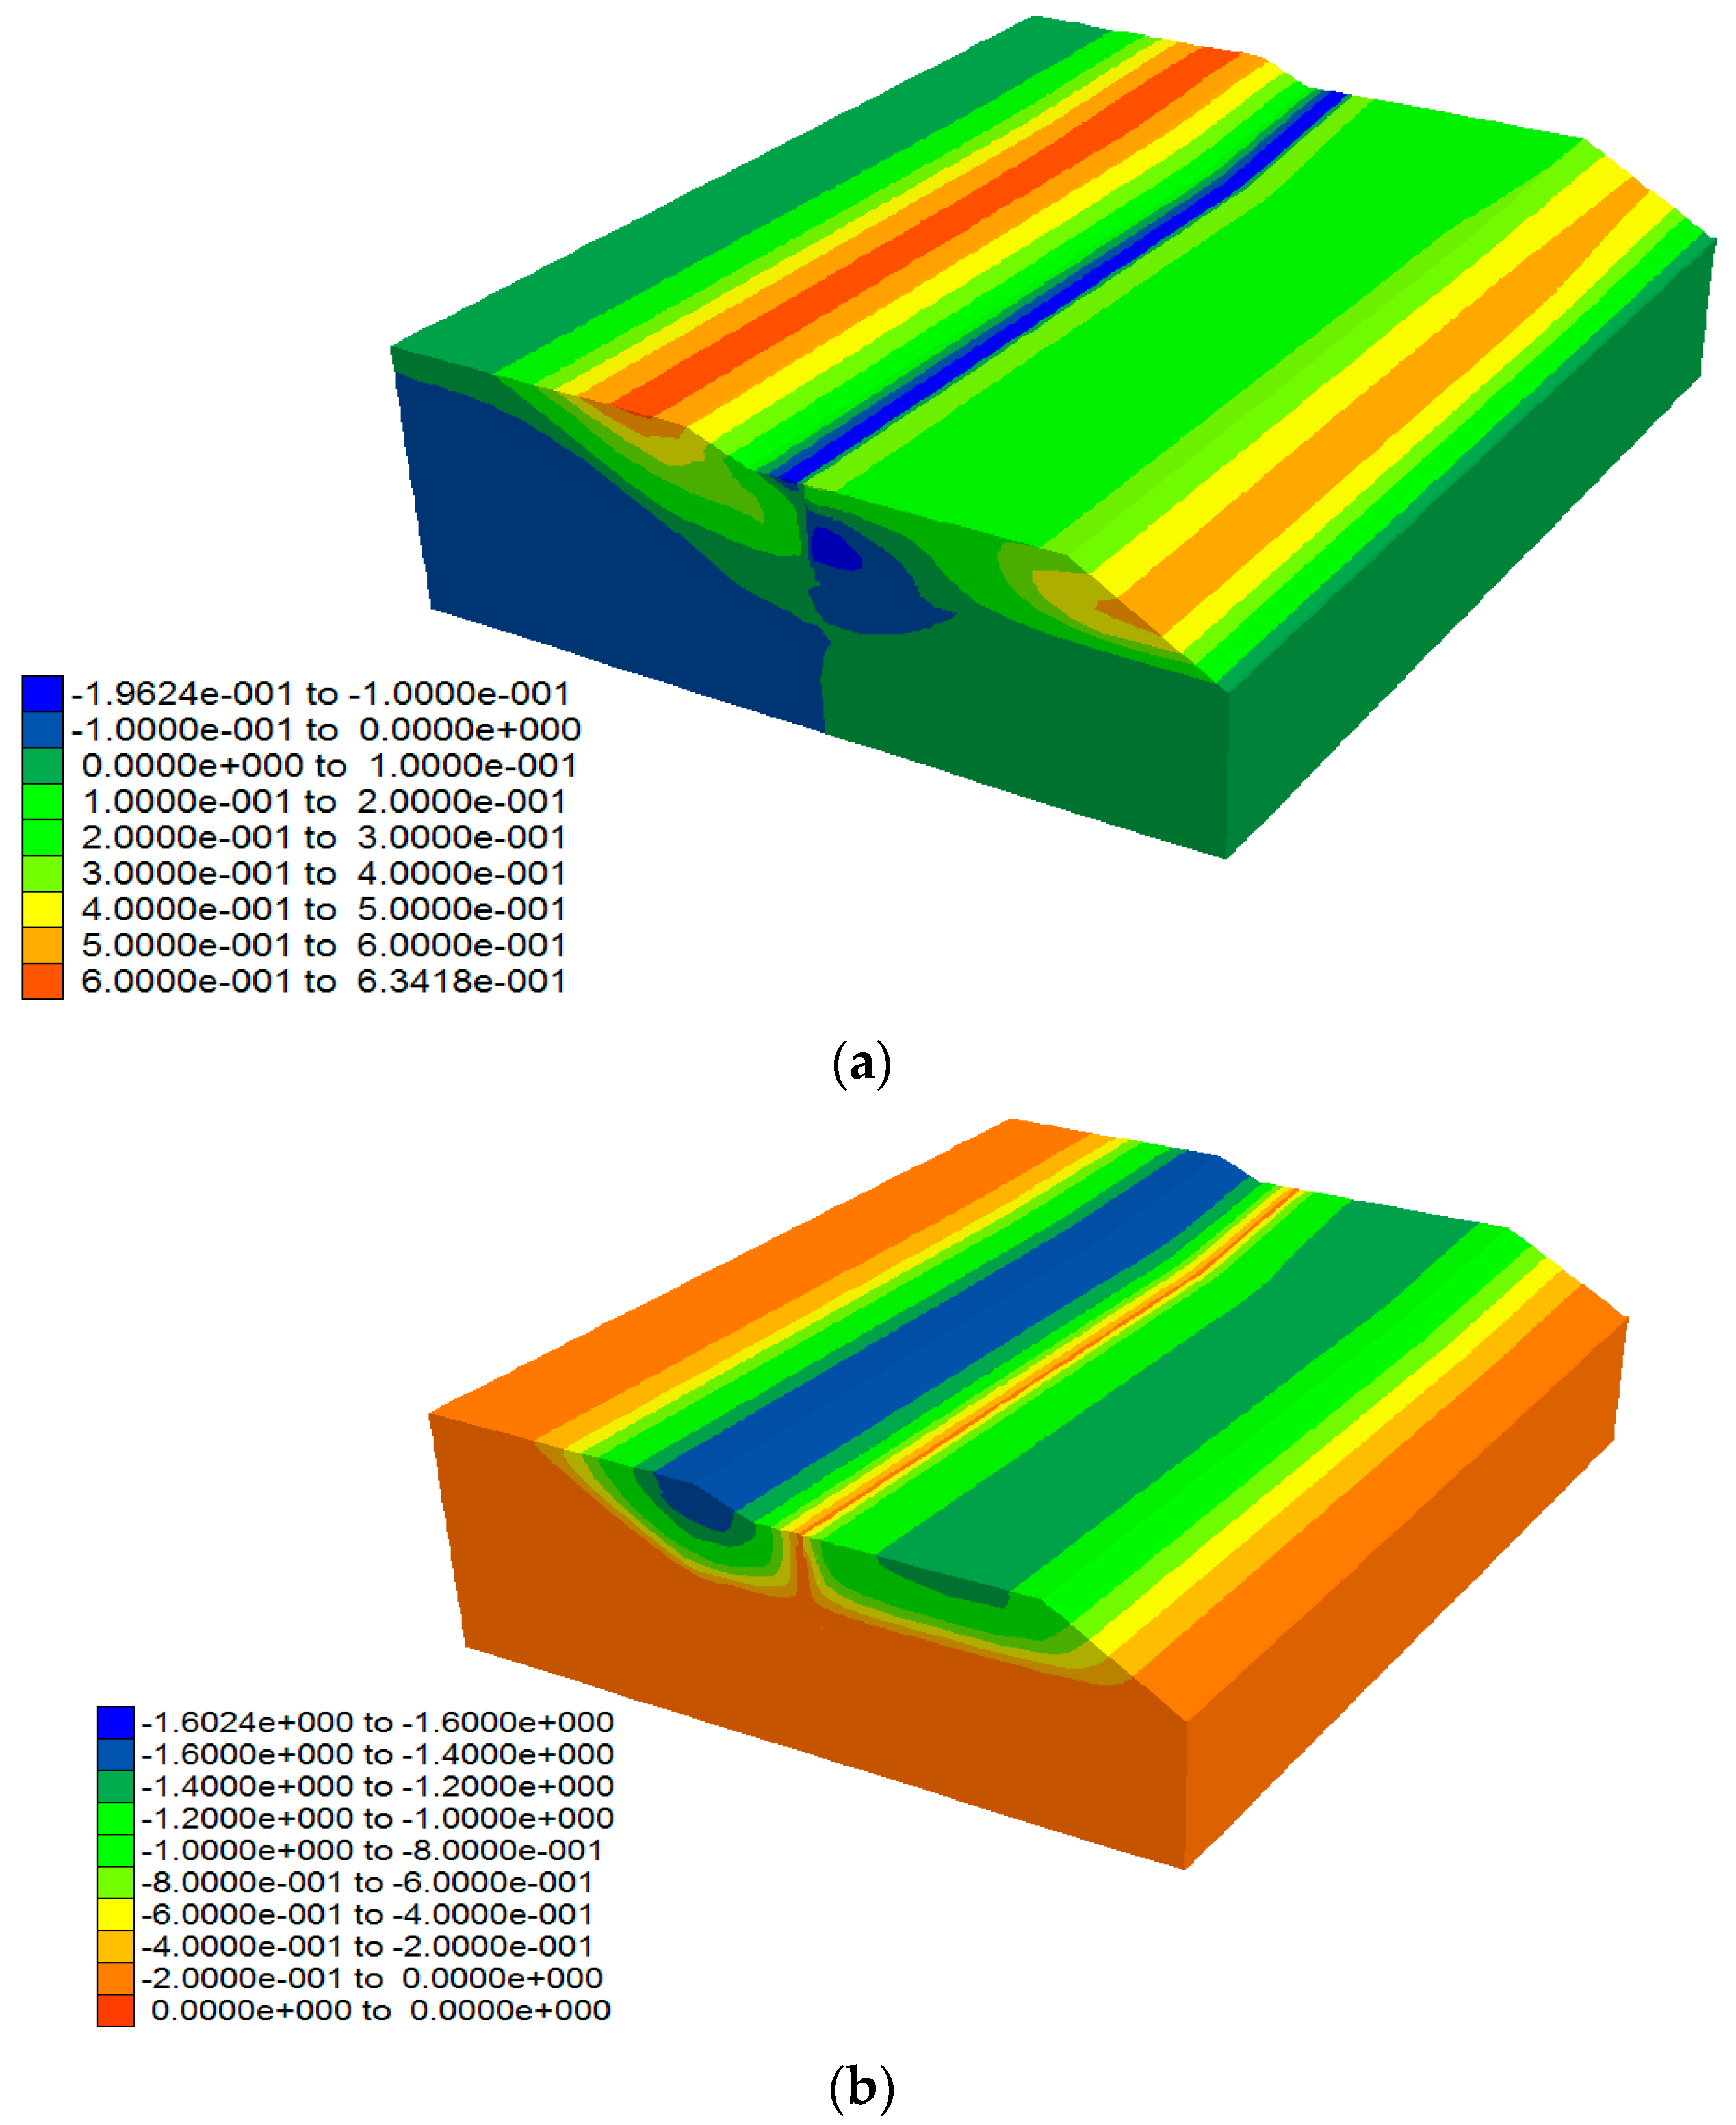
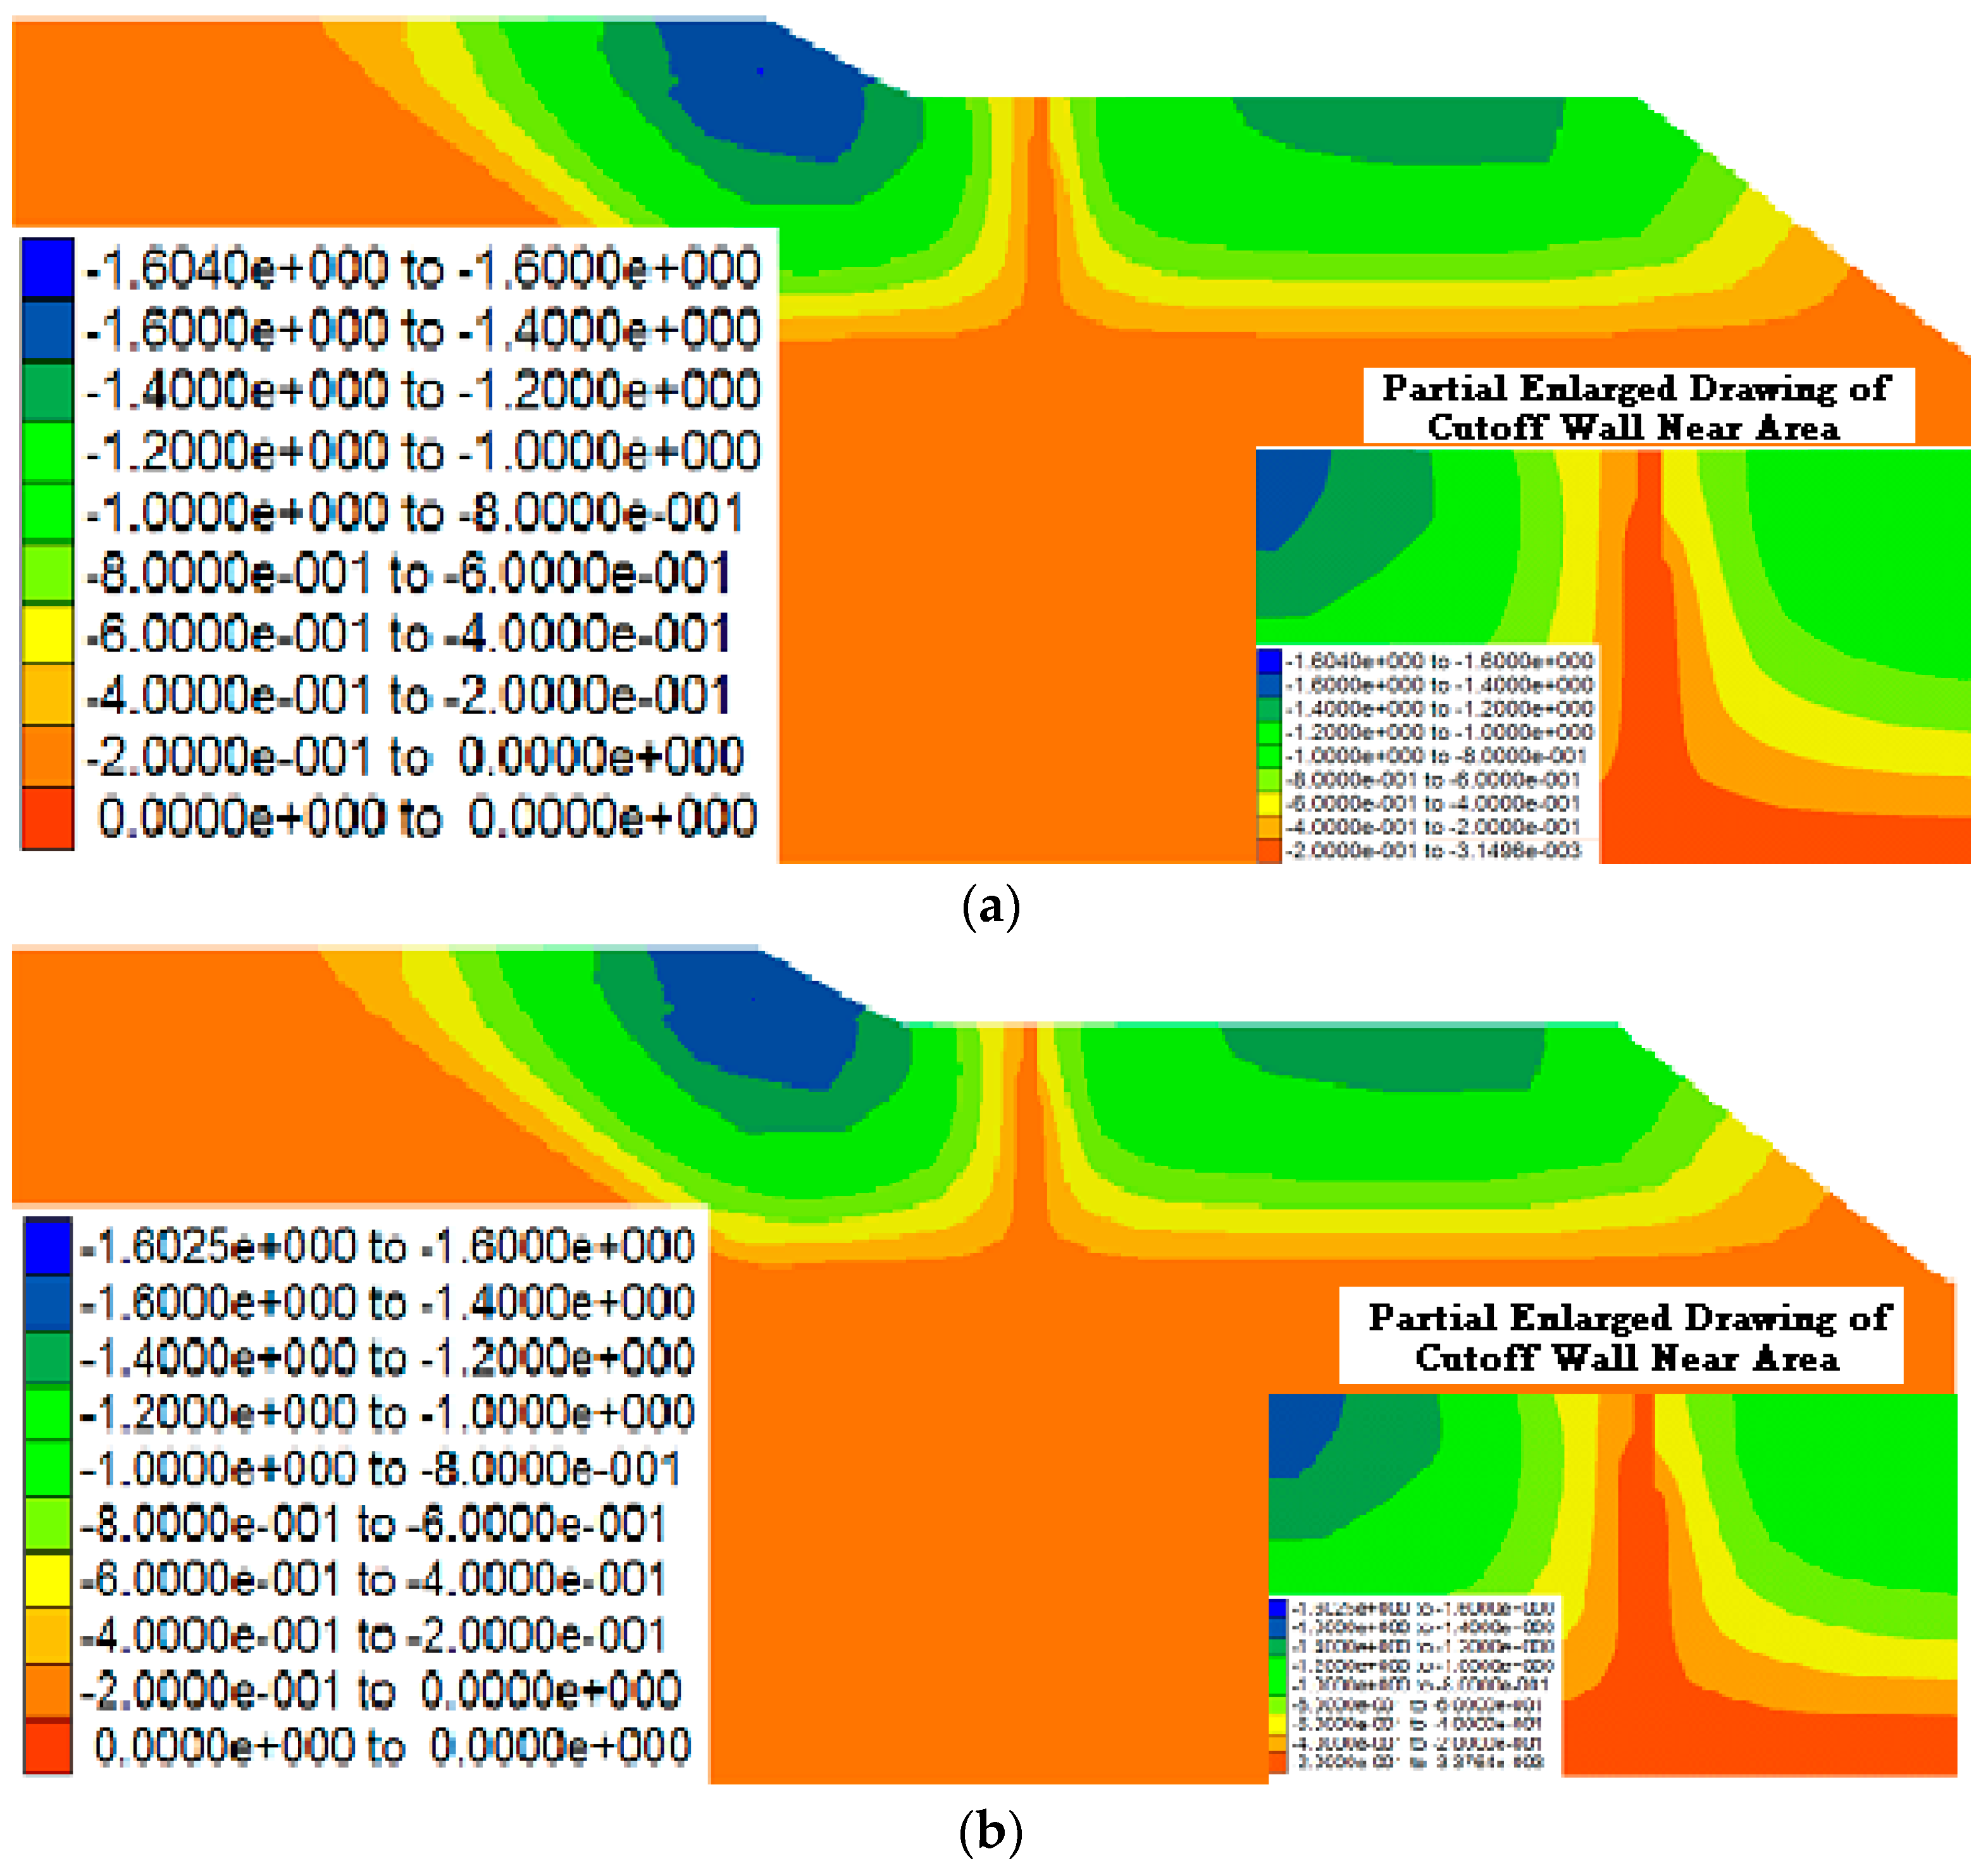
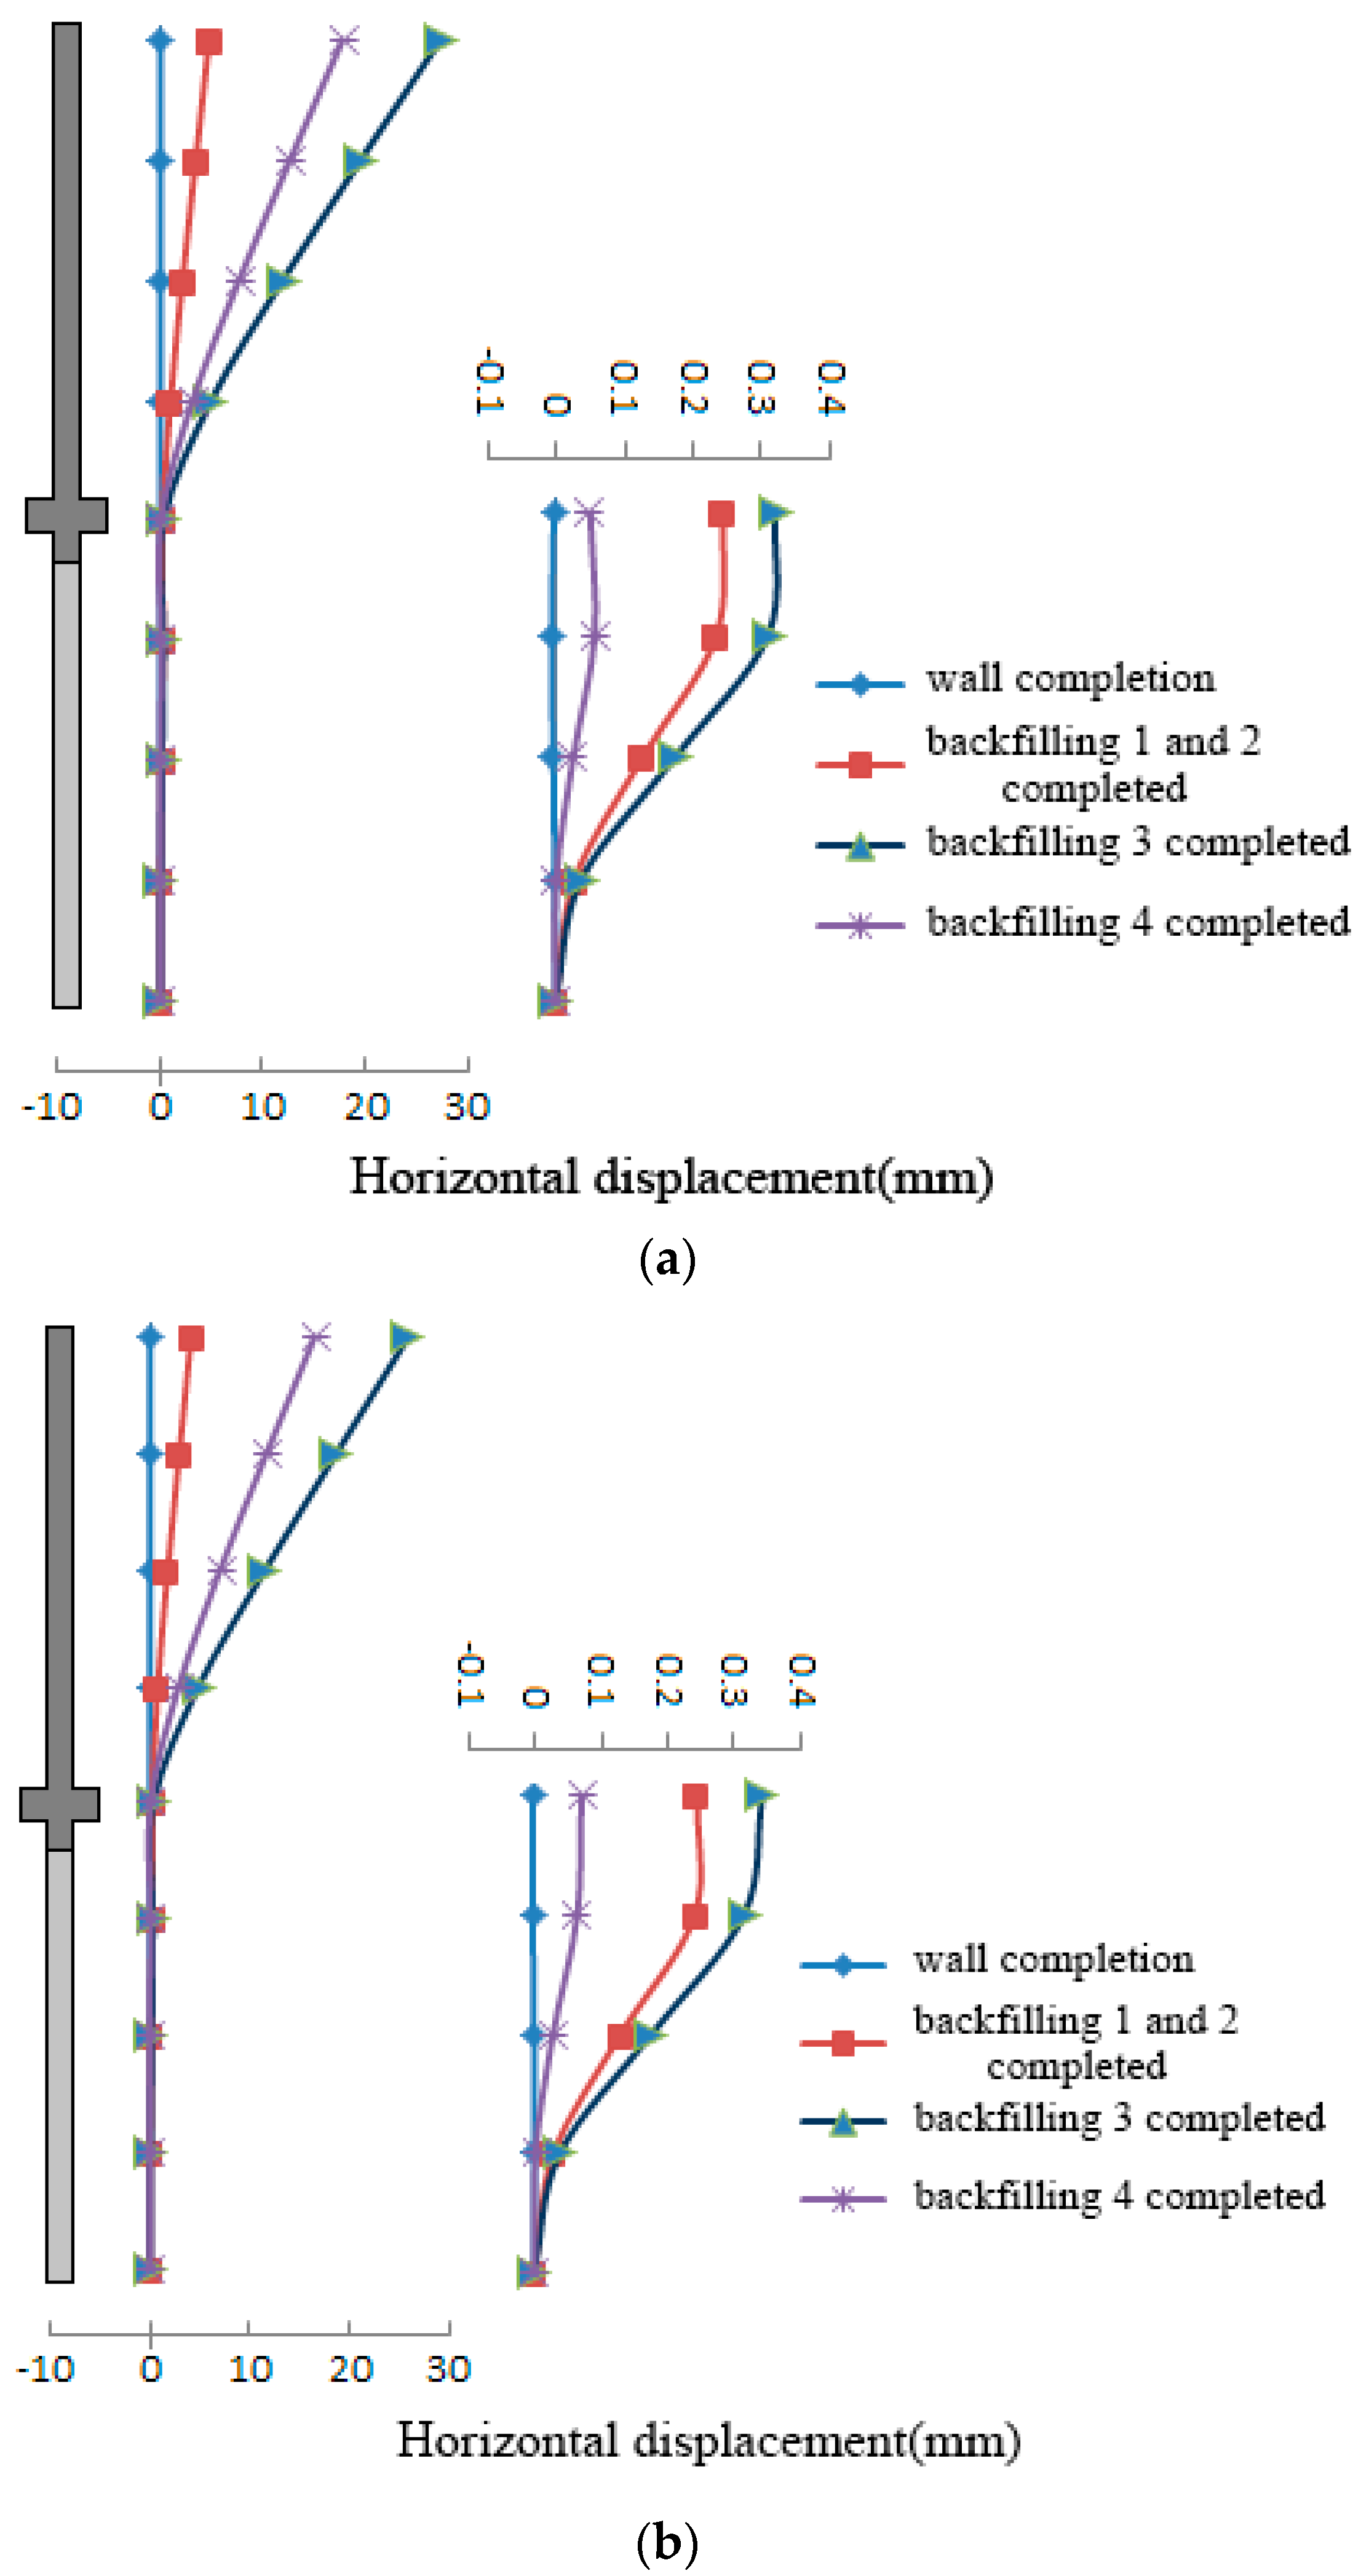
4.1. Analysis of Deformation Law

The deformation analysis includes the overall deformation and the cut-off wall deformation. It mainly focuses on the study of the deformation of the cut-off wall and the surrounding soil with the construction change. The rigid cut-off wall is taken as the initial state when it is completed, that is, the deformation of the wall and the stratum in the subsequent diagrams are all caused by the backfilling construction.
Figure 6 respectively shows the cloud diagrams of the final displacement changes in the analysis domain after the construction of the cut-off wall of the reservoir. The maximum displacement of the analysis domain occurs in the backfill area, the maximum horizontal displacement is 634.171 mm, the maximum vertical displacement is 1602.385 mm, and the maximum displacement is 1675.820 mm.
Figure 7, Figure 8 and Figure 9 show the cloud images of the deformation laws of the two monitoring sections and the cut-off walls at the monitoring sections and the comparison of the deformation laws of the two monitoring sections.
It can be seen from the cloud image analysis of the deformation comparison of the 2 monitoring surface shown in Figure 8 and Figure 9 that the deformation trends during construction are basically consistent. From the analysis of the overall displacement nephogram, it can be concluded that the maximum displacement in the horizontal direction occurs on the upper part of the backfill soil outside the wall, and the maximum vertical displacement occurs at the filling soil on the road. The combined displacement is mainly affected by the vertical displacement. Influenced by displacement, the maximum value also appears at the position where the roadside fill is close to the cut-off wall (Table 1).
Figure 10 shows the overall deformation contours of cut-off walls during construction. From the analysis of the overall deformation, it can be seen that horizontal deformation of the plastic cut-off wall is much smaller than that of the rigid cut-off wall, with a maximum difference of more than two orders of magnitude. The vertical displacement takes place from top to bottom. Gradually decreasing, the settlement at the top is about twice as much as that at the bottom.
The deformation trend of the wall can be divided into three stages as the construction steps proceed. The first stage: Fill on both sides of the wall, but the width of the fill on the outside of the reservoir is large. Then the wall is subject to the lateral constraint of the original reservoir embankment and the whole wall is inclined to the inside of the reservoir. The second stage: There is a large amount of fill in the inner side of the reservoir. Due to the gravity effect of the unilateral soil accumulation, the overall inclination of the wall has recovered. At this stage, the wall tends to move towards the outer side of the reservoir. The third stage: The construction stage of the Beijing-Shijiazhuang Expressway subgrade. Due to the soil piling work outside the reservoir, the wall began to tilt towards the inside of the reservoir (Table 2).
From the analysis of Figure 11, it can be seen that the horizontal plane deformation trend of the three-section cut-off wall is similar. As the construction progresses, the wall tends to displace toward the side of the reservoir as a whole. The horizontal displacement decreases from top to bottom, but it does not decrease nonlinearly or linearly. The horizontal deformation of the plastic concrete wall is small, as can be seen from the comparison curve analysis of its change in value given in Figure 11. The horizontal deformation law of the plastic wall of section 1 and section 2 is similar, with the maximum horizontal displacement occurring at the top. Figure 11 shows that the horizontal deformation of the cut-off wall is greatly affected by the construction, that is, the backfilling and rolling process of the surrounding soil. For example, whether it is a plastic cut-off wall or a rigid cut-off wall, after the completion of backfill 4, a large amount of rebound occurred.
Figure 12 shows that as the construction progresses, the vertical displacement gradually increases from the lower of the wall upwards, and the vertical deformation of the upper rigid cut-off wall is slightly larger than that of the lower plastic cut-off wall. The maximum vertical deformation of the cut-off walls on the three monitoring surfaces is around 6 mm.
Figure 13 shows the displacement distribution pattern at the joints of cut-off walls. For the cut-off walls in the study section, the structural dimensions and backfilling methods of the first to third walls are the same. The fourth to tenth walls are also similar to each other. It can be seen from the displacement cloud map that the horizontal displacement of the first three walls is relatively large, so there is a displacement discontinuity at the joint between the third and fourth walls. The difference gradually decreases from the top to the bottom of the wall. The bottom gradually decreases and is almost zero at the root of the wall, and the displacement difference at the top is about 1.314 mm.
According to the structure of the wall joints (Figure 14), a certain friction force needs to be overcome when the walls are displaced, and then the wall displacement has a certain joint effect. There is also discontinuity of displacement between the five sections (monitoring 1 section wall), which is mainly because the length of the 4th section wall is only 10 m, which is shorter than other walls. The large deformation of the third section is caused by the connection. The friction of the seam implicates the deformation of the fourth wall. In addition, the filling soil on both sides of the third wall will also have a certain degree of influence on the deformation of the fourth wall.
From the above analysis, it can be seen that, as construction progresses, the deformation state of the cut-off wall shows a relatively stable change trend, and the deformation of the reinforced concrete wall is slightly larger than that of the plastic concrete. The maximum horizontal offset of the rigid wall is 2.191 mm, while that of the plastic wall is only about 0.3 mm, which will not affect the structural stability of the wall. The simulation shows that the deformation of the cut-off wall is greatly affected by the dynamic construction on both sides. In the early stage of construction, the wall tends to shift towards the reservoir side and then reaches the maximum value of about 26 mm. Until the massive filling stage at the reservoir side takes place and due to the influence of the filling pressure at the reservoir side, the existing wall is offset slightly. The final offset of the rigid cut-off wall at the end of the project remained at about 21 mm. The maximum vertical deformation of the cut-off wall is about 6 mm.

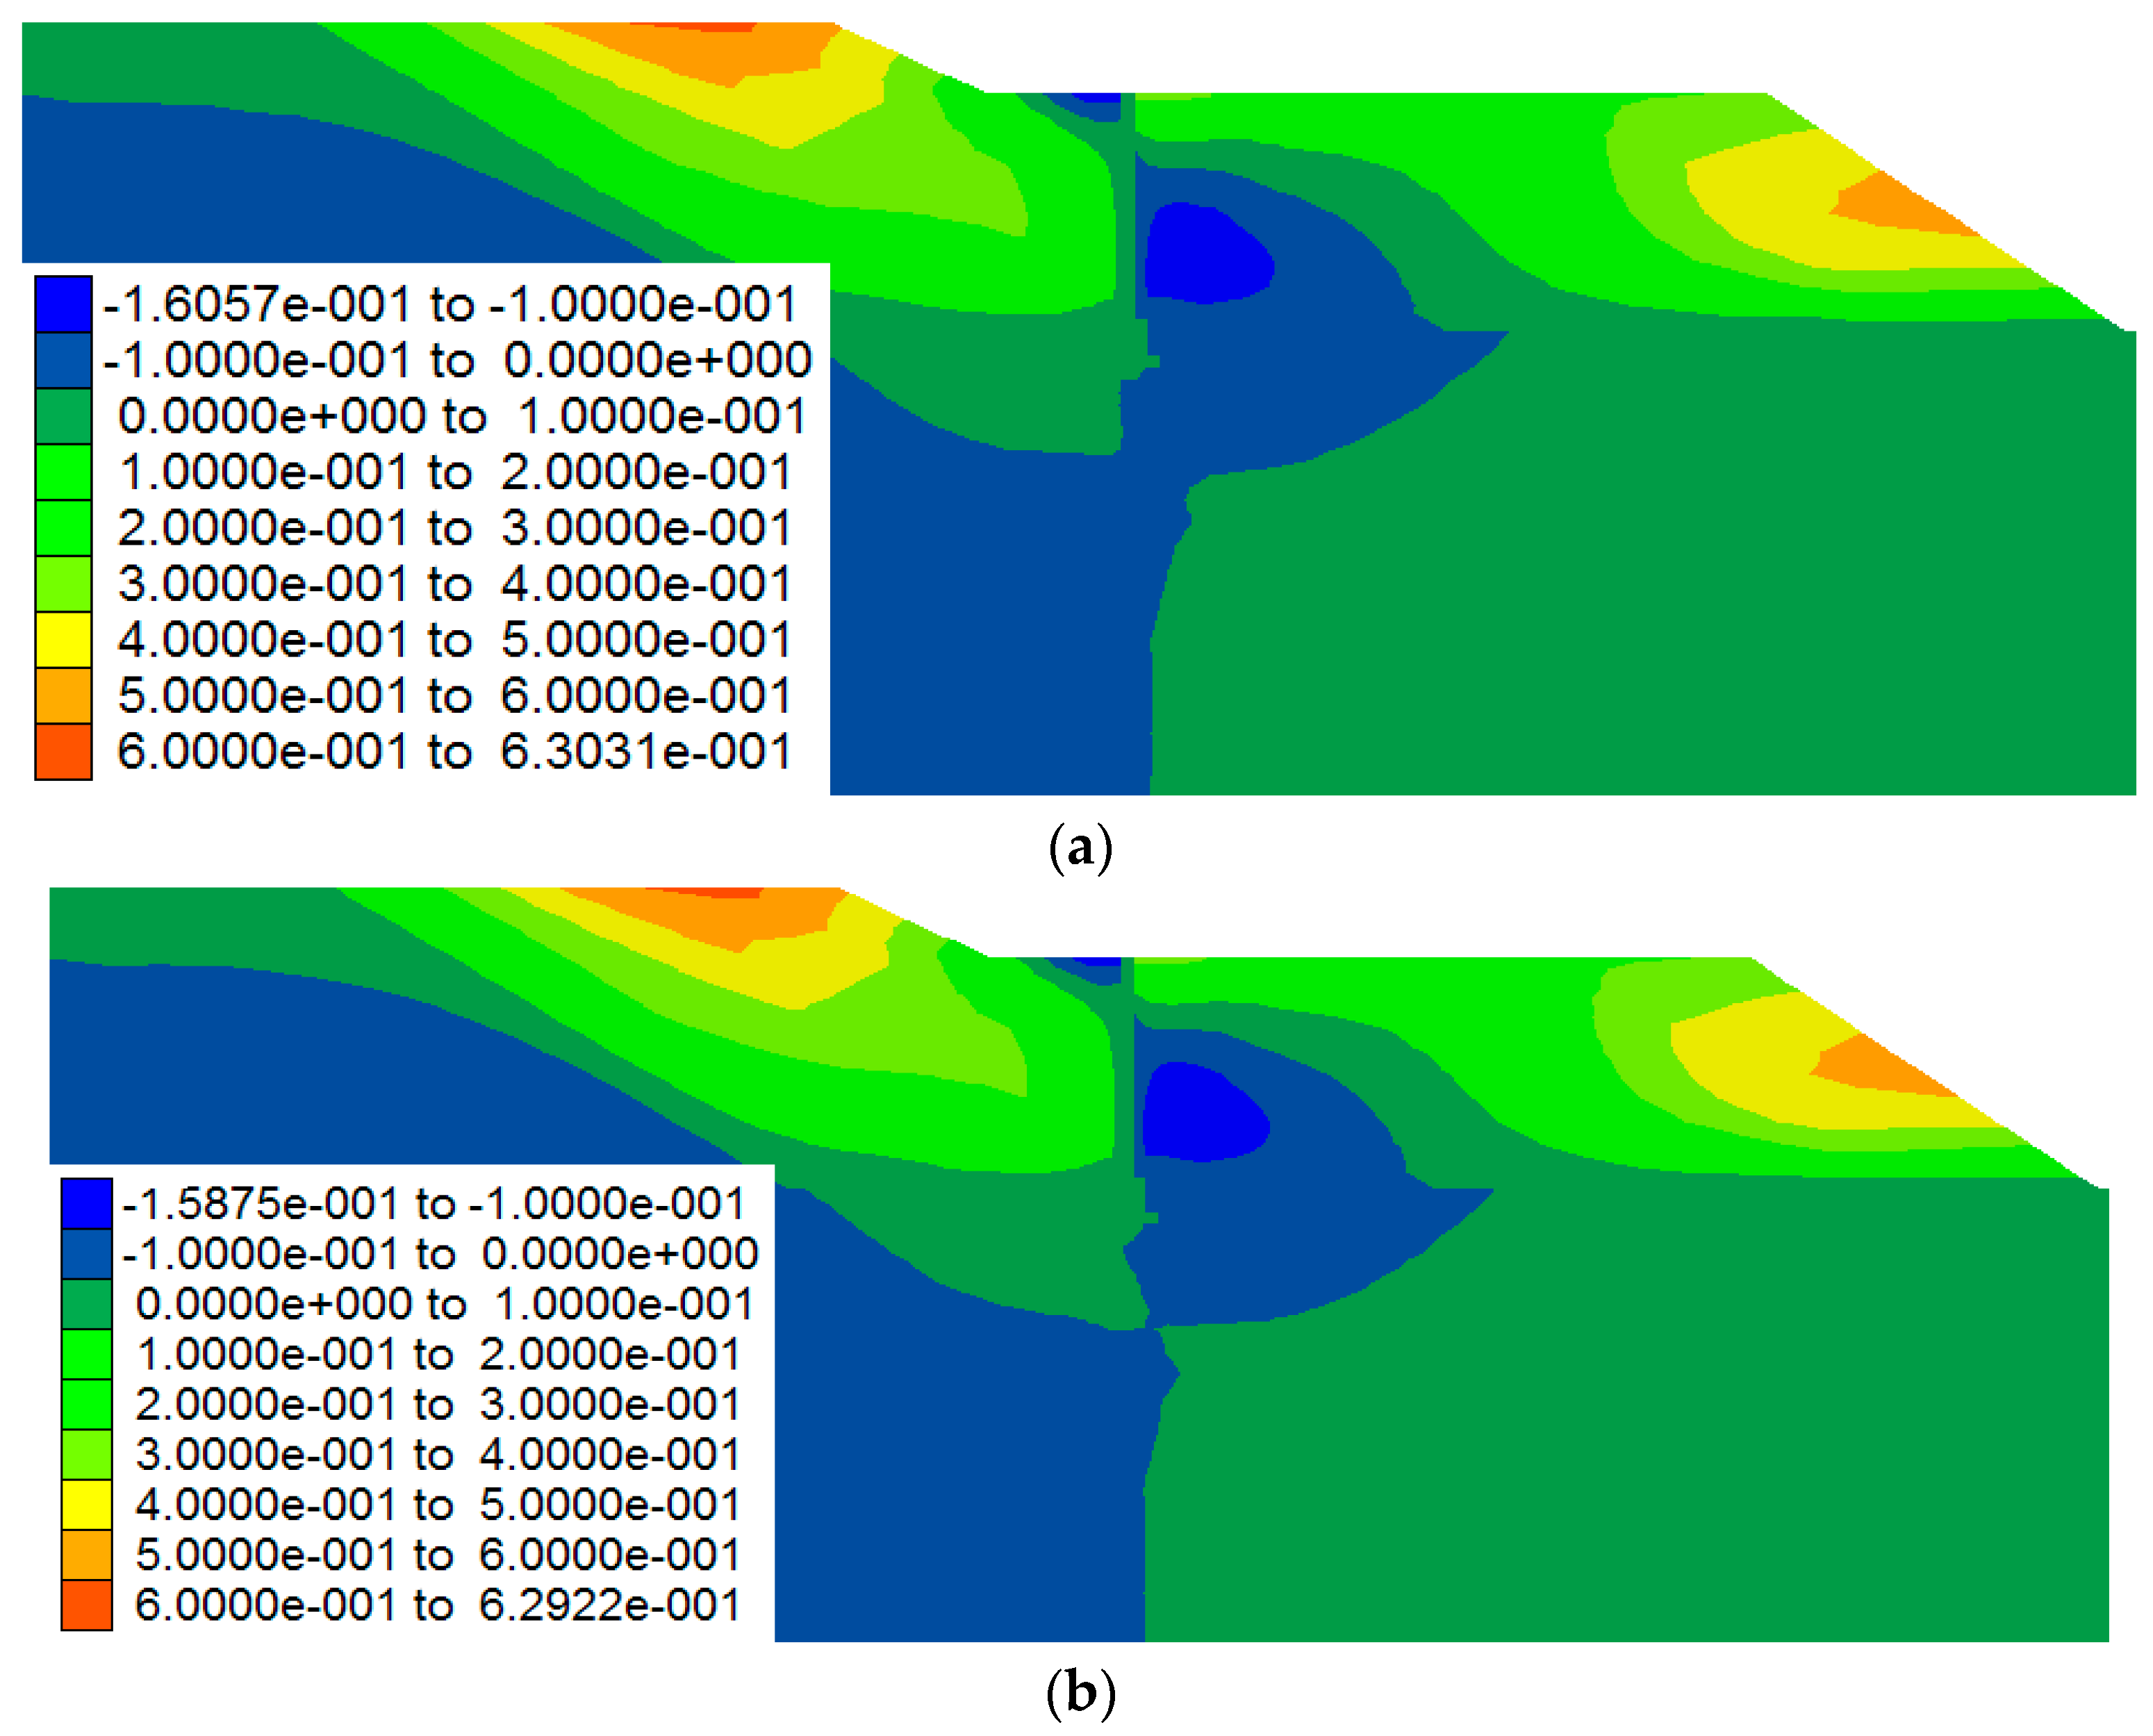
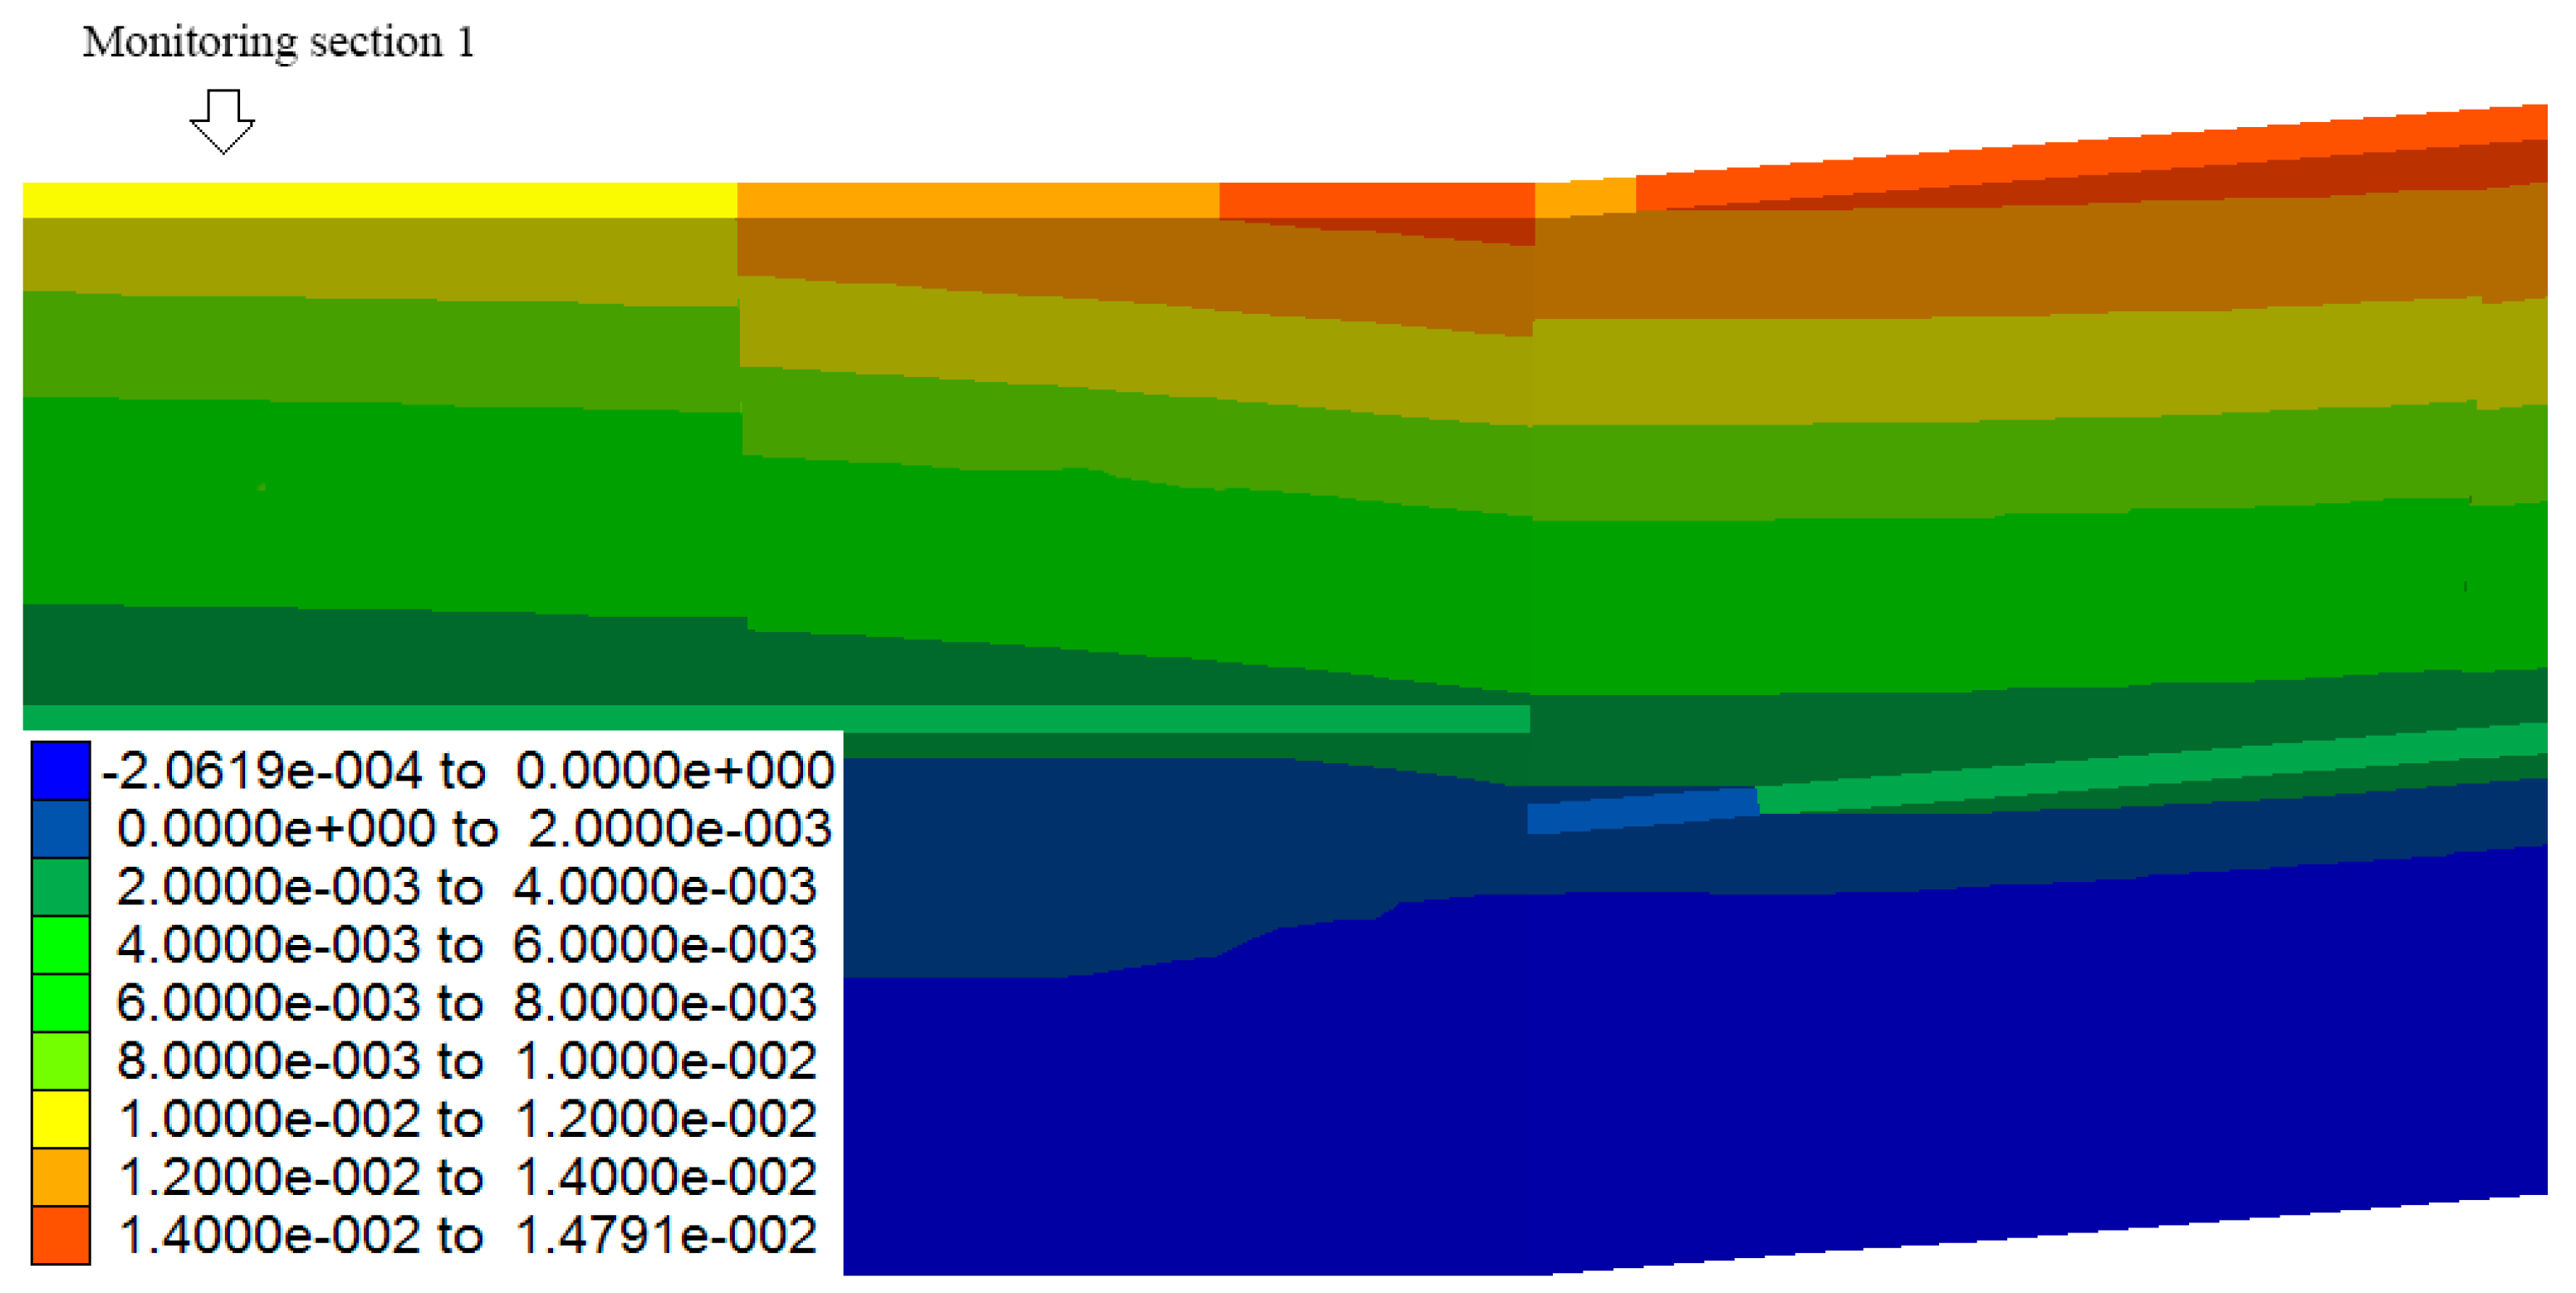
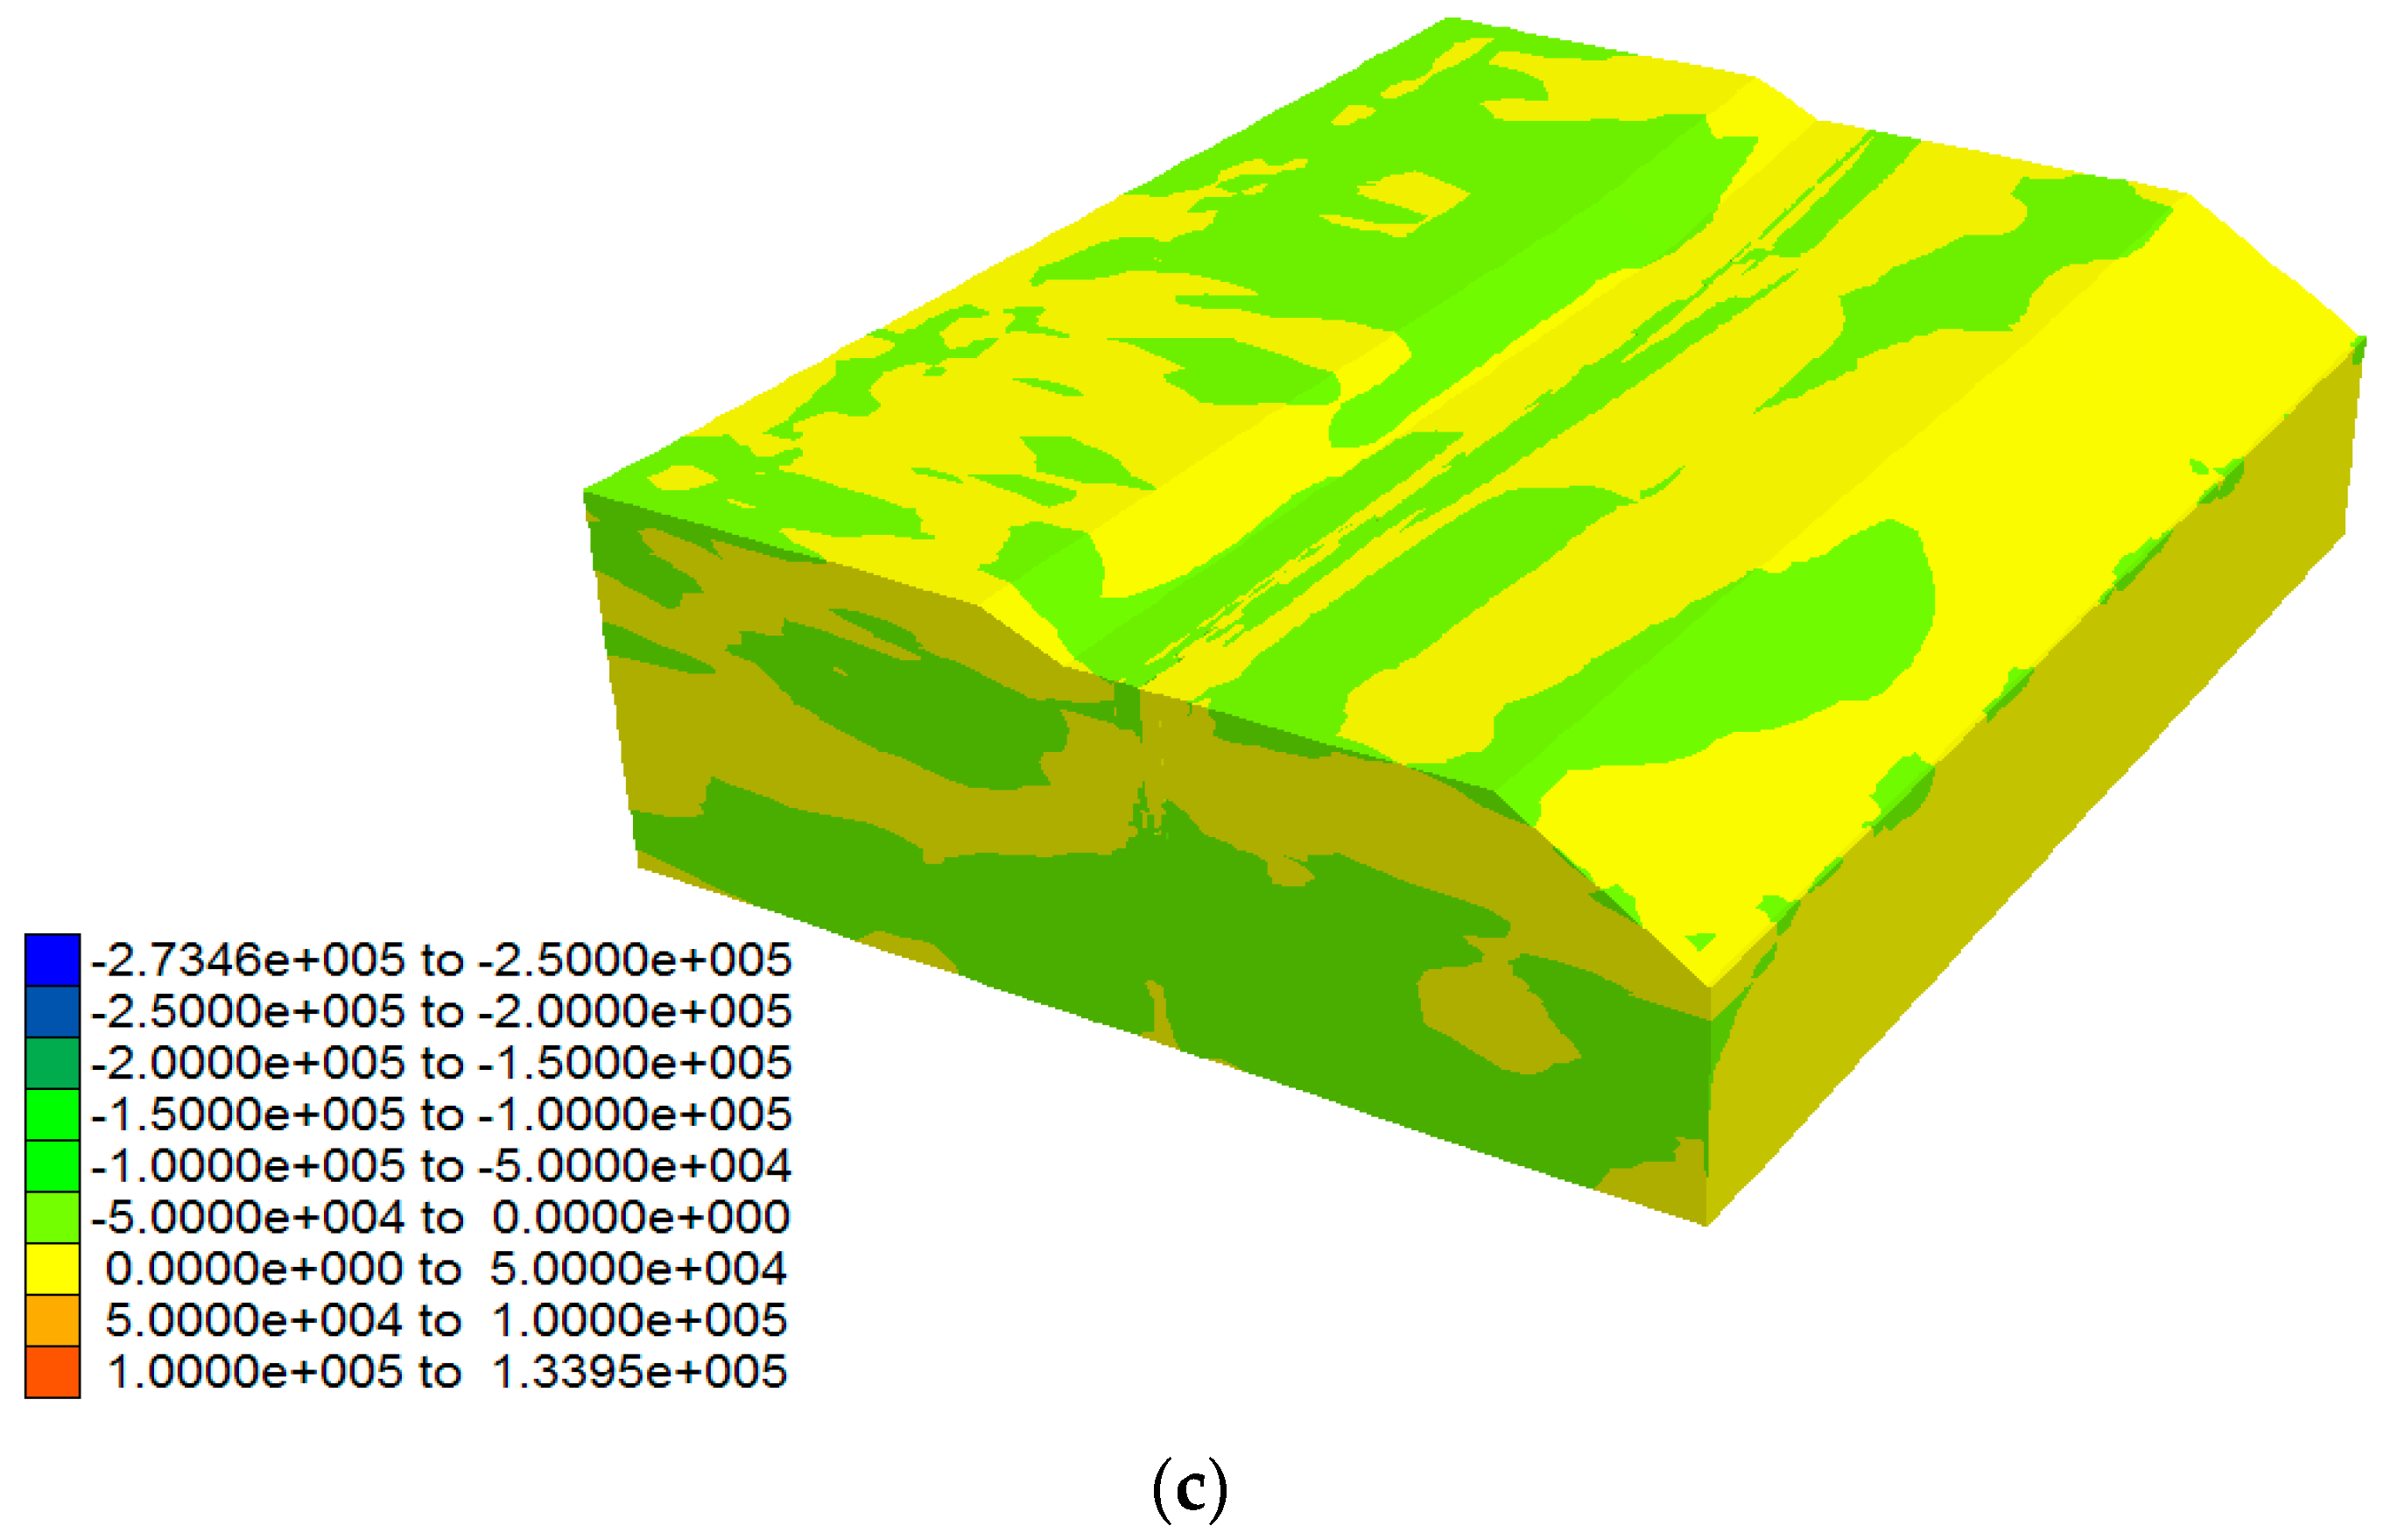
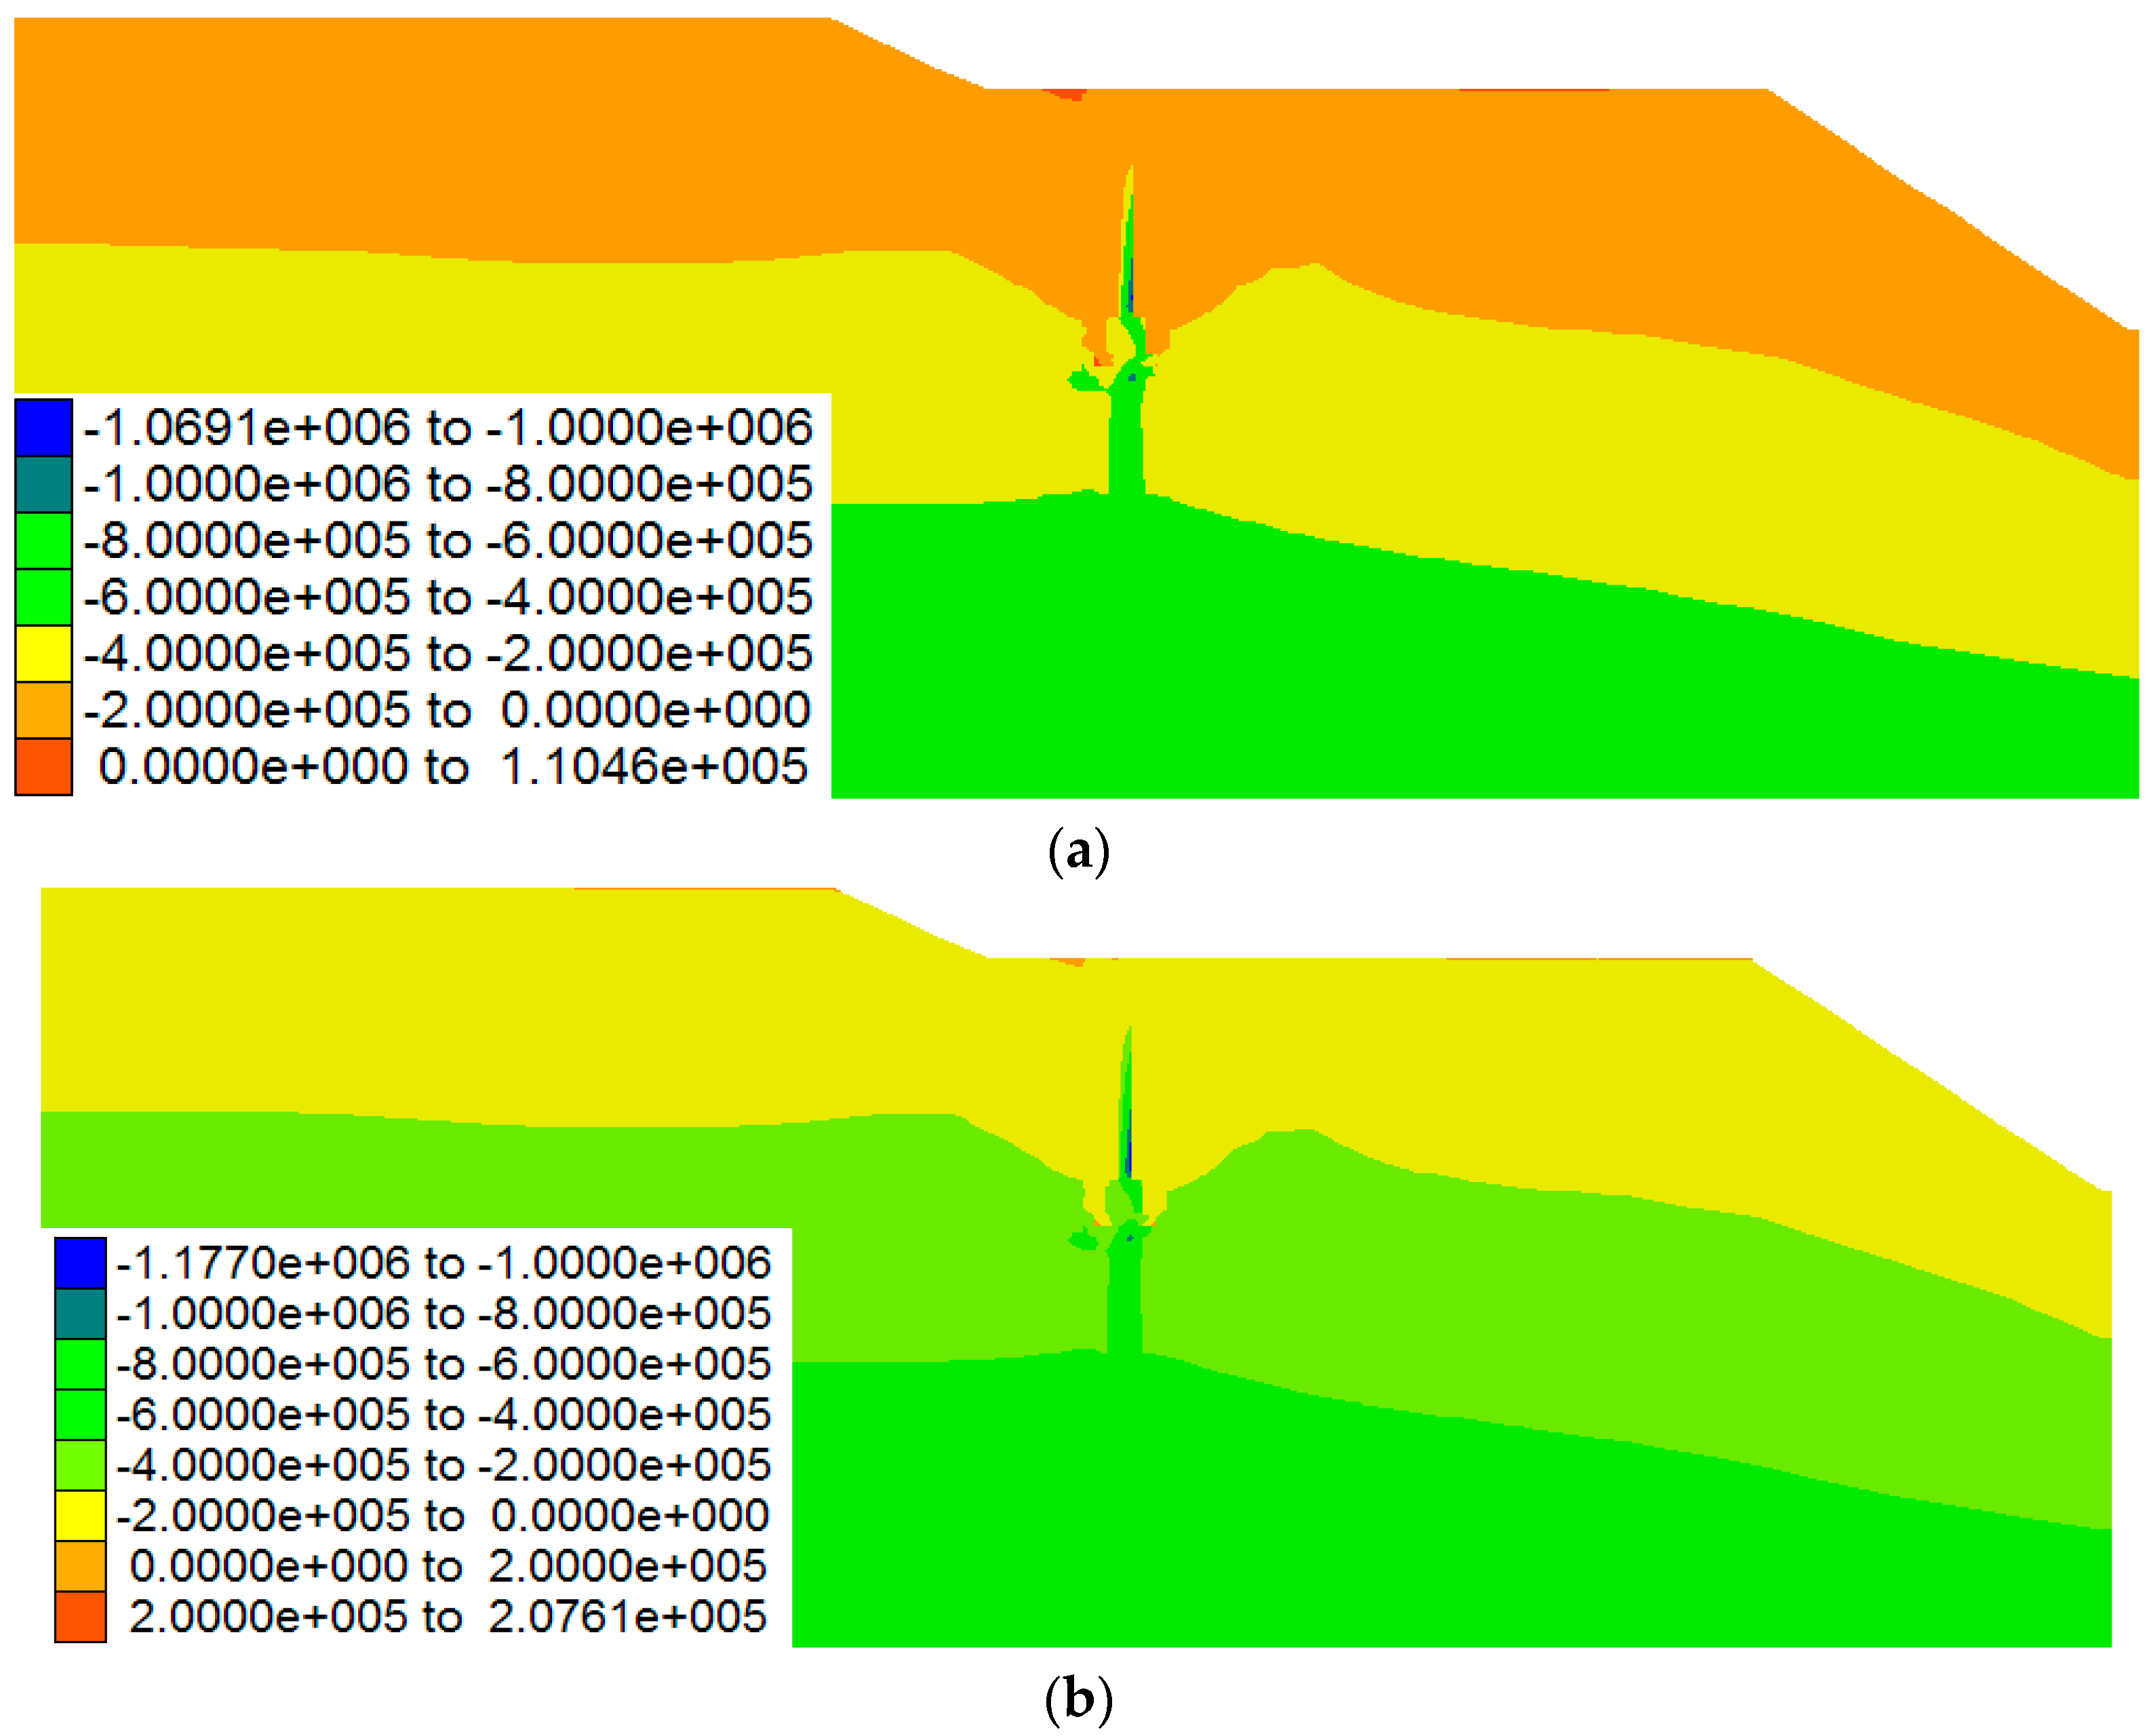
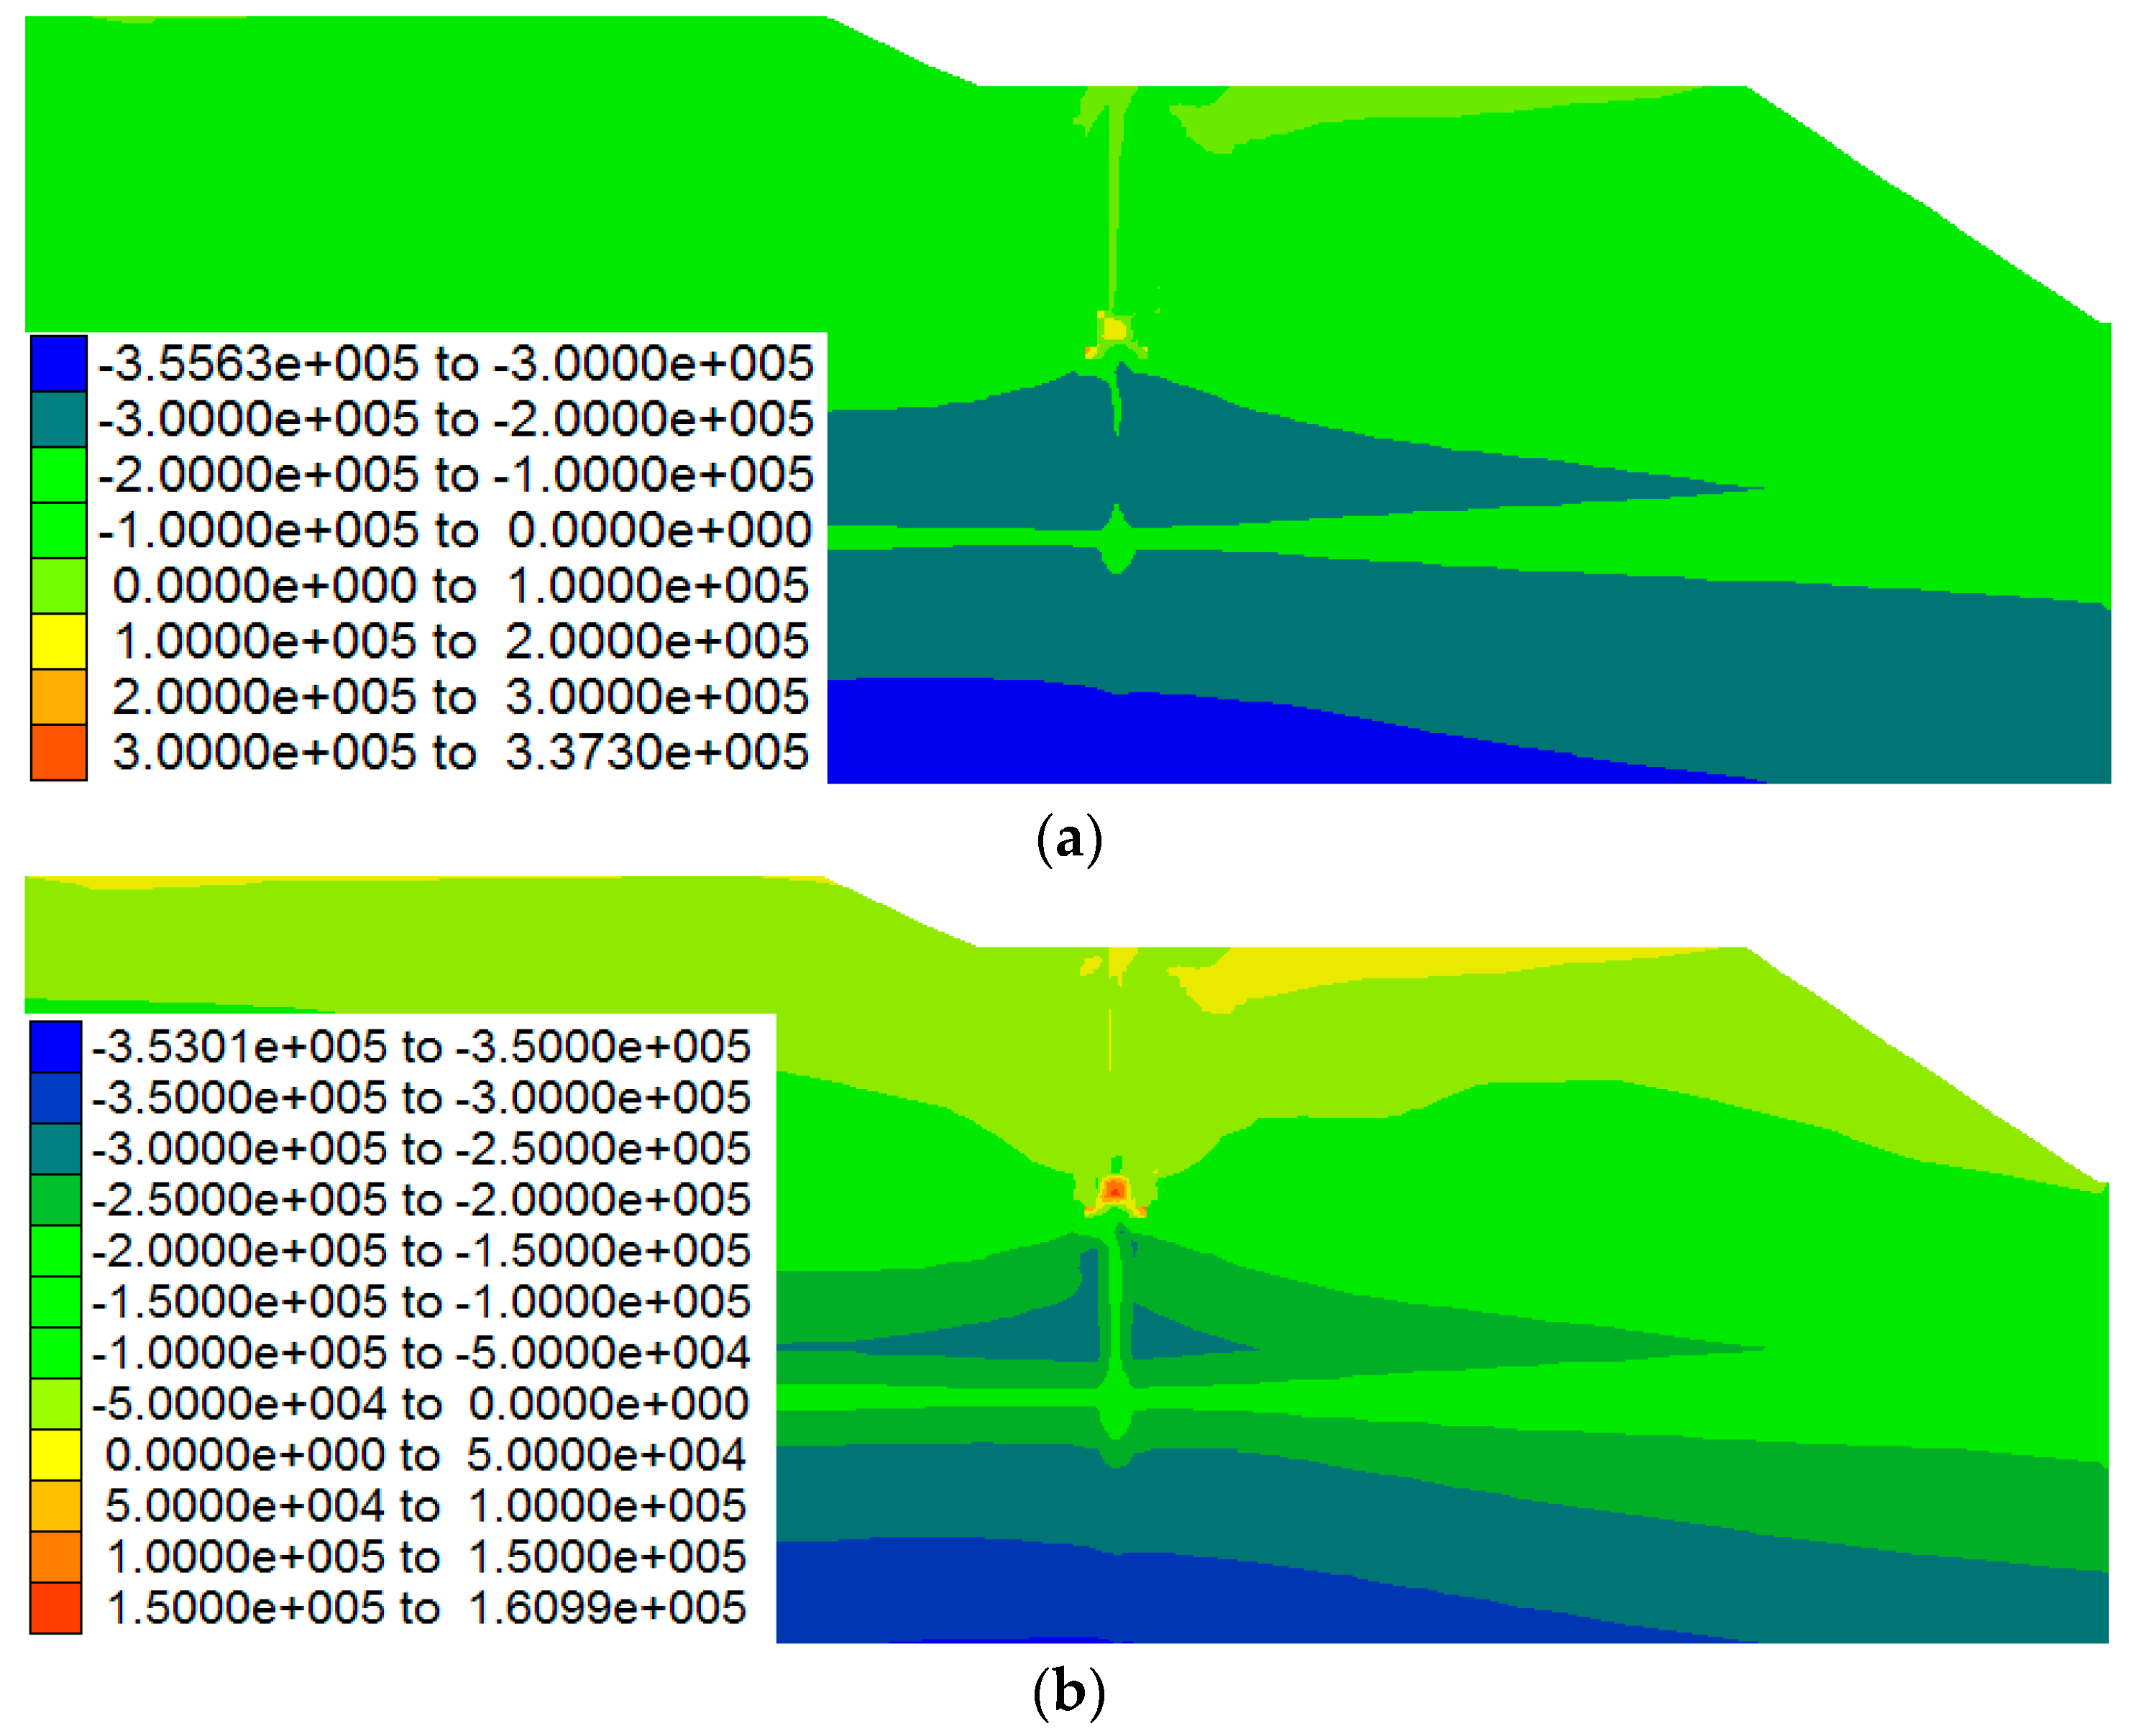
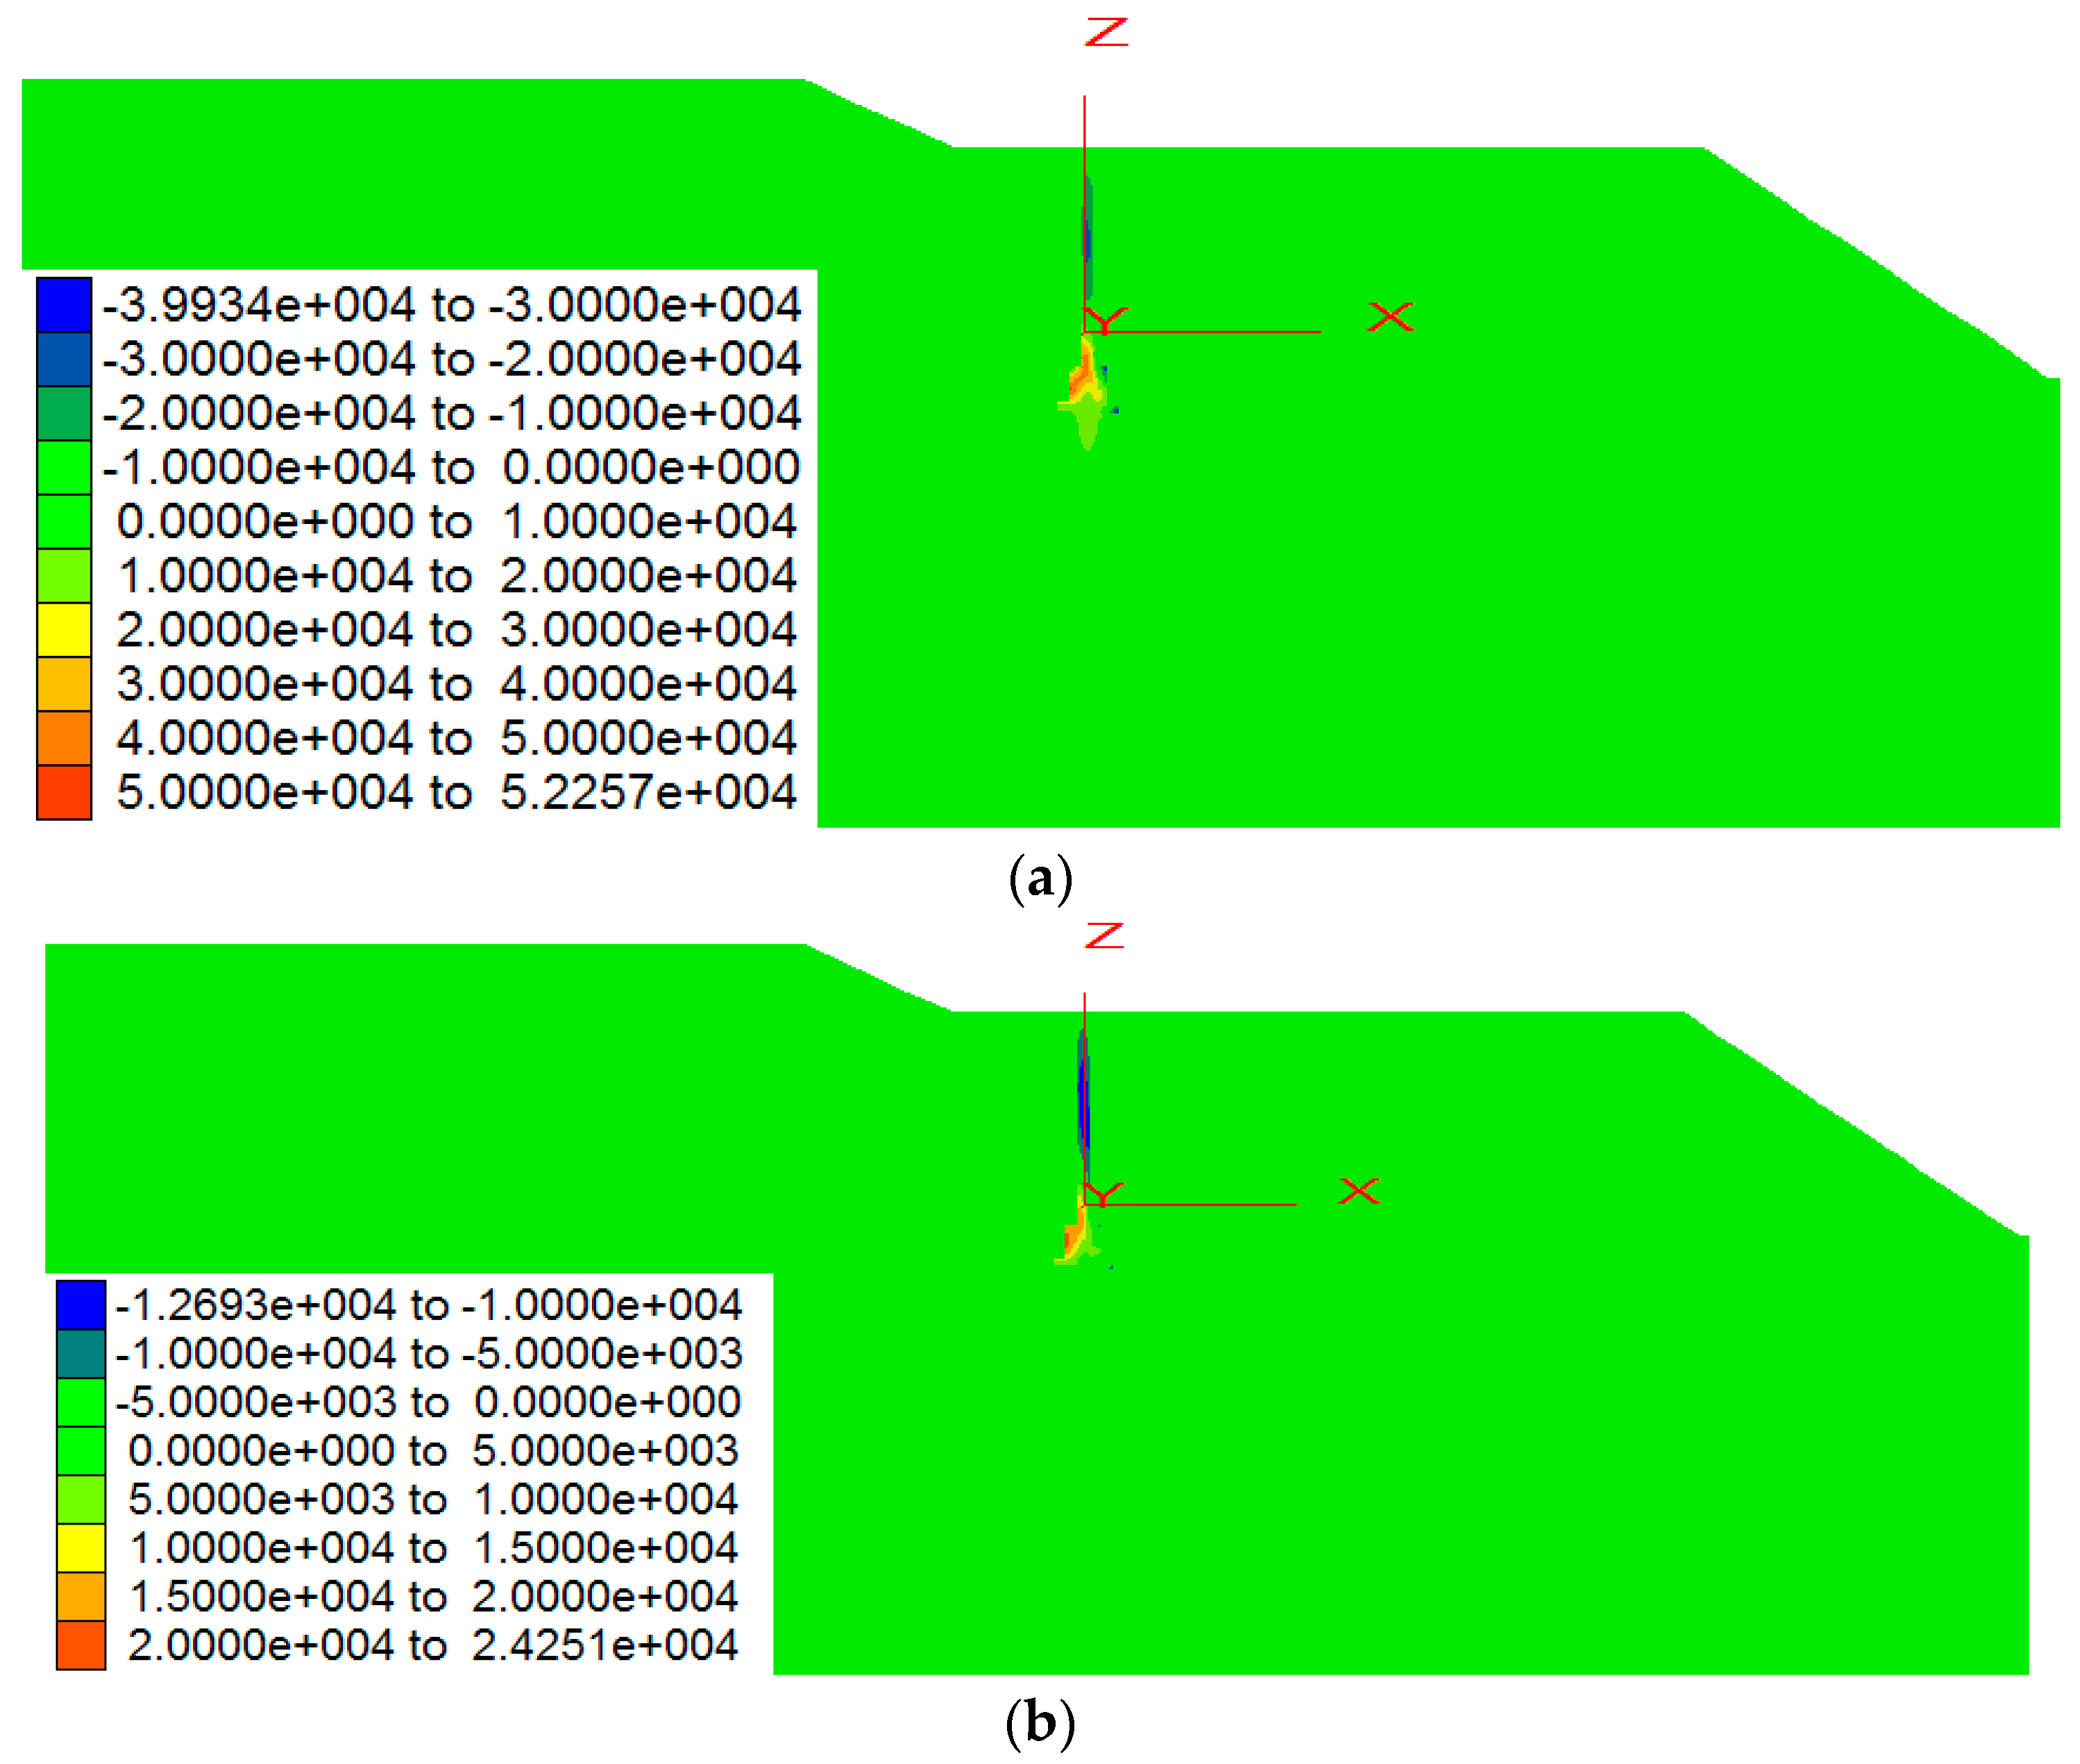
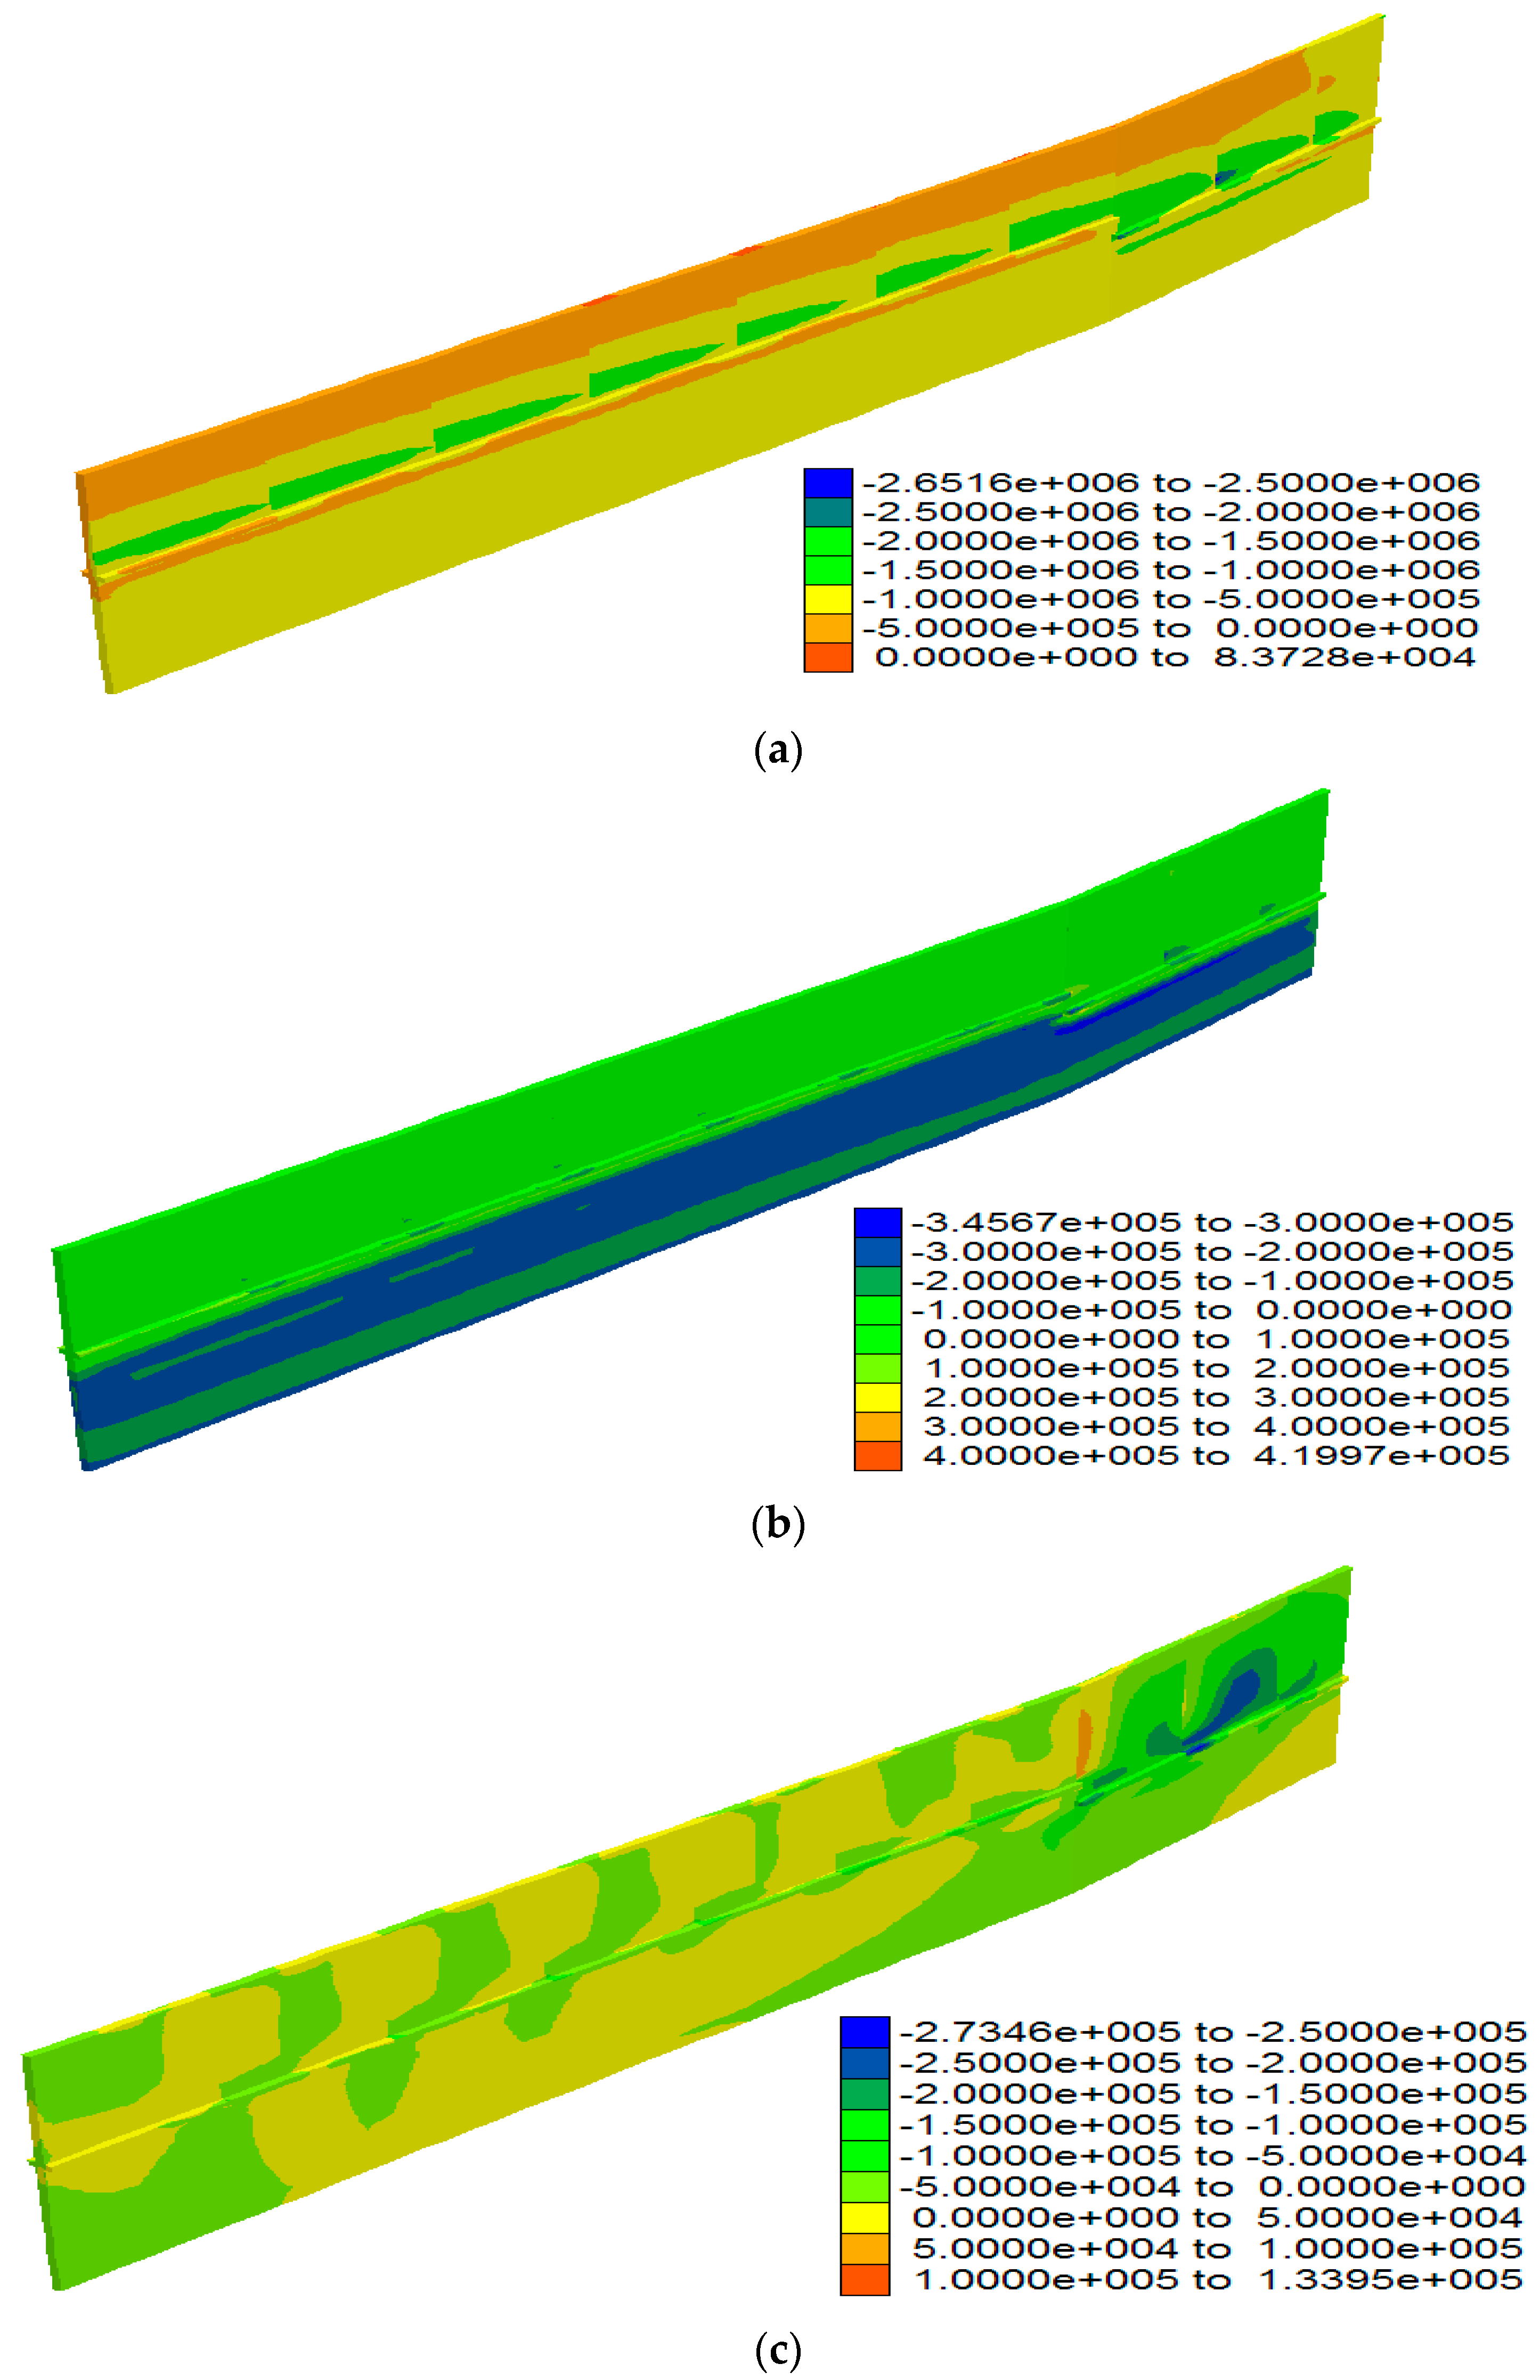
4.2. Analysis of Stress Distribution Law

Figure 15 shows the overall stress distribution in the analysis area after construction. It can be seen from the stress diagram analysis that the maximum principal stress occurs in the filling area, and the large stress value is only about 1.155 Mpa. It can be seen from Figure 16, Figure 17 and Figure 18 of the stress distribution law of the monitoring surface that the maximum principal stress is below 1.5 Mpa, and maximum contact stress of 0.16 Mpa appears in the local area of the rigid cut-off wall close to the guide wall, but the value is small and will not endanger the rigid cut-off wall. The maximum shear stress on the ZX plane of the cut-off wall is only about 0.26 Mpa, and it is located in the lower area of the rigid cut-off wall.
Figure 19 shows that the maximum compressive stress mostly occurs at the lower part of the rigid cut-off wall, and the stresses in the lower part of the first to third piles are slightly greater than those of the walls at other positions. The main reason is that the filling layer in the area is thicker than other parts. The maximum stress on the rigid cut-off wall is between 1.5–2.6500 MPa, and the maximum stress on the plastic cut-off wall is between 0.5600–1.5 Mpa, both of which are within the safe range. The shear stress distribution in the ZX plane is also larger than the cut-off walls at the second and third walls, and the maximum shear stress is about 0.27 MPa.
Figure 20, Figure 21 and Figure 22 shows the stress distribution of the cutoff wall section at different monitoring surfaces. The maximum pressure of the rigid cut-off wall is 1.4302 MPa. The maximum pressure of the plastic cut-off wall is within 1.200 Mpa, which is smaller than that of the rigid cut-off wall. Apart from the tensile stress of less than 0.237 MPa occurring at the connecting guide wall between the rigid cut-off wall and the plastic concrete cut-off wall, the cut-off wall is basically under compression, especially the plastic cut-off wall. There is a stress concentration phenomenon in the upper part of the cross-shaped structure (guide wall) of the wall, that is, there is a large bending moment there, but there is no strong stress concentration in the lower part of the cross-shaped structure. It shows that the guide wall at the lower part of the cross-shaped structure plays a very good supporting role, offsetting some of the harmful bending moments that are unfavorable to the safety of the plastic concrete wall.
Based on the above stress analysis, it can be seen that the overall stress on the cut-off wall gradually decreases from the bottom to the top, and the overall stress on the cut-off wall is slightly greater than that of the surrounding strata. This is not only related to the load it bears, but also to its own load. This is on account of the material properties. There is a phenomenon of compressive stress concentration at the rigid cut-off wall root, but its maximum value is only between 1.5–2.0 Mpa, which is far less than the material strength of the rigid cut-off wall of 15 Mpa. Due to the structural size, the maximum tensile stress of 0.237 Mpa appears in the local area near the guide wall of the rigid cut-off wall, but the value is small, which will not endanger the rigid cut0off wall. The shear stress in the ZX plane of the cut-off wall is slightly higher than that of the surrounding filling area, its maximum value is only about 0.3 Mpa, and it is located at the lower part of the rigid cut-off wall. The shear stress in the plastic cut-off wall is a lower order of magnitude. The maximum stress on the cut-off wall is generally below 1.5 Mpa, which is compressive stress.
The maximum stresses in the lower part of the first to third parts are slightly larger than that of the walls at other positions, and the local stress on the plastic cut-off wall in this area is also greater than that of the plastic cut-off wall in other areas. Their magnitudes are small, and the maximum stress in the rigid cut-off wall and plastic cut-off wall is between 1.5–2.65 Mpa and 0.56–1.5 Mpa, respectively. The shear stress distribution in the ZX plane is also present at the second and third walls. It is larger than other cut-off walls, and the maximum shear stress is only about 0.30 Mpa.
Apart from the small tensile stress at the connection guide wall between the rigid and the plastic concrete cut-off walls, the cut-off wall is in a state of compression. This is especially true for the plastic cut-off wall. Therefore, both the reinforced concrete wall and plastic concrete wall meet the design strength during construction. The guide wall plays an effective role in supporting the plastic cut-off wall. In conclusion, the dynamic construction effect has little influence on the strength of the cut-off wall, and the maximum stress is within the design range. Therefore, the rigid and the plastic cut-off wall are in a safe and stable state.

5. Conclusions

In this paper, through back analysis and simulation, the mechanical action of the whole construction process on a reservoir west dike cut-off wall and the mechanical effect produced by the cut-off wall have been obtained. The following main results and conclusions have been obtained:
  • The deformation trend of the wall can be divided into three stages as the construction steps proceed. The first stage: Fill on both sides of the wall, but the width of the fill on the outside of the reservoir is large, and the wall is subject to the lateral constraint of the original reservoir embankment. The whole wall is inclined to the inside of the reservoir. The second stage: There is a large amount of fill in the inner side of the reservoir. Due to the gravity effect of the unilateral soil accumulation, the overall inclination of the wall has recovered. At this stage, the wall tends to move towards the outer side of the reservoir. The third stage: due to the soil piling work outside the reservoir during the construction stage of the Beijing-Shijiazhuang Expressway subgrade, the wall began to tilt towards the inside of the reservoir;
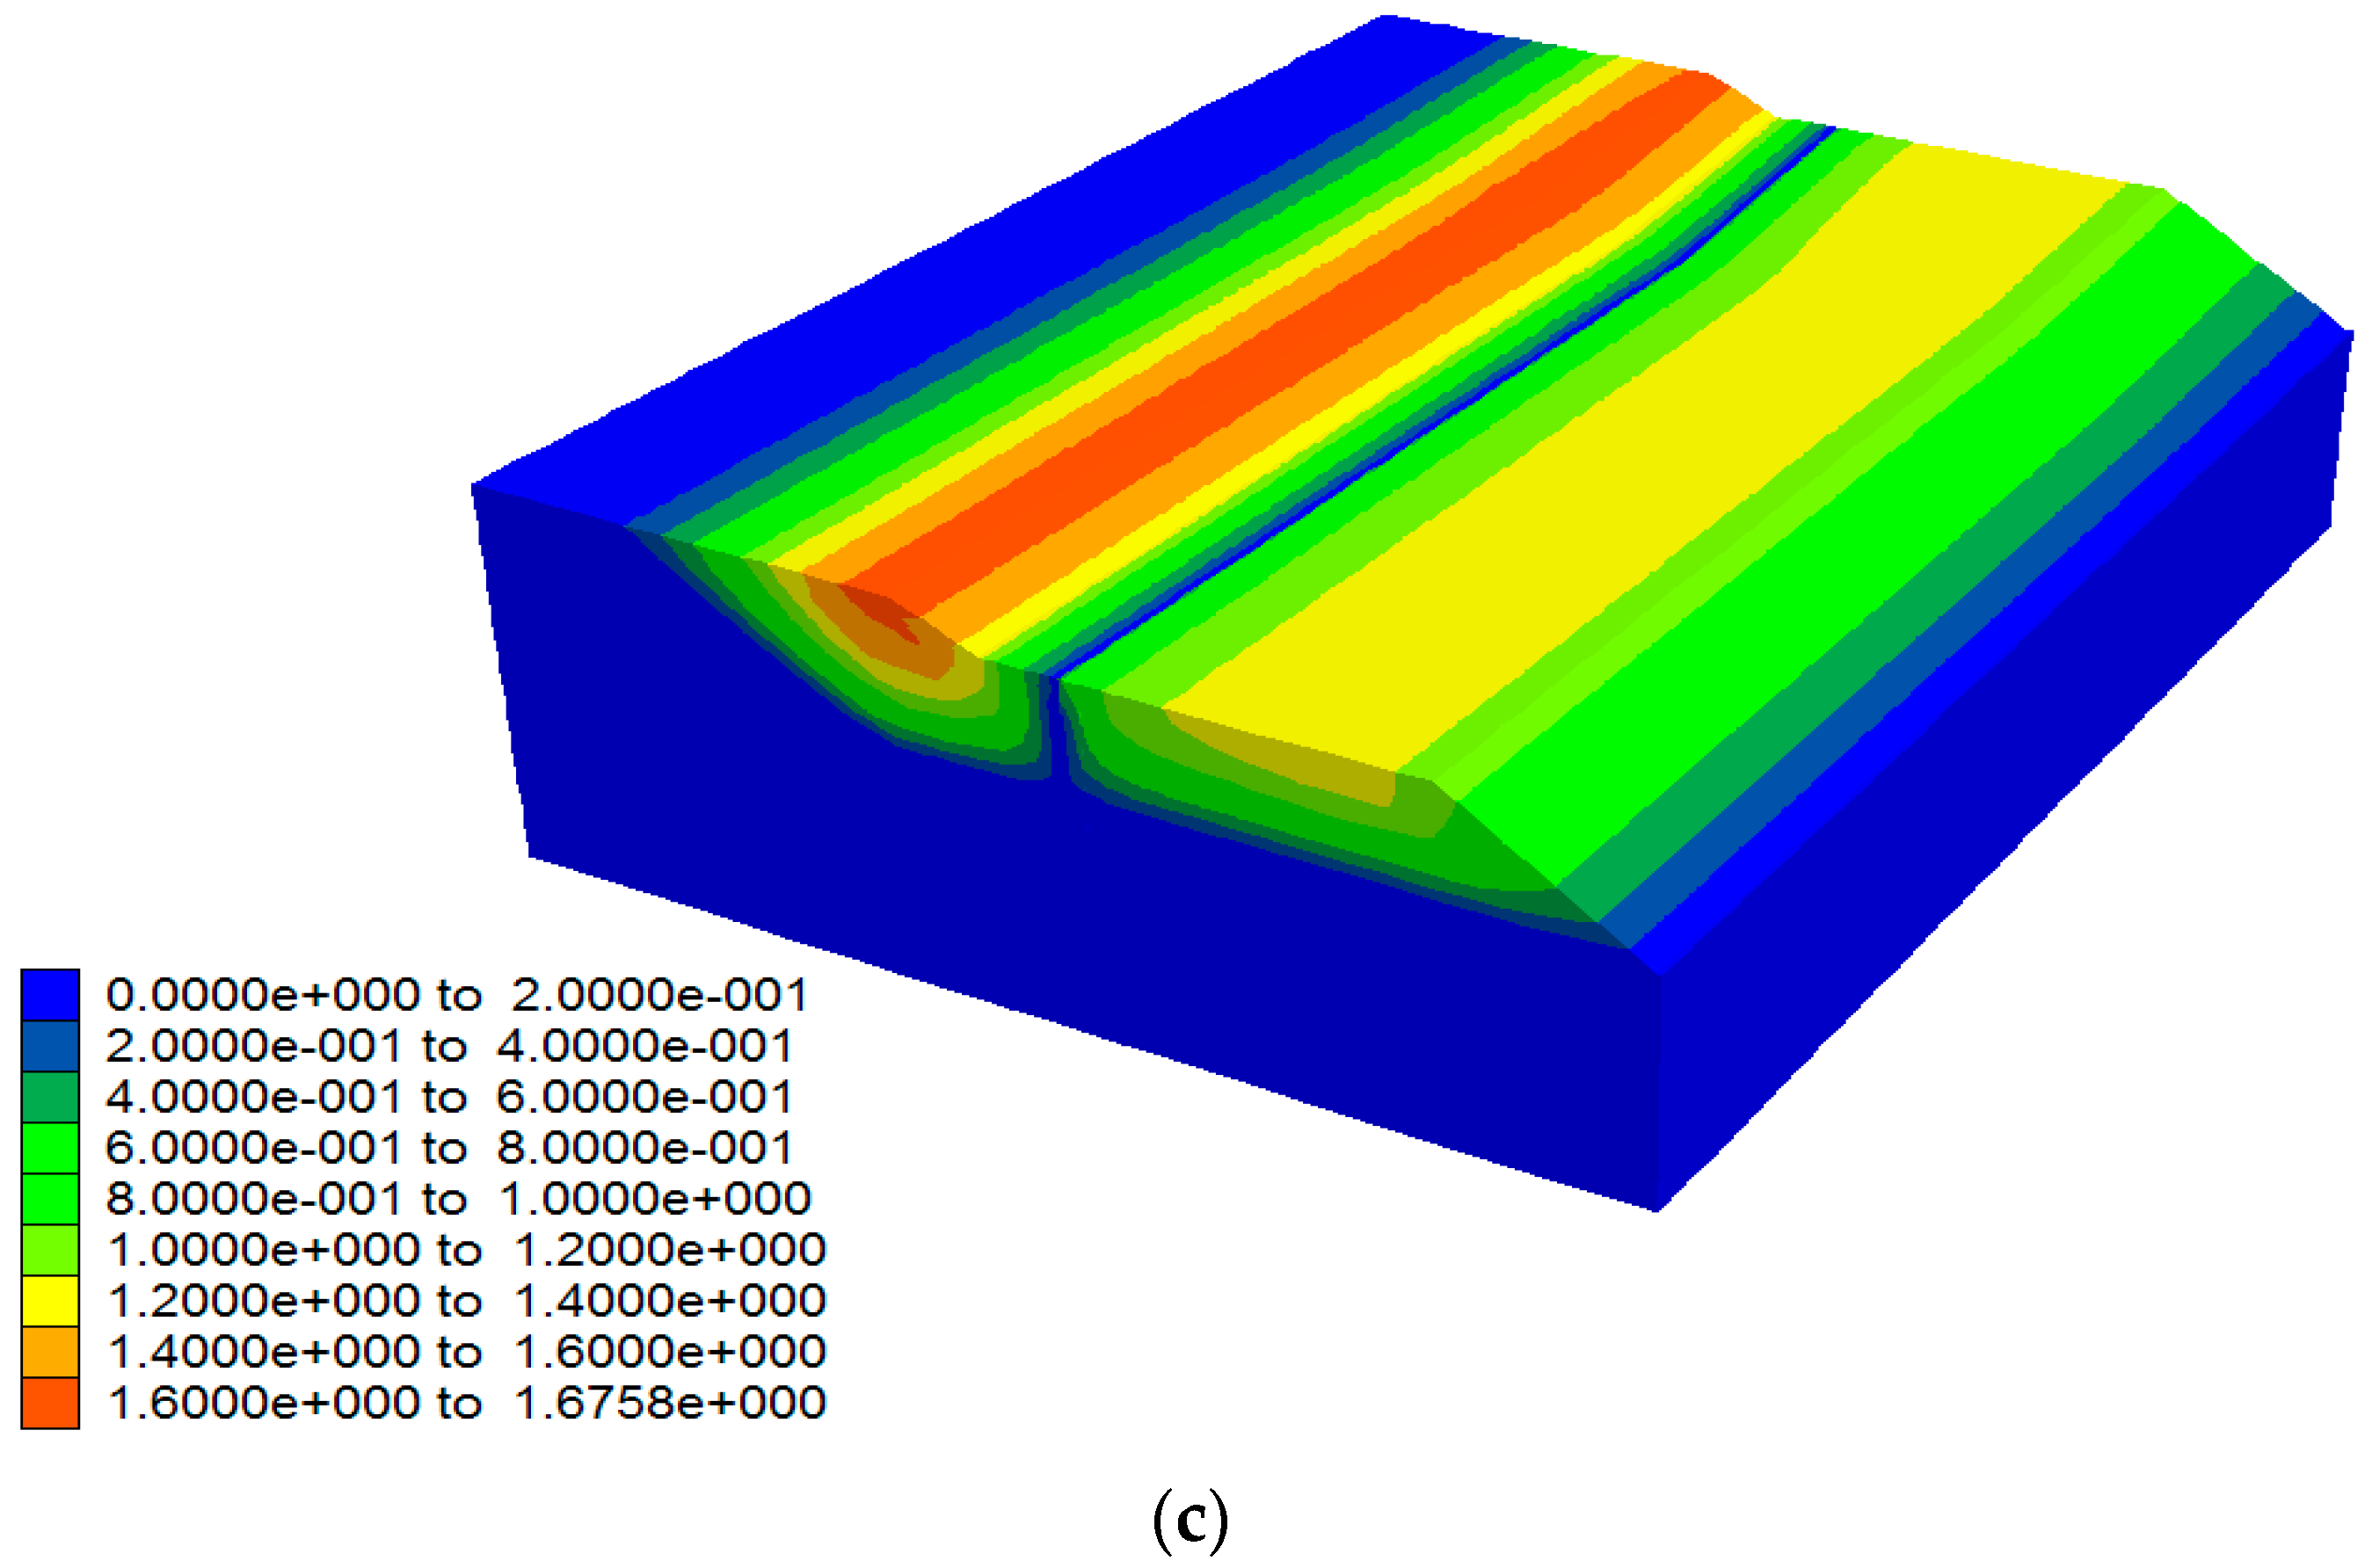
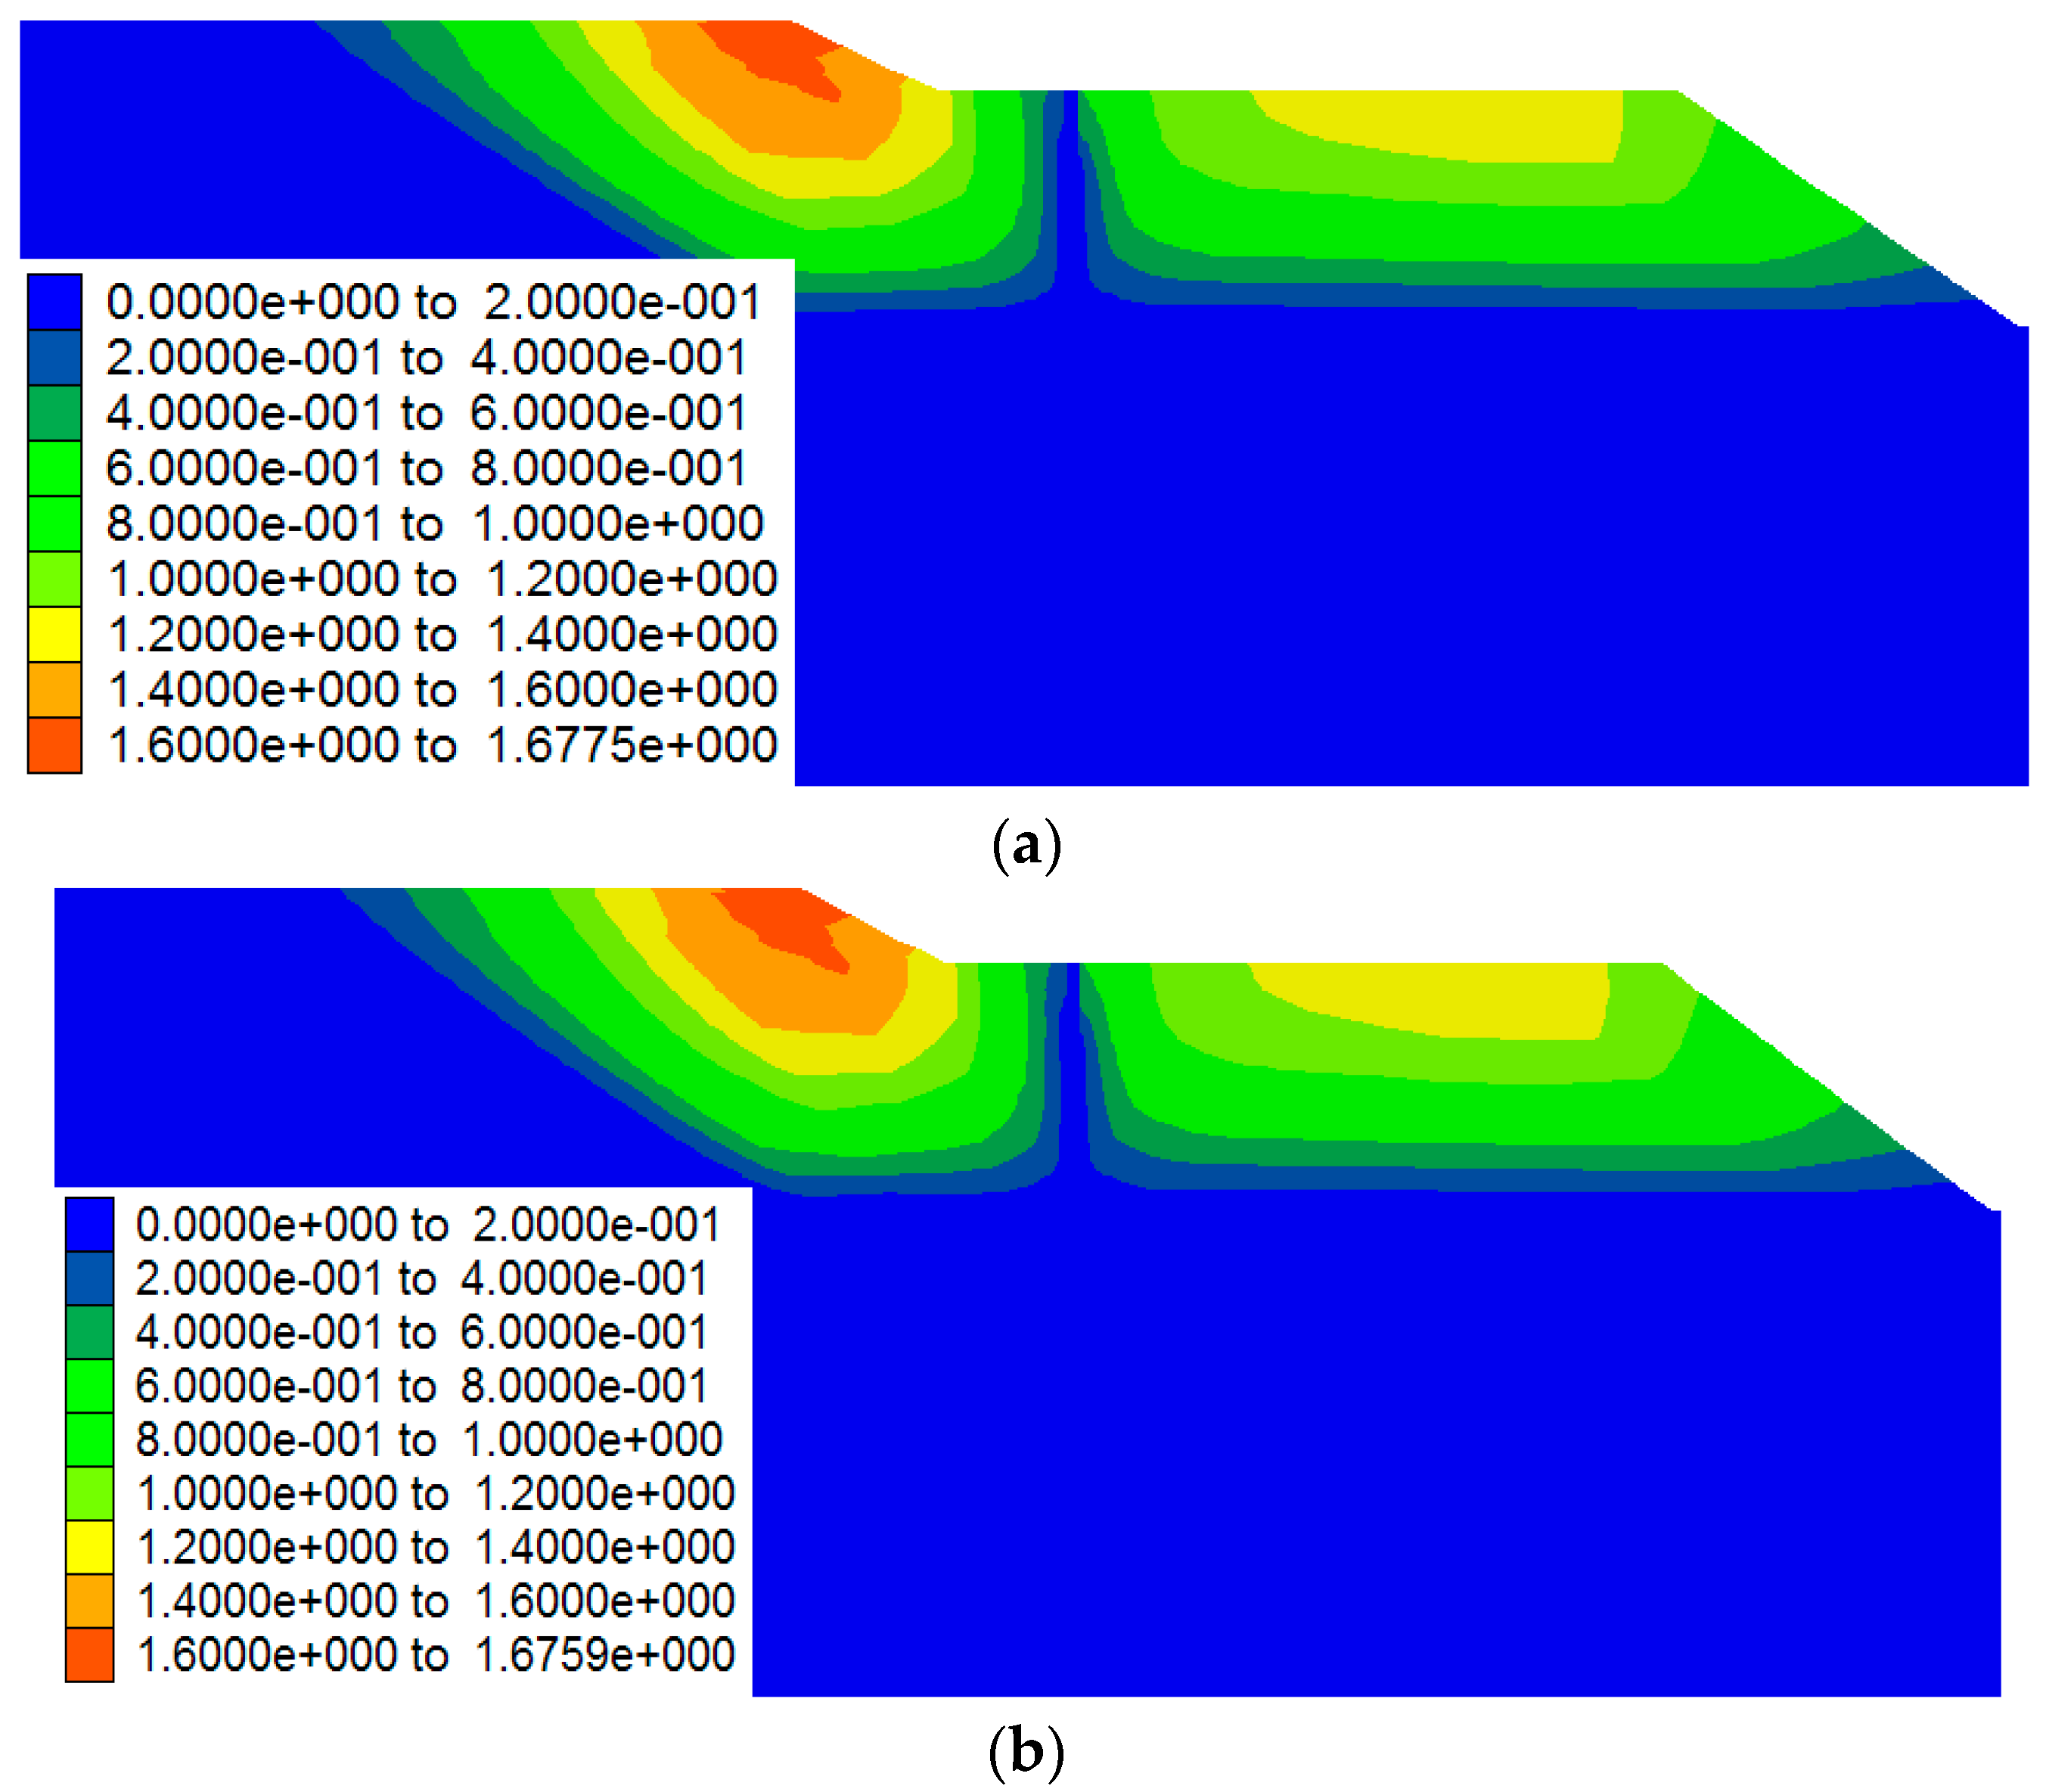
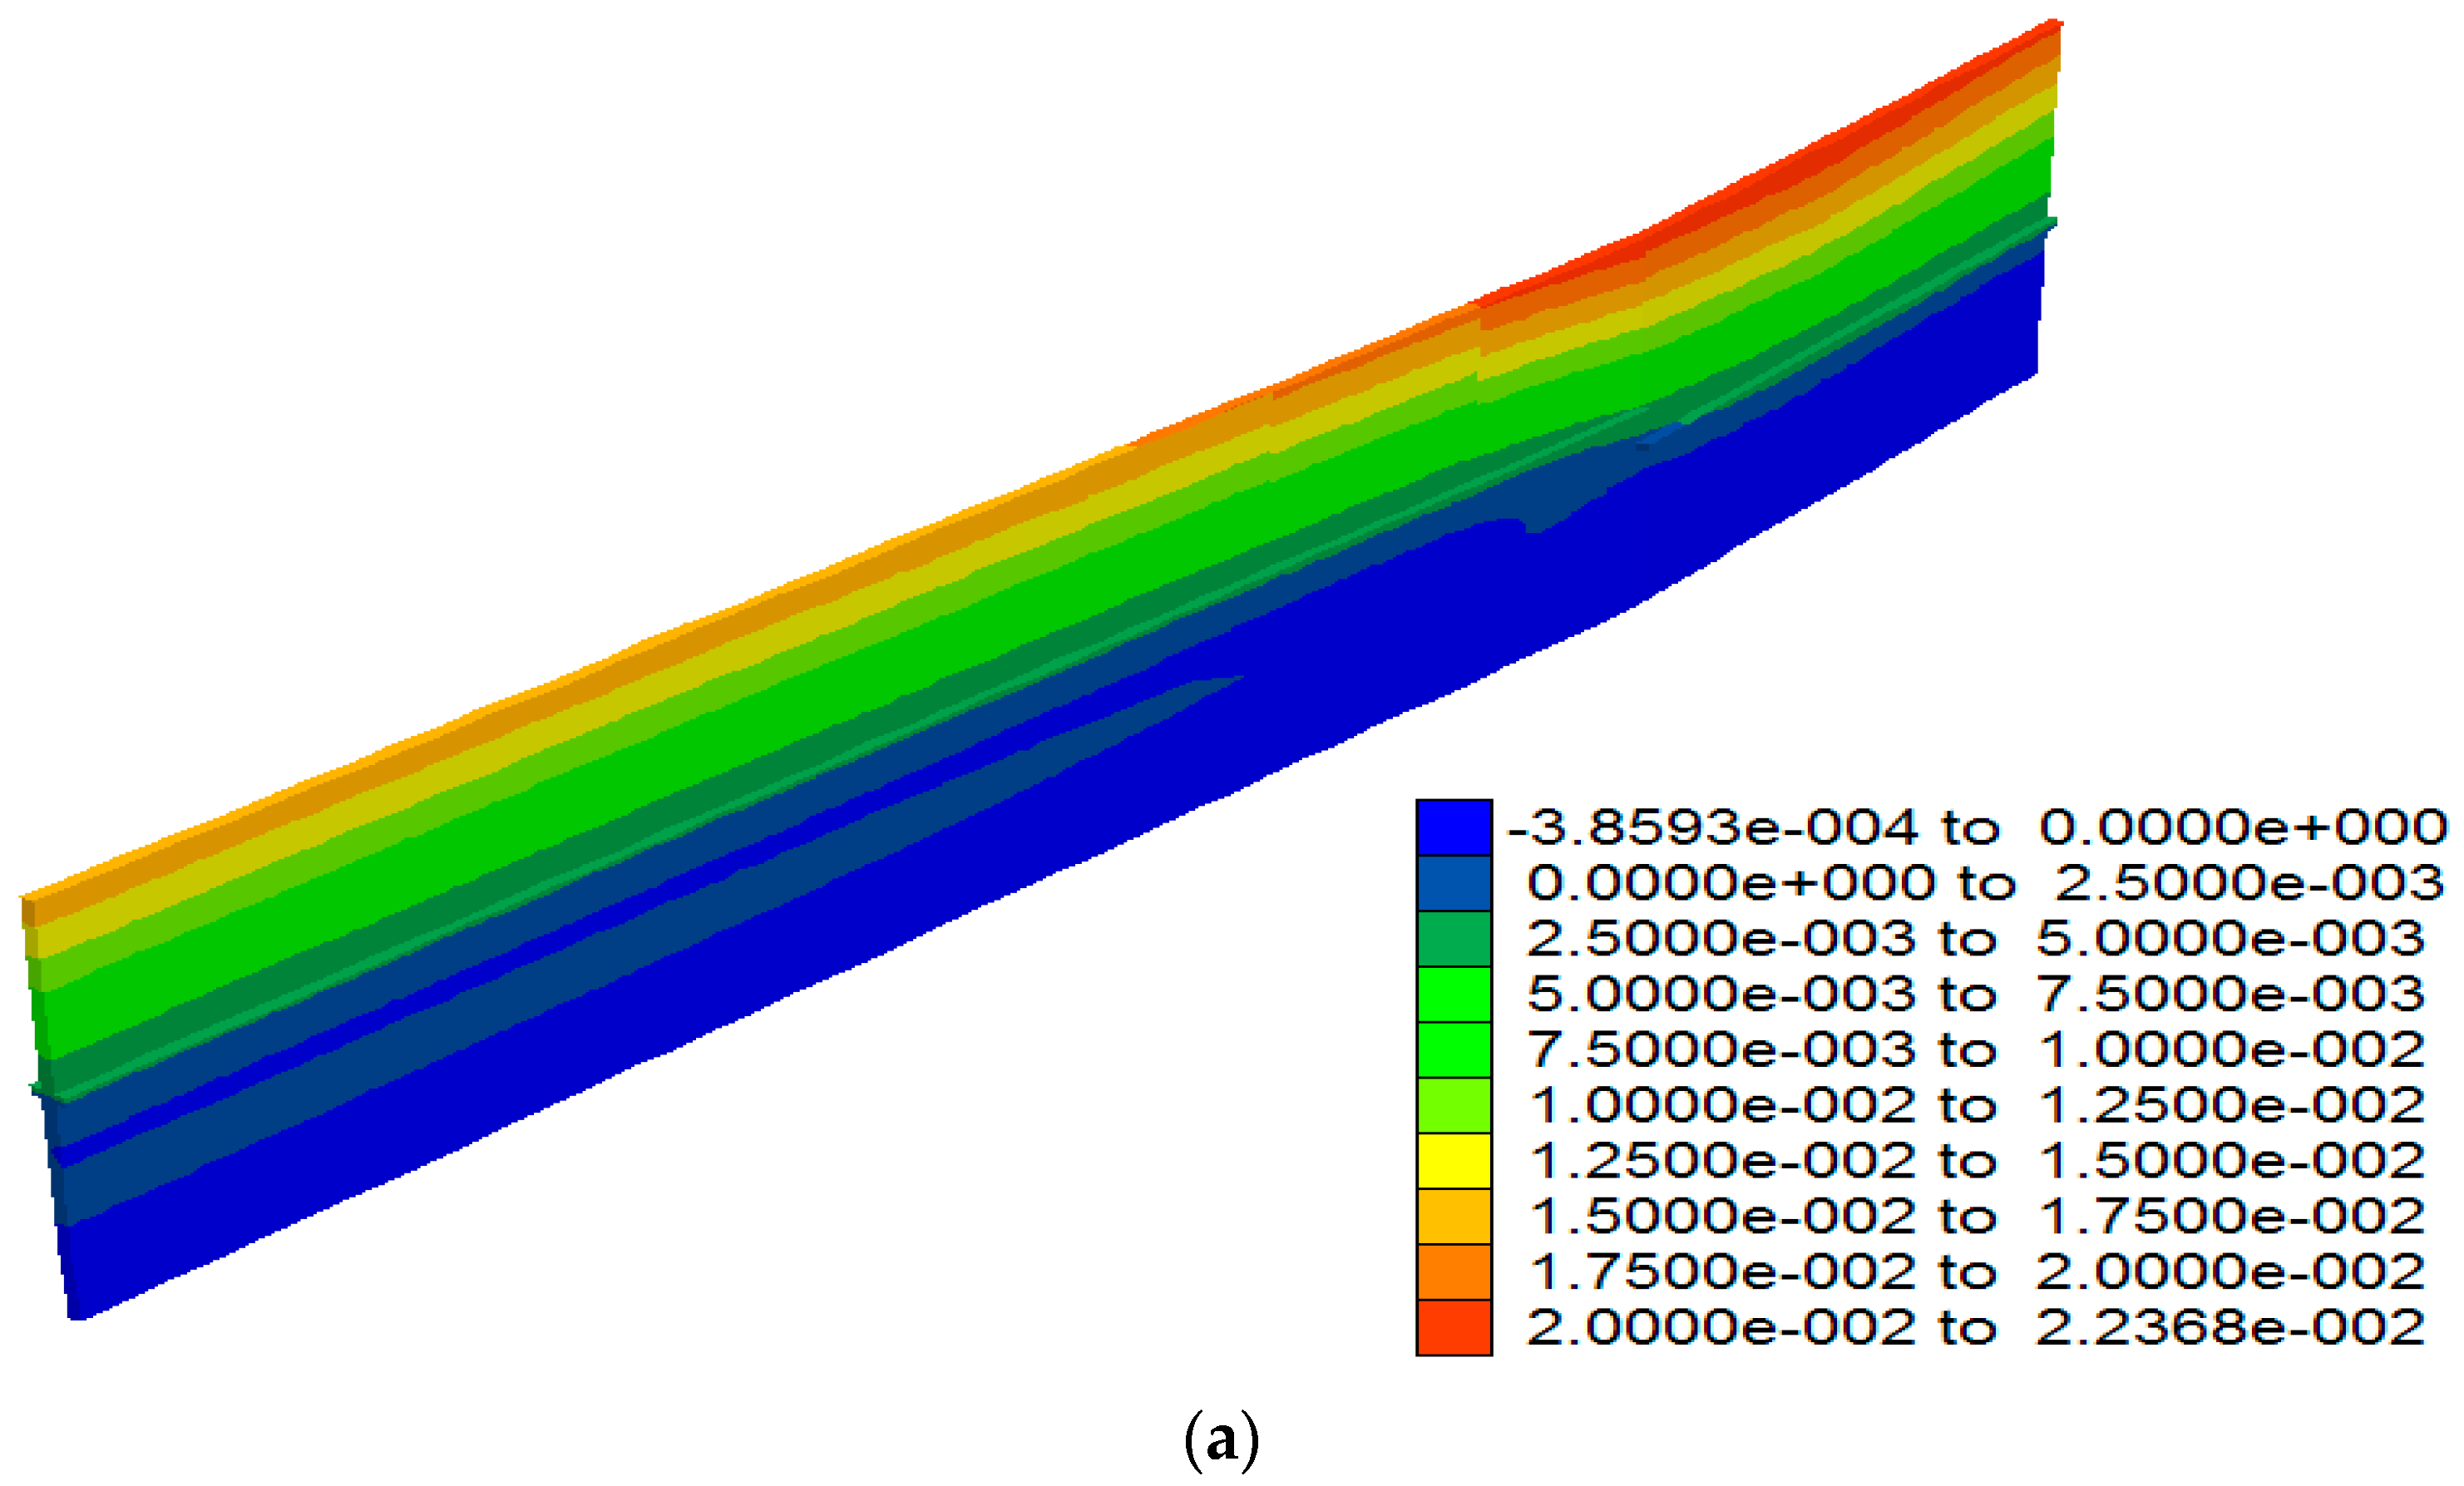
  • In the process of filling construction, the whole impervious wall shows a tendency to tilt towards the inner side of the reservoir. The horizontal displacement value of the wall gradually increases from bottom to top, and the maximum value appears at the top of the wall. The horizontal displacement value of the 1–3 walls is relatively large, with the maximum value of 22.368 mm, and the horizontal displacement value of the 4–10 walls does not differ greatly. The largest difference in the horizontal displacement of the cu-off wall occurs at the joint between the third and fourth walls, and between the fourth and fifth walls, with the maximum difference of 1.314 mm;
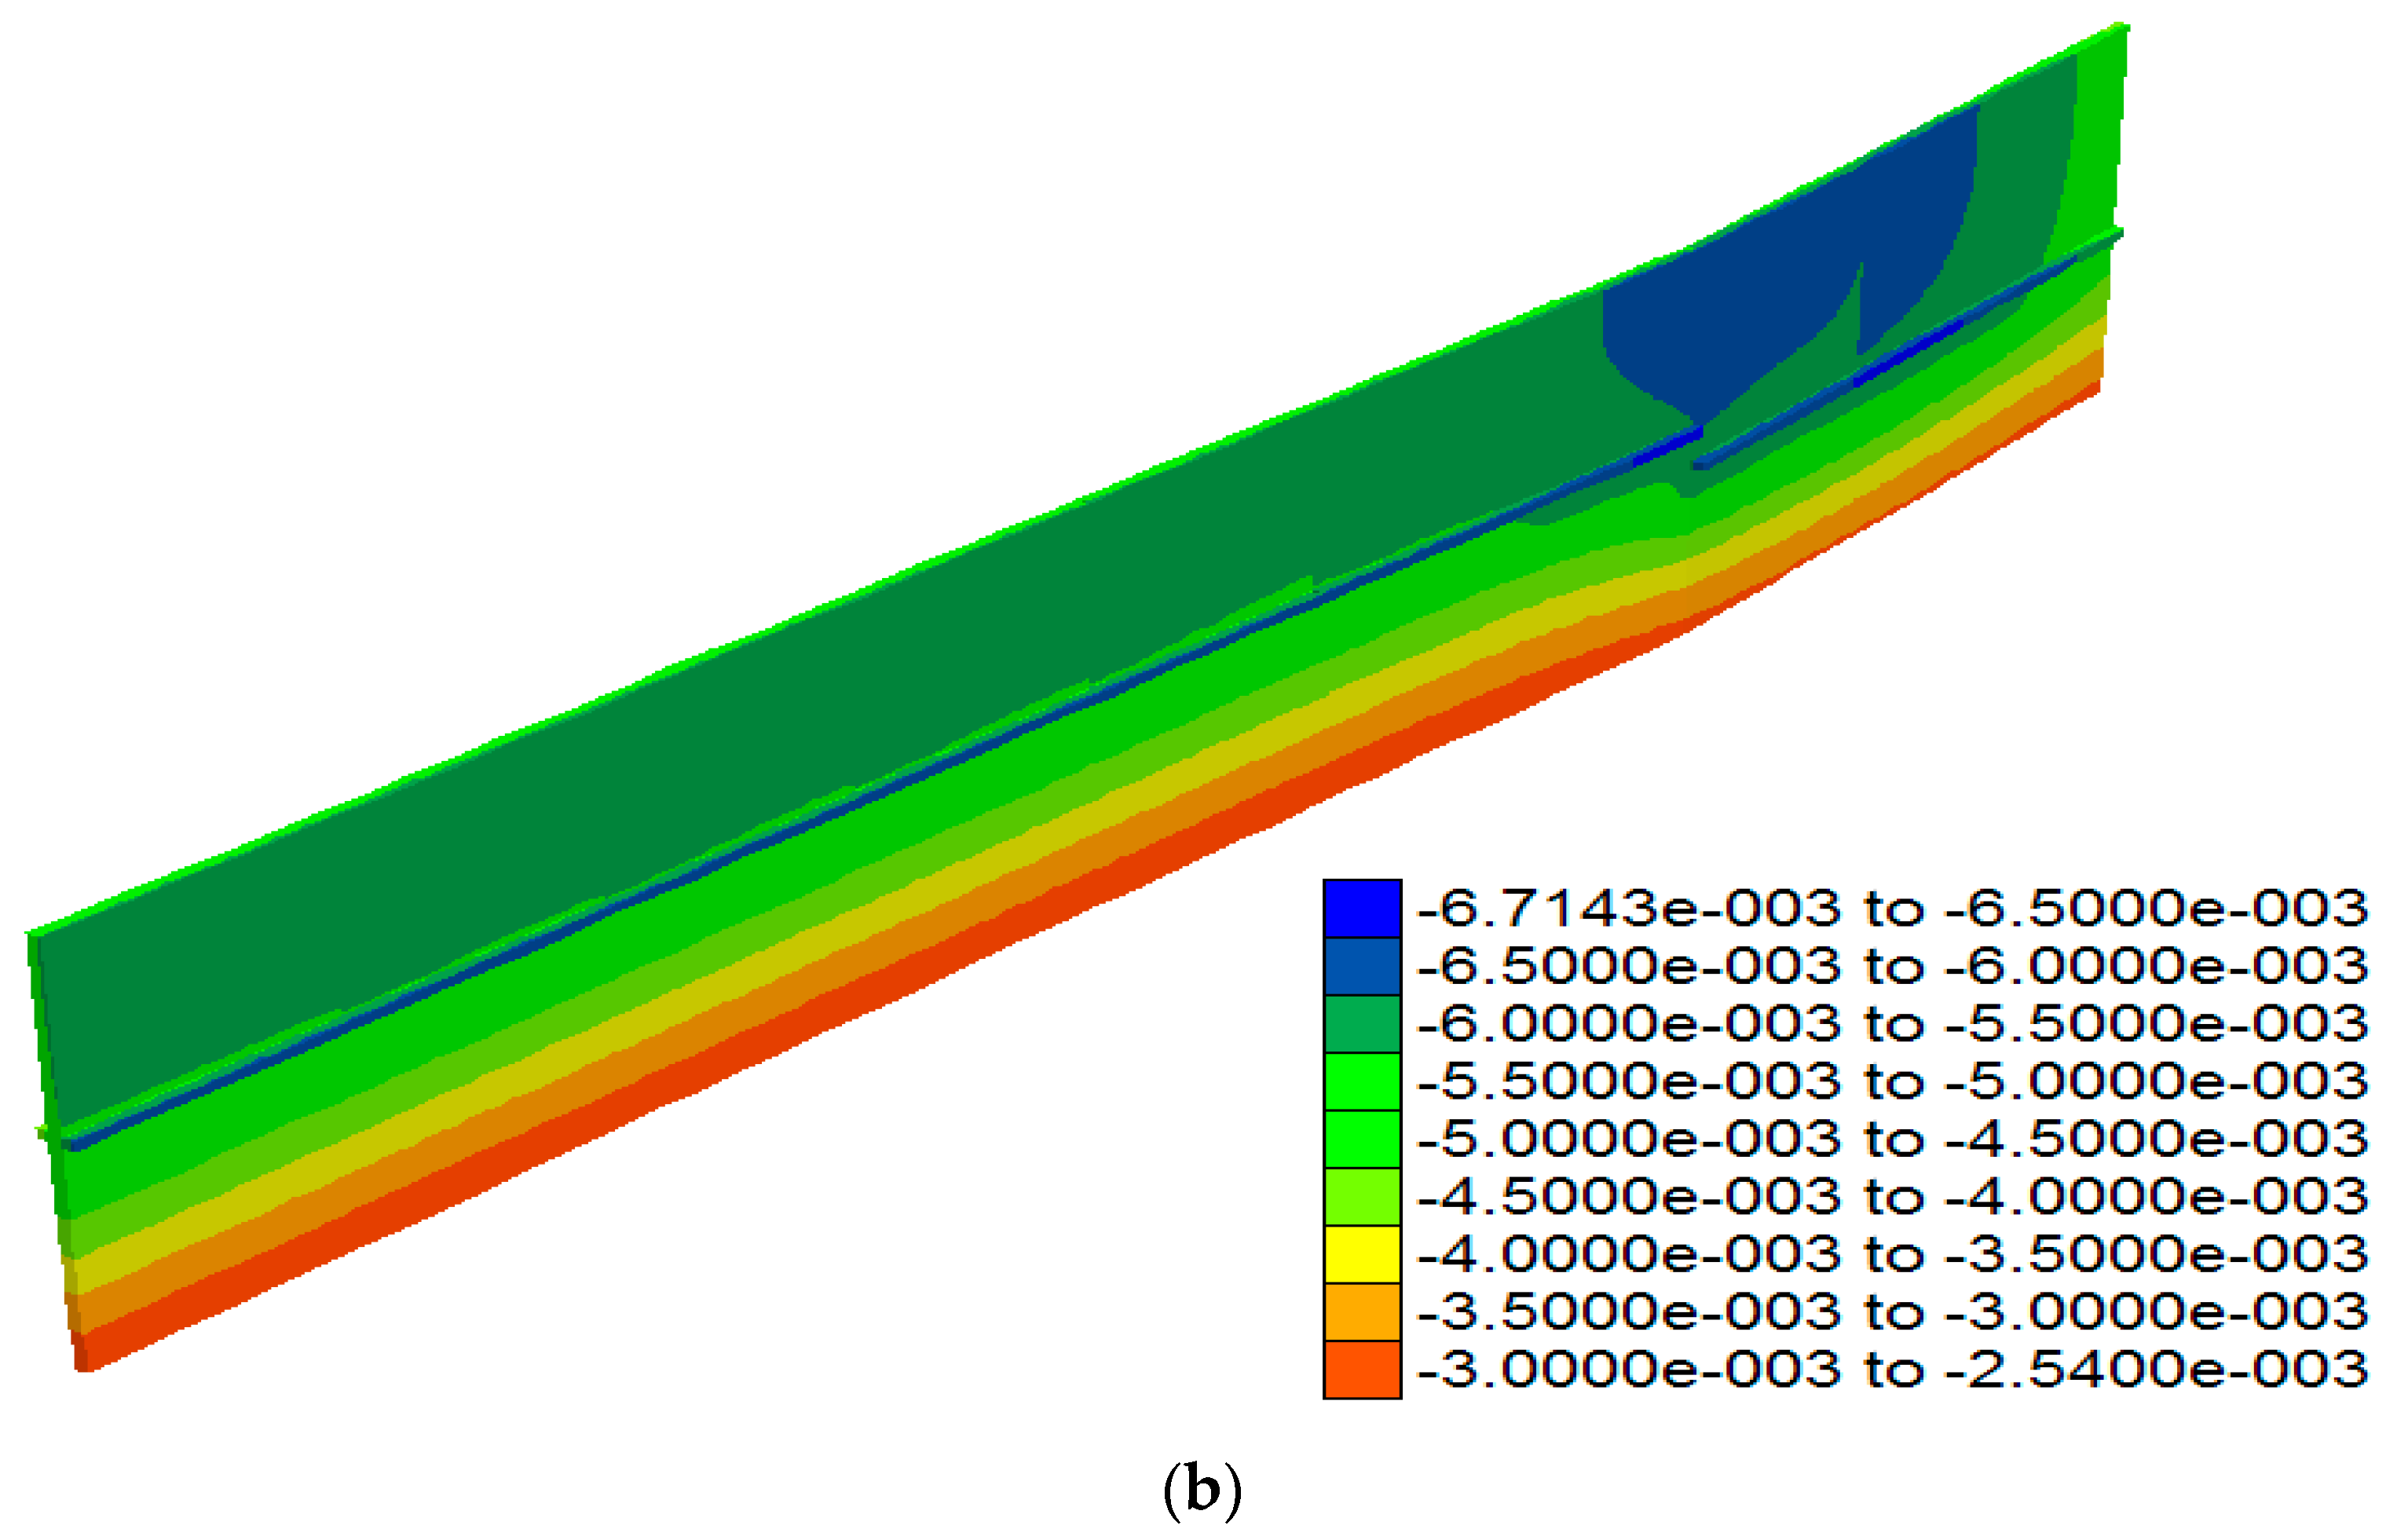
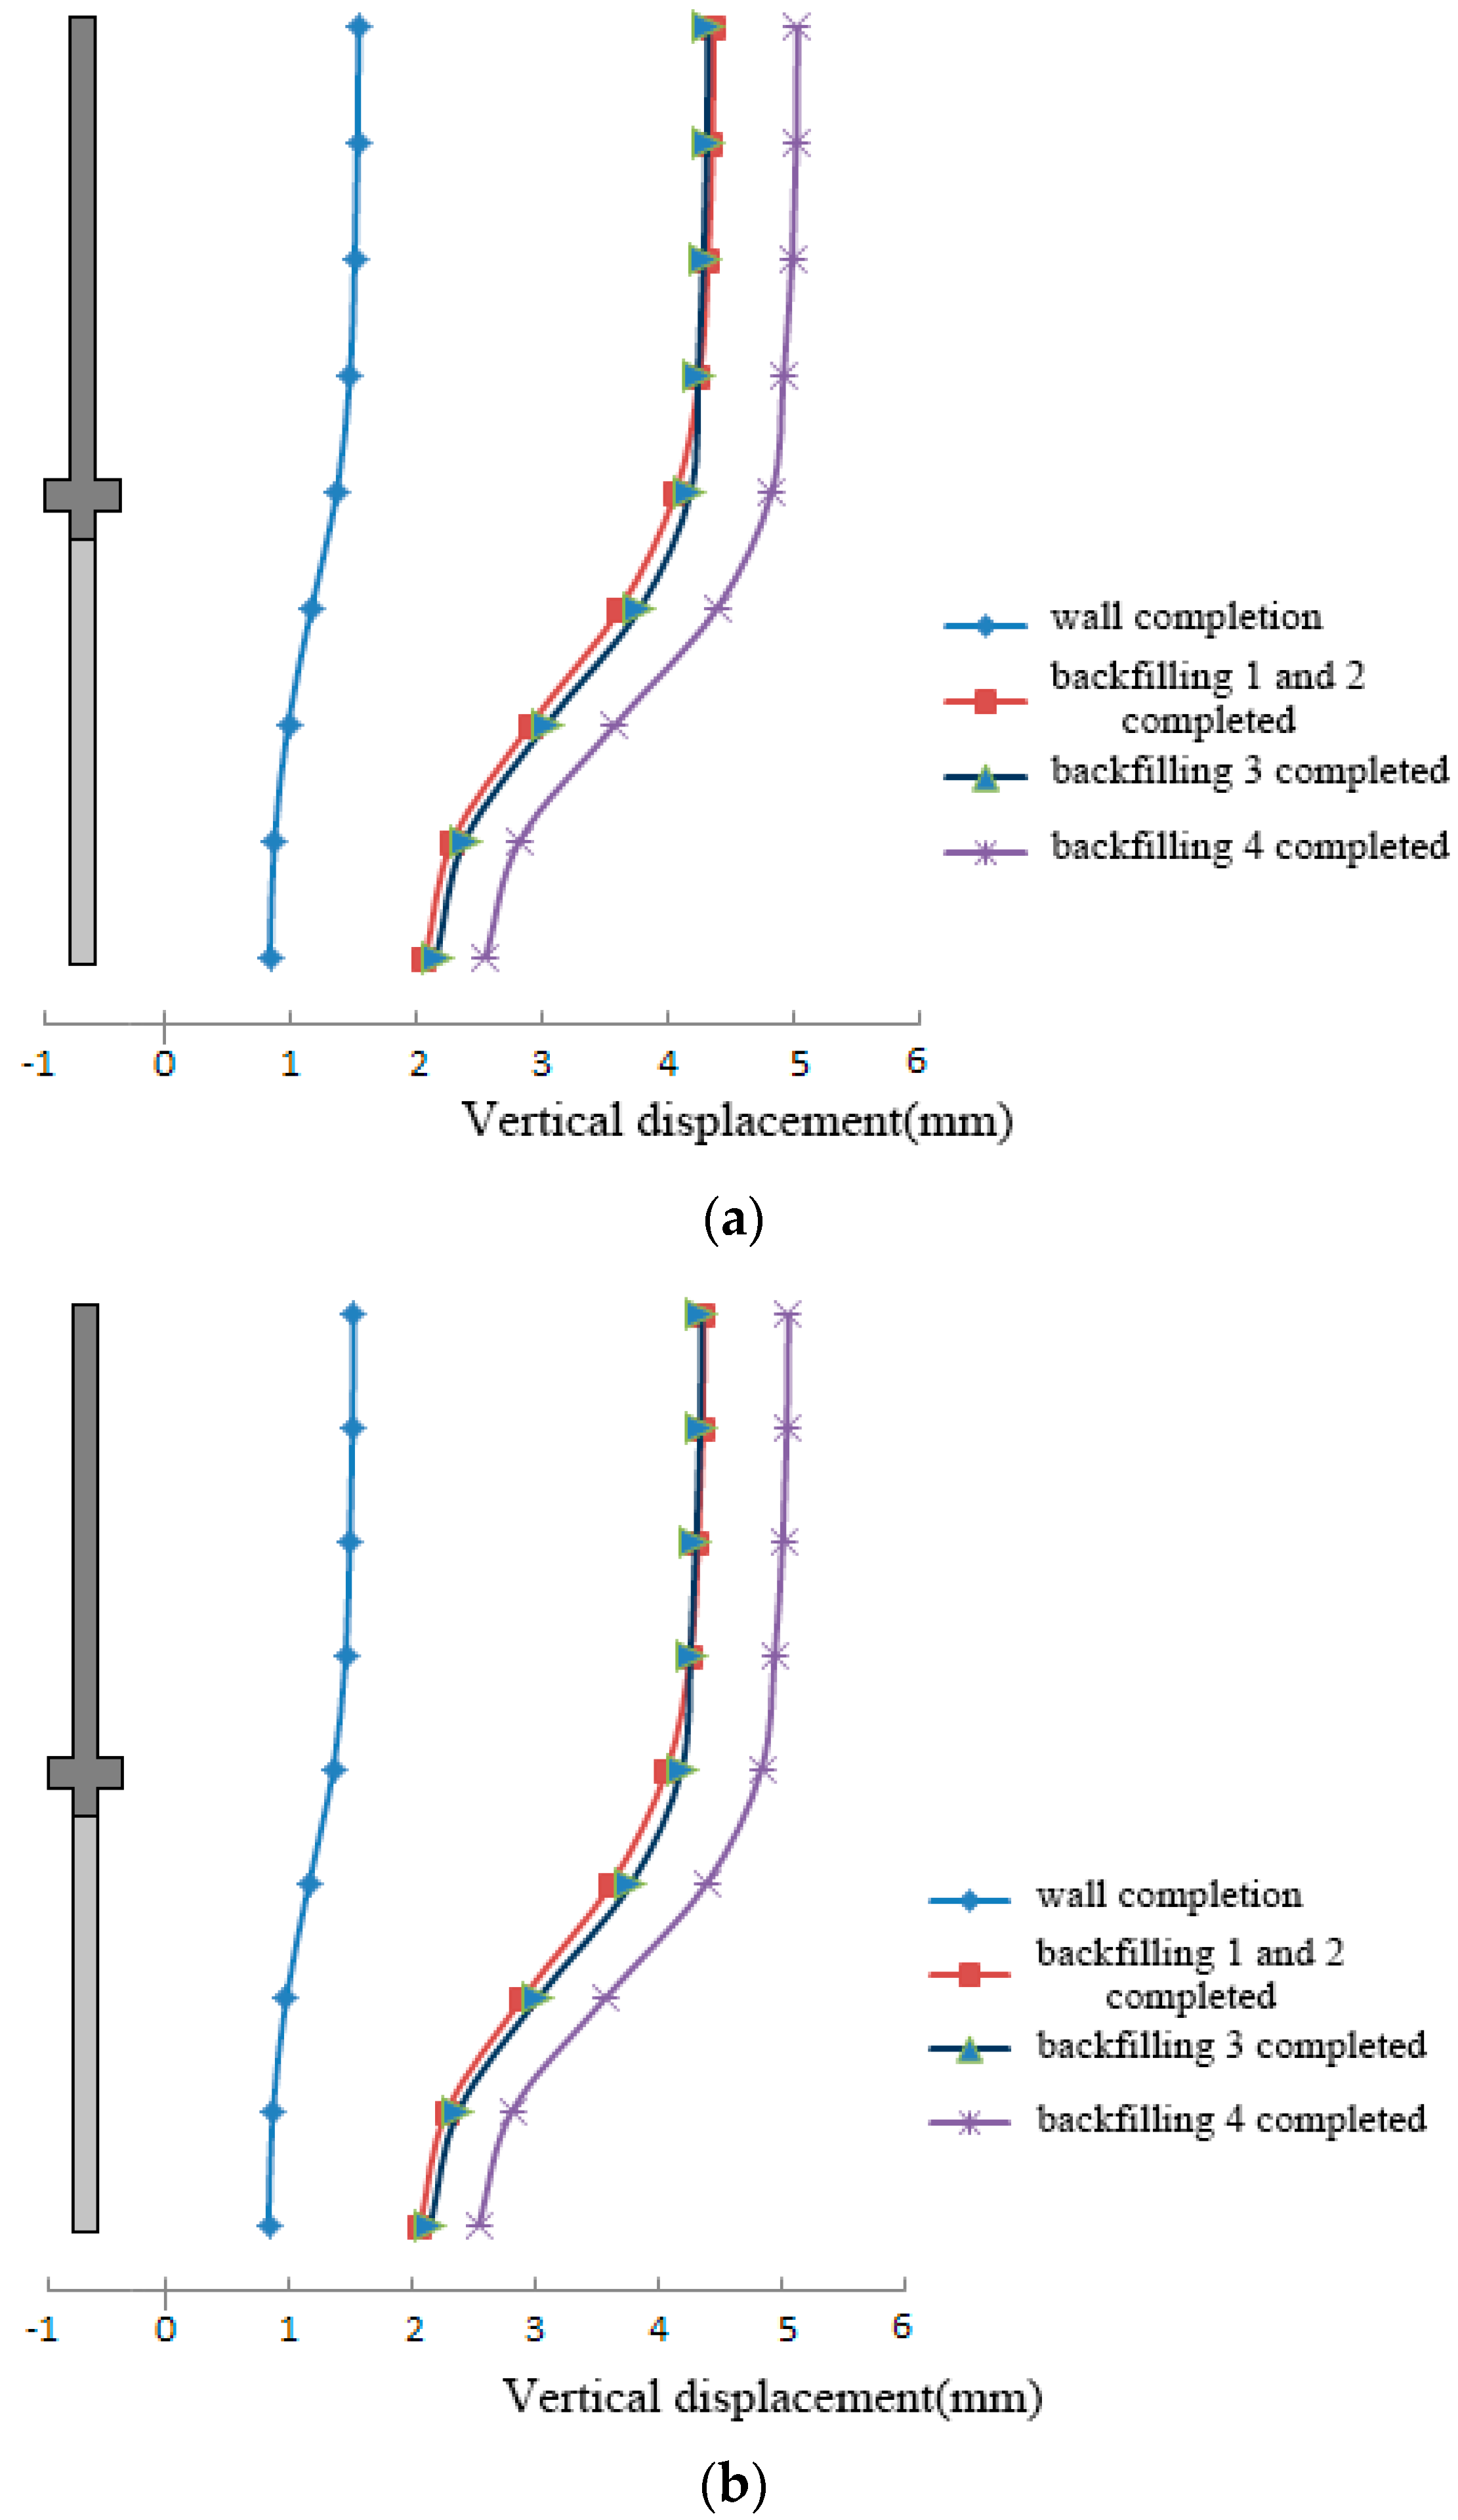
  • During the filling construction, due to the gravity of the backfill, the strata in the whole project area have settled, and the settlement at the bottom of the cut-off wall is 2.542 mm. The settlement characteristics of the rigid cut-off wall and plastic concrete cut-off wall are different. The settlement value of the rigid cut-off wall does not change along the wall height and its value is about 5.3 mm (the second) and 4.7 mm (the fifth and seventh). The settlement value of the plastic concrete wall shows a clear gradient along the elevation direction and its value changes evenly between 2.5–5.3 mm (the second) and 2.5–4.7 mm (the fifth and seventh).
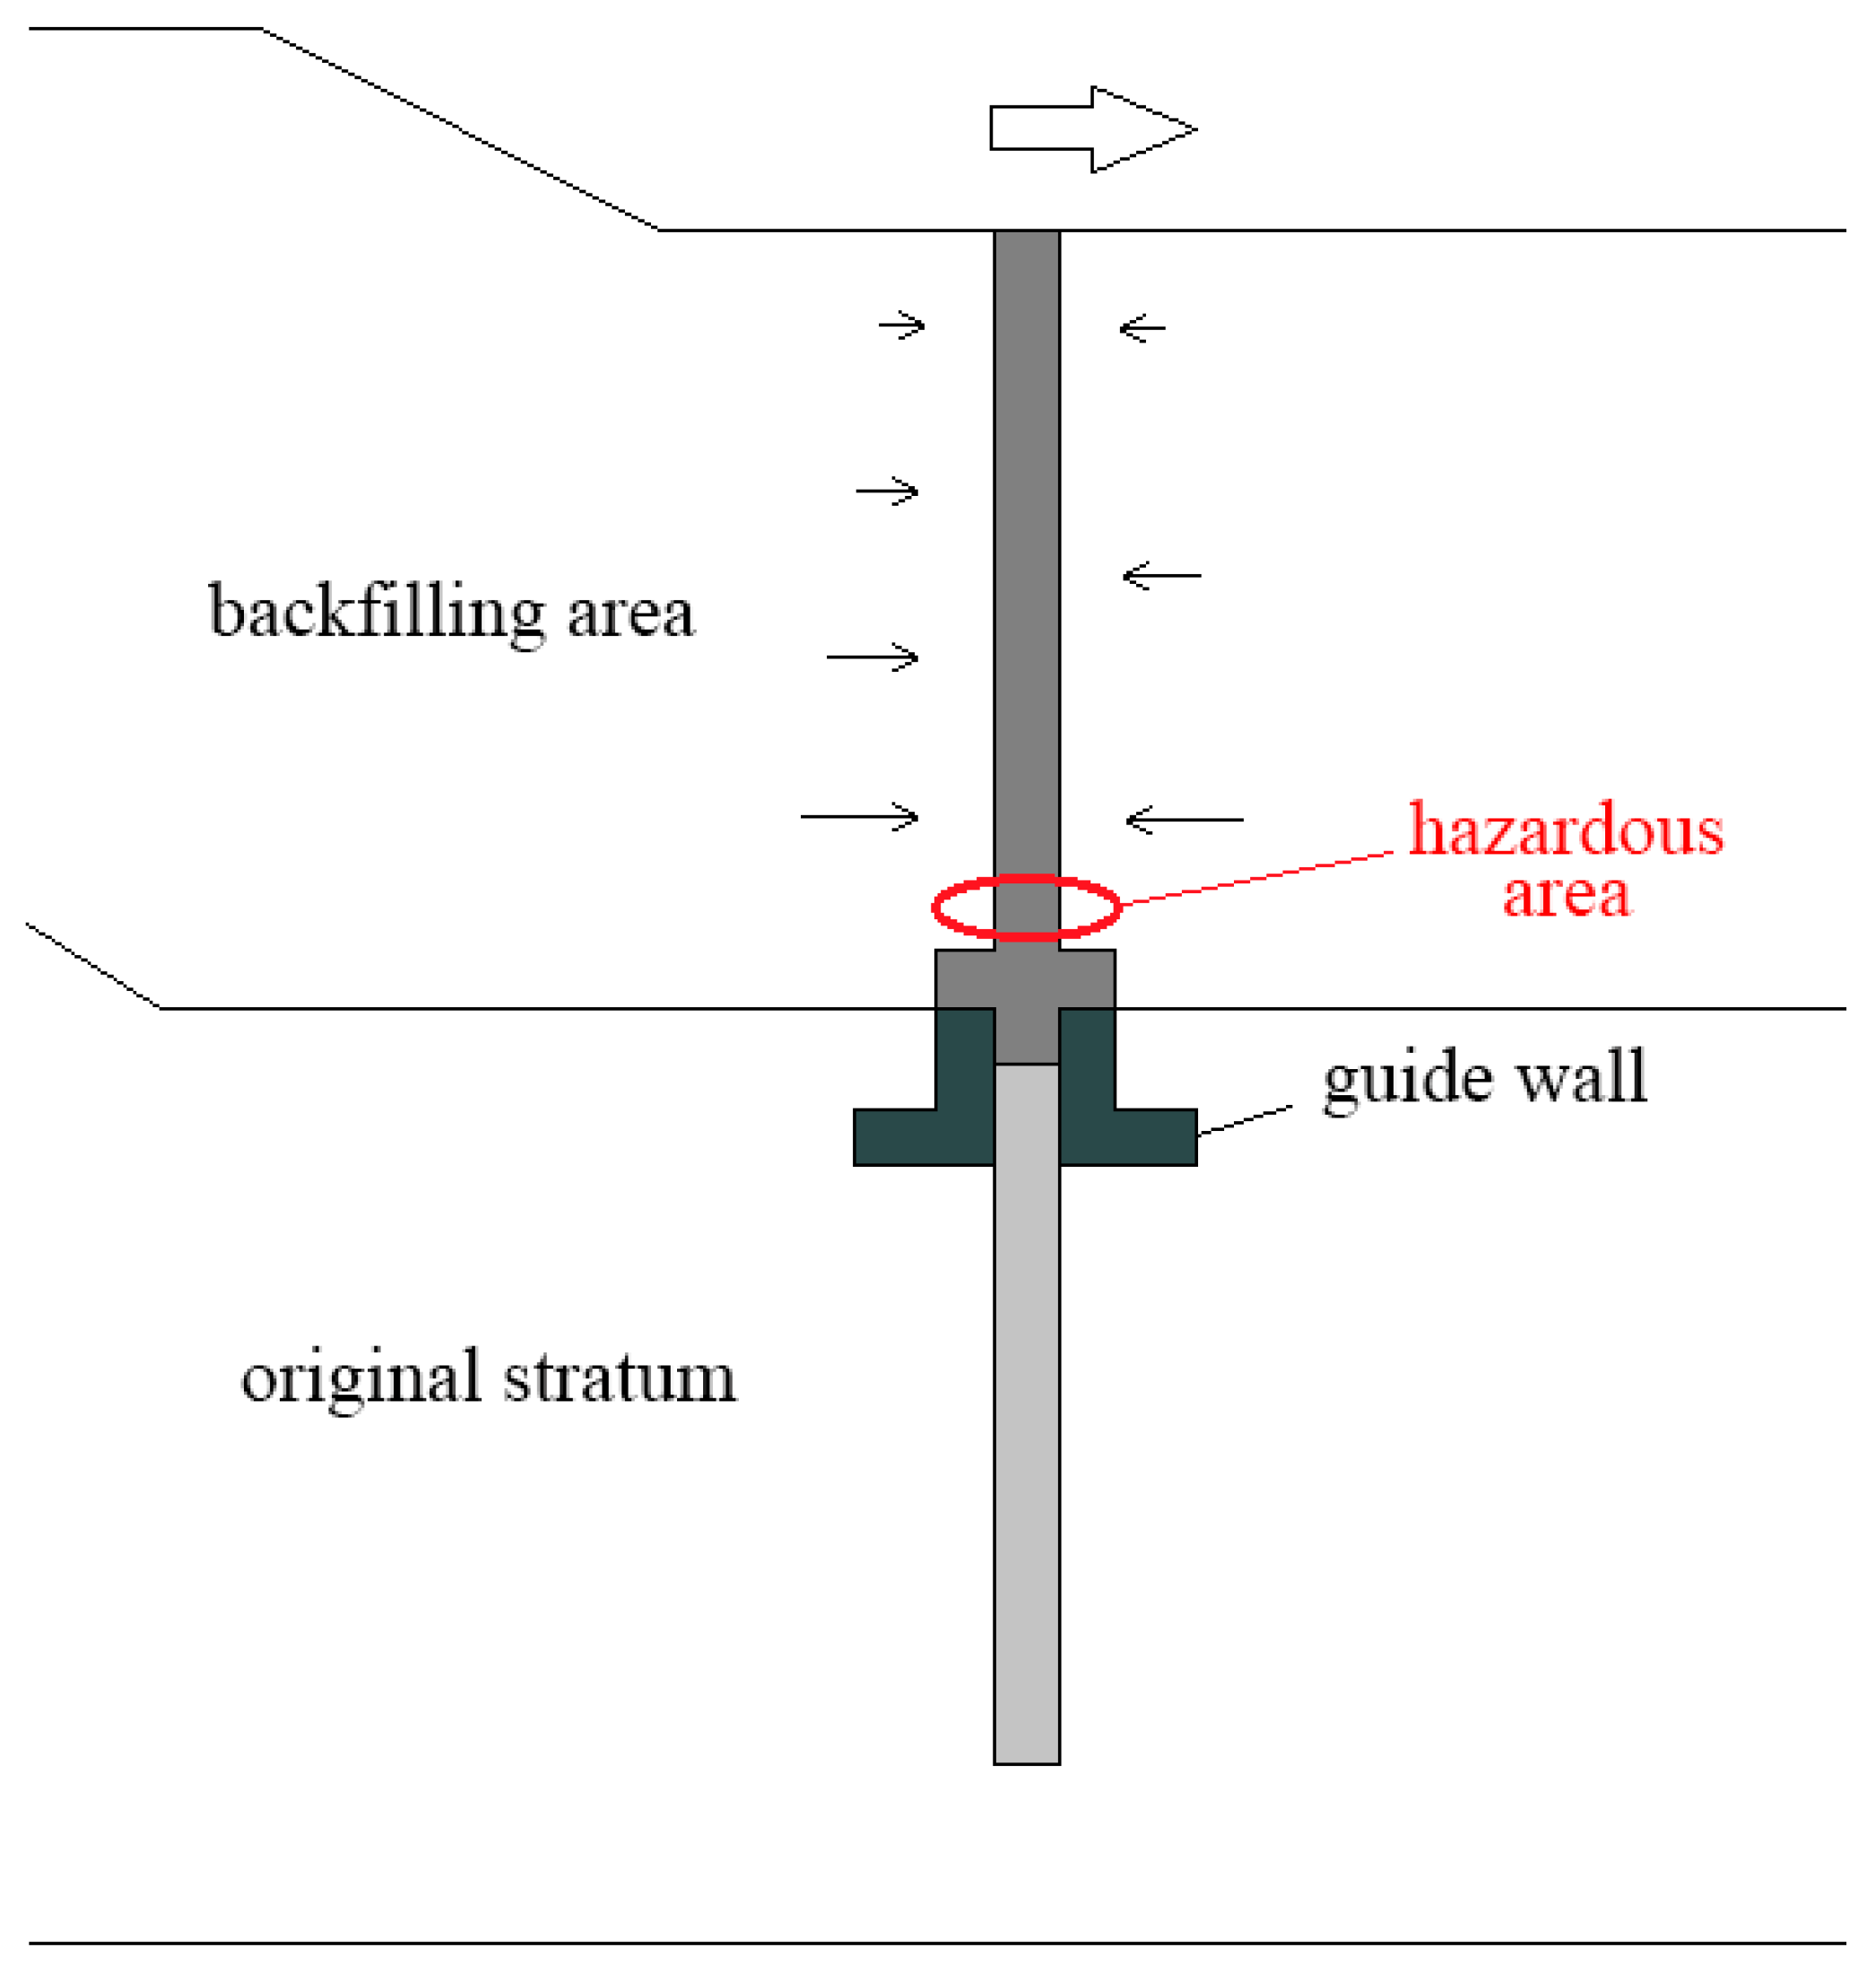
  • The horizontal displacement of the cut-off wall is mainly caused by the asymmetry of the fill on both sides. The fill pressure directly affects the horizontal displacement (inclination) of the reinforced concrete wall and then drives the horizontal displacement of the plastic concrete at the lower part through the structural involvement. The analysis shows that the guide wall has a great clamping effect on the deformation of the plastic cut-off wall, which makes the horizontal displacement between the rigid cut-off wall and the plastic cut-off wall interact and creates a nonlinear relationship. The vertical displacement of the cut-off wall is mainly caused by a compression deformation of the lower stratum under the action of structural gravity. On account of the elastic modulus of the plastic concrete wall material and the small surrounding stratum, the change is relatively obvious during the compression process, while the compression amount of the reinforced concrete wall itself is very small. Its settlement deformation is mainly the vertical movement of the rigid body with the settlement deformation of the plastic cut-off wall;
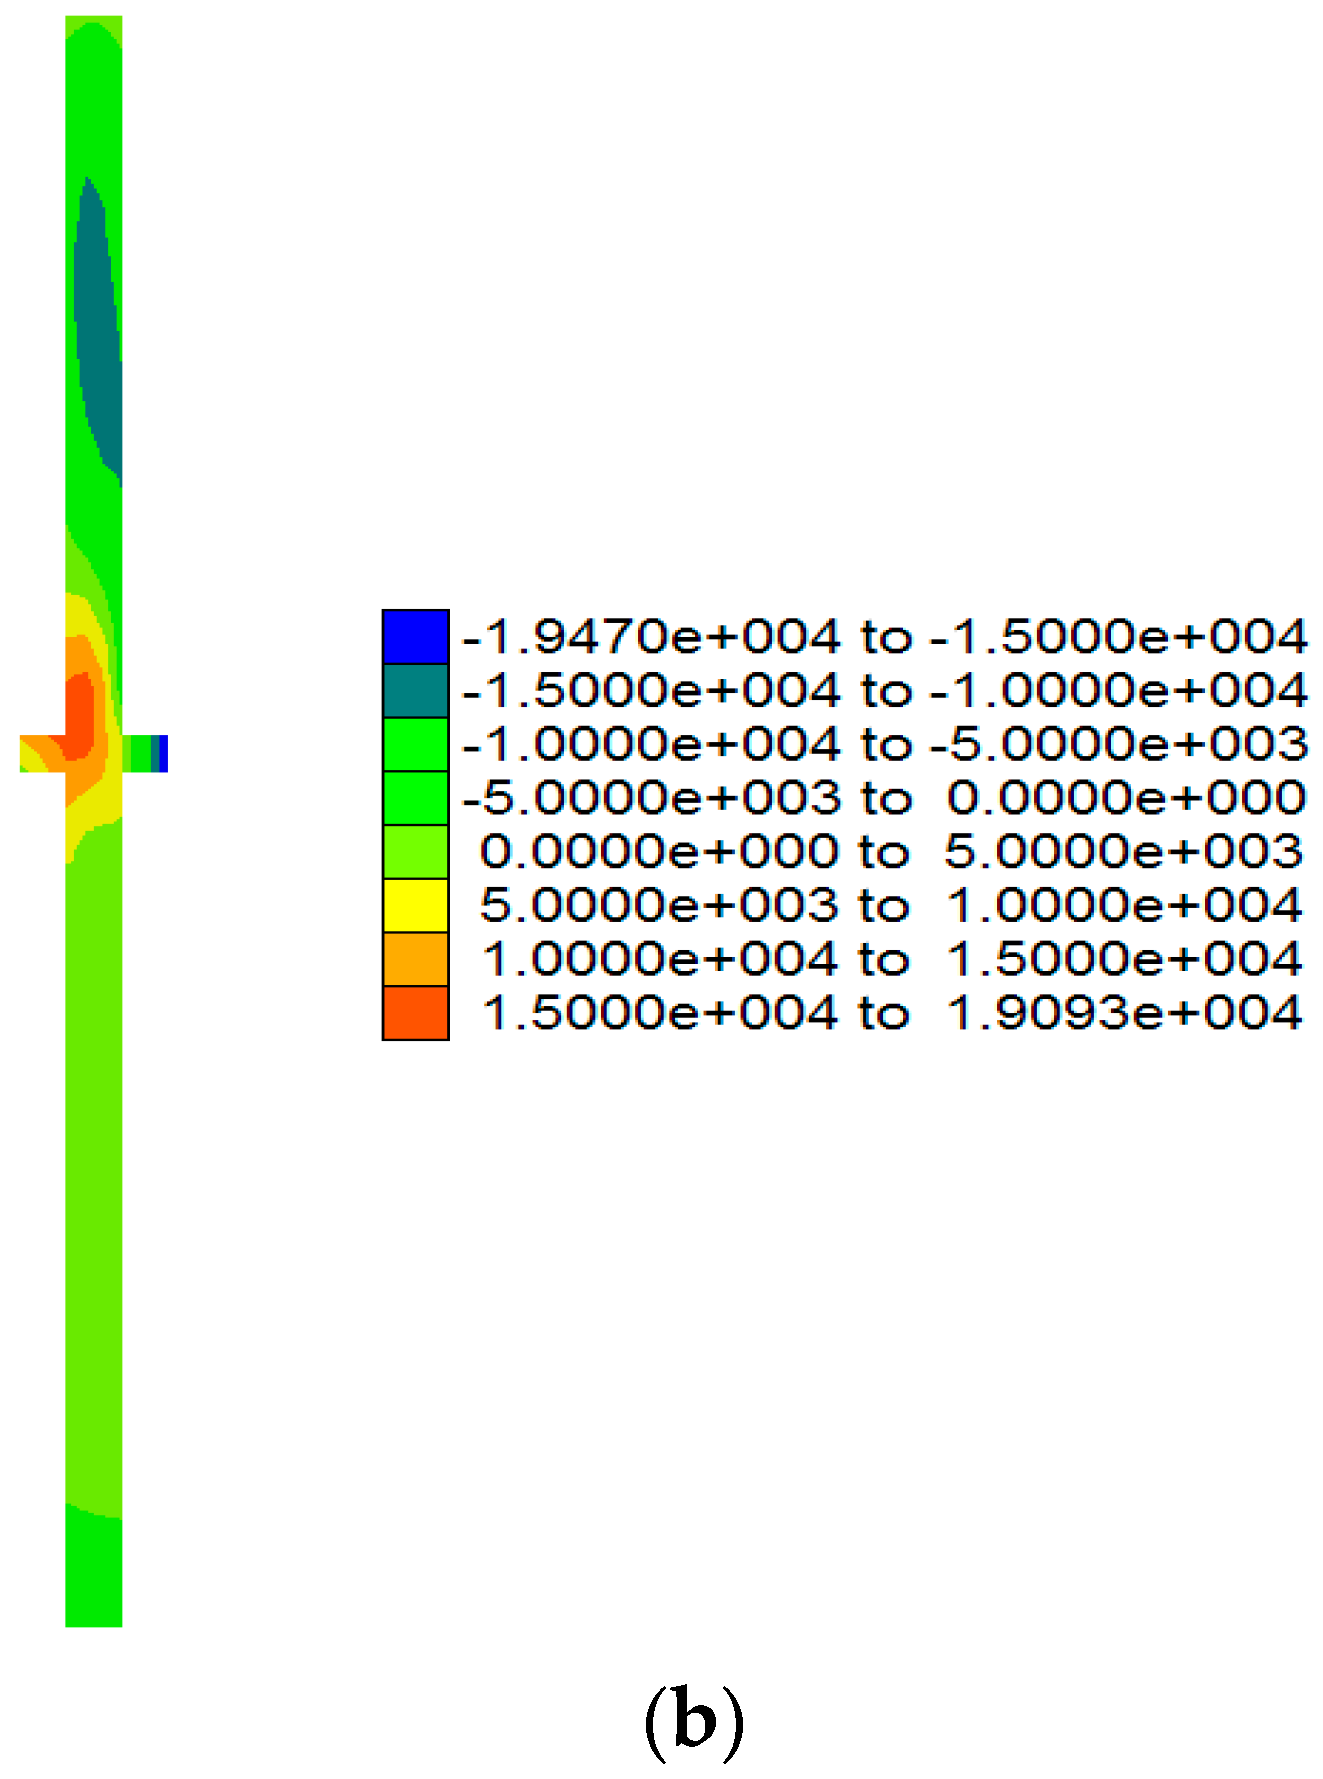
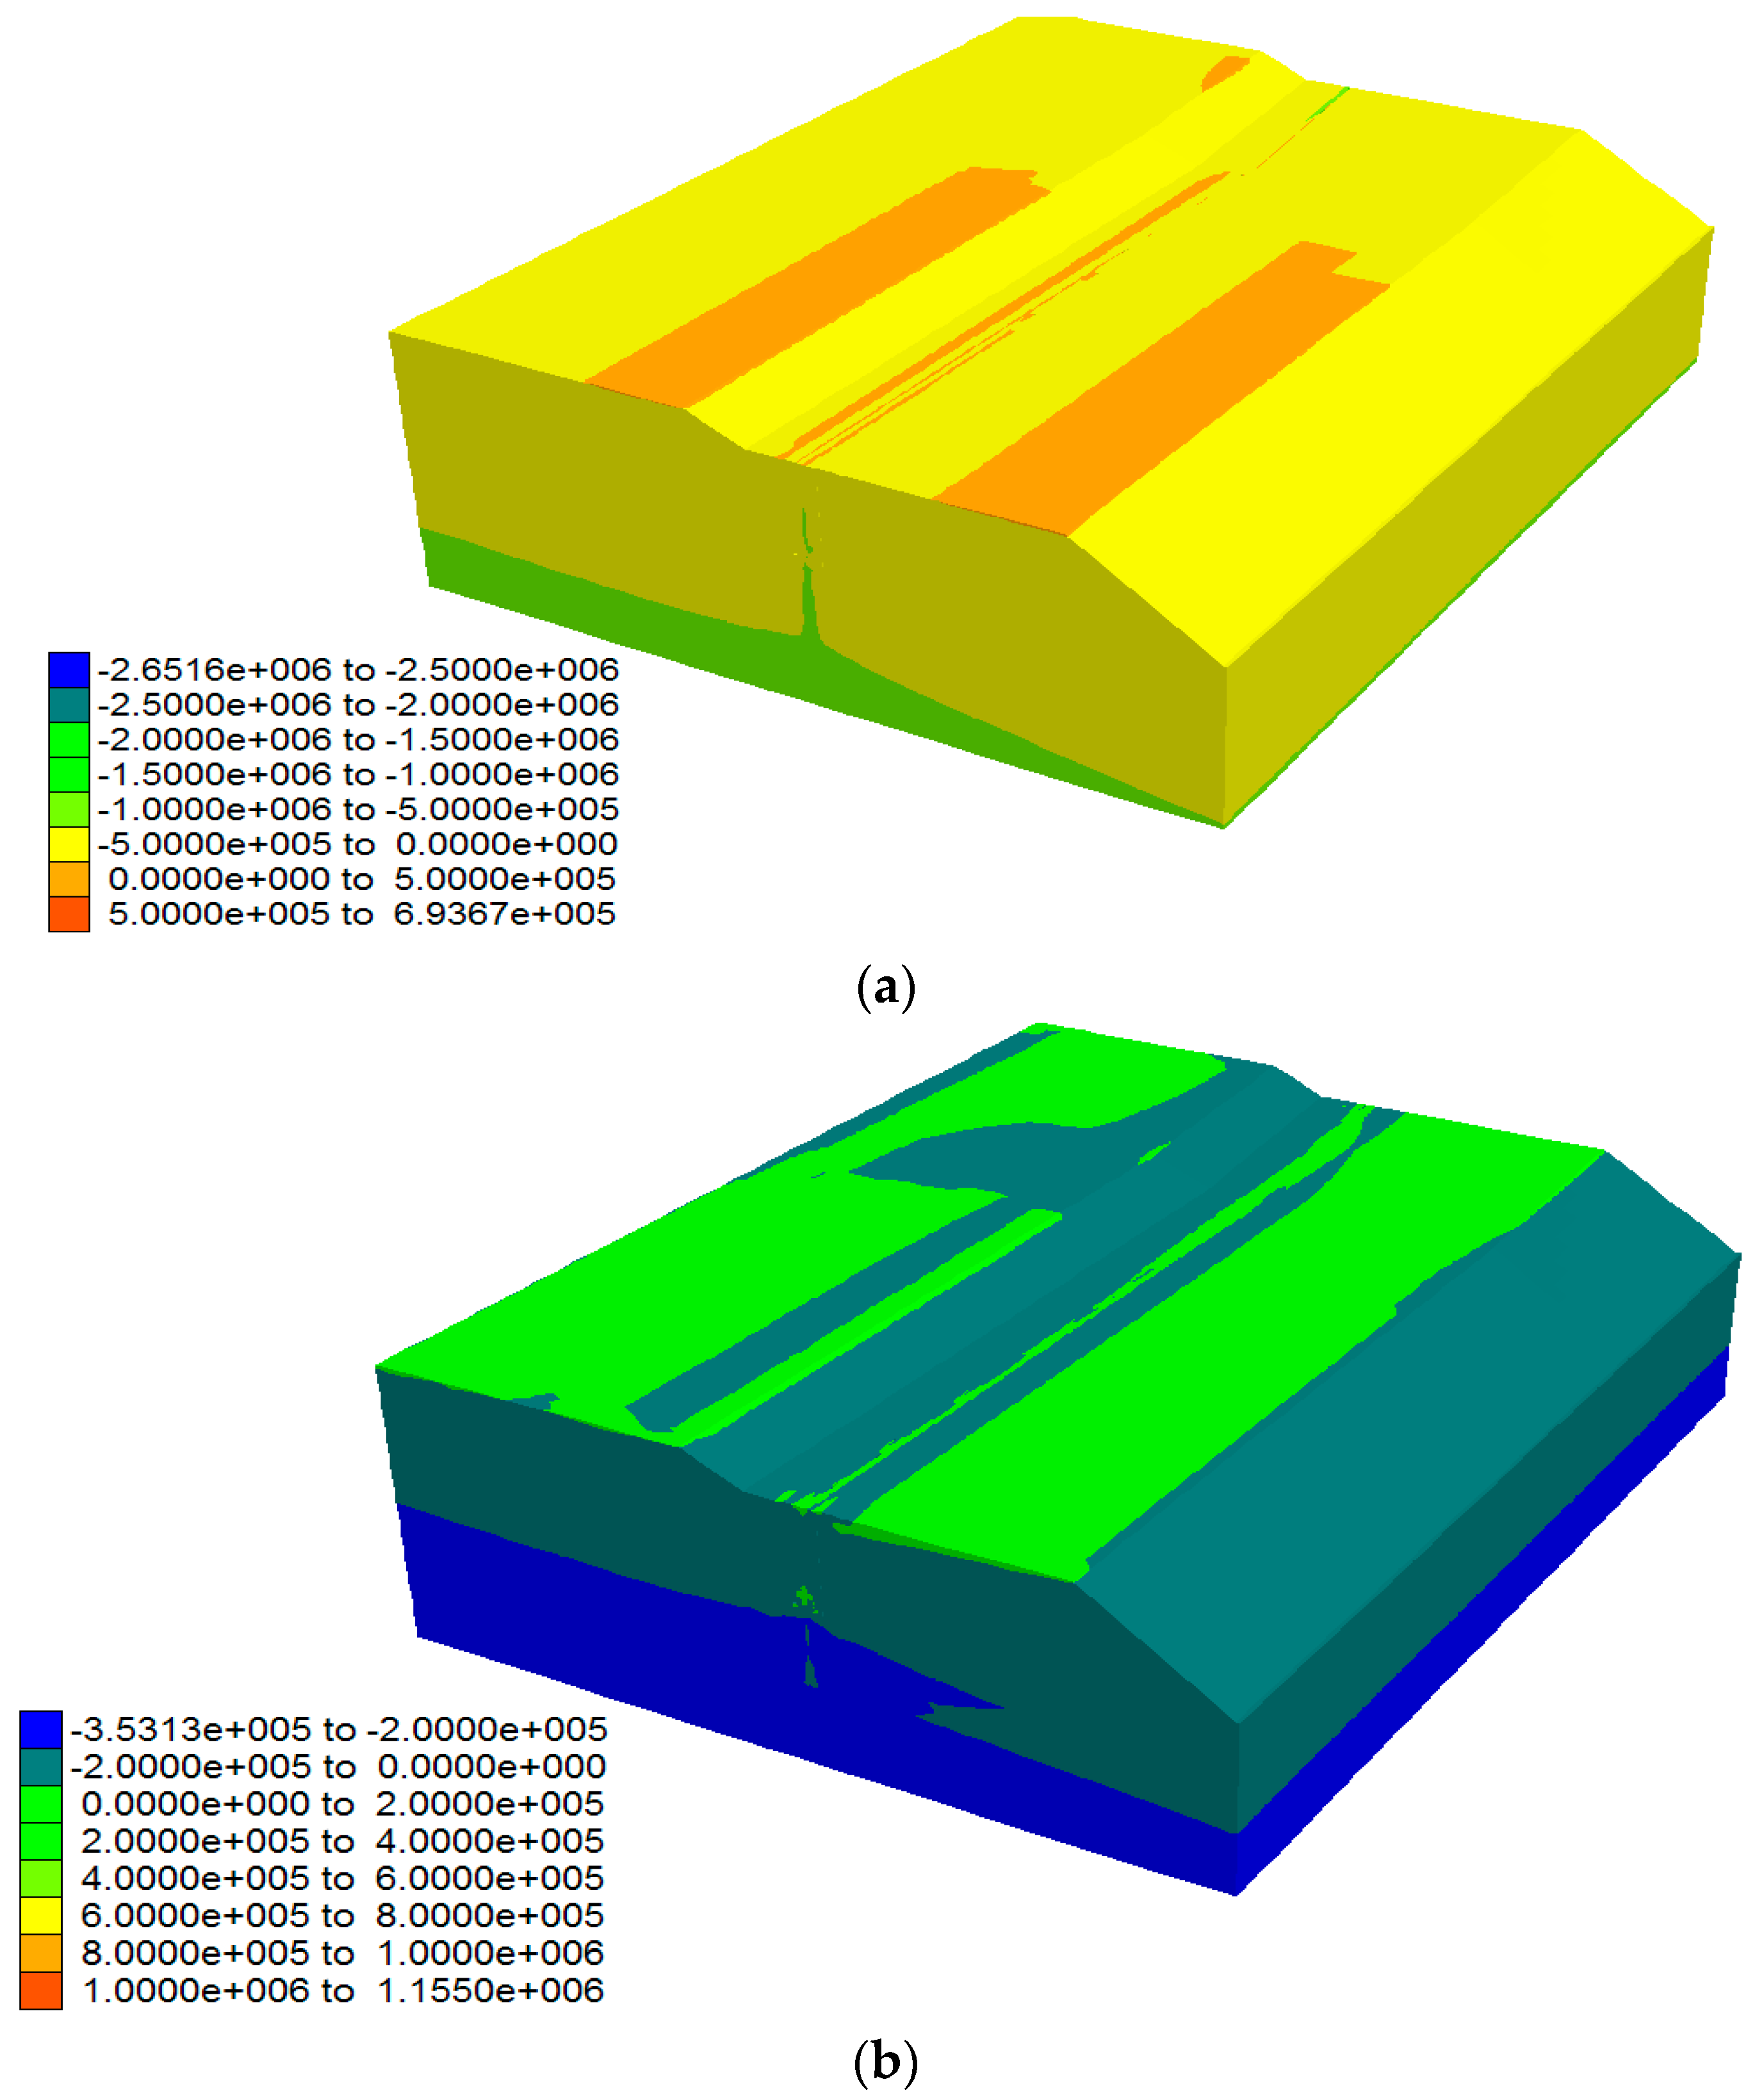
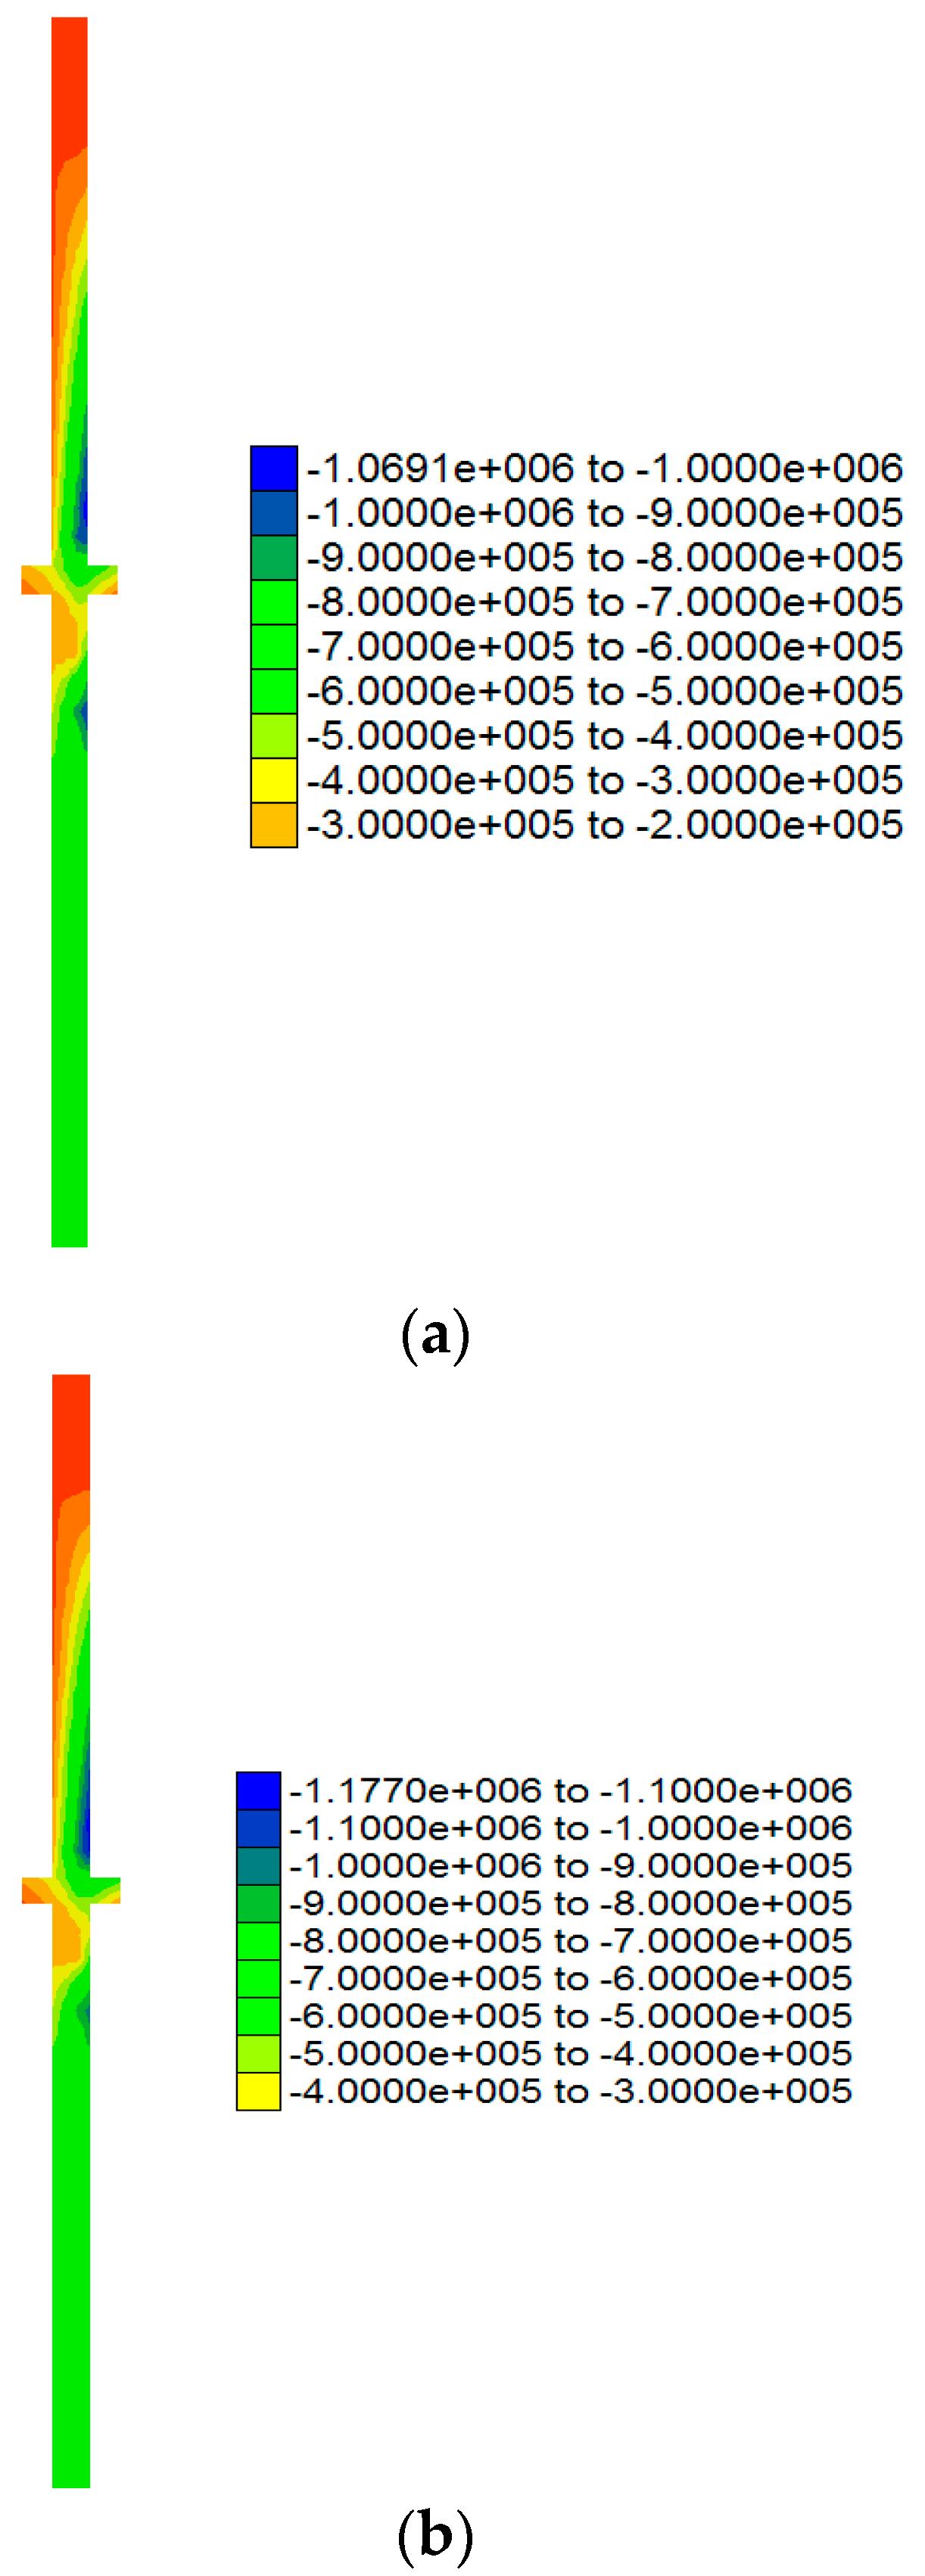
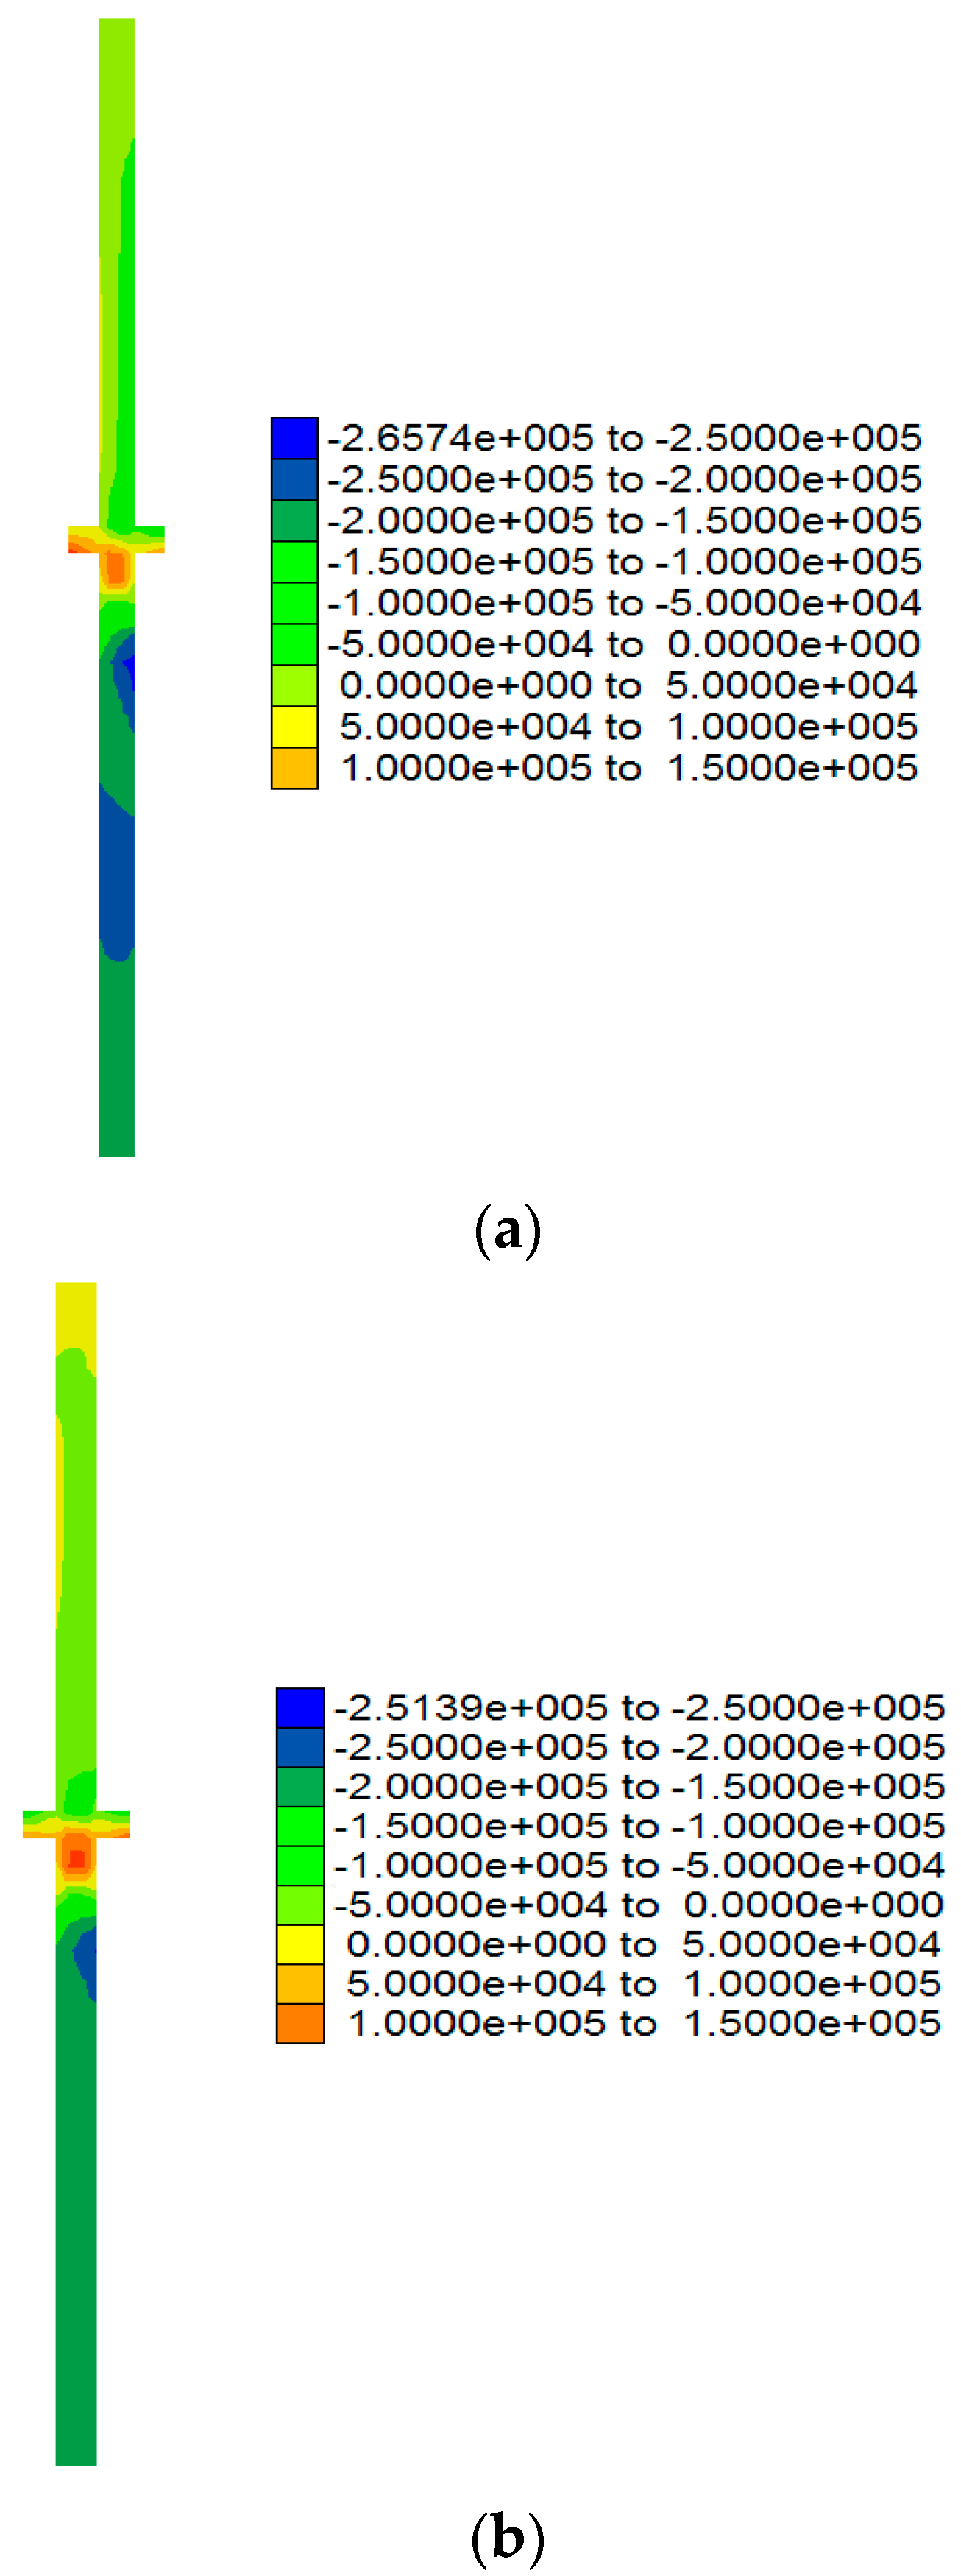
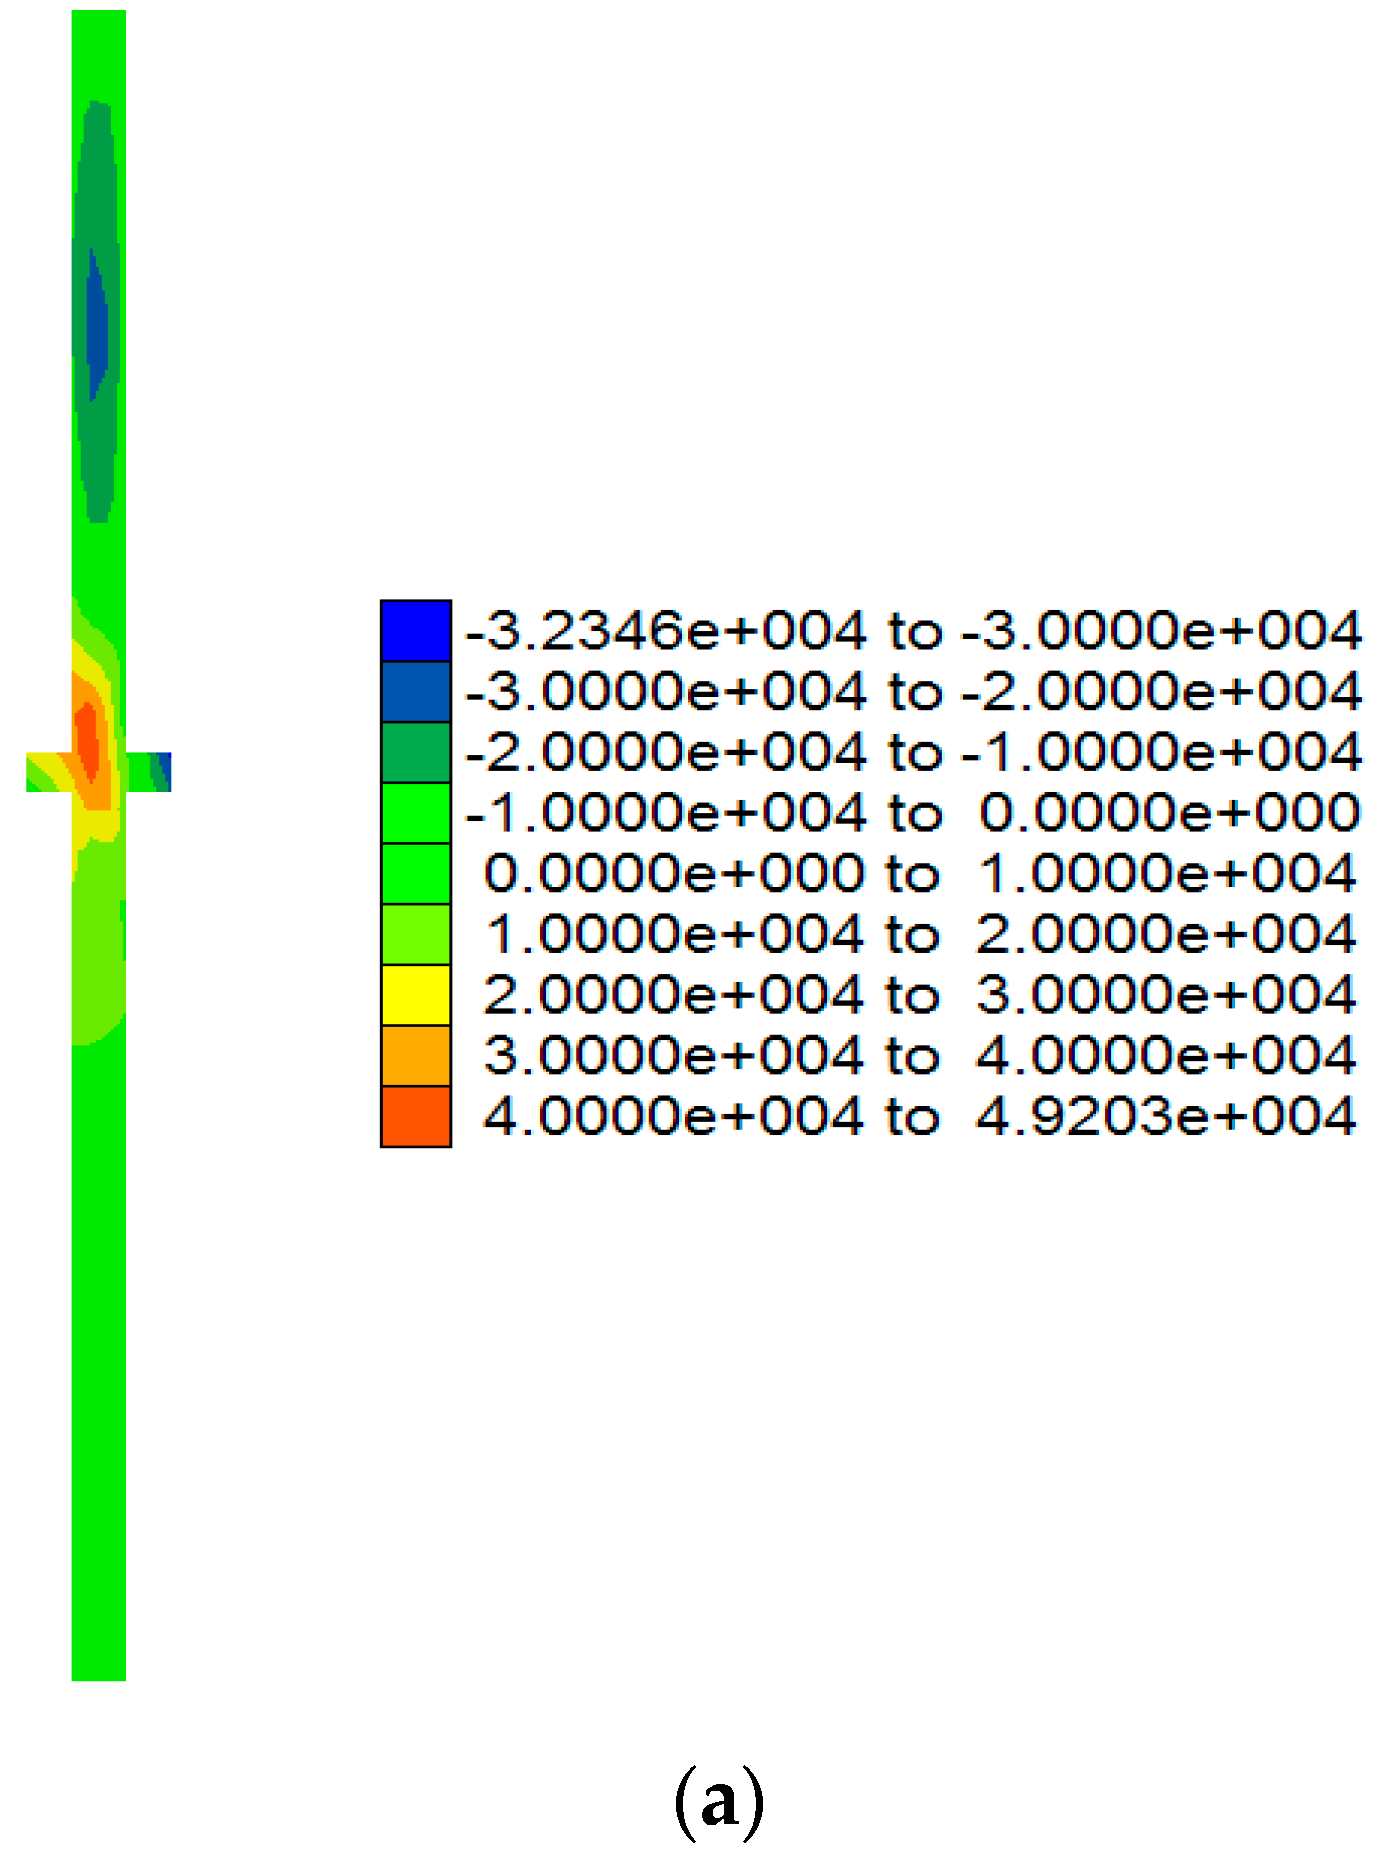
  • The stress on the cut-off wall decreases gradually from bottom to top, and its stress value is slightly larger than that of the surrounding strata. At the root of the rigid cu-toff wall, the compressive stress concentration occurs, with the maximum value between 1.75 MPa and 2.15 MPa. Due to the size of the structure, the maximum tensile stress of 0.237 MPa appears in the local area near the guide wall of the rigid cut-off wall, which will not endanger the rigid cut-off wall because of its small value. The maximum shear stress in the ZX plane of the cut-off wall is only about 0.236 MPa, which is located in the lower part of the rigid cut-off wall. The shear stress in the plastic cut-off wall is one order of magnitude lower. The maximum stress on the plastic cut-off wall is generally below 1.5 MPa, and it is compressive stress;
  • The maximum compressive stress occurs at the lower part of the rigid impervious wall, and the stress at the lower part of the first to the third is slightly greater than that of the wall at other locations. The local stress on the plastic impervious wall in this area is also greater than that of the plastic impervious wall in other areas, and their values are small. The maximum stress in the rigid impervious wall and the plastic impervious wall are 1.90–2.15 MPa and 1.00–1.12 MPa, respectively. The shear stress distribution in the ZX plane is also greater than that of the cut-off wall at other locations in the second and third walls, and the maximum shear stress is only about 0.236 MPa;
  • Apart from the small tensile stress at the connecting guide wall between the rigid cut-off wall and the plastic concrete cut-off wall, the cut-off wall is basically under pressure, especially the plastic cut-off wall. During the construction process, the deformation of the backfill soil on both sides of the wall is relatively large, while the deformation of the whole wall is in a relatively small range, without obvious differential deformation. Combined with the analysis of the stress state of the wall, it can be determined that the anti-seepage wall (rigid cut-off wall and plastic concrete cut-off wall) is stable and safe during the construction period.

Author Contributions

Methodology, A.L.; Software, A.L.; Validation, G.W.; Formal analysis, K.Y.; Investigation, G.W.; Resources, K.Y.; Writing—original draft, Y.S.; Writing—review & editing, Y.S.; Visualization, A.L.; Project administration, Y.S. and G.W. All authors have read and agreed to the published version of the manuscript.

Funding

This research received no external funding.

Data Availability Statement

All data that support the findings of this study are available from the corresponding author upon reasonable request.

Conflicts of Interest

The authors declare that they have no conflicts of interest to report regarding the present study.

References

  1. Shagapov, V.S.; Bashmakov, R.A.; Fokeeva, N.O. Fluid filtration in reservoirs subjected to hydraulic fracturing during transient well operation. J. Appl. Mech. Tech. Phys. 2022, 63, 474–483. [Google Scholar] [CrossRef]
  2. Yan, Z.; Wang, Y.; Fan, J.; Huang, Y.; He, Y. Study on key parameters of directional long borehole layout in high-gas working face. Shock. Vib. 2021, 2021, 1–14. [Google Scholar] [CrossRef]
  3. Almeida, F.; Venkatesh, P.; Gireesha, B.J. Time-Reliant Flow of Casson Nanofluid with Gyrotactic Microbes through the Contracting/Dilating Walls of the Microchannel Impelled by Chemical Reactions. Braz. J. Phys. 2022, 52, 137. [Google Scholar] [CrossRef]
  4. Inazumi, S.; Shishido, K.-i.; Soralump, S. Possibility of impervious coating for the geotechnical reuse of soil and solid waste. Environ. Geotech. 2021, 8, 324–333. [Google Scholar] [CrossRef]
  5. Baumstein, A.; Fendell, F. Strain-rate-free diffusion flames: Initiation, properties, and quenching. Combust. Sci. Technol. 1998, 132, 157–198. [Google Scholar] [CrossRef]
  6. Yu, Z.; Chen, S.; Wong, N.H. Temporal variation in the impact of urban morphology on outdoor air temperature in the tropics: A campus case study. Build. Environ. 2020, 181, 107132. [Google Scholar] [CrossRef]
  7. Sergent, P.; Prevot, G.; Mattarolo, G.; Brossard, J.; Morel, G.; Mar, F.; Benoit, M.; Ropert, F.; Kergadallan, X.; Trichet, J.-J.; et al. Adaptation of coastal structures to mean sea level rise. Houille Blanche-Rev. Int. LEau 2014, 6, 54–61. [Google Scholar] [CrossRef]
  8. Guo, C.; Sun, B.; Hu, D.; Wang, F.; Shi, M.; Li, X. A Field Experimental Study on the Diffusion Behavior of Expanding Polymer Grouting Material in Soil. Soil Mech. Found. Eng. 2019, 56, 171–177. [Google Scholar] [CrossRef]
  9. Shepherd, D.A.; Kotan, E.; Dehn, F. Plastic concrete for cut-off walls: A review. Constr. Build. Mater. 2020, 255, 119248. [Google Scholar] [CrossRef]
  10. Wen, L.; Chai, J.; Wang, X.; Xu, Z.; Qin, Y.; Li, Y. Behaviour of concrete-face rockfill dam on sand and gravel foundation. Proc. Inst. Civ. Eng.-Geotech. Eng. 2015, 168, 439–456. [Google Scholar] [CrossRef]
  11. Stahlhut, O.; Borchert, K.-M.; Voigt, R.E. Design and execution of a trough excavation pit in the Hamburg city center considering complex structural conditions. Bautechnik 2018, 95, 62–71. [Google Scholar] [CrossRef]
  12. Liu, B.; Jiang, X. Detection of anti-seepage effect of building stress wall structure based on transient Rayleigh surface wave method. Arab. J. Geosci. 2020, 13, 819. [Google Scholar] [CrossRef]
  13. Su, S.; Ding, J.; Zhang, T.; You, K.; Gan, Y.; Yan, M.; Feng, Z. Analysis of Factors Affecting Permeability of Cement-bentonite Mud Impervious Wall. In Proceedings of the 5th International Conference on Green Materials and Environmental Engineering (GMEE), Guangzhou, China, 27–29 December 2019; IOP Publishing: Bristol, UK, 2020. [Google Scholar]
  14. Zheng, T.; Zheng, X.; Sun, Q.; Wang, L.; Walther, M. Insights of variable permeability full-section wall for enhanced control of seawater intrusion and nitrate contamination in unconfined aquifers. J. Hydrol. 2020, 586, 124831. [Google Scholar] [CrossRef]
  15. Shah, Z.H.; Ullah, A.; Musa, A.; Vrinceanu, N.; Bou, S.F.; Iqbal, S.; Deebani, W.; Shah, Z.; Ullah, A.; Musa, A.; et al. Entropy optimization and thermal behavior of a porous system with considering hybrid nanofluid. Front. Phys. 2022, 10, 929463. [Google Scholar] [CrossRef]
  16. Chen, K.; Guo, S.; Wang, J.; Qin, P.; He, S.; Sun, S.; Naeini, M.R. Evaluation of GloFAS-Seasonal Forecasts for Cascade Reservoir Impoundment Operation in the Upper Yangtze River. Water 2019, 11, 2539. [Google Scholar] [CrossRef] [Green Version]
  17. He, S.; Guo, S.; Chen, K.; Deng, L.; Liao, Z.; Xiong, F.; Yin, J. Optimal impoundment operation for cascade reservoirs coupling parallel dynamic programming with importance sampling and successive approximation. Adv. Water Resour. 2019, 131, 103375. [Google Scholar] [CrossRef]
  18. Arifeen, S.U.; Haq, S.; Ghafoor, A.; Ullah, A.; Kumam, P.; Chaipanya, P. Numerical solutions of higher order boundary value problems via wavelet approach. Adv. Differ. Equ. 2021, 2021, 347. [Google Scholar] [CrossRef]
  19. Doghozlou, H.M.; Goodarzi, M.; Renani, H.R.; Salmi, E.F. Analysis of spalling failure in marble rock slope: A case study of Neyriz marble mine, Iran. Environ. Earth Sci. 2016, 75, 1478. [Google Scholar] [CrossRef]
  20. Kumar, C.V.; Vardhan, H.; Murthy, C.S.N.; Karmakar, N.C. Estimating rock properties using sound signal dominant frequencies during diamond core drilling operations. J. Rock Mech. Geotech. Eng. 2019, 11, 850–859. [Google Scholar] [CrossRef]
  21. Lawal, A.I.; Kwon, S. Application of artificial intelligence to rock mechanics: An overview. J. Rock Mech. Geotech. Eng. 2021, 13, 248–266. [Google Scholar] [CrossRef]
  22. Shah, Z.; Kumam, P.; Ullah, A.; Khan, S.N.; Selim, M.M. Mesoscopic Simulation for Magnetized Nanofluid Flow Within a Permeable 3D Tank. IEEE Access 2021, 9, 135234–135244. [Google Scholar] [CrossRef]
  23. Moayedi, H.; Mosallanezhad, M.; Rashid, A.S.A.; Jusoh, W.A.W.; Muazu, M.A. A systematic review and meta-analysis of artificial neural network application in geotechnical engineering: Theory and applications. Neural Comput. Appl. 2020, 32, 495–518. [Google Scholar] [CrossRef]
  24. Nie, W.; Guo, W. Applications of Chapman-Richards model to geotechnical engineering. J. Rock Mech. Geotech. Eng. 2019, 11, 1286–1292. [Google Scholar] [CrossRef]
  25. Vlasyuk, A.; Kuzlo, M.; Zhukovska, N.; Zhukovskyy, V.; Tarasyuk, N. Modeling of Soil Basis of Headed Hydrotechnical Structure’s Deformations Under Action Of Filtration Water Flow. In Proceedings of the 10th International Conference on Advanced Computer Information Technologies (ACIT), Deggendorf, Germany, 16–18 September 2020; pp. 18–22. [Google Scholar]
  26. ZeinEldin, R.A.; Ullah, A.; Khalifa, H.A.E.-W.; Ayaz, M. Analytical Study of the Energy Loss Reduction during Three-Dimensional Engine Oil-Based Hybrid Nanofluid Flow by Using Cattaneo–Christov Model. Symmetry 2023, 15, 166. [Google Scholar] [CrossRef]
  27. Bhowmik, R.; Shahu, J.; Datta, M. Finite-Element Modeling of Geogrids in Trenches under Inclined Pull. Int. J. Geomech. 2020, 20, 04020129. [Google Scholar] [CrossRef]
  28. Bodart, O.; Cayol, V.; Dabaghi, F.; Koko, J. An inverse problem in an elastic domain with a crack: A fictitious domain approach. Comput. Geosci. 2022, 26, 423–435. [Google Scholar] [CrossRef]
  29. Shi, L.; Wang, H.; Bai, B.; Li, X. Improved finite element-based limit equilibrium method for slope stability analysis by considering nonlinear strength criteria and its application in assessing the anchoring effect. Int. J. Numer. Anal. Methods Geomech. 2019, 43, 578–598. [Google Scholar] [CrossRef]
  30. Yan, G.; Hao, H. Digital Image Finite Element Analysis of Geotechnical Engineering Materials. Integr. Ferroelectr. 2022, 227, 58–73. [Google Scholar] [CrossRef]
  31. Yu, P.; Hao, Q.; Wang, X.; Yu, Y.; Zhan, Z. Mixed Integration Scheme for Embedded Discontinuous Interfaces by Extended Finite Element Method. Front. Earth Sci. 2022, 9, 1404. [Google Scholar] [CrossRef]
  32. Rizk, D.; Ullah, A.; Ikramullah; Elattar, S.; Alharbi, K.A.M.; Sohail, M.; Khan, R.; Khan, A.; Mlaiki, N. Impact of the KKL Correlation Model on the Activation of Thermal Energy for the Hybrid Nanofluid (GO plus ZnO plus Water) Flow through Permeable Vertically Rotating Surface. Energies 2022, 15, 2872. [Google Scholar] [CrossRef]
  33. Lu, M.; Zhang, Q.; Jing, H.; Wang, Y.; Li, C. Analytical solutions for consolidation of composite ground improved by composite columns with circular and non-circular cross sections. Eur. J. Environ. Civ. Eng. 2022, 26, 2780–2796. [Google Scholar] [CrossRef]
  34. Zhu, J.; Dai, G.; Xu, J.; Zhang, Z. Numerical analysis of wall deformation of impervious material based on polyvinyl alcohol modification. In Proceedings of the 1st International Conference on Environment Prevention and Pollution Control Technology (EPPCT), Tokyo, Japan, 9–11 November 2018; Tokyo University of Science: Shinjuku, Tokyo, 2018. [Google Scholar]
  35. Fu, Z.Q.; Su, H.Z.; Wen, Z.P. Multi-scale numerical analysis for linear elastic behavior of clay concrete. Int. J. Solids Struct. 2020, 203, 23–45. [Google Scholar] [CrossRef]
  36. Han, Y.; Ke, C.F. Study on Cut-off Effect of Xiongjiagang Earth-Rock Dam Based on Cut-off Wall Schemes. In Proceedings of the International Symposium on Multi-Field Coupling Theory of Rock and Soil Media and Its Applications, Chengdu, China, 10–11 October 2010; pp. 548–552. [Google Scholar]
  37. Ma, X.; Zheng, M.; Liang, G.; Xu, C.; Mou, R. Analysis of elastic modulus impact on stress and deformation of concrete cutoff wall in dam body. J. Hydroelectr. Eng. 2013, 32, 230–236. [Google Scholar]
  38. Ding, P.; Xiao, L.; Li, W.; Chen, H. Design of Dewatering Plans for Deep Excavation Pit in Thick Permeable Strata. J. Yangtze River Sci. Res. Inst. 2012, 29, 46–50. [Google Scholar]
  39. Ren, X.; Gao, D.; Gao, Q.; Shen, T. Deformation and Stress Analysis of Extra-deep Concrete Cut-off Wall for Earth-rock Dam. J. Yangtze River Sci. Res. Inst. 2018, 35, 120–124. [Google Scholar]
  40. Wang, L.; Li, R.; Ye, Y. Analysis of dangerous hydraulic conditions of hydraulic fill dam and impervious wall under impact of tidal action. J. Hohai Univ. Nat. Sci. 2012, 40, 426–431. [Google Scholar]
  41. Chen, X.; Wen, Z.; Hu, J.; Min, Y.; Liang, X.; Sun, R.; Li, R. Application of Numerical Simulation and Analytical Methods to Estimate Hydraulic Parameters of Foundation Pit in Hydropower Stations. Earth Sci. 2016, 41, 701–710. [Google Scholar]
  42. Liang, Y.; Mao, R.; Wang, Y. Numerical simulation of underground wall for retaining water at dam foundation of Longkaikou hydropower station. Hydro-Sci. Eng. 2018, 57–64. Available online: http://slsy.nhri.cn/fileSLSYGCXB/journal/article/slsygcxb/2018/3/PDF/201803008.pdf (accessed on 11 February 2023).
  43. Li, M.; Zhou, Z.; Yang, Y.; Xin, Y.; Liu, Y.; Guo, S.; Zhu, Y.; Jin, D. Immersion assessment and control of the right bank of Xingan Navigation and Power Junction. J. Hohai Univ. Nat. Sci. 2018, 46, 203–210. [Google Scholar]
  44. Arai, Y.; Kusakabe, O.; Murata, O.; Konishi, S. A numerical study on ground displacement and stress during and after the installation of deep circular diaphragm walls and soil excavation. Comput. Geotech. 2008, 35, 791–807. [Google Scholar] [CrossRef]
  45. Qiu, M.; Yang, G.; Shen, Q.; Duan, J.; Zhang, P. Deformation Characteristics of Foundation Pit Excavation under the Combined Action of Diaphragm Wall and Impervious Curtain in Water-rich Sandy Stratum. J. Yangtze River Sci. Res. Inst. 2020, 37, 81–88, 95. [Google Scholar]
  46. Yanhua, X.I.A.; Shiwei, B.A.I.; Chao, Z. Seepage deformation evaluation of foundation pit excavation of power-house of a hydro-project. Rock Soil Mech. 2007, 28, 2435–2439. [Google Scholar]
  47. Schaefer, R.; Triantafyllidis, T. The influence of the construction process on the deformation behaviour of diaphragm walls in soft clayey ground. Int. J. Numer. Anal. Methods Geomech. 2006, 30, 563–576. [Google Scholar] [CrossRef]
  48. Lu, M.M.; Xie, K.H.; Wang, S.Y.; Li, C.X. Analytical Solution for the Consolidation of a Composite Foundation Reinforced by an Impervious Column with an Arbitrary Stress Increment. Int. J. Geomech. 2013, 13, 33–40. [Google Scholar] [CrossRef] [Green Version]
Figure 1. Location layout of monitoring sections and selection of numerical simulation sections.
Water 15 00993 g001
Figure 2. Schematic diagram of the cut-off wall structure. (a) Schematic diagram of the interface between reinforced concrete wall and plastic concrete wall. (b) Schematic diagram of joints between rigid cut-off walls.
Water 15 00993 g002
Figure 3. Step-by-step construction of rigid cut-off walls. (a) Construction of the lower wall. (b) Construction of the upper wall.
Water 15 00993 g003aWater 15 00993 g003b
Figure 4. Monitoring 1, 2 section model. (a) Grid division of monitoring section model 1 and 2. (b) Monitoring the relationship between the backfill soil and cut-off wall at sections 1 and 2.
Water 15 00993 g004
Figure 5. Three-dimensional cut-off wall model. (a) Meshing of 3D model. (b) Mesh division of cutoff wall.
Water 15 00993 g005
Figure 6. Cloud map of deformation law in analysis area of cut-off wall. (a)Analysis Domain Horizontal Displacement Contour. (b)Analysis domain vertical displacement cloud map. (c) Analyzing Domain and Displacement Contour.
Water 15 00993 g006aWater 15 00993 g006b
Figure 7. Horizontal displacement nephogram of monitoring surface. (a) 1. (b) 2.
Water 15 00993 g007
Figure 8. Cloud diagram of vertical displacement of monitoring surface. (a) 1. (b) 2.
Water 15 00993 g008
Figure 9. Monitoring surface and displacement nephogram. (a) 1. (b) 2.
Water 15 00993 g009
Figure 10. The overall deformation of cut-off wall. (a) horizontal displacement of cut-off wall. (b) vertical displacement of cut-off wall.
Water 15 00993 g010aWater 15 00993 g010b
Figure 11. Horizontal displacement change of cut-off wall at monitoring section. (a) Monitoring 1 section cut-off wall. (b) Monitoring 2 section cut-off wall.
Water 15 00993 g011
Figure 12. Vertical displacement variation of cut-off wall. (a) Monitoring 1 section cut-off wall. (b) Monitoring section 2 cut-off wall.
Water 15 00993 g012
Figure 13. Horizontal displacement of wall near corner.
Water 15 00993 g013
Figure 14. Schematic diagram of maximum stress area of cut-off wall.
Water 15 00993 g014
Figure 15. Stress distribution in the analysis area. (a) Nephogram of maximum principal stress. (b) Minimum principal stress nephogram. (c) YZ in-plane shear stress nephogram.
Water 15 00993 g015aWater 15 00993 g015b
Figure 16. Comparison of maximum principal stress of monitoring surface. (a) 1. (b) 2.
Water 15 00993 g016
Figure 17. Comparison of minimum principal stress of monitoring surface. (a) 1. (b) 2.
Water 15 00993 g017
Figure 18. Comparison of XZ monitoring in-plane shear stress. (a) 1. (b) 2.
Water 15 00993 g018
Figure 19. Schematic diagram of overall stress distribution of the cut-off wall. (a) Nephogram of maximum principal stress. (b) Minimum principal stress nephogram. (c) Nephogram of shear stress in YZ plane of the cut-off wall.
Water 15 00993 g019
Figure 20. Comparison of maximum principal stress distribution of cut-off wall at monitoring surface. (a) 1. (b) 2.
Water 15 00993 g020
Figure 21. Comparison of minimum principal stress distribution of cut-off wall at monitoring surface. (a) 1. (b) 2.
Water 15 00993 g021
Figure 22. Comparison of shear stress distribution on YZ plane of cut-off l at monitoring surface. (a) 1. (b) 2.
Water 15 00993 g022aWater 15 00993 g022b
Table 1. Comparison of the maximum deformation of the soil in the filling area of the monitoring surface.
Deformation Type Displacement (m)Monitoring Surface
12
Horizontal0.63030.6292
Vertical1.60401.6025
Combined1.67751.6759
Table 2. Comparison of displacement and settlement of cut-off wall at different monitoring sections.
Position of DisplacementMonitoring Section
12
Horizontal displacement of the top of the rigid cut-off wall (m)0.018010.01732
Horizontal displacement of the top of the plastic cut-off wall (m)0.0017040.001588
Top Settlement of Plastic cut-off wall (m)0.0049660.004932
Disclaimer/Publisher’s Note: The statements, opinions and data contained in all publications are solely those of the individual author(s) and contributor(s) and not of MDPI and/or the editor(s). MDPI and/or the editor(s) disclaim responsibility for any injury to people or property resulting from any ideas, methods, instructions or products referred to in the content.

