Article

Modelling Plume Development with Annual Pulses of Contaminants Released from an Airport Runway to a Layered Aquifer, Evaluation of an In Situ Monitoring System

1
Faculty of Environmental Sciences and Natural Resource Management, Norwegian University of Life Sciences (NMBU), 1430 Ås, Norway
2
Norwegian Institute of Bioeconomy Research (NIBIO), 1433 Ås, Norway
3
Norwegian Geotechnical Institute (NGI), Sandakerveien 140, 0484 Oslo, Norway
4
AVINOR, Dronning Eufemias Gate 6A, 0191 Oslo, Norway
5
Norconsult, Postboks 626, 1303 Sandvika, Norway
*
Author to whom correspondence should be addressed.
Water 2023, 15(5), 985; https://doi.org/10.3390/w15050985
Submission received: 1 February 2023 / Revised: 26 February 2023 / Accepted: 28 February 2023 / Published: 4 March 2023

Abstract

:
In cold climates, the use of de-icing chemicals in the winter can lead to groundwater contamination, especially when used in large quantities, such as at airports. Oslo Airport, Gardermoen, is situated on Norway’s largest rain-fed aquifer. Potassium formate is used to remove ice from runways and propylene glycol from airplanes; the organic parts are degradable. Most of the wells to monitor the spread of de-icing chemicals in the underlying aquifer have well screens near the groundwater level, while the runways and the source of de-icing chemicals are near the groundwater divides, where vertical flow is expected. The objective of this study is to demonstrate the importance of layers and time-varying recharge on the spreading of contaminant plumes in an aquifer near a groundwater divide. This is done with numerical modelling. The model results show increased vertical transport of the added tracer in the presence of horizontal layers, both continuous and discontinuous, in the aquifer. With certain distributions of hydraulic conductivity, Ks, we demonstrate that deeper monitoring wells are required. With the scenarios modelled here, time-varying recharge has a weaker effect on plume distribution. Measured concentrations of potassium and total organic carbon show the cyclic effect of seasonally varying recharge of contaminants, and an asymptotic accumulation of concentration over time, that is consistent with the model runs. In conclusion, groundwater monitoring systems near a groundwater divide should include multi-level samplers to ensure control of the vertical plume movement.

1. Introduction and Site Description

In areas with winter frost, substantial amounts of de-icing chemicals are used to remove and prevent ice formation on airplanes, runways, and roads. At most airports, these chemicals are released or partially released into the local environment [1,2]. Oslo Airport (OSL), Gardermoen, approximately 40 km north of Oslo in south-eastern Norway, was opened in 1998. The organic parts of the de-icing chemicals propylene glycol (for de-icing airplanes), potassium acetate, and later potassium formate (to de-ice runways) are completely degradable. Therefore, the removal of chemicals (mainly in the unsaturated zone) by natural degradation is accepted by the environmental authorities on the basis that the groundwater quality is carefully monitored. The overriding requirement defined by the discharge permit from the Norwegian Environment Agency for Oslo Airport is that airport operations should not lead to permanent changes to the groundwater chemistry (Norwegian Environmental Agency, 2016).
The diffuse spread of the chemicals along the runway infiltrates into the ground and are degraded by naturally present microorganisms. Several studies of flow and transport of de-icing chemicals in the unsaturated zone e.g., [3,4,5], document heterogeneous flow and degradation before de-icing chemicals reach the phreatic level. However, increased manganese concentrations indicated insufficient oxygen for complete degradation. When the airport was opened, two monitoring systems were installed to control the water chemistry: one in the unsaturated zone and one in the groundwater. The monitoring system installed in the unsaturated zone consisted of porous filters. It did not take long before the filters were clogged and this monitoring system was abandoned. There are currently 505 available monitoring wells surrounding the entire airport, including wells to monitor background groundwater quality. A selection of 102 wells is manually sampled 1–2 times per year. The monitoring provides a unique dataset to assess the effect of 20 years of de-icing operations on groundwater quality [6]. Most of the wells installed in the first years of operation had screens that covered the fluctuation zone of the groundwater level and some metres below. Hence, the system mainly allows for sampling the upper part of the groundwater zone.
The Gardermoen glacial-contact delta (Figure 1) is an aquifer composed of unconsolidated sand with beds of gravel underlain by silty glaciomarine deposits [7,8,9]. Coarser sediments are dominating in the north-eastern parts of the aquifer, consistent with ice contact, while there is a fining of the sediments towards the distal part of the delta, towards the west and the south. In the deeper layers (bottom set), there is a higher proportion of fine sediments, silt, and clay. The ravines in the southwest are formed in the clayey marine sediments deposited when the Romeriksfjord was at the level of the glacial delta about 10,000 years ago. Today, the Gardermoen delta and the runways are situated 202 m above the current sea level, caused by isostatic uplift.
The groundwater map (Figure 1) is based on groundwater levels measured in 2021. Recharge occurs over the central part of the delta area, while groundwater discharges towards the northeast and southwest. Over the monitoring period of 1999–2019, most of the wells indicated a fluctuation of about 1 m, with some exceptions of up to 2 m, hence indicating a rather stable groundwater flow pattern. Although the airport does not have permission to modify the discharge conditions surrounding the aquifer, the central part of the airport has a drain system in place to maintain the groundwater level below the airport railway line running south-north through the airport. The groundwater level is kept below a defined level (approximately 192–196 m.a.s.l.) along the west side of the railway with a drain (Per Espen Jahren, OSL pers. comm.).
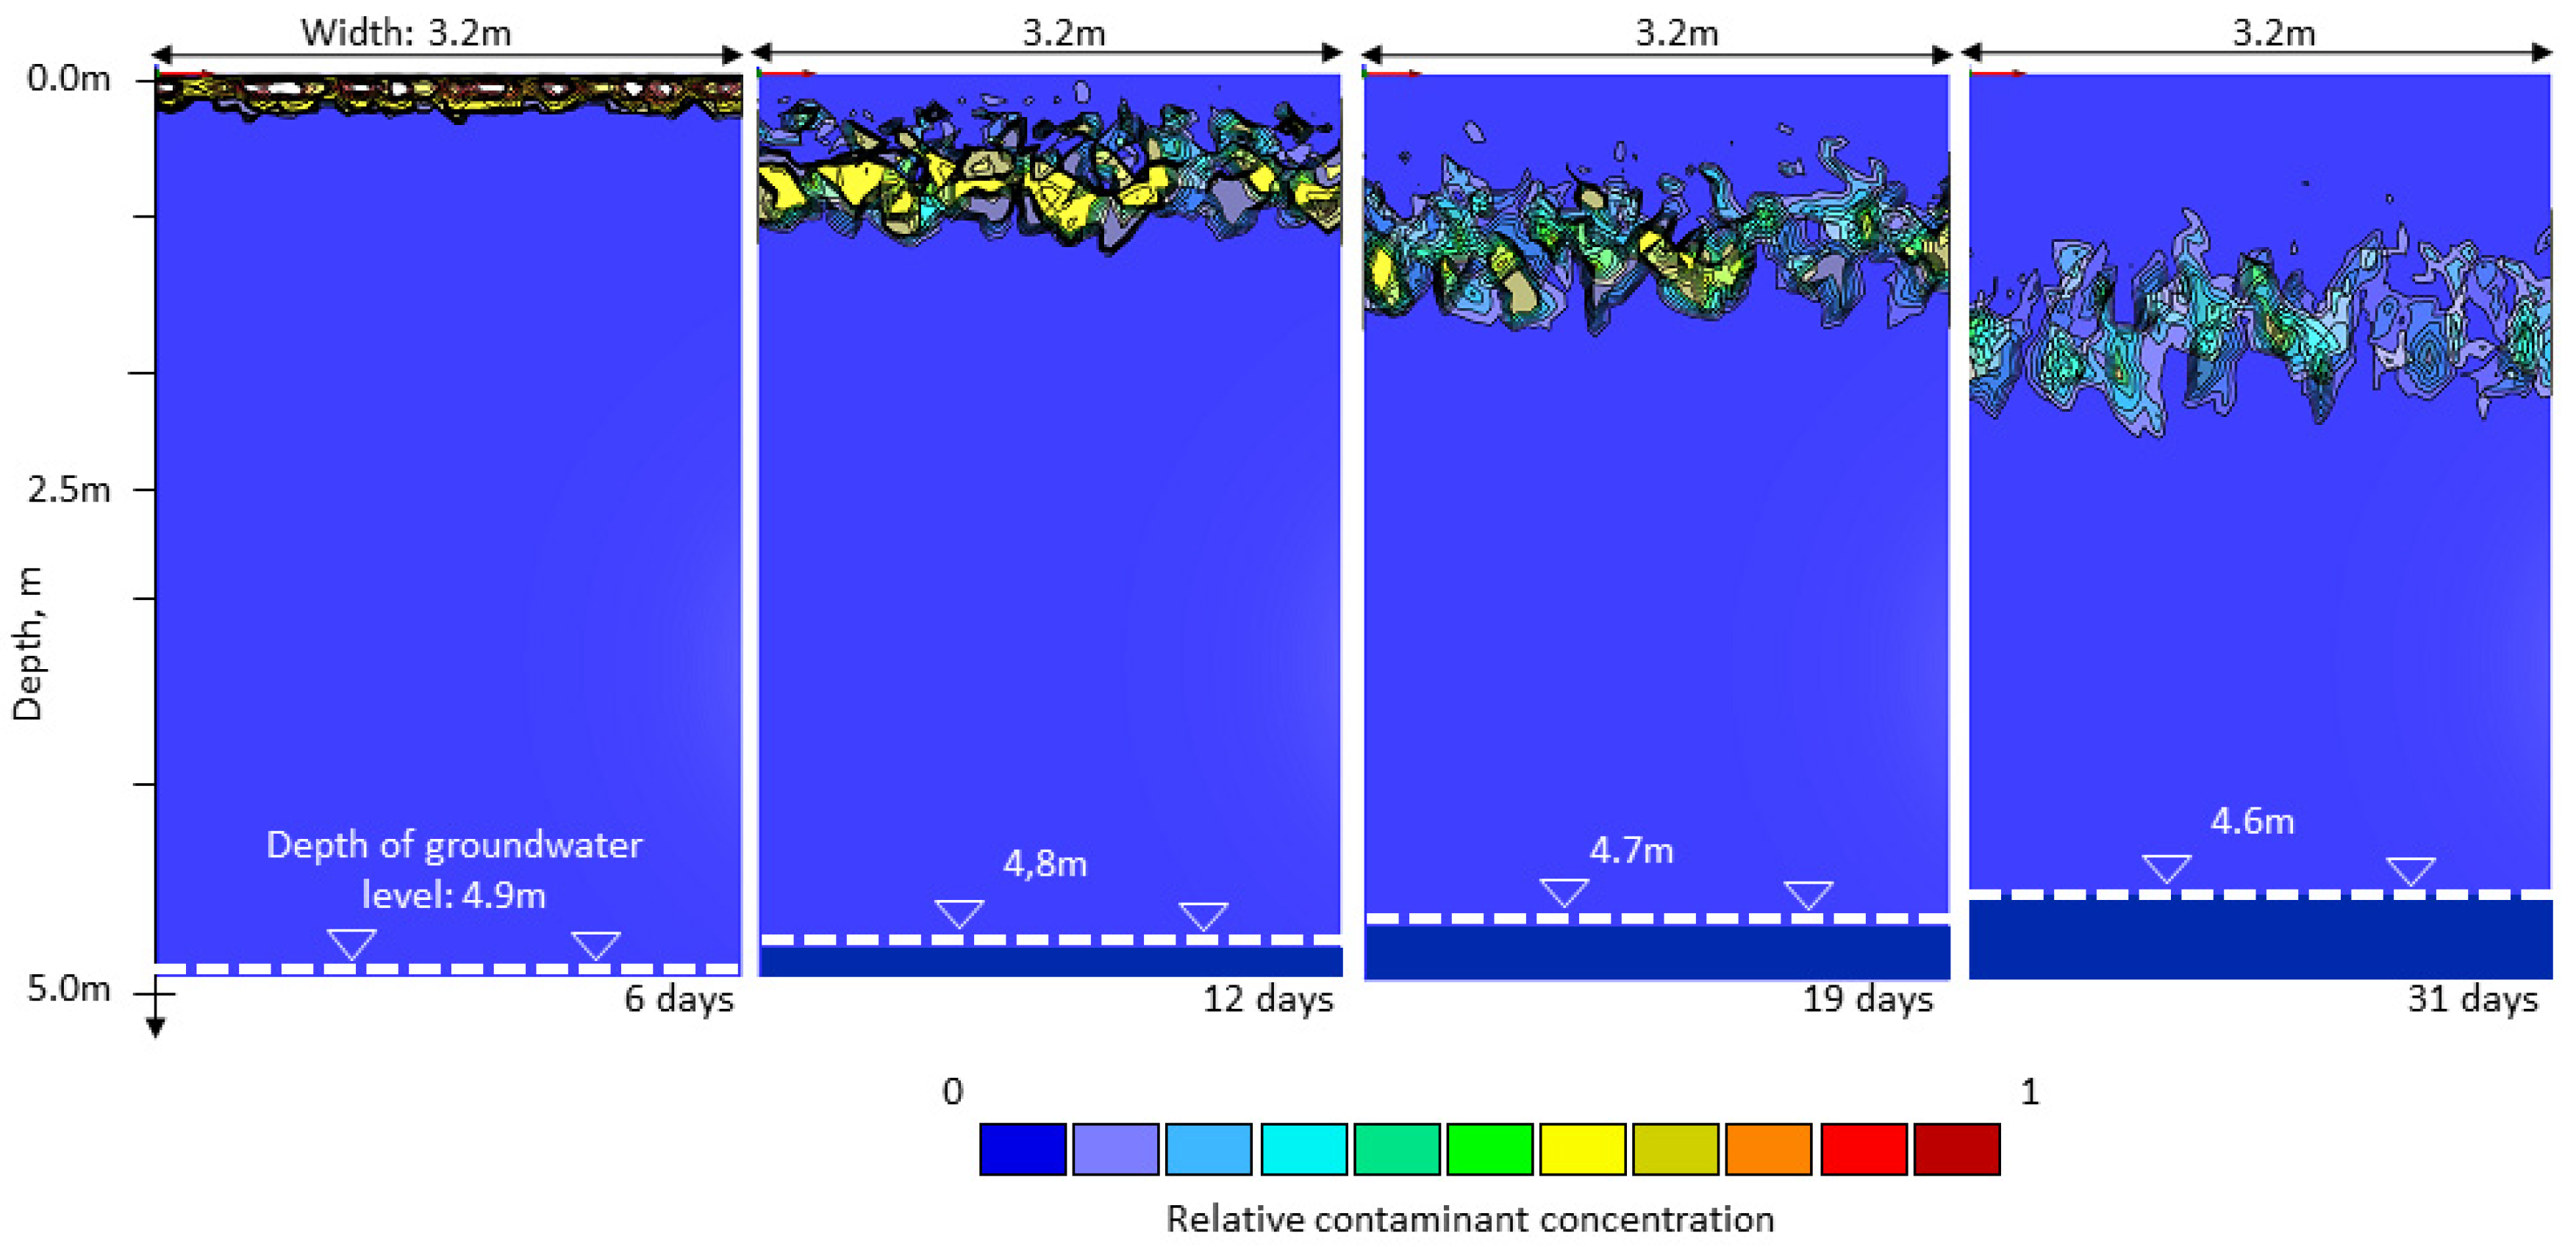
The unsaturated zone thickness prior to the opening of the airport varied between 1 and 30 m. The annual precipitation is approximately 800 mm, and the evapotranspiration is about 400 mm. More than 50% of the groundwater recharge occurs during the snowmelt period over 3–5 weeks [3,7,10,11]. The de-icing chemicals start to infiltrate the unsaturated zone during snowmelt (March–April, e.g., [3]). Summer precipitation is normally balanced by evapotranspiration during the growing season (May–August), and a new vertical push of water in the unsaturated zone occurs during the autumn (September–November), followed by another stagnant period during the winter when all precipitation accumulates as snow [2]. The principle transport pattern of de-icing chemicals in the unsaturated zone during snowmelt based on unsaturated heterogeneous modelling is shown in Figure 2 [12,13]. In this work, we focus on what happens to the chemicals after they have reached the groundwater table.
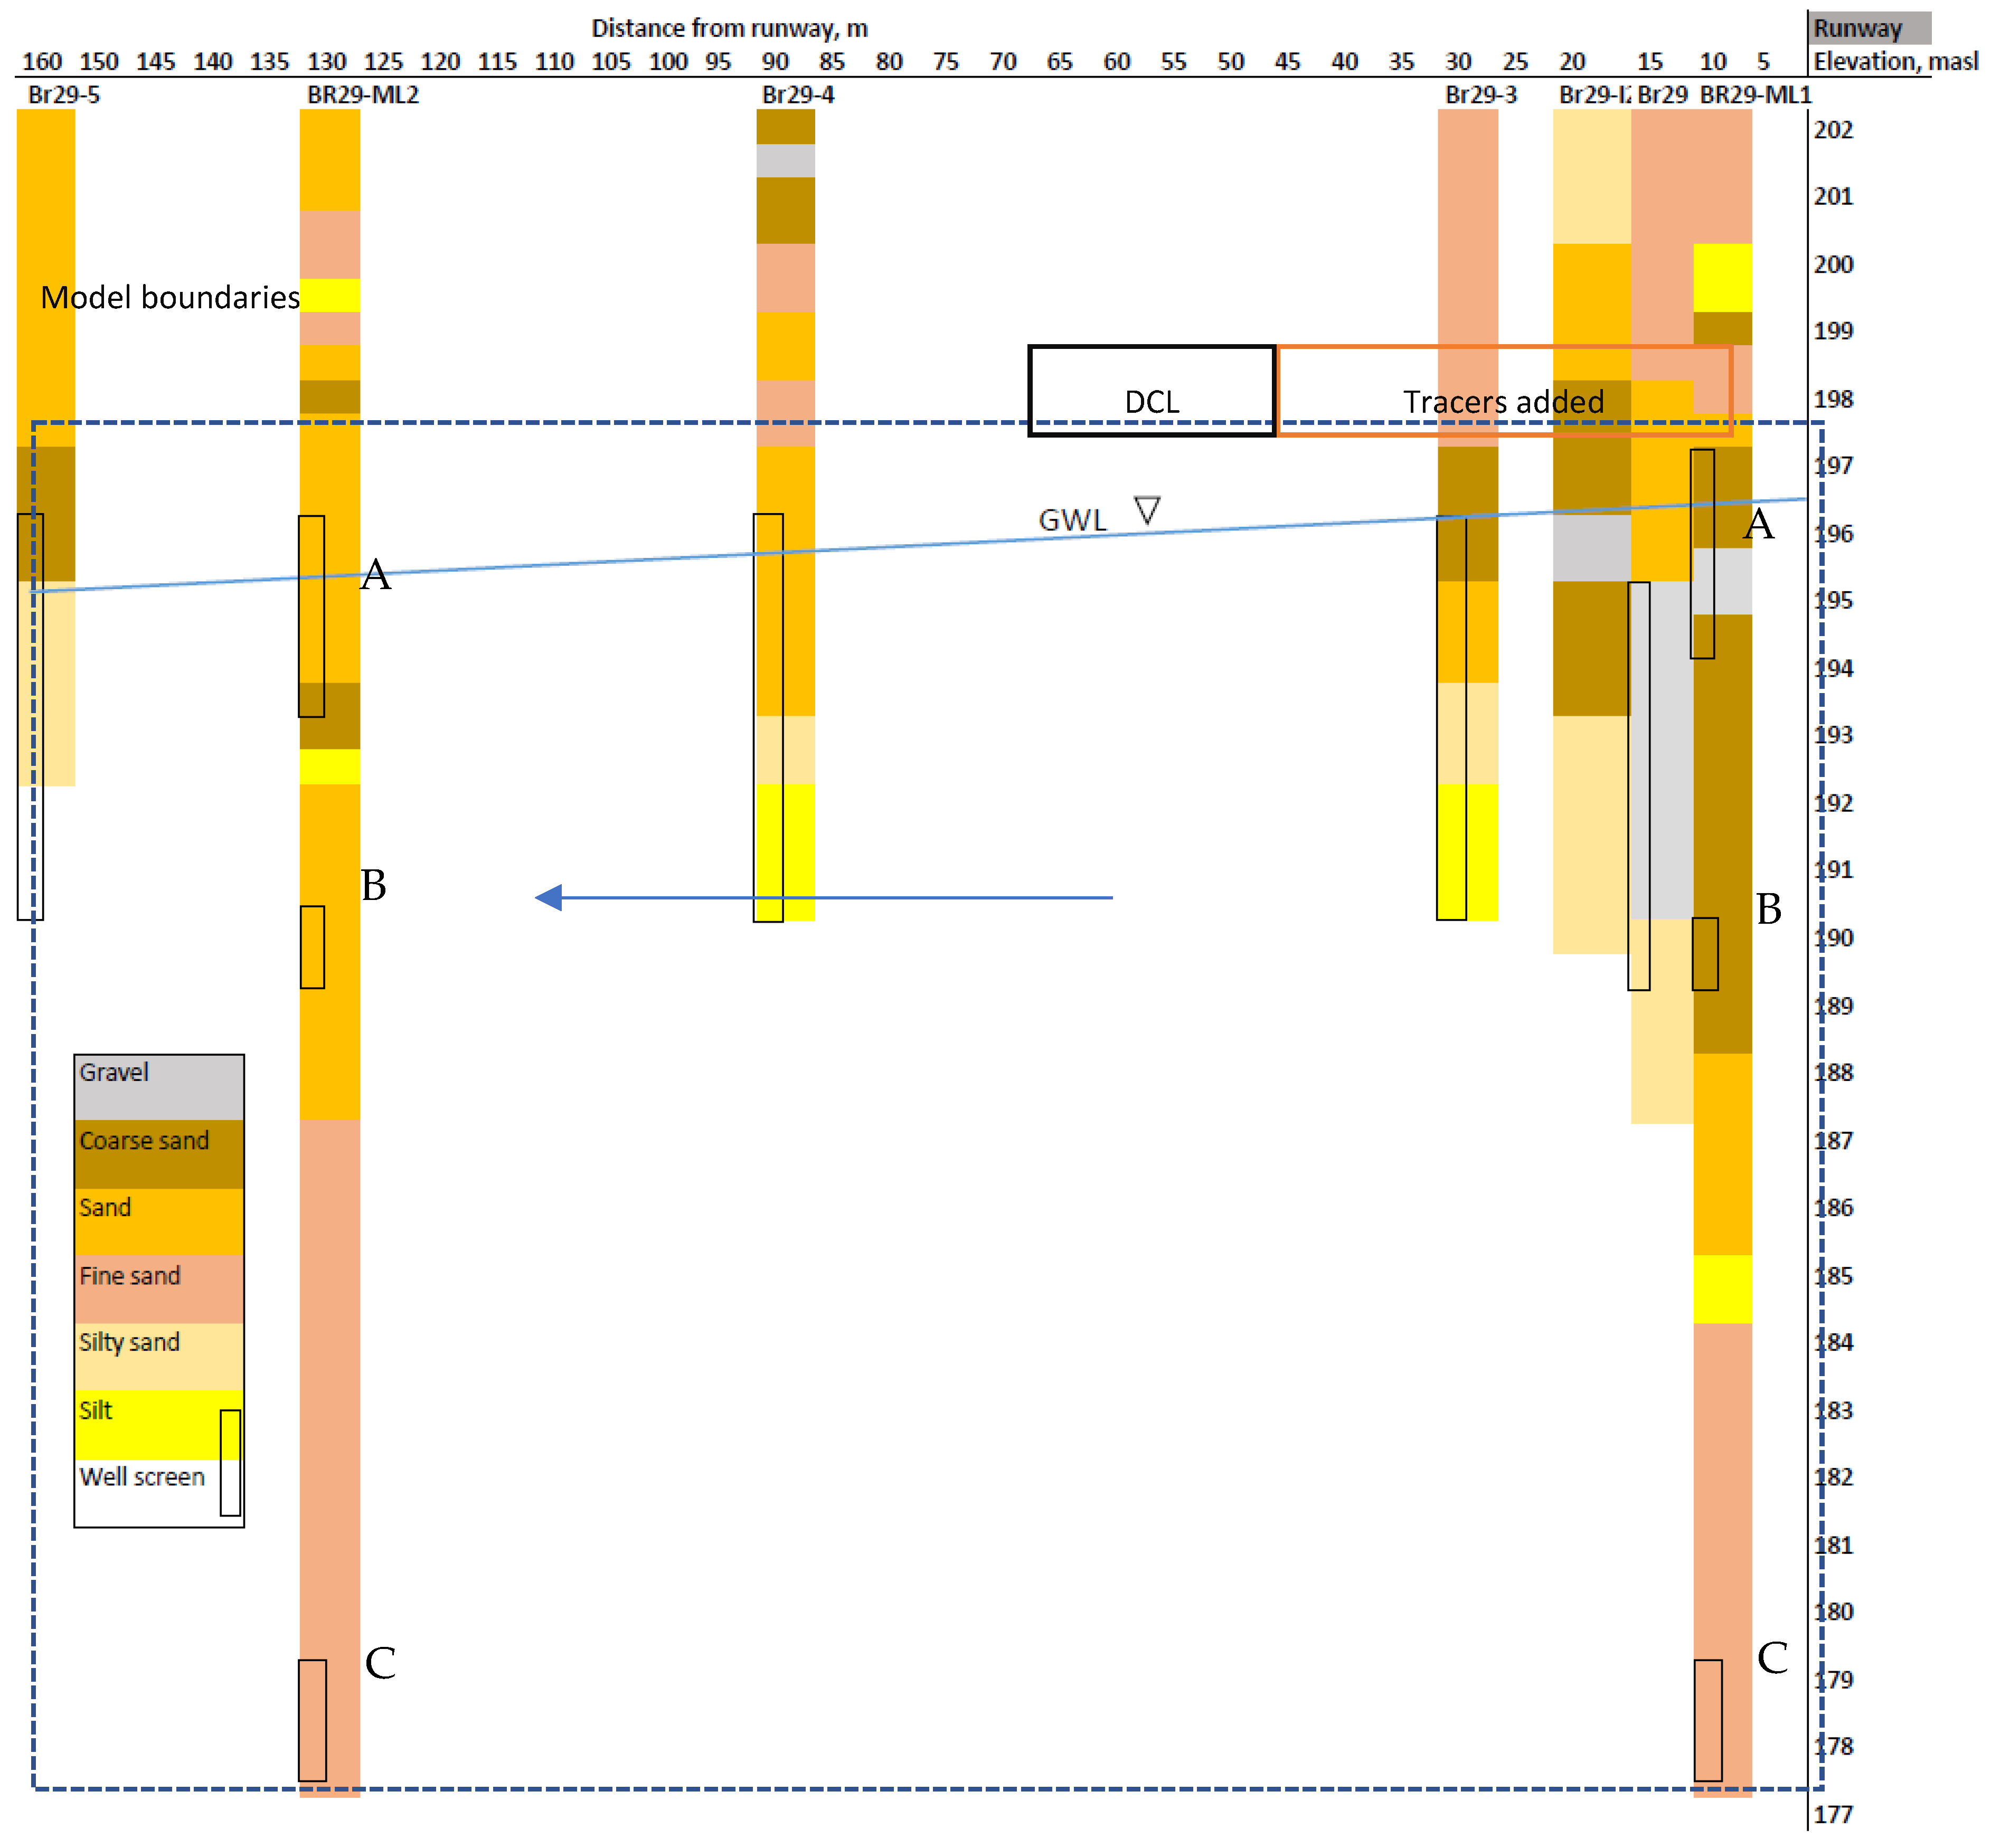
The groundwater on the north-eastern side of the aquifer drains towards Lake Hersjøen, while the groundwater on the south-western side drains towards the river Leira, west and south of the airport. This roughly corresponds to the groundwater map from 1976, before the airport was built [14]. According to previous assessments of groundwater flow in the Gardermoen aquifer, the groundwater divide could vary by up to 1 km in the horizontal direction [7]. Today, the groundwater divides, indicated as blue stippled lines in Figure 1, are probably more stable, partly because the groundwater level is kept constant or below a given level along the railway line. Below the groundwater divide, a strong vertical flow direction is expected, while horizontal groundwater flow is expected to dominate between the recharge and discharge zones. This flow pattern is confirmed by a combined tracer and modelling study performed by Sundal et al. [9] in the northern part of the groundwater area. Since the runways, and hence the source of de-icing chemicals at this airport, are mainly situated near the groundwater divides, we argue that these zones should also be carefully monitored at greater depths. In addition, we expect the presence of thin layers of varying grainsize (from silts to coarse sand, Figure 3) to affect the fate of contaminant plumes released in such areas. This effect was not considered by Sundal et al. [9].
Water samples from the groundwater monitoring programme at Oslo Airport from when the airport opened in 1998 to 2019 [6] show the largest changes in water chemistry in the southwestern part of the western runway. This area receives a high load of de-icing chemicals because propylene glycol, used to de-ice the wings, sloughs off during takeoff at this part of the airport, in addition to potassium formate from runoff from the runway. The mechanical spreading of snow from the runways causes chemicals to spread about 40 m from the runway. This was documented by collecting snow at different distances from the runway in this area [15,16]. The groundwater level in the area is also relatively shallow (6–7 m below the surface). In November 2007, several monitoring wells were installed. These have been named after the first monitoring well, Br29, and form a line along what is expected to be the main direction of groundwater flow. They are named Br29-2, Br29-3, Br29-4, and Br29-5 (area indicated in Figure 1). Notice that the groundwater map and flow lines suggested by the most recent groundwater map, diverge somewhat from the line of Br29-wells shown in the groundwater map. Well logs provide a qualitative description of the stratification (Figure 3); multi-level wells were not available prior to this modelling study. The challenge with using this information to model the groundwater flow in the area was that the information is descriptive and does not provide accurate hydraulic conductivity of the layers. Well logging was carried out by different people, and it is uncertain whether the same classification was used when installing the various wells. With a groundwater table at 6–7 m depth and a total well depth of 10–15 m, there is very limited information about the groundwater zone. The entire lengths of the runways are between 3 and 4 km, illustrating the challenge of both characterising detailed hydrogeological parameters and monitoring groundwater quality.
The actual flow pattern may diverge from the presented groundwater map. Despite being one of the hot spot areas influenced by de-icing chemicals and in the vicinity of the groundwater divide, there has been limited information about the geology and water quality below the upper 6 m of the groundwater zone. There are no drillings to indicate the depth to the bedrock or to the finer soils in this area to confirm the lower no-flow boundary of the groundwater flow. Two multi-level wells (ML1 and ML2 in Figure 3) were installed after the present model work was finished.
In this paper, we use a numerical groundwater model to assess the effect of supplying an inactive tracer to an aquifer using different combinations of surface boundary conditions and a homogeneous or layered aquifer. The surface boundary condition is either a stationary flux boundary with a constant recharge or a transient flux boundary representing snowmelt conditions. As pointed out, e.g., by Nalarajan [17], the data required for constructing a model to simulate a field system are virtually never complete and detailed enough, and there are always significant and small-scale spatial variations. Additionally, the information available here on the layers and their hydraulic conductivity is limited. The main goal is to examine the potential effects of such layers, their continuity or lens structure on the flow pattern, and the contaminant concentrations that would be measured at different depths. We then perform a qualitative comparison between the model results and the observed concentrations along the Br29 transect.
The aim of running model scenarios, is to improve our understanding of the fate of contaminant spread in an aquifer influenced by the presence of layers and transient recharge conditions. Of specific interest was to describe different realisations of plume distributions with depth and to assess how different distributions may or may not be captured by the set-up of monitoring wells, as exemplified by the cyclic supply of de-icing chemicals at Oslo Airport, Gardermoen.
The main purpose of the work was to quantify whether:
(1)
The vertical flow component near a groundwater divide is influenced by the presence of horizontal layers of varying Ks;
(2)
The presence of layers with different hydraulic conductivity affects plume movement and should therefore dictate the placement of well screens in monitoring wells;
(3)
Contaminant transport is more affected by transient recharge conditions than the presence of layers.

2. Modelling and Field Monitoring Data

To model the flow and transport pattern, MODFLOW [18] and MT3DMS [19] were used, and the results were compared with historical measurements of solute concentrations in the groundwater from monitoring wells. The affected area that serves as an example for our model study (Figure 1) is near a groundwater divide; the exact position of the groundwater divide is unknown and is expected to vary in time.

2.1. Model Geometry and Boundary Conditions

The groundwater model MODFLOW (version 2005; [18]) provided by the United States Geological Survey (USGS) was used for the simulation of groundwater flow, and the model MT3D-USGS [19] was used for the simulation of solute transport. The model was constructed in the software ModelMuse (version 5.1, [20]). The model geometry, boundary conditions, and parameter values were chosen to represent the situation at the Oslo Gardermoen airport, specifically a cross-section of groundwater flow from the edge of a runway to 150 m horizontally in the assumed direction of groundwater flow. The cross-section covers the presence of several observational groundwater wells that are placed in a roughly horizontal transect from the northeast to southwest (Figure 1).
The model geometry is shown in Figure 3 and Figure 4. It represents a simple two dimensional flow system with a no-flow boundary at the northeast end and a constant head boundary at the southwest end. The vertical no-flow boundary coincides with the groundwater divide in the area as determined by well observations (Figure 1), while the constant head (CHD) boundary is based on nearby groundwater well measurements. The bottom boundary is a no-flow boundary. The top boundary of the model receives (Figure 4) steady-state recharge equal to half of the average precipitation, totaling 400 mmyr−1, or 1.1 mmd−1, for the duration of the simulations. The element size is 2 by 2 m in the x-y plane. The total vertical extent of the model is 20 m, from 197 m.a.s.l. to 177 m.a.s.l., and it is divided into 9 layers. The top layer is 4 m thick, while deeper layers are 2 m thick (Figure 4). Dispersivity is defined as 0.75 m.
Although we have no measurements of hydraulic conductivities from these specific well logs, they are measured, estimated values from grain size distribution curves from many parts of the airport [21] and calibrated values of Ks including the same area from previous model studies e.g., [9]. Since the objective of this study was to assess the possible effects of different combinations of layer features and transient boundary conditions, we did not attempt to calibrate Ks. Our reference model has a homogeneous Ks of 7 × 10⁻⁶ ms−1, which could represent a fine sandy soil and is consistent with the distal part of the delta. In addition, we modelled three layered scenarios, with different combinations of layer continuity and Ks values, i.e., three continuous layered scenarios and three discontinuous layer scenarios were defined (Figure 4). In all seven model scenarios, the average Ks is 7 × 10⁻⁶ ms−1. The eight layers (2 m in the z-direction) were assigned high (7 × 10⁻⁵ ms−1), medium (7 × 10⁻⁶ ms−1), or lowest (7 × 10⁻⁸ ms−1) Ks values that are isotropic and homogeneous. Adjacent layers with the same Ks are avoided for the continuous layer scenarios. In the discontinuous layer scenario, the layers are broken over a 20 m long section; this part consists of two consecutive lenses of 10 m each (Figure 4). The length of the lenses at the field site have not been confirmed by drillings, but available logs near the runway (Figure 3) suggest some consistency in layers over 10–20 m. The smallest Ks for the discontinuous part of the layers is low Ks (7 × 10⁻⁷ ms−1). The specific yield is 0.2 and the specific storativity is 1 × 10⁻⁵ in all models.

2.2. Simulation Time and Transient Surface Boundary

The model is run for one year to reach a stable hydraulic gradient. A gradient of 1/150, similar to the measured gradient, is obtained. After steady state conditions are established, an inactive tracer with a concentration of 100 mgL−1 is added to the upper layer for a duration of one month (consistent with the observed snow melting periods described earlier). The tracer is added to the surface boundary in the zone of 10–50 m from the north-eastern no-flow boundary next to the runway (Figure 4), consistent with the observed spread of de-icing chemicals [15,16]. The recharge added with the tracer is twice the background recharge value (i.e., 2.2 mmd−1 instead of 1.1 mmd−1) because snow clearance from the runway is added to these parts of the green areas next to the runway. After the addition of a tracer for 30 days, the total simulation time is 100 years to allow the plume of a single tracer pulse to completely flow through the system.
Finally, two additional boundary conditions were tested. In the first situation, the constant head boundary in the southwest was varied between 193 and 195 m (1 m lower or higher than the reference model). In the second situation, a seasonal variation of recharge was defined. This was based on observed hydrological conditions, with increased recharge during snowmelt and late autumn and no recharge during winter (because of sub-zero temperature conditions) and summer (due to evapotranspiration). During each simulated year, the recharge was defined as 6.7 mmd−1 for 30 days in spring (the snowmelt period), 1.67 mmd−1 in autumn (3 months), and 0 mmd−1 in winter and summer. The recharge totalled 400 mm per year defined for the stationary boundary condition.
In addition to ModelMuse, MODFLOW, and MT3DMS, the USGS software programmes Model Viewer and GW_chart were used to visualise results from the simulations. Tracer concentrations were examined for each layer at two different locations, A and B (Figure 4).

2.3. Selected Water Quality Data from Oslo Airport

Potassium (K) from potassium formate, the non-degradable component of the de-icing chemical, is used for the qualitative comparison, with the model results showing an inactive tracer. Total organic carbon (TOC) represents the degradable propylene glycol and formate as well as their degradation products. We focus on the concentrations measured in the selected area (Figure 1) along the Br29 transect, with data from 1999 to 2019. The full dataset of water quality data used for the evaluation of the groundwater quality situation at Oslo Airport is described in Hansen et al. [6]. Following the modelling study performed in 2020 [22], two multi-level wells were installed, ML1 and ML2, both shown in Figure 3. These wells are described further in Waade [23], but we only show the same chemical variables for the additional depth provided by these wells, i.e., at 12.5 and 25 m below surface.

3. Results

3.1. Modelled Head Distribution

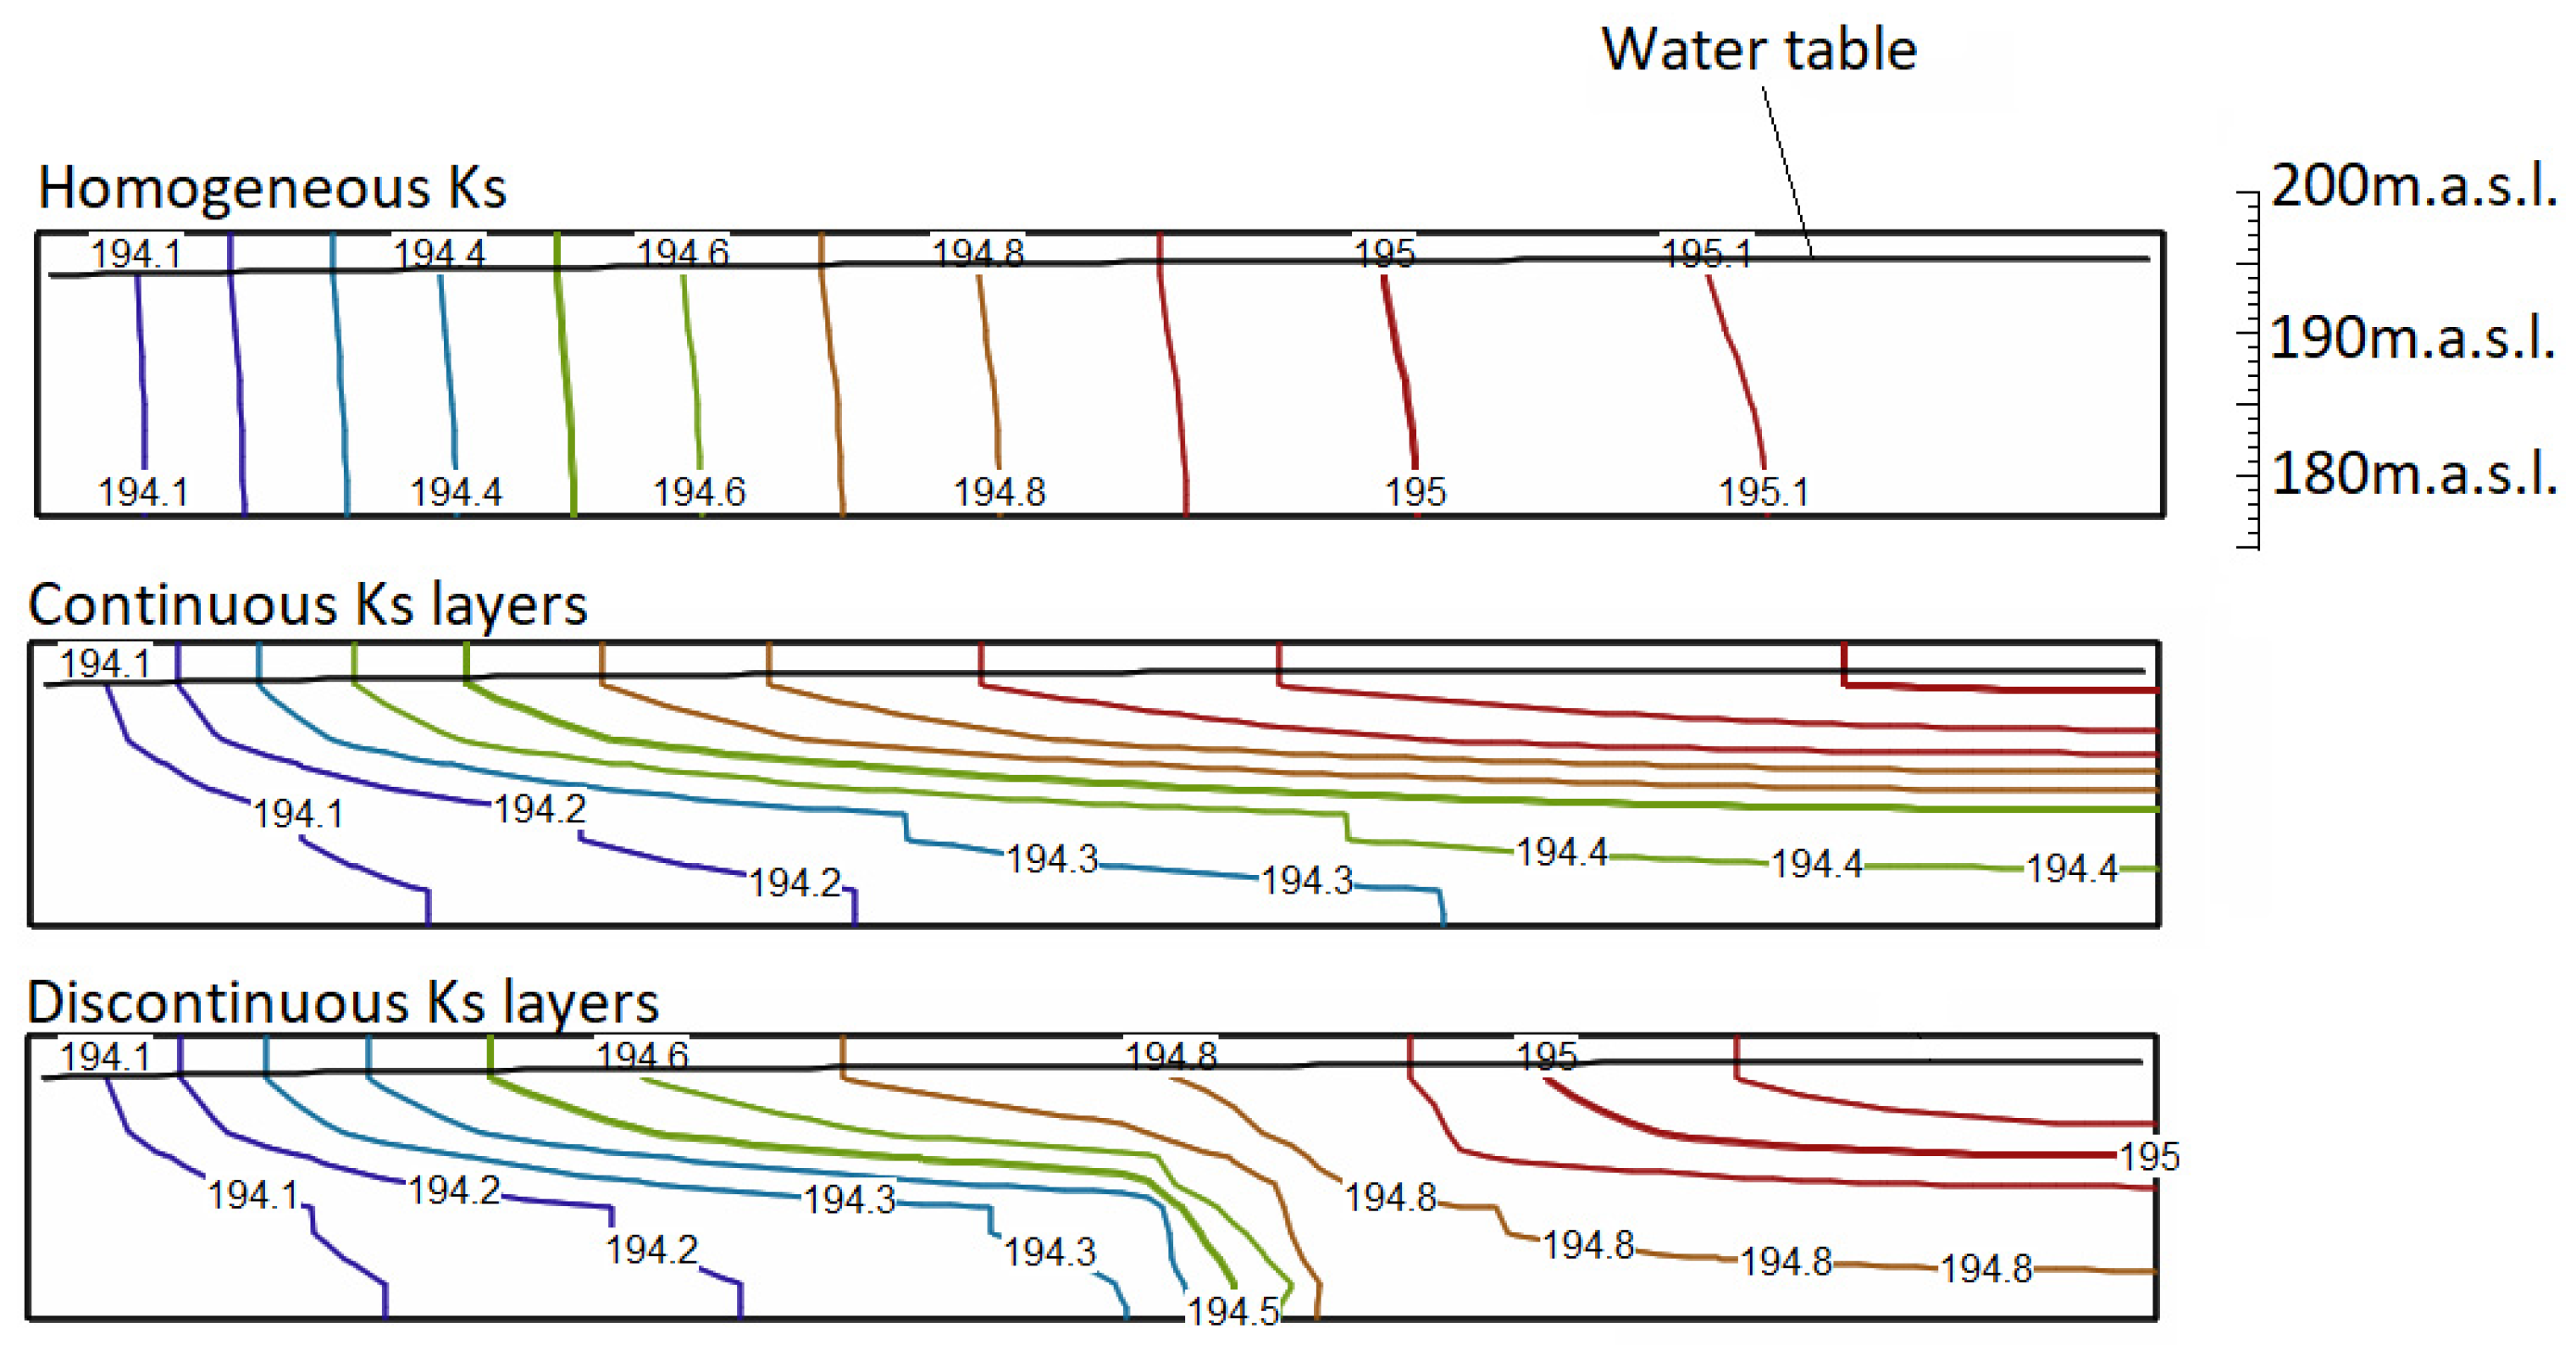
The hydraulic head distributions and water table locations for each of the scenarios (homogeneous Ks, continuous Ks layers, and discontinuous Ks layers–Model 1 are used for illustration purposes) are shown in Figure 5. While the water table remains the same, the hydraulic head equipotential lines are very differently distributed. For the homogeneous Ks case, equipotential lines are nearly vertical, and the system is dominated by horizontal flow. In the other cases, and especially with the discontinuous Ks layers, equipotential lines are highly curved, giving rise to a stronger vertical flow component.

3.2. Different Distributions of Ks

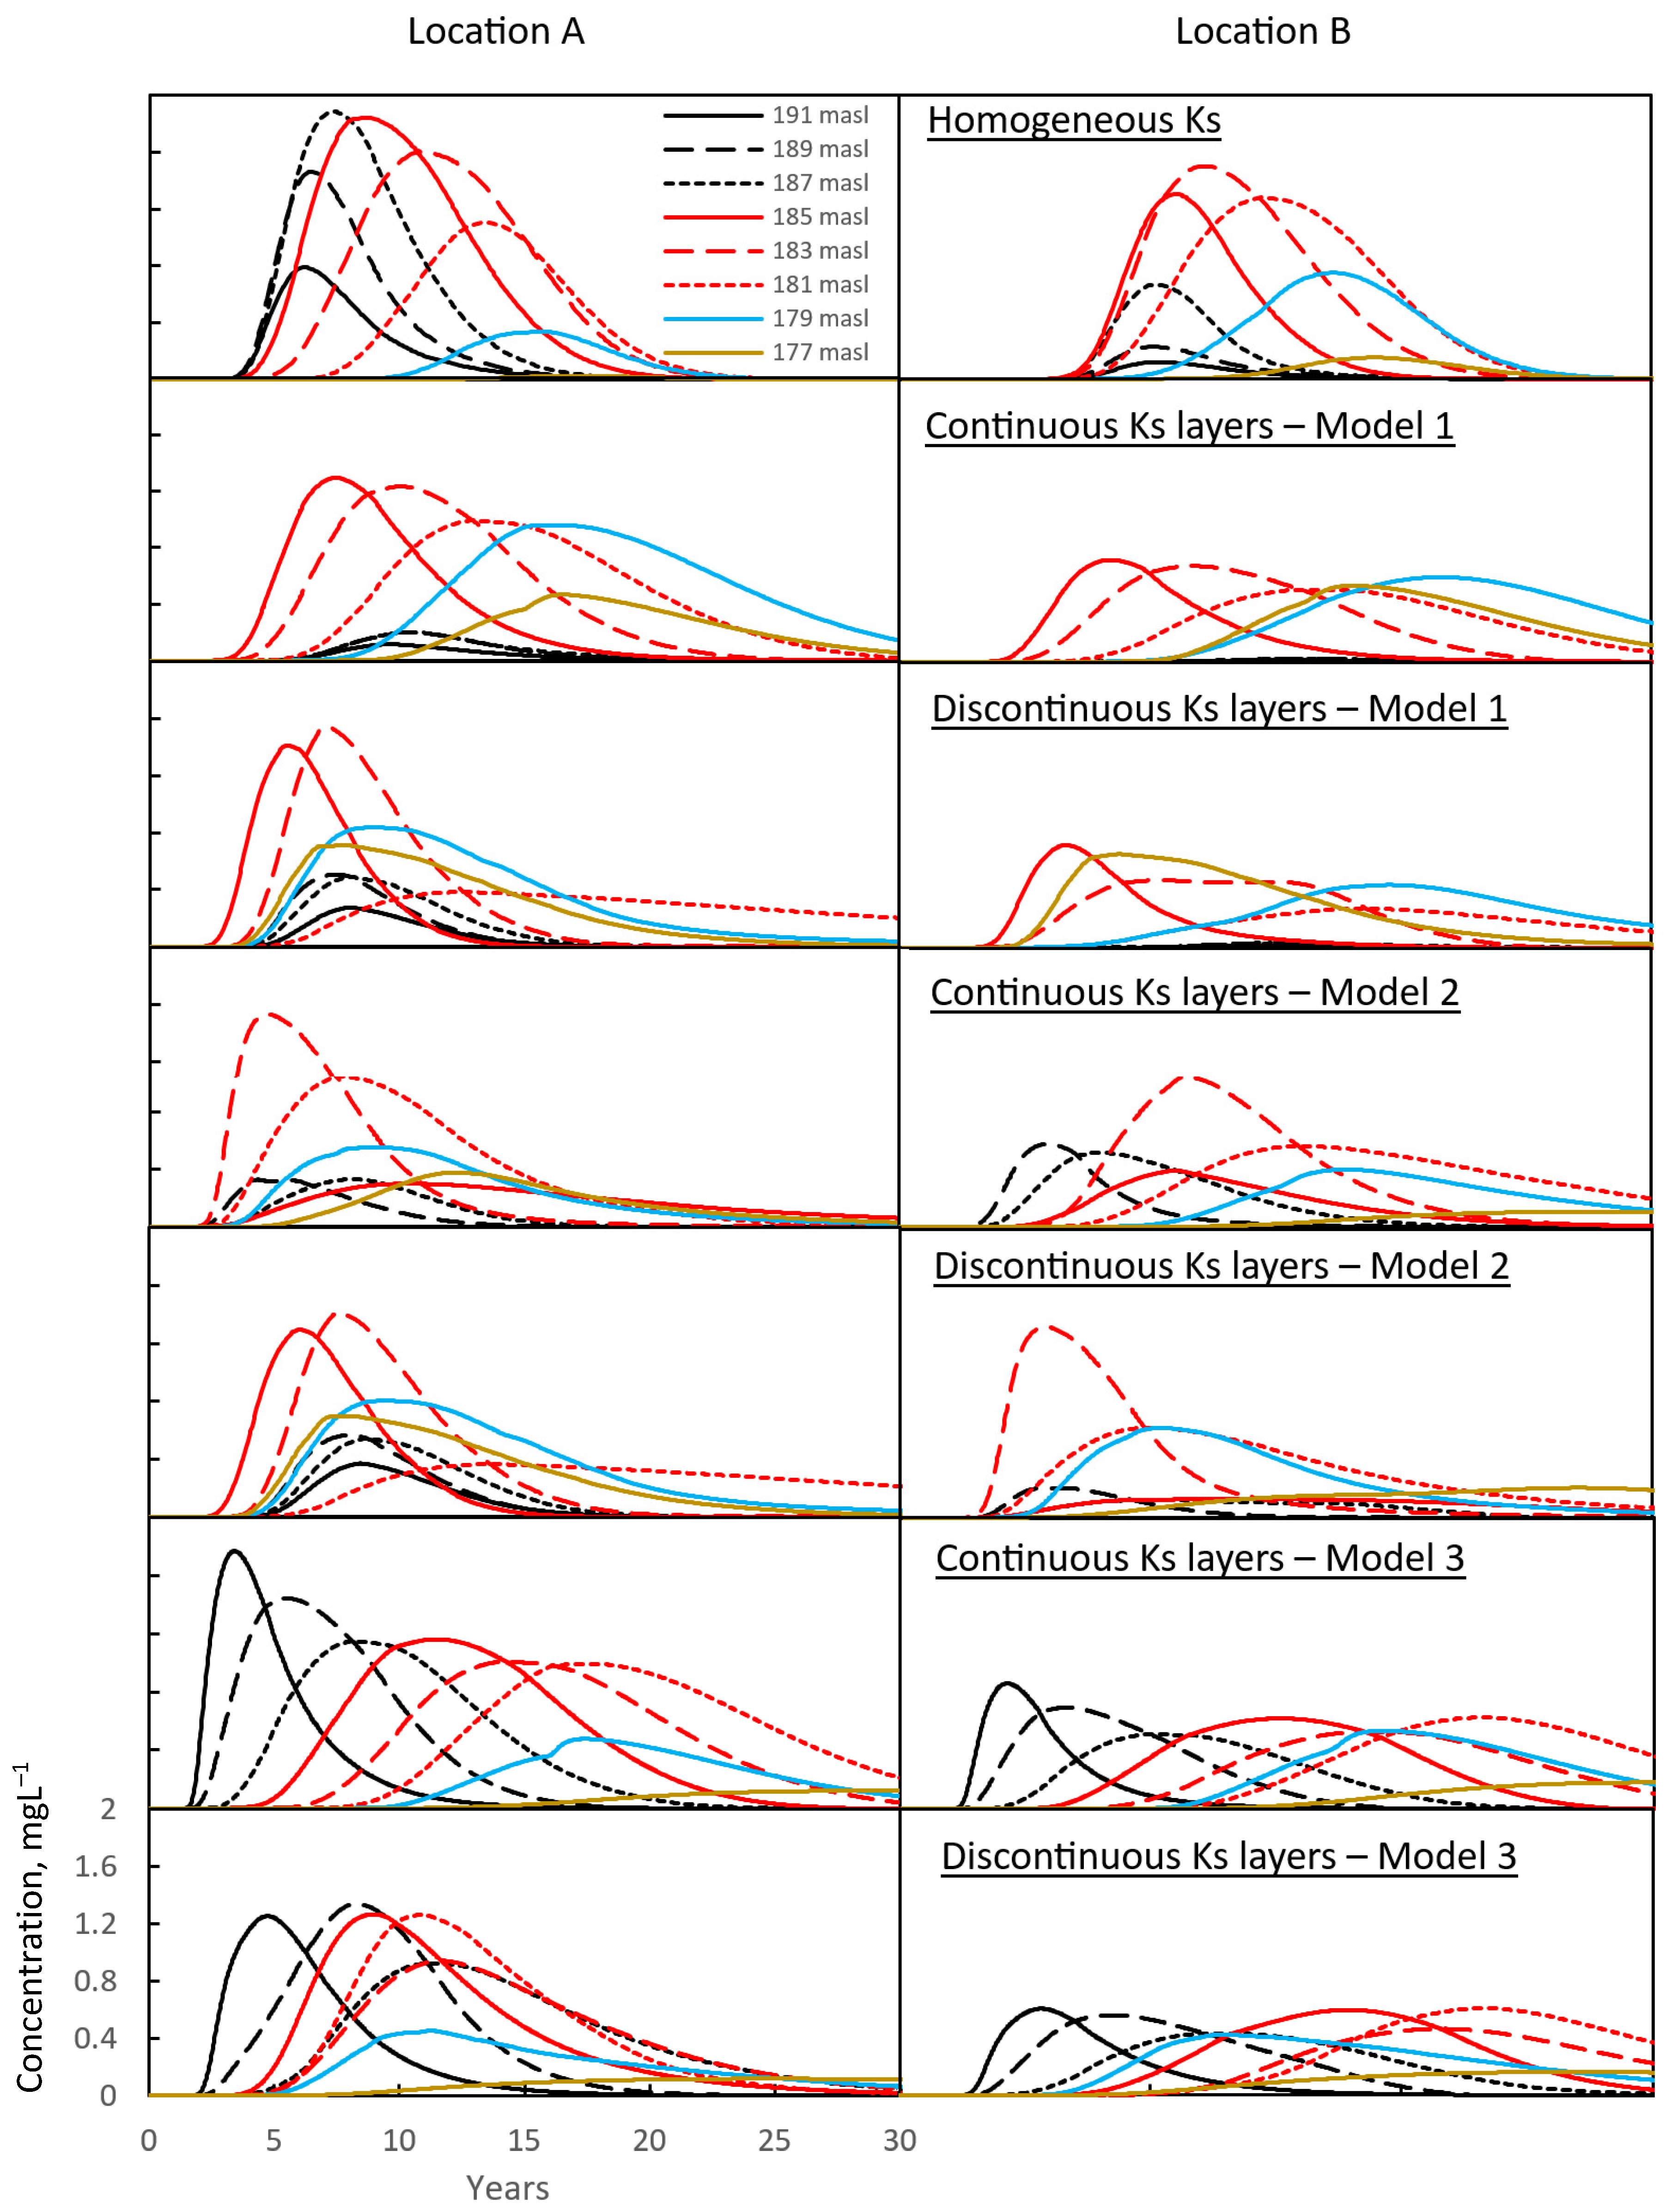
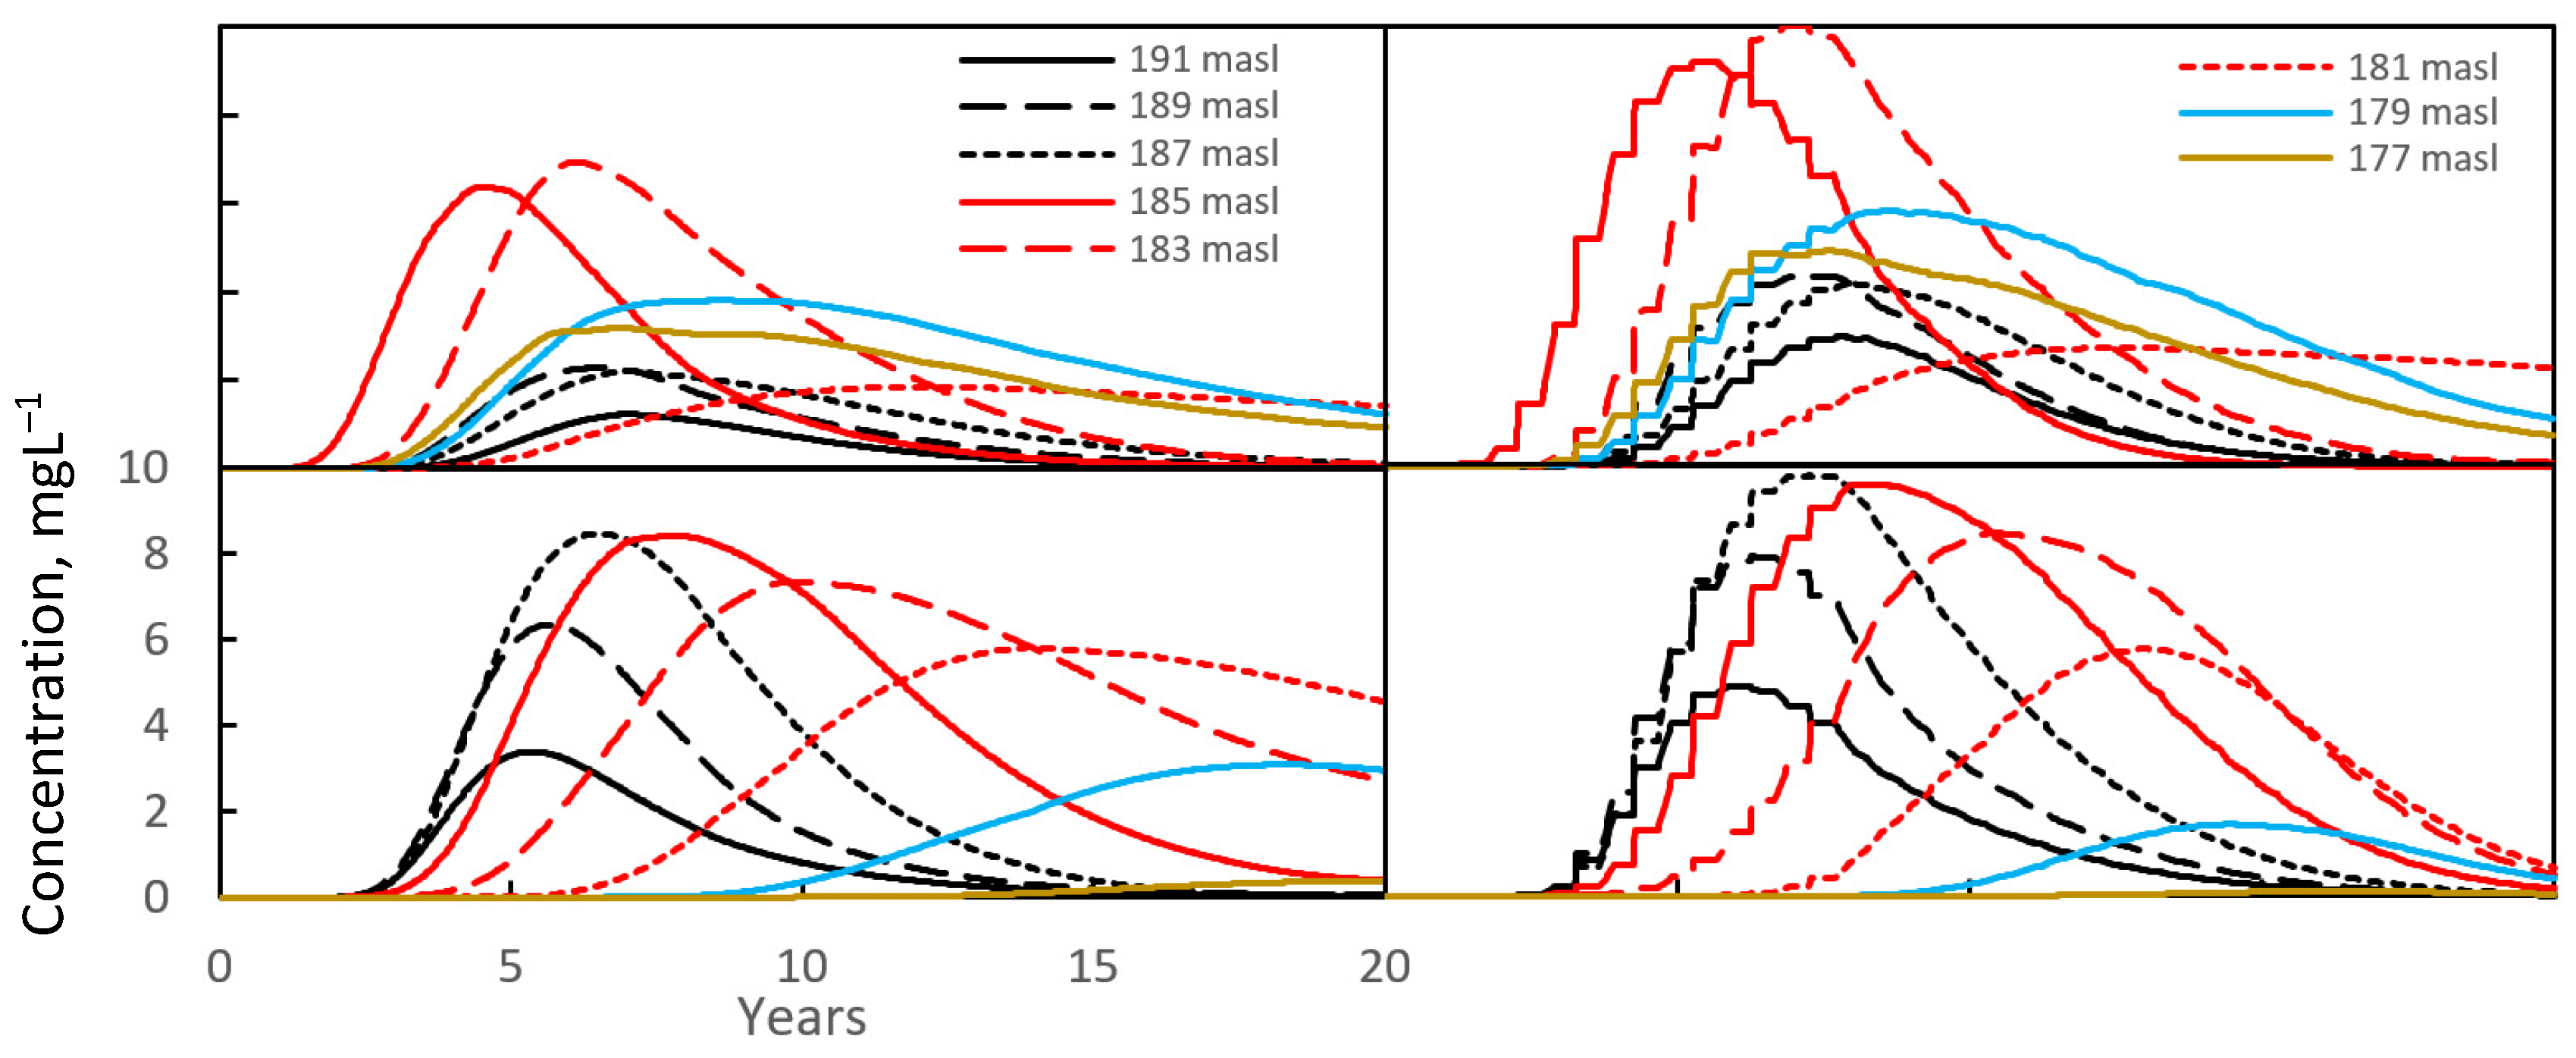
Breakthrough curves of tracer concentrations for the scenarios with varying Ks distributions (Models 1–3, Figure 4) are shown in Figure 6. For the homogeneous case, most of the tracer is found in shallow layers near the source of the plume (187–83 m.a.s.l., Location A, 23 m from the tracer application zone), whereas further downstream (Location B, 57 m from the tracer application zone), most of the tracer is found in the middle layers (185–181 m.a.s.l.). In the layered cases, the breakthrough curves for the different layers are very different from one scenario to another. Additionally, the plume velocities are affected by the layer configurations.
With Model 1, for both the continuous and discontinuous layers, the tracer is mainly found below 185 m.a.s.l. (locations A and B). At location B, the tracer has also spread to deeper layers (179–177 m.a.s.l.) compared to the homogeneous case. Furthermore, the maximum concentration at different depths occurs at different times. In the cases of discontinuous layers, the amount of tracer that reaches the deepest layer (177 m.a.s.l.) has also increased.
With Model 2, most of the tracer is found in the layer at 183 m.a.s.l. in both the continuous and discontinuous cases. Less tracer is found in the shallow layers. The discontinuous layer case causes the tracer to spread higher into the layer at 185 m.a.s.l., whereas in the continuous case the tracer hardly enters this layer. The tracer is well spread vertically in the continuous case, further away from the source of the plume (location B, 189–179 m.a.s.l.), while in the discontinuous case, the tracer is mostly present between 183 and 179 m.a.s.l.
With Model 3, the results are quite different since the tracer now remains in the shallow layers and is less concentrated in the deeper layers. The tracer also spreads fastest in the shallow zone and spreads slower to the deeper layers (the peaks in the deeper layers are delayed). In the discontinuous case with lenses, the concentration peaks are much lower.
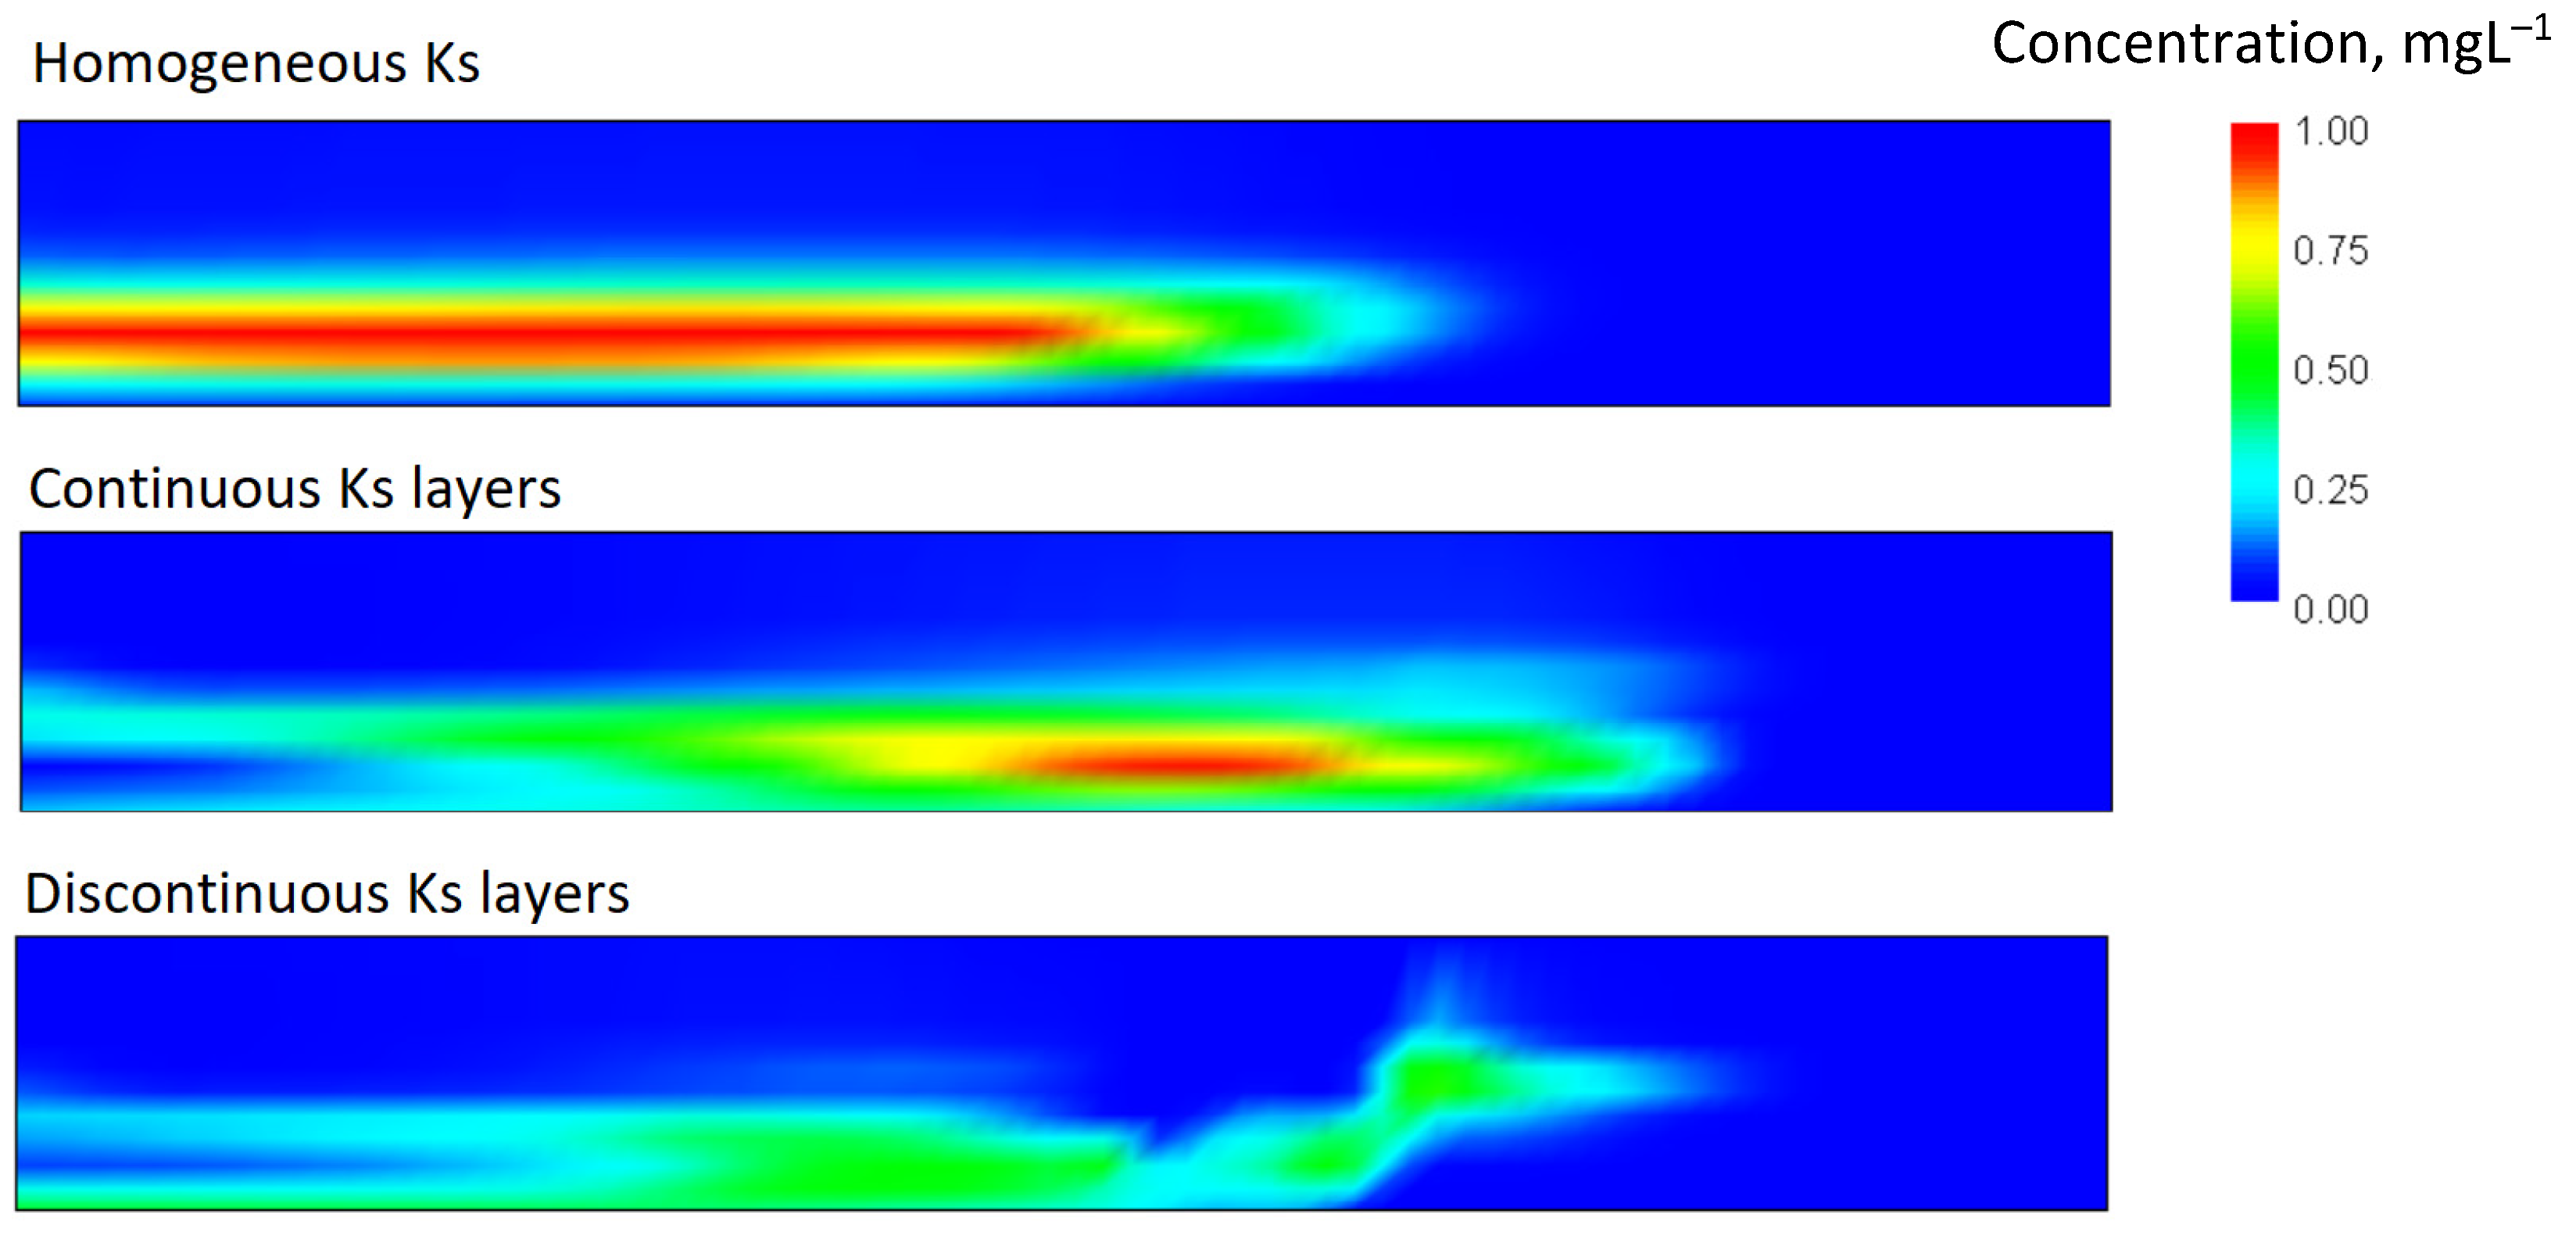
Figure 7 shows the plume distribution for the homogeneous, continuous, and discontinuous cases (Model 1 configuration), 15 years after the tracer was added. The effect of layers and lenses of varying Ks is apparent. The location of the plume and its centre of mass are strongly affected by the different Ks layers and lenses. The spread of the tracer is also slower, and the tracer seems to remain at a greater depth. In the case of discontinuous Ks layers, the tracer does not accumulate in one specific region with high concentrations but spreads out more in the deepest layers. Although it may look as if there is less tracer present in the layered systems (less red colour in Figure 7), the total mass is the same in all model realisations, indicating a larger dispersion (i.e., dilution) of the plume.

3.3. Time-Varying Recharge and Recurring Tracer Pulses

In the case of time-varying recharge, the plume spreads in a stepwise manner due to periodical reduction of flow rate (no recharge) and periodical accelerated flow rate (high recharge) (Figure 8). The peak concentrations are higher with time-varying recharge. The vertical distribution of the tracer only differs slightly between the time-varying and steady-state recharge scenarios. With the discontinuous Ks layers, the time-varying recharge, for example, leads to higher tracer concentrations in the layer at 181 m elevation. In general, the tracer seems to be more concentrated in the middle and deeper layers in the case of time-varying recharge. Furthermore, especially in the homogeneous Ks case, the tracer concentrations drop faster with time-varying recharge, giving the breakthrough curve a narrower distribution (a smaller variance).
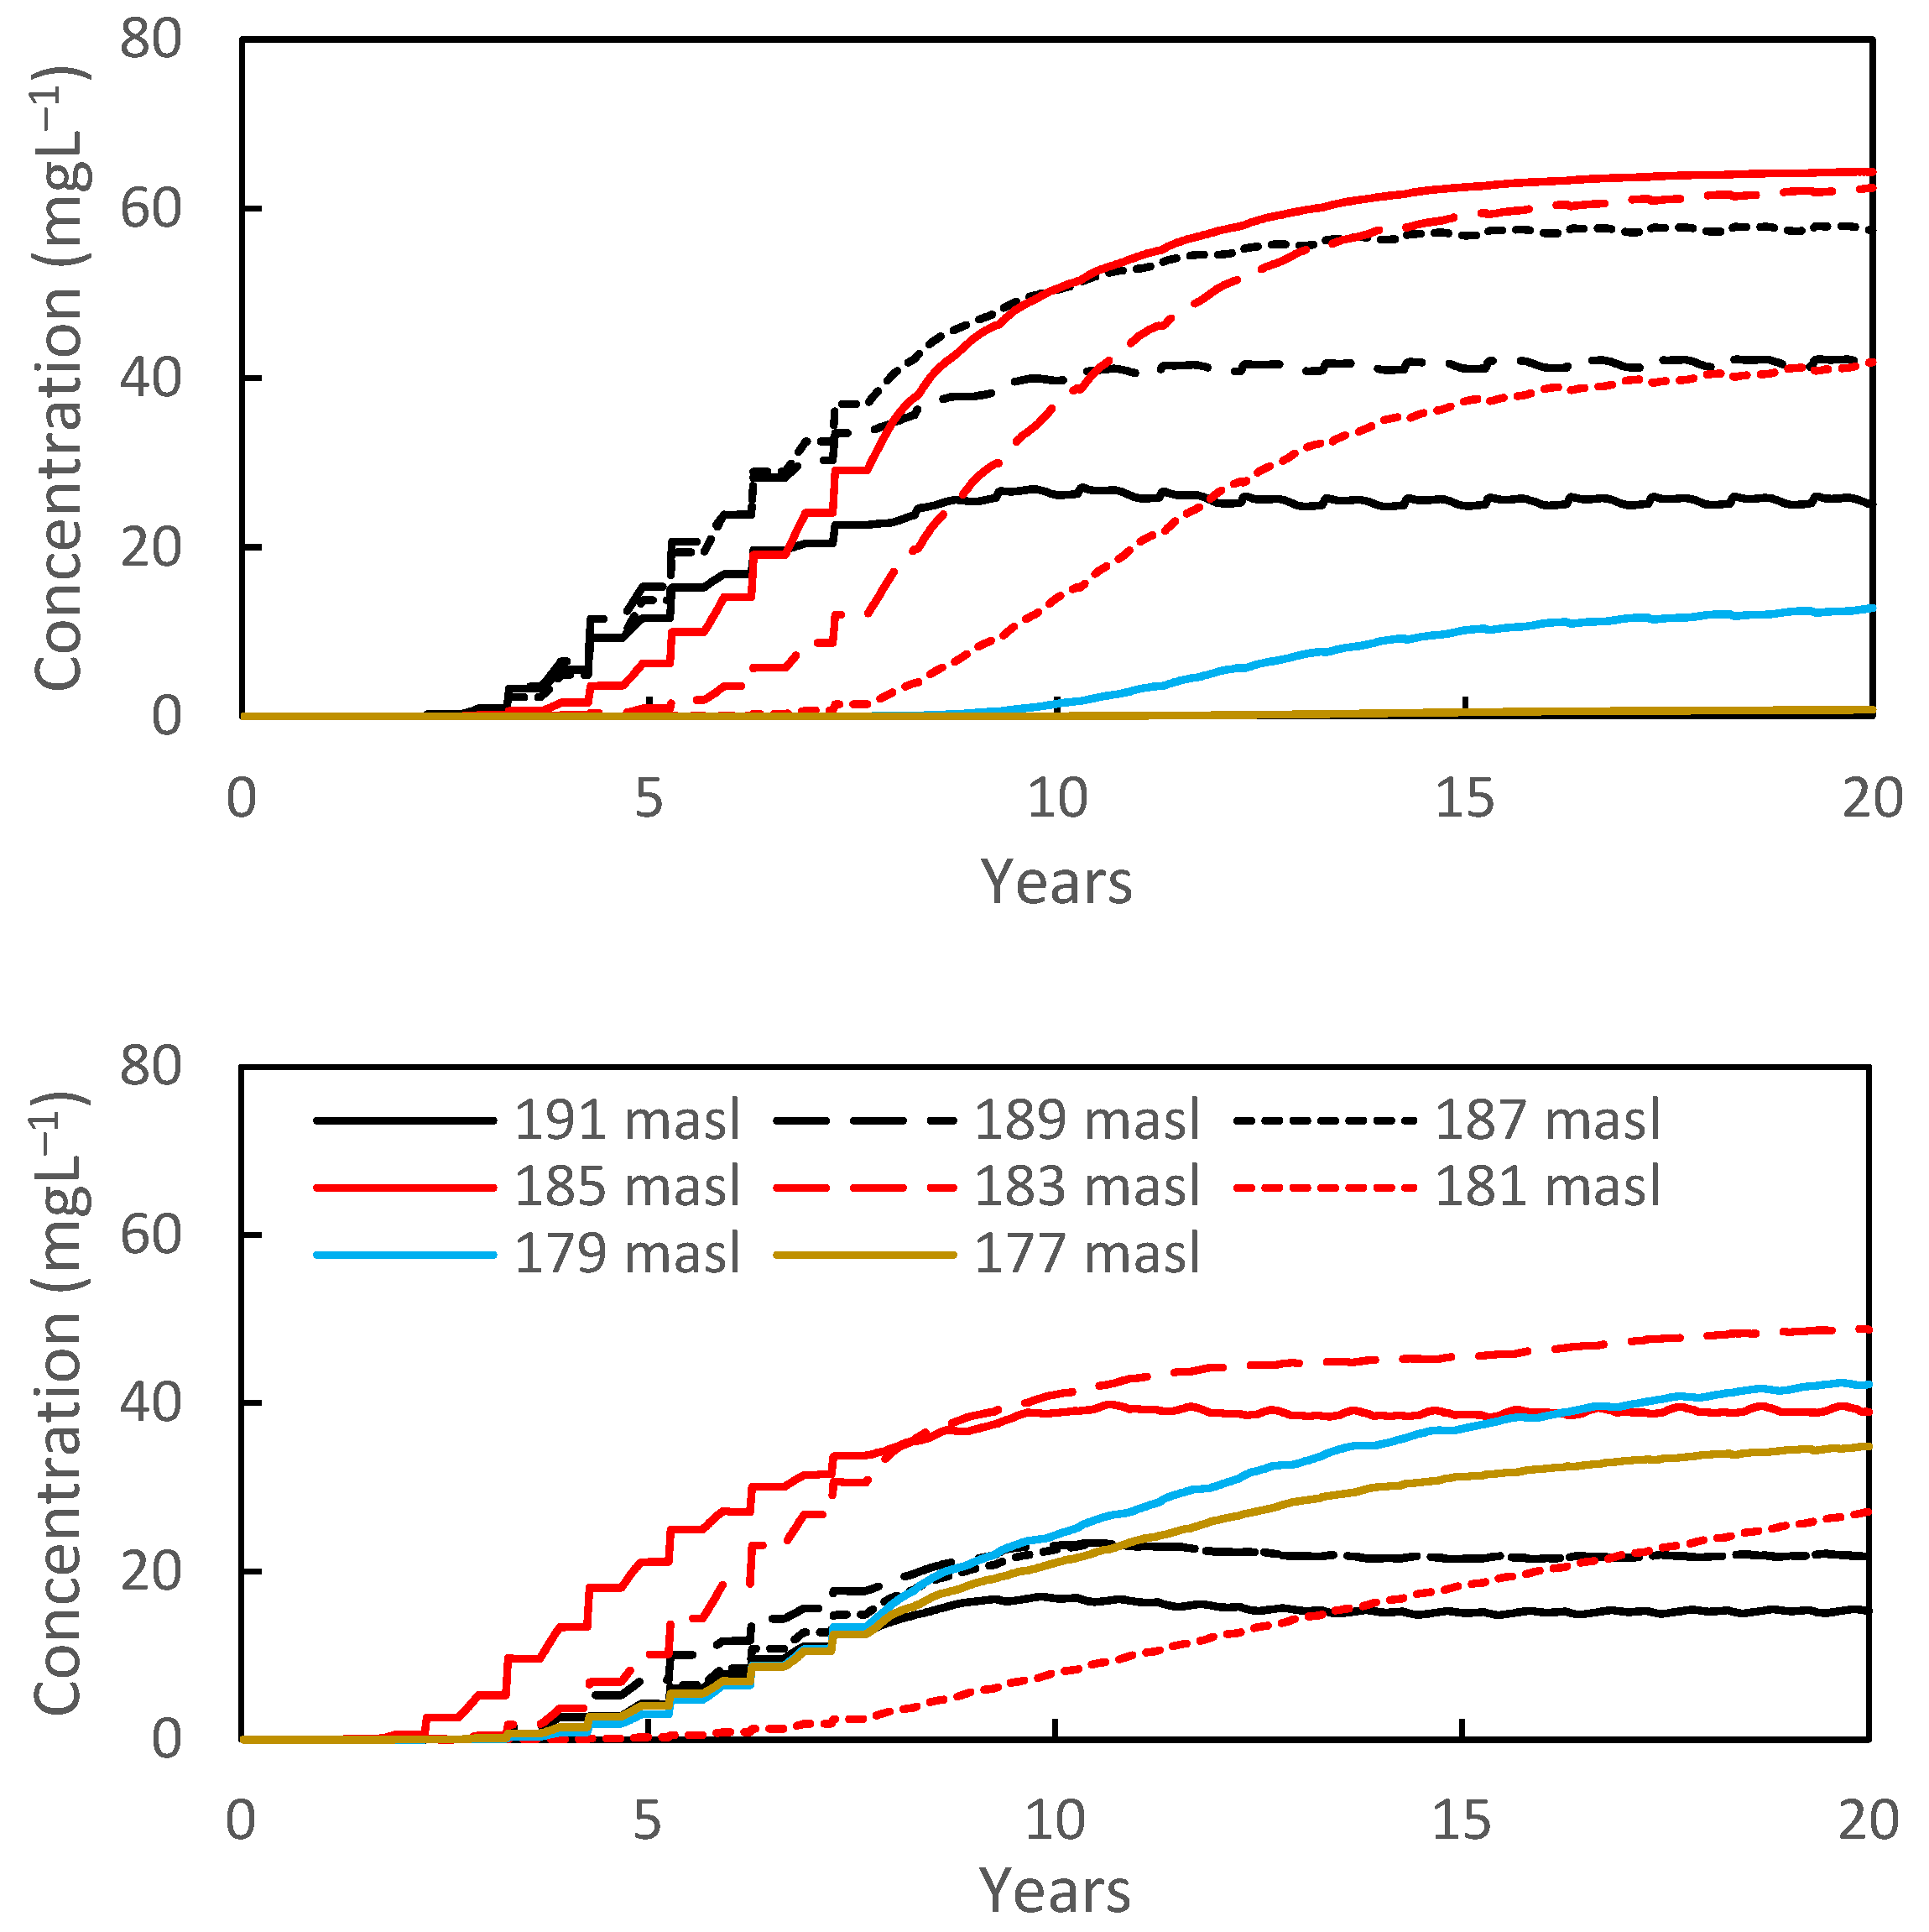
When the tracer is added recurrently each year, there is a build-up of the tracer in specific layers (Figure 9). When layers with different Ks are discontinuous, most of the tracer accumulates in the deepest layers (185–177 m.a.s.l.). With the homogeneous Ks case, less tracer accumulates at depth and more in the shallow part of the aquifer. The tracer concentrations reach a steady-state value at which the concentration no longer increases. However, the concentration in the deepest layers is still increasing after 20 years, particularly in the case of the discontinuous Ks layer.

3.4. Selected Water Quality Data from Oslo Airport, 1999–2019

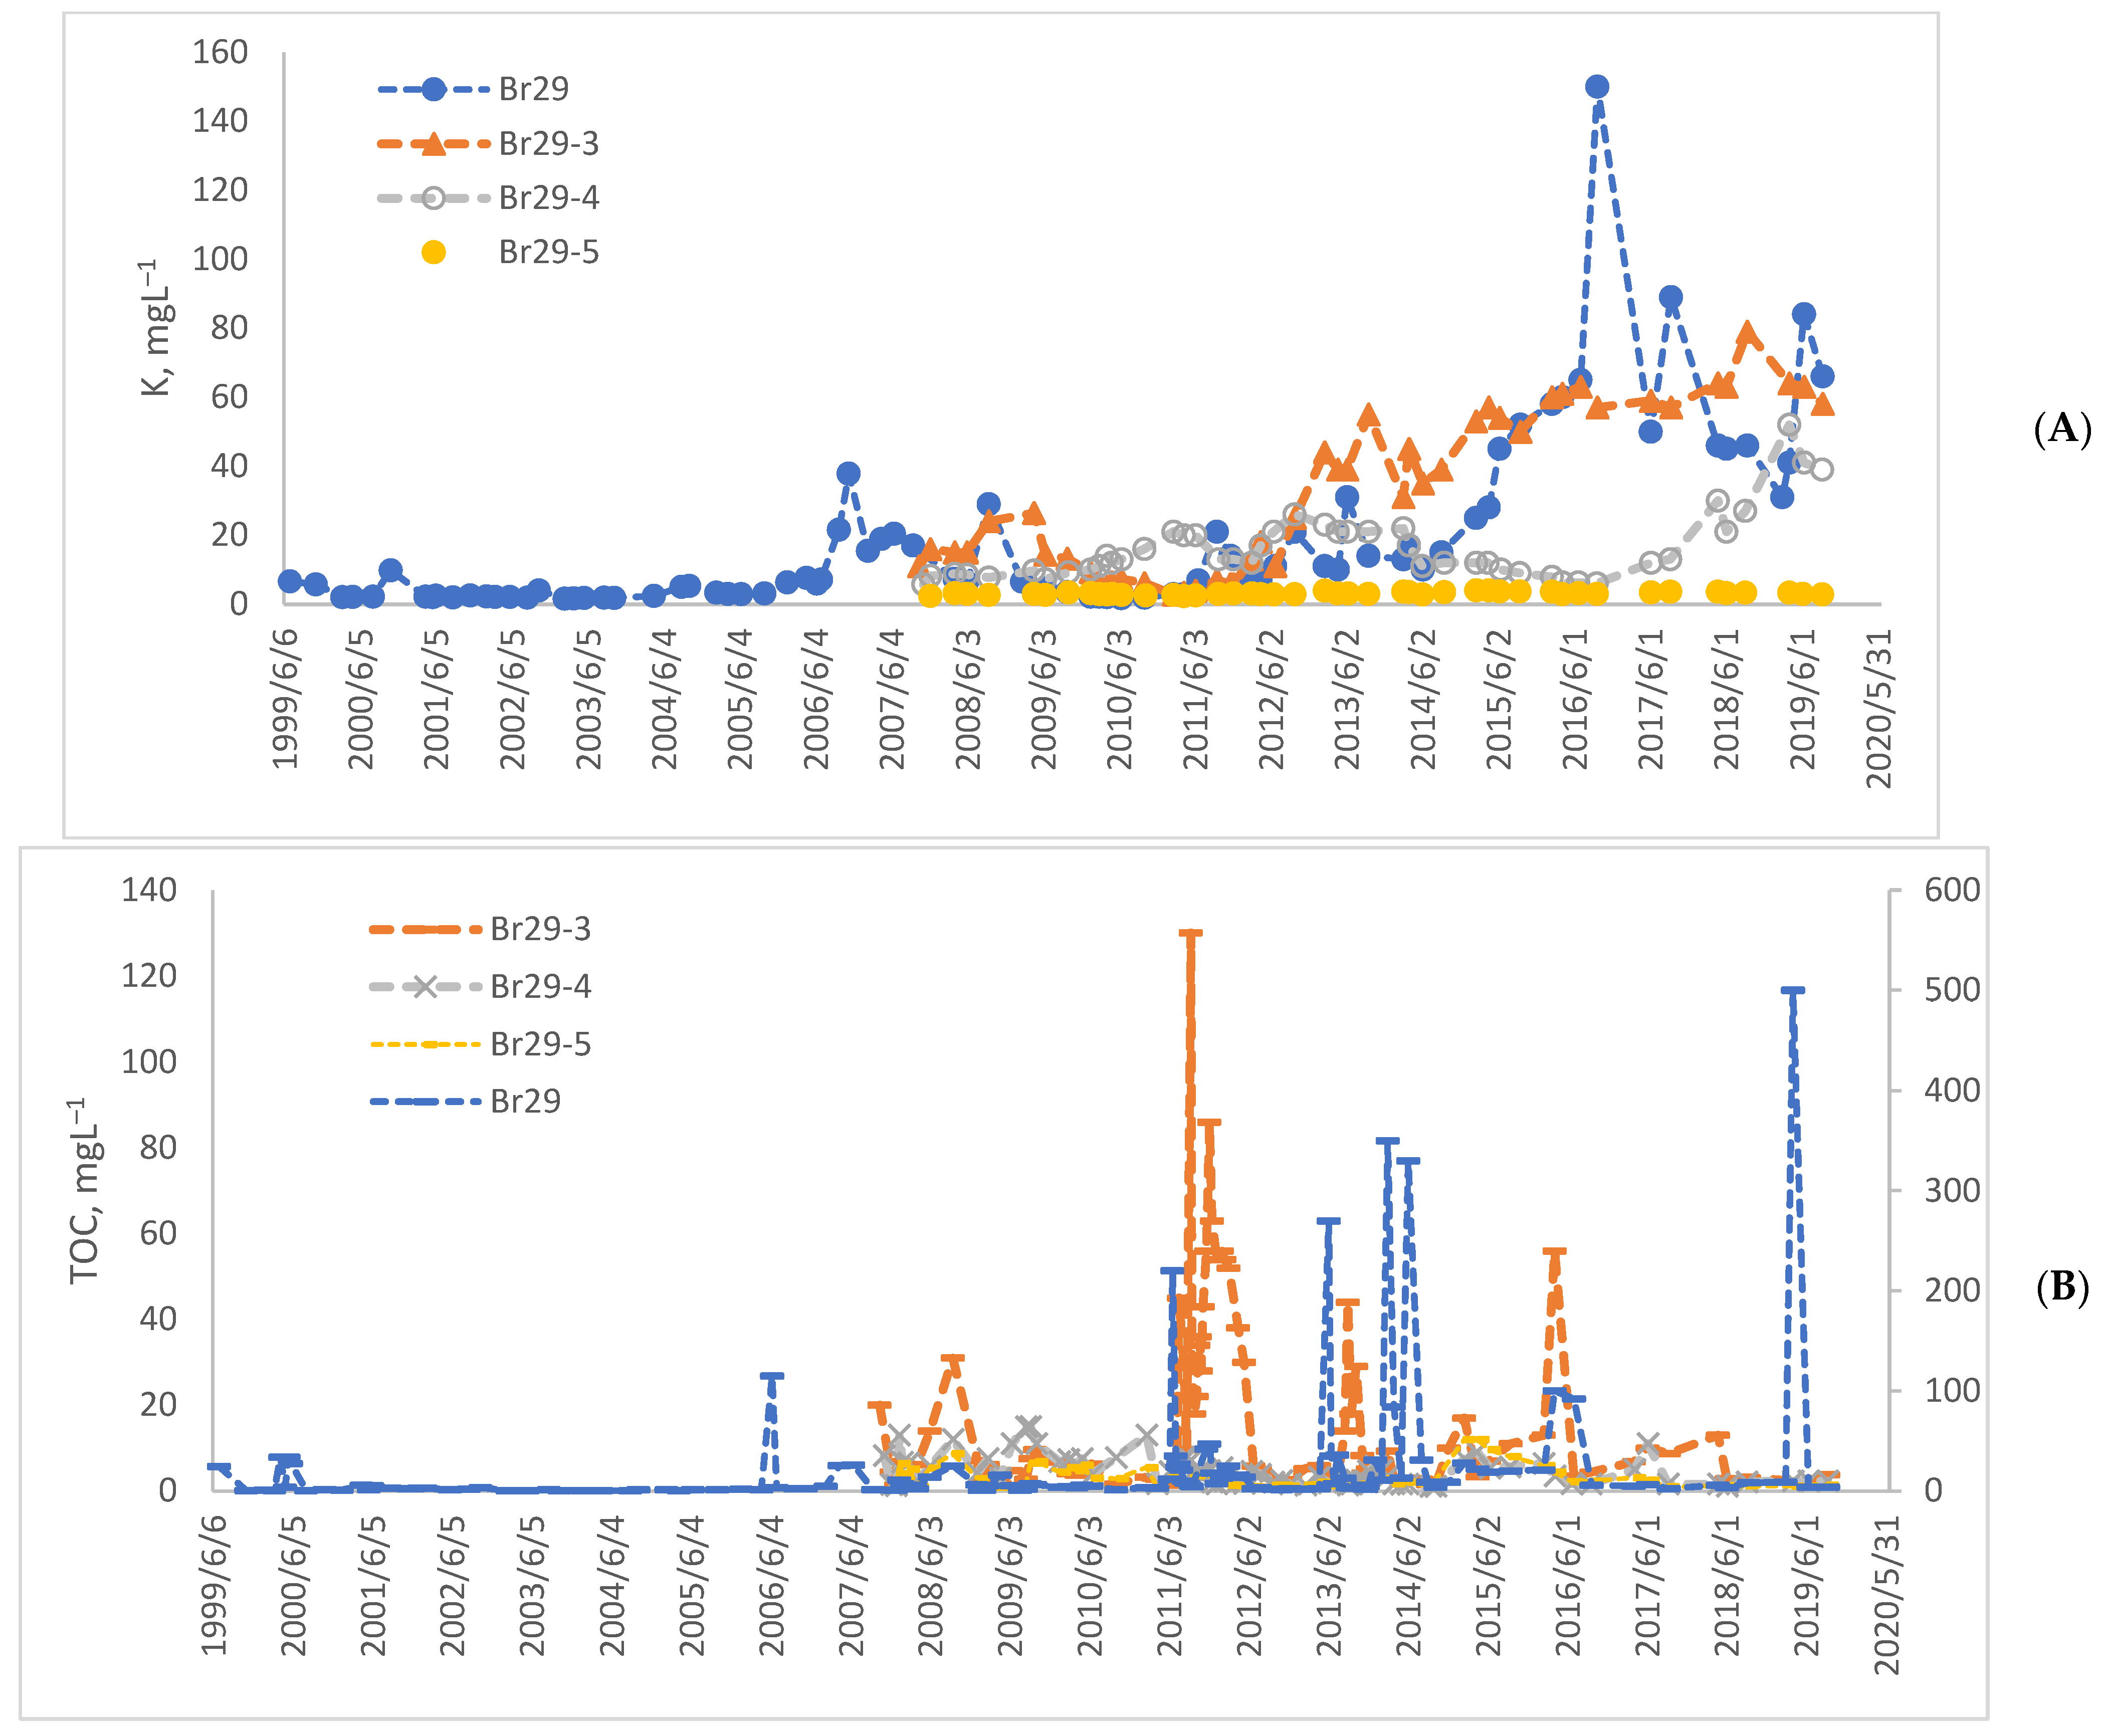
To give an impression of the observed seasonal and accumulated response on groundwater quality, we show the concentrations of potassium (Figure 10A) and total organic carbon (TOC, Figure 10B). Total organic carbon (TOC) includes both propylene glycol and formate as well as degradational products and is expected to be completely degraded by the time groundwater reaches the monitoring well furthest from the runway (Br29-5). Potassium constitutes the non-degradable part of the de-icing chemicals and is expected to behave more similarly to the modelled tracer. Hence, they are useful illustrations of the long-term observations in an affected area. The potassium concentrations show a cyclic effect consistent with annual pulses of de-icing chemicals. They also display a steadily increasing concentration towards what can seem like an asymptotic concentration level consistent with the results of the transient simulation of seasonal variation in recharge and pulses of de-icing chemicals (Figure 9). TOC concentrations clearly show the cyclic effect of the annual pulses and a more complete degradation at increasing distances from the runway (Br29, 15 m, and Br29-5, 160 m from the runway).

3.5. Water Quality Data from Deeper Wells at Oslo Airport

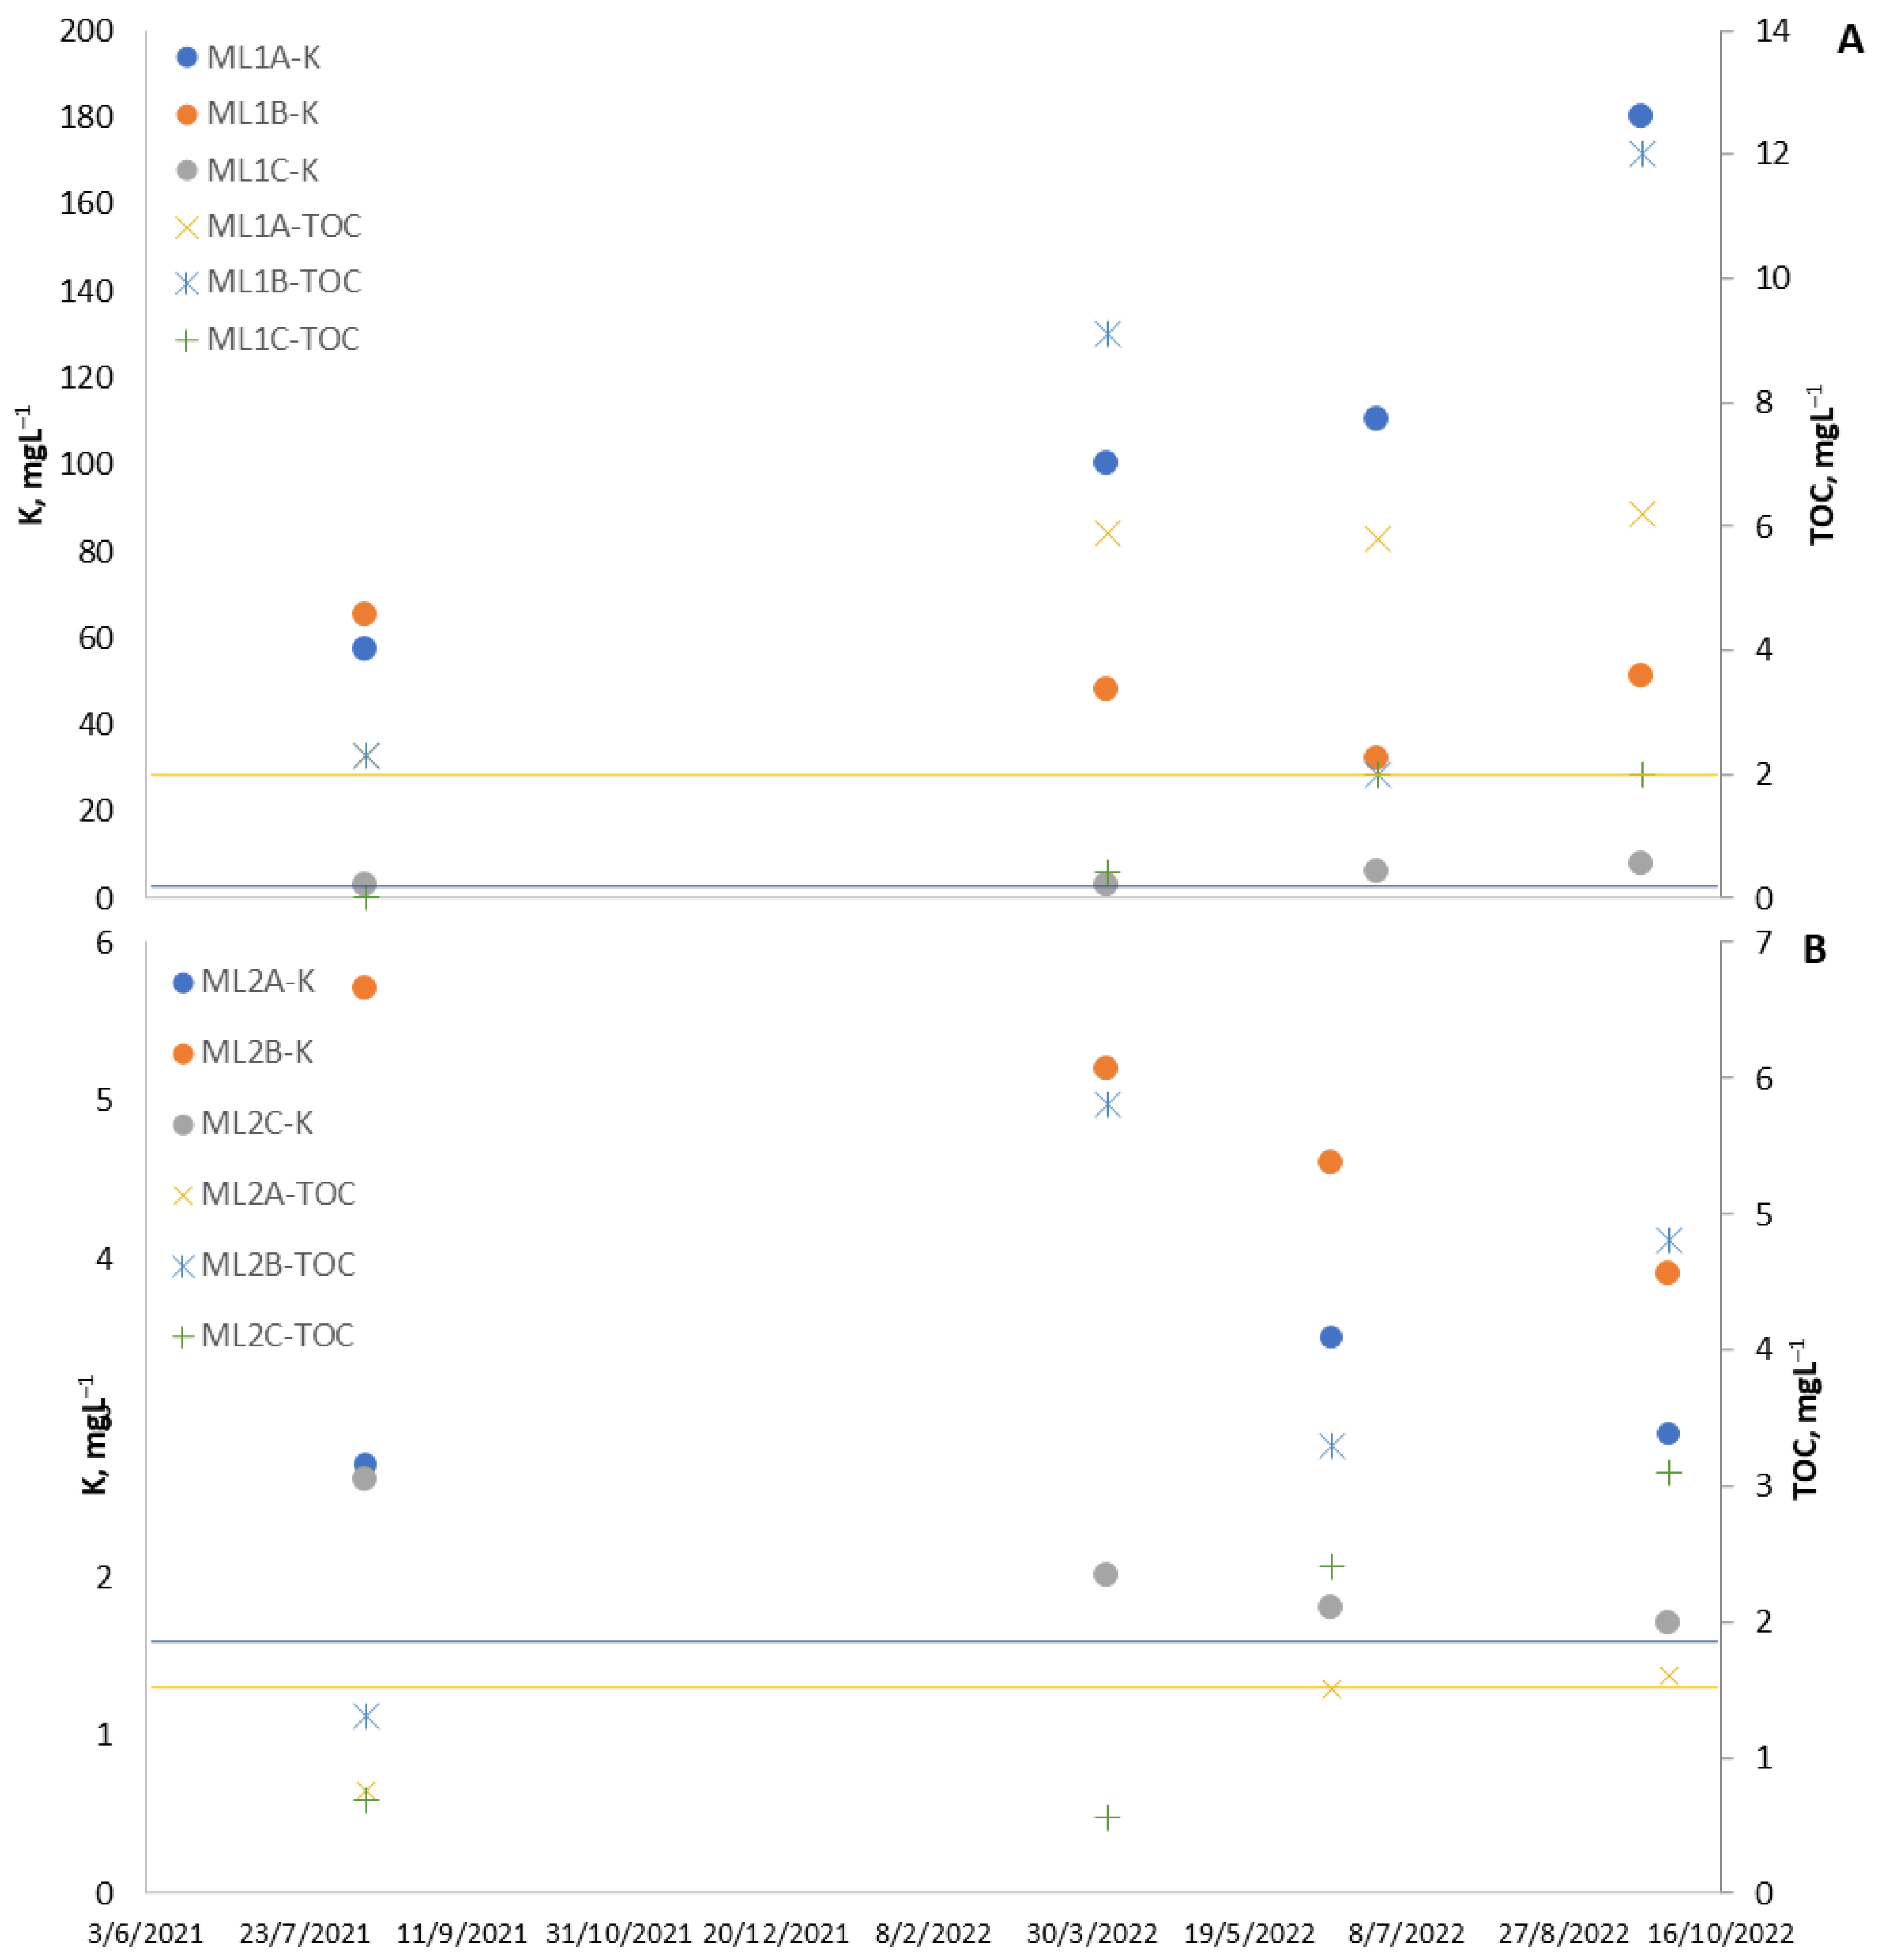
Although the groundwater samples from the Br29 transect wells nicely describe the main features of dilution (K) and degradation (TOC) (Figure 10A,B), recent measurements from the multi-level wells (ML1 and ML2, Figure 3) confirm contaminant transport to the deeper layers in the hotspot area along the western runway. Figure 11A clearly shows that the shallow and deeper well screens of ML1 at 10 m from the runway have higher potassium concentrations than the background. The same is the case for TOC. Although ML2 (Figure 11B), 130 m from the runway, has lower concentrations of potassium, in addition, the deeper screen seems to have a slightly raised concentration compared to the background values.

4. Discussion

Modelling of tracer distribution in a layered aquifer similar to that at Oslo Airport, Gardermoen, shows a stronger vertical flow component near a groundwater divide in the presence of horizontal layers of variable Ks. Although a vertical flow component near the groundwater divide is expected from general groundwater theory, the strong influence of layers is highlighted by our examples. Other studies that have explored this effect include Taylor et al. [24], who investigated the importance of vertical gradients using bundled multilevel piezometers and a double-packer assembly in dedicated boreholes. The importance of layers was documented by Rushton and Salmon [25], who found that when water passes vertically through low-conductivity zones in the Bromsgrove sandstone aquifer, significant vertical head gradients occur.
With a homogeneous Ks, the tracer plume shifts to deeper layers with increasing travel distance. This is expected since there is a recharge along the flow line, which creates a slight vertical gradient in the system (Figure 5). The vertical head gradients increase in layered aquifers, which causes the tracer to spread to deeper layers. The continuous layers cause preferential flow paths and semi-confining units. Layers with high Ks allow for rapid transport of the tracer, while the lower Ks layers slow down and confine the spread of the tracer. Such mechanisms may direct de-icing chemicals to more conductive layers.
The addition of up to 10 m long lenses with varying Ks had a large impact on the spread of the plume. These could retard or accelerate the spread of the tracer across the layers, depending on the specific spatial configuration of Ks. Overall, it seems that the tracer would stay in the groundwater system longer under heterogeneous conditions, suggesting further accumulation in certain layers over time with the annually recurrent use of de-icing chemicals. This was confirmed by the modelling of recurrent tracer additions. Several deeper layers had cumulatively increased tracer concentrations over time under heterogeneous conditions, while the build-up of the tracer occurred in shallow layers in the homogeneous case. Furthermore, the placement of different Ks lenses affects the connection between different layers, potentially creating ‘fast lanes’ and ‘slow lanes’ in the aquifer. Fernàndez-Garcia et al. [26] explained the point-to-point flow and transport connectivity by relating how much faster the head and travel time responses were when compared to those expected for the equivalent homogeneous flow problem. Nalarajan et al. [17] showed with numerical investigations of the well capture zone and solute transport that heterogeneity in the hydraulic conductivity field significantly enhances the non-uniformity in the flow and solute plume movements. Although a more statistically advanced approach was applied in this study, their results indicated that the influence of probable Ks realisations on the hydraulic behaviour within a heterogeneous aquifer could be adequately analysed even without complex stochastic models.
Time-varying recharge had a minor impact on the spread of the tracer for the tests performed here. It did, however, affect the concentration of the tracer and at what depth the tracer concentration would be higher or lower. A stronger effect could be expected if the recharge had greater temporal variability than what we modeled. Elfeki et al. [27] found a strong impact on contaminant transport only if the amplitude of head gradient oscillations is relatively large. This was based on a numerical study of solute transport under the influence of oscillating groundwater flow in a homogeneous aquifer. For relatively small oscillations, results were close to steady state conditions, similar to our results.
Field measurements of potassium concentrations in the hot-spot area of de-icing chemical release at Oslo Airport indicate a steady increase of the concentrations towards an asymptotic maximum and lower concentrations with increasing distances from the runway. This result is in line with the simulation results. Measured total organic carbon concentrations in the same wells show a cyclic effect reflecting the seasonal variation in inputs of de-icing chemicals. Although the scenarios modelled here are by no means exhaustive, the layered model scenarios seem to give a realistic representation of the solute transport pattern observed at Oslo Airport. The model results strongly support the installation of deeper monitoring wells, preferably multi-level wells that can capture zones of varying concentrations. This paper demonstrates the usefulness of using numerical modelling to explain contaminant transport processes and prompt managers at Oslo Airport to supplement the existing monitoring programme with multi-level sampling wells.
Many publications document the effect of heterogeneity and transient boundary conditions on solute transport [28], but these may not easily be grasped by practitioners. Our modelling study illustrates how a more simplistic set-up can provide enough information to improve the monitoring system at a specific site. The results also highlight the importance of mapping layers in the vicinity of the groundwater divide, and vertical flow should be carefully monitored in such areas. This is important for the future design of appropriate monitoring systems.

5. Conclusions

This modelling study shows that the vertical flow component near a groundwater divide is stronger in the presence of horizontal layers with variable hydraulic conductivity. Hence the importance of mapping such layers to predict plume movement near the groundwater divide. Further, the study demonstrates that a layered structure may have a large impact on the spread of a tracer, and contaminants can become ‘trapped’ in certain layers, depending on the combination of contaminant infiltration and discontinuities of the layers. It is therefore important that the monitoring system allows for the collection of depth-specific groundwater samples. Time-varying boundary conditions had less effect on the plume movement than the layer structures defined for the tested circumstances. The 20 year time series of field measurements of potassium and total organic carbon concentrations in the hot-spot area of de-icing chemical release at Oslo Airport support the simulation results, showing a steady increase in concentrations towards an asymptotic maximum as well as a cyclic effect reflecting the seasonal input of de-icing chemicals. Recently added multi-level sampling wells confirm contaminant transport to deeper layers. The model results presented here provide a useful example for designing groundwater monitoring programmes, and they strongly support the installation of multi-level samplers, especially near groundwater divides. Further modelling studies could include anisotropy effects and the effect of heterogeneities within the different layers.

Author Contributions

Conceptualisation, H.K.F.; facilitation of field data, K.G.M. and J.S.; formal analysis of field data, M.C.H. and J.S.; modelling investigation, H.K.F.; resources and data curation, M.C.H., K.G.M. and J.S.; writing—original draft preparation, H.K.F.; writing—review and editing, M.C.H.; visualisation, H.K.F. All authors have read and agreed to the published version of the manuscript.

Funding

This research was funded by the Oslo Airport, NGI, and the Earth Rescue Centre for Research Driven Innovation, Rescue of Earth Materials in the Circular Economy, partly funded by the Research Council of Norway, grant number 310042.

Data Availability Statement

No new data were created; Oslo Airport is the owner of the monitoring data that were used in this study.

Acknowledgments

The authors also thank colleagues at Oslo Airport, NGI, and NMBU for valuable discussions and the funders who supported our work. A special thanks to Joris Stuurop, who conducted the simulations and created the groundwater map. We highly appreciate the valuable collaboration with Oslo Airport for sharing data collected as part of their monitoring programme and for their willingness to implement suggested well installations.

Conflicts of Interest

The authors declare no conflict of interest. The funders had no role in the design of the study; in the collection, analyses, or interpretation of data; in the writing of the manuscript; or in the decision to publish the results.

References

  1. EPA-821-R-12-003; Environmental Impact and Benefit Assessment for the Final Effluent Limitation Guidelines and Standards for the Airport Deicing Category. EPA: Washington, DC, USA, 2012; 187p.
  2. French, H.K.; Van der Zee, S.E.A.T.M. Improved management of winter operations to limit subsurface contamination with degradable deicing chemicals in cold regions. Environ. Sci. Pollut. Res. 2013, 21, 8897–8913. [Google Scholar] [CrossRef] [PubMed]
  3. French, H.K.; Van der Zee, S.E.A.T.M.; Leijnse, A. Transport and degradation of propyleneglycol and potassium acetate in the unsaturated zone. J. Contam. Hydrol. 2001, 49, 23–48. [Google Scholar] [CrossRef] [PubMed]
  4. Wejden, B.; Øvstedal, J. Contamination and degradation of de-icing chemicals in the unsaturated and saturated zones at Oslo airport Gardermoen, Norway. In Urban Groundwater Management and Sustainability; NATO Science Series; Tellam, J.H., Rivett, M.O., Israfilov, R.G., Herringshaw, L.G., Eds.; Springer: Dordrecht, The Netherlands, 2006; Volume 74. [Google Scholar] [CrossRef]
  5. De Vries, J. Solute Transport and Water Flow in an Unsaturated, Heterogeneous Profile with Root Water Uptake. Master’s Thesis, Wageningen University, Wageningen, The Netherlands, 2016; 36p. [Google Scholar]
  6. Hansen, M.C.; Breedveld, G.; French, H.K. Vurdering av Endringer i Grunnvannskjemi på OSL fra 1999 til 2019; Technical Report 201905083-01-R; Norges Geotekniske Institutt: Oslo, Norway, 2020a. [Google Scholar]
  7. Jørgensen, P.; Østmo, S.R. Hydrogeology in the Romerike area, southern Norway. NGU Bull. 1990, 418, 19–26. [Google Scholar]
  8. Tuttle, K.J.; Østmo, S.R.; Andersen, B.Ö.G. Quantitative study of the distributary braidplain of the Preboreal ice-contact Gardermoen delta complex. Southeastern Norway. Boreas 1997, 26, 141–156. [Google Scholar] [CrossRef]
  9. Sundal, A.; Brennwaldb, M.S.; Aagaard, P.; Kipfer, K. Noble gas composition and 3H/3He groundwater ages in the Gardermoen Aquifer, Norway: Improved understanding of flow dynamics as a tool for water management. Sci. Total Environ. 2019, 660, 1219–1231. [Google Scholar] [CrossRef] [PubMed]
  10. French, H.K.; Van der Zee, S. Field scale observations of small scale spatial variability of snowmelt drainage and infiltration. Nord. Hydrol. 1999, 30, 166–176. [Google Scholar] [CrossRef]
  11. French, H.K.; Binley, A. Snowmelt Infiltration: Monitoring Temporal and Spatial Variability using Time-Lapse Electrical resistivity. J. Hydrol. 2004, 297, 174–186. [Google Scholar] [CrossRef]
  12. French, H.K. Fra Nedbør til Grunnvann, Dette Visste du Ikke … GEO Energi & Ressurser, GEO365.no. 23, 4. 2020. Available online: https://geoforskning.no/fra-nedbor-til-grunnvann/ (accessed on 1 January 2023). (In Norwegian).
  13. Bloem, E.; Forquet, N.; Søiland, A.; Binley, A.; French, H.K. Towards understanding time-lapse electrical resistivity signals measured during contaminated snowmelt infiltration. Near Surf. Geophys. 2020, 18, 399–412. [Google Scholar] [CrossRef]
  14. Østmo, S.R. Hydrogeological map of Øvre Romerike, M 1:20.000. Norwegian Geological Survey, 1976. [Google Scholar]
  15. Øvstedal, J.; Wejden, B. Dispersion and infiltration of de-icing chemicals in frozen soil at Oslo Airport Gardermoen. In Abstract and Proceedings of the Geological Society of Norway, 5th International Conference on Contaminants in Freezing Ground, Oslo, 21–25 May 2006; Norwegian Geotechnical Institute: Oslo, Norway, 2006. [Google Scholar]
  16. Øvstedal, J.; Wejden, B. Dispersion of De-Icing Chemicals to the Areas Along the Runways at Oslo Airport Gardermoen; SAE Technical Paper; SAE: London, UK, 2007; ISSN 0148-7191. [Google Scholar] [CrossRef]
  17. Nalarajan, N.A.; Govindarajan, S.K.; Nambi, I.M. Aquifer heterogeneity on well capture zone and solute transport: Numerical investigations with spatial moment analysis. Int. J. Environ. Sci. Technol. 2022, 19, 7261–7274. [Google Scholar] [CrossRef]
  18. Harbaugh, A.W. MODFLOW-2005, The U.S. Geological Survey Modular Ground-Water Model—The Ground-Water Flow Process, U.S. Geological Survey Techniques and Methods 6-A16; U.S. Geological Survey: Reston, VA, USA, 2005. [Google Scholar]
  19. Bedekar, V.; Morway, E.D.; Langevin, C.D.; Tonkin, M. MT3D-USGS Version 1: A U.S. Geological Survey Release of MT3DMS Updated with New and Expanded Transport Capabilities for Use with MODFLOW; U.S. Geological Survey Techniques and Methods 6-A53; U.S. Geological Survey: Reston, VA, USA, 2016; 69p. [Google Scholar] [CrossRef] [Green Version]
  20. Winston, R.B. ModelMuse Version 4—A Graphical User Interface for MODFLOW 6: U.S.; Geological Survey Scientific Investigations Report 2019–5036; U.S. Geological Survey: Reston, VA, USA, 2019; 10p. [Google Scholar] [CrossRef]
  21. Pedersen, T.S. Væsketransport i Umettet Sone, Stratigrafisk Beskrivelse av Toppsedimentene på Forskningsfeltet, Moreppen, og Bestemmelse av Tilh¢rede Hydrauliske Parametre; Flow in the Unsaturated Zone, Stratigraphic Description of the Top Sediments at the Research Station, Moreppen, and the Determination of Hydraulic Parameters. Master’s Thesis, Department of Geology, University of Oslo, Oslo, Norway, 1994; pp. 1–122. [Google Scholar]
  22. Hansen, M.C.; French, H.K.; Stuurop, J. Modellering av Grunnvannstroemning i br29 Området; Technical Report 201905083-02-R; Norges Geotekniske Institutt: Oslo, Norway, 2020b. [Google Scholar]
  23. Waade, A. Sustainability and Degradation of Chemical Deicers in the Gardermoen Aquifer, Iron and Manganese Redox Processes. Master’s Thesis, Geosciences, Faculty of Mathematics and Natural Sciences, University in Oslo, Oslo, Norway, 2022; 116p. [Google Scholar]
  24. Taylor, R.G.; Cronin, A.; Trowsdale, S.; Baines, O.; Barrett, M.; Lerner, D. Vertical groundwater flow in Permo-Triassic sediments underlying two cities in the Trent River Basin (UK). J. Hydrol. 2003, 284, 92–113. [Google Scholar] [CrossRef]
  25. Rushton, K.R.; Salmon, S. Significance of vertical flow through low-conductivity zones in Bromsgrove Sandstone Aquifer. J. Hydrol. 1993, 152, 131–152. [Google Scholar] [CrossRef]
  26. Fernàndez-Garcia, D.; Trinchero, P.; Sanchez-Vila, X. Conditional stochastic mapping of transport connectivity. Water Resour. Res. 2010, 46, W10515. [Google Scholar] [CrossRef]
  27. Elfeki, A.M.M.; Uffink, G.; Lebreton, S. Simulation of solute transport under oscillating groundwater flow in homogeneous aquifers. J. Hydraul. Res. 2007, 45, 254–260. [Google Scholar] [CrossRef] [Green Version]
  28. Dagan, G.; Neuman, S.P. Subsurface Flow and Transport: A Stochastic Approach, 1st ed.; Cambridge Univiversity Press: Cambridge, UK, 1997; 241p. [Google Scholar]
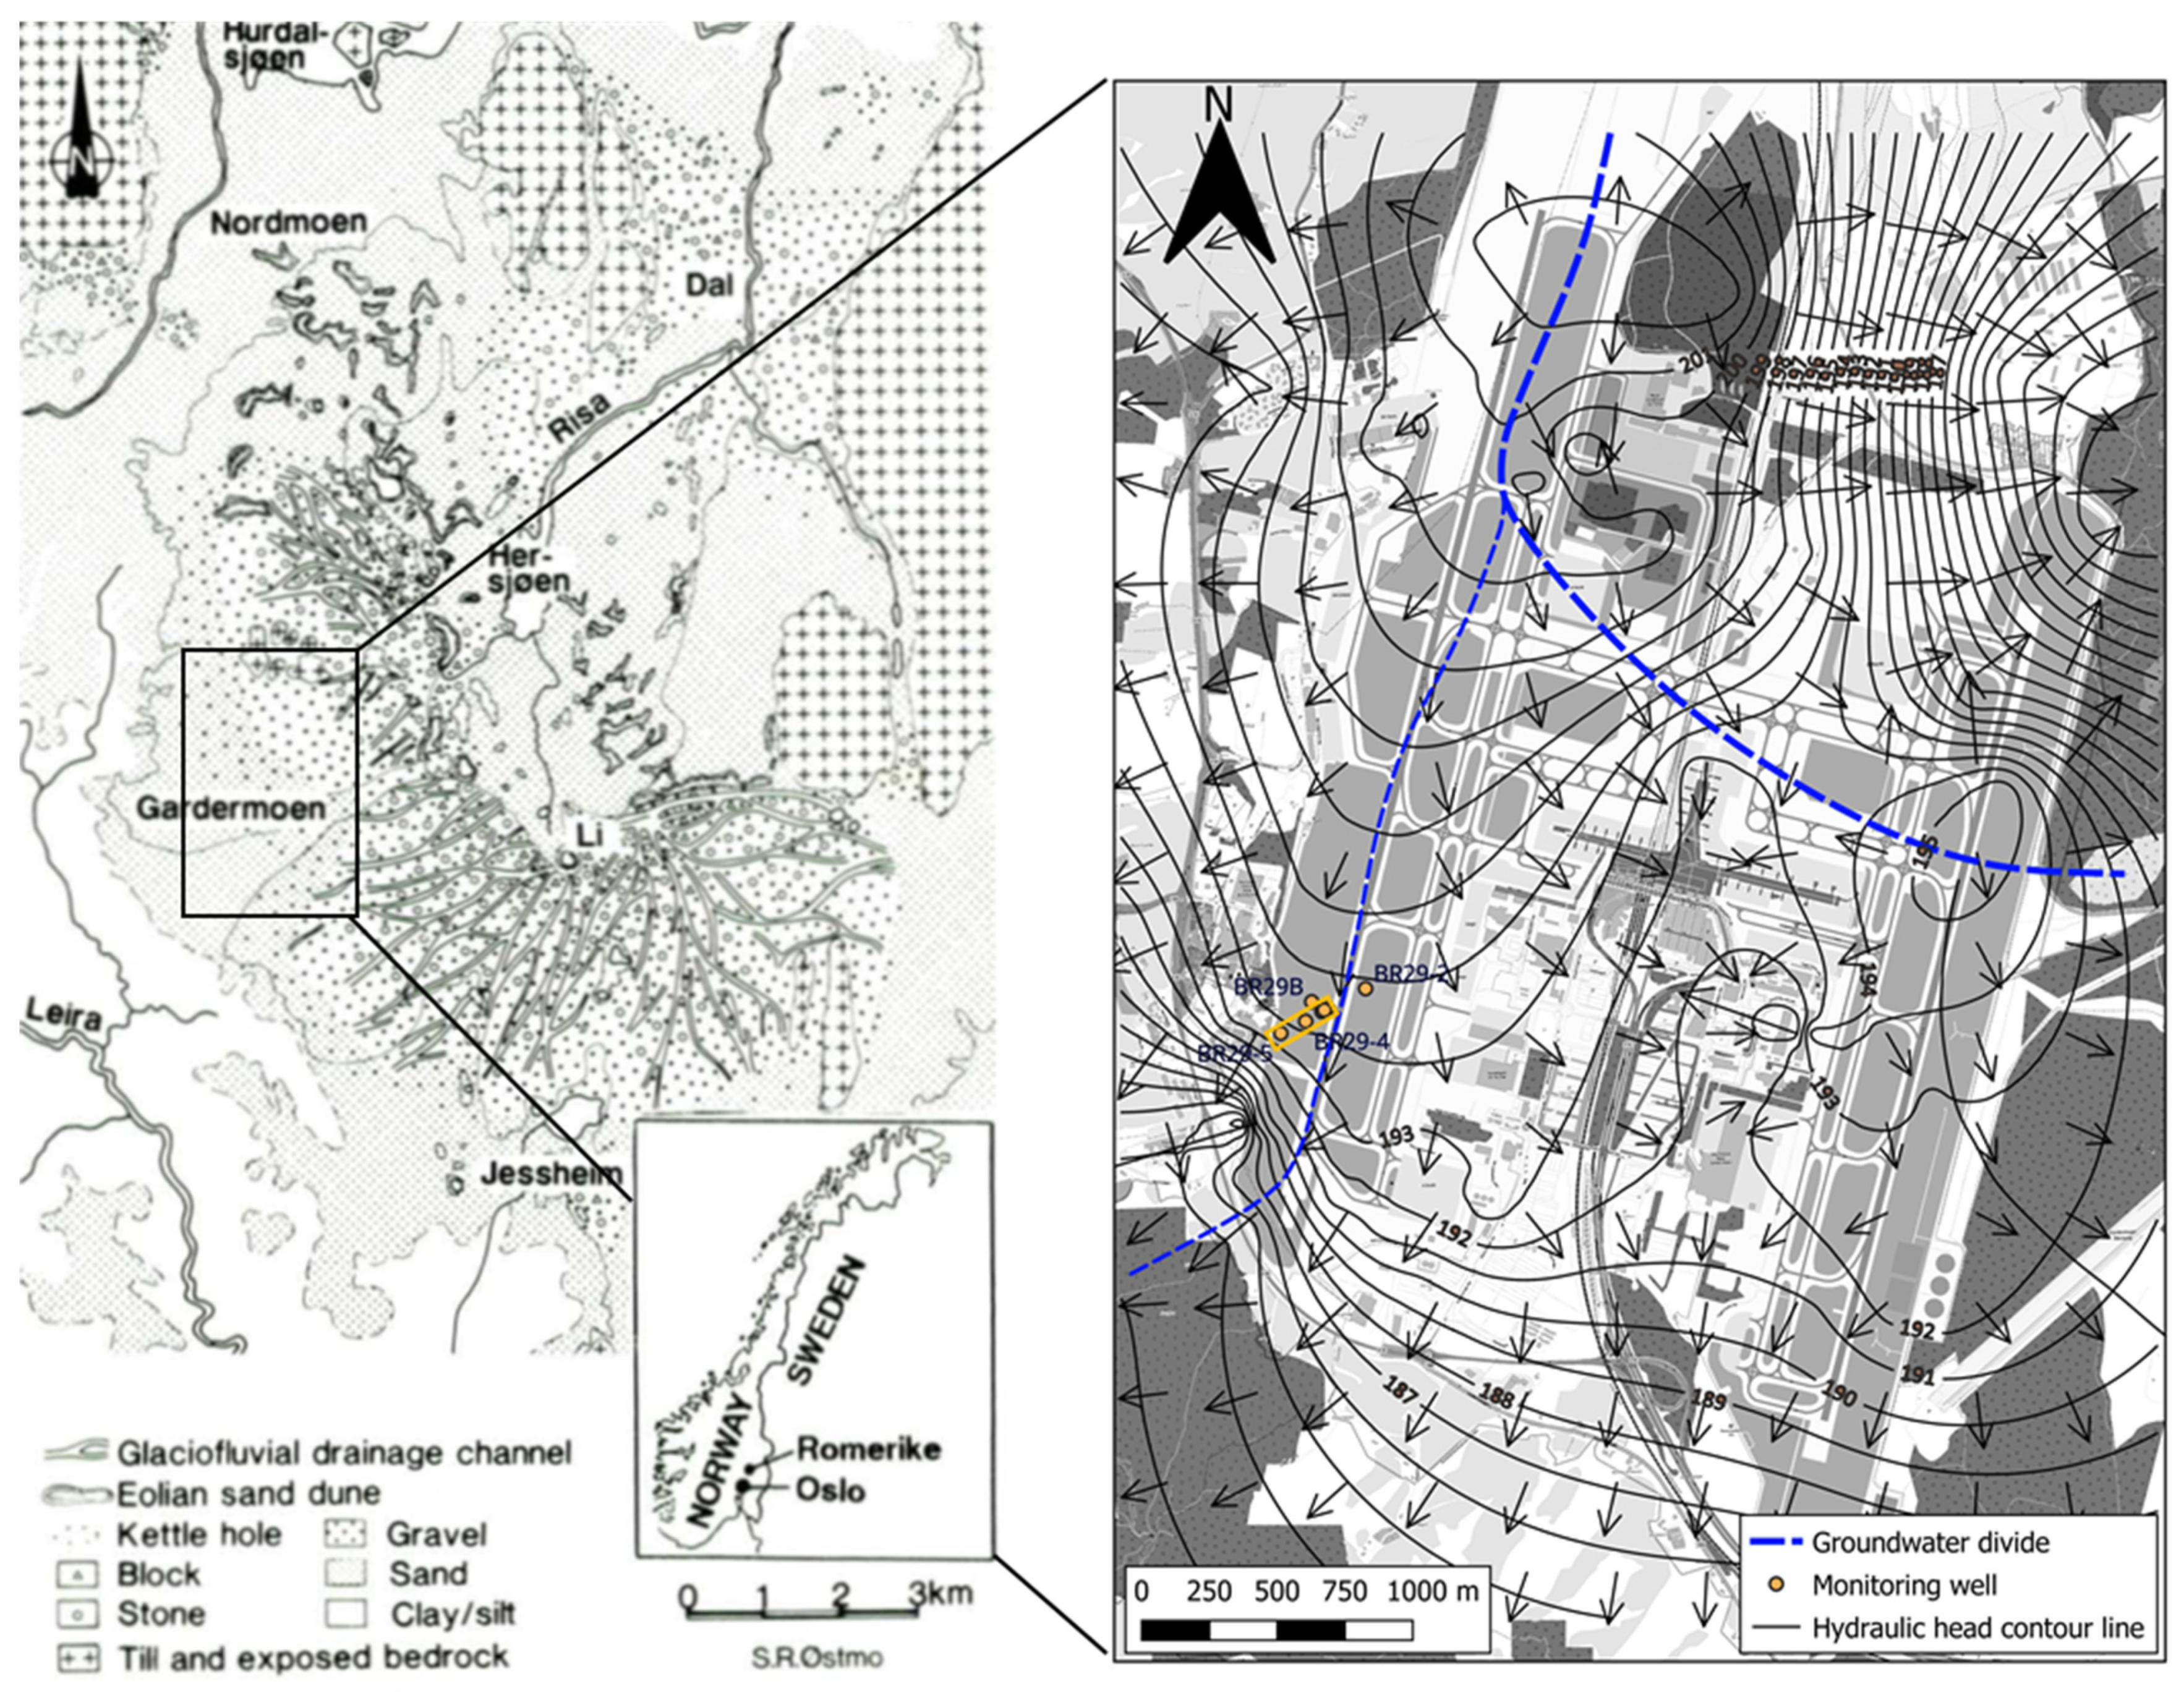
Figure 1. On the left is a map of the quaternary geology of the Romerike area [7]. The location of Oslo Airport is indicated by the rectangle. On the right is a groundwater map based on groundwater levels measured in 2021. The thick stippled line shows the main groundwater divide, while the thinner stippled line shows the local groundwater divide along the western runway. The Br29 monitoring wells inspiring the model scenarios carried out in this study are included as yellow points, and the model domain is a yellow rectangle.
Water 15 00985 g001
Figure 2. Modelled transport of de-icing chemicals in a 5 m deep heterogeneous unsaturated zone and a total infiltration of 245 mm during a 31 day snowmelt period at Gardermoen and the rise of the groundwater table [12,13].
Water 15 00985 g002
Figure 3. Well logs along the Br29 transect (Figure 1) and dominant grain size classification of layers observed during the drilling. The deep multilevel wells, ML1 and ML2, with screens at A, B and C were installed after the modelling presented here was performed, highlighting the importance of vertical flow effects in the vicinity of the groundwater divide. The approximate groundwater level and direction of flow are indicated. The model domain is shown with stippled lines, and the location of tracer infiltration and the zone of discontinuous layer (DCL) are all indicated on the top boundary.
Water 15 00985 g003
Figure 4. Model geometry (inspired by well logs shown in Figure 3), boundary conditions, and the main setup defining three model scenarios (1–3) with different hydraulic conductivity (Ks) distributions. The homogeneous setup has medium Ks in all layers (not shown). The scenario with continuous layers is the same as those shown here, but the layers are not broken up by the discontinuous layers section (Figure 3), indicated here as lenses. Vertical lines A and B show locations where simulated breakthrough curves are observed.
Water 15 00985 g004
Figure 5. Hydraulic head equipotential lines (contour interval 0.1 m) for the homogeneous (top), continuous, and discontinuous layers of variable Ks, respectively, (Model 1 is used for illustration).
Water 15 00985 g005
Figure 6. Concentration of added tracer for different elevations (corresponding to the different discretized layers), different model configurations, and two different locations (A and B, Figure 4) against time. The model scenario given in the graphs on the right (location B) also applies to the graphs on the left (location A).
Water 15 00985 g006
Figure 7. Spatial distribution of tracer concentration after 15 years for the homogeneous, continuous, and discontinuous Ks cases (Model 1, Figure 4). Conc. = concentration.
Water 15 00985 g007
Figure 8. Modelled tracer breakthrough curves for time-varying (right) and steady-state (left) recharge scenarios, and for both the homogeneous (top) and layered Ks (bottom) cases.
Water 15 00985 g008
Figure 9. Modelled tracer breakthrough curves for the time-varying recharge scenario, including, annual recurring addition of tracer during the defined snowmelt period and for both homogeneous (top) and discontinuous Ks layers (bottom). Model 1 is used as an illustration for the discontinuous, layered system.
Water 15 00985 g009
Figure 10. Observed concentrations from 1999 to 2019 of (A) potassium (K) and (B) total organic carbon (TOC) in monitoring well Br29 shown on the secondary y-axis and wells Br29-3, Br29-4, and Br29-5 on the primary y-axis (for distance from runway see Figure 3), wells from Br29-3 to Br29-5 were installed in 2007.
Water 15 00985 g010
Figure 11. Concentrations of potassium (K, left y-axis) and total organic carbon (TOC, right y-axis) in water sampled at three depths of the multilevel samplers (Figure 3), (A) ML1 at 10 m and (B) ML2, installed at 10 and 130 m from the runway, respectively. Maximum background concentrations of K are indicated as blue straight lines, and the equivalent for TOC as yellow lines.
Water 15 00985 g011
Disclaimer/Publisher’s Note: The statements, opinions and data contained in all publications are solely those of the individual author(s) and contributor(s) and not of MDPI and/or the editor(s). MDPI and/or the editor(s) disclaim responsibility for any injury to people or property resulting from any ideas, methods, instructions or products referred to in the content.