
Hydrochemical Characterization and Quality Assessment of Groundwater in Hatiya Island, Southeastern Coastal Region of Bangladesh

 , , ,
, , ,
Abstract
1. Introduction
2. Materials and Methods
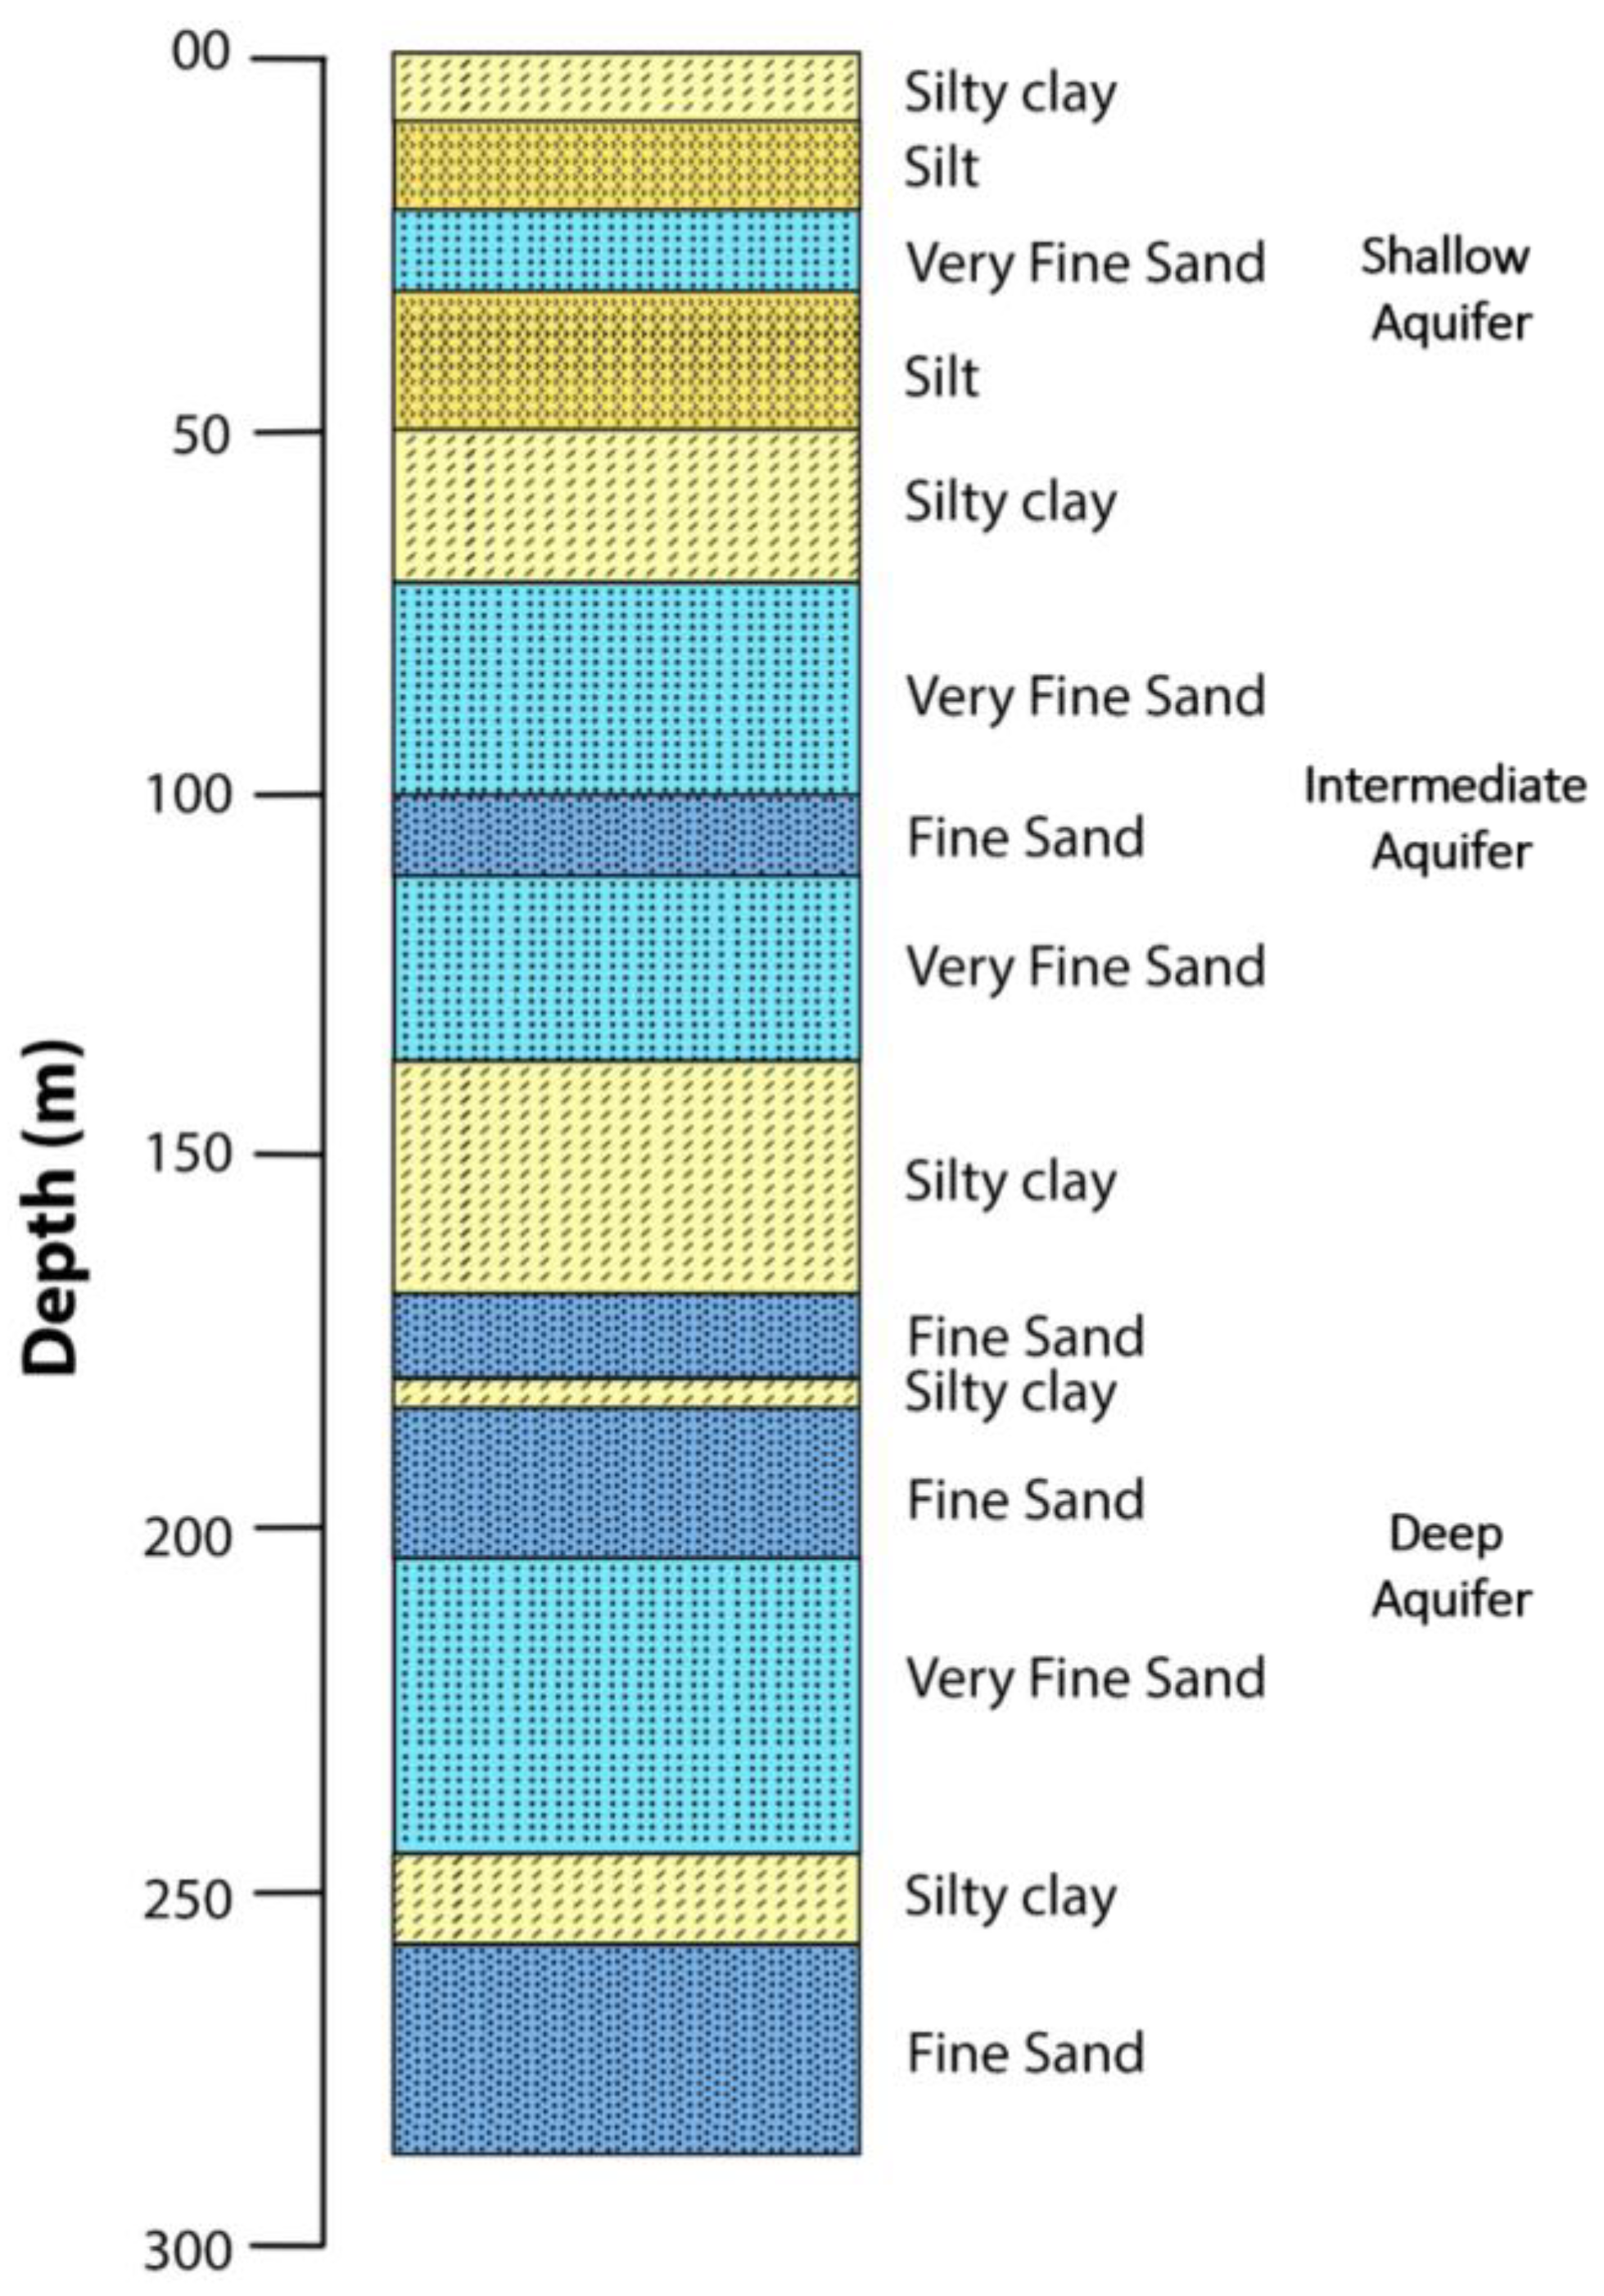
2.1. Study Area
2.2. Groundwater Sampling and Chemical Analyses
2.3. Hydrogeochemical Data Analyses
2.4. Geostatistical Data Analyses
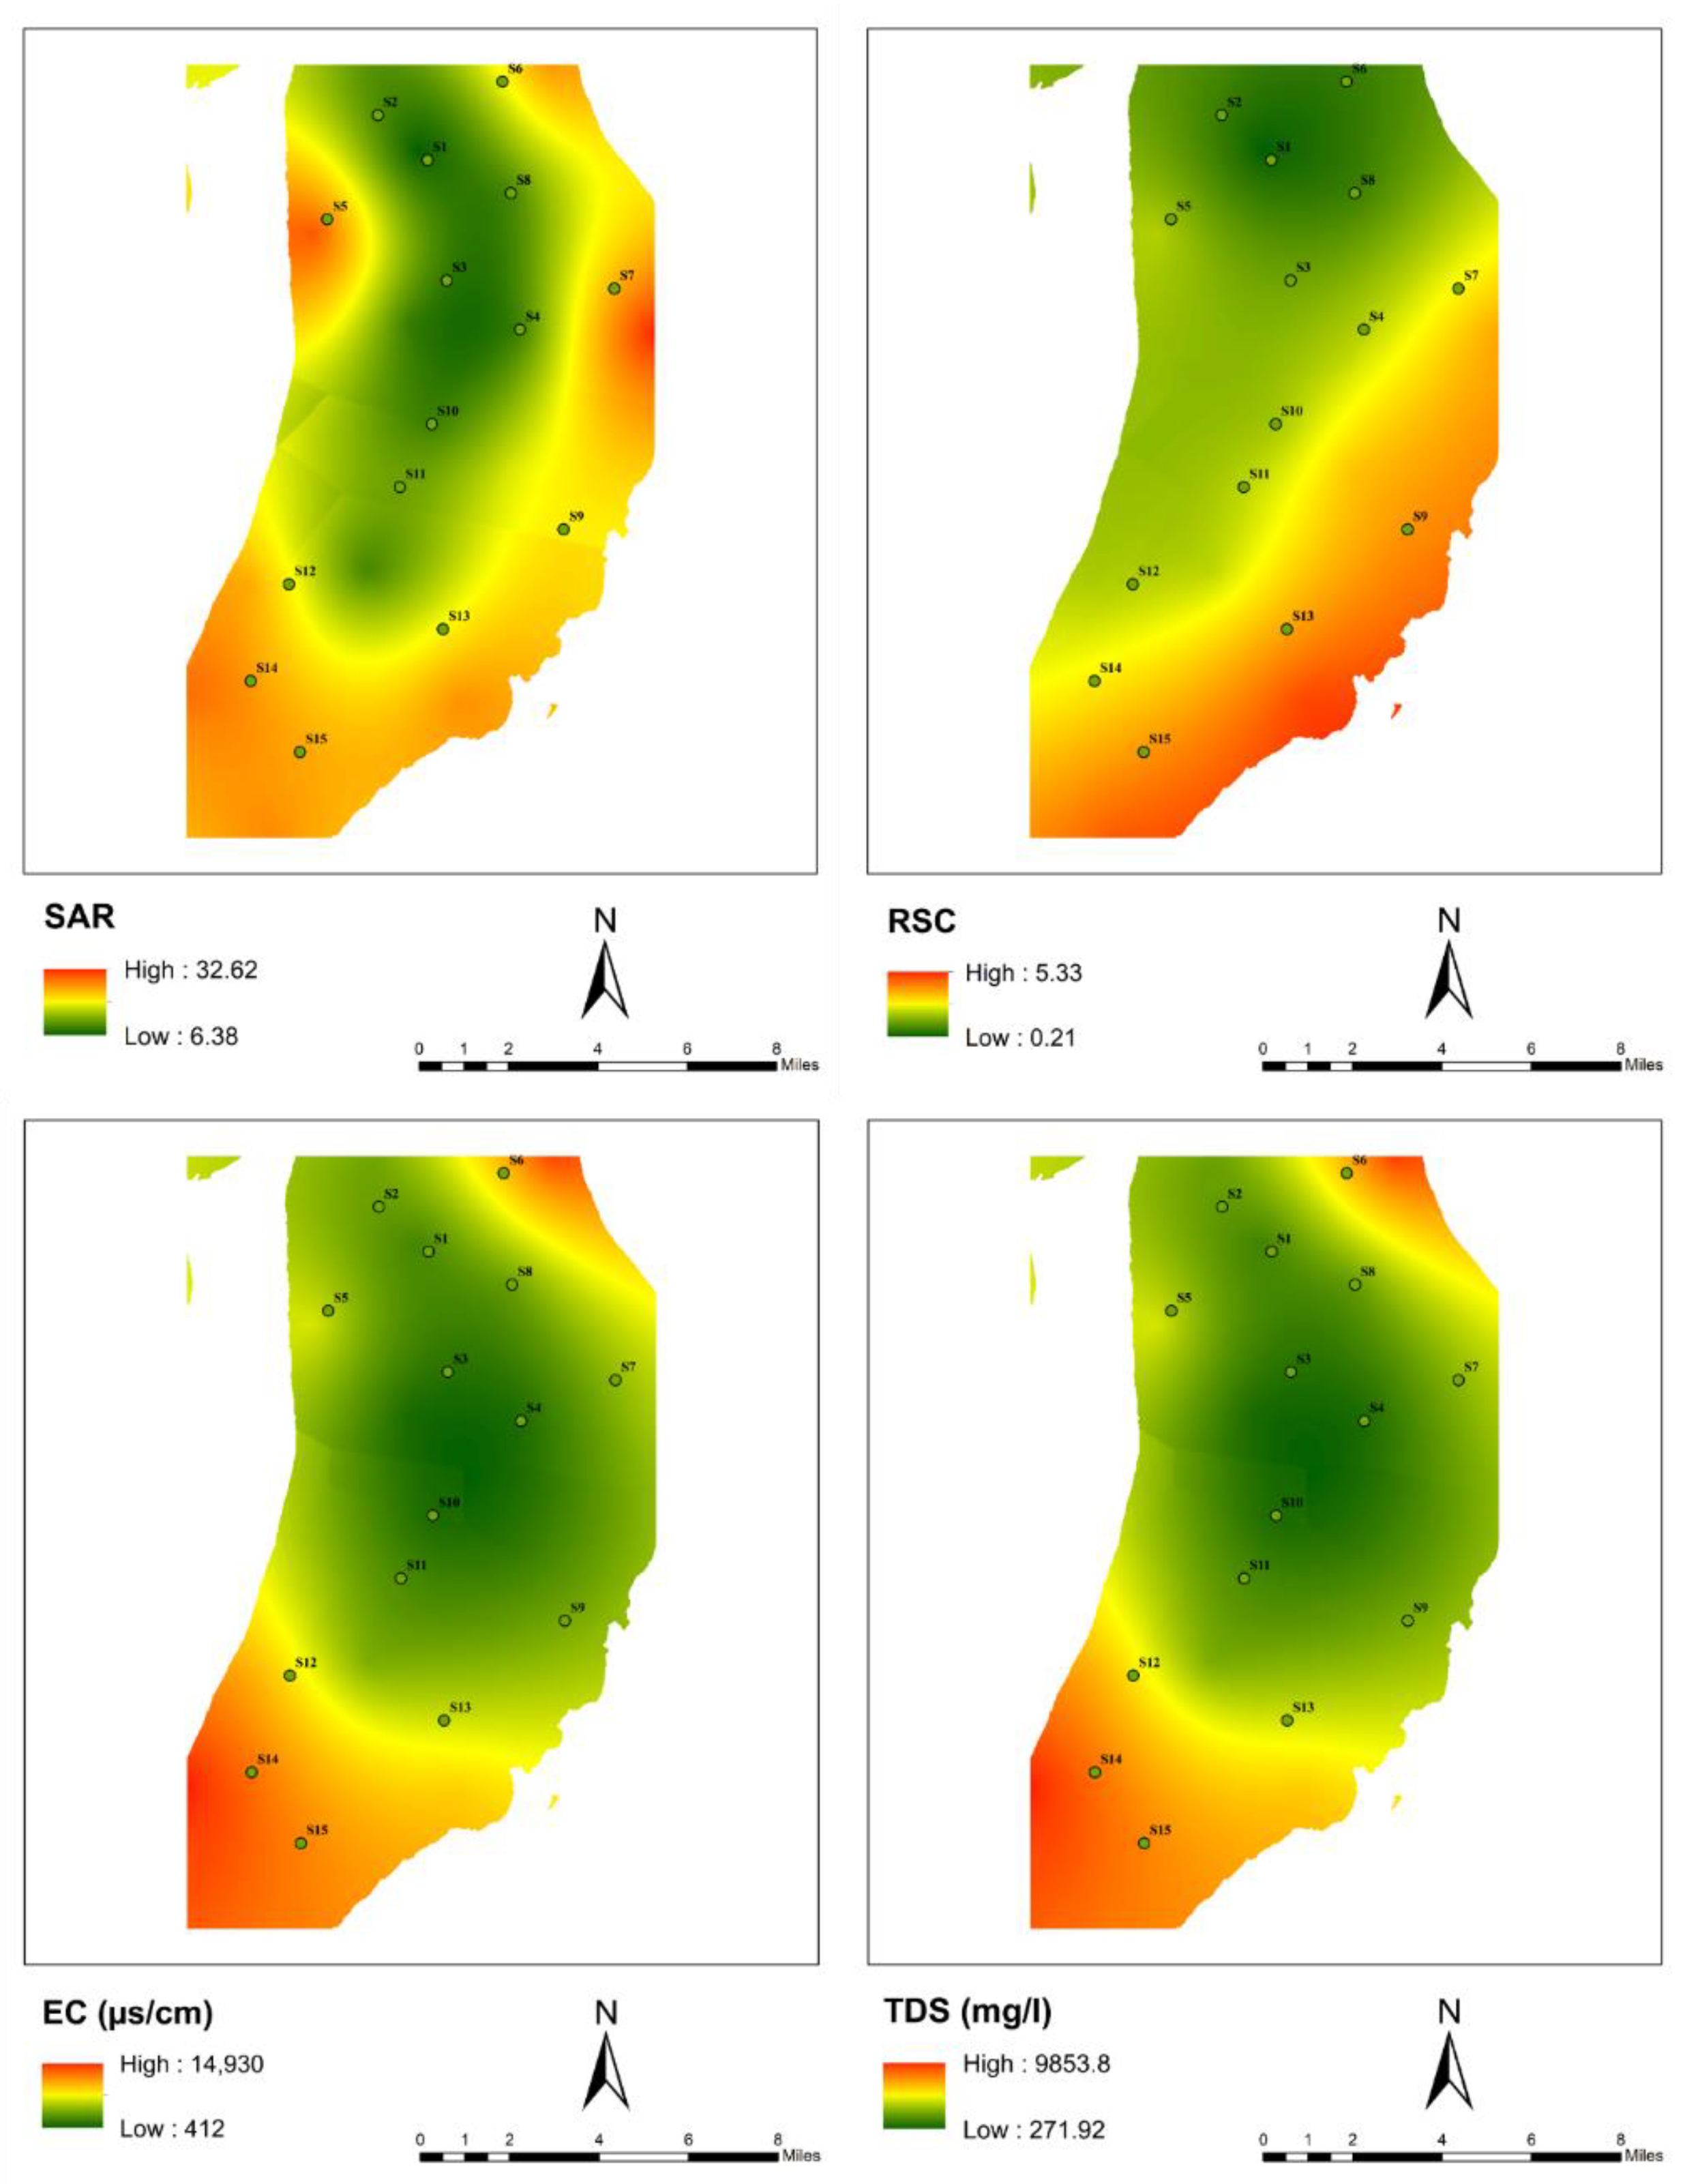
2.5. Spatial Data Analyses
2.6. Water Quality Indexing
3. Results and Discussion
3.1. Groundwater Chemistry
3.2. Hydrogeochemical Facies and Processes
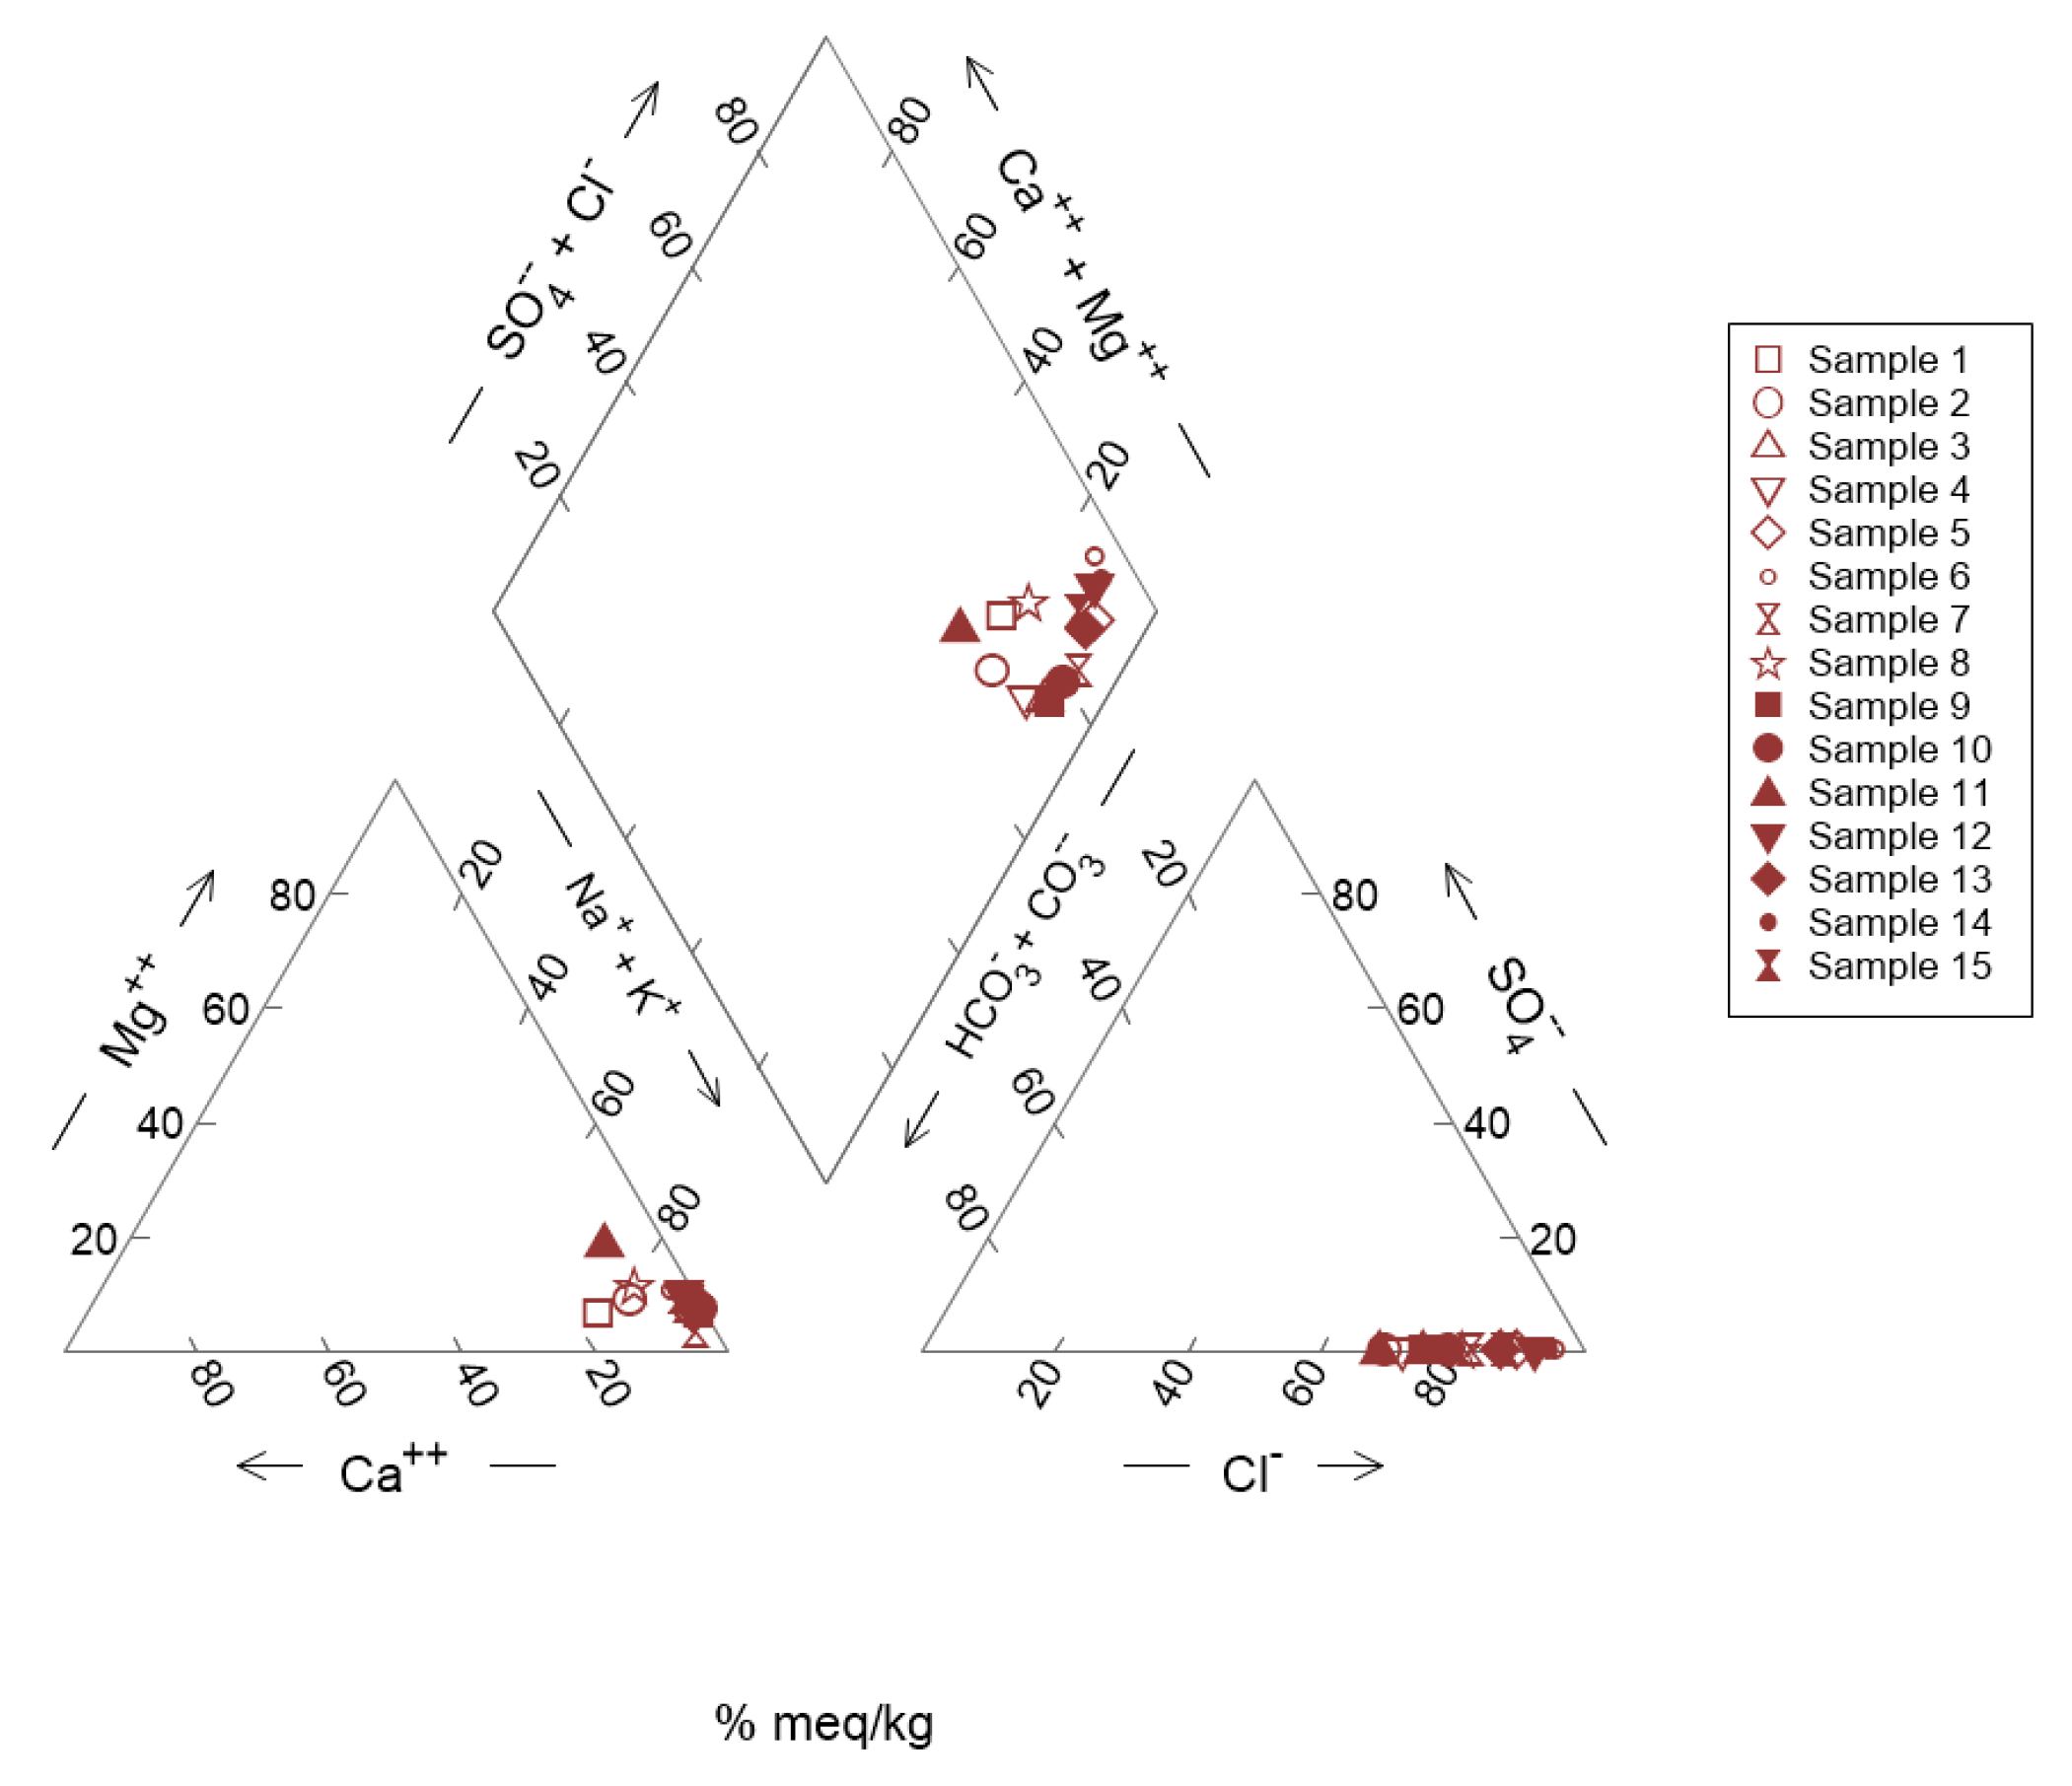
3.2.1. Piper Diagram
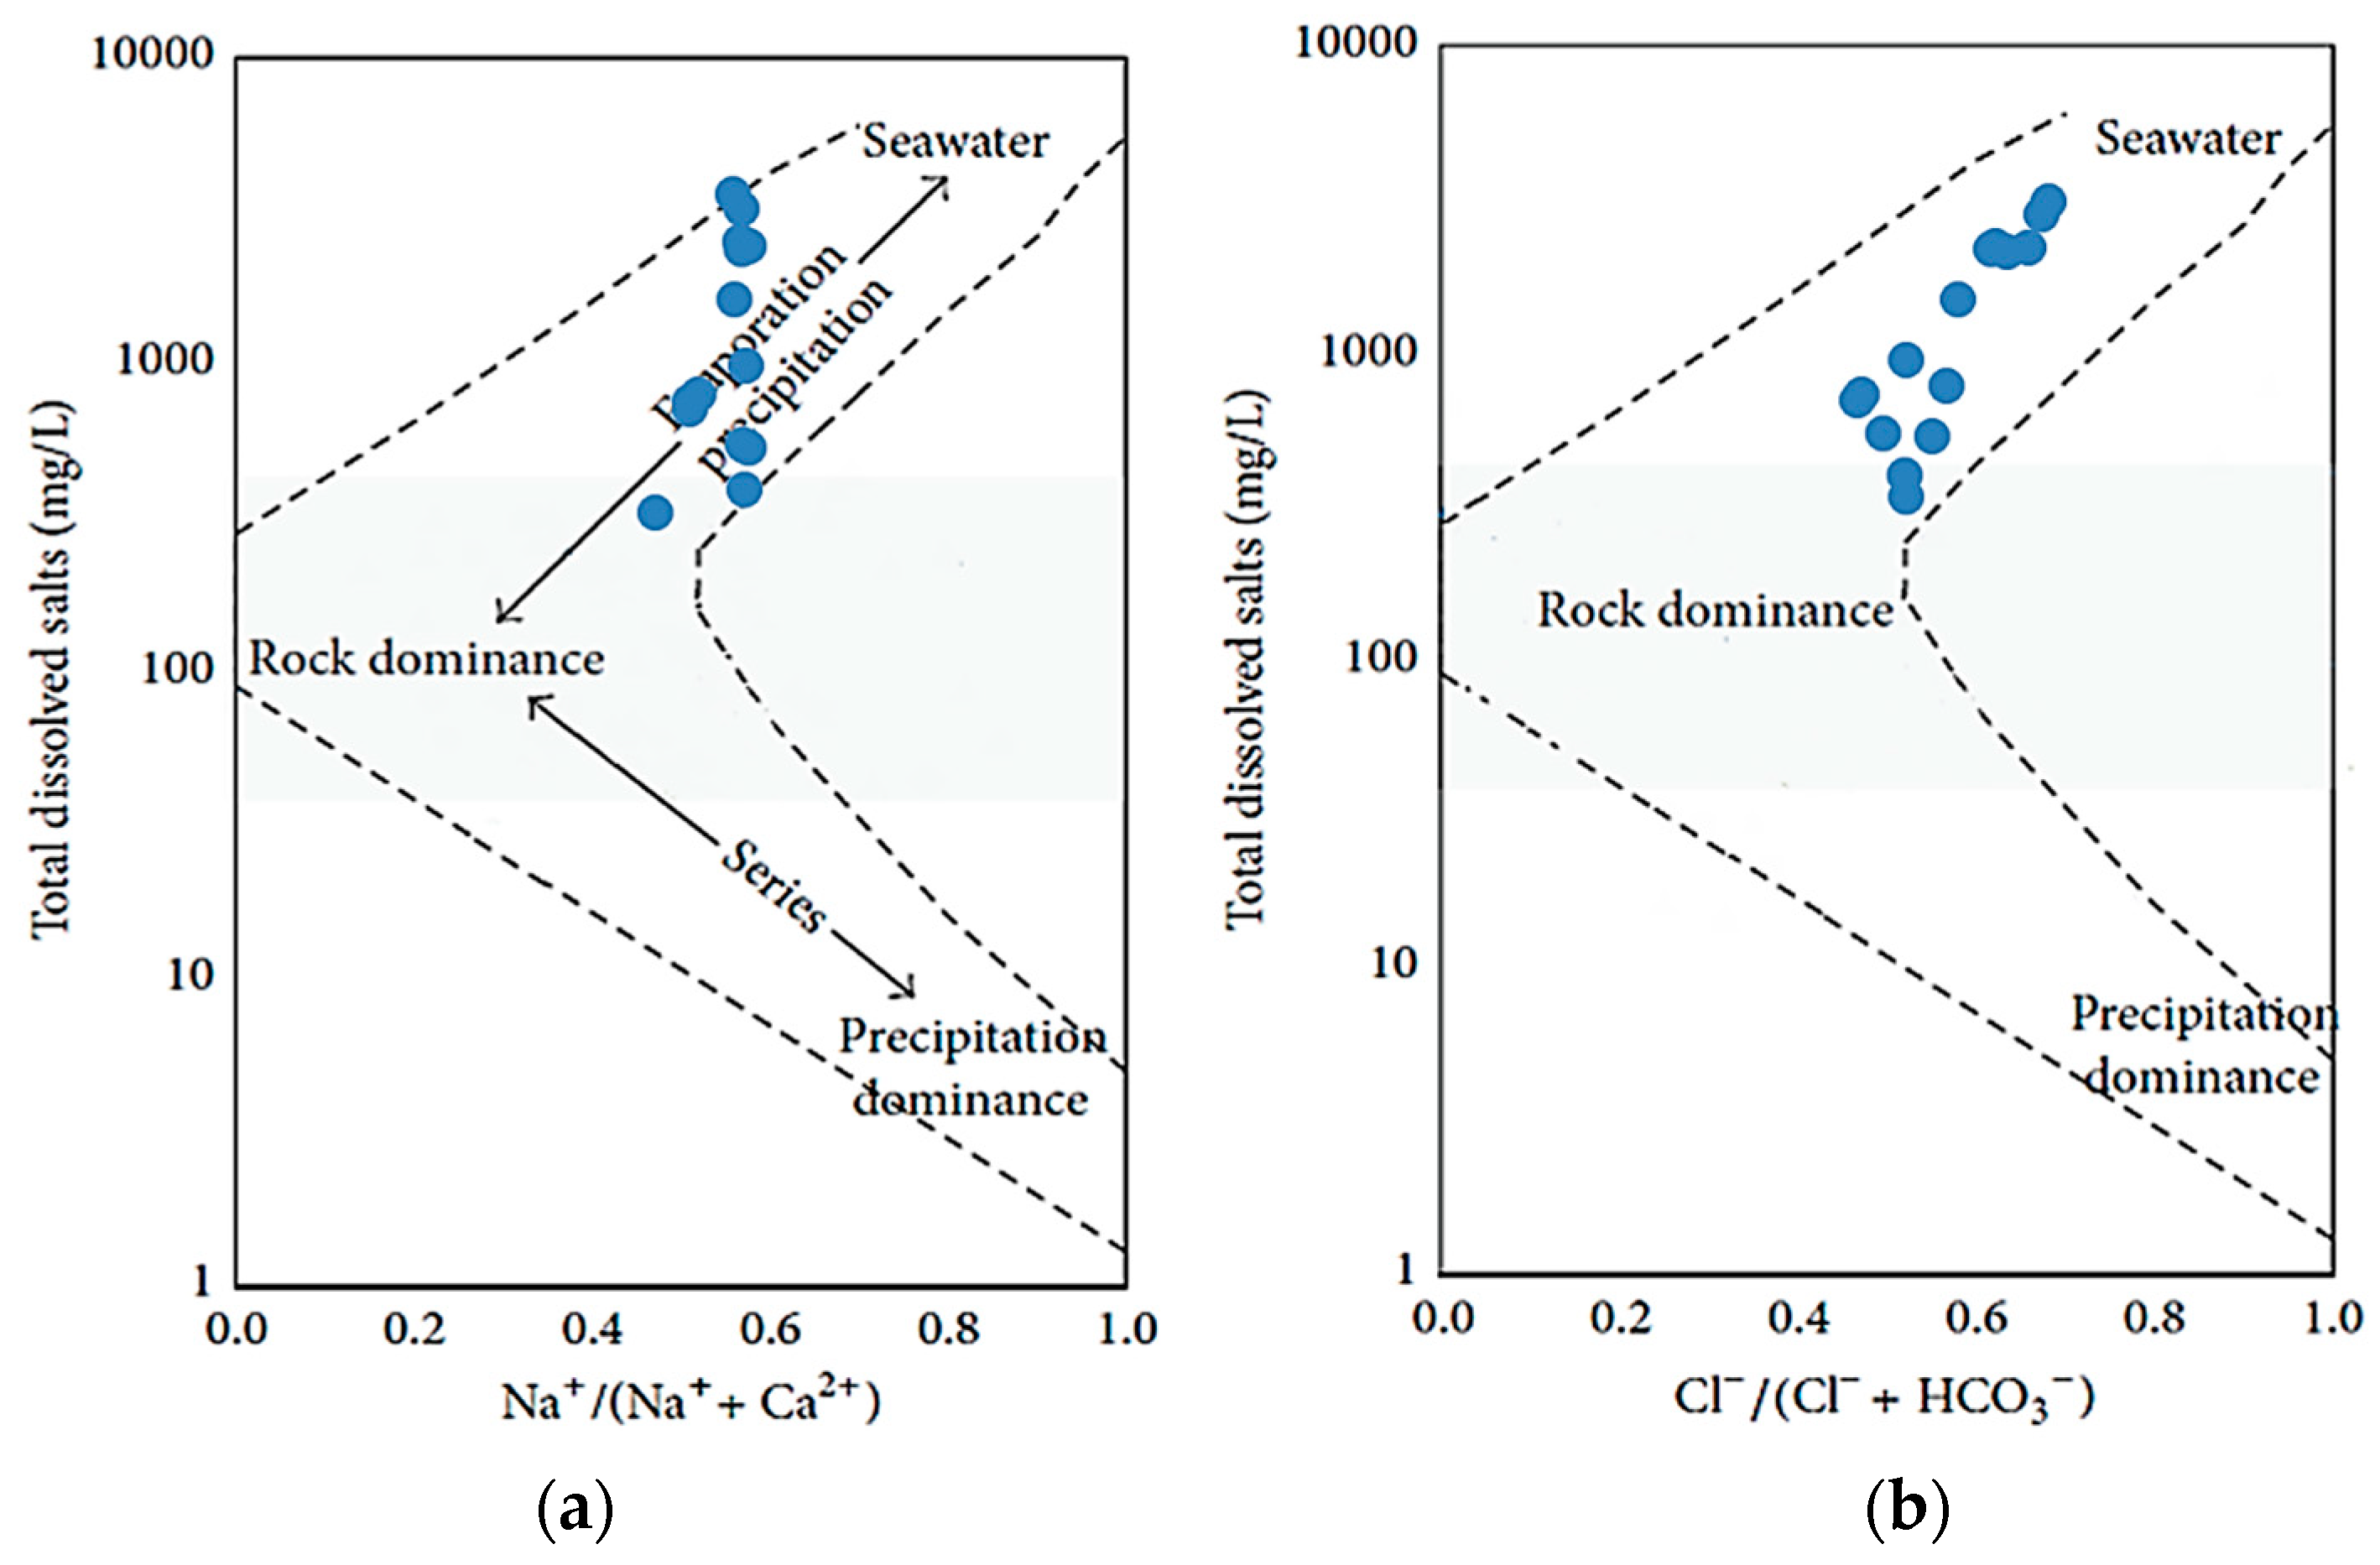
3.2.2. Gibbs Diagram
3.2.3. Wilcox’s Diagram
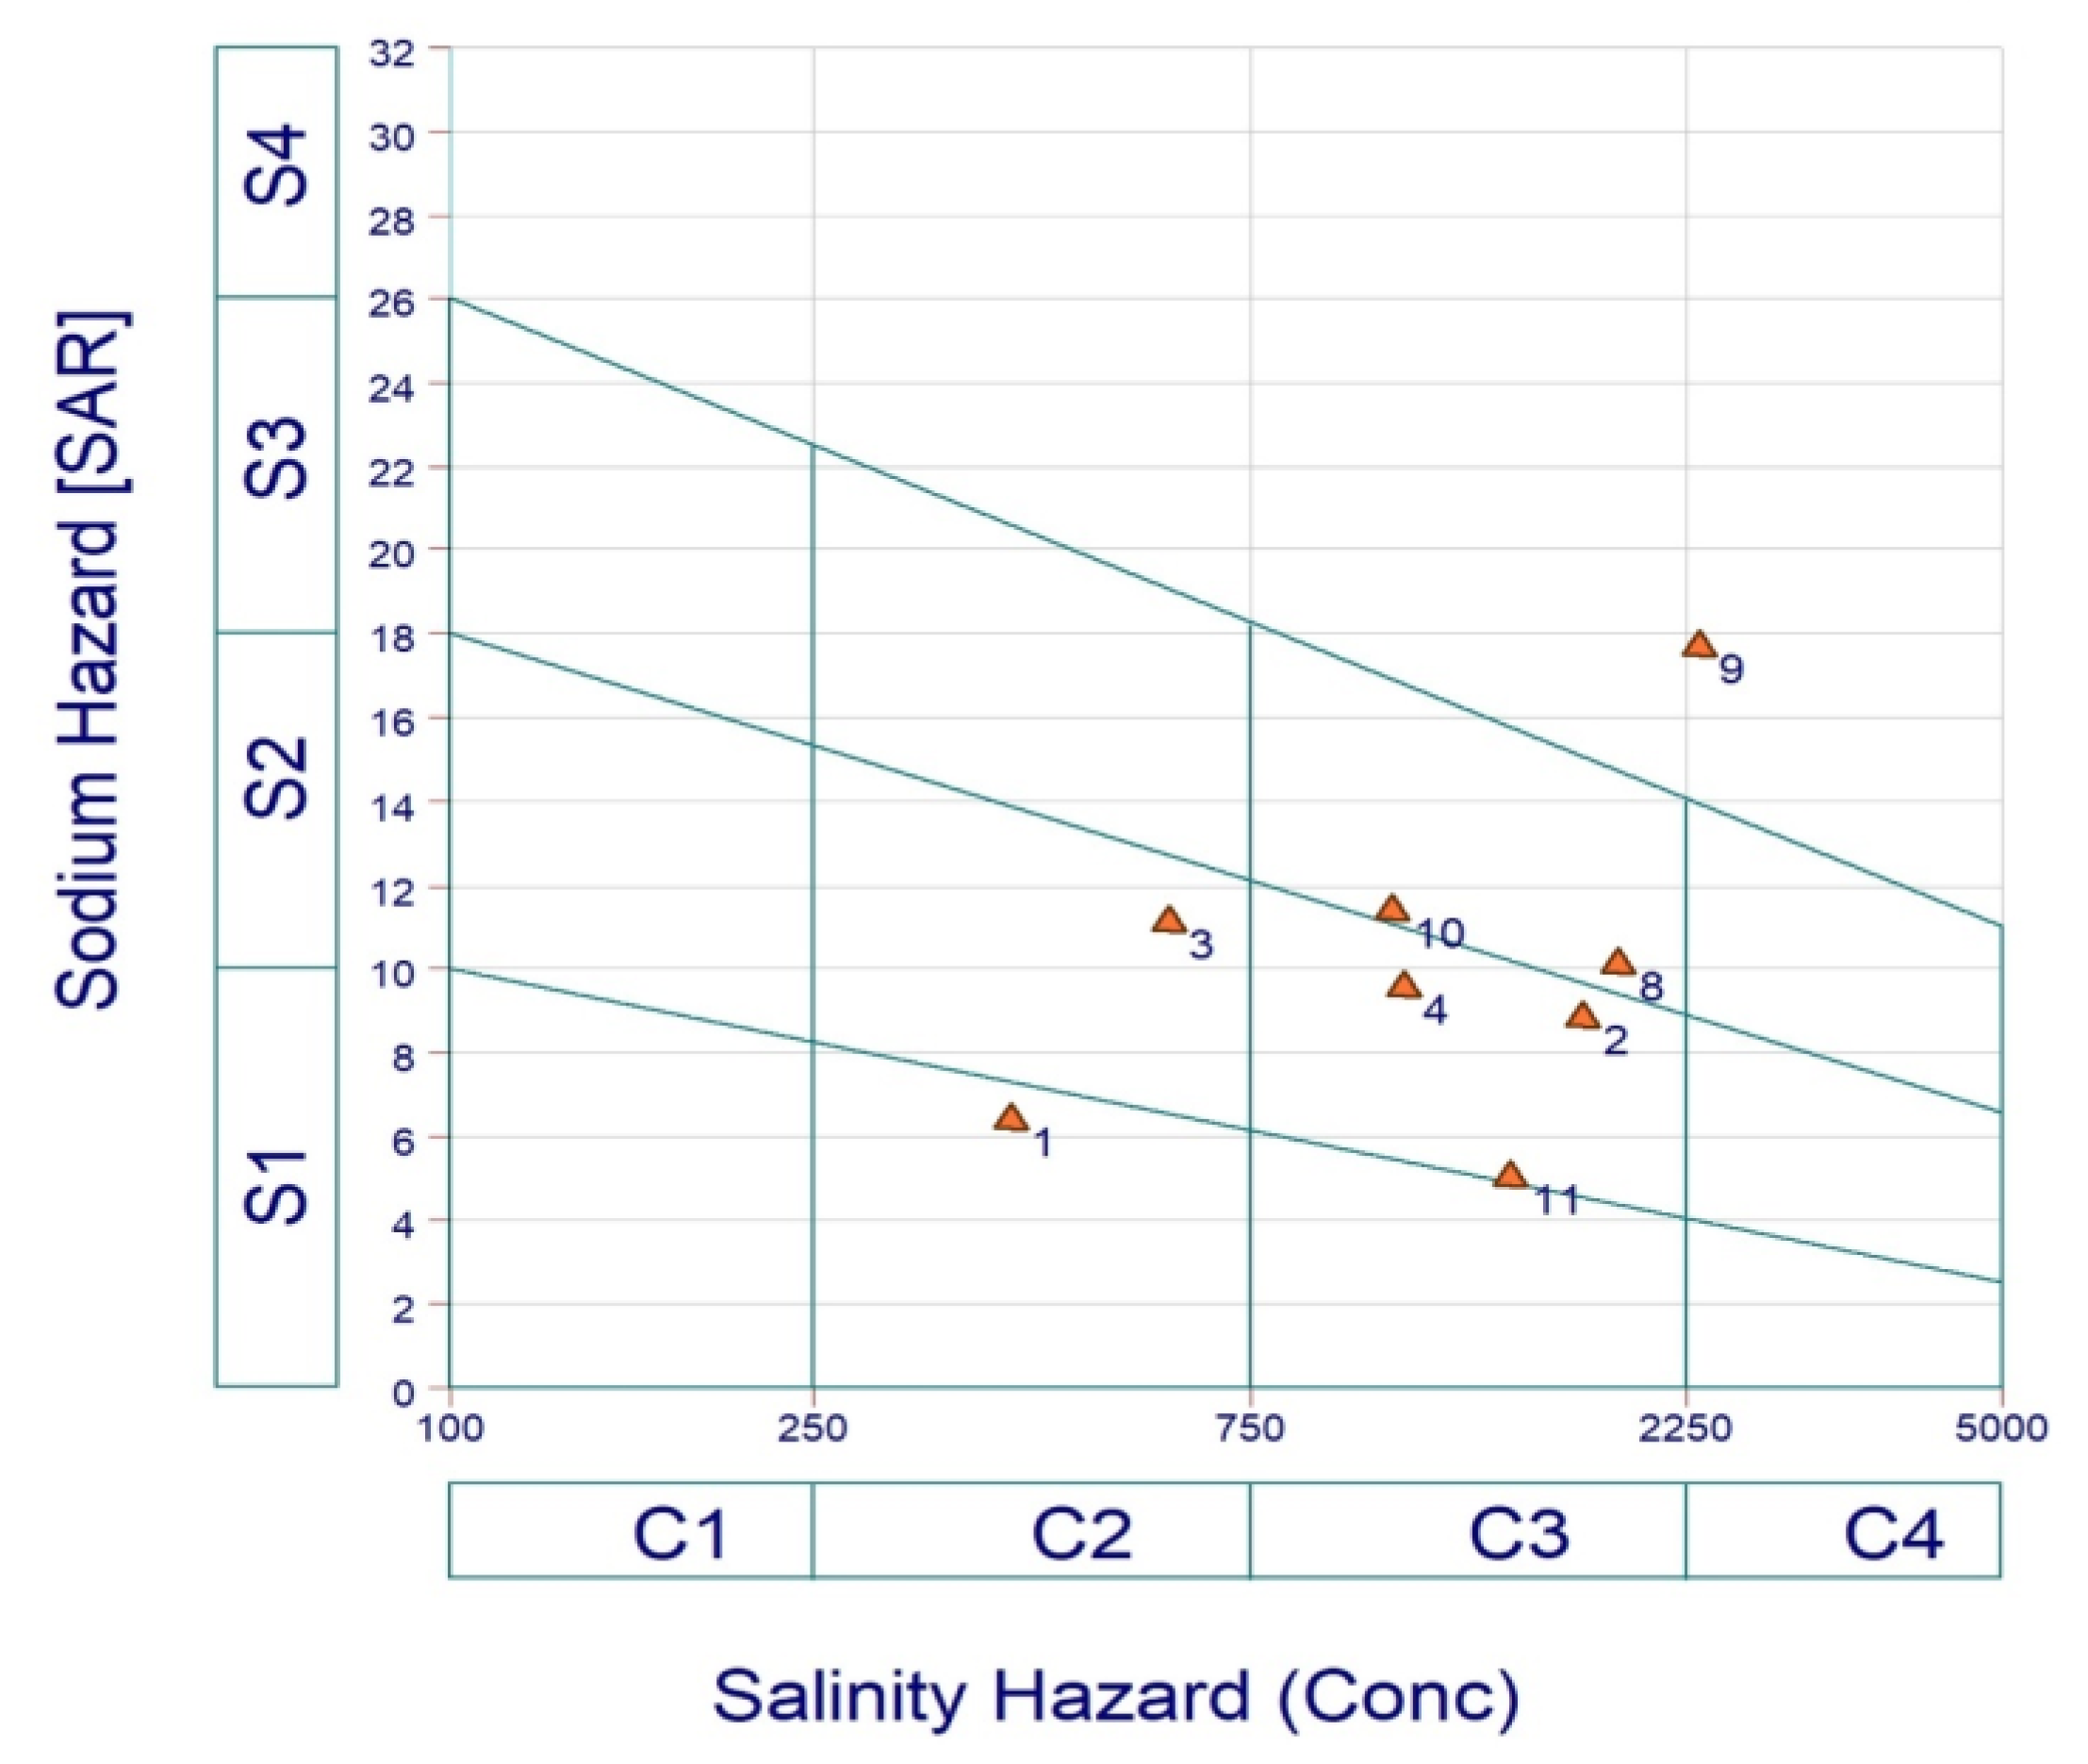
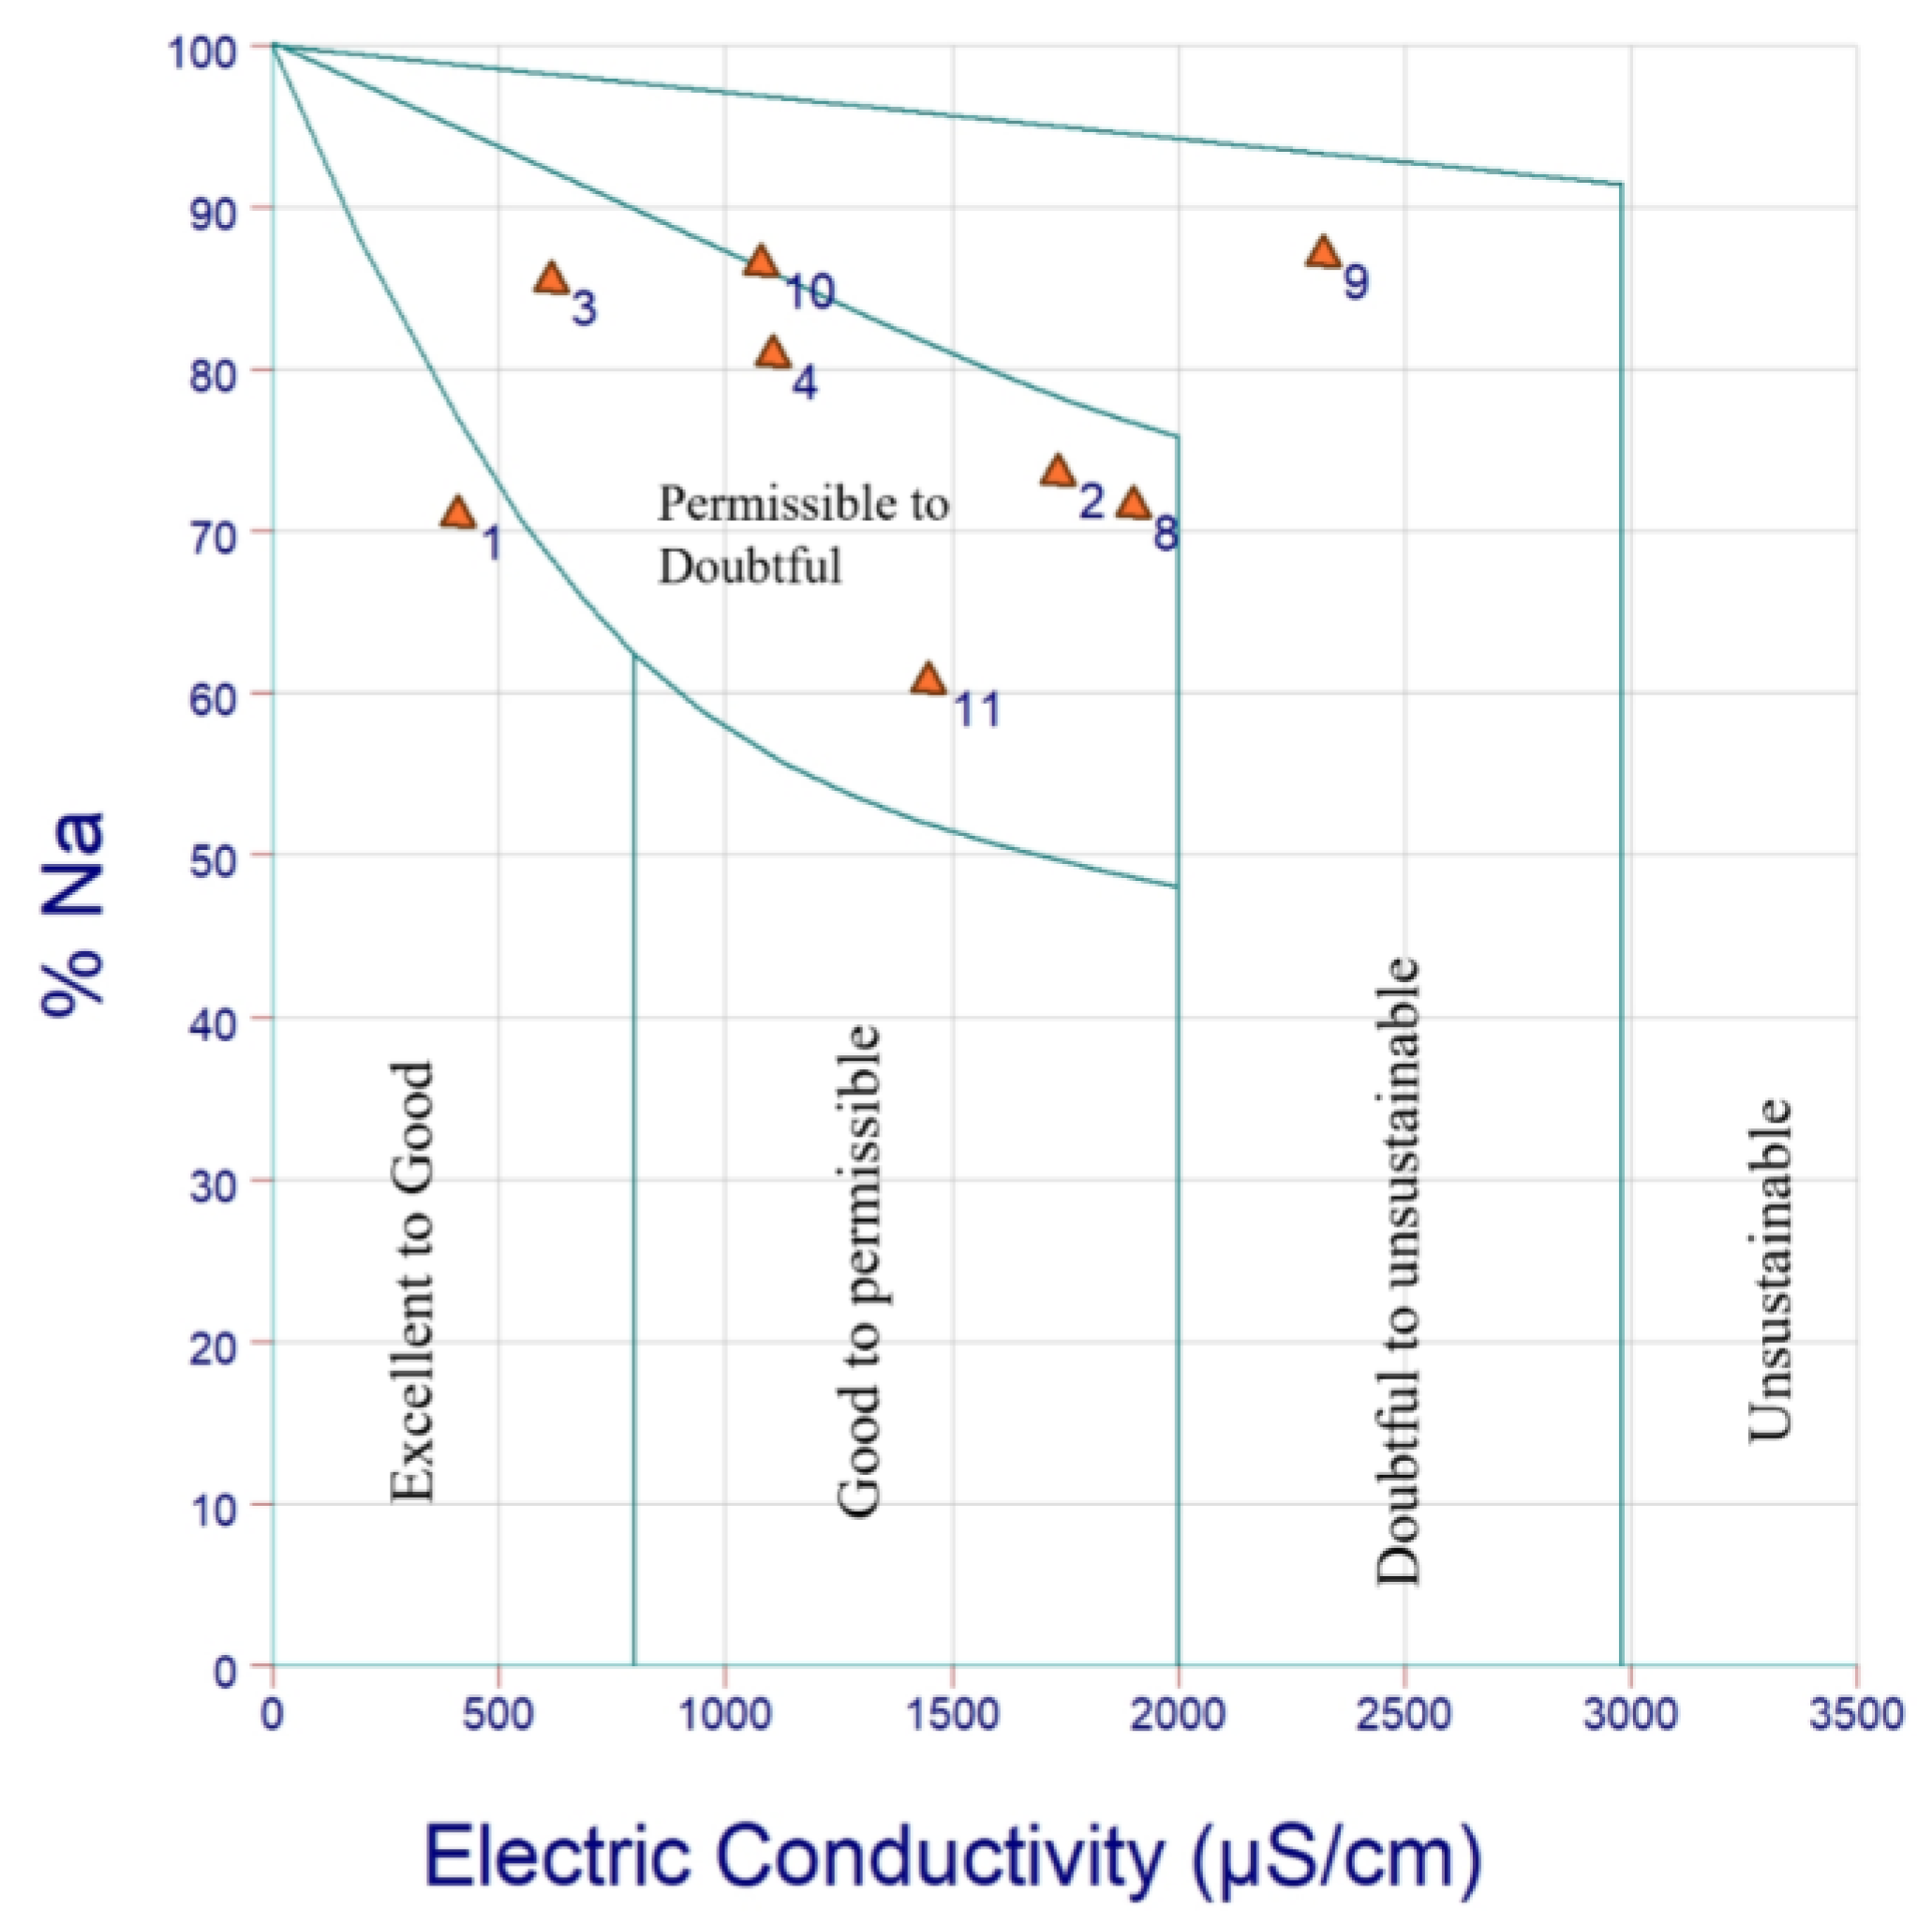
3.2.4. U.S. Salinity Diagram
3.3. Geostatistical Analyses
3.3.1. Correlation-Matrix Analysis
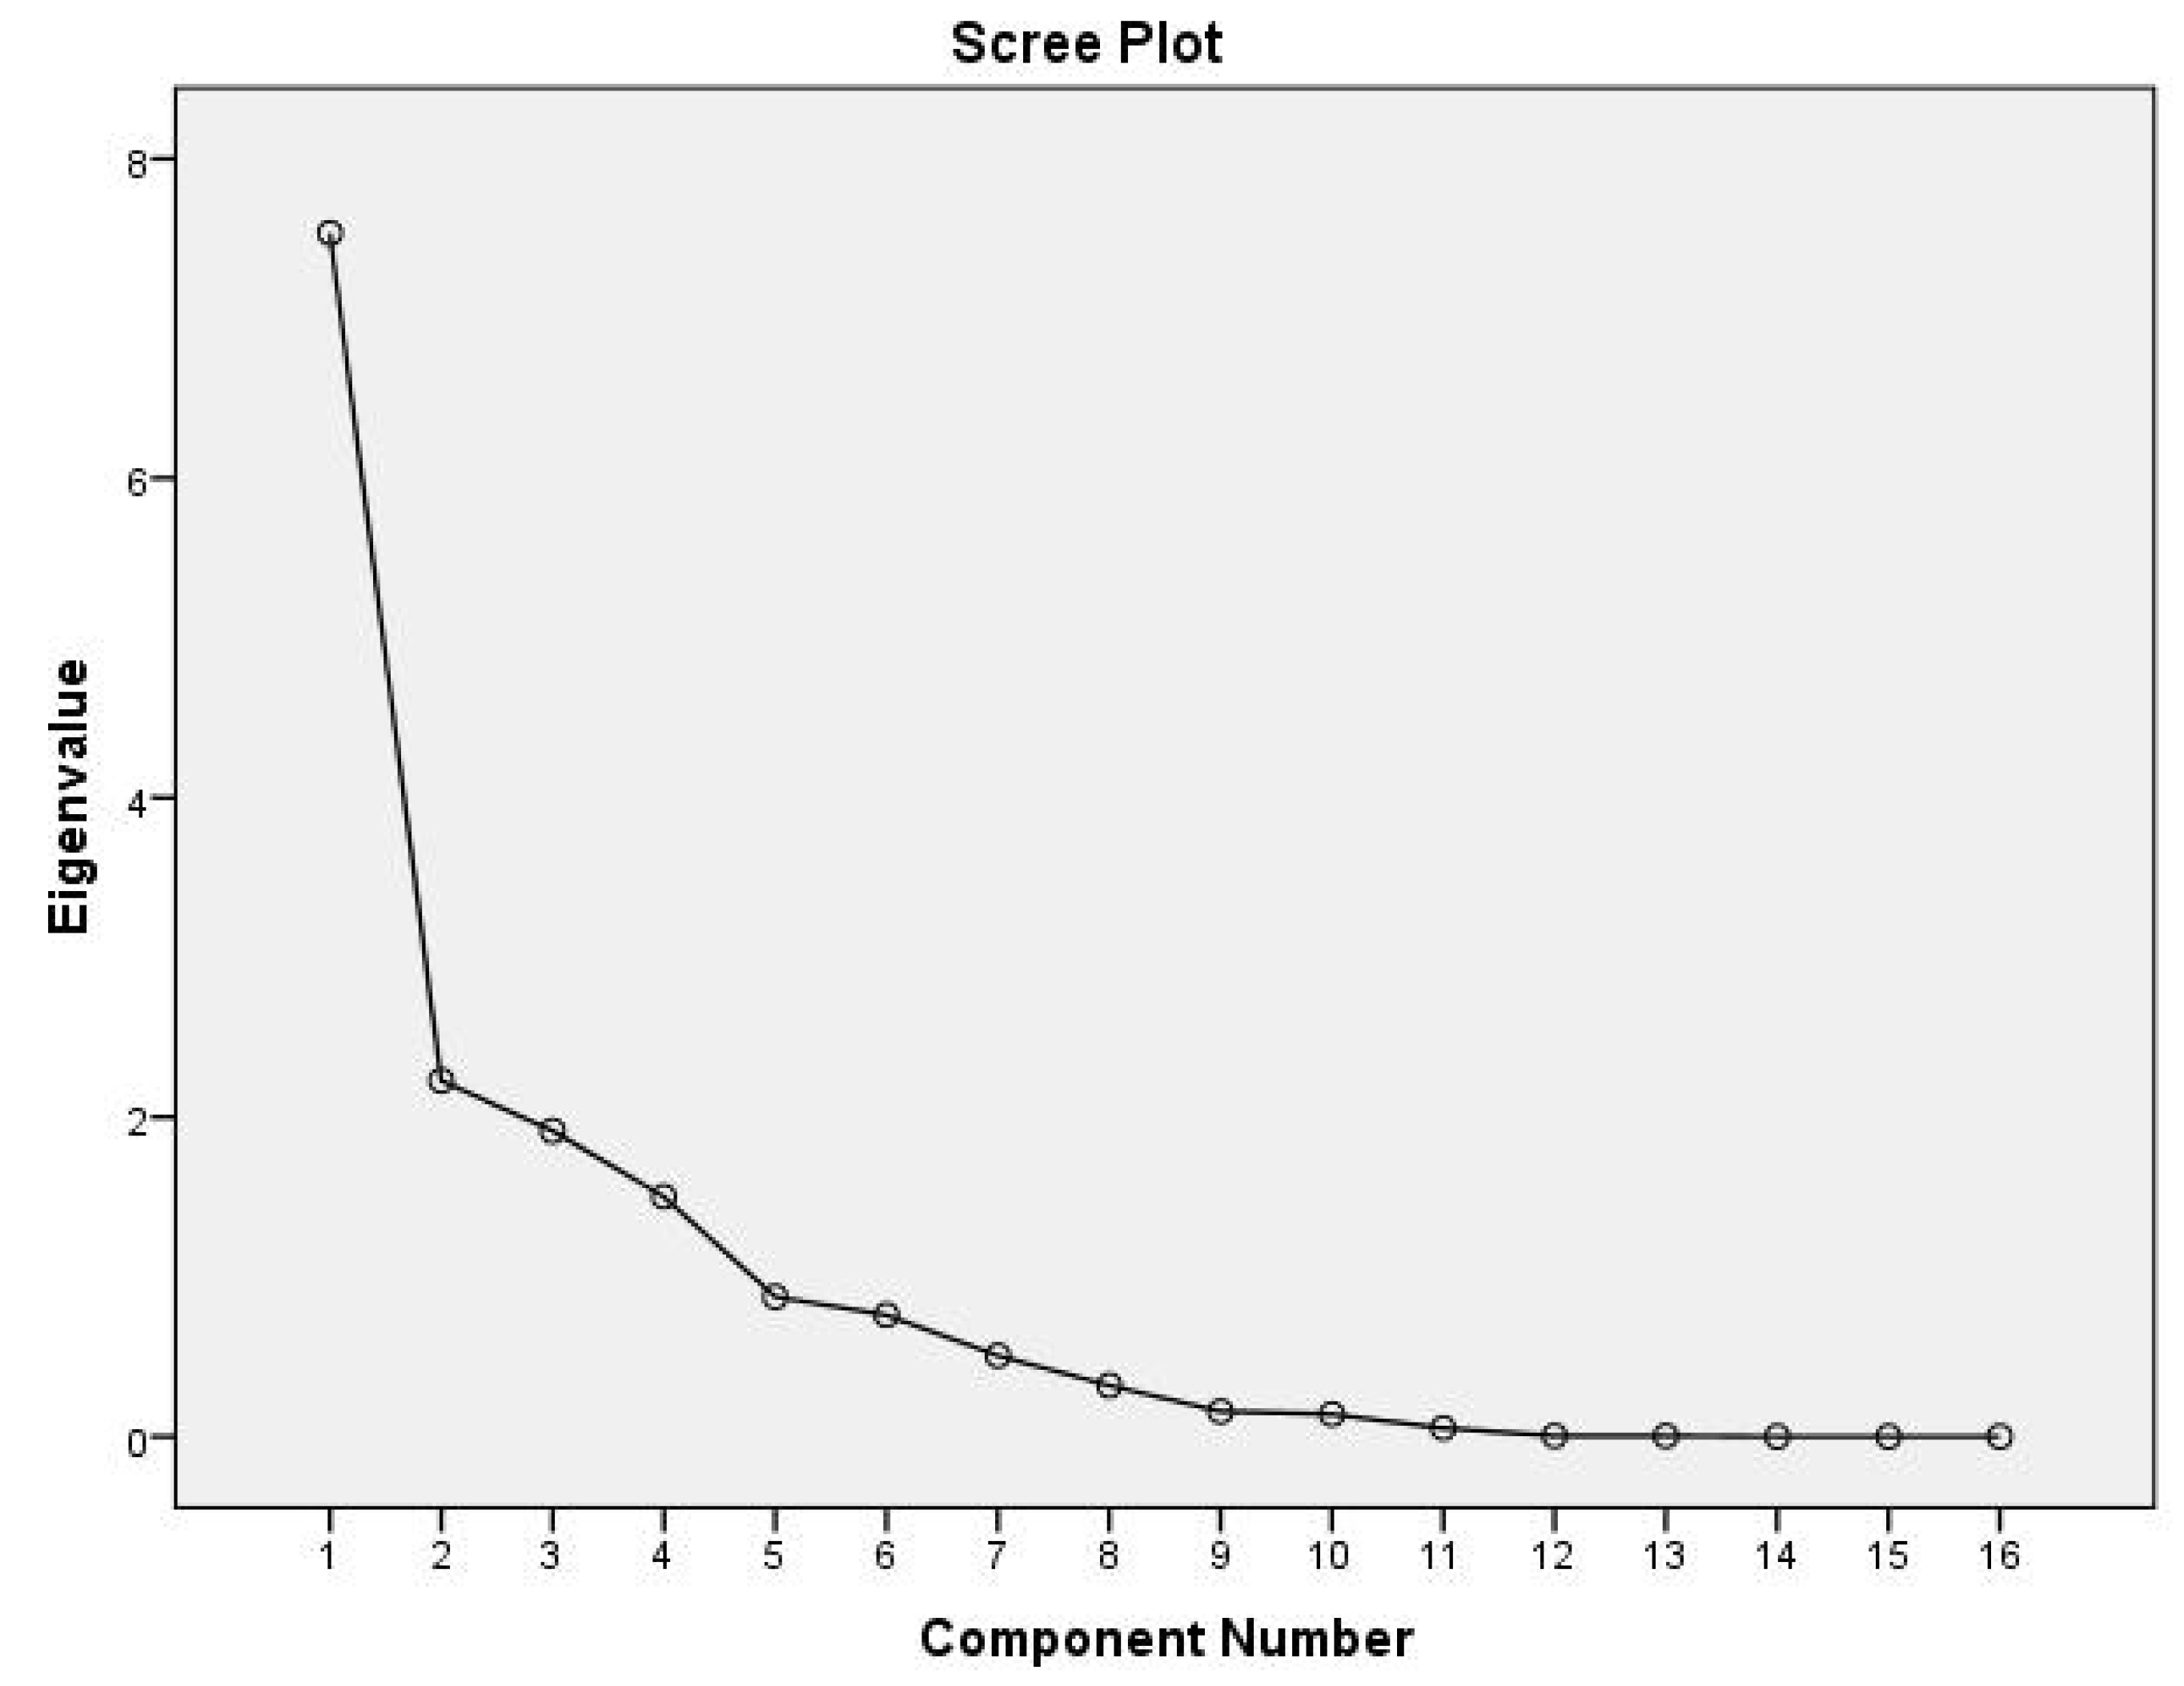
3.3.2. Principal Component Analysis
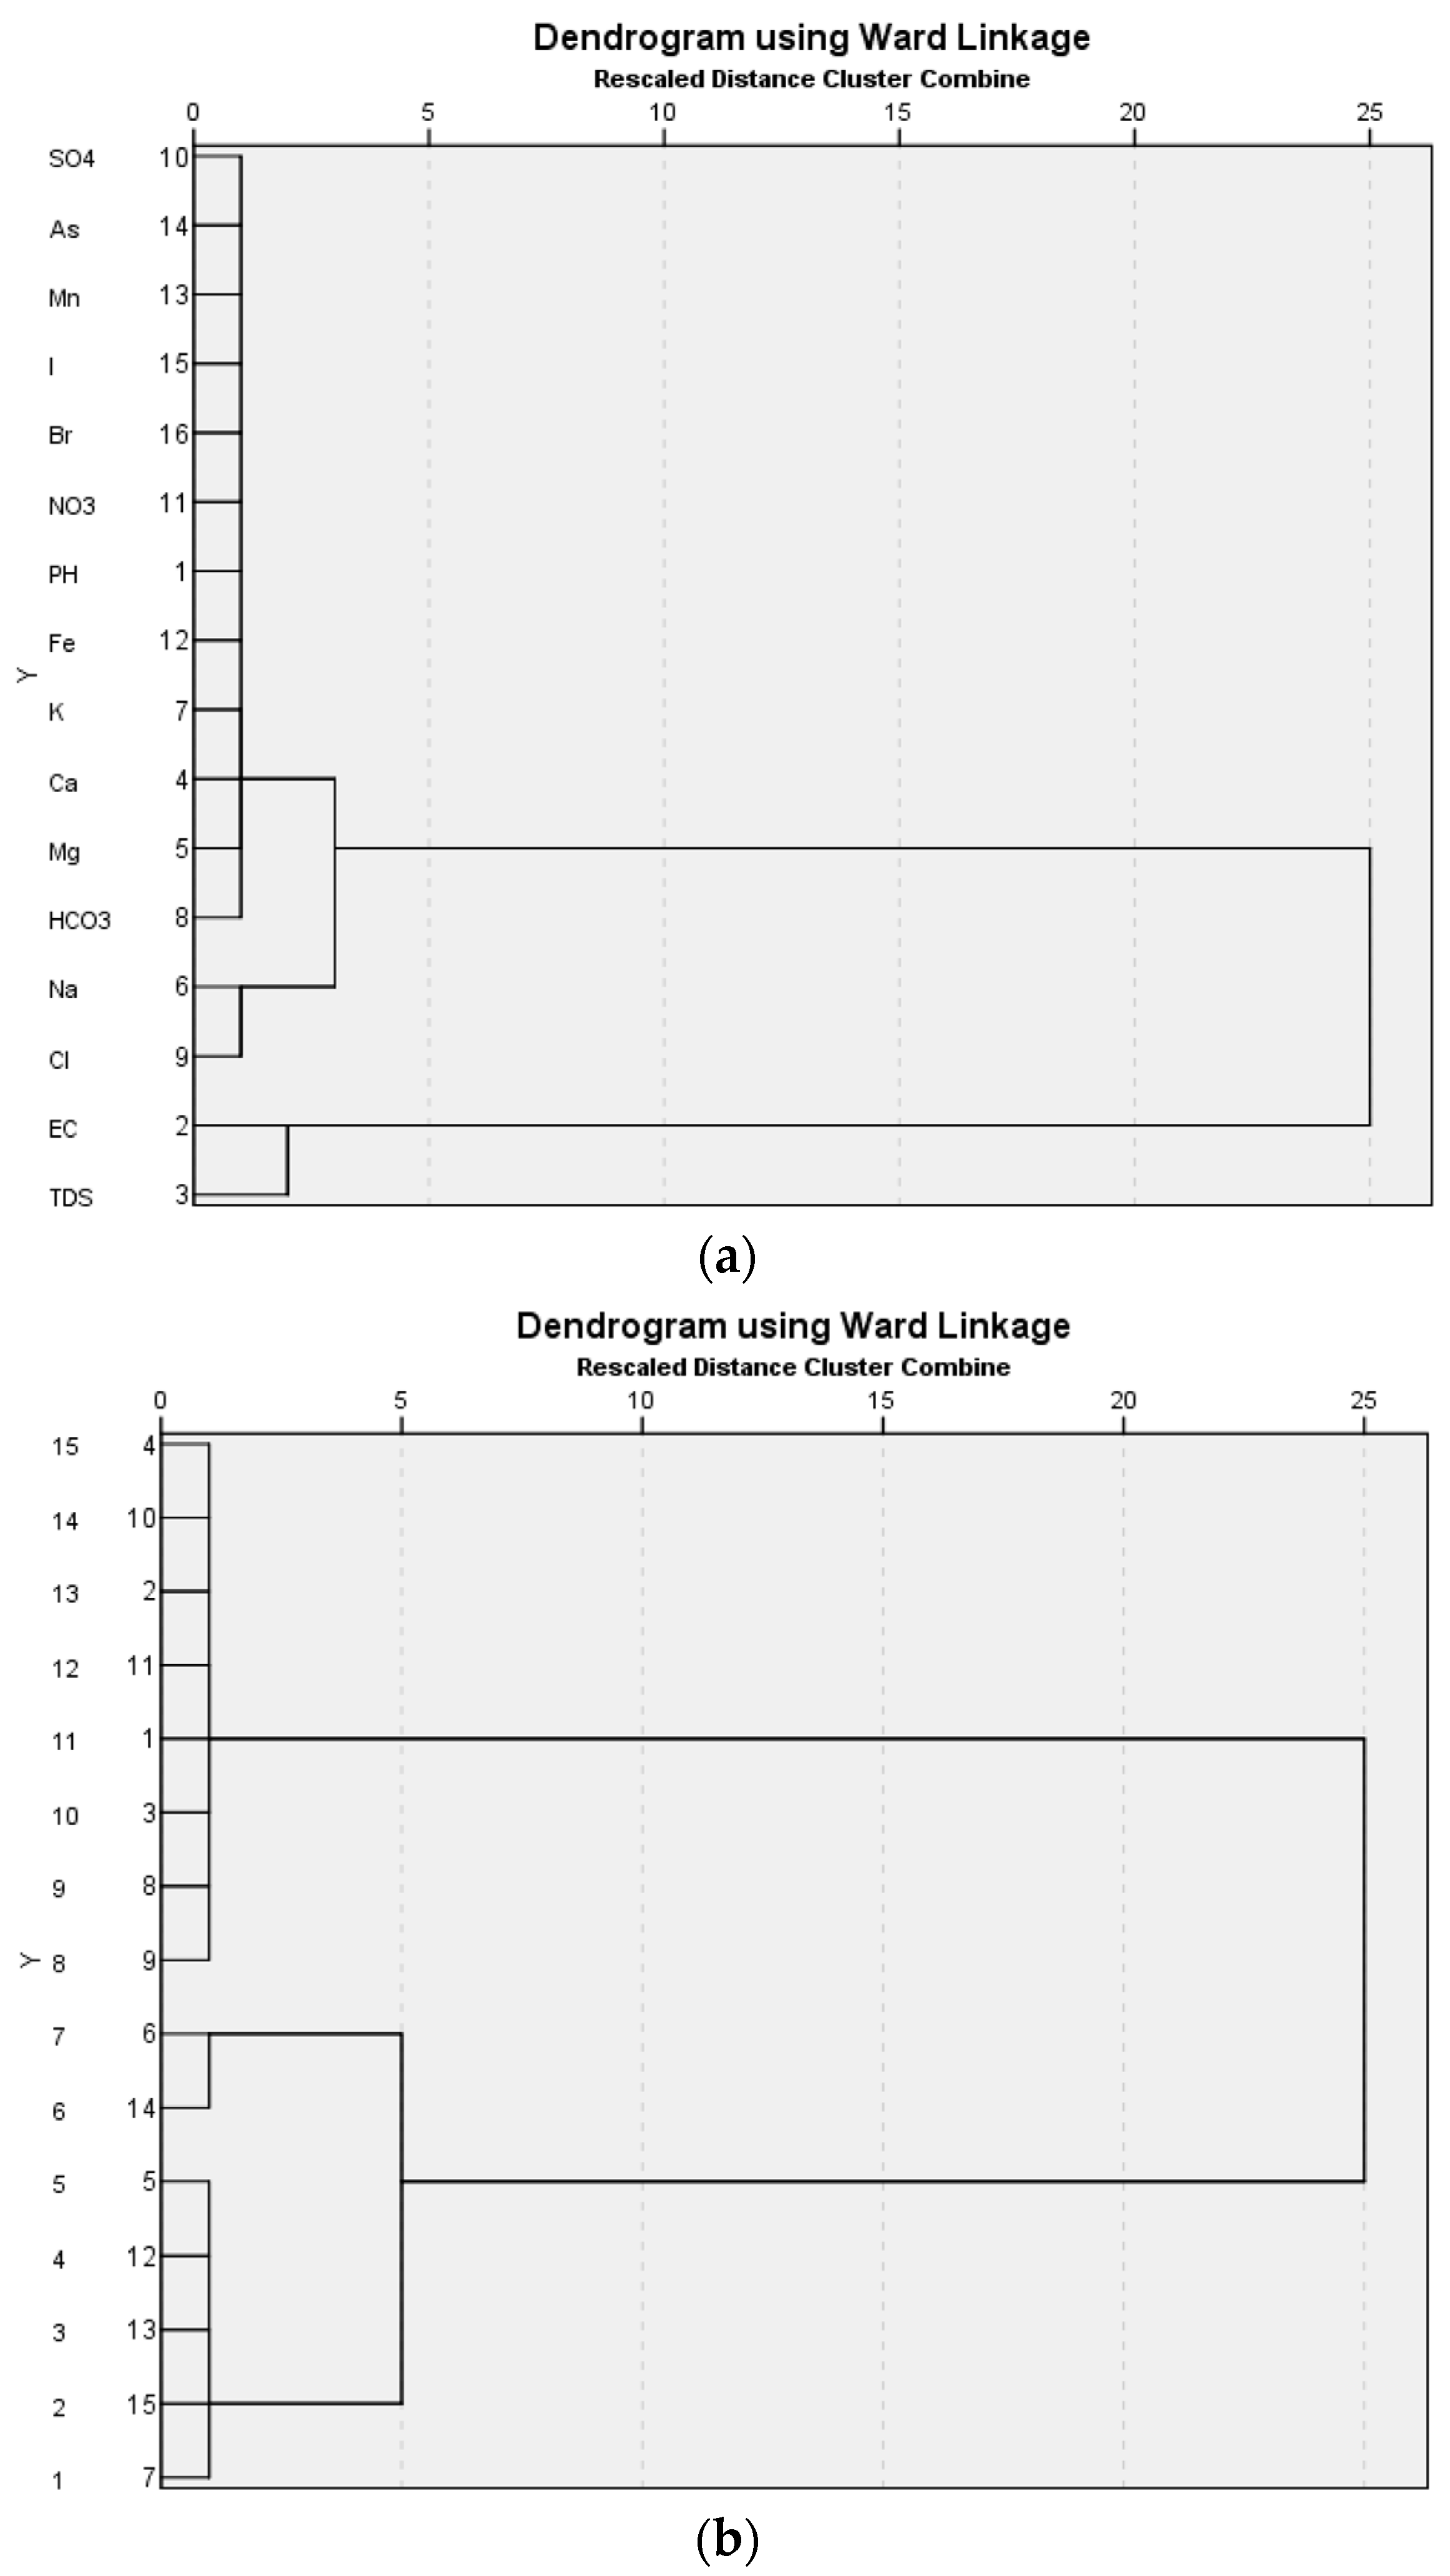
3.3.3. Hierarchal Cluster Analysis
3.4. Water-Quality Assessment
3.4.1. Drinking-Water Quality
3.4.2. Irrigation Water Quality
4. Conclusions
Author Contributions
Funding
Data Availability Statement
Acknowledgments
Conflicts of Interest
Appendix A

| Parameter | BD Standard (Si) | Weight (Wi) | Relative Weight (Wi) |
|---|---|---|---|
| Na | 200 | 4 | 0.1 |
| K | 12 | 2 | 0.05 |
| Ca | 75 | 3 | 0.075 |
| Mg | 35 | 2 | 0.05 |
| HCO3 | 200 | 3 | 0.075 |
| Cl | 600 | 4 | 0.1 |
| SO4 | 400 | 3 | 0.075 |
| NO3 | 10 | 4 | 0.1 |
| Fe | 1 | 3 | 0.075 |
| Mn | 0.1 | 3 | 0.075 |
| pH | 8.5 | 2 | 0.05 |
| TDS | 1000 | 3 | 0.075 |
| EC | 1000 | 4 | 0.1 |
| Parameter | Mean | Std. Deviation | Analysis N |
|---|---|---|---|
| Ca | 28.32 | 21.11 | 15 |
| Mg | 93.61 | 79.58 | 15 |
| Na | 949.15 | 742.82 | 15 |
| K | 11.77 | 4.63 | 15 |
| HCO3 | 230.13 | 99.43 | 15 |
| Cl | 1658.5 | 1351.6 | 15 |
| SO4 | 0.12 | 0.056 | 15 |
| NO3 | 1.77 | 0.83 | 15 |
| Fe | 3.51 | 2.17 | 15 |
| Mn | 0.24 | 0.112 | 15 |
| As | 0.014 | 0.008 | 15 |
| I | 0.419 | 0.335 | 15 |
| Br | 0.256 | 0.23 | 15 |
| pH | 7.59 | 0.28 | 15 |
| EC (µS/cm) | 5187.2 | 4790.59 | 15 |
| TDS | 3423.55 | 3161.79 | 15 |
References
- Aggarwal, P.K.; Joshi, P.K.; Ingram, J.S.; Gupta, R.K. Adapting food systems of the Indo-Gangetic plains to global environmental change: Key information needs to improve policy formulation. Environ. Sci. Policy 2004, 7, 487–498. [Google Scholar] [CrossRef]
- Bear, J. Hydraulics of Groundwater; McGraw-Hill International Book: New York, NY, USA, 1979. [Google Scholar]
- Iqbal, M.A.; Gupta, S.G. Studies on heavy metal ion pollution of ground water sources as an effect of municipal solid waste dumping. Afr. J. Basic Appl. Sci. 2009, 1, 117–122. [Google Scholar]
- Raju, N.J.; Shukla, U.K.; Ram, P. Hydrogeochemistry for the assessment of groundwater quality in Varanasi: A fast-urbanizing center in Uttar Pradesh, India. Environ. Monit. Assess. 2011, 173, 279–300. [Google Scholar] [CrossRef] [PubMed]
- Dhanasekarapandian, M.; Chandran, S.; Devi, D.S.; Kumar, V. Spatial and temporal variation of groundwater quality and its suitability for irrigation and drinking purpose using GIS and WQI in an urban fringe. J. Afr. Earth Sci. 2016, 124, 270–288. [Google Scholar] [CrossRef]
- Nickson, R.T.; McArthur, J.M.; Shrestha, B.; Kyaw-Nyint, T.O.; Lowrt, D. Arsenic and other drinking water quality issues, Muzaffargarh District, Pakistan. Appl. Geochem. 2005, 20, 55–68. [Google Scholar] [CrossRef]
- Foster, S.S.D. Groundwater for development: An overview of quality constraints. In Groundwater Quality; Chapman and Hall: London, UK, 1995; Volume 17, pp. 1–3. [Google Scholar]
- Naiman, R.J.; Magnuson, J.J.; Stanford, J.A.; McKnight, D.M. The Freshwater Imperative: A Research Agenda; Island Press: Washington, DC, USA, 1995. [Google Scholar]
- Haritash, A.K.; Kaushik, C.P.; Kaushik, A.; Kansal, A.; Yadav, A.K. Suitability assessment of groundwater for drinking, irrigation and industrial use in some North Indian villages. Environ. Monit. Assess. 2008, 145, 397–406. [Google Scholar] [CrossRef] [PubMed]
- Selvakumar, S.; Ramkumar, K.; Chandrasekar, N.; Magesh, N.S.; Kaliraj, S. Groundwater quality and its suitability for drinking and irrigational use in the Southern Tiruchirappalli district, Tamil Nadu, India. Appl. Water Sci. 2017, 7, 411–420. [Google Scholar] [CrossRef]
- Rahman, M.M.; Lee, M.K.; Uddin, A. Geochemistry of Groundwater and Naturally Occurring Biogenic Pyrite in the Holocene Fluvial Aquifers in Uphapee Watershed, Macon County, Alabama. Minerals 2020, 10, 912. [Google Scholar] [CrossRef]
- Richards, L.A. Diagnosis and Improvement of Saline and Alkali Soils; Agricultural Handbook 60; USDA and IBH Publishing Co. Ltd.: New Delhi, India, 1954; pp. 98–99.
- Tiwari, T.N.; Mishra, M.A. A preliminary assignment of water quality index of major Indian rivers. Indian J. Environ. Prot. 1985, 5, 276–279. [Google Scholar]
- Miller, W.W.; Young, H.M.; Mahannah, C.N.; Garret, J.R. Identification of Water Quality Differences in Nevada through Index Application. J. Environ. Qual. 1986, 15, 265–272. [Google Scholar] [CrossRef]
- Shahid, S.; Chen, X.; Hazarika, M.K. Evaluation of groundwater quality for irrigation in Bangladesh using Geographic information system. J. Hydrol. Hydromech. 2006, 54, 3–14. [Google Scholar]
- Shariot-Ullah, M. Impacts of sugar mill’s wastewater use on physical and hydraulic properties of soil: Evidence from North Bengal Sugar Mill, Natore, Bangladesh. Sustain. Water Resour. Manag. 2019, 5, 863–871. [Google Scholar] [CrossRef]
- Bear, J.; Cheng, A.H.D.; Sorek, S.; Ouazar, D.; Herrera, I. (Eds.) Seawater Intrusion in Coastal Aquifers: Concepts, Methods and Practices; Springer Science & Business Media: Berlin, Germany, 1999; Volume 14. [Google Scholar]
- Todd, D. Groundwater Hydrology, 2nd ed.; John Willey and Sons. Inc.: New York, NY, USA, 1980. [Google Scholar]
- Halliwell, D.J.; Barlow, K.M.; Nash, D.M. A review of the effects of wastewater sodium on soil physical properties and their implications for irrigation systems. Soil Res. 2001, 39, 1259–1267. [Google Scholar] [CrossRef]
- Etteieb, S.; Cherif, S.; Tarhouni, J. Hydrochemical assessment of water quality for irrigation: A case study of the Medjerda River in Tunisia. Appl. Water Sci. 2017, 7, 469–480. [Google Scholar] [CrossRef]
- Ahmad, A.Y.; Al-Ghouti, M.A.; Khraisheh, M.; Zouari, N. Hydrogeochemical characterization and quality evaluation of groundwater suitability for domestic and agricultural uses in the state of Qatar. Groundw. Sustain. Dev. 2020, 11, 100467. [Google Scholar] [CrossRef]
- Shamsudduha, M.; Taylor, R.G.; Haq, M.I.; Nowreen, S.; Zahid, A.; Ahmed, K.M.U. The Bengal Water Machine: Quantified freshwater capture in Bangladesh. Science 2022, 377, 1315–1319. [Google Scholar] [CrossRef] [PubMed]
- Caraballo, M.A.; Macías, F.; Nieto, J.M.; Ayora, C. Long term fuctuations of groundwater mine pollution in a sulfde mining district with dry Mediterranean climate: Implications for water resources management and remediation. Sci. Total Environ. 2016, 539, 427–435. [Google Scholar] [CrossRef]
- Bekkoussa, S.; Bekkoussa, B.; Taupin, J.-D.; Patris, N.; Meddi, M. Groundwater hydrochemical characterization and quality assessment in the Ghriss Plain basin, northwest Algeria. J. Water Supply Res. Technol. AQUA 2018, 67, 458–466. [Google Scholar] [CrossRef]
- Saha, S.K.; Gazi, M.Y.; Tajwar, M.; Kumar, S. Soil Contamination Assessment by Trace Elements in Barapukuria Coal Mine Region, Bangladesh Soil Contamination Assessment by Trace Elements in Barapukuria Coal Mine Region, Bangladesh. Environ. Earth Sci. Res. J. 2021, 8, 1–10. [Google Scholar]
- Islam, S.M.D.; Uddin, M.J. Impacts, vulnerability and coping with cyclone hazard in coastal region of Bangladesh: A case study on Kalapara upazila of Patuakhali district. Jahangirnagar Univ. Env. Bull. 2015, 4, 11–30. [Google Scholar]
- Loitzenbauer, E.; Mendes, C.A.B. Salinity dynamics as a tool for water resources management in coastal zones: An application in the Tramandaí River basin, southern Brazil. Ocean. Coast. Manag. 2012, 55, 52–62. [Google Scholar] [CrossRef]
- Karro, E.; Marandi, A.; Vaikm, R. The origin of increased salinity in the Cambrian-Vendian aquifer system on the Kopl Peninsula, northern Estonia. Hydrogeol. J. 2004, 12, 424–435. [Google Scholar] [CrossRef]
- Shamsudduha, M.; Marzen, L.J.; Uddin, A.; Lee, M.K.; Saunders, J.A. Spatial relationship of groundwater arsenic distribution with regional topography and water-table fluctuations in the shallow aquifers in Bangladesh. Environ. Geol. 2009, 57, 1521–1535. [Google Scholar] [CrossRef]
- Uddin, A.; Shamsudduha, M.; Saunders, J.A.; Lee, M.K.; Ahmed, K.M.; Chowdhury, M.T. Mineralogical profiling of alluvial sediments from arsenic-affected Ganges–Brahmaputra floodplain in central Bangladesh. Appl. Geochem. 2011, 26, 470–483. [Google Scholar] [CrossRef]
- Bahar, M.M.; Reza, M.S. Hydrochemical characteristics and quality assessment of shallow groundwater in a coastal area of southwest Bangladesh. Environ. Earth Sci. 2010, 61, 1065–1073. [Google Scholar] [CrossRef]
- Rahman, M.M.; Bhattacharya, A.K. Saline water Intrusion in Coastal Aquifer: A case study from Bangladesh. J. Eng. 2014, 4, 7–13. [Google Scholar] [CrossRef]
- Tajwar, M.; Uddin, A. Heavy minerals distribution in arsenic-contaminated coastal sediments in the southern part of Bangladesh. In Geological Society of America Abstracts with Programs; Geological Society of America: Boulder, CO, USA, 2021; Volume 53. [Google Scholar] [CrossRef]
- Bodrud-Doza, M.; Islam, S.M.D.-U.; Rume, T.; Quraishi, S.B.; Rahman, M.S.; Bhuiyan, M.A.H. Groundwater quality and human health risk assessment for safe and sustainable water supply of Dhaka City dwellers in Bangladesh. Groundw. Sustain. Dev. 2020, 10, 100374. [Google Scholar] [CrossRef]
- Jahan, C.S.; Rahaman, M.; Arefin, R.; Ali, M.; Mazumder, Q.H. Delineation of groundwater potential zones of Atrai-Sib river basin in north-west Bangladesh using remote sensing and GIS techniques. Sustain. Water Resour. Manag. 2019, 5, 689–702. [Google Scholar] [CrossRef]
- Ahmed, N.; Hoque, M.A.-A.; Pradhan, B.; Arabameri, A. Spatio-temporal assessment of groundwater potential zone in the drought-prone area of Bangladesh using GIS-based bivariate models. Nat. Resour. Res. 2021, 30, 3315–3337. [Google Scholar] [CrossRef]
- Sresto, M.A.; Siddika, S.; Haque, M.N.; Saroar, M. Application of fuzzy analytic hierarchy process and geospatial technology to identify groundwater potential zones in north-west region of Bangladesh. Environ. Chall. 2021, 5, 100214. [Google Scholar] [CrossRef]
- Islam, S.M.; Majumder, R.K.; Uddin, M.J.; Khalil, M.; Ferdous Alam, M. Hydrochemical characteristics and quality assessment of groundwater in Patuakhali district, southern coastal region of Bangladesh. Expo. Health 2017, 9, 43–60. [Google Scholar] [CrossRef]
- Mukherjee, A.; Bhattacharya, P.; Ahmed, K.M. Groundwater quality of Meghna River Basin aquifers. In Groundwater of South Asia; Springer: Berlin/Heidelberg, Germany, 2018; pp. 307–317. [Google Scholar] [CrossRef]
- Kabir, M.M.; Hossain, N.; Islam, A.R.M.T.; Akter, S.; Fatema, K.J.; Hilary, L.N.; Hasanuzzaman, M.; Didar-ul-Alam, M.; Choudhury, T.R. Characterization of groundwater hydrogeochemistry, quality, and associated health hazards to the residents of southwestern Bangladesh. Environ. Sci. Pollut. Res. 2021, 28, 68745–68761. [Google Scholar] [CrossRef] [PubMed]
- Hasan, M.; Islam, M.A.; Alam, M.J.; Rahman, M.; Hasan, M.A. Hydrogeochemical characterization and quality assessment of groundwater resource in Savar—An industrialized zone of Bangladesh. Environ. Monit. Assess. 2022, 194, 549. [Google Scholar] [CrossRef]
- Tajwar, M.; Uddin, A. Hydrochemical Characteristics and Quality Assessment of Groundwater In Hatiya Island, Southern Coastal Region Of Bangladesh. In Geological Society of America Abstracts with Programs; 2022; Volume 54. [Google Scholar] [CrossRef]
- Islam, A.R.M.T.; Shen, S.; Haque, M.A.; Bodrud-Doza, M.; Maw, K.W.; Habib, M.A. Assessing groundwater quality and its sustainability in Joypurhat district of Bangladesh using GIS and multivariate statistical approaches. Environ. Dev. Sustain. 2018, 20, 1935–1959. [Google Scholar] [CrossRef]
- Khan, M.R.; Koneshloo, M.; Knappett, P.S.K.; Ahmed, K.M.; Bostick, B.C.; Mailloux, B.J.; Mozumder, R.H.; Zahid, A.; Harvey, C.F.; Van Geen, A. Megacity pumping and preferential flow threaten groundwater quality. Nat. Commun. 2016, 7, 12833. [Google Scholar] [CrossRef]
- Khan, M.K.A.; Alam, M.; Islam, M.S.; Hassan, M.Q.; Al-Mansur, M.A. Environmental pollution around Dhaka EPZ and its impact on surface and groundwater. Bangladesh J. Sci. Ind. Res. 2011, 46, 153–162. [Google Scholar] [CrossRef]
- Knappett, P.S.K.; Mailloux, B.J.; Choudhury, I.; Khan, M.R.; Michael, H.A.; Barua, S.; Mondal, D.R.; Steckler, M.S.; Akhter, S.H.; Ahmed, K.M. Vulnerability of low-arsenic aquifers to municipal pumping in Bangladesh. J. Hydrol. 2016, 539, 674–686. [Google Scholar] [CrossRef] [PubMed]
- Mihajlov, I.; Mozumder, M.R.H.; Bostick, B.C.; Stute, M.; Mailloux, B.J.; Knappett, P.S.K.; Choudhury, I.; Ahmed, K.M.; Schlosser, P.; van Geen, A. Arsenic contamination of Bangladesh aquifers exacerbated by clay layers. Nat. Commun. 2020, 11, 2244. [Google Scholar] [CrossRef]
- Yasmin, G.; Islam, D.; Islam, M.T.; Adham, A.K.M. Evaluation of groundwater quality for irrigation and drinking purposes in Barishal District of Bangladesh. Fundam. Appl. Agric. 2019, 4, 632–641. [Google Scholar] [CrossRef]
- Iqbal, A.B.; Rahman, M.M.; Mondal, D.R.; Khandaker, N.R.; Khan, H.M.; Ahsan, G.U.; Jakariya, M.; Hossain, M.M. Assessment of Bangladesh groundwater for drinking and irrigation using weighted overlay analysis. Groundw. Sustain. Dev. 2020, 10, 100312. [Google Scholar] [CrossRef]
- Anonna, T.A.; Ahmed, Z.; Alam, R.; Karim, M.; Xie, Z.; Kumar, P.; Zhang, F.; Simal-Gandara, J. Water quality assessment for drinking and irrigation purposes in Mahananda River Basin of Bangladesh. Earth Syst. Environ. 2022, 6, 87–98. [Google Scholar] [CrossRef]
- Rahman, M.; Khan, M.; Islam, S.; Hossain, M.S.; Hossain, M.; Shohel, I.; Hasan, M.; Hamli, H.; Mustafa, M.G. Groundwater Contamination and Health Risk Evaluation of Naturally Occurring Potential Toxic Metals of Hatiya Island, Bangladesh. J. Ecol. Eng. 2022, 23, 223–236. [Google Scholar] [CrossRef]
- BBS. Statistical Year Book of Bangladesh 2011; Bangladesh, Bureau of Statistics, Ministry of Planning, Government of Bangladesh: Agargaon, Dhaka, 2011.
- Ghosh, M.K.; Kumar, L.; Roy, C. Monitoring the coastline change of Hatiya Island in Bangladesh using remote sensing techniques. ISPRS J. Photogramm. Remote Sens. 2015, 101, 137–144. [Google Scholar] [CrossRef]
- Goodbred, S.L., Jr.; Kuehl, S.A.; Steckler, M.S.; Sarker, M.H. Controls on facies distribution and stratigraphic preservation in the Ganges–Brahmaputra delta sequence. Sediment. Geol. 2003, 155, 301–316. [Google Scholar] [CrossRef]
- FAO. Report on Tidal Area Study Fisheries Resources Survey System FAO/UNDP-BGD/79/015; FAO: Rome, Italy, 1985. [Google Scholar]
- Zahid, A.; Afzal Hossain, A.F.M.; Hazrat Ali, M.; Islam, K.; Abbassi, S.U. Monitoring the coastal groundwater of Bangladesh. In Groundwater of South Asia; Springer: Singapore, 2018; pp. 431–451. [Google Scholar]
- Ravenscroft, P.; McArthur, J.M. Mechanism of regional enrichment of groundwater by boron: The examples of Bangladesh and Michigan, USA. Appl. Geochem. 2004, 19, 1413–1430. [Google Scholar] [CrossRef]
- BWDB. Hydrogeological Study and Mathematical Modelling to Identify Sites for Installation of Observation Well Nests, Selection on Model Boundary, Supervision of Pumping Test, Slug Test, Assessment of Different Hydrogeological Parameters Collection And Conduct Chemical Analysis of Surface Water And Groundwater, Final Report; Bangladesh Water Development Board and Institute of Water Modelling: Dhaka, Bangladesh, 2013; p. 152. [Google Scholar]
- APHA. Standard Methods for the Examination of Water and Wastewater. Washington: American Public Health Association (22nd ed). 2012. Available online: http://www.standardmethods.org/ (accessed on 3 February 2021).
- USGS. National Field Manual for the Collection of Water-Quality Data, Book 9, Version 2.0. 2006. Available online: http://water.usgs.gov/owq/FieldManual/Chapter6/Archive/Section6.6_4-98.pdf (accessed on 10 February 2021).
- Piper, A.M. A graphic procedure in the geochemical interpretation of water-analyses. Eos Trans. Am. Geophys. Union 1944, 25, 914–928. [Google Scholar] [CrossRef]
- Gibbs, R.J. Mechanisms controlling world water chemistry. Science 1970, 170, 1088–1090. [Google Scholar] [CrossRef]
- Naseem, S.; Rafique, T.; Bashir, E.; Bhanger, M.I.; Laghari, A.; Usmani, T.H. Lithological influences on occurrence of high-fluoride groundwater in Nagar Parkar area, Thar Desert, Pakistan. Chemosphere 2010, 78, 1313–1321. [Google Scholar] [CrossRef] [PubMed]
- Marghade, D.; Malpe, D.B.; Zade, A.B. Major ion chemistry of shallow groundwater of a fast growing city of Central India. Environ. Monit. Assess. 2012, 184, 2405–2418. [Google Scholar] [CrossRef]
- Wilcox, L.V. The Quality of Water for Irrigation Use; US Department of Agriculture Technology Bulletin 962; US Department of Agriculture Technology: Washington, DC, USA, 1948; Volume 40.
- Meng, S.X.; Maynard, J.B. Use of statistical analysis to formulate conceptual models of geochemical behaviour: Water chemical data from the Botucatu aquifer in Sao Paulostate, Brazil. J. Hydrol. 2001, 250, 78–97. [Google Scholar] [CrossRef]
- Hamzaoui-Azaza, F.; Ketata, M.; Bouhlila, R.; Gueddari, M. Hydrochemical evolution and evolution of drinking water quality in Zeuss–Koutine aquifer, south-eastern of Tunisia. Environ. Monit. Assess. 2011, 174, 283–298. [Google Scholar] [CrossRef]
- Wu, J.; Li, P.; Qian, H. Using correlation and multivariate statistical analysis to identify hydrogeochemical processes affecting the major ion chemistry of waters: A case study in Laohebaphosphorite mine in Sichuan, China. Arab. J. Geosci. 2014, 7, 3973–3982. [Google Scholar] [CrossRef]
- Kim, J.H.; Kim, R.H.; Lee, J.; Chenong, T.J.; Yum, B.W.; Chang, H.W. Multivariate statistical analysis to identify the major factors governing groundwater quality in the coastal are of Kimje, South Korea. Hydrol. Process. Int. J. 2005, 19, 1261–1276. [Google Scholar] [CrossRef]
- Papatheodorou, G.; Lambrakis, N.; Panagopoulos, G. Application of multivariate statistical procedures to the hydrochemical study of a coastal aquifer: An example from Crete, Greece. Hydrol. Process. J. 2007, 21, 1482–1495. [Google Scholar] [CrossRef]
- Bouzourra, H.; Bouhlila, R.; Elango, L.; Slama, F.; Ouslati, N. Characterization of mechanisms and processes of groundwater stalinization in irrigated coastal area using statistics, GIS and hydrochemical investigations. Environ. Sci. Pollut. Res. 2015, 22, 2643–2660. [Google Scholar] [CrossRef]
- Islam, M.A.; Rahman, M.M.; Bodrud-Doza, M.; Muhib, M.I.; Shammi, M.; Zahid, A.; Akter, Y.; Kurasaki, M. A study of groundwater irrigation water quality in south-central Bangladesh: A geo-statistical model approach using GIS and multivariate statistics. Acta Geochim. 2018, 37, 193–214. [Google Scholar] [CrossRef]
- Panda, U.C.; Sundaray, S.K.; Rath, P.; Nayak, B.B.; Bhatta, D. Application of factor and cluster analysis for characterization of river and estuarine water systems—A case study: Mahanadi River (India). J. Hydrol. 2006, 331, 434–445. [Google Scholar] [CrossRef]
- Bodrud-Doza, M.; Islam, A.R.M.T.; Ahmed, F.; Samiran, D.; Narottam, S.; Rahman, M.S. Characterization of groundwater quality using water evaluation indices, multivariate statistics and geostatistics in central Bangladesh. Water Sci. 2016, 30, 19–40. [Google Scholar] [CrossRef]
- Sarath Prasanth, S.V.; Magesh, N.S.; Jitheshlal, K.V.; Chandrasekar, N.; Gangadhar, K.J.A.W.S. Evaluation of groundwater quality and its suitability for drinking and agricultural use in the coastal stretch of Alappuzha District, Kerala, India. Appl. Water Sci. 2012, 2, 165–175. [Google Scholar] [CrossRef]
- Avvannavar, S.M.; Shrihari, S. Evaluation of water quality index for drinking purposes for river Netravathi, Mangalore, South India. Environ. Monit. Assess. 2008, 143, 279–290. [Google Scholar] [CrossRef]
- Mitra, B.K.; Sasaki, C.; Keijirou, E. Spatial and temporal variation of ground water quality in sand dune area of aomori prefecture in Japan. In 2006 ASAE Annual Meeting; American Society of Agricultural and Biological Engineers: St. Joseph, MI, USA, 2006. [Google Scholar]
- WHO. Guidelines for Drinking-Water Quality; World Health Organization: Geneva, Switzerland, 2011; Volume 216, pp. 303–304. [Google Scholar]
- Dwivedi, S.L.; Pathak, V. A preliminary assignment of water quality index to Mandakini River, Chitrakoot. Indian J. Environ. Prot. 2007, 27, 1036. [Google Scholar]
- Yogendra, K.; Puttaiah, E.T. Determination of water quality index and suitability of urban water body in Shimoga town, Karnataka. In Proceedings of the 12th World Lake Conference, Jaipur, India, 28 October–2 November 2017; pp. 342–346. [Google Scholar]
- Saeedi, M.; Abessi, O.; Sharifi, F.; Meraji, H. Development of groundwater quality index. Environ. Monit. Assess. 2010, 163, 327–335. [Google Scholar] [CrossRef] [PubMed]
- Ketata, M.; Gueddari, M.; Bouhlila, R. Use of geographical information system and water quality index to assess groundwater quality in El Khairat deep aquifer (Enfidha, Central East Tunisia). Arab. J. Geosci. 2012, 5, 1379–1390. [Google Scholar] [CrossRef]
- Horton, R.K. An index number system for rating water quality. J. Water Pollut. Control. Fed. 1965, 37, 300–306. [Google Scholar]
- Brown, R.M.; McClelland, N.I.; Deininger, R.A.; O’Connor, M.F. A water quality index—Crashing the psychological barrier. In Indicators of Environmental Quality; Springer: Berlin/Heidelberg, Germany, 1972; pp. 173–182. [Google Scholar]
- Srinivasamoorthy, K.; Chidambaram, S.; Prasanna, M.V.; Vasanthavihar, M.; Peter, J.; Anandhan, P. Identification of major sources controlling groundwater chemistry from a hard rock terrain—A case study from Mettur taluk, Salem district, Tamil Nadu, India. J. Earth Syst. Sci. 2008, 117, 49. [Google Scholar] [CrossRef]
- Ishaku, J.M.; Ahmed, A.S.; Abubakar, M.A. Assessment of groundwater quality using water quality index and GIS in Jada, northeastern Nigeria. Int. Res. J. Geol. Min. 2012, 2, 54–61. [Google Scholar]
- Oişte, A.M. Groundwater quality assessment in urban environment. Int. J. Environ. Sci. Technol. 2014, 11, 2095–2102. [Google Scholar] [CrossRef]
- Verma, A.; Shetty, B.K.; Guddattu, V.; Chourasia, M.K.; Pundir, P. High prevalence of dental fluorosis among adolescents is a growing concern: A school based cross-sectional study from Southern India. Environ. Health Prev. Med. 2017, 22, 17. [Google Scholar] [CrossRef] [PubMed]
- Ghalib, H.B. Groundwater chemistry evaluation for drinking and irrigation utilities in east Wasit province, Central Iraq. Appl. Water Sci. 2017, 7, 3447–3467. [Google Scholar] [CrossRef]
- Eaton, F.M. Significance of carbonates in irrigation waters. Soil Sci. 1950, 69, 123–134. [Google Scholar] [CrossRef]
- Raghunath, H.M. Ground Water: Hydrogeology, Ground water Survey and Pumping Tests, Rural Water Supply and Irrigation Systems; New Age International: Delhi, India, 1987. [Google Scholar]
- Khalid, S. An assessment of groundwater quality for irrigation and drinking purposes around brick kilns in three districts of Balochistan province, Pakistan, through water quality index and multivariate statistical approaches. J. Geochem. Explor. 2019, 197, 14–26. [Google Scholar] [CrossRef]
- Trieff, N.M. Environment and Health. Tex. Rep. Biol. Med. 1980, 33, 7–22. [Google Scholar]
- Sivasubramanian, P.; Balasubramanian, N.; Soundranayagam, J.P.; Chandrasekar, N. Hydrochemical characteristics of coastal aquifers of Kadaladi, Ramanathapuram District, Tamilnadu, India. Appl. Water Sci. 2013, 3, 603–612. [Google Scholar] [CrossRef]
- Jeevanandam, M.; Senthilkumar, M.; Nagarajan, R.; Srinivasalu, S.; Manikandan, M.; Prasanna, M.V. Hydrogeochemistry and microbial contamination of groundwater from Lower Ponnaiyar Basin, Cuddalore District, Tamil Nadu, India. Environ. Earth Sci. 2012, 67, 867–887. [Google Scholar] [CrossRef]
- US Salinity Laboratory. Diagnosis and Improvement of Saline and Alkali Soils; Agriculture Handbook NO. 60; USDA: Washington, DC, USA, 1954; p. 160.
- Chen, K.; Jiao, J.J.; Huang, J.; Huang, R. Multivariate statistical evaluation of trace elements in groundwater in a coastal area in Shenzhen. China. Environ. Pollut. 2007, 147, 771–780. [Google Scholar] [CrossRef]
- Hasan, M.A.; Ahmed, K.M.; Sracek, O.; Bhattacharya, P.; Von Broemssen, M.; Broms, S.; Fogelström, J.; Mazumder, M.L.; Jacks, G. Arsenic in shallow groundwater of Bangladesh: Investigations from three different physiographic settings. Hydrogeol. J. 2007, 15, 1507–1522. [Google Scholar] [CrossRef]
- Chapagain, S.K.; Pandey, V.P.; Shrestha, S.; Nakamura, T.; Kazama, F. Assessment of deep groundwater quality in Kathmandu Valley using multivariate statistical techniques. Water Air Soil Pollut. 2010, 210, 277–288. [Google Scholar] [CrossRef]
- Kraiem, Z.; Zouari, K.; Chkir, N.; Agoune, A. Geochemical characteristics of arid shallow aquifers in Chott Djerid, south-western Tunisia. J. Hydro-Environ. Res. 2014, 8, 460–473. [Google Scholar] [CrossRef]
- Doza, B.; Bhuiyan, M.A.H.; Islam, S.D.-U.; Rahman, M.S.; Haque, M.; Fatema, K.J.; Ahmed, N.; Rakib, M.; Rahman, A. Hydrogeochemical investigation of groundwater in Dhaka City of Bangladesh using GIS and multivariate statistical techniques. Groundw. Sustain. Dev. 2019, 8, 226–244. [Google Scholar] [CrossRef]
- Jackson, J.E. A User’s Guide to Principal Components; John Wiley & Sons: Hoboken, NJ, USA, 2005; Volume 587. [Google Scholar]
- Bromfield, S.M. The oxidation of manganous ions under acid conditions by an acidophilous actinomycete from acid soil. Soil Res. 1978, 16, 91–100. [Google Scholar] [CrossRef]
- Bhattacharya, P.; Jacks, G.; Ahmed, K.M.; Routh, J.; Khan, A.A. Arsenic in groundwater of the Bengal Delta Plain aquifers in Bangladesh. Bull. Environ. Contam. Toxicol. 2002, 69, 538–545. [Google Scholar] [CrossRef]
- Islam, I.R.; Rahman, M.; Reza, A.; Rahman, M. Groundwater geochemistry and its implication for arsenic enrichment and mobilization in shallow alluvial aquifers of Pakshi Union, Ishwardi, Pabna. Bangladesh. Int. J. Chem.Mater. Sci. 2013, 1, 69–78. [Google Scholar]
- Naujokas, M.F.; Anderson, B.; Ahsan, H.; Aposhian, H.V.; Graziano, J.H.; Thompson, C.; Suk, W.A. The broad scope of health effects from chronic arsenic exposure: Update on a worldwide public health problem. Environ. Health Perspect. 2013, 121, 295–302. [Google Scholar] [CrossRef]
- Helena, B.; Pardo, R.; Vega, M.; Barrado, E.; Fernandez, J.M.; Fernandez, L. Temporal evolution of groundwater composition in an alluvial aquifer (Pisuerga River, Spain) by principal component analysis. Water Res. 2000, 34, 807–816. [Google Scholar] [CrossRef]
- Levins, I.; Gosk, E. Trace elements in groundwater as indicators of anthropogenic impact. Environ. Geol. 2008, 55, 285–290. [Google Scholar] [CrossRef]
- Shammi, M.; Rahman, M.; Islam, A.; Doza, B.; Zahid, A.; Akter, Y.; Quaiyum, S.; Kurasaki, M. Spatio-temporal assessment and trend analysis of surface water salinity in the coastal region of Bangladesh. Environ. Sci. Pollut. Res. 2017, 24, 14273–14290. [Google Scholar] [CrossRef] [PubMed]
- Bhuiyan, M.A.H.; Bodrud-Doza, M.; Islam, A.R.M.T.; Rakib, M.A.; Rahman, M.S.; Ramanathan, A.L. Assessment of groundwater quality of Lakshimpur district of Bangladesh using water quality indices, geostatistical methods, and multivariate analysis. Environ. Earth Sci. 2016, 75, 1020. [Google Scholar] [CrossRef]
- Bhuiyan, M.A.H.; Rakib, M.A.; Dampare, S.B.; Ganyaglo, S.; Suzuki, S. Surface water quality assessment in the central part of Bangladesh using multivariate analysis. KSCE J. Civ. Eng. 2011, 15, 995–1003. [Google Scholar] [CrossRef]
- Sadat-Noori, S.M.; Ebrahimi, K.; Liaghat, A.M. Groundwater quality assessment using the water quality index and GIS in Saveh-Nobaran aquifer, Iran. Environ. Earth Sci. 2014, 71, 3827–3843. [Google Scholar] [CrossRef]
- Obiefuna, G.I.; Sheriff, A. Assessment of shallow ground water quality of Pindiga Gombe area, Yola area, NE, Nigeria for irrigation and domestic purposes. Res. J. Environ. Earth Sci. 2011, 3, 131–141. [Google Scholar]
- Kundu, A.; Nag, S.K. Assessment of groundwater quality in Kashipur block, Purulia district, West Bengal. Appl. Water Sci. 2018, 8, 33. [Google Scholar] [CrossRef]
- Ayers, R.S.; Westcot, D.W. Water Quality for Agriculture; Food and Agriculture Organization of the United Nations: Rome, Italy, 1985; Volume 29. [Google Scholar]
- Todd, D.K.; Mays, L.W. Groundwater Hydrology; John Wiley & Sons: Hoboken, NJ, USA, 2004. [Google Scholar]
- Sadashivaiah, C.; Ramakrishnaiah, C.R.; Ranganna, G. Hydrochemical analysis and evaluation of groundwater quality in Tumkur Taluk, Karnataka State, India. Int. J. Environ. Res. Public Health 2008, 5, 158–164. [Google Scholar] [CrossRef] [PubMed]
- Davis, S.N.; DeWiest, R.J.M. Hydrogeology; Wiley: New York, NY, USA, 1966; p. 463. [Google Scholar]


| Ca | Mg | Na | K | HCO3 | Cl | SO4 | NO3 | Fe | Mn | As | I | Br | pH | EC (µS/cm) | TDS |
|---|---|---|---|---|---|---|---|---|---|---|---|---|---|---|---|
| 1 | |||||||||||||||
| 0.531 | 1 | ||||||||||||||
| 0.454 | 0.919 | 1 | |||||||||||||
| 0.07 | 0.287 | 0.269 | 1 | ||||||||||||
| 0.19 | 0.361 | 0.58 | 0.155 | 1 | |||||||||||
| 0.504 | 0.95 | 0.993 | 0.273 | 0.495 | 1 | ||||||||||
| −0.127 | 0.097 | 0.329 | 0.234 | 0.105 | 0.296 | 1 | |||||||||
| 0.157 | 0.347 | 0.286 | 0.412 | −0.246 | 0.333 | 0.569 | 1 | ||||||||
| 0.325 | 0.779 | 0.726 | 0.075 | 0.11 | 0.767 | −0.028 | 0.166 | 1 | |||||||
| 0.491 | 0.621 | 0.518 | 0.108 | 0.099 | 0.561 | 0.205 | 0.4 | 0.496 | 1 | ||||||
| 0.064 | 0.226 | 0.364 | 0.403 | 0.39 | 0.329 | 0.522 | 0.289 | 0.085 | 0.245 | 1 | |||||
| −0.108 | 0.052 | 0.006 | −0.095 | 0.203 | −0.012 | 0.005 | 0.135 | −0.007 | 0.332 | 0.125 | 1 | ||||
| −0.076 | 0.017 | −0.065 | −0.095 | 0.098 | −0.071 | −0.048 | 0.187 | −0.043 | 0.29 | 0.05 | 0.984 | 1 | |||
| −0.471 | −0.811 | −0.766 | −0.207 | −0.139 | −0.802 | −0.211 | −0.571 | −0.752 | −0.648 | −0.07 | −0.136 | −0.133 | 1 | ||
| 0.48 | 0.954 | 0.97 | 0.242 | 0.403 | 0.988 | 0.27 | 0.378 | 0.832 | 0.571 | 0.302 | −0.002 | −0.051 | −0.825 | 1 | |
| 0.48 | 0.954 | 0.97 | 0.242 | 0.403 | 0.988 | 0.27 | 0.378 | 0.832 | 0.571 | 0.302 | −0.002 | −0.051 | −0.825 | 1 | 1 |
| Variable | PC1 | PC2 | PC3 | PC4 |
|---|---|---|---|---|
| Ca | 0.533 | −0.294 | 0.004 | 0.254 |
| Mg | 0.945 | −0.201 | 0.045 | 0.041 |
| Na | 0.968 | −0.005 | −0.093 | 0.149 |
| K | 0.317 | 0.344 | −0.309 | −0.135 |
| HCO3 | 0.458 | 0.358 | 0.003 | 0.661 |
| Cl | 0.982 | −0.074 | −0.082 | 0.082 |
| SO4 | 0.309 | 0.589 | −0.247 | −0.446 |
| NO3 | 0.362 | 0.864 | −0.173 | −0.013 |
| Fe | 0.785 | −0.347 | 0.053 | −0.116 |
| Mn | 0.667 | 0.018 | 0.373 | −0.326 |
| As | 0.407 | 0.813 | −0.201 | −0.005 |
| I | 0.078 | 0.366 | 0.917 | 0.045 |
| Br | 0.022 | 0.297 | 0.935 | −0.004 |
| pH | −0.84 | 0.25 | −0.187 | 0.259 |
| EC | 0.978 | −0.123 | −0.05 | 0.008 |
| Eigenvalue | 4.927 | 2.193 | 1.884 | 1.388 |
| % variance | 37.9 | 16.87 | 14.49 | 10.68 |
| Cumulative % | 37.9 | 54.77 | 69.26 | 79.94 |
| Range | Class | Frequency % (Counts) | Reference |
|---|---|---|---|
| <50 | Excellent | 0% (0) | [14,78] |
| 50−100 | Good | 40% (6) | |
| 100.1−200 | Poor | 13.33% (2) | |
| 200.1−300 | Very poor | 6.66% (1) | |
| >300 | Unsuitable for drinking | 40% (6) |
| Parameter | Range | Class | Frequency % (Counts) | Reference |
|---|---|---|---|---|
| Electrical conductivity (EC) | <700 | No hazard | 13.3% (2) | [115] |
| 700−3000 | Slight-to-moderate hazard | 40% (6) | ||
| >3000 | Severe hazard | 44.7% (7) | ||
| Sodium absorption ratio (SAR) | <10 | Excellent | 26.66% (4) | [12,116] |
| 10−18 | Good | 26.66% (4) | ||
| 18−26 | Poor | 6.66% (1) | ||
| >26 | Unsuitable | 40% (6) | ||
| Soluble sodium percentage (SSP) | <20 | Excellent | 0% (0) | [117] |
| 20−40 | Good | 0% (0) | ||
| 40−80 | Fair | 53.3% (8) | ||
| >80 | Unsuitable | 44.7% (7) | ||
| Residual sodium carbonate (RSC) | <1.25 | Safe | 13.3% (2) | [12] |
| 1.25–2.5 | Marginally suitable | 33.3% (5) | ||
| >2.5 | Unsuitable | 53.3% (8) | ||
| TDS | <500 | Excellent | 13.3% (2) | [118] |
| 500–1000 | Good | 33.3% (5) | ||
| 1000–3000 | Suitable | 6.66% (1) | ||
| >3000 | Unsuitable | 44.7% (7) |
Disclaimer/Publisher’s Note: The statements, opinions and data contained in all publications are solely those of the individual author(s) and contributor(s) and not of MDPI and/or the editor(s). MDPI and/or the editor(s) disclaim responsibility for any injury to people or property resulting from any ideas, methods, instructions or products referred to in the content. |
© 2023 by the authors. Licensee MDPI, Basel, Switzerland. This article is an open access article distributed under the terms and conditions of the Creative Commons Attribution (CC BY) license (https://creativecommons.org/licenses/by/4.0/).
Share and Cite
Tajwar, M.; Uddin, A.; Lee, M.-K.; Nelson, J.; Zahid, A.; Sakib, N. Hydrochemical Characterization and Quality Assessment of Groundwater in Hatiya Island, Southeastern Coastal Region of Bangladesh. Water 2023, 15, 905. https://doi.org/10.3390/w15050905
Tajwar M, Uddin A, Lee M-K, Nelson J, Zahid A, Sakib N. Hydrochemical Characterization and Quality Assessment of Groundwater in Hatiya Island, Southeastern Coastal Region of Bangladesh. Water. 2023; 15(5):905. https://doi.org/10.3390/w15050905
Chicago/Turabian StyleTajwar, Mahir, Ashraf Uddin, Ming-Kuo Lee, Jake Nelson, Anwar Zahid, and Nazmus Sakib. 2023. "Hydrochemical Characterization and Quality Assessment of Groundwater in Hatiya Island, Southeastern Coastal Region of Bangladesh" Water 15, no. 5: 905. https://doi.org/10.3390/w15050905
APA StyleTajwar, M., Uddin, A., Lee, M.-K., Nelson, J., Zahid, A., & Sakib, N. (2023). Hydrochemical Characterization and Quality Assessment of Groundwater in Hatiya Island, Southeastern Coastal Region of Bangladesh. Water, 15(5), 905. https://doi.org/10.3390/w15050905