Article

Field Evaluation of UF Filtration Pretreatment Impact on RO Membrane Scaling

1
Water Technology Research (WaTeR) Center, Chemical and Biomolecular Engineering Department, University of California, Los Angeles, CA 90095, USA
2
School of Computer Science and Engineering, California State University San Bernardino, 5500 University Parkway, San Bernardino, CA 92407, USA
*
Author to whom correspondence should be addressed.
Water 2023, 15(5), 847; https://doi.org/10.3390/w15050847
Submission received: 1 January 2023 / Revised: 16 February 2023 / Accepted: 18 February 2023 / Published: 22 February 2023
(This article belongs to the Special Issue Ultrafiltration Membranes in Water Treatment)

Abstract

:
Pretreatment of reverse osmosis (RO) feed water of high mineral scaling propensity was evaluated with respect to downstream RO membrane scaling, for two different feed pretreatment configurations. The pretreatment schemes included (i) media sand filtration, followed by a hydrocyclone (HC) and (ii) a hydrocyclone, microfilter, and a UF module, where both configurations included mesh screens for added protection. The first pretreatment configuration reduced the source water turbidity to ~0.5 NTU, while treatment that included UF feed yielded turbidity of < ˜ 0.1   NTU ; both pretreatment strategies provided feed water turbidity within the range recommended for RO desalination. Membrane scaling tests, with the pretreated water without antiscalant dosing, using a plate-and-frame RO unit and a membrane monitoring system, provided real-time membrane surface images that were quantified with respect to the progression of mineral scaling. RO desalting of source water pretreated with the first configuration revealed flux decline that was 75% greater and scale coverage (primarily gypsum) a factor of approximately eight higher relative to desalting of UF-treated source water. The results suggest that RO desalting of high mineral scaling propensity water can significantly benefit from added UF treatment to achieve feedwater turbidity to well below the typically recommended 0.5 NTU upper limit.

1. Introduction

Reverse osmosis (RO) membrane desalination technology is utilized for desalting seawater, brackish groundwater, industrial water, and in municipal water reuse applications given its operational simplicity and scalability [1,2,3]. Although RO/NF desalination is of increasing popularity, membrane mineral scaling and fouling (e.g., by particulate matter, organics, and biological matter) remain as major impediments to effective and efficient RO/NF water desalination/treatment. Membrane mineral scaling, which is the focus of the present contribution, occurs when the concentrations of sparingly soluble salts (e.g., CaCO3, CaSO4, BaSO4, SrSO4, and silica) exceed their solubility limits within the RO membrane feed channels [4]. As a result, the occurrence of scaling is due to (a) precipitation/crystallization of sparingly soluble salts in the bulk of the solution, followed by subsequent deposition onto the membrane surface, and continued crystal growth; and/or (b) direct heterogeneous nucleation on the membrane surface and subsequent crystal growth. It is noted that heterogeneous nucleation at the membrane surface can occur at significantly lower supersaturation levels relative to homogeneous nucleation for which significant crystallization “induction” time is often reported [2,5,6,7]. As a consequence of mineral scaling, membrane permeability declines and thus energy consumption increases for a given target permeate production level in addition to potential system downtime, added cost of membrane cleaning, and shortening of membrane service life [8]. Moreover, the presence of mineral scale on the membrane surface can also physically damage the membrane active layer, thus resulting in decreased solute rejection and loss of product quality [9].
There are various approaches to membrane scale mitigation including, for example, removal of scale precursor ions via feedwater pretreatment (e.g., chemical softening, ion exchange, nanofiltration), and inhibition of nucleation/crystal growth via dosing of antiscalant into the RO feedwater [10]. However, the presence of suspended particulate matter in a saline source water, unless removed from RO feed of high mineral scaling propensity, may accelerate mineral salt crystal nucleation [11] and thus exacerbate RO membrane mineral scaling as suggested in various studies on RO mineral scaling [12,13,14,15]. For example, studies on gypsum crystallization from solutions being about a factor of six above saturation have shown that the presence of colloidal particles (e.g., sulfate latex, silica colloids, and gypsum and calcite particles) in the size range of 16–1000 nm, decreased the crystallization induction time of gypsum crystallization by a factor of 1.5–7 [11,16,17,18,19,20,21]. The presence of foreign particulate matter in a supersaturated solution was also shown to lead to increased calcium carbonate and gypsum scaling (via deposition of bulk formed crystals or direct surface crystallization onto deposited particles) of labyrinth drippers [3], membranes [22,23], and heat transfer surfaces [24]. The above studies clearly document that the presence of particulate matter in the sub-micron and nano size range can increase the rate of mineral crystal nucleation from supersaturated solutions of sparingly soluble mineral salts. However, we note that the removal of particulate matter from RO feed has generally been pursued primarily for the purpose of reducing downstream RO membrane fouling by suspended matter [25].
Although previous studies have acknowledged that suspended matter can exacerbate RO membrane scaling, the impact of suspended matter removal from RO feed water on mineral scaling has not been directly quantified. Accordingly, the present study presents an experimental field investigation that demonstrates the impact of the presence and removal of suspended matter from RO feed water of high mineral scaling propensity on RO membrane mineral scaling. Two different feedwater pretreatment sequences were explored that included a train of a sand filter, hydrocyclone, strainers, and ultrafiltration module. The field study was carried out for agricultural drainage water of high scaling propensity for calcite and gypsum [26]. Pretreatment with and without ultrafiltration was assessed whereby downstream RO fouling/mineral scaling, without antiscalant dosing, was followed employing a diagnostic RO membrane scale monitoring system [27]. Real-time imaging of the evolution of RO membrane scaling and permeate flux data were utilized to assess the impact of different modes of feed filtration on the ensuing level of RO membrane mineral scaling. In addition, the rate of growth of individual mineral crystals was quantified in terms of their size, surface number density, and scaled area. The above approach provided quantitative data that then serve to demonstrate the significance of fine particle removal from RO feed water as an important pretreatment step to reduce RO membrane mineral scaling.

2. Materials and Methods

2.1. Field Brackish Water

Ultrafiltration (UF) removal of suspended matter from RO feed water was investigated to assess its impact on RO membrane mineral scaling in the desalination of brackish agricultural drainage water (AD water) of high mineral scaling propensity. The study was conducted at the Panoche Drainage District (PPD), San Joaquin Valley (SJV), California, USA, with AD water source water (Table 1). The source water salinity was 14,160 mg/L total dissolved solids (TDS). The saturation levels with respect to gypsum and calcite for the above water source were quantified in terms of the saturation index, defined as S I x = I A P / K s p , x where IAP is the ion activity product and Ksp,x is the solubility product for mineral salt x (e.g., where x = c is CaCO3 (as calcite) and x = g is gypsum). The above source water was supersaturated with respect calcium carbonate with SIcalcite ~ 7, and near saturation with respect to gypsum with SIgypsum = 0.97. At the membrane surface, the gypsum and calcite saturation indices were assessed based on the estimated solute concentrations at the membrane surface, i.e., Cm = CP × Cb, where Cb is the bulk solute concentration, and CP is the concentration polarization modulus estimated as detailed in [28].

2.2. Source Water Pretreatment

The significance of adding UF filtration to the RO feed water pretreatment train in reducing RO membrane mineral scaling was evaluated utilizing an AD water pretreatment with a configurable pretreatment train housed in a 151 m3/day capacity mobile RO plant (consisting of 4 inch × 40 inch spiral-wound brackish water RO elements) housed in a 12.2 m ISO container (Figure 1). The plant was equipped with sensors, along with a data acquisition and control system, for monitoring various streams with respect to pressure flow rate, temperature, pH, electrical conductivity, and turbidity [26,29]. The plant’s raw AD water pretreatment train, prior to RO desalting, included the following two pretreatment options:
(a)
Media filtration using a standard silica sand filter (silver sand, US mesh #20, average sieve size 0.85 mm), a hydrocyclone (HC) separator (Lakos, Lindsay Corporation, Fresno, CA, USA), followed by an 80-mesh strainer for upstream failure to protect against large size debris. The media filtration served to reduce the burden of suspended particles prior to hydrocyclone.
(b)
Hydrocyclone centrifugal (HC) separator, followed by a 200 µm rotating self-cleaning disk microfilter (2” Brushaway Filter, Amiad, Mooresville, NC, USA) (Figure 2), and subsequent ultrafiltration (UF) modules consisting of two multi-bore inside-out hollow fiber ultrafiltration (UF) modules (Dizzer XL 0.9 MB 60 W; Inge GmbH, Greifenberg, Germany) arranged in parallel. UF pretreatment was assisted by inline coagulant dosing (using a metering pump, SMART Digital DDA; Grundfos, Bjerringbro, Denmark) of aluminum chlorohydrate (Qemipac 7580; Qemi International, Inc., Kingwood, TX, USA) at a dose of 0.8 mg/L. A rotating self-cleaning disk microfilter (200 μm) was used prior to UF in order to reduce the frequency of backwash cleaning of the UF unit. The UF modules were backwashed for 50 s every 60 min of operation. A strainer (80-mesh) was also installed after the UF for added protection of the RO elements to capture potential debris in the event of UF tubules breakage (Figure 2).
In the present work, pretreated raw brackish water from the RO plant pretreatment train was utilized to assess the impact of the above two different filtration train configurations on downstream RO membrane scaling. The potential impact of pretreatment on RO membrane scaling was monitored directly using the membrane monitoring system described in Section 2.3. The pretreated RO feed from both configurations (a) and (b) was conveyed via a slip stream to a 25-L feed tank that was continuously stirred (using Stirrer Type RZR1; Caframo Limited, Georgian Bluffs, Ontario, Canada). The pretreated feed water was then delivered, from the feed tank in which the water level was maintained, to the MMS unit via the MMS feed pump (Section 2.3). It is noted that although two different feed pretreatment configurations were available, the RO plant only utilized configuration (b) for routine desalting operations.

2.3. Membrane Monitoring System (MMS)

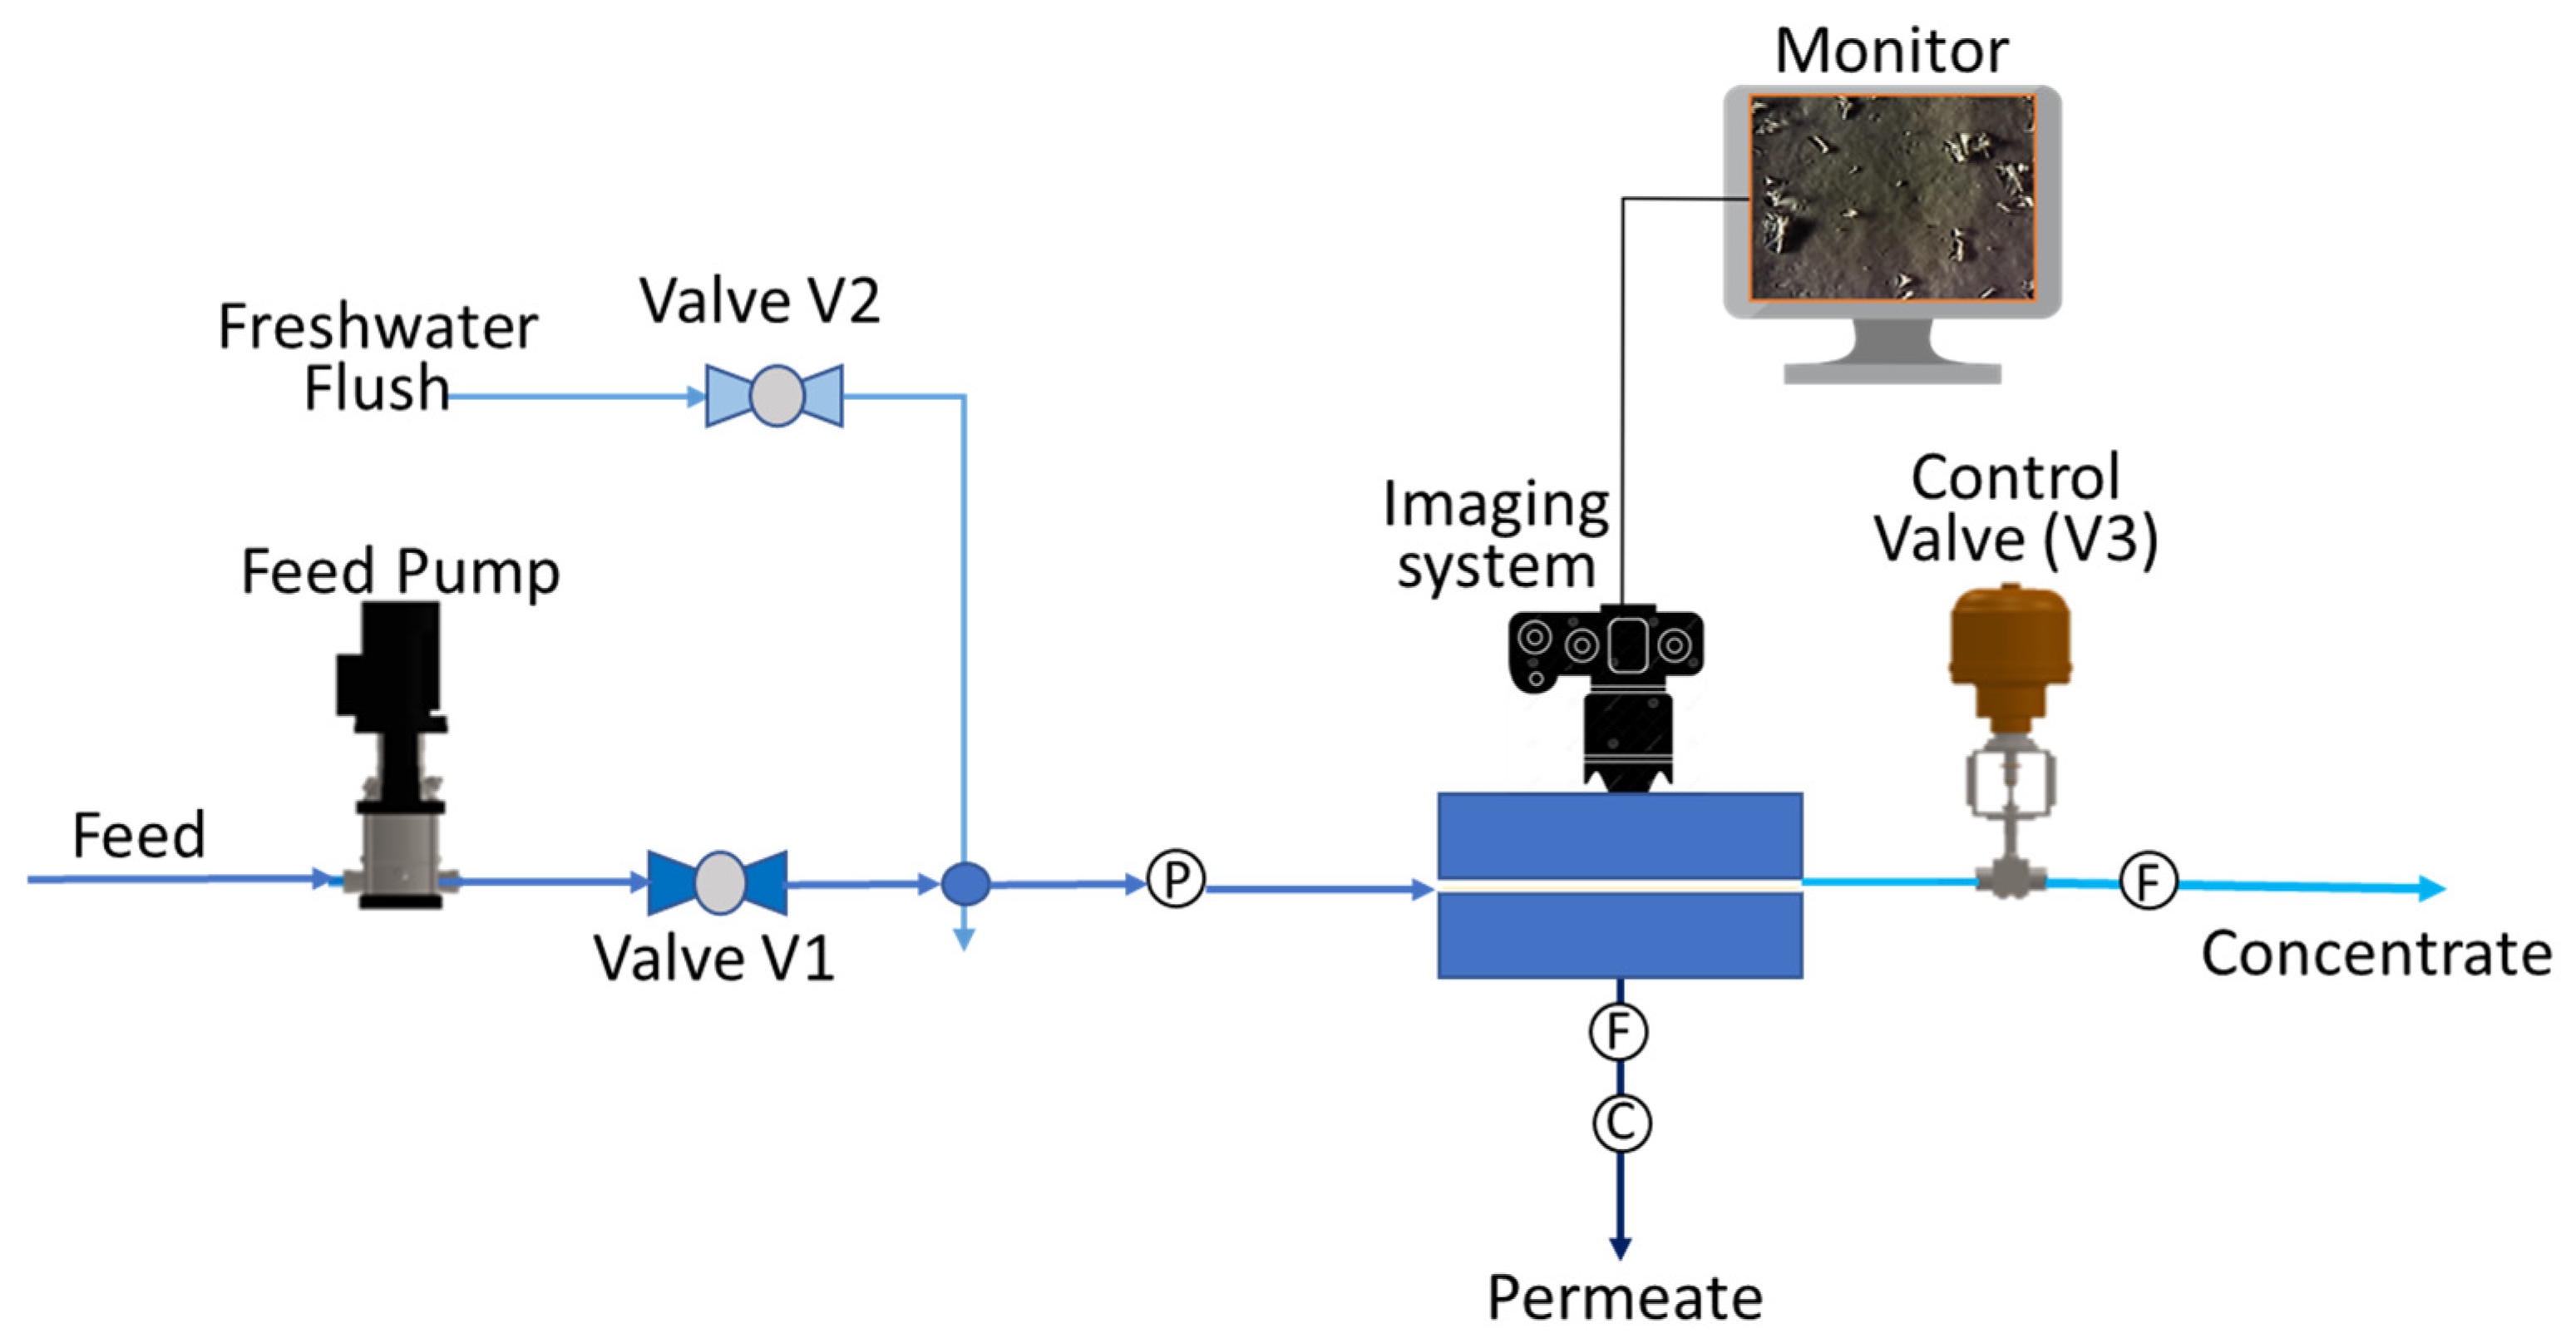
The impact of RO feed pretreatment on RO membrane mineral scaling was investigated via a membrane monitoring system (MMS) (Figure 3) described in previous studies [30,31,32,33,34,35,36,37,38]. Briefly, MMS consisted of a transparent plate-and-frame RO (PFRO) membrane cell having a rectangular RO channel with dimensions of 3.1 cm (width) × 8.8 cm (length) × 0.25 cm (height). The PFRO membrane channel was fitted with a Brackish water (BW) membrane coupon (UTC-70AC; Toray, Poway, CA, USA) having a manufacturer reported salt rejection of 97.5 ± 0.6% (determined for a 4000 ppm NaCl solution at a transmembrane pressure of 17.2 bar). The pretreated RO feed water was delivered to the MMS from a 25-L feed tank via a 3/4 hp (559 W) positive displacement pump of 0.10 m3/h capacity (Hydra-Cell model P100; Wanner Engineering, Inc., Minneapolis, MN, USA) controlled using a variable-frequency drive (VS1MX11-4D Microdrive; Baldor Electric Company, Fort Smith, AR, USA). Transmembrane pressure to MMS membrane cell was adjusted using a back-pressure regulator (US Paraplate, Auburn, CA, USA) while inlet pressure was monitored using a pressure transducer (model PX303-500G5V; Omega, Stamford, CT, USA) installed prior to the RO channel entrance. Permeate flow rate was monitored using a digital flow meter (model 1000; Fisher Scientific, Pittsburgh, PA, USA). Feed and permeate conductivities were monitored with an online conductivity meter (model WD-35607-30; Oakton Research, Vernon Hills, IL, USA), temperature was monitored using a 2350 model temperature sensor (Georg Fischer Signet, LLC, El Monte, CA, USA) while concentrate flow was adjusted using an electric actuator (MCJ-050AB; Hanbay Inc., Pointe-Claire, QC, Canada).
The MMS membrane surface was visualized utilizing the imaging system described in [26,31] which consisted of a compact digital microscope installed above the membrane cell with a specialized lighting arrangement [26]. Real-time high-resolution membrane surface images (2592 × 1944 pixels) were captured and transmitted to a data acquisition system for subsequent image analysis using specialized in-house software [31]. Image analysis relied on adaptive image segmentation to highlight and quantify surface changes due to mineral scaling. Images were first converted to grayscale and enhanced based on histogram equalization in order to increase image contrast [39,40], and subsequently aligned to enable accurate image comparison. Image background subtraction was then carried out to identify the evolution of surface changes over time. Subsequently, the evolution of membrane area covered by mineral scale and the surface number density of mineral crystals (# crystals/mm2) were determined.

2.4. Evaluation of Feed Pretreatment on Downstream RO Membrane Scaling

The impact of feed pretreatment on RO membrane mineral scaling was quantified using the MMS system (Section 2.3) operated in a single-pass mode (Figure 3). The raw AD water was first treated via one of two configurations (Section 2.2) and then delivered to the MMS, without antiscalant dosing, as described in Section 2.2 and Section 2.3. It is noted that calcite scaling of the RO membrane was not expected as it has been shown that calcium sulfate inhibits calcite scaling due to antagonistic effects for the present source water composition (with respect to calcium, sulfate and carbonate ions) and for the pH range of 7.4–8 [41].
The transmembrane pressure was set so as to control the permeate flux and thus the solutes concentrations at the membrane surface [15,42,43,44]. The CP modulus, at the location of the membrane surface monitored region, was defined as CP = Cm/Cb, where Cm and Cb are the solute concentrations at the membrane surface and in the channel bulk region, respectively. CP was determined based on the estimation procedure for the present PFRO cell geometry as described in previous work [15,44]. In the present study, the MMS was operated at an initial permeate flux of 33 L/m2h and crossflow velocity of 4.5 cm/s (in the MMS RO channel). At these operating conditions, the CP modulus at the MMS membrane monitored location was 1.55, as estimated following the approach reported in [33] for the current RO channel geometry. Accordingly, the initial supersaturation levels for gypsum (the primary membrane scalant) at the membrane surface was quantified by its saturation index of SIg,m ~ 2. The permeate flux was monitored and recorded during the MMS tests and membrane surface images were captured and analyzed as described in Section 2.3.
It is noted that although the recovery in the MMS is small (<1%), the equivalent recovery in an actual RO plant can be estimated for the same supersaturation level (at the tail elements of the target plant having the same membrane type as in the MMS). For example, the equivalent product water recovery for spiral-wound UTC-70AC elements (4 inch × 40 inch; Toray, Poway, CA, USA) can be estimated by setting the tail element membrane surface concentration to be equivalent to that in the MMS tests. Accordingly, for the spiral-wound elements in the plant the equivalent recovery (i.e., Y = Qp/Qf, where Qp and Qf are the feed and permeate flow rates, respectively) can be estimated based on the concentration polarization modulus expression provided in [26], i.e., CPplant = Cm/Cb = exp [0.7Y]; it is noted that given the negligibly low permeate recovery in the MMS, it is reasonable to set Cb = Cf. Given the above, the equivalent plant permeate recovery for the MMS operating conditions was estimated to be ~63%.

2.5. SEM/EDS Analysis of Scaled RO Membrane

Membrane samples were analyzed using scanning electron microscopy (JSM-6700F Field Emission SEM; JEOL, Ltd., Tokyo, Japan) and energy dispersive X-ray spectroscopy (EDS) (EDAX Genesis Spectrum; EDAX Inc., Mahwah, NJ, USA). Prior to analysis, membrane samples were pre-coated with a gold film (~10 nm thickness) using a vacuum sputtering system (Hummer 6.2 Sputtering System; Anatech, Hayward, CA, USA). SEM imaging was conducted with electron beam voltages ranging from 2.5 keV to 10 keV at an average working distance of 8 mm.

3. Results

Impact of Feed Prefiltration Treatment on RO Permeate Flux and Surface Fouling/Scaling

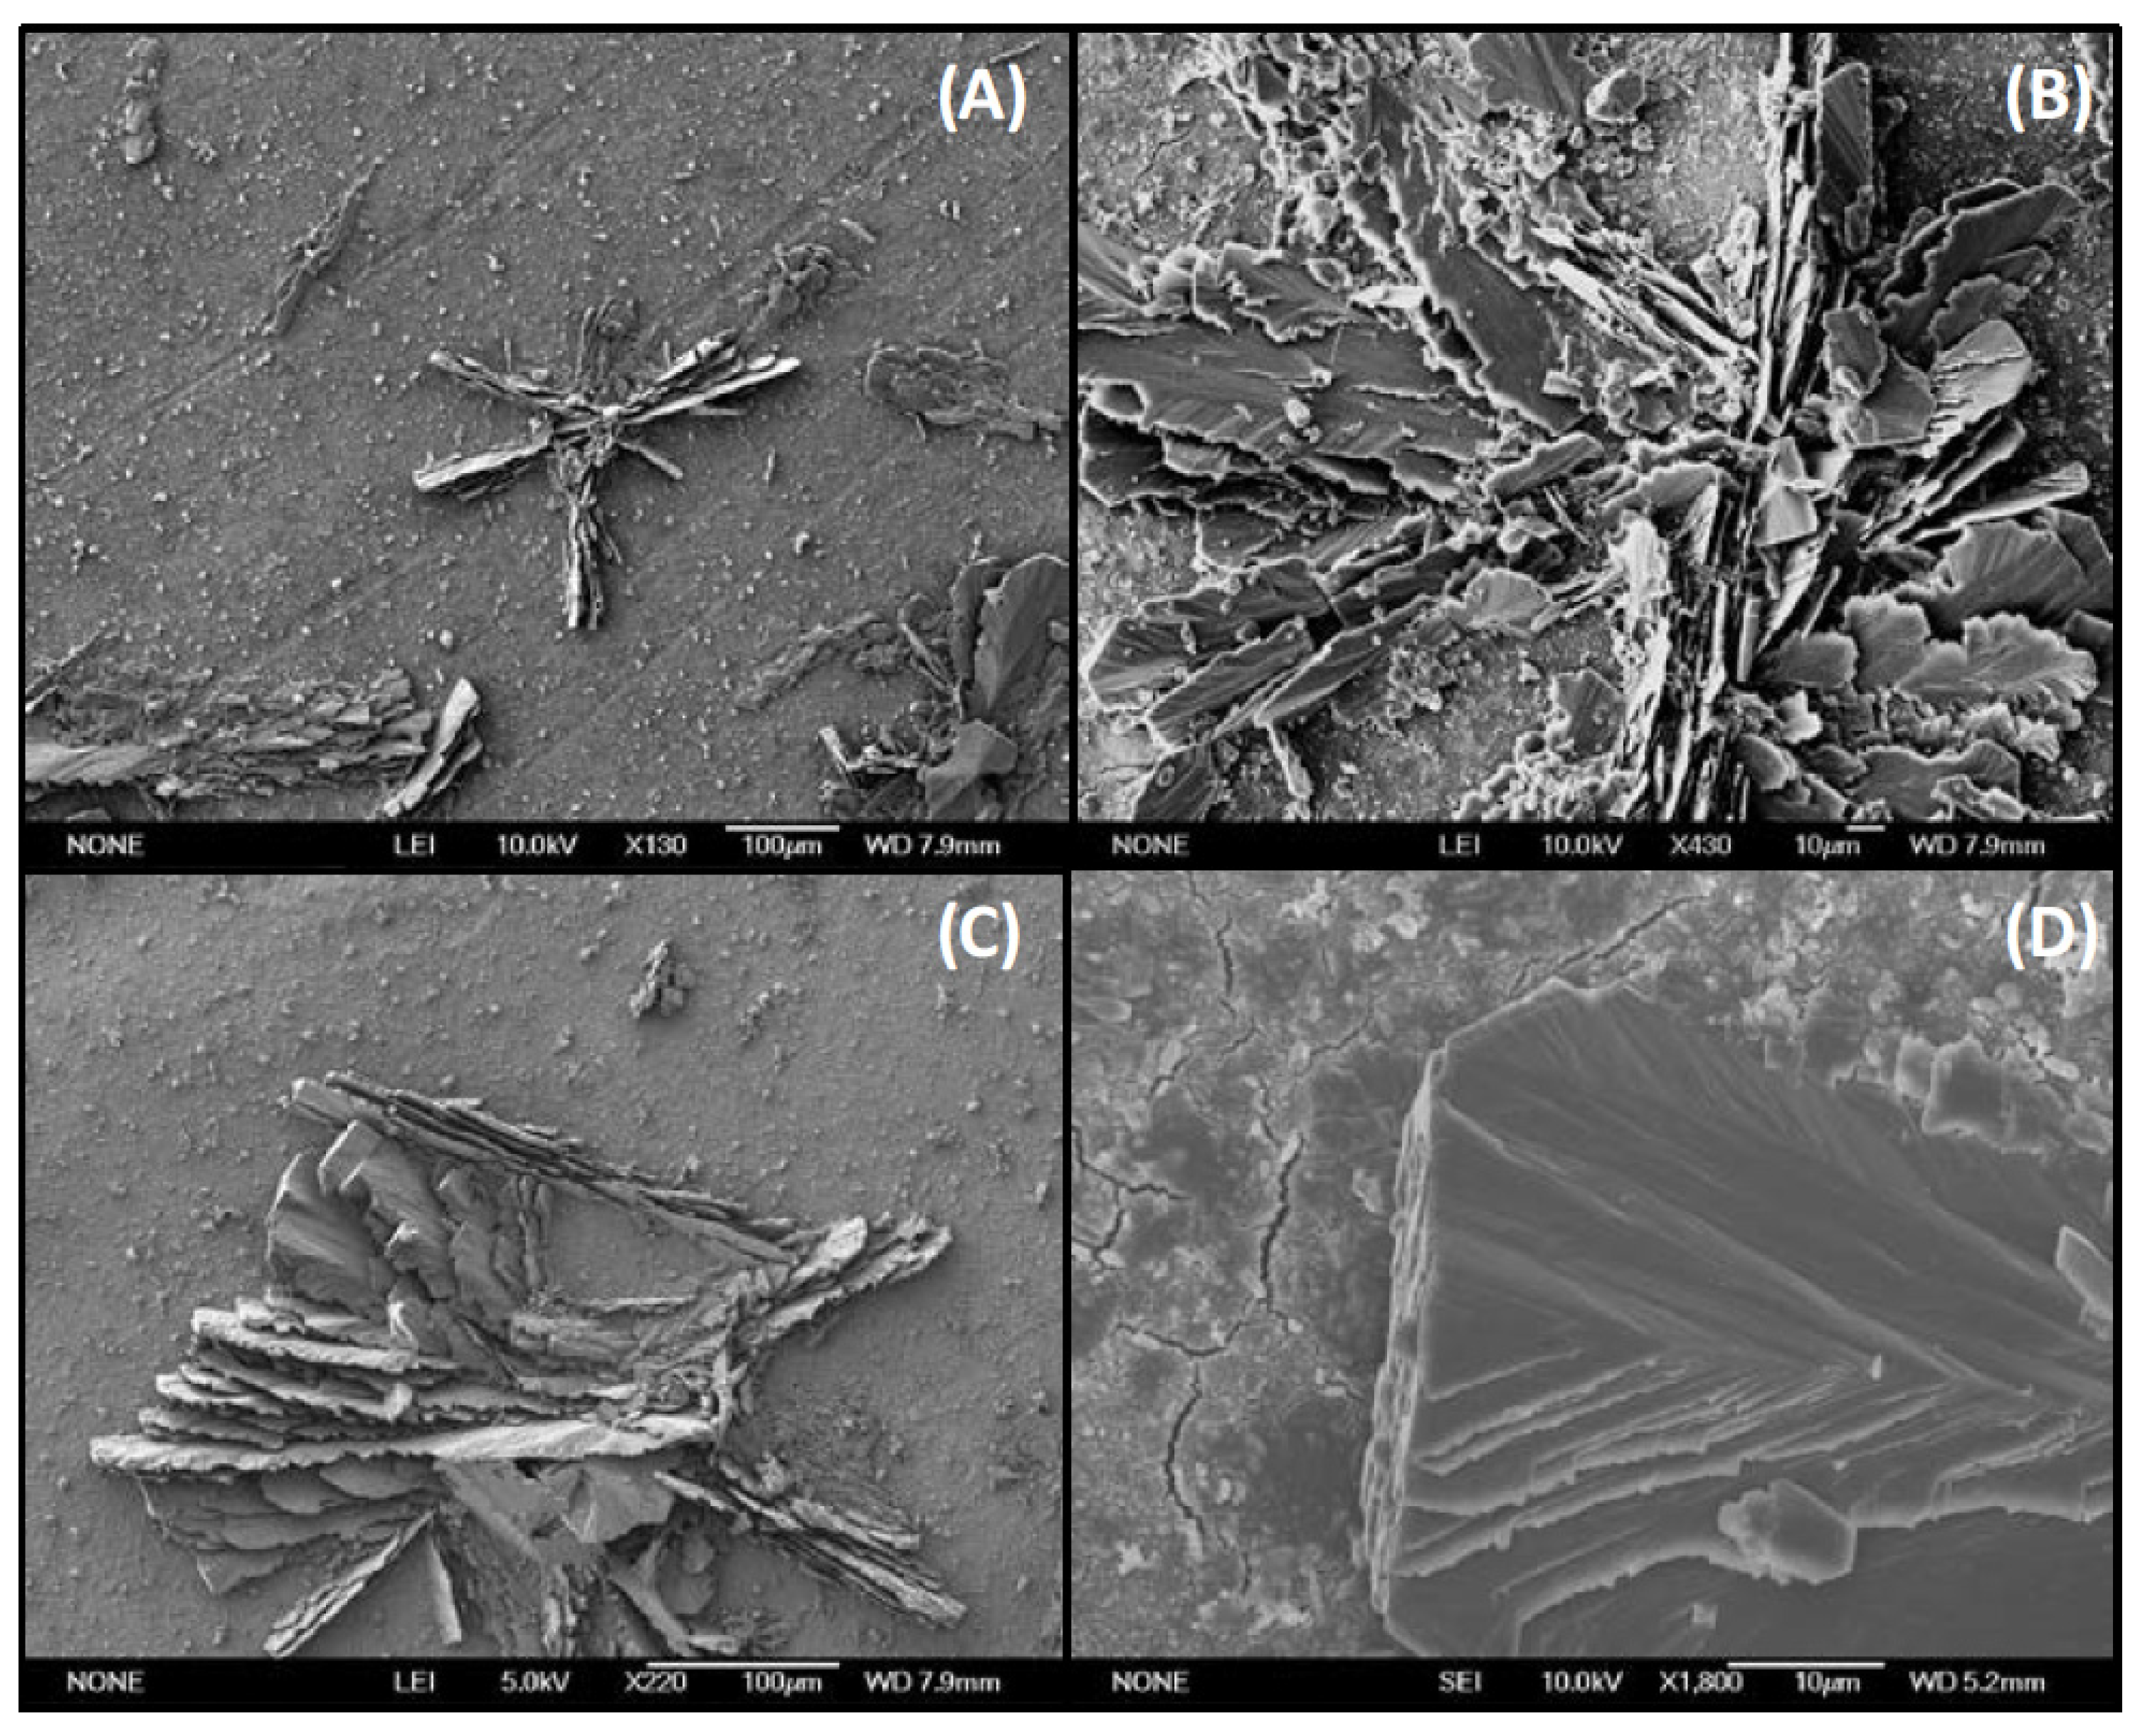
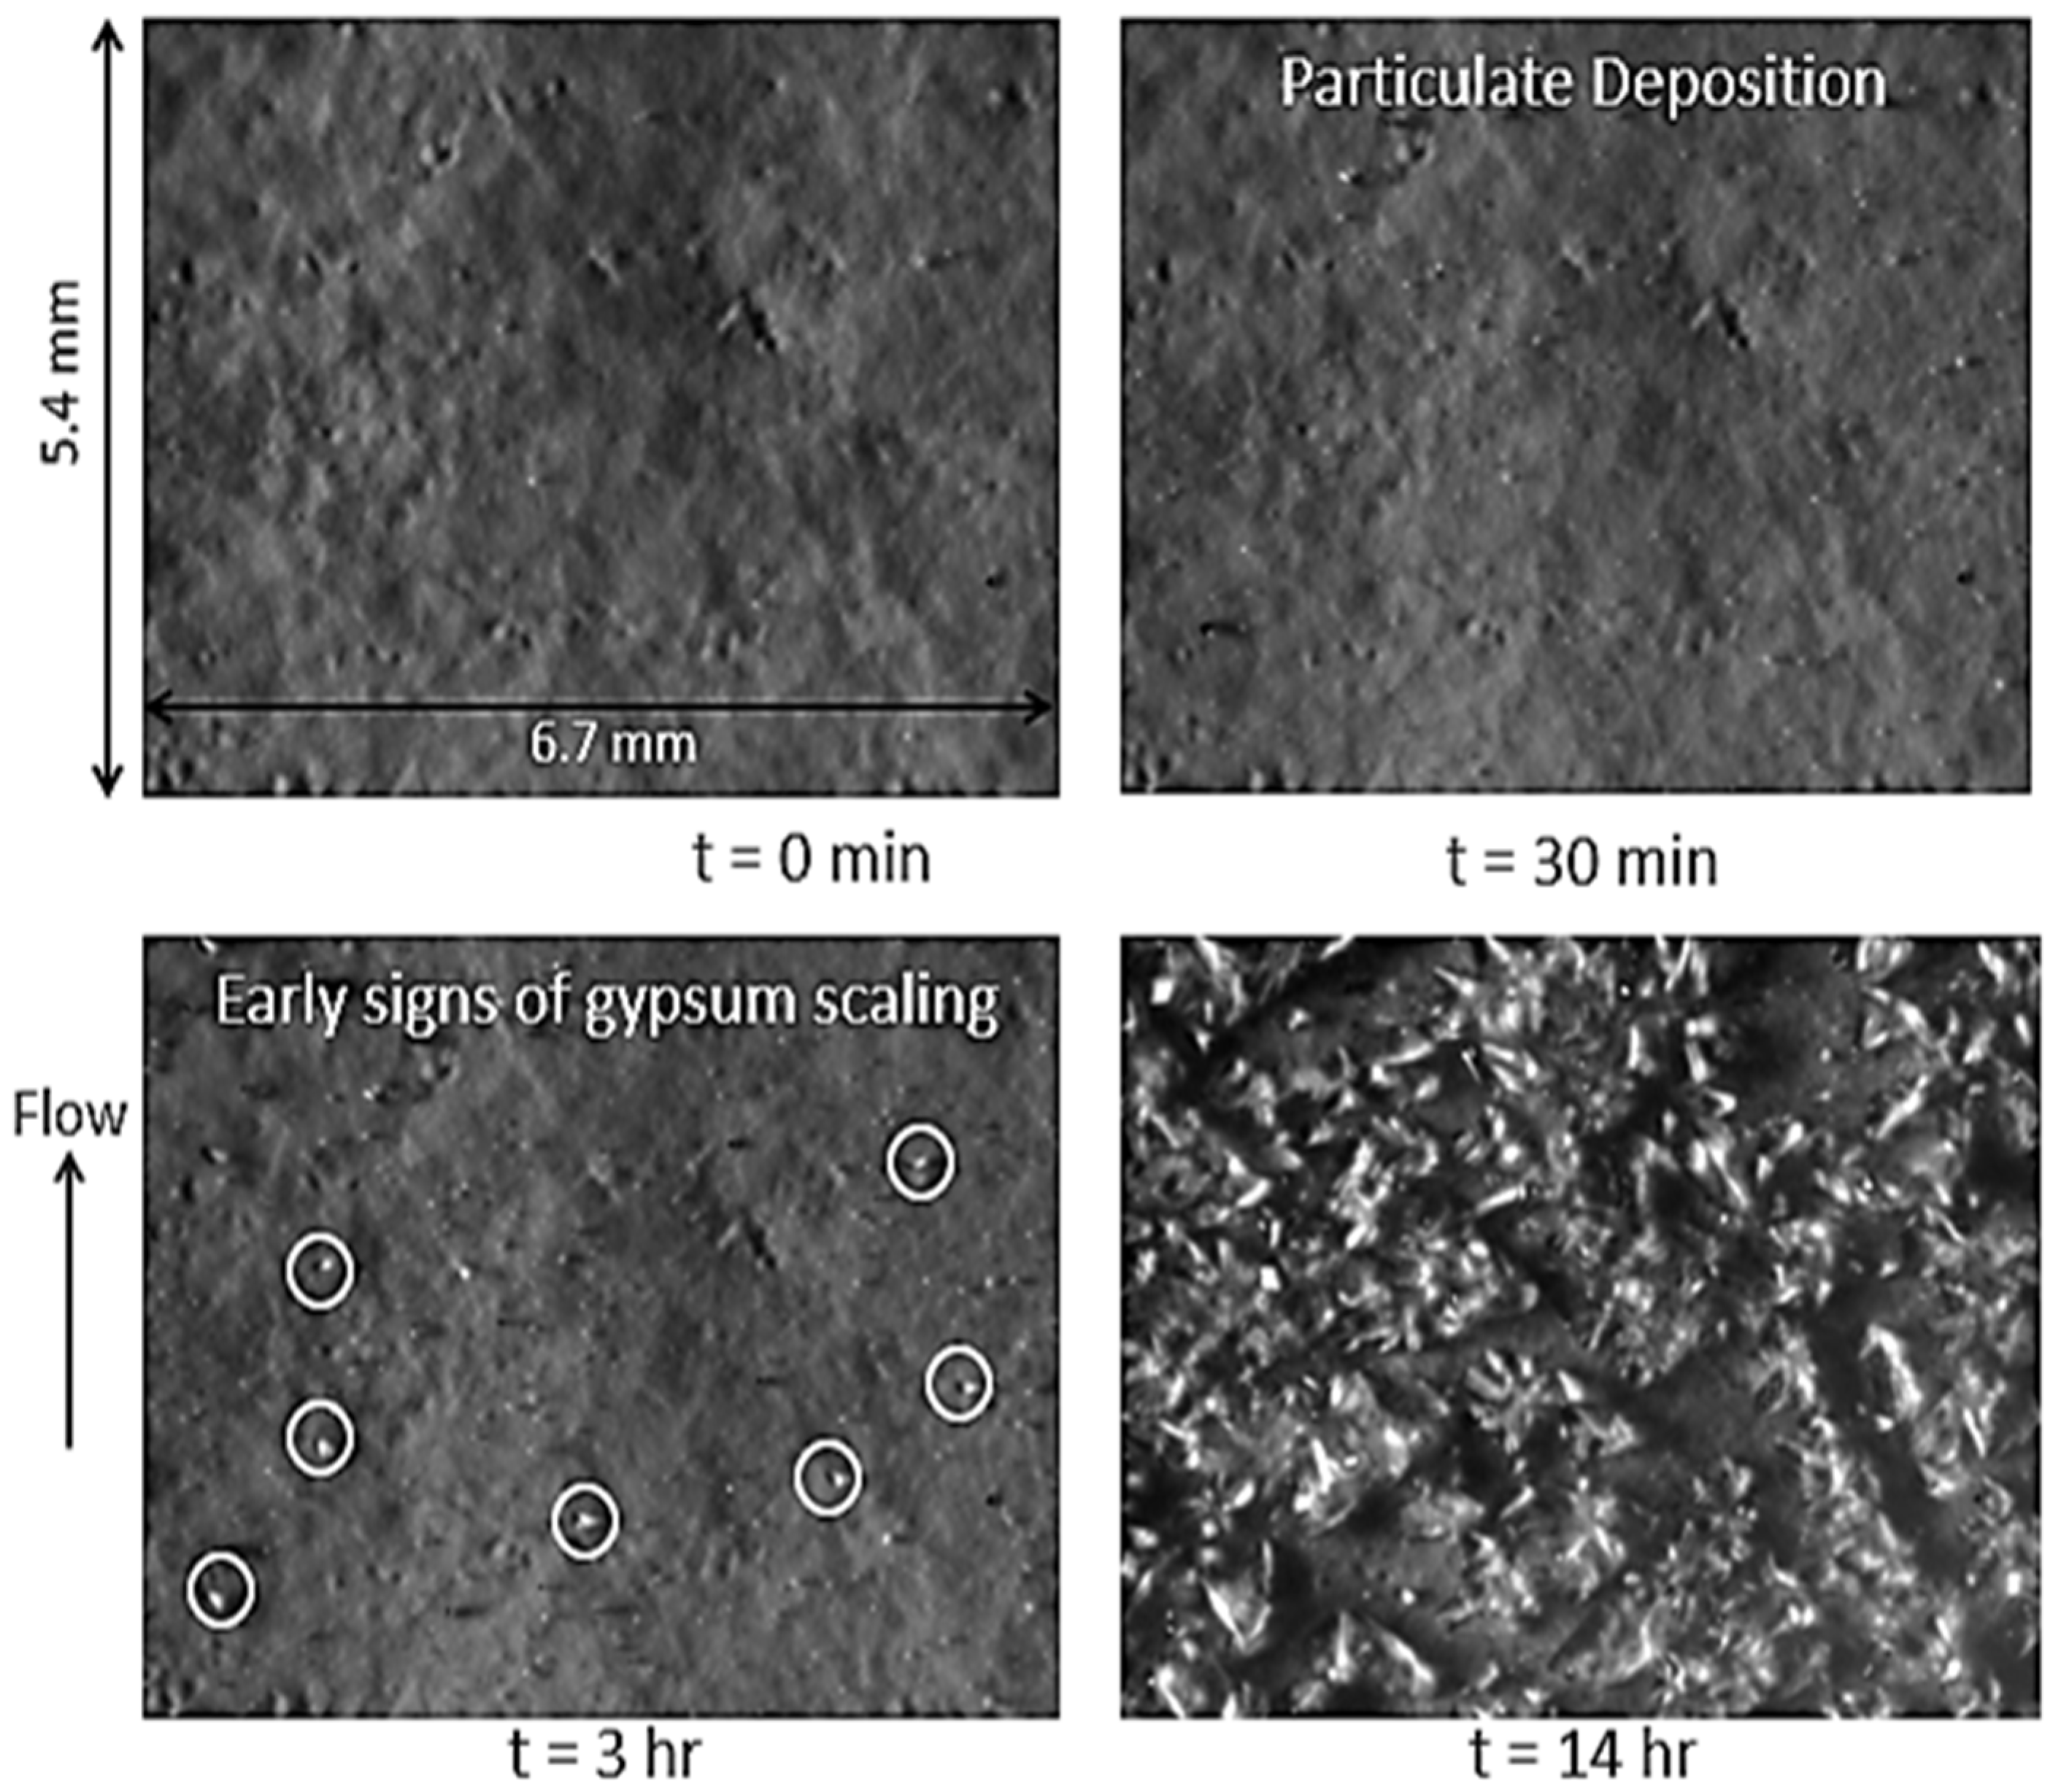
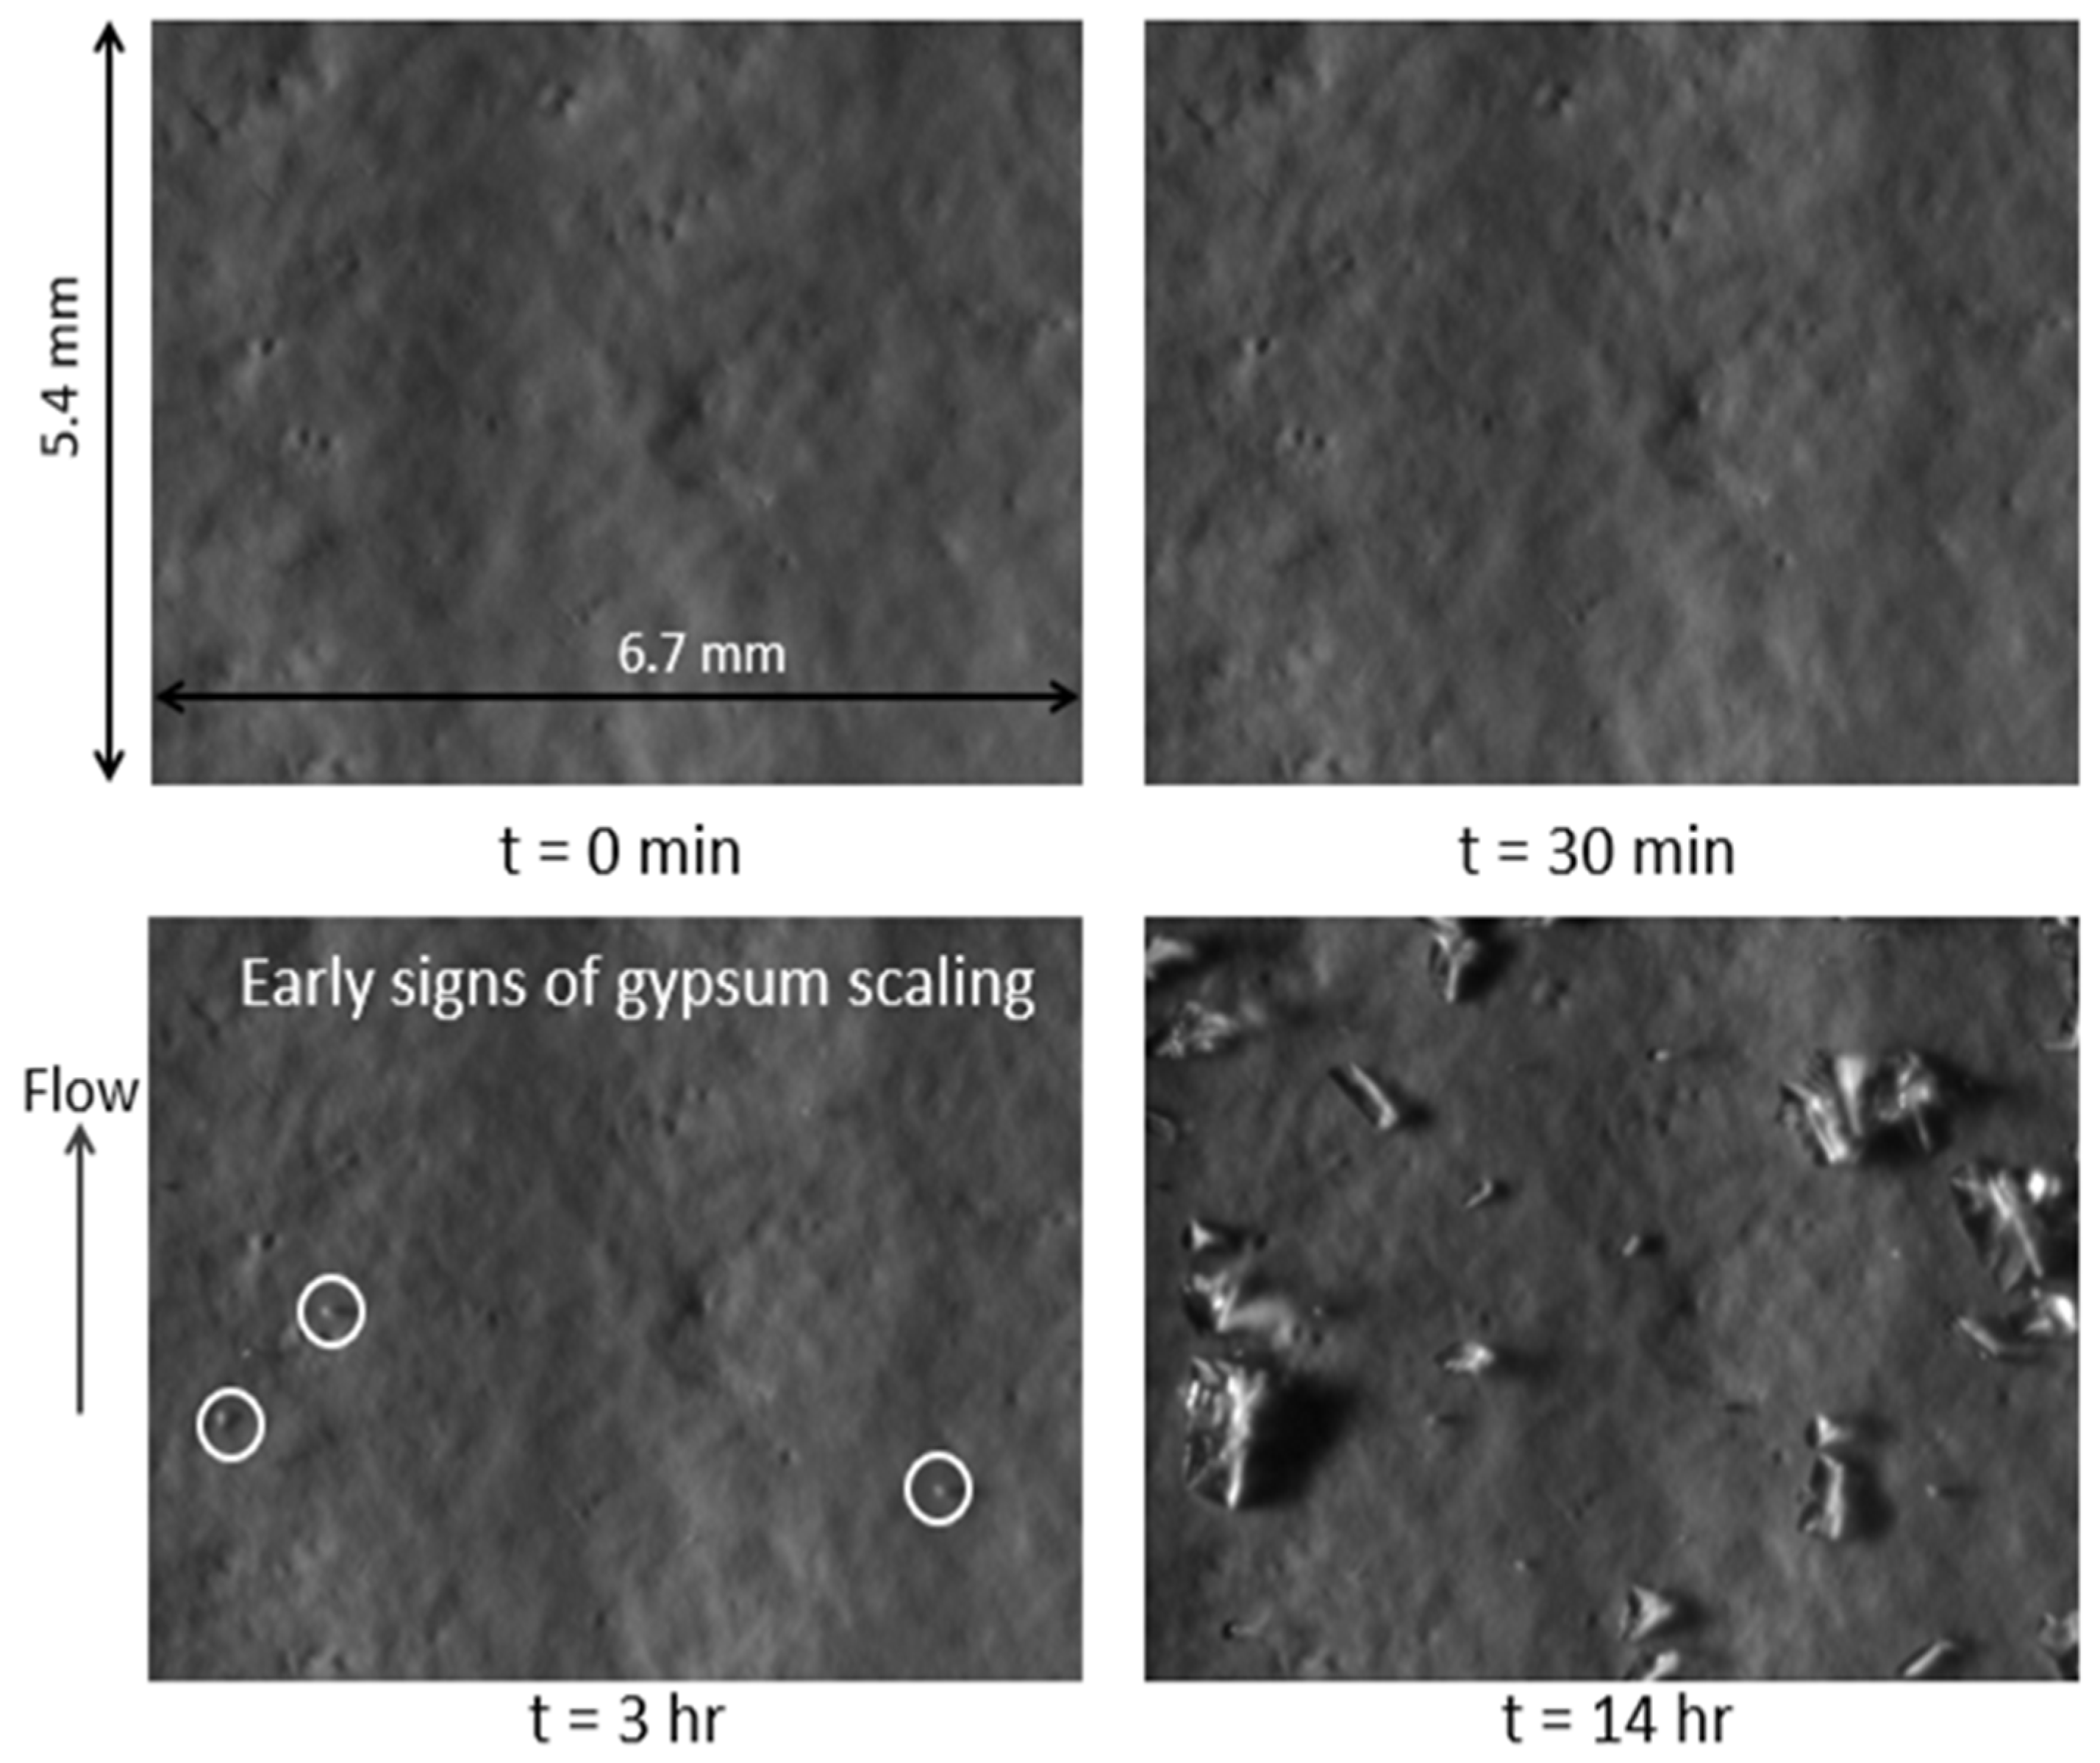
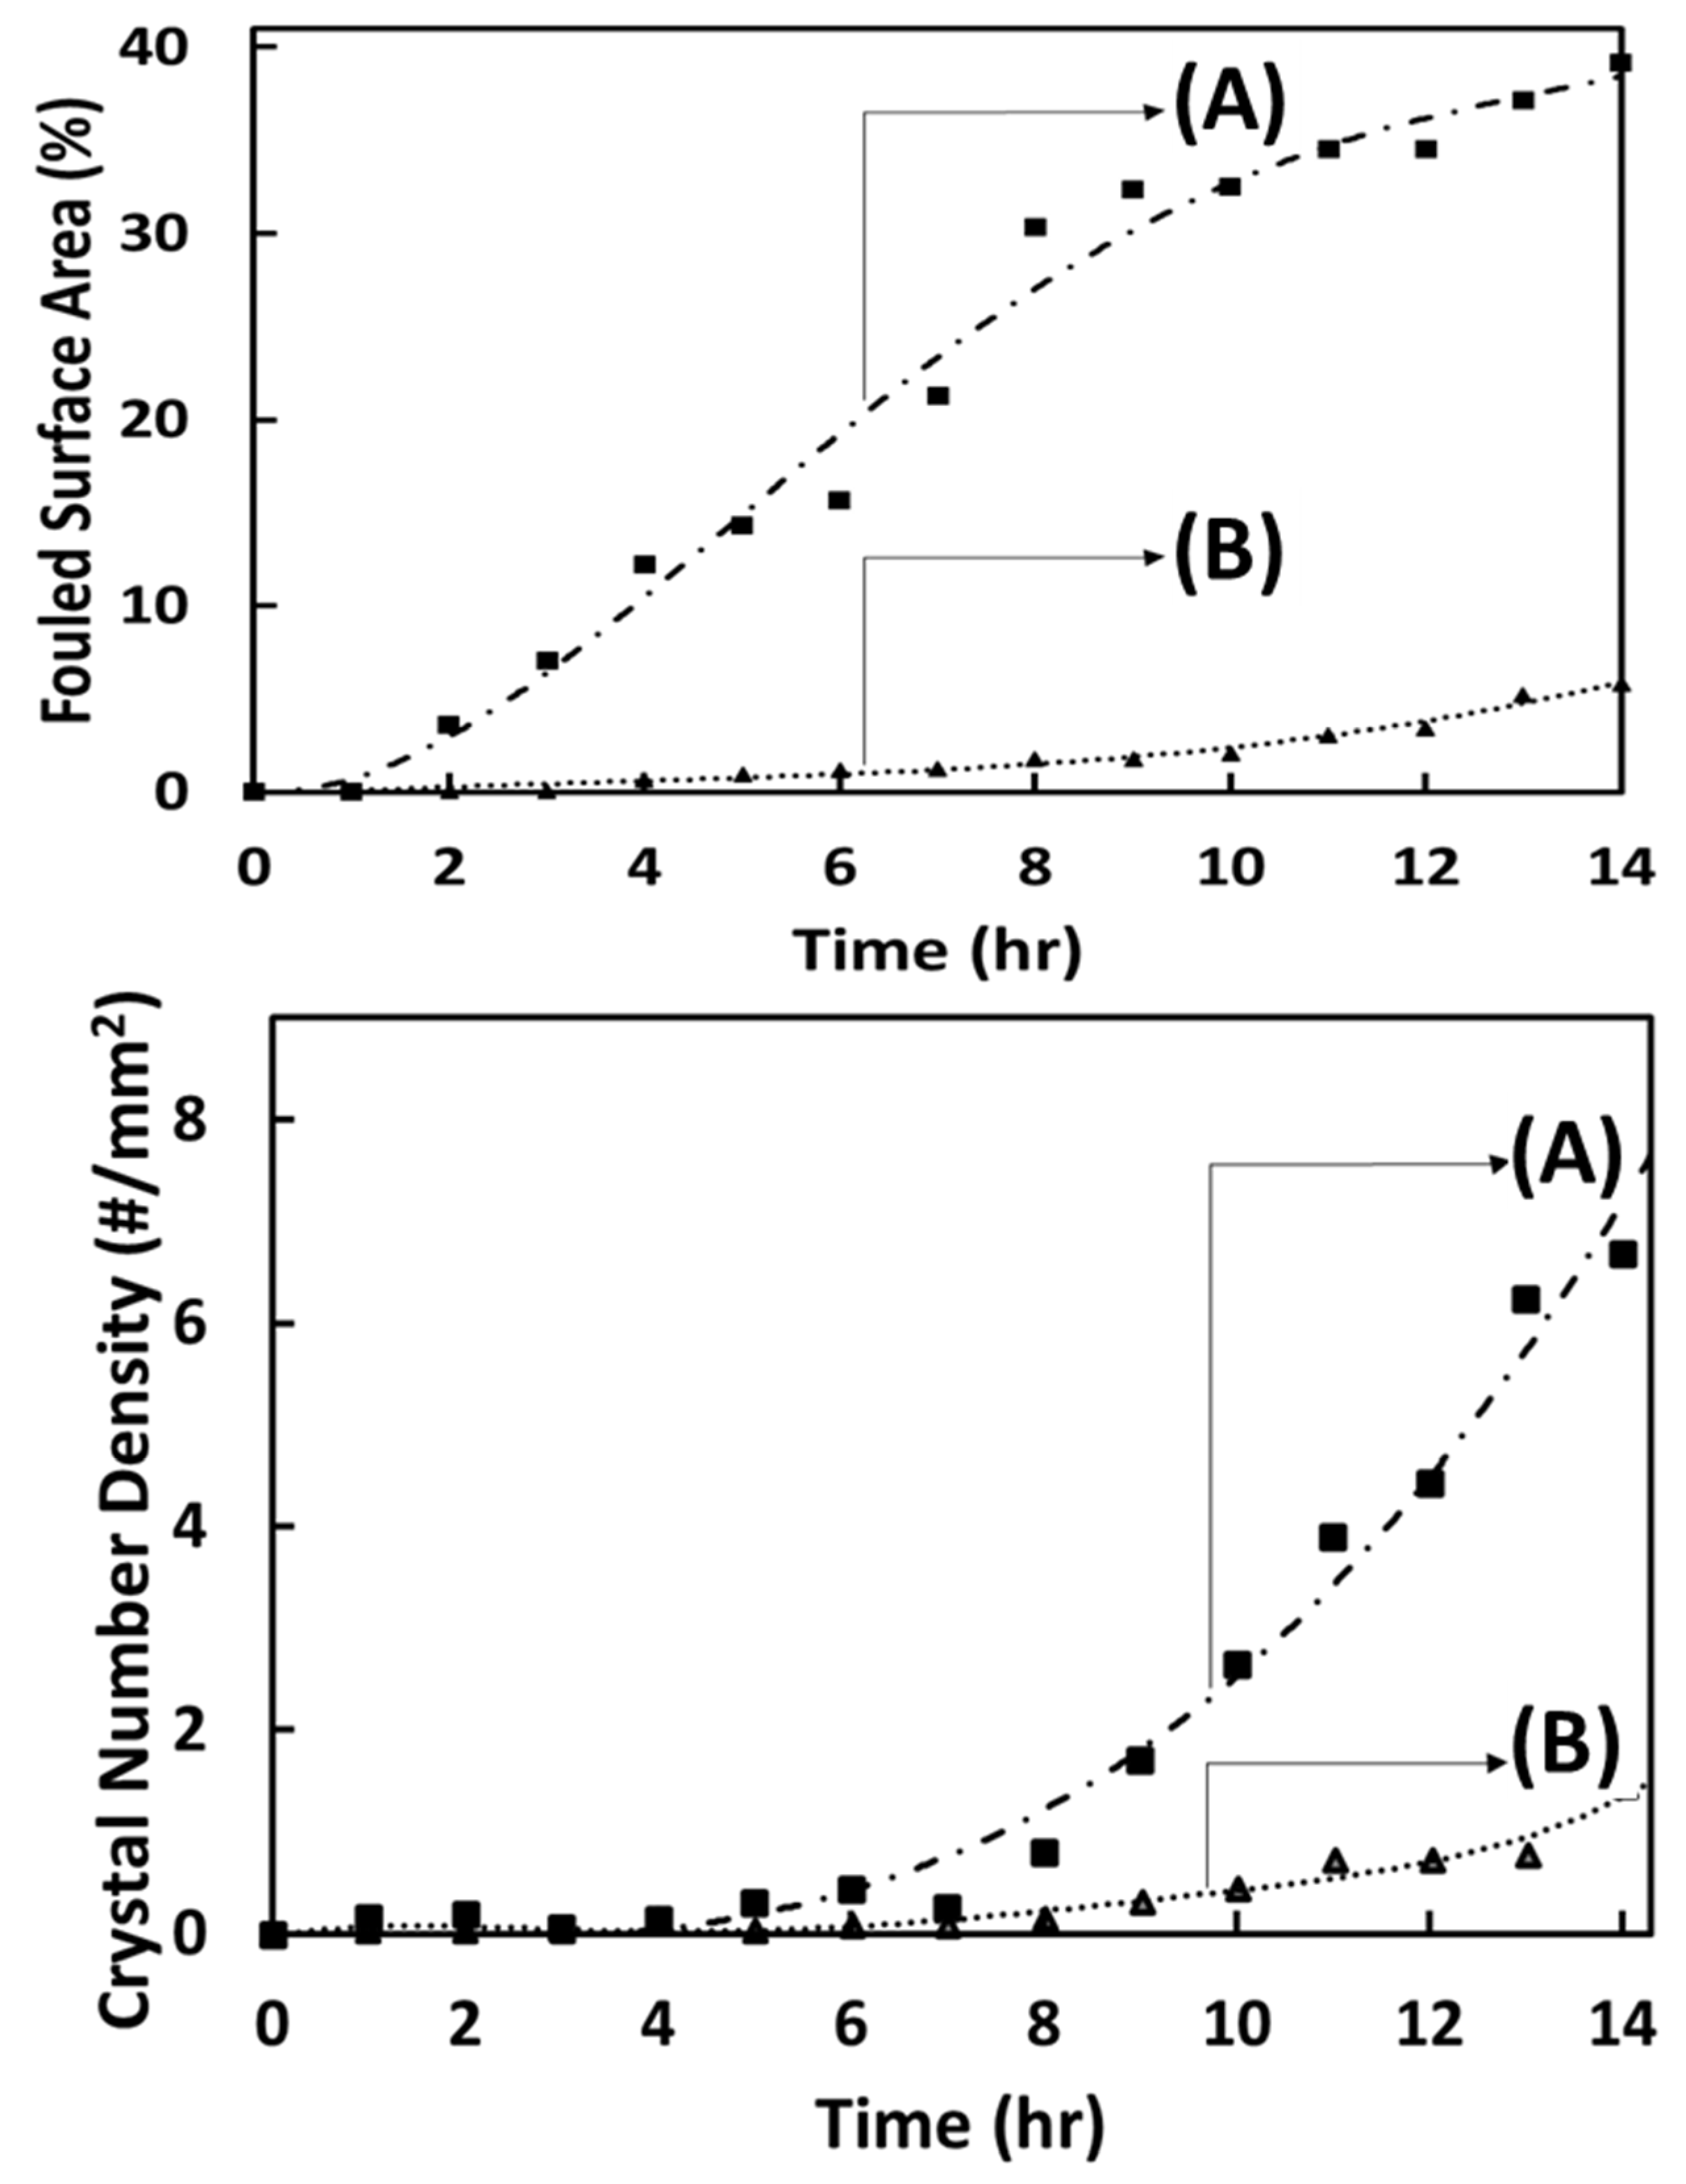
Direct membrane surface monitoring in the RO membrane monitoring system (MMS) served to evaluate the impact of filtration pretreatment of AD water feed on downstream RO membrane mineral scaling. Two different AD raw water feed pretreatment trains were evaluated (Section 2.2; Figure 2) via direct observation of RO membrane fouling/scaling in the MMS unit (Figure 3). MMS RO tests revealed a 32% flux decline for RO feed pretreatment that utilized UF (configuration B) relative to a 56% decline for the test without UF (configuration A) (Figure 4). The MMS RO test using the source water pretreated without UF (configuration A, Figure 2) revealed deposited particulate matter (or initial mineral scale crystals) within the first 30 min of MMS RO desalting (Figure 5). Significant fouling was observed within 2 h with ~40% of the membrane area fouled by the end of the 14-h MMS desalting test. EDS analysis of the membrane surface, along with high resolution SEM imaging, indicated the presence of calcium and sulfur, suggesting the dominant presence of gypsum scale (Figure A1 and Figure A2, Appendix A). Indeed, the presence of surface crystals of the common full and partial gypsum rosette configurations was evident after 14 h of MMS operation. In contrast, in the MMS test using UF filtered raw feed water, surface images revealed particulate deposition and/or small crystals after a longer period of operation (3 h) with scale coverage of ~5% by 14 h (Figure 6).
The above RO desalting tests demonstrate that the efficacy of raw feed water filtration can have a significant impact on the RO membrane minerals scaling even for water of relatively low turbidity. Previous studies have reported that particles in the micron and possibly sub-micron range can promote heterogeneous nucleation in either the bulk of the RO feed channel or once deposited onto the membrane surface [43]. In the present study, the RO feed water turbidity was reduced via pretreatment without and with UF from 1 NTU to ~0.5 NTU and to < ˜ 0.1   NTU , respectively; both are below the industry recommended maximum level of below 1.0 NTU of RO feed water [45,46]. One should expect that UF feed pretreatment should lead to a lower level of particulate deposition onto the RO membrane and thus lower number density of growing mineral crystals, and hence lower surface scale coverage. Indeed, as shown in Figure 7, after 14 h of operation, UF feed filtration reduced the crystal number density by a factor of approximately four and the surface scale coverage by a factor of approximately eight relative to the case of feed filtration with media sand filtration and HC (i.e., pretreatment configuration A, Figure 2). It is noted that the UF modules were backwashed periodically (Section 2.2) following the recommended approach for the modules utilized in the present study [38,47,48,49] and operated for a period of six months prior to chemical cleaning in place.
Analysis of the growth rate of mineral crystals (averaged over five crystals), resembling mostly gypsum rosettes, demonstrated a crystal growth rate (in terms of the effective crystal diameter and after 6 h–post the observed induction period) of ~7 × 10⁻² mm/h. This crystal growth rate is consistent with those reported for gypsum crystals in previous RO scaling studies for the condition of SIg,m = 2 [34,41]. It is emphasized that the above crystal growth rate was similar for RO desalting of feed delivered from the two different feed pretreatment configurations (Figure 2). This behavior indicates that the difference in membrane surface scale coverage was primarily due to the higher crystal number density on the RO membrane receiving UF-treated treating water (configuration B, Figure 2).
In closure, the current study revealed that the presence of suspended particles in the RO feed water, even at levels well below the acceptable level for RO feed [11,26,29], can exacerbate membrane mineral scaling, particularly when desalting water of high mineral scaling propensity. The above assertion is supported by previous studies on the increased rate of heterogeneous crystallization from supersaturated solutions of sparingly soluble mineral salts due to the presence of suspended matter [3,15,20,22,24].

4. Conclusions

The impact particulate matter removal from source water of high mineral scaling propensity on downstream RO membrane scaling was evaluated for two different feed pretreatment configurations. The primary pretreatment units in the first configuration (A) included a sequence of media sand filtration, followed by a hydrocyclone (HC). The second pretreatment configuration (B) consisted of a hydrocyclone followed by 200 µm microfilter and a UF module. RO membrane scaling tests for source water treated with the above RO feed pretreatment configurations were conducted via direct RO membrane monitoring system (MMS) providing real-time images of the RO membrane in a plate-and-frame RO (PFRO) unit. The study results demonstrated that RO feed water pretreatment via media filter and hydrocyclone was sufficiently adequate for reducing feed water turbidity to ~0.5 NTU (within the range recommended for RO desalination). However, the rate (and thus the severity) of membrane mineral scaling was significantly greater relative to RO desalting with feedwater that was also pretreated via UF resulting in feedwater turbidity of < ˜ 0.1 NTU. Particulate matter (even when feed turbidity is within the acceptable level for RO desalination) in the pretreated source water can promote heterogeneous nucleation and thus exacerbate RO membrane mineral scaling and may require a higher antiscalant dose to suppress mineral scaling. Hence, the current results suggest that removal of colloidal particles from source water of high mineral scaling propensity should strive to achieve RO feedwater turbidity that is well below 0.5 NTU which can be achieved via the addition of UF pretreatment.

Author Contributions

Conceptualization, Y.C.; Methodology, J.T., Y.C., B.M.K.; Supervision, Y.C.; Resources, Y.C.; Writing, J.T., Y.A.J.; Funding acquisition, Y.C.; Administration, Y.C.; Review and Editing, Y.C., Y.A.J., J.T.; Analysis, J.T., B.M.K., Y.A.J.; Visualization, J.T. All authors have read and agreed to the published version of the manuscript.

Funding

This research was funded by the United States Bureau of Reclamation (Grant R11AC81533) and the California Department of Water Resources (Agreement number 4600011630).

Data Availability Statement

The data presented in this study are available upon request from the corresponding author.

Acknowledgments

The authors acknowledge Toray Membrane USA Inc. for providing membrane samples.

Conflicts of Interest

The authors declare no conflict of interest.

Appendix A

Figure A1. EDS spectra of MMS membrane fouled/scaled after 14 h of filtration with raw water treatment (Figure 4) that includes UF (configuration B, Figure 2). The presence of calcium and sulfur are consistent with the presence of calcium sulfate as also suggested by the gypsum (calcium sulfate dihydrate) rosette-type crystal structures. The presence of calcium and oxygen are consistent with the expected presence of calcite given the supersaturation of the raw feedwater with respect to calcite (Table 1). Note: Au peak is present since the membrane sample was coated with gold (Au) prior to EDS analysis.
Water 15 00847 g0a1
Figure A2. SEM images of mineral scale crystals formed on the RO membrane in the membrane monitoring system (MMS) during RO desalination of AD water showing different mineral crystal morphologies. Mineral crystals resembling “flattened” gypsum rosettes (AC), and high mag. image of a “flattened” crystal rod or arm (D).
Water 15 00847 g0a2

References

  1. Bystrianský, M.; Nir, O.; Šír, M.; Honzajková, Z.; Vurm, R.; Hrychová, P.; Bervic, A.; van der Bruggen, B. The presence of ferric iron promotes calcium sulphate scaling in reverse osmosis processes. Desalination 2016, 393, 115–119. [Google Scholar] [CrossRef]
  2. Cao, T.; Rolf, J.; Wang, Z.; Violet, C.; Elimelech, M. Distinct impacts of natural organic matter and colloidal particles on gypsum crystallization. Water Res. 2022, 218, 118500. [Google Scholar] [CrossRef]
  3. Muniz, G.L.; Camargo, A.P.; Signorelli, F.; Bertran, C.A.; Pereira, D.J.S.; Frizzone, J.A. Influence of suspended solid particles on calcium carbonate fouling in dripper labyrinths. Agric. Water Manag. 2022, 273, 107890. [Google Scholar] [CrossRef]
  4. Dai, Z.; Zhao, Y.; Paudyal, S.; Wang, X.; Dai, C.; Ko, S.; Li, W.; Kan, A.T.; Tomson, M.B. Gypsum scale formation and inhibition kinetics with implications in membrane system. Water Res. 2022, 225, 119166. [Google Scholar] [CrossRef]
  5. Liu, Q.; Xu, G.-R.; Das, R. Inorganic scaling in reverse osmosis (RO) desalination: Mechanisms, monitoring, and inhibition strategies. Desalination 2019, 468, 114065. [Google Scholar] [CrossRef]
  6. Spinthaki, A.; Kamaratou, M.; Skordalou, G.; Petratos, G.; Tramaux, A.; David, G.; Demadis, K.D. A universal scale inhibitor: A dual inhibition/dispersion performance evaluation under difficult brine stresses. Geothermics 2021, 89, 101972. [Google Scholar] [CrossRef]
  7. Tong, T.; Wallace, A.F.; Zhao, S.; Wang, Z. Mineral scaling in membrane desalination: Mechanisms, mitigation strategies, and feasibility of scaling-resistant membranes. J. Membr. Sci. 2019, 579, 52–69. [Google Scholar] [CrossRef]
  8. Melliti, E.; Van der Bruggen, B.; Elfil, H. Combined iron oxides and gypsum fouling of reverse osmosis membranes during desalination process. J. Membr. Sci. 2022, 653, 120472. [Google Scholar] [CrossRef]
  9. Nthunya, L.N.; Bopape, M.F.; Mahlangu, O.T.; Mamba, B.B.; Van der Bruggen, B.; Quist-Jensen, C.A.; Richards, H. Fouling, performance and cost analysis of membrane-based water desalination technologies: A critical review. J. Environ. Manag. 2022, 301, 113922. [Google Scholar] [CrossRef]
  10. Matin, A.; Rahman, F.; Shafi, H.Z.; Zubair, S.M. Scaling of reverse osmosis membranes used in water desalination: Phenomena, impact, and control; future directions. Desalination 2019, 455, 135–157. [Google Scholar] [CrossRef]
  11. Choi, J.Y.; Kaufmann, F.; Rahardianto, A.; Cohen, Y. Desupersaturation of RO concentrate and gypsum removal via seeded precipitation in a fluidized bed crystallizer. Water Res. 2021, 190, 116766. [Google Scholar] [CrossRef]
  12. Kyllönen, H.; Grönroos, A.; Järvelä, E.; Heikkinen, J.; Tang, C. Experimental aspects of scaling control in membrane filtration of mine water. Mine Water Environ. 2017, 36, 193–198. [Google Scholar] [CrossRef]
  13. Mitrouli, S.; Karabelas, A.; Karanasiou, A.; Kostoglou, M. Incipient calcium carbonate scaling of desalination membranes in narrow channels with spacers—Experimental insights. J. Membr. Sci. 2013, 425, 48–57. [Google Scholar] [CrossRef]
  14. Shmulevsky, M.; Li, X.; Shemer, H.; Hasson, D.; Semiat, R. Analysis of the onset of calcium sulfate scaling on RO membranes. J. Membr. Sci. 2017, 524, 299–304. [Google Scholar] [CrossRef]
  15. Oshchepkov, M.; Popov, K.; Kovalenko, A.; Redchuk, A.; Dikareva, J.; Pochitalkina, I. Initial Stages of Gypsum Nucleation: The Role of “Nano/Microdust”. Minerals 2020, 10, 1083. [Google Scholar] [CrossRef]
  16. Dou, X.; Huang, H.; Han, Y. The role of diffusion in the nucleation of calcium carbonate. Chin. J. Chem. Eng. 2022, 43, 275–281. [Google Scholar] [CrossRef]
  17. Lapidot, T.; Matar, O.K.; Heng, J.Y. Calcium sulphate crystallisation in the presence of mesoporous silica particles: Experiments and population balance modelling. J. Chem. Eng. Sci. 2019, 202, 238–249. [Google Scholar] [CrossRef]
  18. Wang, F.; Davis, T.E.; Tarabara, V.V. Crystillization of calcium sulfate dihydrate in the presence of colloidal silica. Ind. Eng. Chem. Res. 2010, 49, 11344–11350. [Google Scholar] [CrossRef]
  19. Deng, M.; Liu, Q.; Xu, Z. Impact of gypsum supersaturated water on the uptake of copper and xanthate on sphalerite. Miner. Eng. 2013, 49, 165–171. [Google Scholar] [CrossRef]
  20. Trukhina, M.; Popov, K.; Oshchepkov, M.; Tkachenko, S.; Vorob’eva, A.; Rudakova, G. Impact of colloidal iron hydroxide and colloidal silicon dioxide on calcium sulfate crystallization in the presence of antiscalants. Int. J. Corros. Scale Inhib. 2022, 11, 1147–1171. [Google Scholar] [CrossRef]
  21. Choi, J.Y.; Lee, T.; Cheng, Y.; Cohen, Y. Observed crystallization induction time in seeded gypsum crystallization. Ind. Eng. Chem. Res. 2019, 58, 23359–23365. [Google Scholar] [CrossRef]
  22. McCool, B.C.; Rahardianto, A.; Faria, J.I.; Cohen, Y. Evaluation of chemically-enhanced seeded precipitation of RO concentrate for high recovery desalting of high salinity brackish water. Desalination 2013, 317, 116–126. [Google Scholar] [CrossRef]
  23. Yuan, K.; Starchenko, V.; Rampal, N.; Yang, F.; Yang, X.; Xiao, X.; Lee, W.-K.; Stack, A.G. Opposing Effects of Impurity Ion Sr2+ on the Heterogeneous Nucleation and Growth of Barite (BaSO4). Cryst. Growth Des. 2021, 21, 5828–5839. [Google Scholar] [CrossRef]
  24. Varnaseri, M.; Peyghambarzadeh, S.M. Interference effect of suspended particles on the crystallization fouling: A critical review. Heat Mass Transf. 2022, 1–26. [Google Scholar] [CrossRef]
  25. Jiang, S.; Li, Y.; Ladewig, B.P. A review of reverse osmosis membrane fouling and control strategies. Sci. Total Environ. 2017, 595, 567–583. [Google Scholar] [CrossRef]
  26. Thompson, J.; Rahardianto, A.; Kim, S.; Bilal, M.; Breckenridge, R.; Cohen, Y. Real-time direct detection of silica scaling on RO membranes. J. Membr. Sci. 2017, 528, 346–358. [Google Scholar] [CrossRef] [Green Version]
  27. AzadiAghdam, M.; Park, M.; Lopez-Prieto, I.J.; Achilli, A.; Snyder, S.A.; Farrell, J. Pretreatment for water reuse using fluidized bed crystallization. J. Water Process Eng. 2020, 35, 101226. [Google Scholar] [CrossRef]
  28. Chen, Y.; Kim, S.; Kim, Y.; Walker, J.S.; Wolfe, T.; Coleman, K.; Cohen, Y. Scale up of polyamide reverse osmosis membranes surface modification with tethered poly(acrylic acid) for fabrication of low fouling spiral-wound elements. Desalination 2022, 536, 115762. [Google Scholar] [CrossRef]
  29. Thompson, J.; Rahardianto, A.; Gu, H.; Uchymiak, M.; Bartman, A.; Hedrick, M.; Lara, D.; Cooper, J.; Faria, J.; Christofides, P.D.; et al. Rapid field assessment of RO desalination of brackish agricultural drainage water. Water Res 2013, 47, 2649–2660. [Google Scholar] [CrossRef]
  30. McCool, B.C.; Rahardianto, A.; Faria, J.; Kovac, K.; Lara, D.; Cohen, Y. Feasibility of reverse osmosis desalination of brackish agricultural drainage water in the San Joaquin Valley. Desalination 2010, 261, 240–250. [Google Scholar] [CrossRef]
  31. Gu, H.; Rahardianto, A.; Gao, L.; Caro, X.; Giralt, J.; Rallo, R.; Christofides, P.; Cohen, Y. Fouling indicators for field monitoring the effectiveness of operational strategies of ultrafiltration as pretreatment for seawater desalination. Desalination 2018, 431, 86–99. [Google Scholar] [CrossRef]
  32. Zhou, Y.; Khan, B.; Gu, H.; Christofides, P.; Cohen, Y. Modeling UF fouling and backwash in seawater RO feedwater treatment using neural networks with evolutionary algorithm and Bayesian binary classification. Desalination 2021, 513, 115129. [Google Scholar] [CrossRef]
  33. Bartman, A.R.; Lyster, E.; Rallo, R.; Christofides, P.D.; Cohen, Y. Mineral scale monitoring for reverse osmosis desalination via real-time membrane surface image analysis. Desalination 2011, 273, 64–71. [Google Scholar] [CrossRef]
  34. Lyster, E.; Au, J.; Rallo, R.; Giralt, F.; Cohen, Y. Coupled 3-D hydrodynamics and mass transfer analysis of mineral scaling-induced flux decline in a laboratory plate-and-frame reverse osmosis membrane module. J. Membr. Sci. 2009, 339, 39–48. [Google Scholar] [CrossRef]
  35. Lyster, E.; Cohen, Y. Numerical study of concentration polarization in a rectangular reverse osmosis membrane channel: Permeate flux variation and hydrodynamic end effects. J. Membr. Sci. 2007, 303, 140–153. [Google Scholar] [CrossRef]
  36. Lyster, E.; Kim, M.-M.; Au, J.; Cohen, Y. A method for evaluating antiscalant retardation of crystal nucleation and growth on RO membranes. J. Membr. Sci. 2010, 364, 122–131. [Google Scholar] [CrossRef]
  37. Uchymiak, M.; Lyster, E.; Glater, J.; Cohen, Y. Kinetics of gypsum crystal growth on a reverse osmosis membrane. J. Membr. Sci. 2008, 314, 163–172. [Google Scholar] [CrossRef]
  38. Uchymiak, M.; Rahardianto, A.; Lyster, E.; Glater, J.; Cohen, Y. A novel RO ex situ scale observation detector (EXSOD) for mineral scale characterization and early detection. J. Membr. Sci. 2007, 291, 86–95. [Google Scholar] [CrossRef]
  39. Cohen, Y.; Rahardianto, A.; Christofides, P.; Thompson, J.; Gao, L. Pilot-Scale Evaluation of High Recovery Desalination of Agricultural Drainage Water with Smart Integrated Membrane Systems (SIMS), Desalination and Water Purification Research and Development Report No. 173; Bureau of Reclamation, Department of the Interior Denver Federal Center: Denver, CO, USA, 2016; pp. 19–22. [Google Scholar]
  40. Gu, H.; Bartman, A.R.; Uchymiak, M.; Christofides, P.D.; Cohen, Y. Self-adaptive feed flow reversal operation of reverse osmosis desalination. Desalination 2013, 308, 63–72. [Google Scholar] [CrossRef]
  41. Gonzalez, R.; Woods, R. Digital Image Processing; Addison-Wesley Longman Publishing, Co. Inc.: Boston, MA, USA, 2008. [Google Scholar]
  42. Krishna, A.; Rao, G.; Sravya, M. Contrast Enhancement Techniques Using Histogram Equalization on Color Images with Poor Lighting. Int. J. Comput. Sci. Eng. Appl. 2013, 3, 15. [Google Scholar] [CrossRef]
  43. Rahardianto, A.; McCool, B.; Cohen, Y. Reverse osmosis desalting of inland brackish water of high gypsum scaling propensity: Kinetics and mitigation of membrane mineral scaling. Environ. Sci. Technol. 2008, 42, 4292–4297. [Google Scholar] [CrossRef]
  44. Oren, Y.; Korngold, E.; Daltrophe, N.; Messalem, R.; Volkman, Y.; Aronov, L.; Weismann, M.; Bouriakov, N.; Glueckstern, P.; Gilron, J. Pilot studies on high recovery BWRO-EDR for near zero liquid discharge approach. Desalination 2010, 261, 321–330. [Google Scholar] [CrossRef]
  45. Oshchepkov, M.; Golovesov, V.; Ryabova, A.; Frolova, S.; Tkachenko, S.; Kamagurov, S.; Rudakova, G.; Popov, K. Synthesis and Visualization of a Novel Fluorescent-Tagged Polymeric Antiscalant during Gypsum Crystallization in Combination with Bisphosphonate Fluorophore. Crystals 2020, 10, 992. [Google Scholar] [CrossRef]
  46. Gilron, J. Brine Treatment and High Recovery Desalination. In Emerging Membrane Technology for Sustainable Water Treatment; Singh, R., Hankins, N., Eds.; Elsevier Science: Amsterdam, The Netherlands, 2016; Volume 3, pp. 297–324. [Google Scholar]
  47. Hydranautics. RO Water Chemistry. 2001. Available online: https://novoagua.com/wp-content/uploads/2014/04/RO_Water_Chemistry.pdf (accessed on 30 January 2023).
  48. Dupont. FilmTec™ Reverse Osmosis Membranes Technical Manual. 2022. Available online: https://www.dupont.com/content/dam/dupont/amer/us/en/water-solutions/public/documents/en/RO-NF-FilmTec-Manual-45-D01504-en.pdf (accessed on 30 January 2023).
  49. Gao, L.; Gu, H.; Rahardianto, A.; Christofides, P.; Cohen, Y. Self-adaptive cycle-to-cycle control of in-line coagulant dosing in ultrafiltration for pre-treatment of reverse osmosis feed water. Desalination 2017, 401, 22–31. [Google Scholar] [CrossRef] [Green Version]
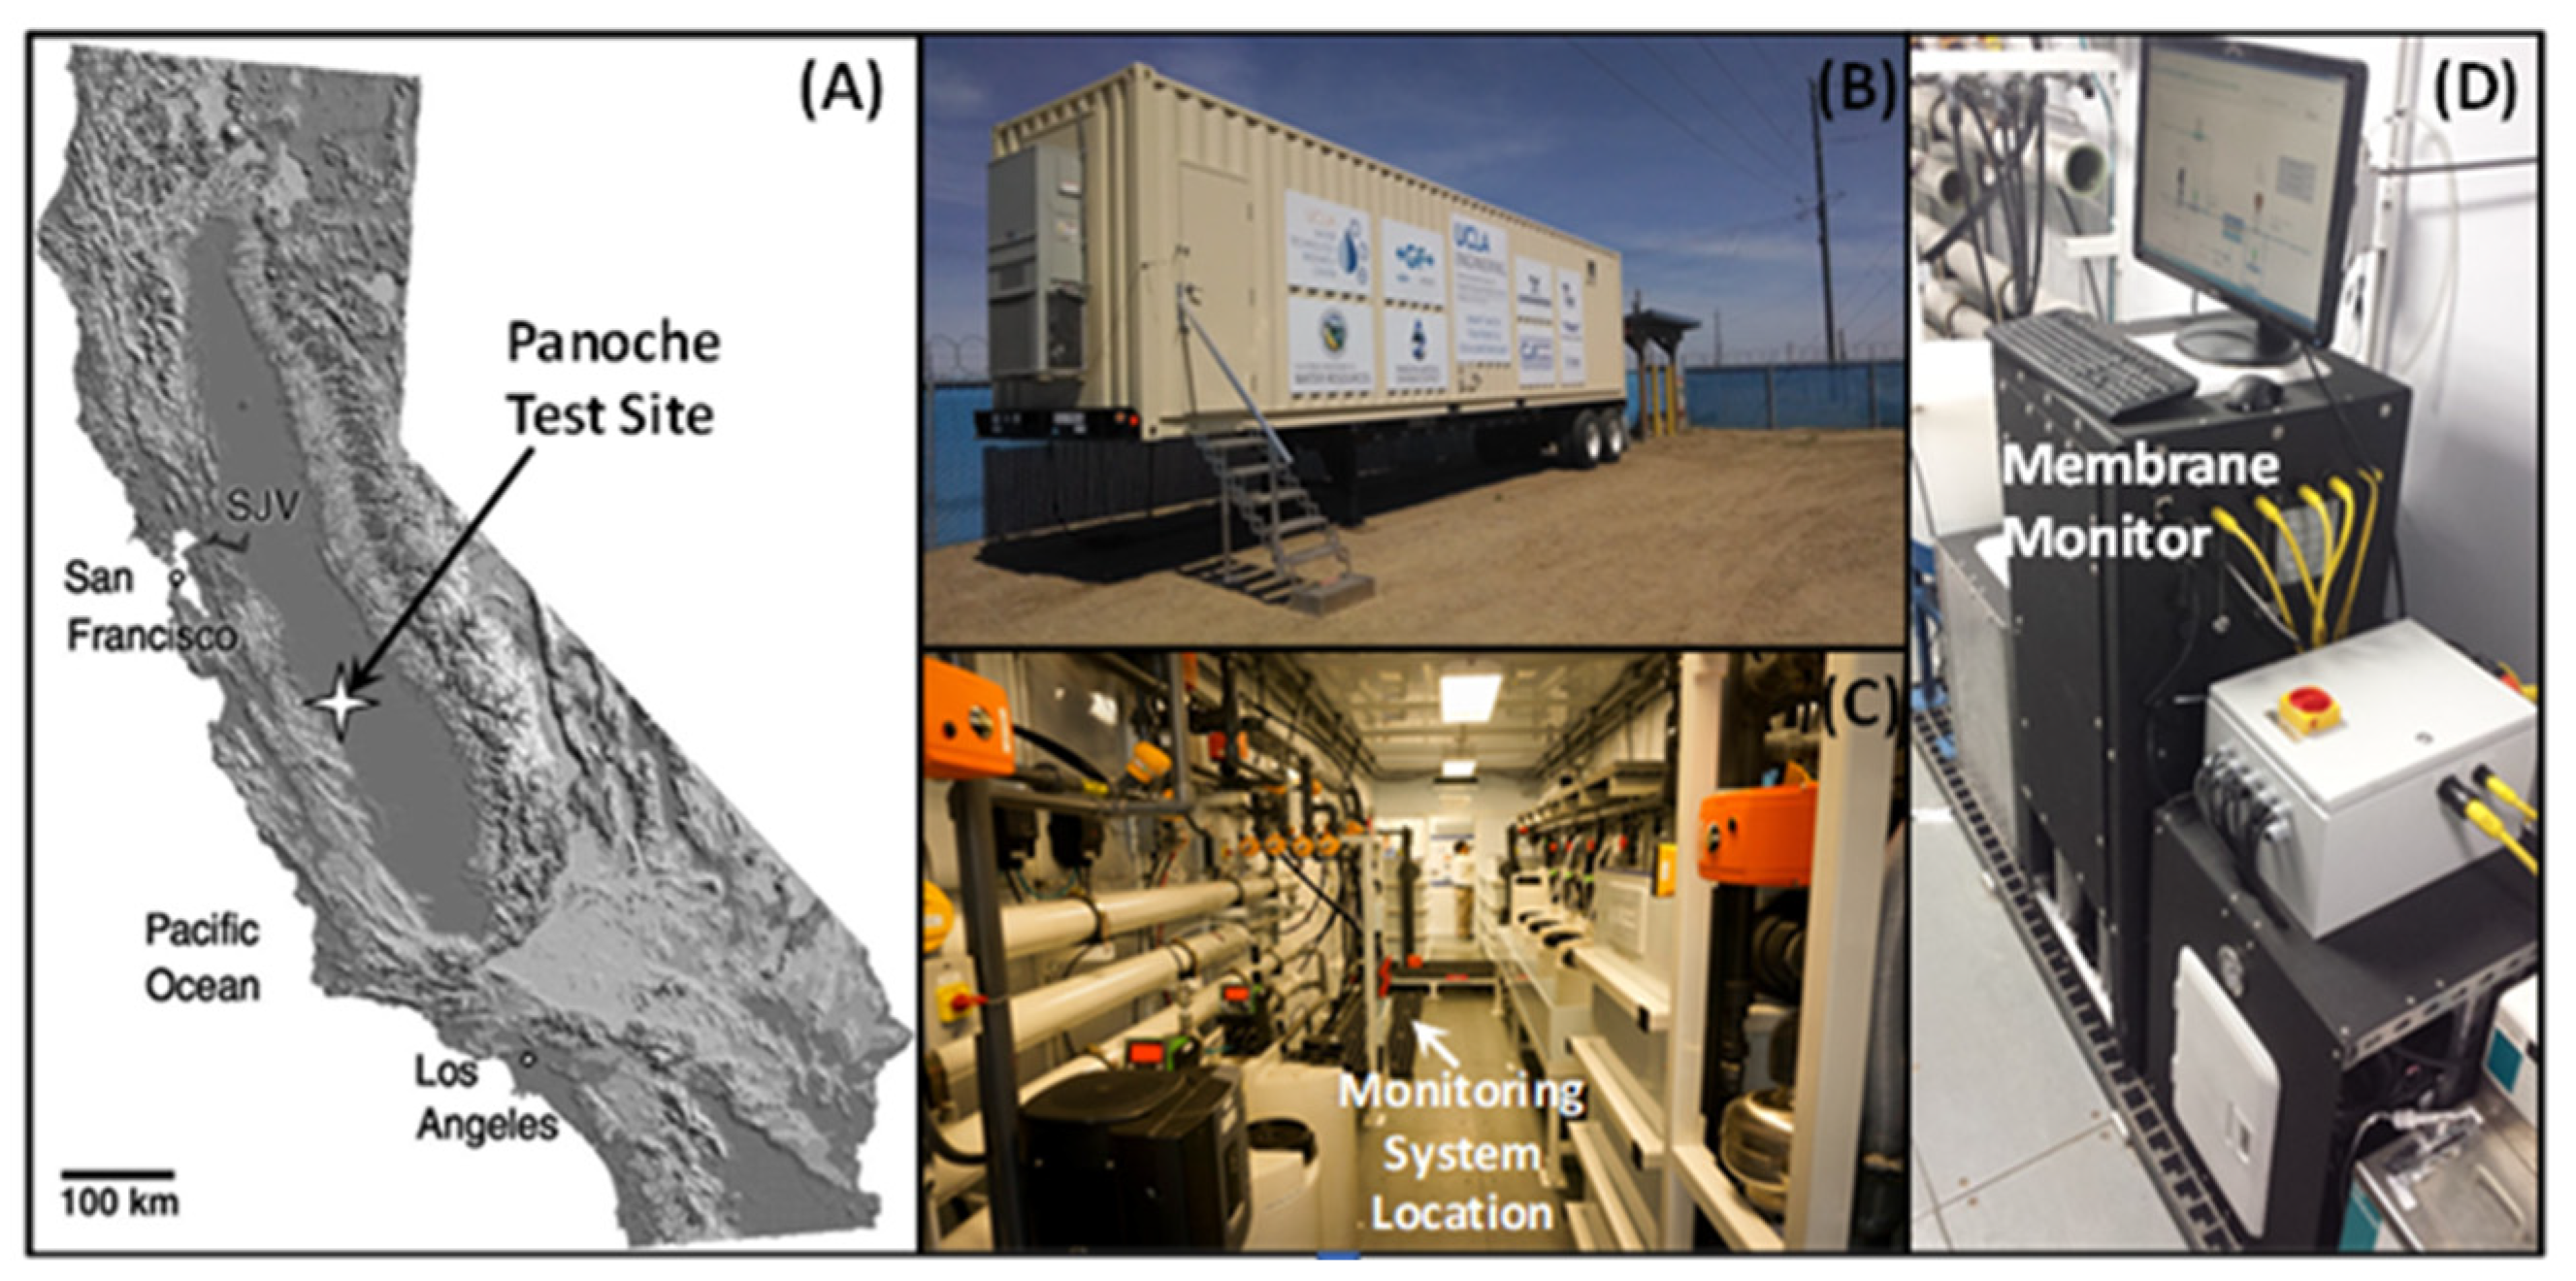
Figure 1. (A) Location of field-testing site in the San Joaquin Valley of California (adapted from [30]). (B) External view of the containerized RO plant. (C) Internal view of the RO plant. (D) Membrane monitoring system (MMS) inside the RO plant trailer.
Water 15 00847 g001
Figure 2. Schematic illustration of the sequence of two RO feed water pretreatment trains: (A) media filtration, followed by a hydrocyclone and 80-mesh strainer; and (B) hydrocyclone, followed by a 200 µm microfilter (MF), ultrafiltration (UF), and 80-mesh strainer.
Water 15 00847 g002
Figure 3. Schematic representation of the plate-and-frame RO (PFRO) membrane monitoring system (MMS). The applied pressure and crossflow in the PFRO unit were controlled via the variable frequency drive (VFD) of the feed pump and an automated control valve (V3). Online sensors included feed pressure (P), concentrate and permeate flow rate sensors (F), and conductivity sensors (C).
Water 15 00847 g003
Figure 4. Normalized RO permeate flux during filtration tests for feed water treatment with configurations A (without UF) and B (with UF pretreatment). Crossflow velocity = 4.5 cm/s, Yplant = 63%, initial permeate flux = 33 L/m2h, and SIg,m = 1.9–2.0. P and PO are permeate flux values at time t and initially. Dotted vertical lines 1 and 2 denote early detection of particles/small crystals formed for RO operation with feedwater pretreated via configurations A and B, respectively (Figure 2).
Water 15 00847 g004
Figure 5. Real-time membrane monitoring system (MMS) surface images during desalination RO feed water treated via a filtration train without UF (configuration A). PFRO operating conditions: crossflow velocity = 4.5 cm/s, initial permeate flux = 33 L/m2-h (19 gallons/ft2-day), and SIg,m = 1.9–2.0 corresponding to equivalent RO plant recovery of 63%.
Water 15 00847 g005
Figure 6. RO membrane surface images during desalination of RO feed water pretreated via a filtration train that included UF (configuration B, Figure 2) without antiscalant dosing. PFRO operating conditions: crossflow velocity = 4.5 cm/s, initial permeate flux = 33 L/m2-h (19 gallons/ft2-day), and initial SIg,m ~ 2 corresponding to equivalent RO plant recovery of 63%.
Water 15 00847 g006
Figure 7. Comparison of surface coverage and crystal number density analyzed from real-time membrane images during prefiltration testing indicating a comparison of observed mineral scaling configurations A and B. PFRO operating conditions: crossflow velocity = 4.5 cm/s, initial permeate flux = 33 L/m2-h (19 gallons/ft2-day), and SIg,m = 1.9–2.0 corresponding to equivalent RO plant recovery of 63%. RO feed pretreatment with media filtration and hydrocyclone and without UF and with UF pretreatment identified as configurations A and B, respectively (Figure 2).
Water 15 00847 g007
Table 1. Agricultural brackish feedwater quality.
Major Analytes/PropertiesValue
Total Dissolved Solids (TDS) (mg/L)14,160
Total Suspended Solids (mg/L)8.6
Total Organic Carbon (mg/L)8.3
Barium (mg/L)<0.1
Boron (mg/L)49.8
Calcium (mg/L)549
Chloride (mg/L)3042
Magnesium (mg/L)358
Nitrate (mg/L)122
Potassium (mg/L)15.1
Silica (mg/L)37
Sodium (mg/L)3772
Strontium (mg/L)6.7
Sulfate (mg/L)6047
Turbidity (NTU) (a)1.1
pH7.6
SIcalcite(b)7.0
SIgypsum(b)0.97
Note: (a) NTU: nephelometric turbidity unit; (b) SIx: mineral salt x saturation index.
Disclaimer/Publisher’s Note: The statements, opinions and data contained in all publications are solely those of the individual author(s) and contributor(s) and not of MDPI and/or the editor(s). MDPI and/or the editor(s) disclaim responsibility for any injury to people or property resulting from any ideas, methods, instructions or products referred to in the content.