

Historical Review on Water Level Changes in Lake Kinneret (Israel) and Incomparable Perspectives


Abstract
1. Introduction
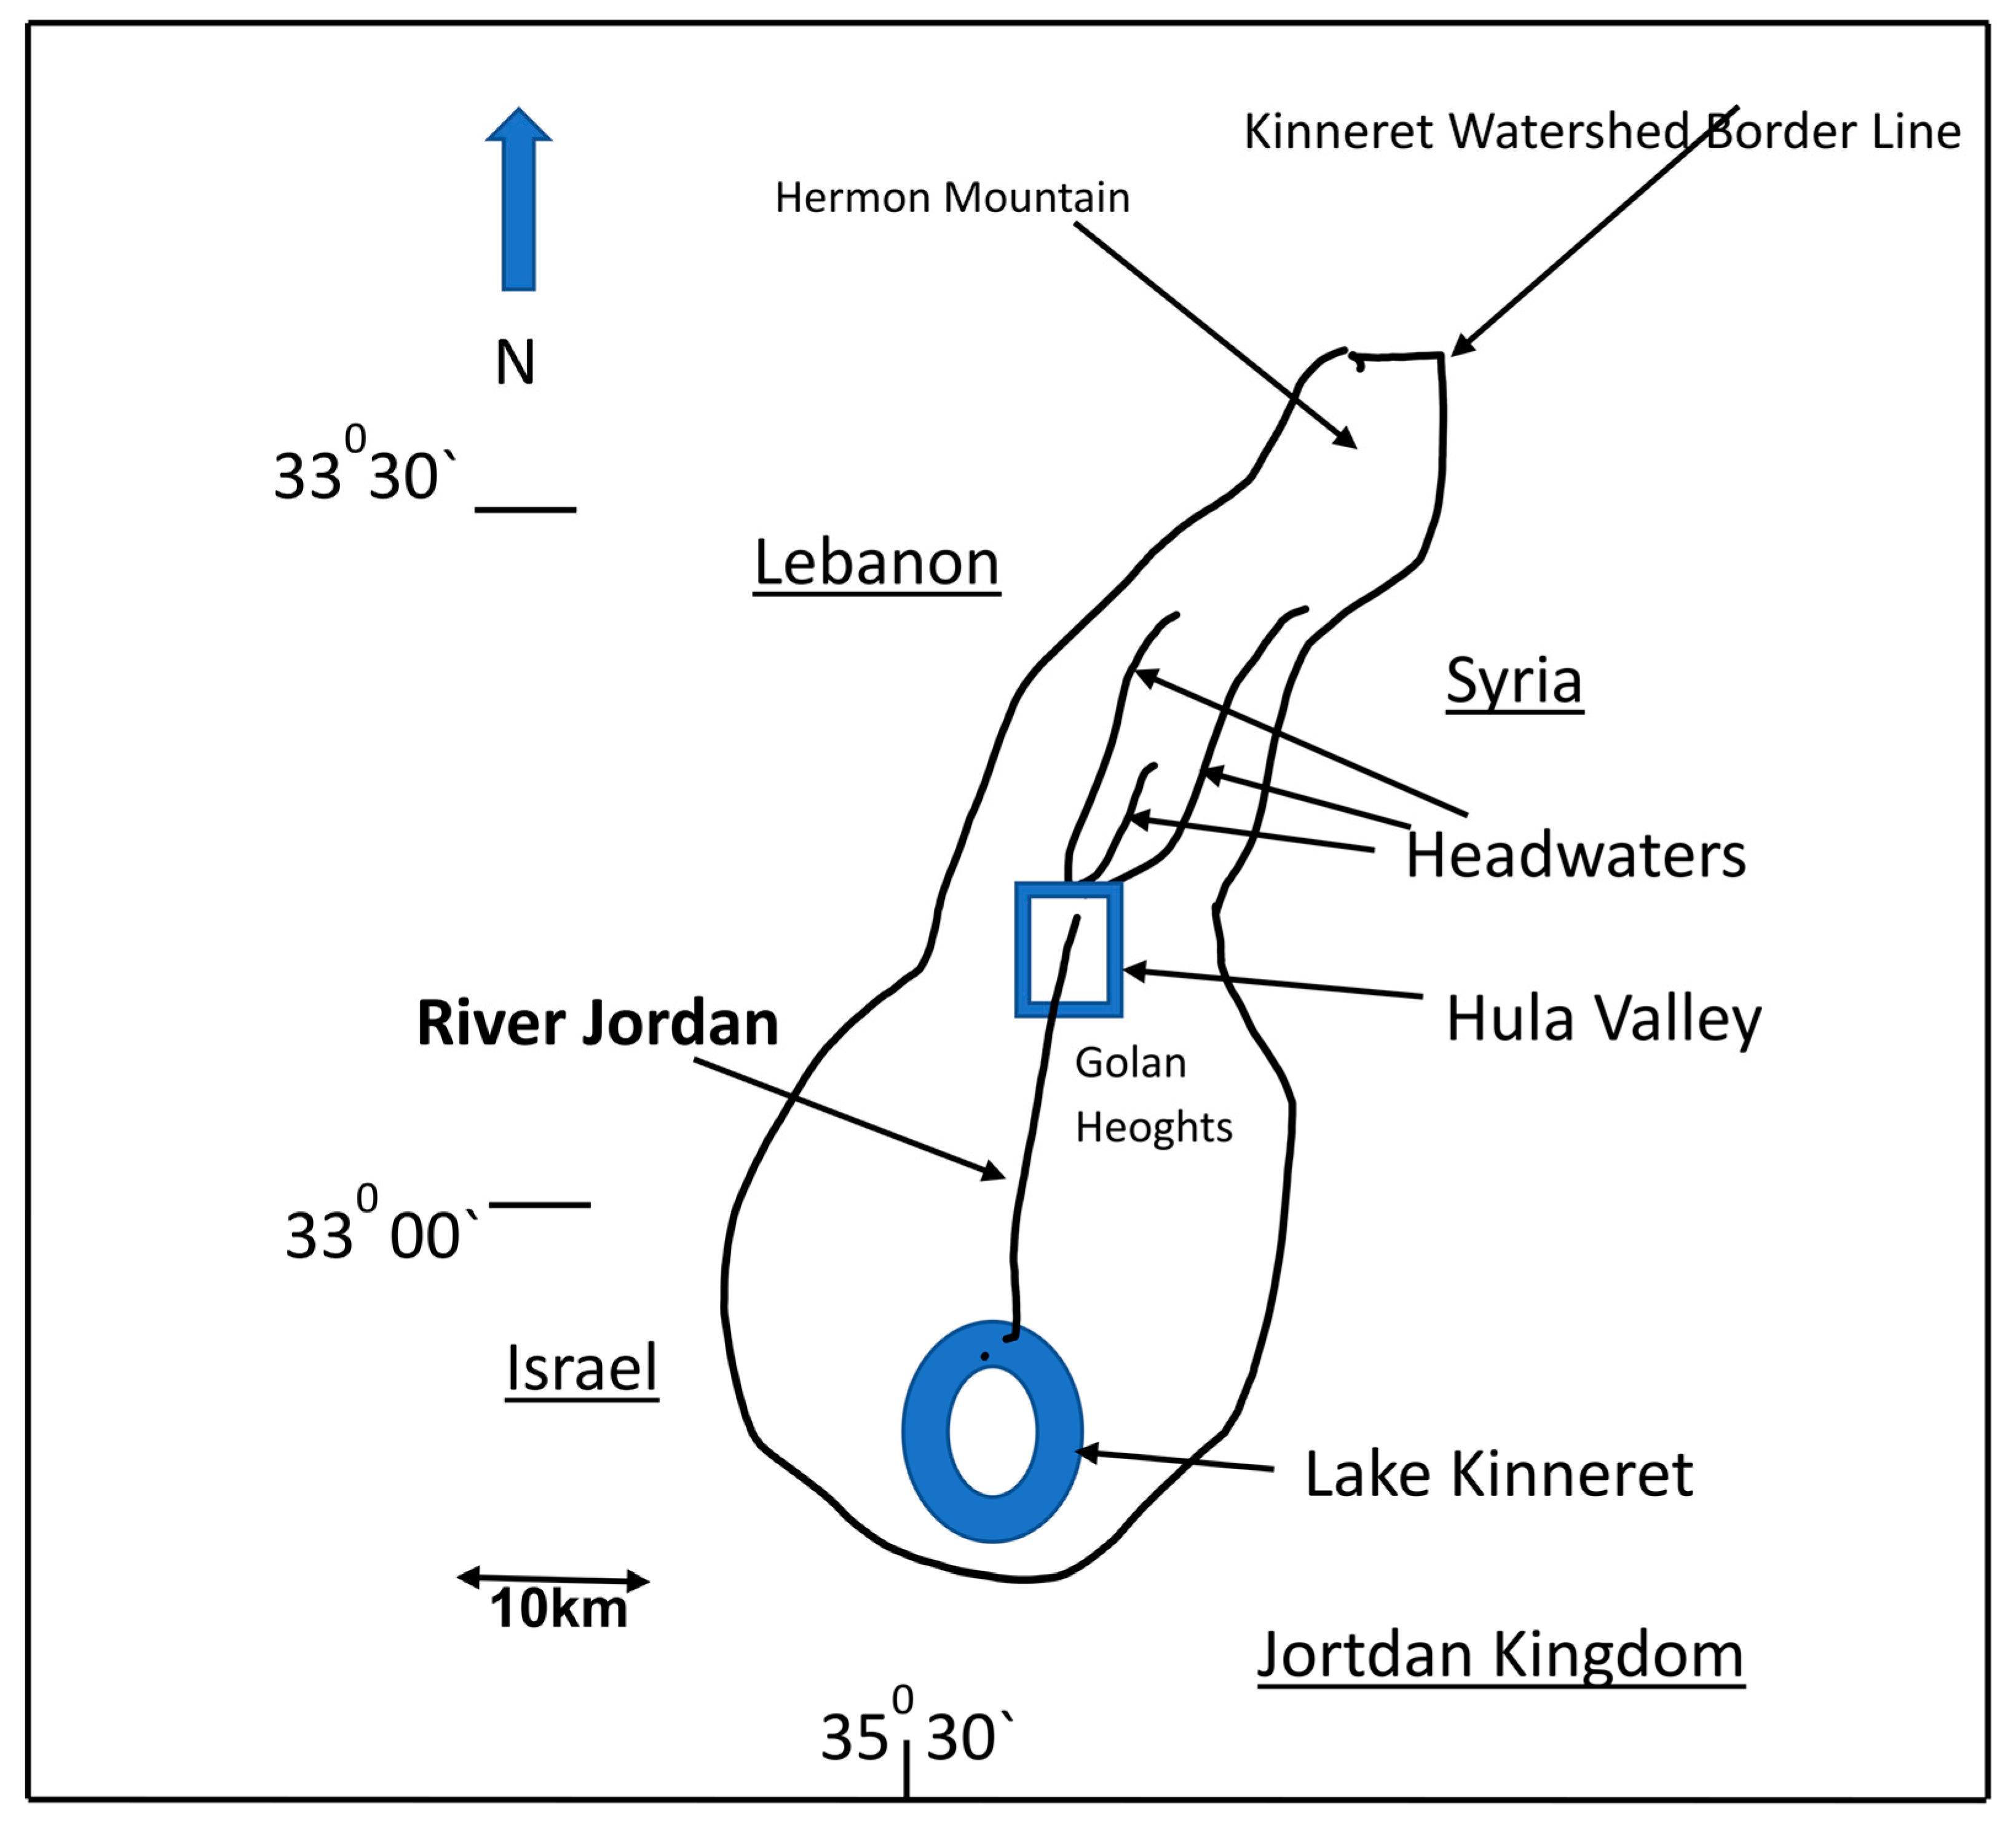
2. Study Area
2.1. Regional Hydrology
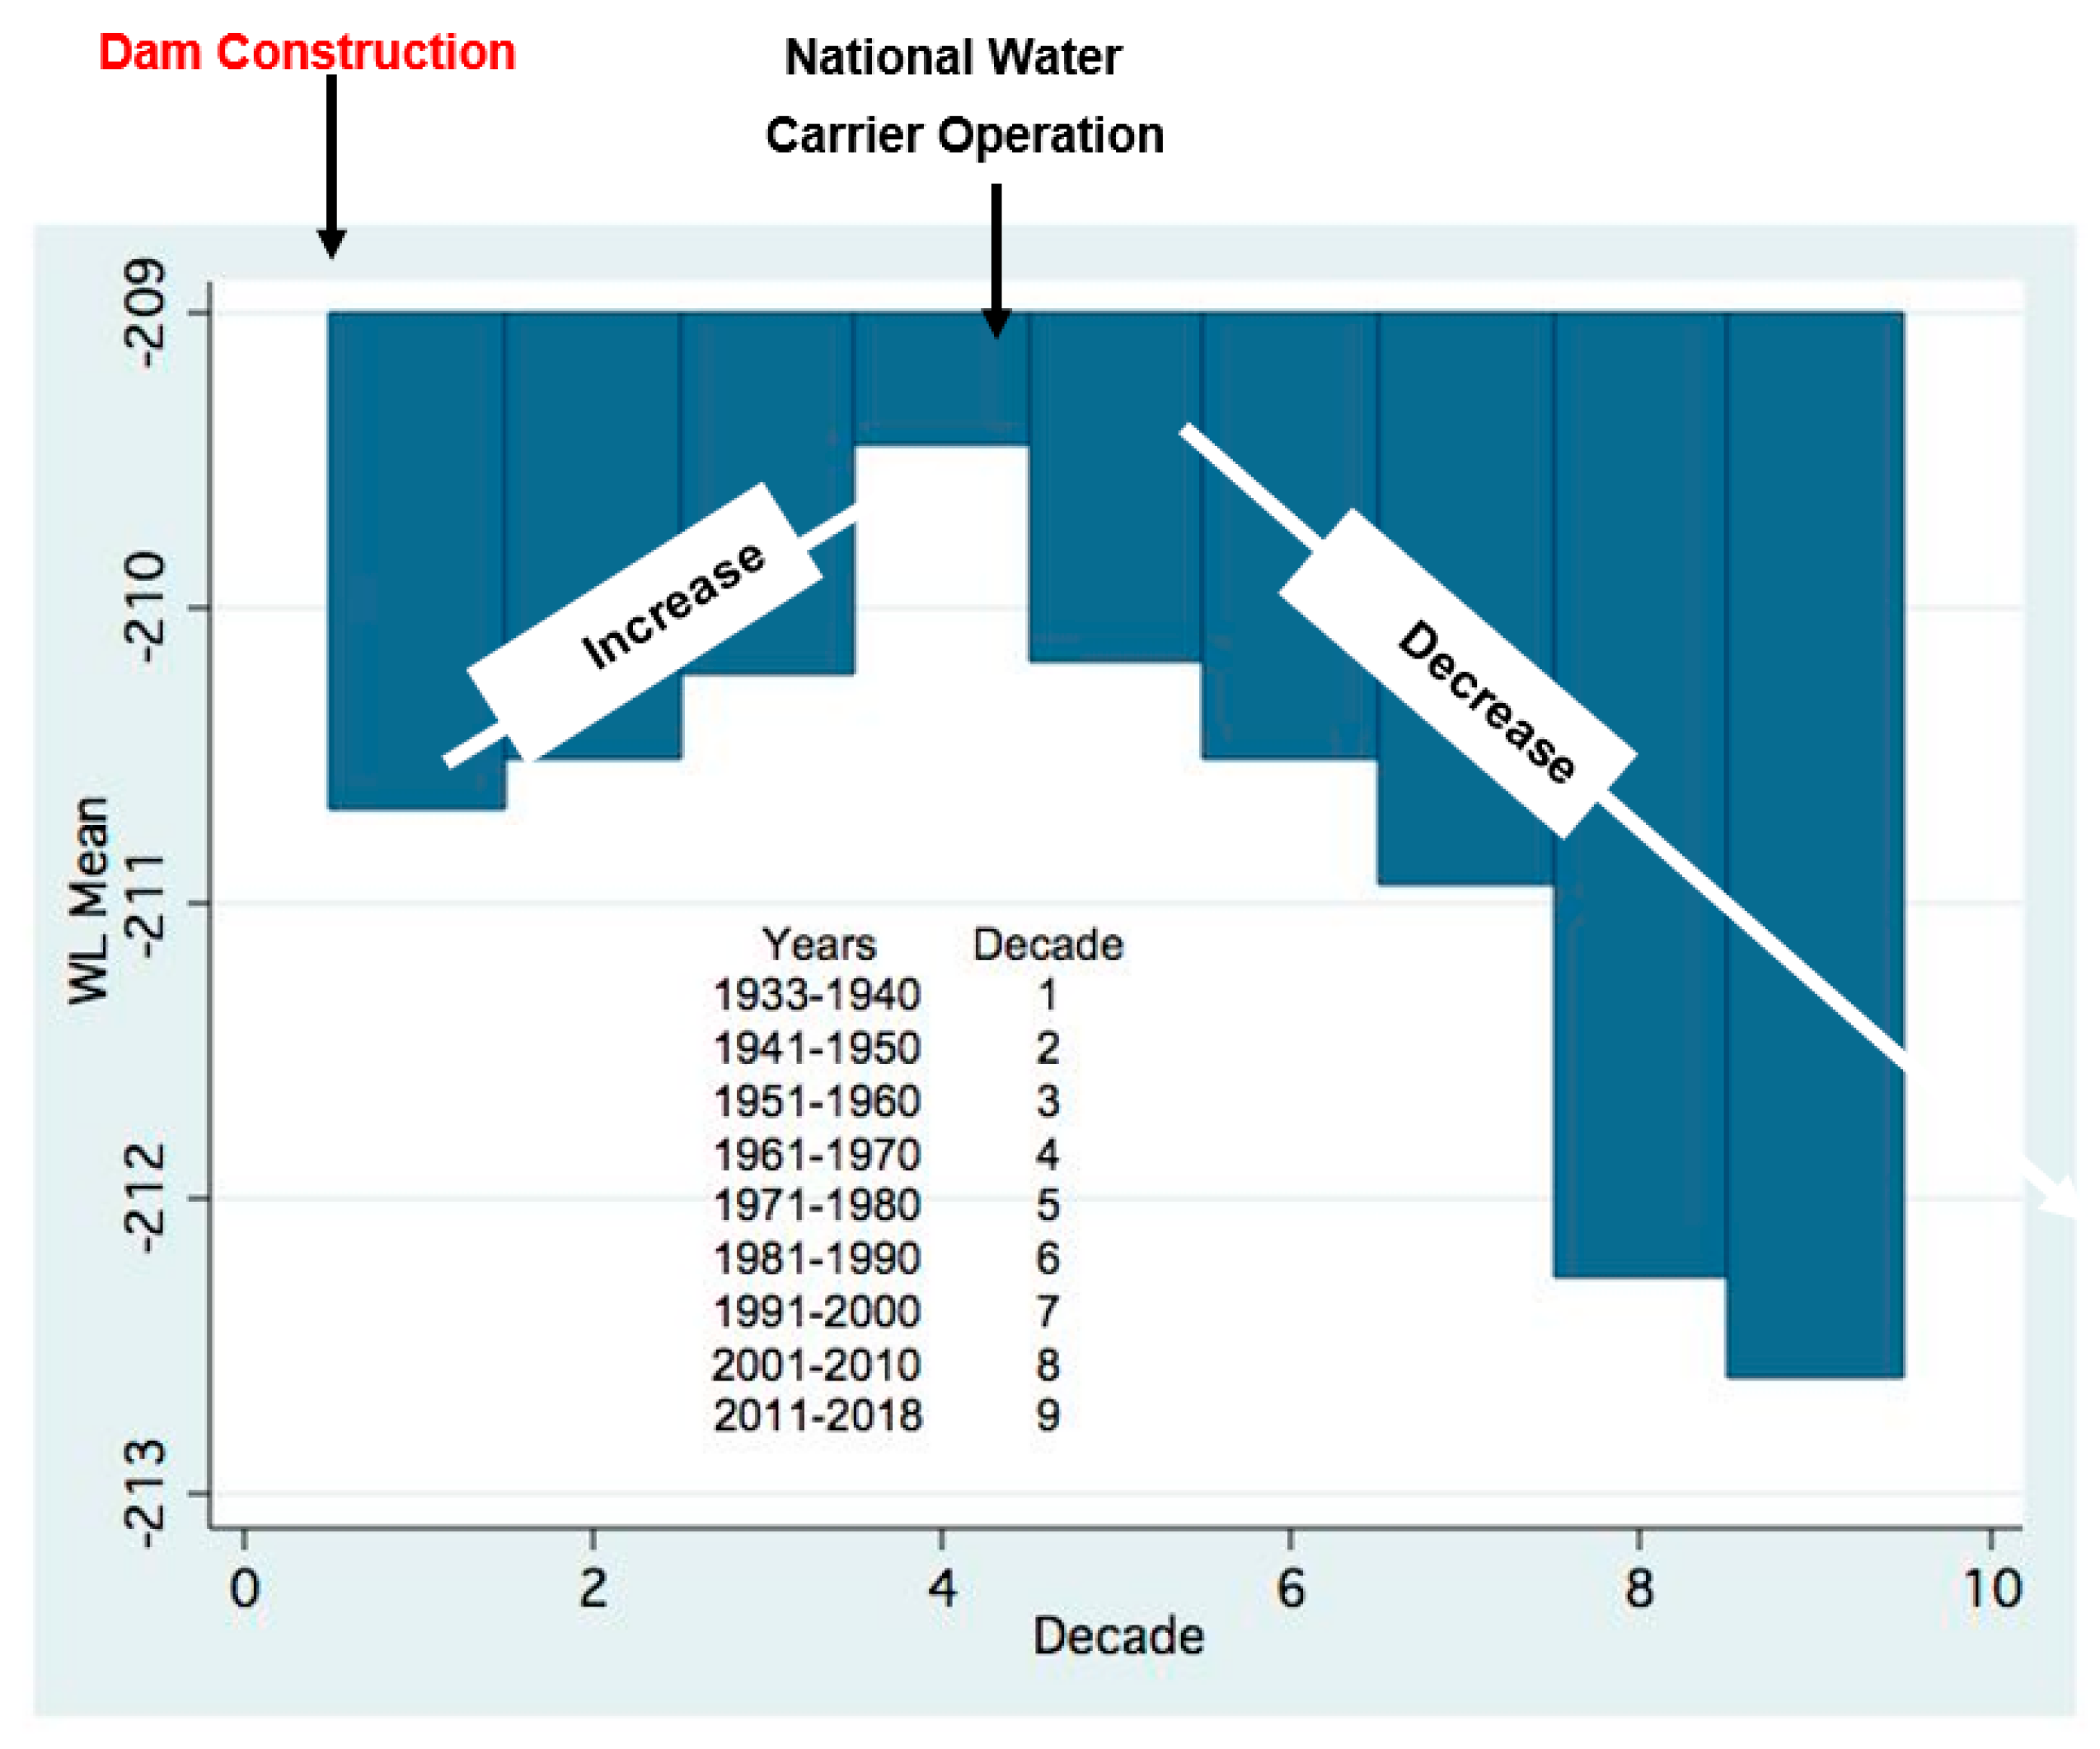
2.2. Anthropogenic Involvement
Lake Water Balance (Table 1)

| Input | Output | ||
|---|---|---|---|
| Golan Heights rivers | 145 | Evaporation | 280 |
| Jordan and headwater sources | 480 (northern consumption abstracted) | Southern Jordan Spiling | 80 |
| Direct Rainfall | 75 | Local Consumption | 60 |
| Eastern Galilee rivers | 75 | National Water Carrier | 380 |
| Jarmuch diversion | 25 | Total Output | 800 |
| Total input | 800 | ||
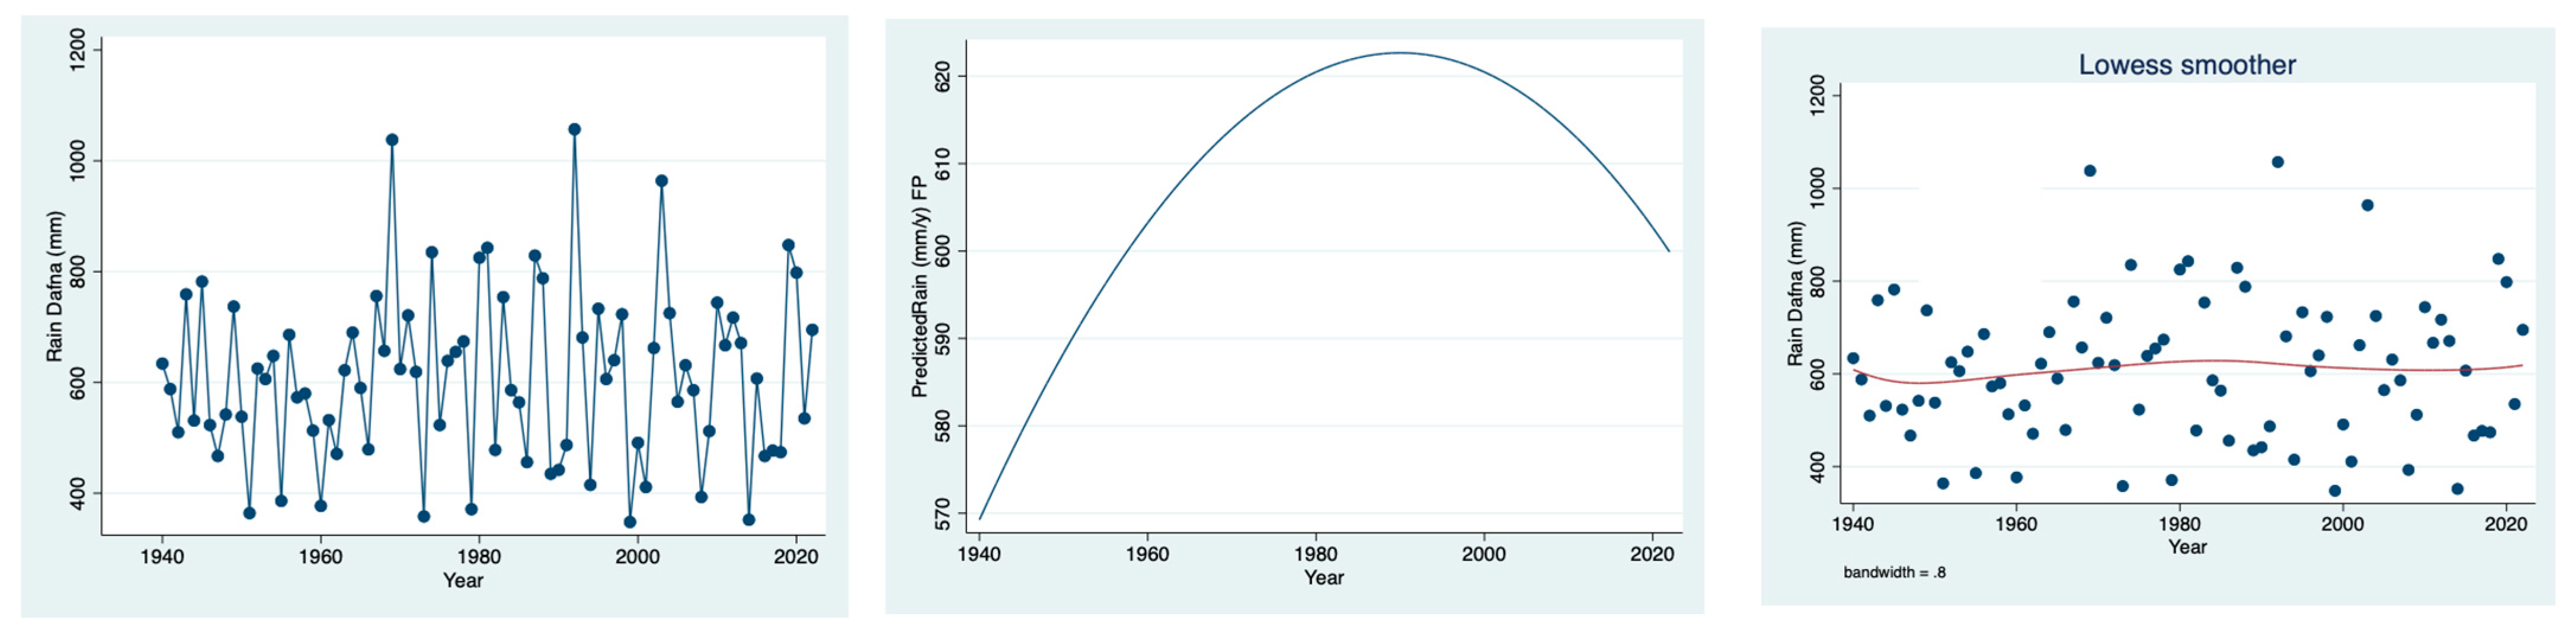
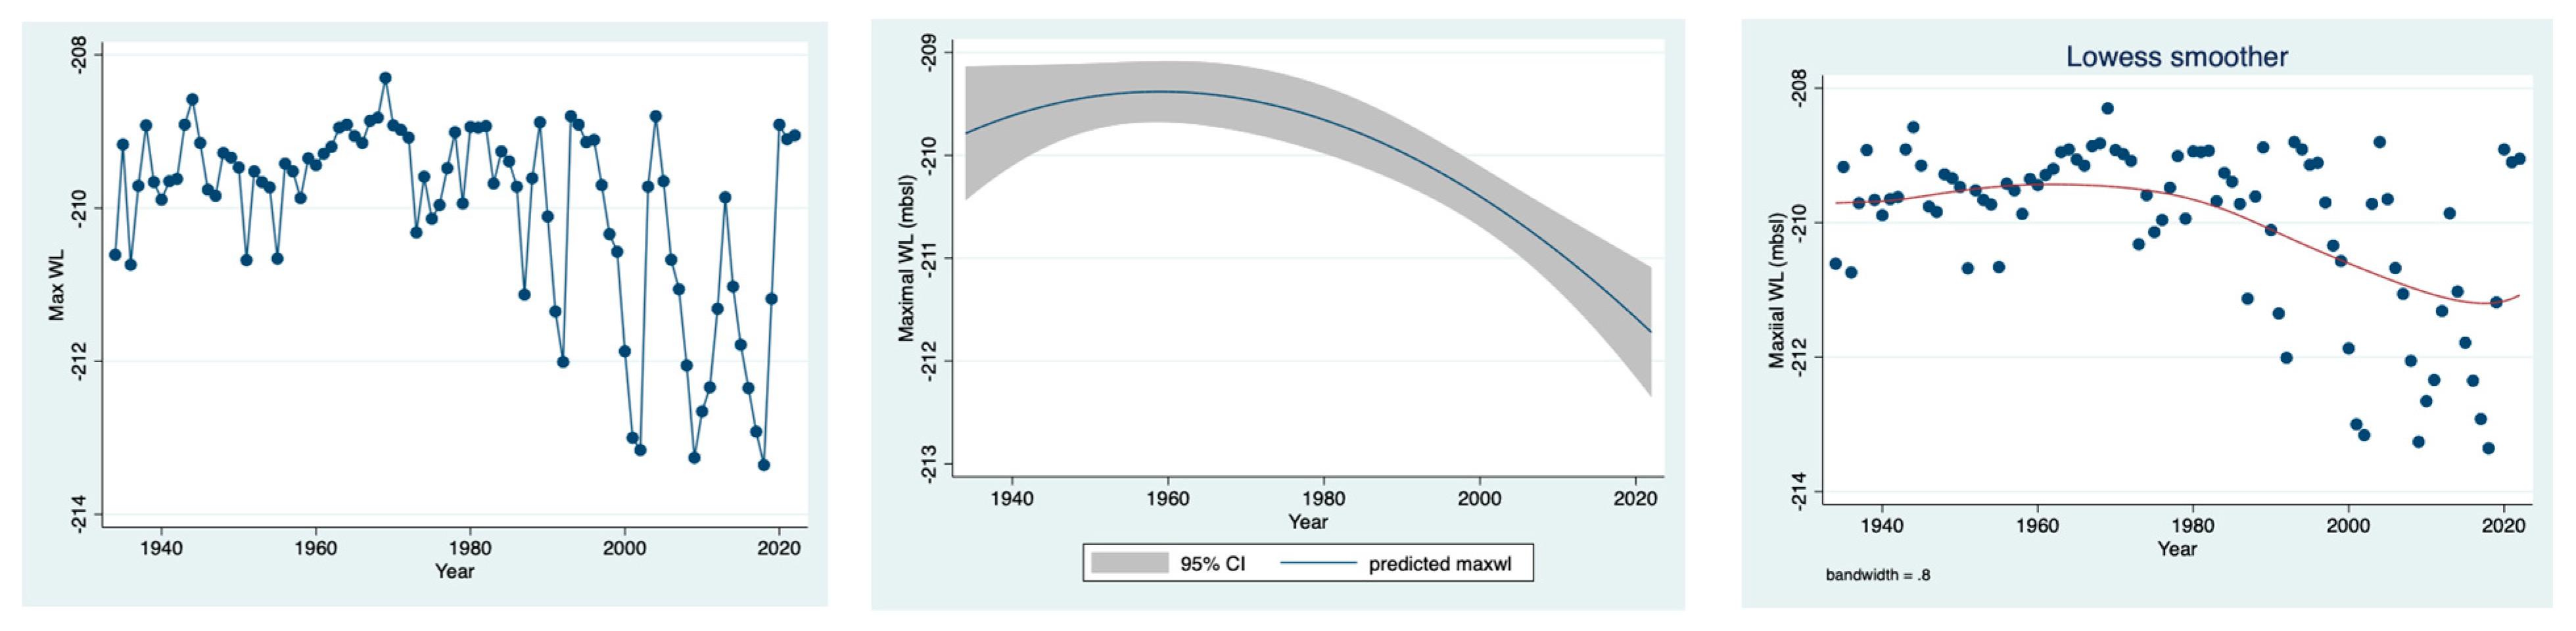
3. Statistical Methods
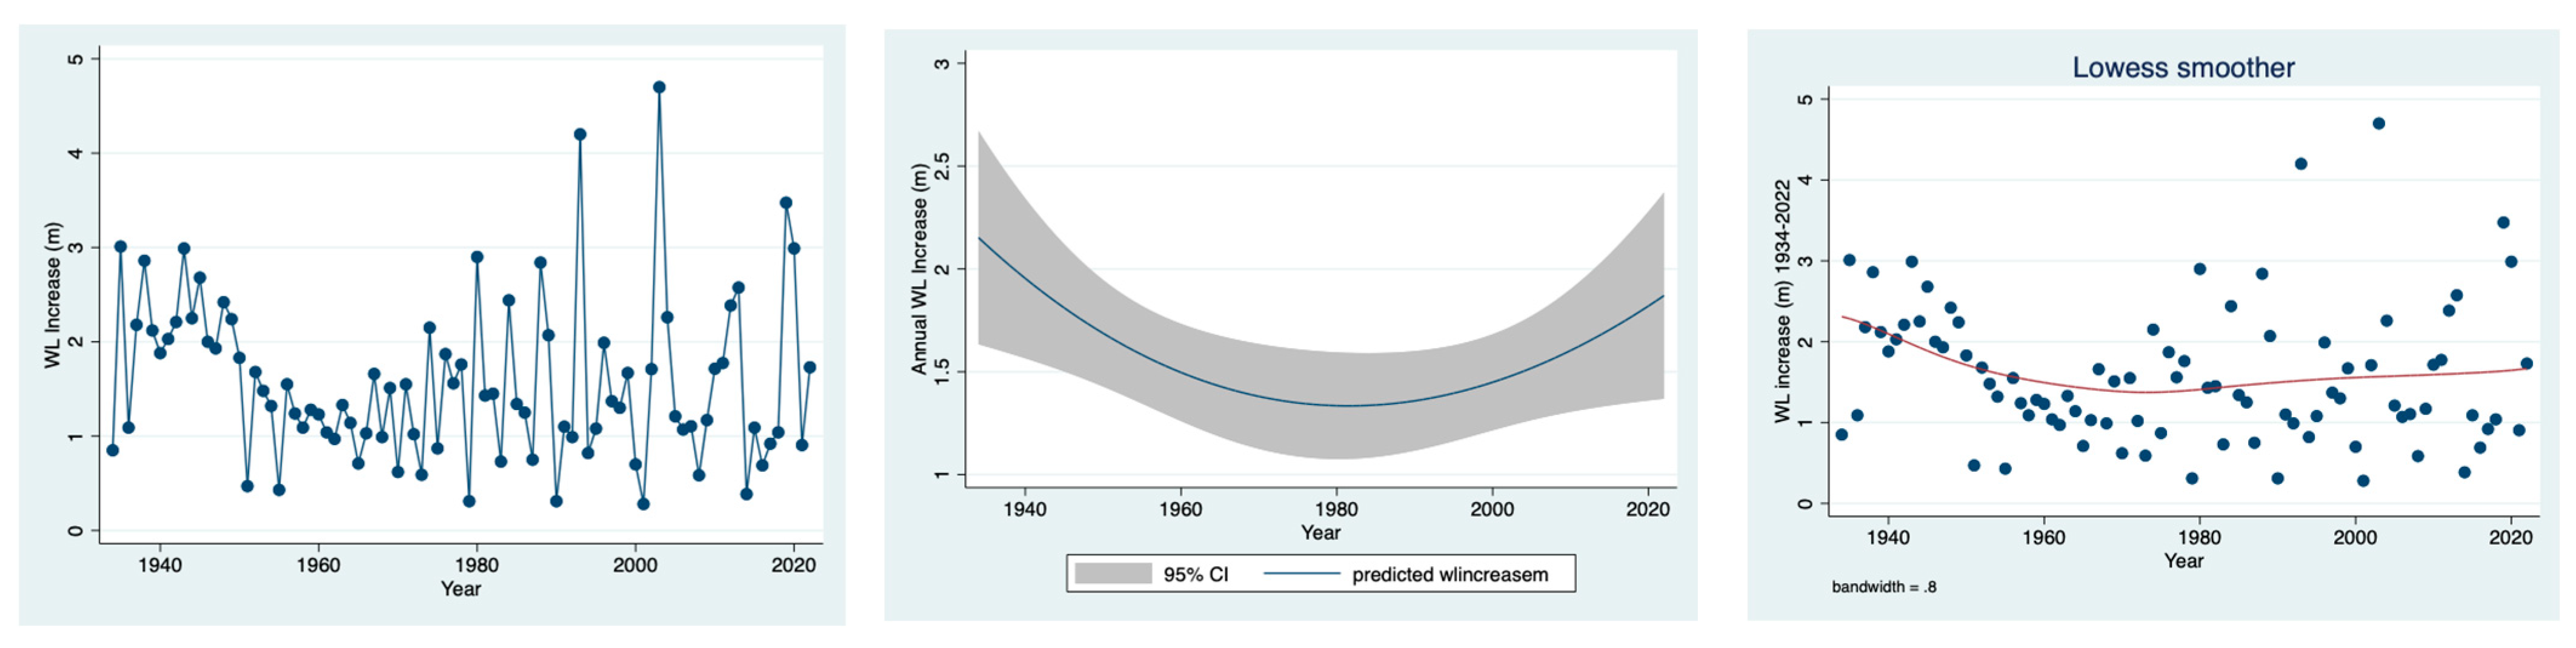
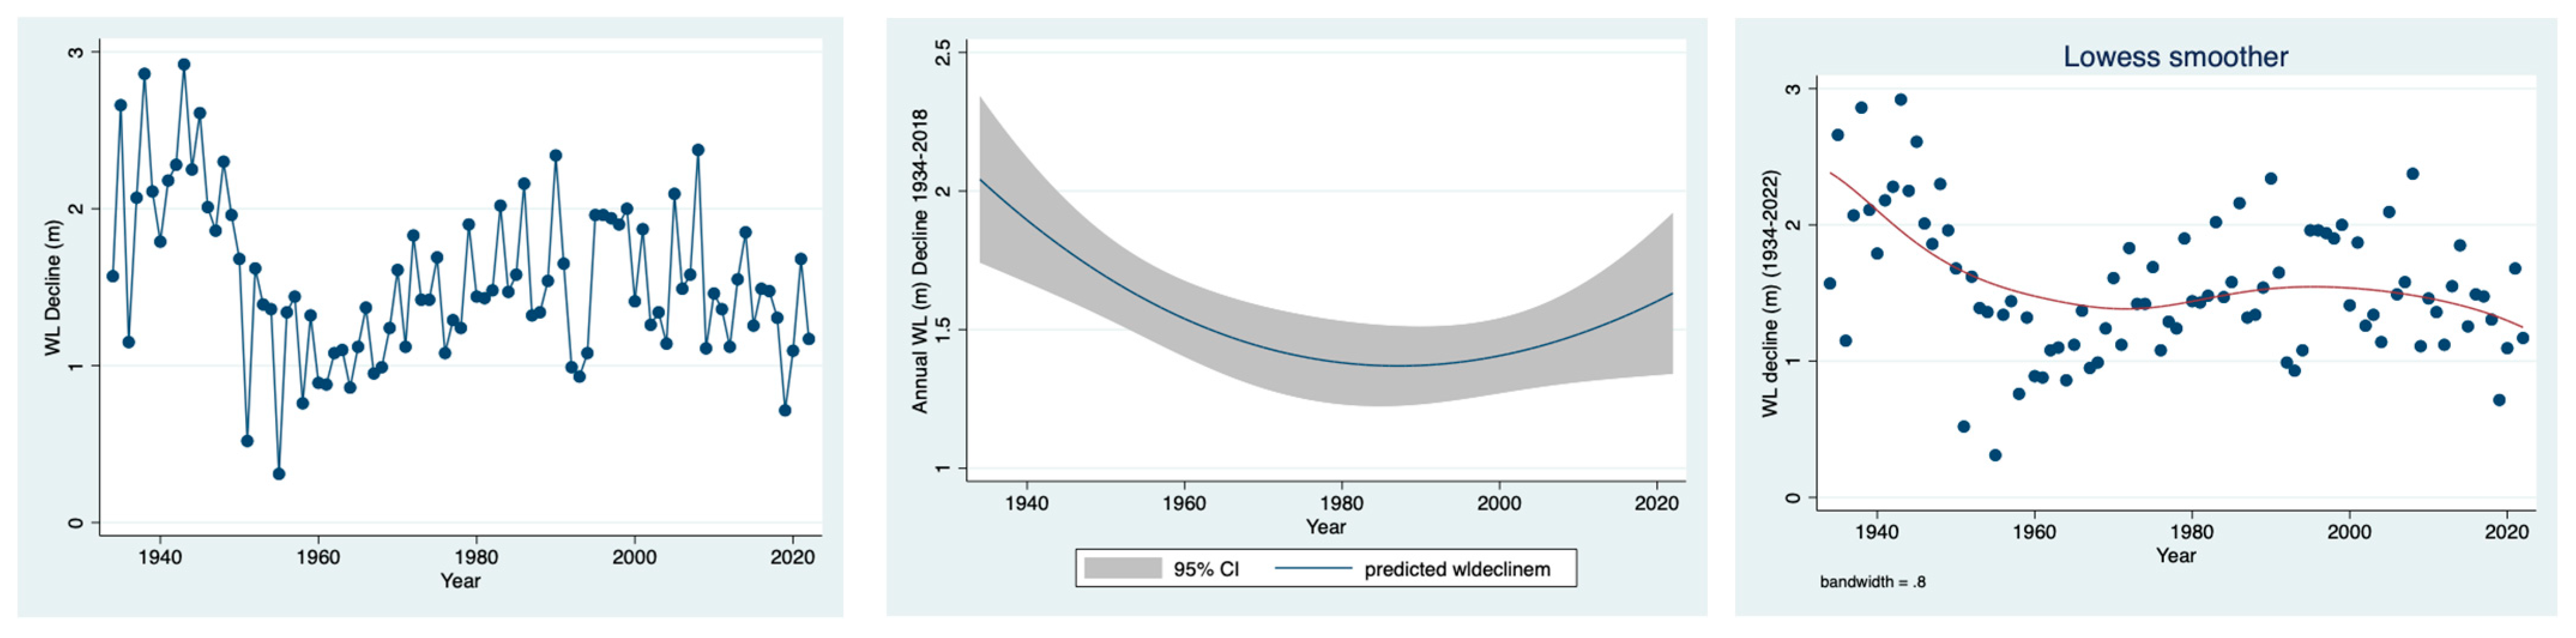
4. Results and Discussion
4.1. Discussion
4.1.1. Complex Interactions in WL Management
4.1.2. The Dramatic WL Decline in SAT Lakes
4.1.3. Lake Sevan
4.1.4. Lake Tchad
4.1.5. The Aral Sea
4.1.6. SAT and Kinneret Incomparability
5. Conclusive Remarks
Funding
Data Availability Statement
Conflicts of Interest
References
- Mekorot, National Water Company. Annual Report, Submitted to the Water Authority Department of Hydrology; 1986–2018, Water, Salt, and Energy Balances for Lake Kinneret. 2019/20; Mekorot, National Water Company: Tel Aviv, Israel, 2019; 41p. (In Hebrew) [Google Scholar]
- Hydrological Service; Wtare Authority. Monthly Reports: Hydrological Status, Surface Water, and Ground Water Table; Department of Surface Water, Hydrology, Hydrometeorology, Hydrometry, Conservation of Northern Water Resources, National Water Authority: Jerusalem, Israel, 2022. (In Hebrew)
- LKDB-1969-2021; Data Base, Annual Report, Water Level Record. Kinneret Limnological Laboratory. Israel Oceanogrphic and Limnological Research Ltd.: Migdal, Israel, 2021. (In Hebrew)
- Feitelson, E.; Gazit, T.; Fischhendler, I. The Role of “Red Lines” in safeguarding the Sea of Galilee (Lake Kinneret); The Center for Environmental Policy, Stablished by the Charles H. Revson Foundation; Compiled Recommendations, Interim Summary: The Jerusalem Institute for Israeli Studies: Jerusalem, Israel, 2005; 75p, (In Hebrew; English Abstract). [Google Scholar]
- Seruya, C. Lake Kinneret Monographiae Biologicae; Dr. Junk bv Publishers: The Hague, The Netherlands; Boston, MA, USA; London, UK, 1978; Volume 32, 501p. [Google Scholar]
- Gophen, M. Chapter, Part 1: The Lake. In Lake Kinneret; Ministry of Defense-Israel and Kinneret Authority: Tel Aviv, Israel, 1992; 159p. [Google Scholar]
- Gvirtzman, H. Israel Water Resources, Chapter in Hydrology and Environmental Sciences; Yad Ben-Zvi Press: Jerusalem, Israel, 2002; 278p. (In Hebrew) [Google Scholar]
- HYBI. Hydrological Year-Book of Israel, 1950–1997; Annual Reports, Tel-Aviv, Submitted yo the National Water Authority; Ministry of National Infrastructures, Water Commission, Hydrological Service: Jerusalem, Israel, (In Hebrew, English Abstract).
- TAHAL-Water Planning in Israel Ltd. Monitoring and Salt and Water Balances in Lake Kinneret; Report, 01/90/39; Simon, E., Michelson, C., Eds.; Annual Reports; Submitted to the National Water Authority and Mekorot, Water Supply Compny, Ltd.; TAHAL, Hydrological Departement: Tel-Aviv, Israel, 1960–1988. (In Hebrew) [Google Scholar]
- Gophen, M. Different Kinneret; Gliit Publisher, 2019; 158p. (In Hebrew) [Google Scholar]
- Hazan, D.; Stein, M.; Agnon, A.; Marco, S.; Nadel, D.; Negendank, J.F.W.; Schwabe, M.; Neev, D. The late Pleistocene-Holocene Limnological History of Lake Kinneret (Sea Of Galilee). Quat. Res. 2005, 63, 60–77. [Google Scholar] [CrossRef]
- Vossel, H.; Roeser, P.; Litt, T.; Reed, J.M. Lake Kinneret Israel: New insight into Holocene regional Palaeo-climate variability based on high-resolution multi-proxy analysis. Holocene 2018, 2018, 1395–1410. [Google Scholar] [CrossRef]
- Babayan, A.; Hakobyan, S.; Jenderedjian, K.; Muradyan, S.; Voskanov, M. Report from: Lake Basin Management Initiative Regional Workshop for Europe, Central Asia and the Americas, Saint Michael’s College Vermont, USA, 18–21 June 2003; LakeNet in Cooperation with SMC and the International Lake Environment Committee, Global Environment Facility, U.S. Agency for International Development, Shiga Prefecture Government and World Bank: Washinghton, DC, USA, 2003; 28p. [Google Scholar]
- Wilkinson, I.P. Lake Sevan: Evolution, biotic variability and ecological degradation. In Large Asian Lakes in a Changing World; Minsche, S., Ed.; Springer: Cham, Switzerland, 2020; pp. 35–63. [Google Scholar]
- Gabrielyan, B.; Khosrovyan, A.; Schultze, M. A review of anthropogenic stressors on Lake Sevan, Armenia. J. Limnol. 2022, 81, 2061. [Google Scholar] [CrossRef]
- Serruya, C.; Pollingher, U. Lakes of the Warm Belt; Cambridge University Press: Cambridge, MA, USA; London, UK; New York, NY, USA, 1983; 569p. [Google Scholar]
- Carmouze, J.P.; Dejoux, C.; Durand, J.; Gras, R.; Iltis, A.; Lauzane, L.; Lemoalle, J.; Leveque, C.; Loubens, G.; Jean, L.S. Contribution a la connaissance du basin Tchad. Cah. ORSTOM (Ser. Hydrol.) 1972, 6, 69–103. [Google Scholar]
- Carmouze, J.P. The Hydrochemical regulation of the Lake Tchad. In Proceedings of the SIL-UNEP, Workshop on African Limnology; Symoens, J.J., Ed.; Nairobi SIL-UNEP: Nairobi, Kenya, 1983. [Google Scholar]
- Pham-Duc, B.; Sylvestre, F.; Frederic, F.; Bouchez, C.; Cretaux, J.F. The Lake Tchad hydrology under current climate change. Sci. Rep. 2020, 10, 5498. [Google Scholar] [CrossRef] [PubMed]
- Micklin, P. The past, present, and future Aral Sea. Lakes Reserv. Res. Manag. 2017, 15, 193–213. [Google Scholar] [CrossRef]
- Micklin, P.; Aladin, N.V. Reclaiming the Aral Sea. Sci. Am. 2008, 298, 64–71. [Google Scholar] [CrossRef]
- Aladin, N.V.; Ivanovna, G.V.; Vasilevna, Z.L.; Svetozarovich, P.I.; Olegovich, S.A.; Klimaszyk, R.P. The zoocenosis of the Aral Sea: Six decades of fast-paced change. Environ. Sci. Pollut. Res. Int. 2019, 26, 2228–2237. [Google Scholar] [CrossRef]
- Sala, R. Quantitative Evaluation of the Impact on Aral Sea Levels by Anthropogenic Water Withdrawal and Syr Darya Course Diversion During the Medieval Period (1.0–0.8 ka BP). In Socio-Environmental Dynamics along the Historical Silk Road; Yang, L.E., Bork, H.-R., Fang, X., Mishke, S., Eds.; Springer: Cham, Switzarland, 2019; pp. 95–121. ISBN 978-3-030-00727-0. [Google Scholar] [CrossRef]
- Aladin, N.V.; Plotnikov, I.S.; Micklin, P.; Ballatore, T. Aral Sea: Chapter: Water level, Salinity, and long-term changes in Biologicl communities of endangered ecosystem-pat, present and future. Nat. Resour. Environ. Issues 2009, 15, 36. [Google Scholar]
- Zohary, T.; Ostrovsky, I. Ecological impact of excessive water level fluctuations in stratified freshwater lakes. Inland Waters 2011, 1, 47–59. [Google Scholar] [CrossRef]


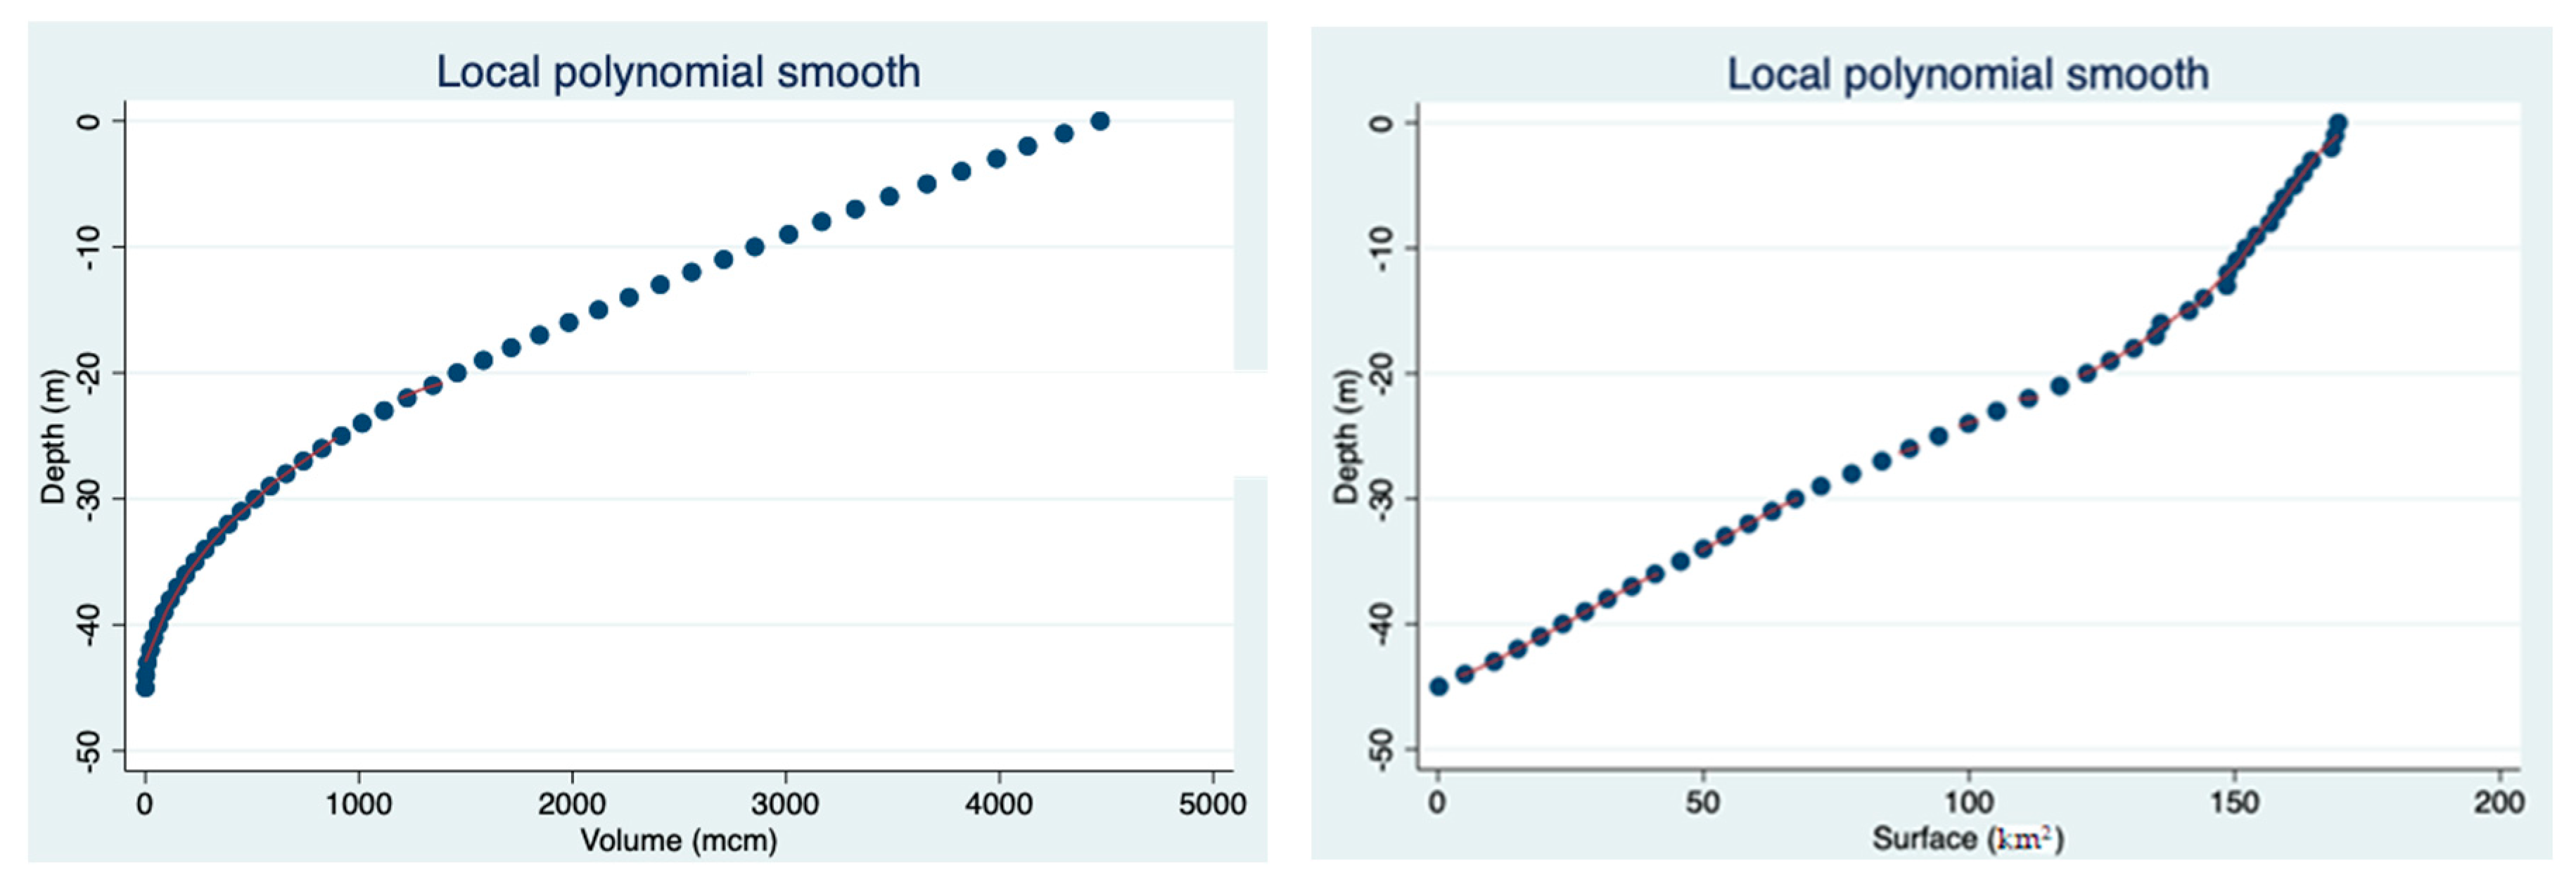
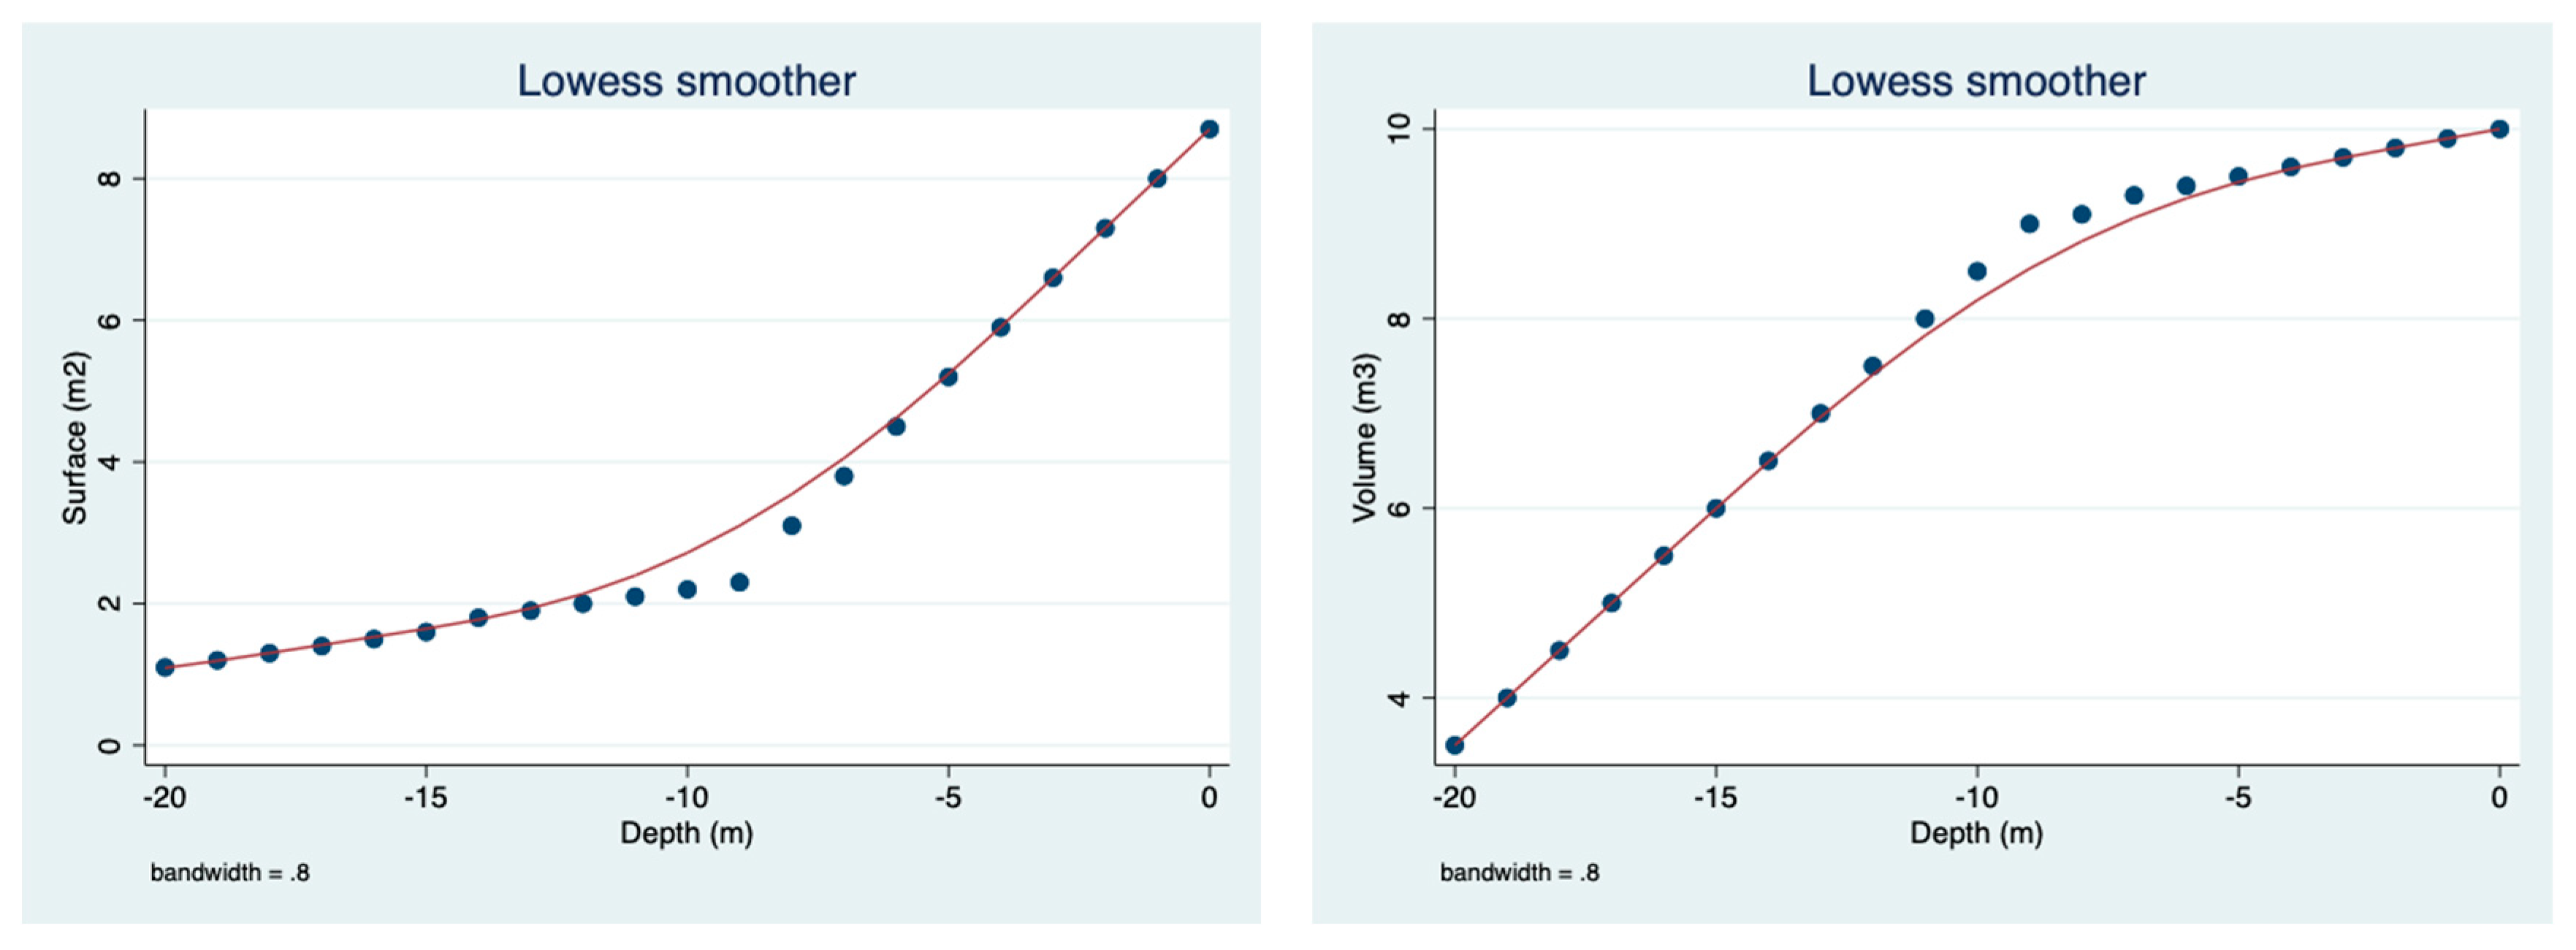
| Parameter | Units | Value |
|---|---|---|
| Water Surface | km2 | 169.5 |
| Maximum Depth (M), latitude | Meter mbsl | 48 256 |
| Mean Depth | Meter | 26 |
| Mean/Maximal depths Ratio | No dimension | 0.54 |
| Volume | km3 | 4.471 |
| Maximal Length | km | 22 |
| Maximal Width | km | 12 |
| Shore line length | km | 55 |
| Shore line development Value (D) | No dimension | 1.19 |
| Morphometric Parameter | Kinneret | Sevan |
|---|---|---|
| Surface | 6.55% | 12.7% |
| Volume | 22.7% | 43.8% |
| Maximal Depth | 12.8% | 19.6% |
Disclaimer/Publisher’s Note: The statements, opinions and data contained in all publications are solely those of the individual author(s) and contributor(s) and not of MDPI and/or the editor(s). MDPI and/or the editor(s) disclaim responsibility for any injury to people or property resulting from any ideas, methods, instructions or products referred to in the content. |
© 2023 by the author. Licensee MDPI, Basel, Switzerland. This article is an open access article distributed under the terms and conditions of the Creative Commons Attribution (CC BY) license (https://creativecommons.org/licenses/by/4.0/).
Share and Cite
Gophen, M. Historical Review on Water Level Changes in Lake Kinneret (Israel) and Incomparable Perspectives. Water 2023, 15, 837. https://doi.org/10.3390/w15050837
Gophen M. Historical Review on Water Level Changes in Lake Kinneret (Israel) and Incomparable Perspectives. Water. 2023; 15(5):837. https://doi.org/10.3390/w15050837
Chicago/Turabian StyleGophen, Moshe. 2023. "Historical Review on Water Level Changes in Lake Kinneret (Israel) and Incomparable Perspectives" Water 15, no. 5: 837. https://doi.org/10.3390/w15050837
APA StyleGophen, M. (2023). Historical Review on Water Level Changes in Lake Kinneret (Israel) and Incomparable Perspectives. Water, 15(5), 837. https://doi.org/10.3390/w15050837