Article

Effective Management Changes to Reduce Halogens, Sulfate, and TDS in the Monongahela River Basin, 2009–2019

1
School of Natural Resources, West Virginia University, Morgantown, WV 26506, USA
2
West Virginia Water Research Institute, West Virginia University, Morgantown, WV 26506, USA
*
Author to whom correspondence should be addressed.
Water 2023, 15(4), 631; https://doi.org/10.3390/w15040631
Submission received: 16 December 2022 / Revised: 26 January 2023 / Accepted: 31 January 2023 / Published: 6 February 2023
(This article belongs to the Section Water Quality and Contamination)

Abstract

:
The Monongahela River Basin has an extensive history of fossil fuel development, including coal mining and natural gas extraction. In late summer 2008, total dissolved solids (TDS) concentrations exceeding the United States Environmental Protection Agency′s (EPA) secondary drinking water standards were detected. After determining the source, a voluntary discharge management plan (VDMP) was developed by the West Virginia Water Research Institute (WVWRI) and implemented by the coal industry (2010). Additional remediation actions included Pennsylvania’s prohibition of produced wastewater in publicly owned treatment facilities (2011) and construction of a reverse osmosis treatment facility (2013). We used a locally weighted polynomial regression in conjunction with a segmented regression to assess the discharge and concentration trends/changepoints for bromide, chloride, sulfate, and total dissolved solids at various locations relative to the three remedial actions. We detected significant (α < 0.05) positive trends for discharge and significant negative trends for bromide, chloride, sulfate, and total dissolved solids. In conjunction, we also detected 1–4 changepoints within each model. Additionally, a linear mixed effects model containing discharge and remedial actions was used to measure the effectiveness of each remediation action in reducing TDS over time. Of the three remedial actions, the VDMP by itself was effective in maintaining river sulfate and TDS levels below the secondary drinking water standards (−0.12, p-value = 0.002). The combination of the VDMP with Pennsylvania’s produced water prohibition (−0.16, p-value < 0.001) and the combination of the VDMP with the reverse osmosis treatment facility (−0.19, p-value < 0.001) were also effective. The use of all three remedial actions produced the strongest effect (−0.37, p-value < 0.001) Since the implementation of these changes, primarily the VDMP which encompasses most of the watershed, TDS in the Monongahela has not exceeded the EPA′s secondary drinking water standards. Future management decisions should include efforts to further expand the VDMP and to monitor changes in land use or severe changes in discharge.

1. Introduction

The Monongahela River Basin, a 19,104 square kilometer watershed spanning northcentral West Virginia, southwestern Pennsylvania, and western Maryland, has supported a variety of industrial uses throughout its history, most notably historic and present-day coal mining and contemporary oil and gas development. Mine discharges are major sources of sulfate and other salts in the Monongahela River Basin, while oil and gas developments are a major source of halogens such as chloride and bromide. The extent to which these industries have contributed to total dissolved solids (TDS) loading in the Monongahela River is of interest to researchers and water managers. Elevated TDS within the Monongahela River has been shown to impact drinking water during low-flow events [1]. Historically, TDS concentrations in the Monongahela River have exceeded the secondary drinking water standard of 500 mg/L only when flow drops below 2000 cubic feet per second based on United States Geological Survey (USGS) flow data that were collected near Masontown and Elizabeth, PA. In late 2008, TDS began trending upward in the Monongahela River [2].
Prior to 2008, most of the mine drainage entering the Monongahela River came from deep mine discharges or surface mine seeps at pre-law abandoned mine sites [3,4]. Acid mine drainage (AMD) contains large quantities of TDS, including sulfate, calcium, magnesium, sodium, iron, aluminum, and manganese [5]. Active mines must treat discharged water to remove metals and neutralize acidity. However, treatment processes do not generally remove calcium, sodium, and sulfate ions. In this way, treated mine drainage also contributes to the Monongahela River′s TDS load. Drought conditions that result in low flows often exacerbate the problem by reducing the river′s assimilative capacity when mine discharges are not regulated by seasonal variations in flow [6]. Another potential source of TDS in the Monongahela River Basin is natural gas development which rapidly expanded starting in 2008. Notably, unconventional natural gas development, which utilizes horizontal drilling and hydraulic fracturing to target and extract natural gas from both the Marcellus and Utica Shale formations, has become more prevalent throughout the region right around the same time TDS began trending upwards [2].
In the late fall of 2009, the West Virginia Water Research Institute (WVWRI) sampled the Monongahela River and its major tributaries and determined that active deep coal mines were the most easily managed component of the TDS problem. WVWRI began working with major coal companies in the Upper Monongahela River Basin to implement a voluntary discharge management plan. The model accounted for the pumping capacities of the 14 major mine pumping and treatment plants in the Upper Monongahela River Basin using typical TDS concentrations as well as the flow in the Monongahela on any day [7]. It was designed to ensure the Monongahela River′s mainstem would not exceed the secondary drinking water standards for sulfate or TDS (250 and 500 mg/L, respectively). Operators of mine discharge treatment facilities voluntarily implemented discharge management in January 2010 and continue to this day.
In addition to AMD, a new source of TDS was emerging with the rapid expansion of unconventional oil and gas production in the Monongahela River Basin. From 2009 to 2011 there was sufficient evidence showing that the produced water from unconventional gas extraction was degrading surface waters and elevating TDS in Pennsylvania [2]. The point source for the degradation was identified as centralized publicly owned treatment works not being able to properly treat the produced water and discharging untreated wastewater into surface waters [8,9]. Contained within this produced water is a mixture of brine, toxic metals, and radioactive elements including chloride and bromide ions, which severely damage aquatic ecosystems [1,8,10]. The presence of chloride and bromide in source water can contribute to higher levels of disinfection byproducts such as trihalomethanes (THMs) and haloacetic acids in drinking water [11,12]. In addition, bromide in source waters can lead to a shift toward more carcinogenic brominated THM forms [13].
As a response to the disposal of produced water in publicly owned treatment works, the Pennsylvania state legislature passed a new regulation that went into effect on 1 May 2011, restricting the disposal of produced water into new public treatment facilities to eliminate produced water from making its way into Pennsylvania rivers and lakes [14]. Pennsylvania discharges of inadequately treated produced water ultimately contributed to higher TDS and bromide levels in the Pennsylvanian portion of the Monongahela River Basin before 2011 [15]. Prohibiting the improper disposal of produced water into publicly owned treatment works is likely to have helped alleviate some of the problems, but to what extent is currently unknown.
Another key point took place in the fall of 2009 at Dunkard Creek, a tributary of the Monongahela River, where a combination of low flows and disastrously high TDS concentrations resulted in a devastating fish kill. Improper disposal of produced water within deep mines and exceedingly low flows combined with traditional AMD discharges in Dunkard Creek led to a golden algae (Prymneisum parvum) bloom [16]. Nearly 30 miles of Dunkard Creek was impacted leading to the death of many aquatic organisms including 18 species of fish and 14 species of freshwater mussel [17,18].
Following the Dunkard Creek fish kill investigation, a coal mining company, which operates several active coal mines, was ultimately held responsible for the fish kill. The mining company was then tasked with constructing a new reverse osmosis treatment facility as a part of the legal settlement between the company and the PADEP [19]. The established AMD treatment facilities previously discharged their treated wastewater into smaller tributaries of the Monongahela River including Dunkard Creek. These tributaries flowed into the Monongahela River at various points spanning from the confluence of the Monongahela up to the West Virginia-Pennsylvania state border [20] (Figure 1). Construction of the new reverse osmosis treatment facility was completed in May 2013 with a stated objective of treating chloride content in receiving waters. Reverse osmosis treatment facilities are capable of desalinating and purifying waters that have been polluted because of fossil fuel extraction. Unlike passive treatment systems which typically use settling ponds and wetlands to naturally remove contaminants, reverse osmosis plants actively remove contaminants by forcing water through various types of semi-permeable membranes. Reverse osmosis can remove low molecular weight organics, multivalent ions, and monovalent ions which include sulfate, chloride, bromide, and other salts and metals that contribute to TDS [21,22,23]. TDS levels in the Monongahela River Basin have since decreased from their peak in 2008 and 2009, however to what extent the reverse osmosis facility has contributed to this decline is not currently known.
In this study, we seek to evaluate the effectiveness of the voluntary discharge management plan in maintaining compliant TDS and sulfate concentrations in the Monongahela River. We also seek to evaluate the impacts of the Pennsylvania legislature restricting produced water in publicly owned treatment works and the reverse osmosis treatment plant. We attempted to quantify the trends and inflection points caused by the management decisions regarding the concentrations of halogens, bromide, and chloride, as well as the concentration of sulfate and TDS that result from the coal and natural gas industries in the Monongahela River and its tributaries from 2009 to 2019.

2. Materials and Methods

2.1. Study Area

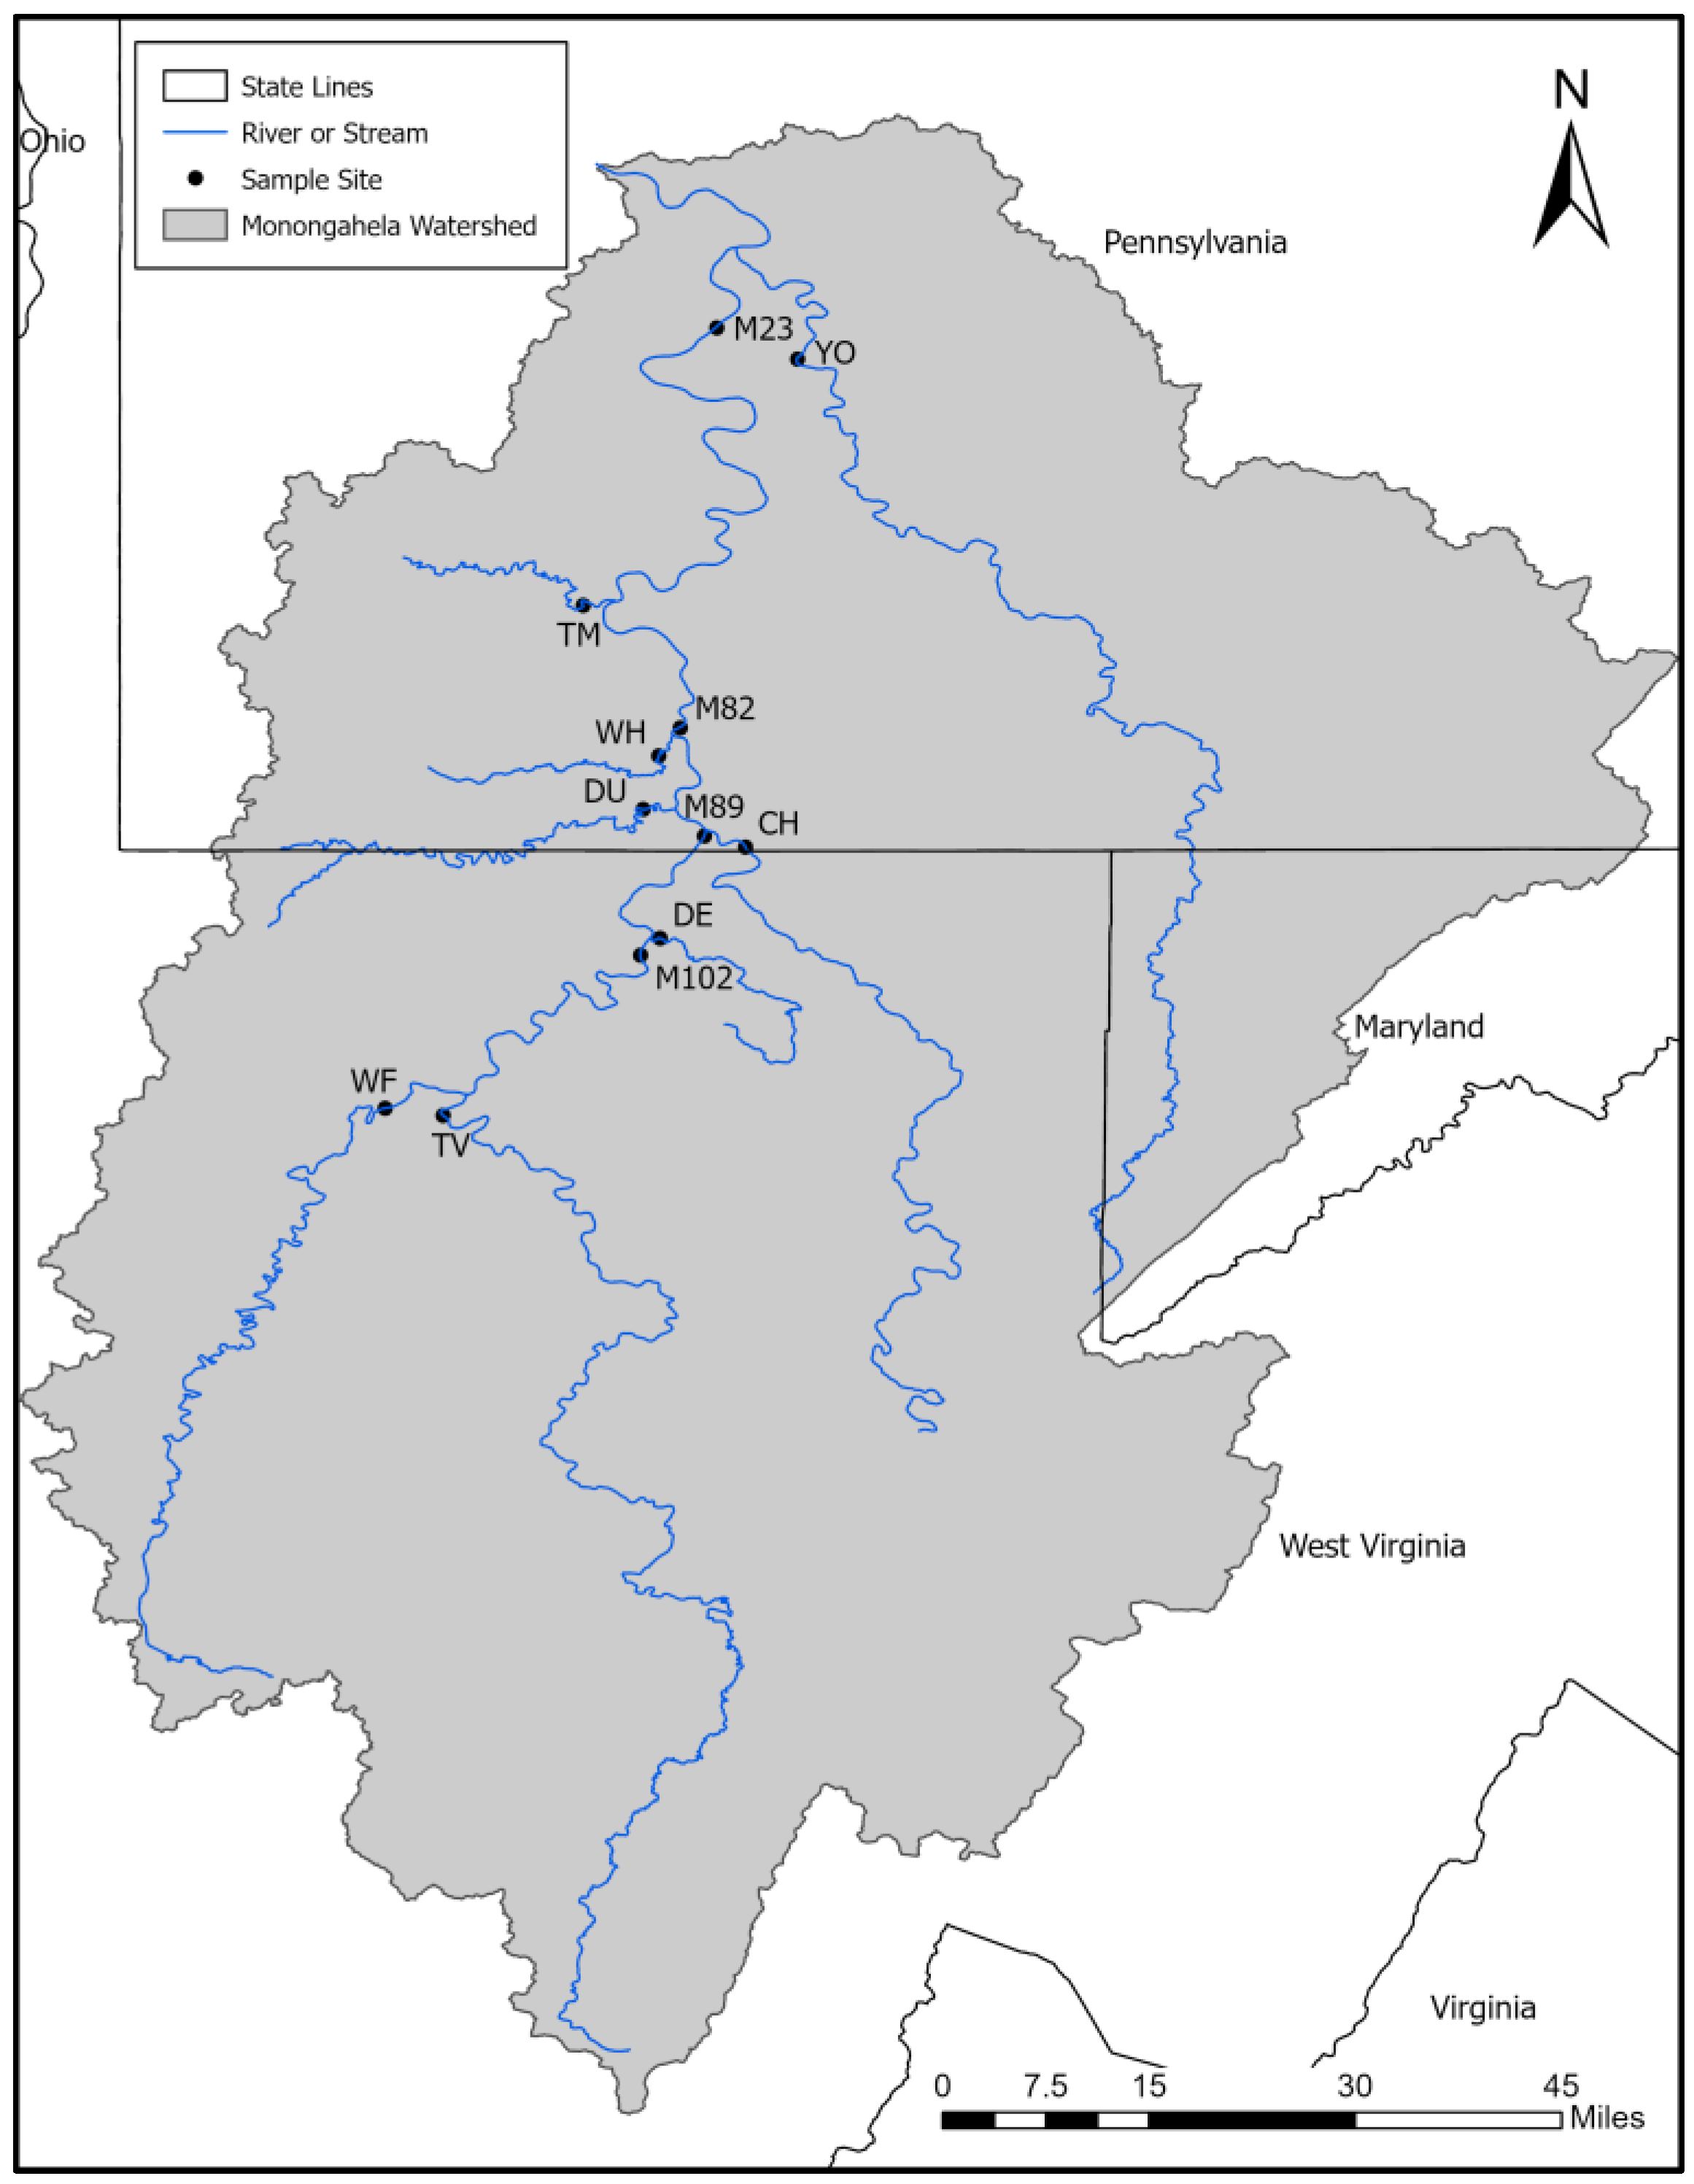
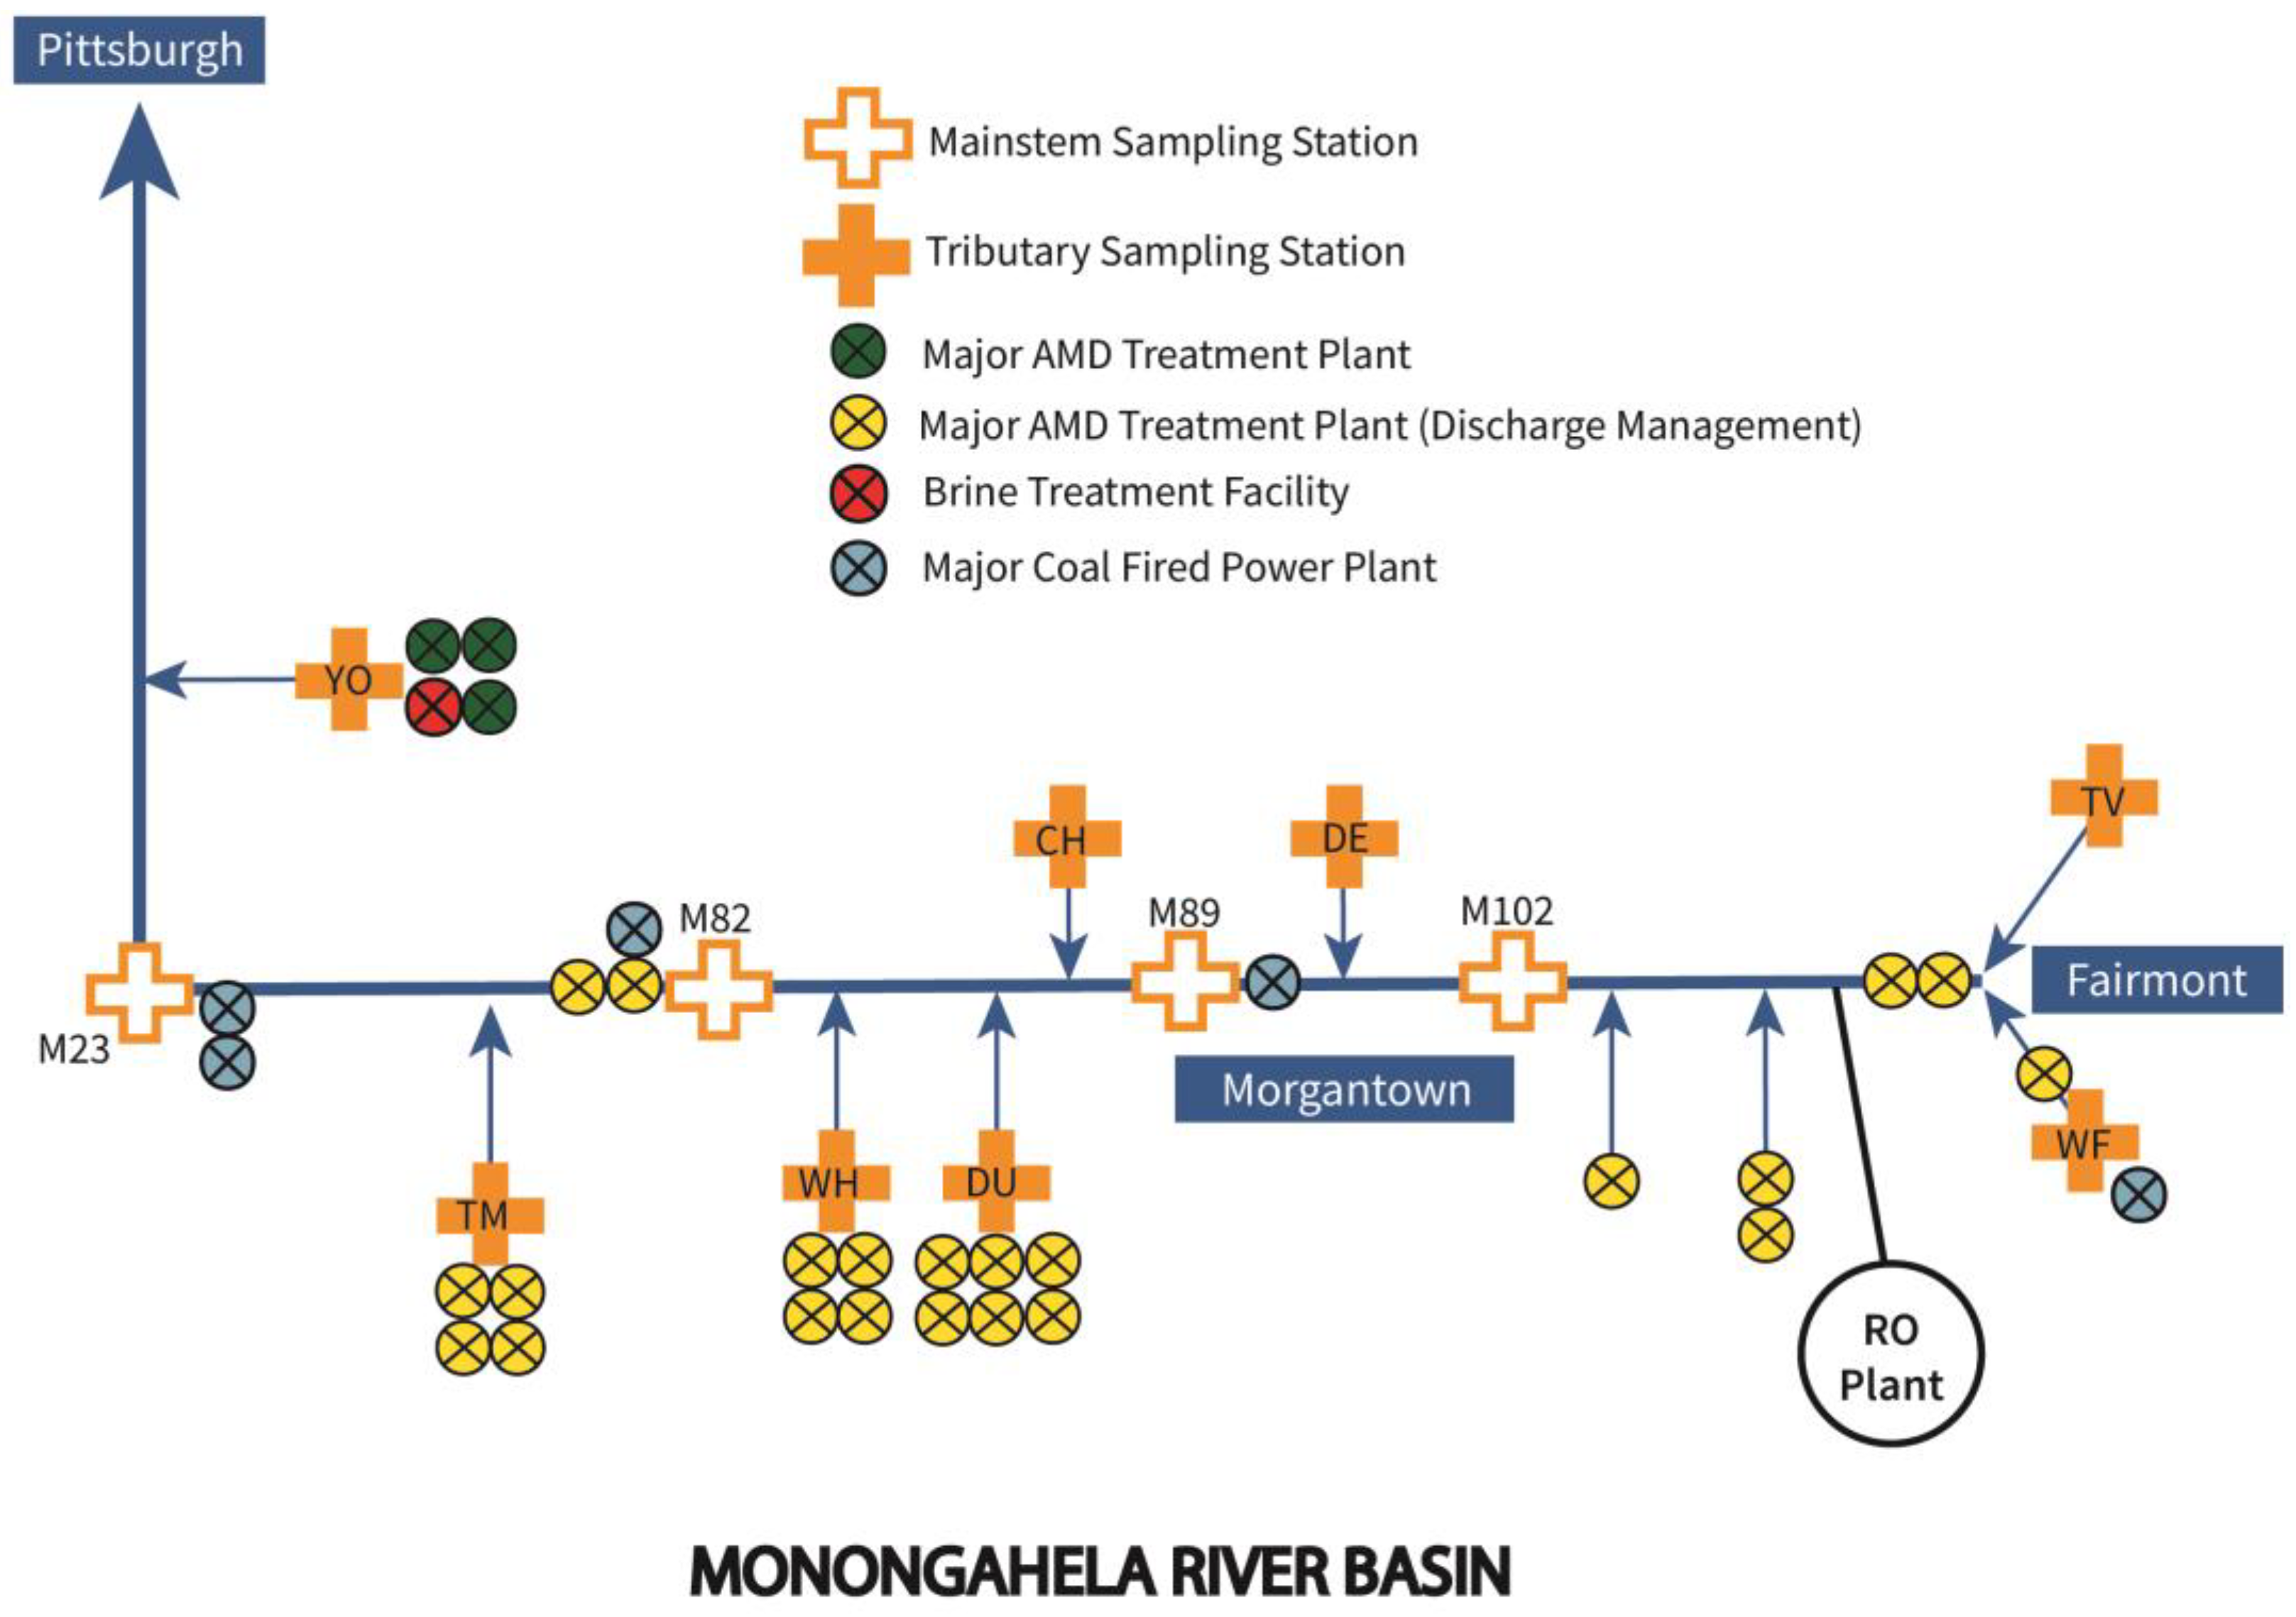
Sampling sites were located throughout the Monongahela River basin which includes a drainage area of 19,104 square kilometers. The Monongahela River forms at the confluence of the West Fork and Tygart Valley rivers in Fairmont, WV, and flows northward 206 km to the confluence with the Allegheny River whereby it flows into the Ohio River in Pittsburgh, PA [24]. Of the 18 sites that are currently sampled within the Three Rivers Quest (3RQ) monitoring program, we selected 12 sites with datasets dating back to the summer of 2009. The reason for this date criterion is based on the voluntary discharge management plan initiation date of January 2010. Out of these 12 sites, 6 are located on the Monongahela River itself or the rivers that form the confluence while the other 6 sites are distributed among key tributaries (Figure 2). The mainstem and the tributaries of the Monongahela River are subject to coal mine AMD, and more recently unconventional gas extraction. Located throughout the Monongahela River basin is a network of private and state-run treatment facilities. The predominant treatment facilities are AMD treatment sites, many of which are enrolled in the voluntary discharge management plan (Figure 3). Other land uses within the Monongahela River basin that have potential impacts include agriculture and general urbanization.

2.2. Data Collection

2.2.1. Water Quality Data

Water samples and water quality parameters were collected and measured twice a month from July 2009 to April 2015. Beginning in May 2015, sample collection was reduced to once a month and took place between the 10th and 20th day of each month. We attempted to consistently collect water samples when the river/stream discharges were near their 30-year median as determined by the USGS.
At each site, 2 water samples were collected, one in a 500 mL unfiltered, unpreserved grab sample and a second 250 mL bottle with ~10 drops of nitric acid as a preservative. Prior to adding the raw water sample to the acidified bottle, the water was filtered using a Nalgene vacuum filtration device (Fisher Scientific) with 47 mm diameter, 0.45 µm pore cellulose filter papers (Millipore). All water samples were placed inside a cooler that was filled with ice and transported to either the laboratory for analysis or placed in a refrigerator until they were ready to be analyzed. Water samples were analyzed for dissolved alkalinity (mg/L CaCO3 equivalents; EPA method SM-2320B); dissolved Al, Ca, Fe, Mn, and Na (mg/L; EPA method 60140B); and dissolved Br, Cl, and SO4 (mg/L, EPA method 300). Temperature (Celsius), specific conductivity (µS/cm), pH, and calculated total dissolved solids (mg/L) were collected in the field via handheld water probes (YSI 556 and YSI Professional Series).

2.2.2. Hydrologic Data

Discharge (f/s3) data were obtained from nearby USGS gauges at the time of sample collection. When direct gauge measurements were not available at a site, flow was estimated by averaging flow between an upstream and downstream gauge (Table 1).

2.3. Statistical Analyses

2.3.1. Water Quality Characteristics

Summary statistics, average, and standard deviation, were calculated for flow, bromide, chloride, sulfate, and TDS. Summaries were done on a site-by-site basis to show the variability among the mainstem and tributary sites.

2.3.2. Locally Weighted Polynomial Regression (LWPR)

Trend analyses are often used to determine if the measured water quality parameter is increasing or decreasing over a specified period. The basic linear trend model for a water quality series WQi is:
WQi = αti + β +εi
where ti is time, α is the regression coefficient indicating the slope of the line, β is the regression constant, and εi is an irregular noise term. LWPR uses either a local linear polynomial regression or a local nonlinear regression model depending on the circumstances [25]. For this study, a local linear polynomial regression model was used. The LWPR equation for all water quality series WQi is:
WQi = f(ti) + εi
where f(ti) is a smoothed function and εi is an irregular noise term. LWPR was applied to all parameters within the dataset with local polynomial fits being first or second order using weighted least squares. This method gives more weight to points near the point whose response is being estimated and less weight to points that are further away [26]. Traditionally, the weighted function is the tricube weight function, but other functions are suitable if they meet the requirements. Additional information on the LWPR method that was used in this study can be found in Rajagopalan and Lall [27], and Proiettie and Luati [28]. We fitted the LWPR models in R using the “stats” package [29].

2.3.3. Segmented Regression (SegReg)

Segmented regression, also known as piecewise regression or broken-stick regression, is commonly employed with interrupted time series. While often employed in other fields of study such as political science, economics, and healthcare, segmented regression has shown to also be effective at evaluating the effectiveness of environmental pollution control measures [30,31,32]. Each segment in a segmented regression is separated by breakpoints (i.e., changepoints) with the least squares method being applied separately to each segment and optimized to minimize the sum of squares of the differences (SSD). For a water quality time series WQi with m change-points (CPs), a segmented linear regression with m + 1 is depicted as:
{ W Q i = α 1 t i + β 1 ( t i C P 1 ) W Q i = α 2 t i + β 2 ( C P 1 < t i C P 2 ) W Q i = α m + 1 t i + β m + 1 ( t i C P m ) ,
where ti represents time, αm represents the regression coefficient for each line segment, and βm is the regression constant. A positive α is indicative of an increasing trend while a negative α is indicative of a negative trend. To assess the overall trend, the average annual percent (AAPC) was calculated for each model based on the slopes of each segment and weighted based on the lengths of each segment [33]. Davies statistical test was used to determine the statistical significance of trend for each segmented regression model [34]. The adjusted R-squared value was also used to evaluate the model fit for each regression model. Models were fitted and evaluated in the statistical program R using the “segmented” package [35]. Additional information regarding segmented regression can be found in Mathews and Hamilton [36], Wu and Chang [37], and Muggeo [38].

2.3.4. Linear Mixed Effect Model

In addition to the LWPR-SegReg models, we also used a linear-mixed effect model to quantify the effect of management changes on TDS within the Monongahela River Basin. Discharge and TDS were log[x] transformed to achieve approximate normality. By including a random effect structure, we were able to account for site-specific characteristics that could potentially affect TDS on a site-by-site basis [39]. This was especially crucial given that not all management changes of interest were applied to all sites of interest. Furthermore, this modeling approach enabled us to determine the effectiveness of single management changes against the effect of several management changes. The optimal model was selected by comparing the global model to all possible parameterized models where we retained models with a ΔAIC > 2 [40]. We also assessed model performance by comparing marginal (variance explained by fixed effects) and conditional (variance explained by fixed and random effects) coefficients of determination (R2). Reported p-values are based on Satterthwatie′s degrees of freedom method [41]. A similar approach has been used for predicting TDS based on discharge [6]. In addition, models that failed to properly converge, were unstable, or displayed singular boundary issues were disregarded. The ‘lme4’ [41] and ‘lmerTest’ [40] packages were used to create and extract model statistics. The ‘MuMIN’ package was used for model selection and for the calculation of R2 values [42]. All analyses were performed in the Program R [29].

3. Results

3.1. Water Quality Characteristics

There was a high degree of variability in flow and concentration within and among the mainstem sites (Table 2). The mean flow steadily increased downstream with a range of 4003–9192 cfs. The maximum average for flow occurred at M23 (9192 cfs) which is the furthest downstream site among the mainstem sites. The mean bromide concentrations ranged between 0.01 and 1.01 mg/L across all sites. WH, TM, and DU reported the three highest average bromide values of 0.37, 0.35, and 1.01 mg/L, respectively. The mean chloride concentrations varied greatly from site to site (range = 3.5–132.9 mg/L) with the largest mean chloride concentrations occurring at WH, YO, and TM with values of 132.9, 59.5, and 57.3 mg/L, respectively. For sulfates, the mean concentrations throughout all sites ranged from 24.8 to 692.4 mg/L with the highest means recorded on DU (692.4 mg/L), WH (607.8 mg/L), and WF (190.0 mg/L). The mean TDS concentrations also varied greatly between each site with a range of 51.0–966.75. WH and DU displayed the largest mean TDS concentrations compared to all other sites with mean values of 966.8 mg/L and 922.5 mg/L, respectively.

3.2. LWPR-SegReg Concentration Results

The LWPR-SegReg analysis of the concentration data resulted in the creation of 60 segmented regression models across 12 sites with each site containing a discharge, bromide, chloride, sulfate, and TDS segmented regression model (Appendix A and Appendix B). Within every LWPR-SegReg model, at minimum one breakpoint was identified and each segment was assigned a slope value with the overall trend being measured as average annual percent change (AAPC). Each model returned the estimated date(s) of the changepoint(s), the p-value as determined by Davie’s test, and the adjusted R-squared value (Table A1 and Table A2).
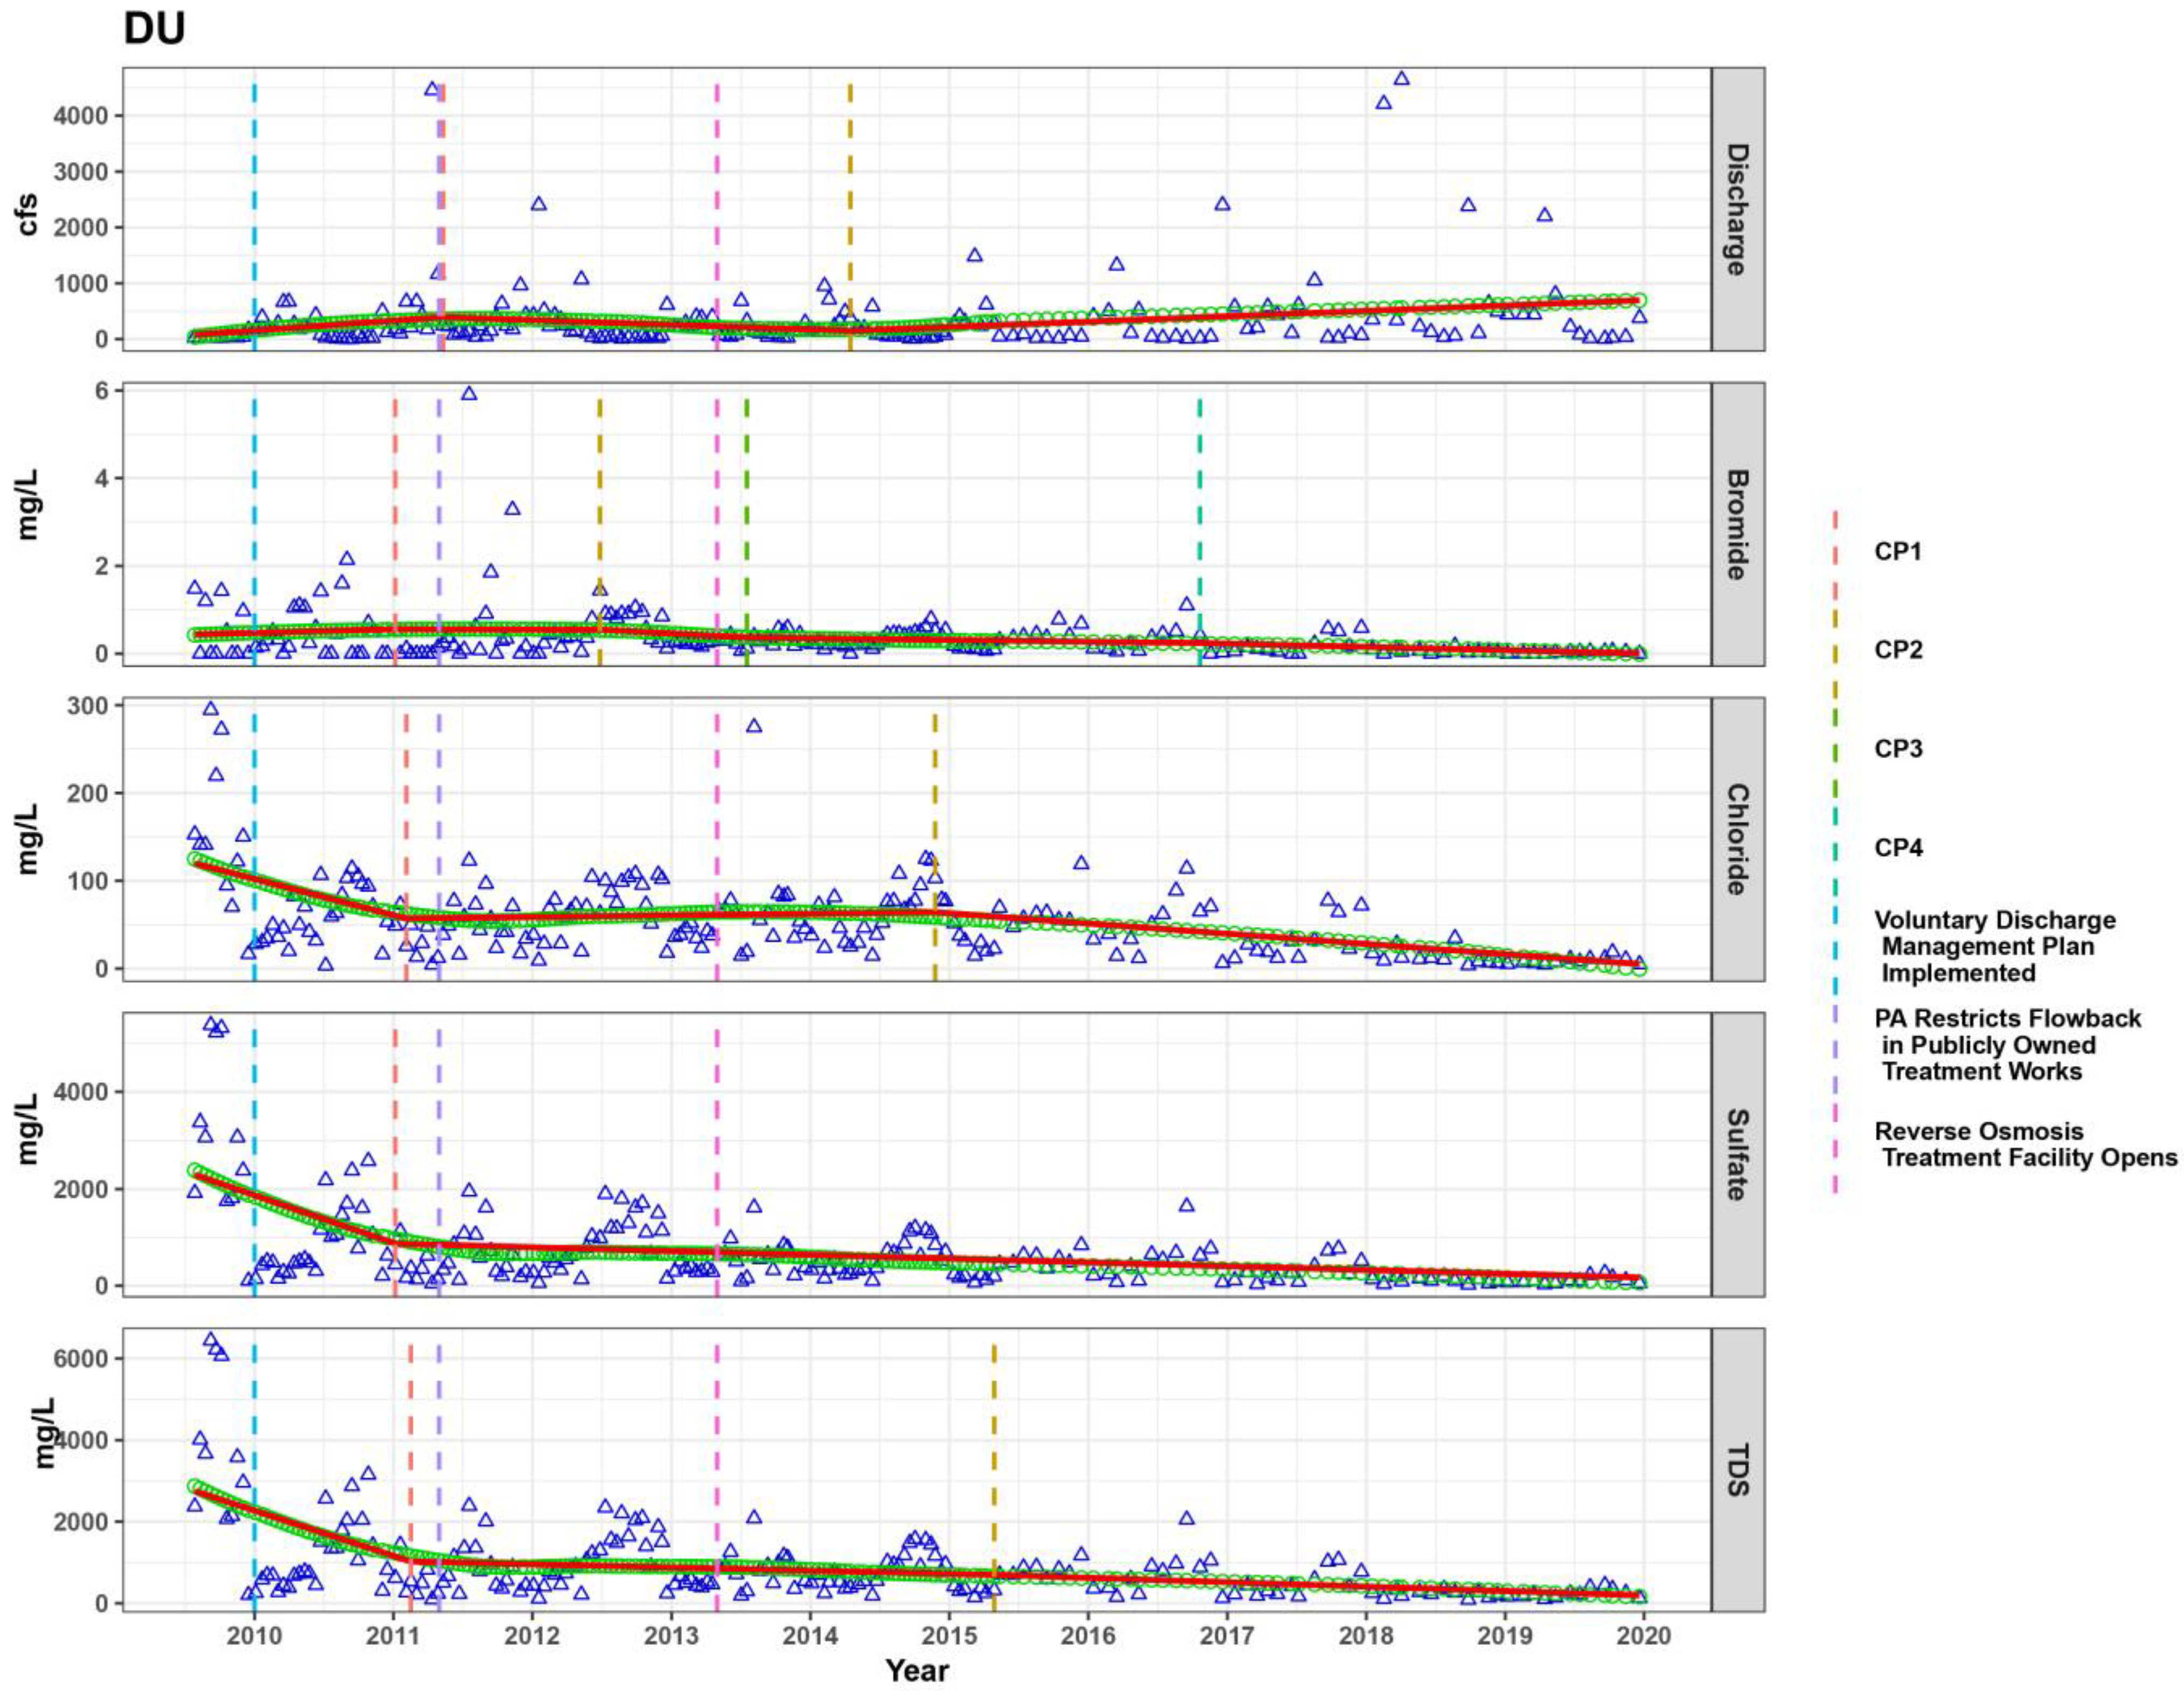
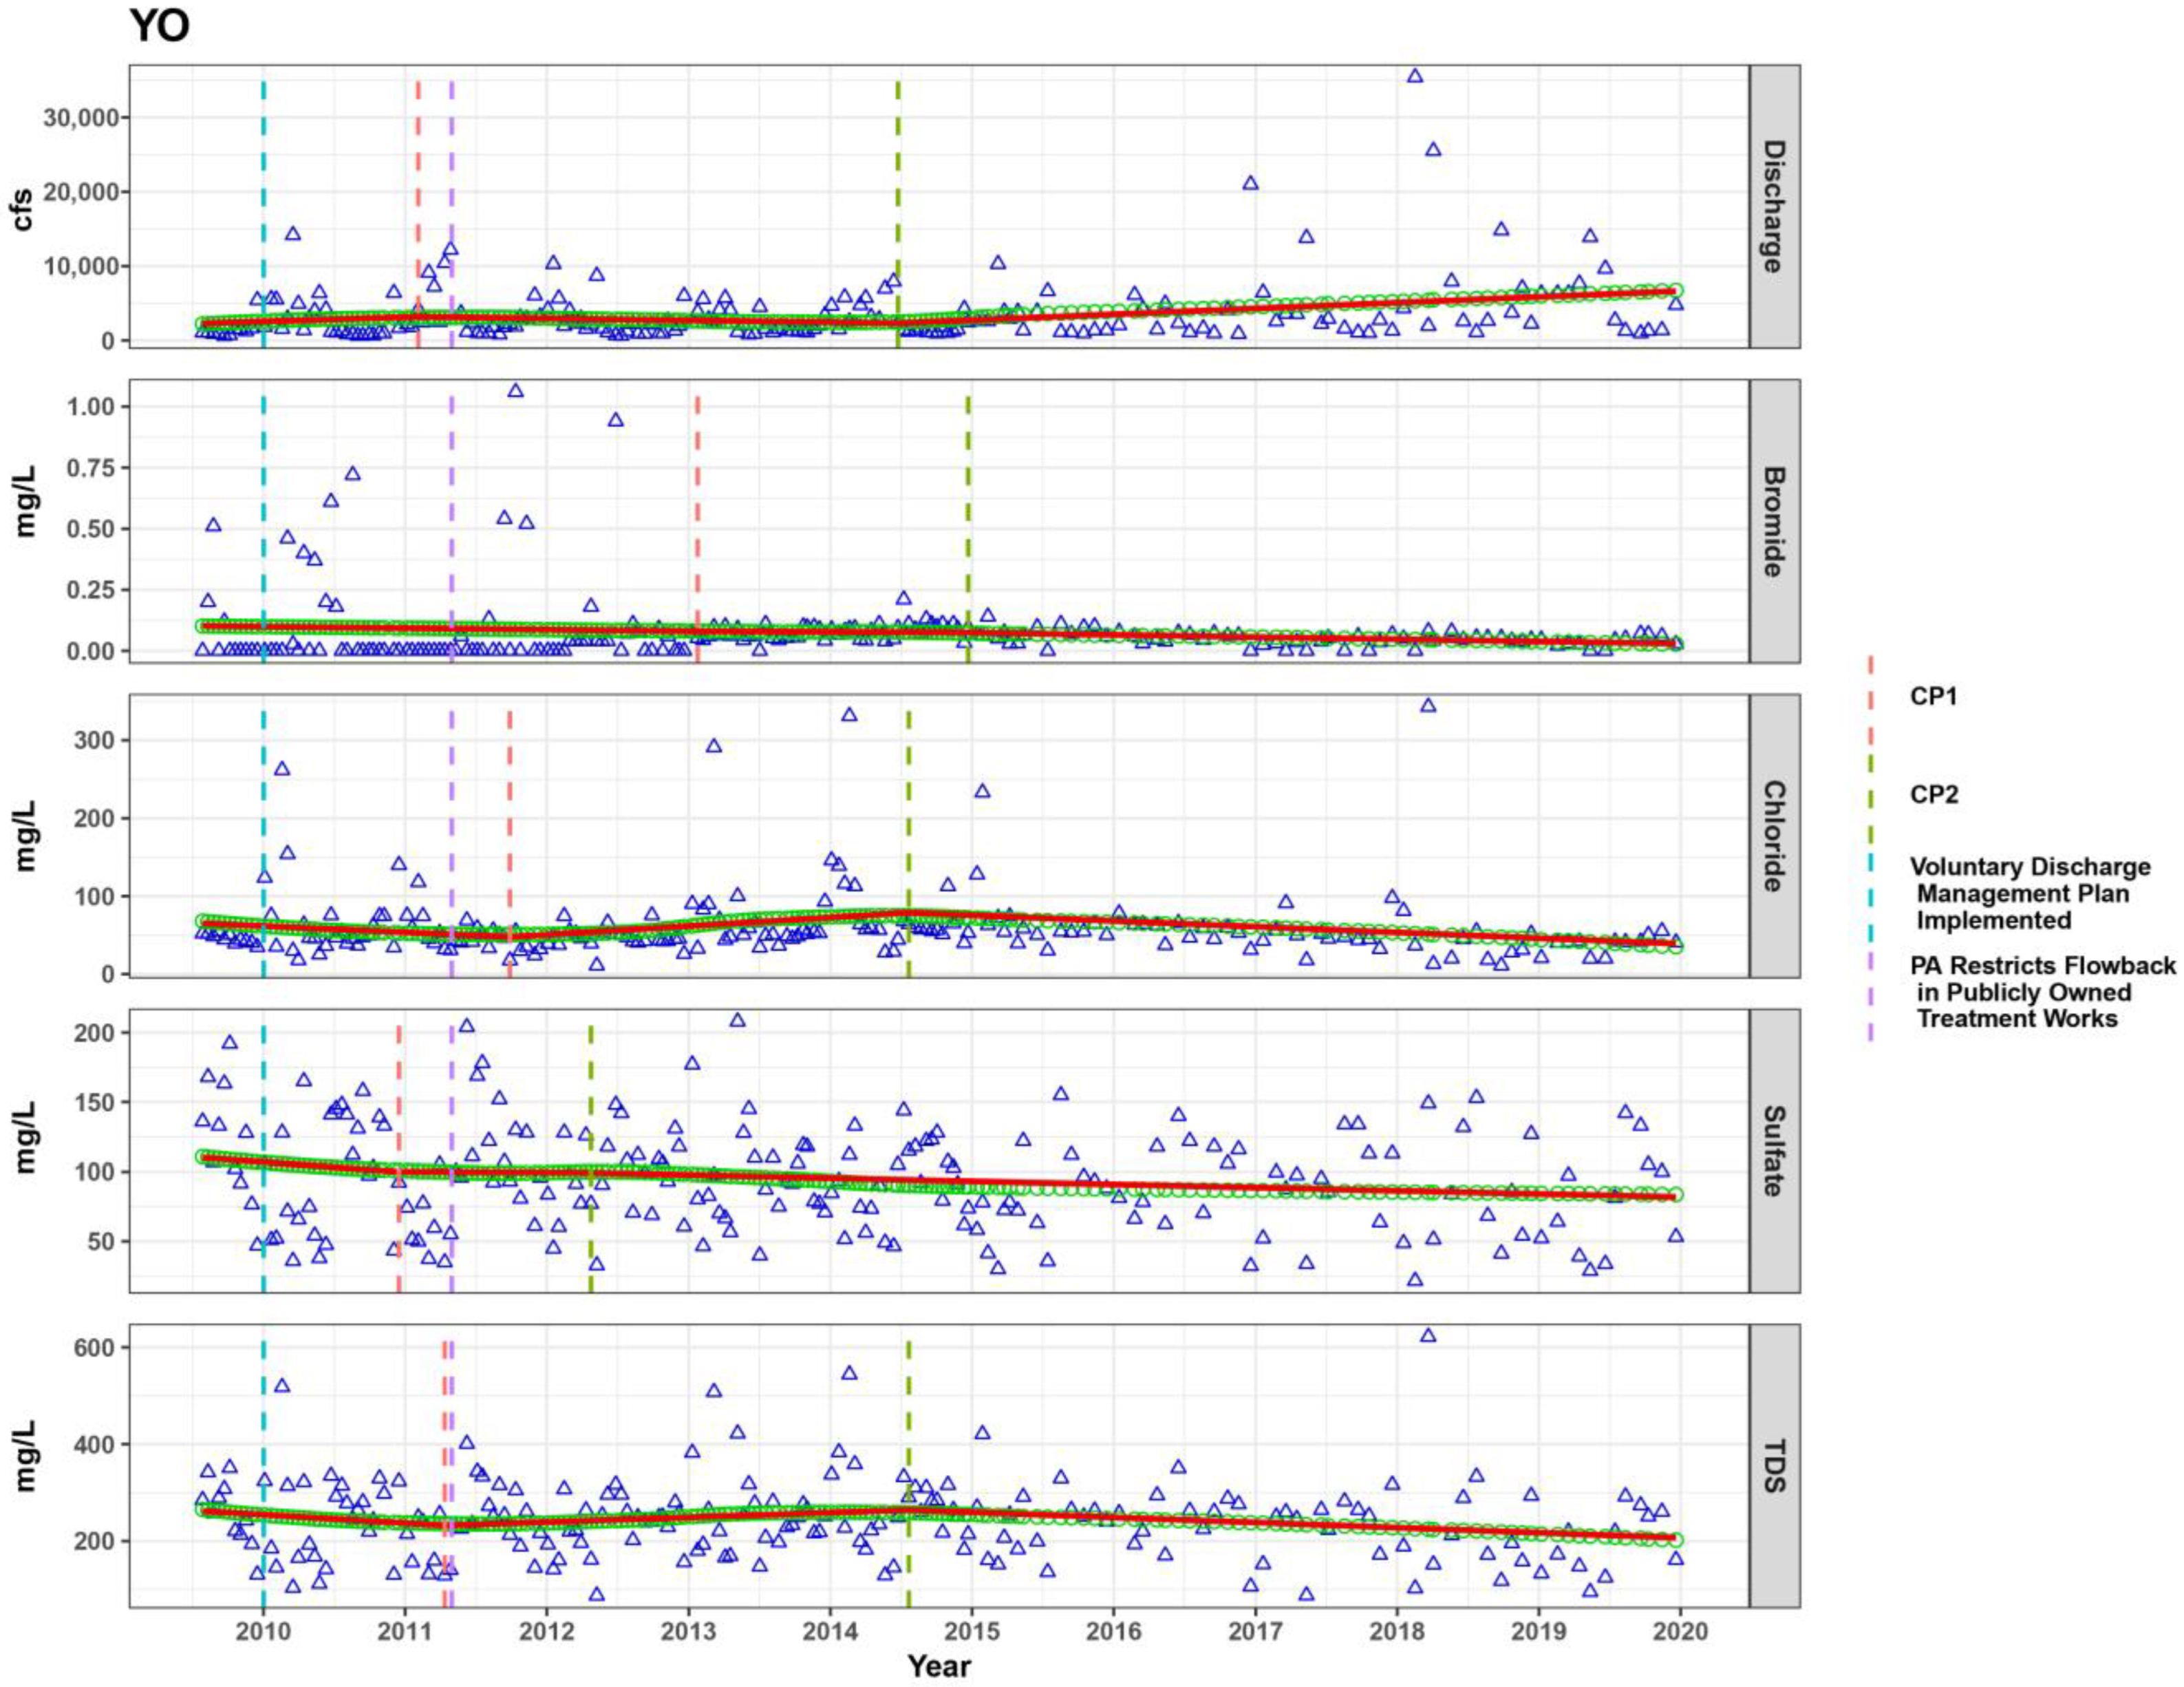
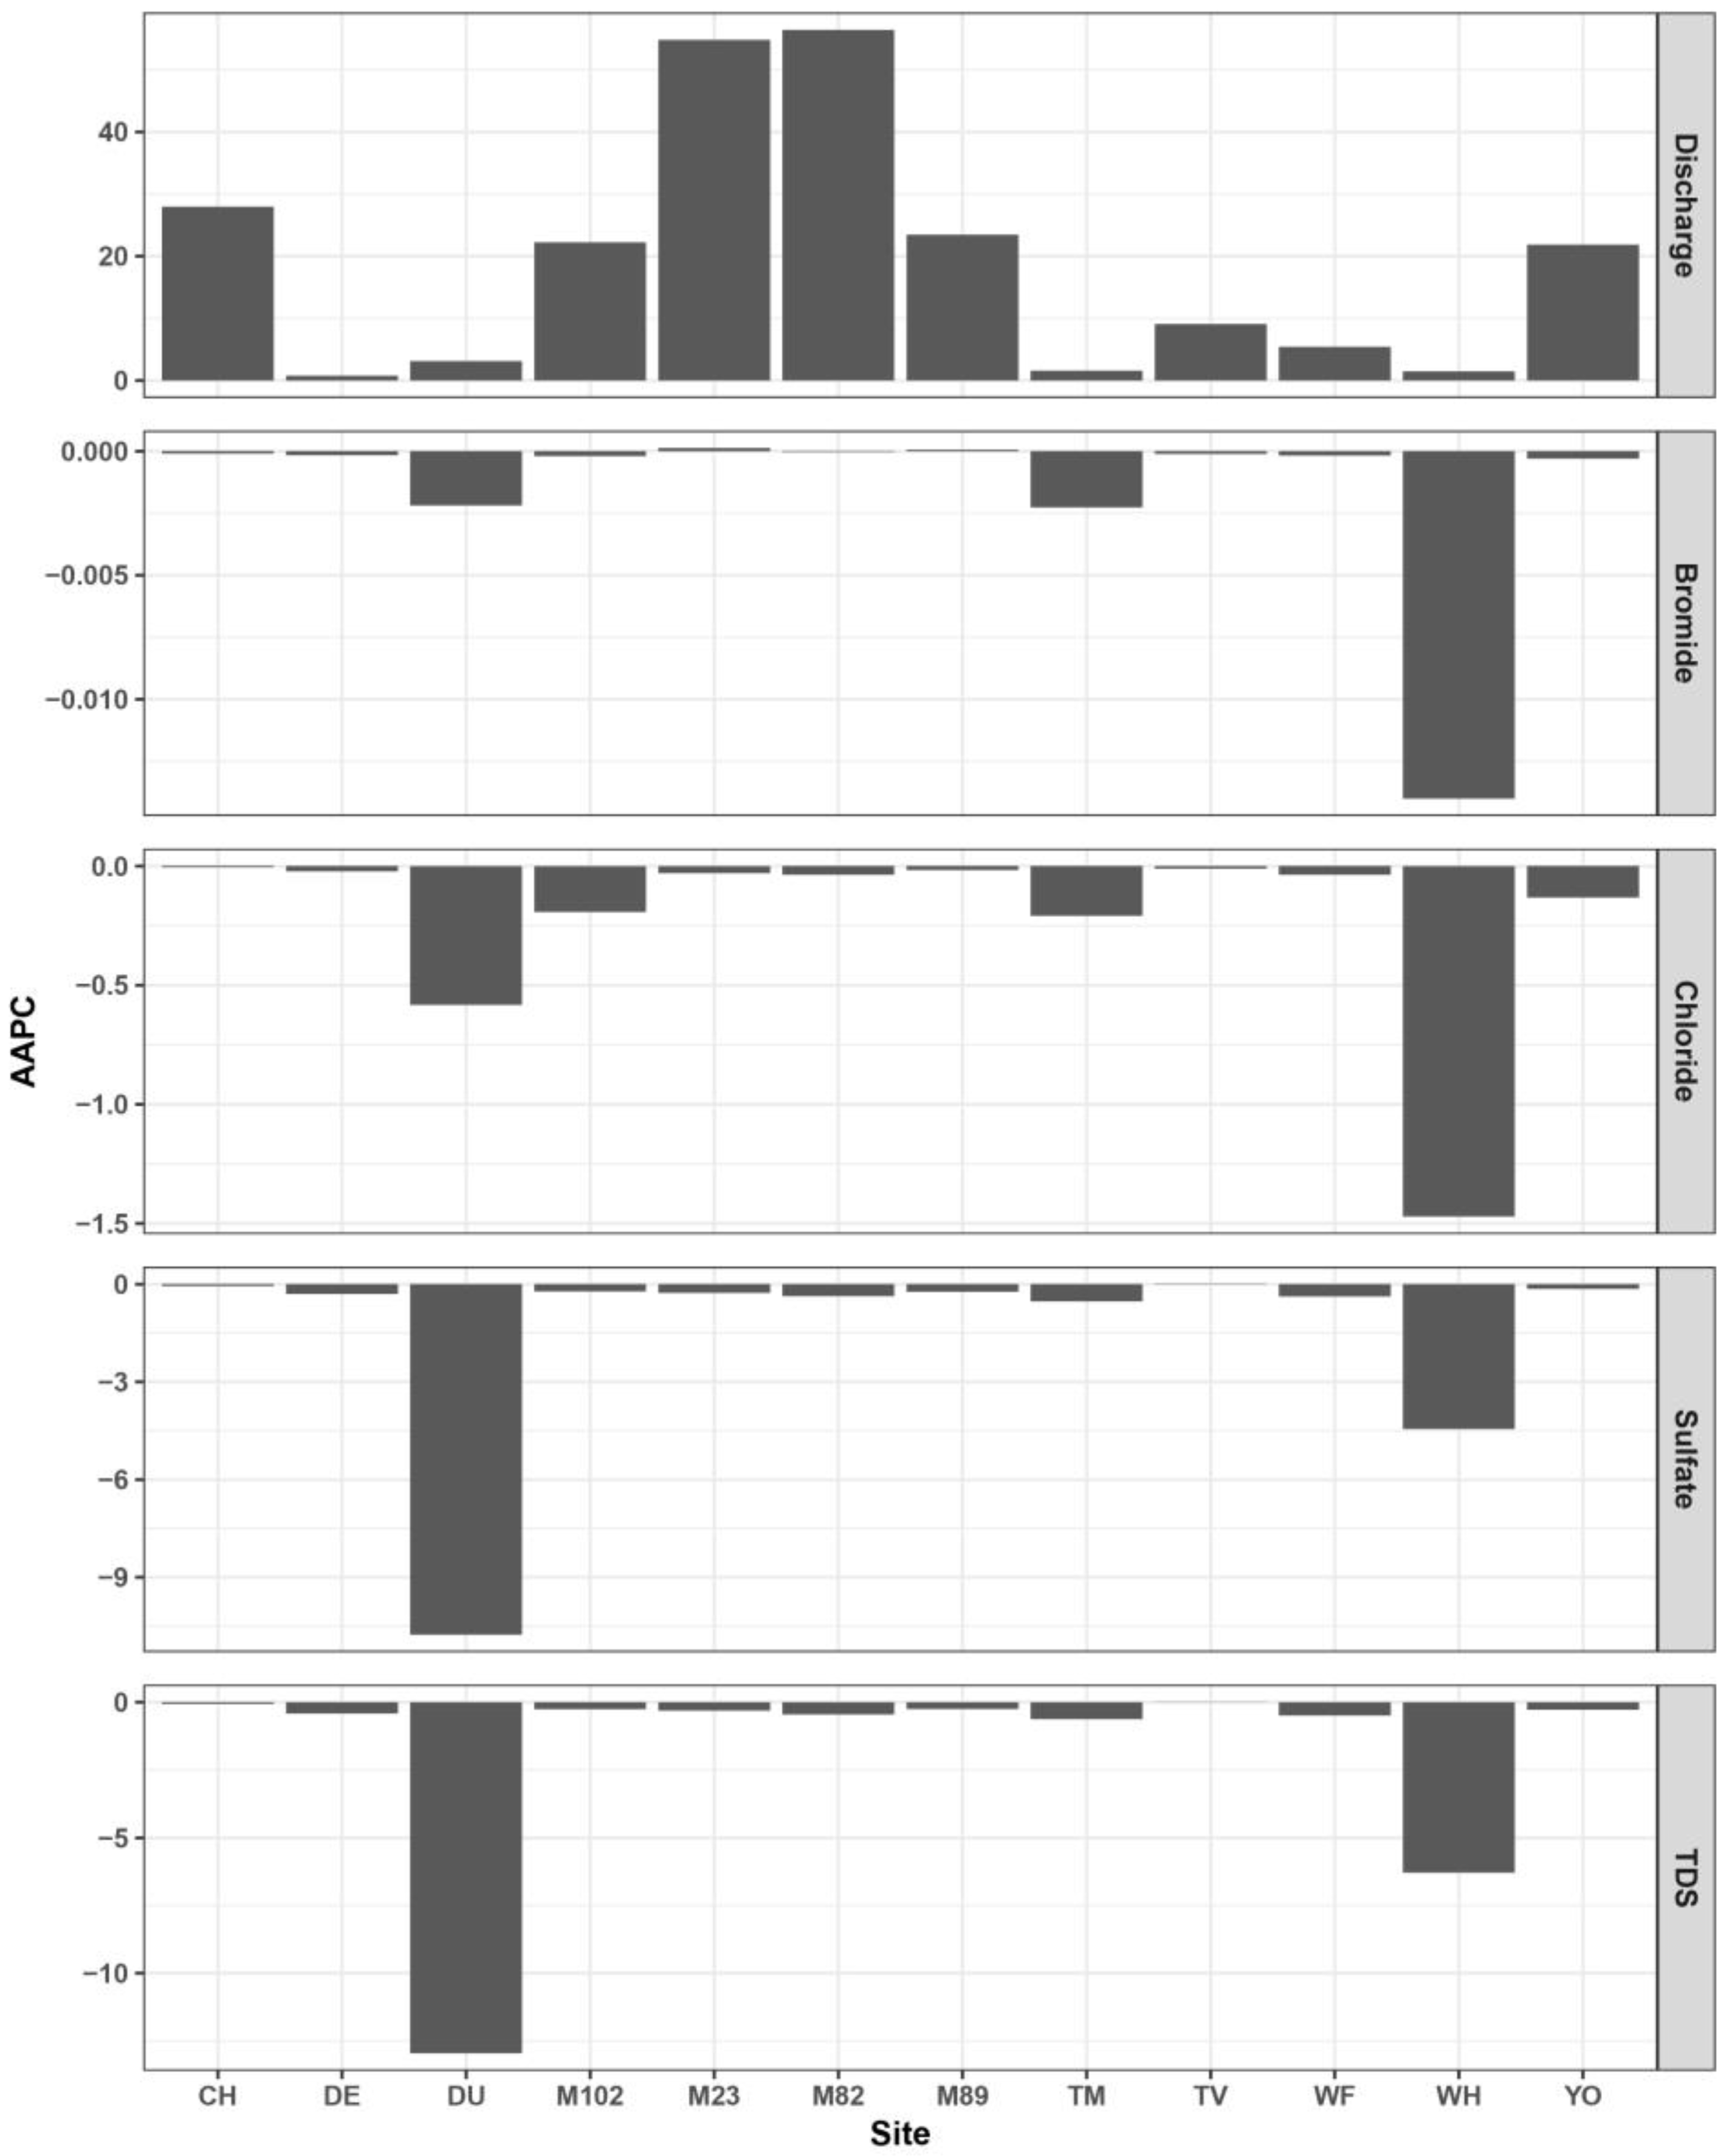
All concentration segmented regression models displayed significant trends with the alpha level being set at 0.05 (p-values ≤ 0.001). Following LWPR smoothing, the segmented models explained between 96 and 99% of variation. The AAPC values for discharge among all the mainstem sites were positive (range = 5.41–56.40) and the AAPC values for the tributary sites were also entirely positive (range = 0.76–27.97). Bromide AAPC among the mainstem sites presented negative values at M102 (−0.0002), M82 (−0.0003), TV (−0.0001), and WF (−0.0002) and positive values at M89 (0.0001) and M23 (0.0001). Additionally, bromide AAPC values for all tributaries were negative (range = −0.014–−0.0001). Chloride AAPC values were negative across all the mainstem and tributary sites (range = −1.47–−0.005). Sulfate AAPC values displayed negative values across all the sample sites (range = −10.761–−0.012) with DU (−10.761) displaying the largest negative AAPC value by far. Finally, TDS AAPC followed the same pattern as sulfate and chloride with negative values at all sites (range = −12.961–−0.012) with DU (−12.961) and WH (−6.281) possessing the largest negative values by far compared to all other sites (Figure 4).
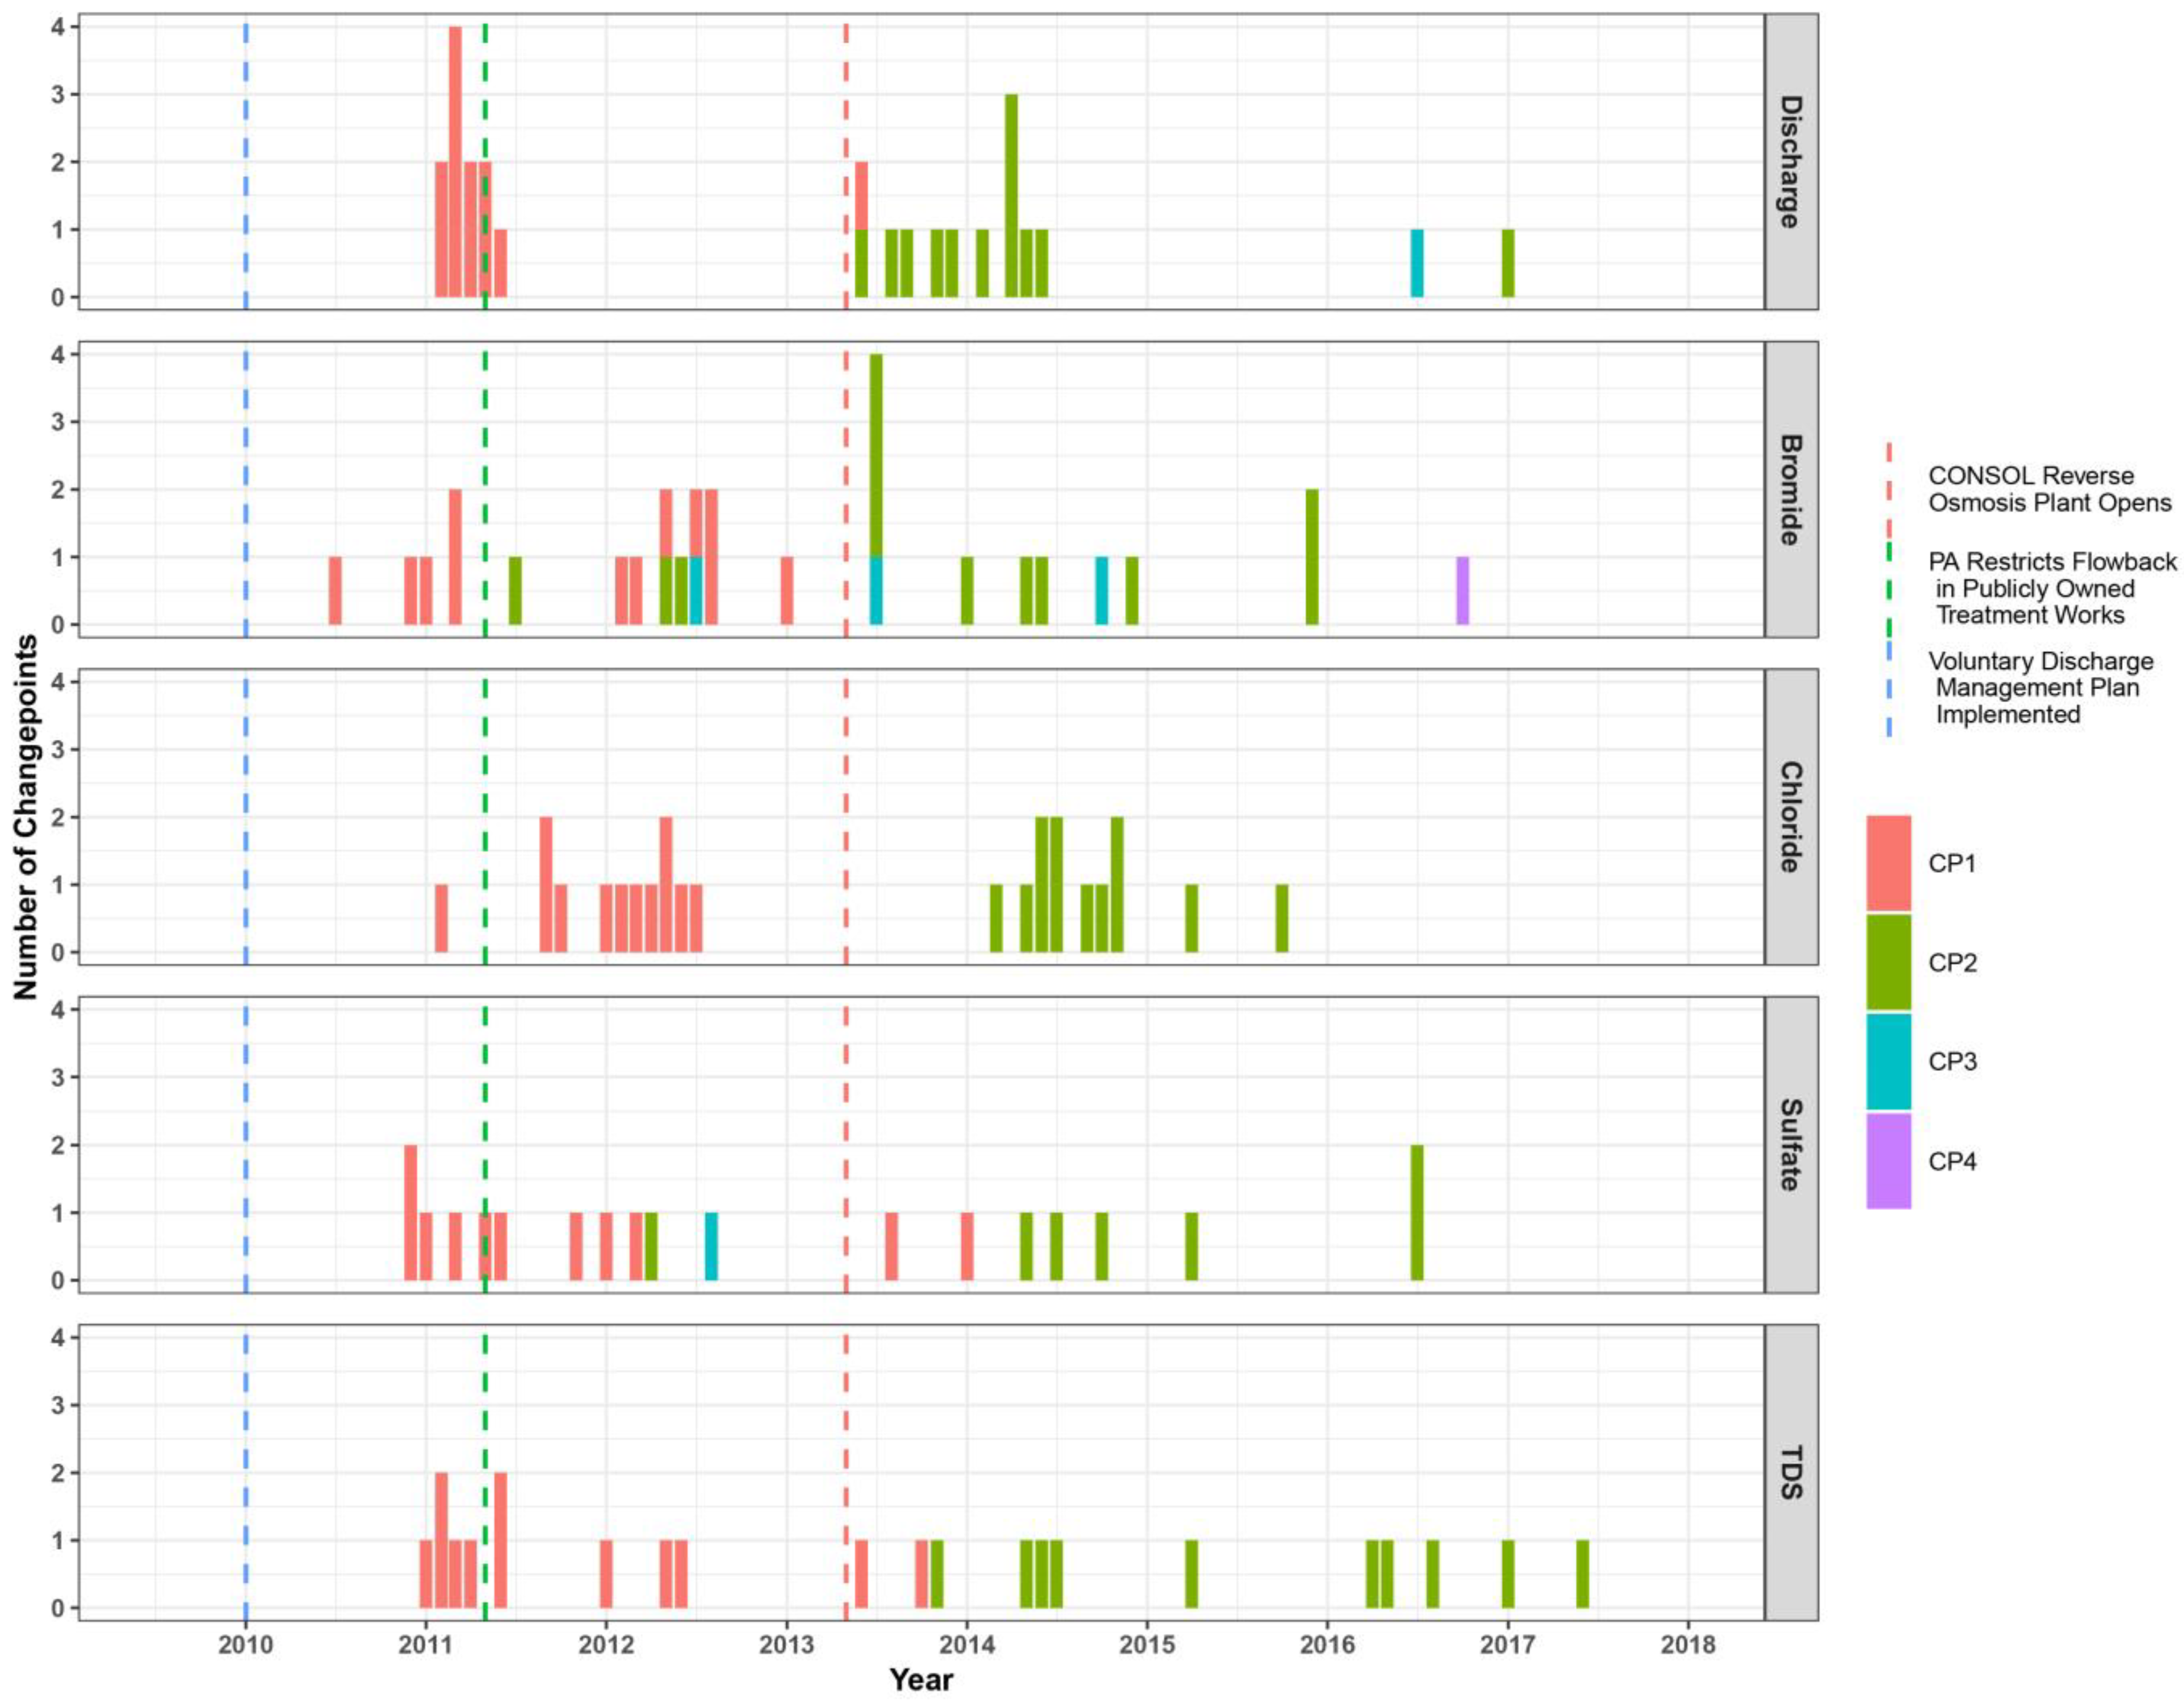
The number of change points for each parameter varied (1 to 4 CPs) with most models possessing two change points (Figure 5). Regarding the discharge models, five out of the six mainstem sites displayed two changepoints with WF being an exception displaying three changepoints (Appendix A). All tributary sites displayed at least two change points within the discharge models (Appendix B). The first changepoints with regards to the discharge models are estimated to have occurred in 2011 while the second changepoint is often estimated to have occurred between late 2013 and the middle of 2014 (Figure 5). The bromide models routinely possessed a greater number of changepoints per model when compared to the other parameters. Dates for bromide changepoints vary between July 2010 and October 2016 with the majority of changepoints occurring between 2012 and 2014 (Figure 5). In comparison, each chloride model identified two changepoints with the first changepoint often occurring in 2012 and the second changepoint occurring in 2014. Sulfate models for the mainstem sites directly on the Monongahela River displayed a single changepoint that ranged between May 2011 and January 2014. However, the sulfate models for the tributaries displayed either one or two changepoints with the first changepoint falling between December 2010 and March 2012. For the sulfate tributary models that contained a second changepoint, it fell between May 2014 and July 2016. There was one exception with YO′s second sulfate changepoint taking place in April 2012. Finally, the TDS models showed two changepoints for four mainstem sites and all the tributary sites with M23′s TDS model detecting a single changepoint. The first changepoints for the mainstem TDS models fell between February 2011 and June 2013 and the second changepoints fell between November 2011 and June 2017 (Figure 5).

3.3. Linear Mixed Effects Model Results

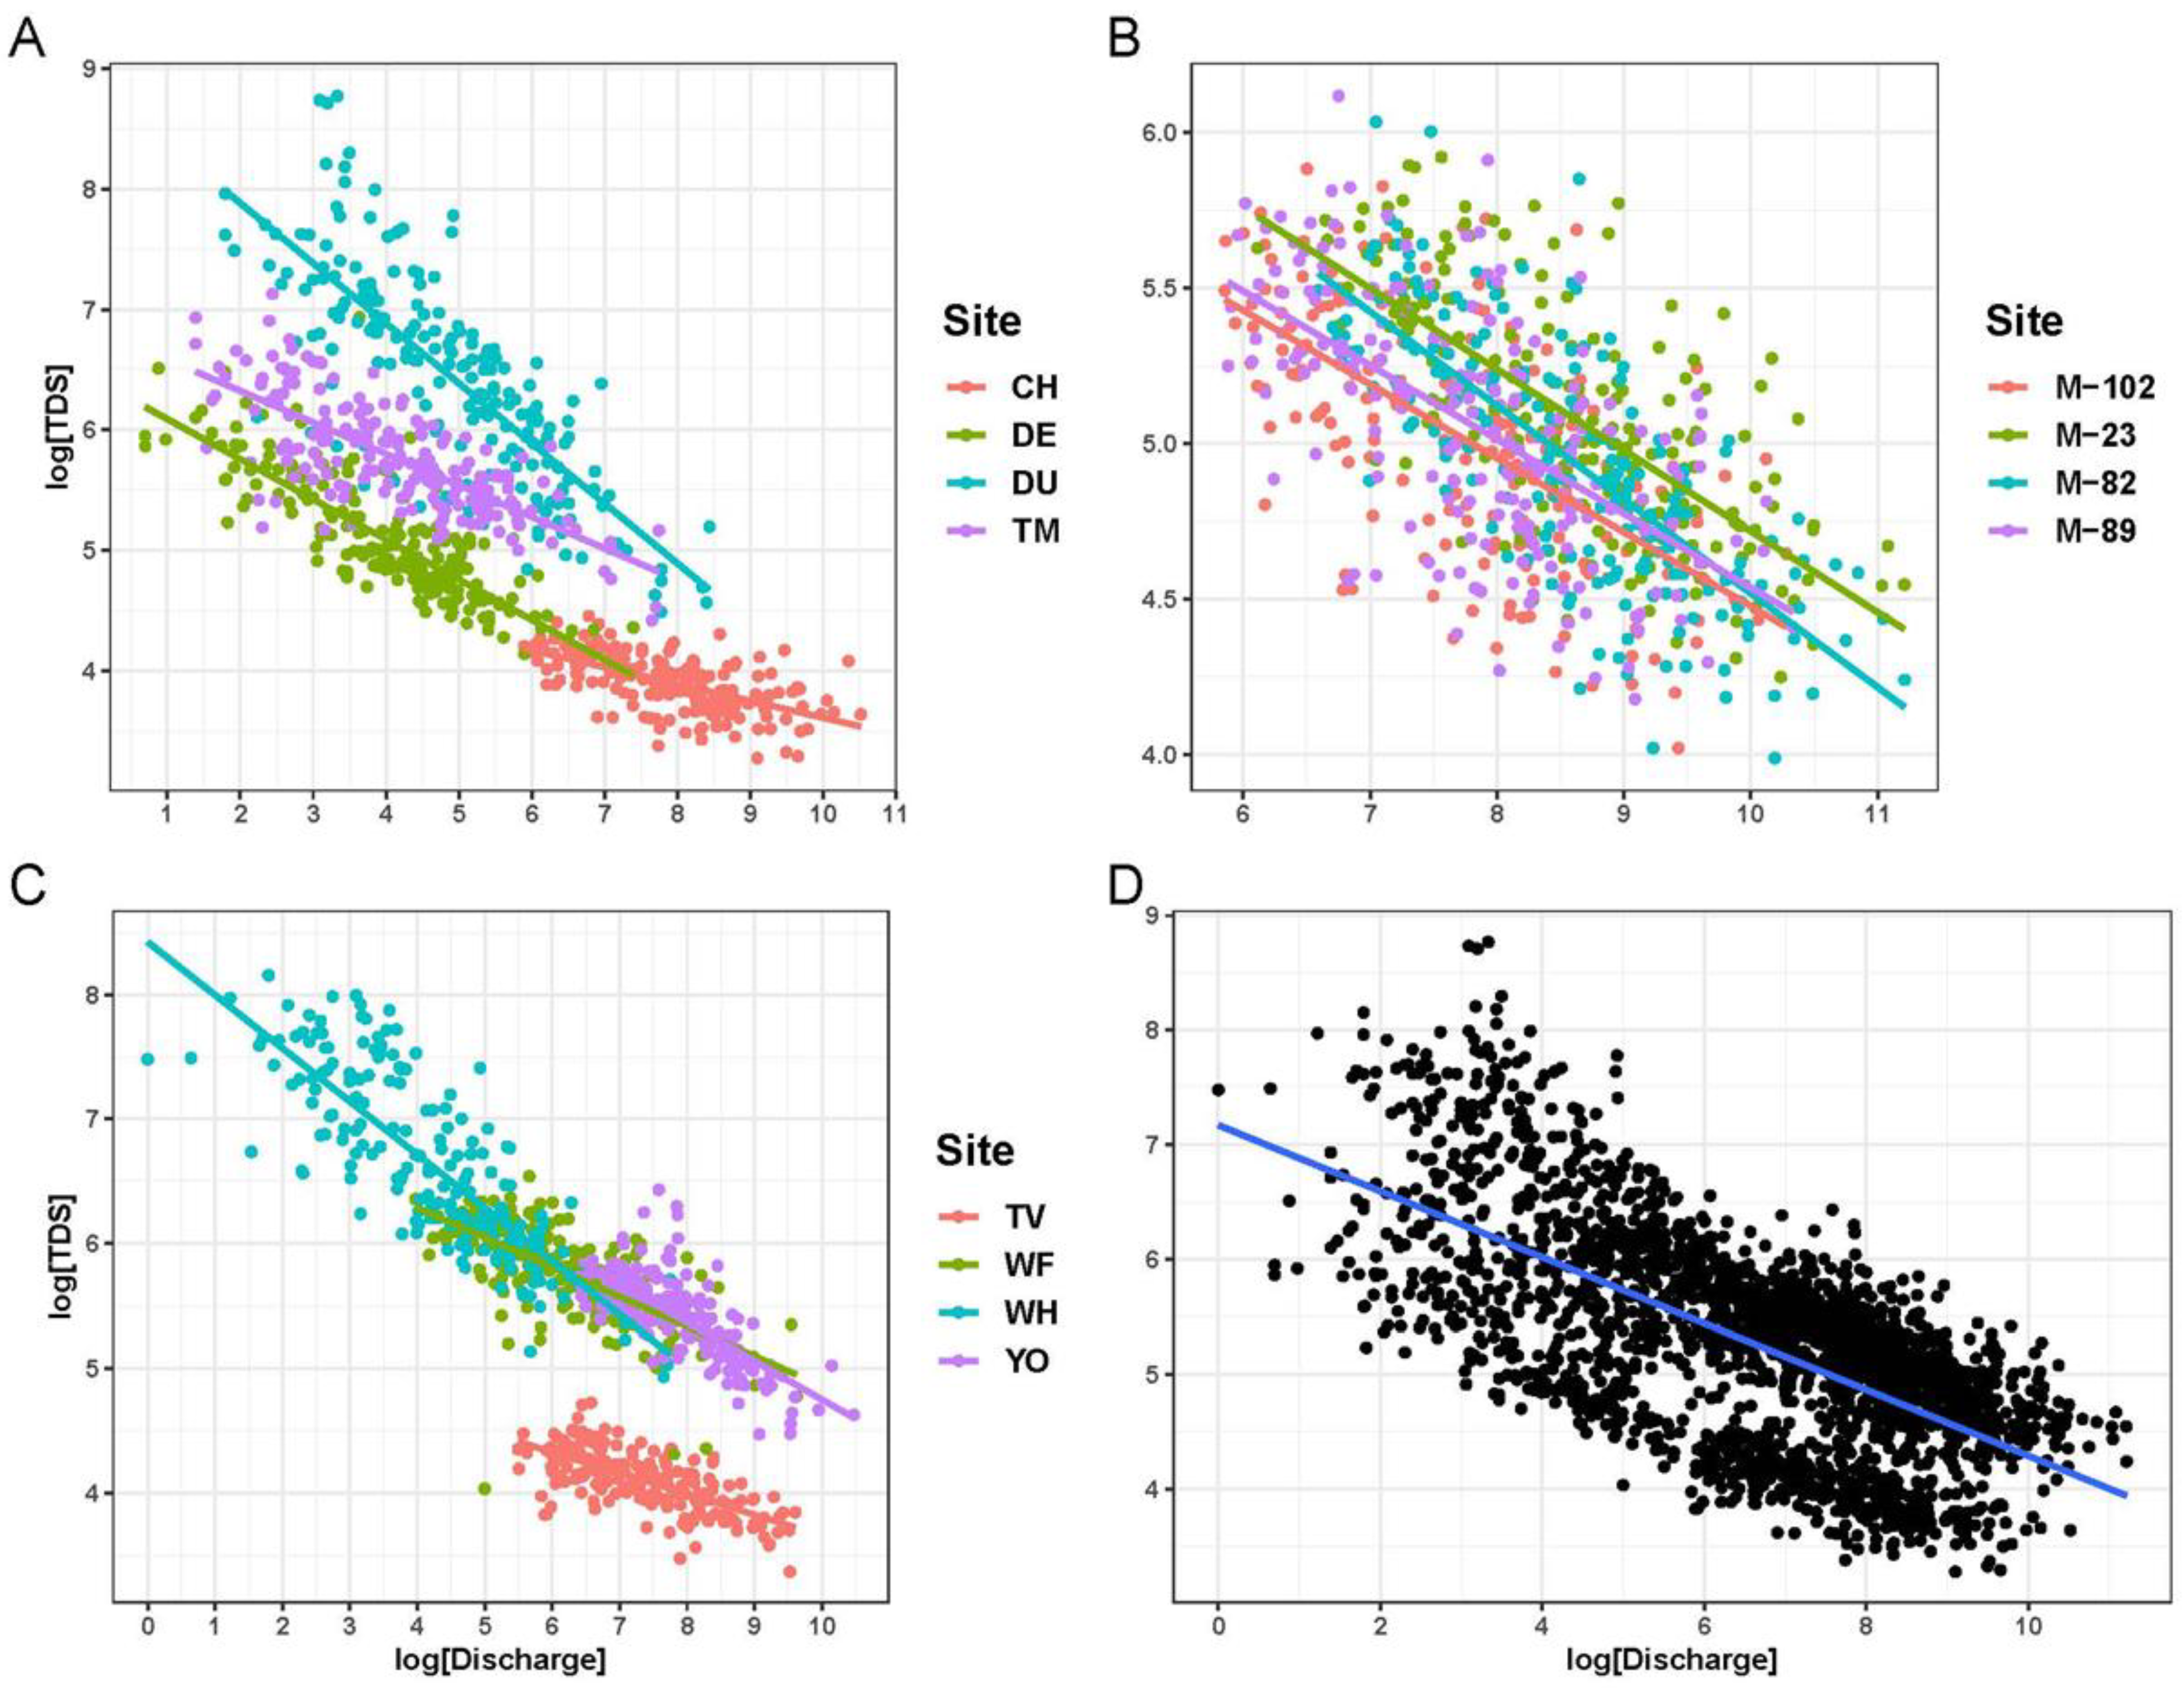
The optimal model for estimating management changes related to TDS concentration included random intercepts and slopes among the sites (Figure 6). Discharge, year, and treatment(s) all had significant negative effects on TDS while the interaction between year and discharge had a significant positive effect (Table 3). All but one treatment type, PA’s prohibition on produced water in POTWs (PA_Pro), displayed significant negative effects on TDS concentrations. Combined, the fixed and random effects explained 91% percent of the total variation in TDS (conditional R2 = 0.91), whereas discharge, year, and treatment type explained 38% of the overall variation (marginal R2 = 0.38).

4. Discussion

We showed temporal and spatial changes for bromide, chloride, sulfate, and TDS concentrations throughout the Monongahela River Basin, thereby providing valuable understanding of how the overall river basin is changing over time in relation to both discharge and various management decisions. Concentrations for bromide, chloride, sulfate, and TDS showed significant overall downward trends throughout the river basin. Most LWPR-SegReg models identified one or two changepoints over the 10-year time period which often coincided with the changepoints that were identified within each site′s discharge model. Bromide and chloride linear segments exhibited a delayed inverse relationship with their sites′ respective discharge segments. As discharge increased, bromide and chloride concentrations would often decrease and vice versa. By comparison, the sulfate and TDS models for the mainstem sites and some of the tributaries displayed permanent long-term downward shifts regardless of changes within the river or stream discharge following the implementation of the voluntary discharge management plan. After implementing the voluntary discharge management plan, sulfate and TDS concentrations failed to return to their pre-management plan levels. By comparison, bromide, chloride, sulfate, and TDS concentrations showed limited to no change or maintained their trajectories following Pennsylvania′s restriction of produced water into publicly owned treatment works and/or the opening of the reverse osmosis treatment facility.
We followed up the LWPR-SegReg trend analysis with a linear mixed effects model focusing solely on how TDS concentrations responded to changes in discharge over time as well as the various combinations of management decisions that were implemented throughout the Monongahela River Basin. TDS was most significantly affected by discharge, which has been well established by previous works [6,43,44]. However, TDS was also significantly reduced because of the management changes. More specifically, the voluntary discharge management plan was effective in reducing TDS, an effect that was enhanced by other TDS reduction measures. Specifically, Pennsylvania′s prohibition of produced water in POTWs did not have a significant effect on TDS concentrations when it was the only management change in place. The reverse osmosis treatment facility was always paired with other management changes but appears to have played some role in further reducing TDS concentrations in the Monongahela River.
The effectiveness of the voluntary discharge management plan is demonstrated by the significant and sustained reduction in sulfate and TDS concentrations after its implementation in January 2010. While discharge varied spatially and temporally on a site-by-site basis, the sulfate and TDS reductions were consistent throughout the Monongahela River basin in streams that were affected by the discharge management plan. Similar management plans have been implemented by state and federal agencies as part of the Clean Water Act (CWA) to reduce various types of pollution and are referred to as total maximum daily loading (TMDL) regulations. The total maximum daily loadings regulations are a common and effective tool for point-source pollution and non-point source pollution that contributes to the impairment of water bodies such as rivers, lakes, and estuaries [45,46]. The voluntary discharge management plan is a non-regulatory TMDL that was developed and deployed by the West Virginia Water Research Institute in partnership with leaders from the coal industry within the Monongahela River basin. This TMDL targets sulfate and TDS originating from treated AMD discharges into surface waters by limiting treated AMD discharges during low flow conditions in the Monongahela River watershed [7]. The discharge management plan went into effect in January 2010 and is still employed as of publishing this study. The voluntary discharge management plan utilizes the large assimilative capacity that is provided by the Monongahela River during high flows to reduce sulfate and TDS concentrations. During low flows, AMD treatment facilities reduce their treated water discharge rates to match the assimilative capacity that is provided by the Monongahela River at these low flows [6,7]. AMD treatment facilities that are involved with the voluntary discharge management plan are distributed among the tributaries and the main stem of the Monongahela River (Figure 3). Our results indicate that the WVWRI voluntary discharge management plan was successful in significantly reducing sulfate and TDS concentrations in the Monongahela River almost immediately upon implementation. The results seen within the Monongahela River basin are just one example of the effectiveness of TMDL plans, both voluntary and regulatory as a tool for implementing the objective of the Federal Clean Water Act. For example, the Chesapeake Bay watershed uses a TMDL in conjunction with other remediation measures to control excessive nutrient loading that has had detrimental effects on the aquatic ecosystem [47]. Other examples include the implementation of TMDLs in the Middle Cuyahoga Valley and the Lynnhaven River to reduce nutrient loads and reduce fecal coliform, respectively [48,49]. In addition to the TMDL, managers and stakeholders in the Monongahela River basin have attempted to use additional remediation actions to further improve water quality.
The second change made to the Monongahela River Basin regarding water quality was Pennsylvania′s prohibition of depositing produced water into publicly owned treatment works, effective May 2011. Based on the results from our study, this regulation had a very limited effect on reducing bromide, chloride, sulfate, or TDS concentrations among most sites. It did, however, appear to have reduced bromide concentrations at the TM and WH sites in Pennsylvania. The reduction in bromide concentrations at TM and WH is likely tied to the major publicly owned wastewater treatment facilities that are located along these two streams and their relatively low flows. While this regulation does not appear to have reduced chloride, sulfate, or TDS in a significant way, that is not to say that this regulation has not had a positive impact on water quality or aquatic ecosystems. Benefits of this localized reduction include lowering risks that are associated with excess bromide such as brominated disinfectant byproducts (DBPs) which are a known carcinogen and readily form when bromide concentrations are greater than 0.1 mg/L [8,50]. There is also evidence that produced water from hydraulic fracturing is detrimental to soil quality [51]. Additionally, produced water entering surface waters can impact the gill structures of fish leading to oxidative stress as well as potential liver damage when exposed to larger volumes of produced water [52]. Thus, limiting the volume of produced water entering surface waters does possess positive benefits for the environment.
The final watershed scale change of interest was the impact of opening a new reverse osmosis treatment facility in May 2013, located in Mannington, West Virginia. The results from our study showed limited significant reductions in chloride and TDS concentrations. Dunkard Creek (DU) was the lone site that displayed further downward trends in chloride and TDS concentrations following the opening of the treatment facility. This is to be expected due to the low assimilative capacity of Dunkard Creek based on median discharge and because several AMD plants that were discharging into Dunkard Creek are now sending their wastewater to a reverse osmosis treatment facility. However, when looking at the other sites where concentrations displayed changepoints following the opening of the reverse osmosis treatment facility, it was concluded that the changes more likely coincided with trend changes that were related to discharge. This pattern was observed across many sites, including sites that were not utilizing the reverse osmosis treatment plant which leads us to believe that increased stream or river discharge caused these changes via dilution and not via contaminant removal.
Reverse osmosis treatment facilities differ from TMDL-based waste load reductions and wastewater restrictions by physically removing contaminants from wastewater prior to final discharge and thus do not rely on the assimilative capacity of their receiving waters [21,22]. While a single reverse osmosis facility will have difficulty processing wastewater throughout an entire watershed, TMDLs are capable of being implemented at the watershed scale and are far more cost-effective. Reverse osmosis technology is difficult to implement on a wide scale largely due to the technological complexity and their capital and operating costs [53]. Reverse osmosis is most effective when removing highly soluble salts such as NaCl. However, they suffer from severe scaling when applied to low solubility salts such as CaSO4, typical of AMD. Reverse osmosis facilities are best suited for treating large quantities of wastewater that are discharged to streams that lack the capacity to assimilate salts through natural processes. With real-world implementation, this is not always feasible and, depending on the scale, multiple reverse osmosis facilities may be required to match the effectiveness of other management decisions.
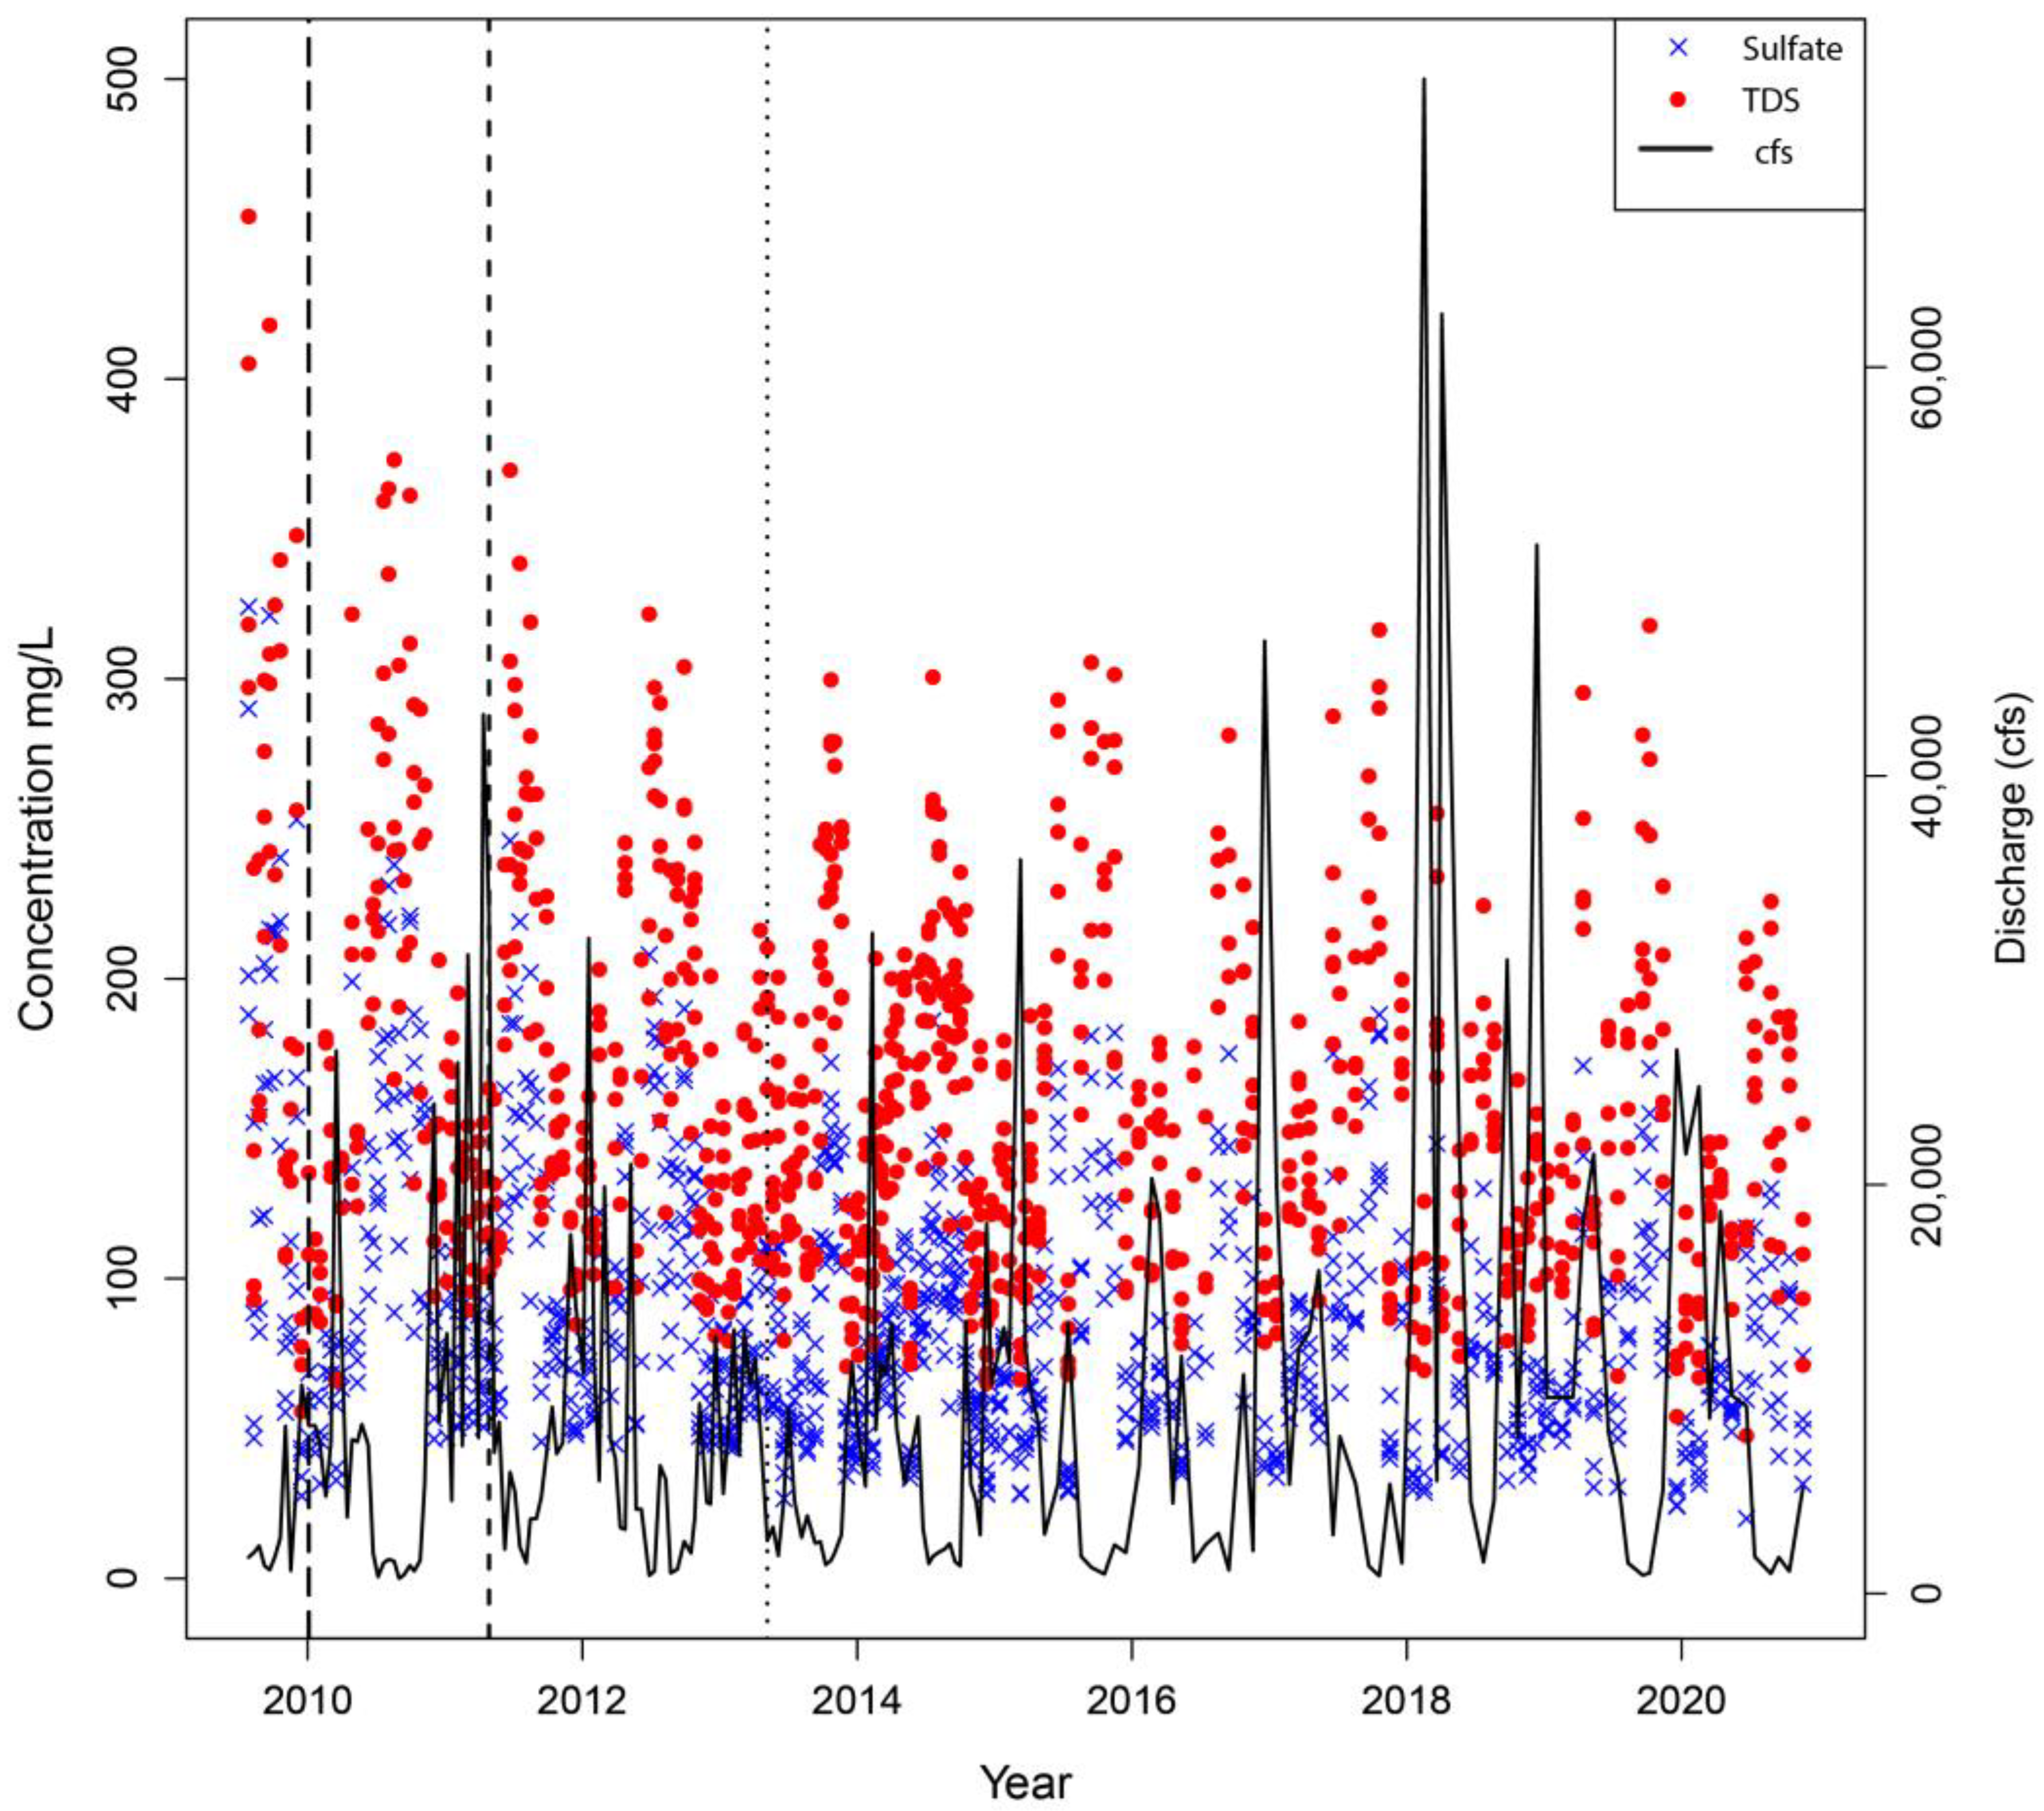
The observed downward trends in concentrations for all four parameters (bromide, chloride, sulfate, and TDS) throughout the Monongahela River Basin are important for improving ecosystem services and drinking water services. Decreasing bromide and chloride concentrations are particularly helpful as both these ions are key components in DBPs such as trihalomethane (THM) formation [8,50,54,55]. THMs are known to be carcinogenic and teratogenic to humans and thus the formation of THMs in drinking water has been linked to serious health risks including birth defects and various types of cancer in humans [56,57,58,59,60,61]. Chloride reductions are also important as elevated chloride concentrations in surface waters can lead to chronic toxicity impacts to aquatic organisms [62]. Elevated sulfate concentrations within underwater sediments can cause environmental degradation through acidification of significant reductions in dissolved oxygen within aquatic ecosystems [63]. Regarding drinking water, elevated sulfate can lead to a bitter taste, and at exceedingly high levels there is the potential to cause gastrointestinal problems in both humans and animals [64]. Sulfate and chloride ions are notorious for causing infrastructure damage to reinforced concrete as well [65]. Therefore, by reducing the sulfate concentrations in the Monongahela River basin, the risk of degradation to aquatic environments is reduced, the quality of the drinking water has improved, as well as lessening the potential infrastructure damage that is caused through sulfate-related corrosion. Reducing the sulfate concentration throughout the Monongahela River resulted in the river being officially delisted from sulfate impairment by the Pennsylvania Department of Environmental Protection 5 years after the implementation of the voluntary discharge management plant [66]. Finally, reductions in TDS concentrations throughout the Monongahela River basin provide key benefits to drinking water treatment facilities; benefits include better-tasting water, minimal odors, rand educed corrosion and scaling of pipes and boilers. In fact, TDS and sulfate concentrations within the Monongahela River proper, not including the West Fork and Tygart Valley Rivers, have not exceeded the EPA′s secondary drinking water standards since implementation of the Voluntary Discharge Management Program in January 2010. (Figure 7). In addition, reductions in salts that lead to increased surface water salinity are important for preventing harmful algal blooms such as the one that occurred in 2009 at Dunkard Creek [18]. The downward trends of these concentrations provide benefits for the short-term and long-term health of the Monongahela River Basin as well as the communities that rely on the river for various services.
Large datasets over long periods of time enable researchers and managers alike to conduct better observational studies and it also enables researchers to analyze river systems of interest over both temporal and spatial scales not often found in smaller datasets [67]. For example, trend analyses are often used to investigate temperature or precipitation change over time but the 3RQ dataset allows researchers to analyze a wide array of concentration changes over 10 years at consistent intervals, providing a level of detail that is not found in many water quality datasets. Previous studies have utilized the 3RQ dataset to create models that are of direct use to managers such as how flow impacts TDS concentrations as well as characterizing fossil fuel extraction activities in the Monongahela River Basin [1,5,6]. 3RQ has also enabled researchers to identify potential areas of concern for targeted studies that focus on a specific issue within any of the three watersheds or a specific location in the watersheds (3riversquest.wvu.edu/data/targeted-studies). Going forward, 3RQ provides a plethora of new opportunities for additional research focused on water quality improvement and watershed recovery. Similar analyses can be conducted for the upper Ohio and Allegheny rivers utilizing 3RQ data to better characterize trends in major ions that contribute to elevated TDS concentrations within these basins. Future research should focus on generating detailed, consistent long-term datasets for other major bodies of water and their contributing rivers to enable researchers and managers to better characterize contaminants of concern.
The methodology that was used for this study can be readily applied to other large water quality datasets to determine significant trends and when trend changes occurred relative to key dates or major changes to a system by managers. In addition, using the LWPR-SegReg method on interrupted or non-traditional time series datasets enables greater flexibility compared to traditional time series analysis with environmental datasets. A potential improvement for this methodology includes reducing the number of estimated discharges and instead using direct discharge measurements at as many sites as possible. This study also highlights the advantages of long-term monitoring datasets and the utility that they can provide to researchers and managers alike when investigating various pollutants.
Based on the results of our study, the Monongahela River Basin has seen a significant reduction in sulfate and TDS concentrations from 2009 to 2019. In addition to the sulfate and TDS concentration reduction, bromide and chloride concentrations have also either decreased or remained stable. These concentration reductions coincide with several management decisions, primarily the voluntary discharge management of treated acid mine drainage, followed by state legislation restricting produced water in public treatment facilities, and the construction of a new reverse osmosis wastewater treatment facility. While these management decisions have improved the water quality of the Monongahela River, future threats to the Monongahela River Basin including anthropogenic impacts through land use as well as changes in flow regime through the effects of climate change [6]. Examples of land-use changes include continued urbanization, expansion of unconventional gas extraction, increased acid mine drainage inputs, and reductions in treatment to acid-mine drainage. Climate change-related problems including increasing temperatures and increased probability of drought could leave the Monongahela River Basin vulnerable to low flow events. Continued monitoring of the Monongahela River and key tributaries will allow managers to respond faster to these changes and aid in the creation and implementation of future solutions.

5. Conclusions

The results from this study have demonstrated how bromide, chloride, sulfate, and TDS trend changes coincided with discharge and critical water quality management alterations to the Monongahela River Basin. While individual management decisions may be effective, combining multiple watershed-scale decisions targeting contributing constituents of TDS can lead to greater overall effectiveness. The Monongahela River Basin is a potential example for other watersheds actively managing coal mining and natural gas activities. However, effective management decisions need to first identify the various sources of TDS and its key constituents throughout the entire watershed. It is also important for managers to assess the assimilative capacity of their streams and rivers, especially during low flows, to protect the areas that are currently minimally impacted. Given limited assimilation capacity, the removal or prohibition of pollutants that contribute to TDS may be preferred. Further research will be necessary to determine the appropriate removal methods depending on the source of TDS within a given watershed. Future watershed management scenarios will need to take into consideration several factors, including but not limited to, new emerging pollutants, changes in land use, and climate change.

Author Contributions

Conceptualization, J.W.K.; formal analysis, J.W.K.; resources, P.Z.; data curation, M.O.; writing—original draft preparation, J.W.K.; writing—review and editing, R.S. and M.O.; visualization, J.W.K.; project administration, R.S. and M.O.; funding acquisition, M.O. and P.Z. All authors have read and agreed to the published version of the manuscript.

Funding

This material is based upon work supported by the U.S. Geological Survey under grant #2009WV127B, the West Virginia Water Research Institute, and funding from the Colcom Foundation, Pittsburgh, PA, USA.

Data Availability Statement

Data available on request due to privacy restrictions. The data presented in this study are available on request from the West Virginia Water Research Institute, https://3riversquest.wvu.edu/.

Acknowledgments

Field sampling by West Virginia University staff: Jason Fillhart, Benjamin Mack, Benjamin Pursglove, Eliza Seifert; undergraduate students: Kaylynn Kotlar, Reva Dickson, Joshua Ash, Anthony Diamario, Jason Eulberg, Tyler Richards, Jude Platz, Cullen Platz, and Alex Pall; and Eric Baker, Zac Zacavish, Chance Chapman, Madison Cogar, and Levi Cyphers. The authors thank John Stolz, Beth Dakin, and Brady Porter from Duquesne University, James Wood from West Liberty University, and the late Benjamin Stout III, and David Saville from Wheeling Jesuit University for their insights and support throughout the 3RQ monitoring project. The authors would also like to thank Eric Merriam for providing comments that greatly improved the quality of the manuscript.

Conflicts of Interest

The authors declare no conflict of interest.

Appendix A

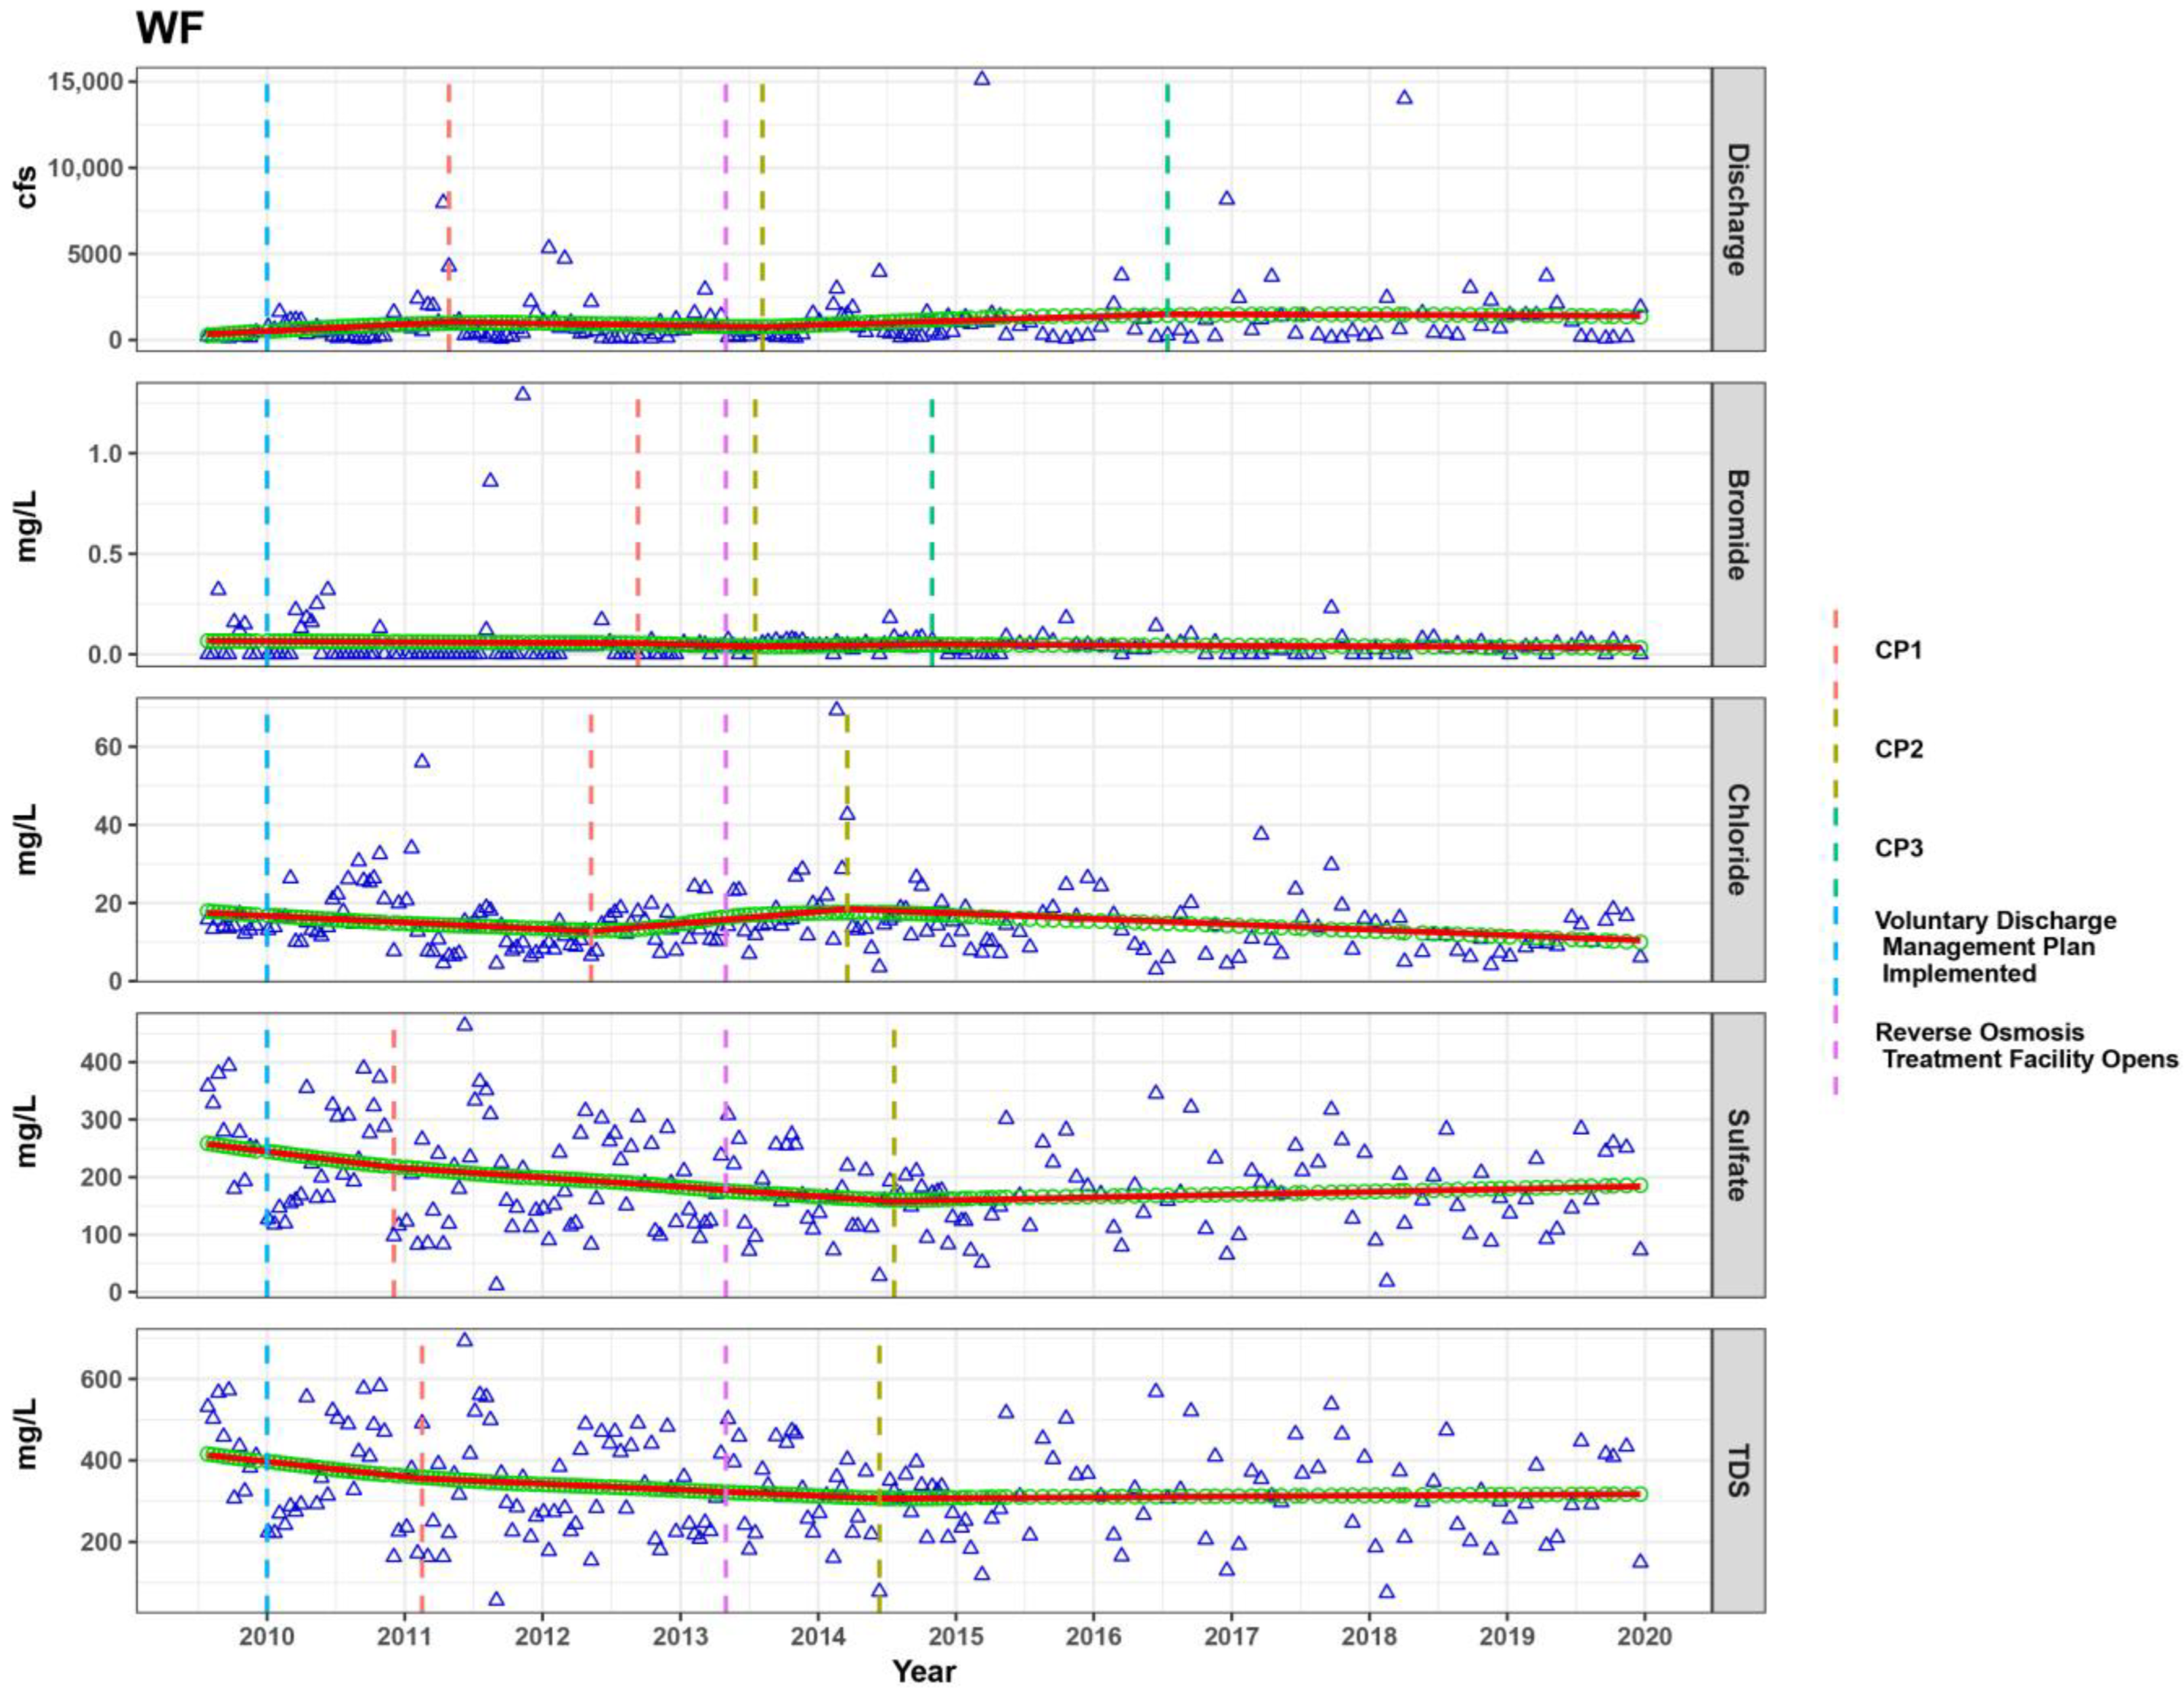
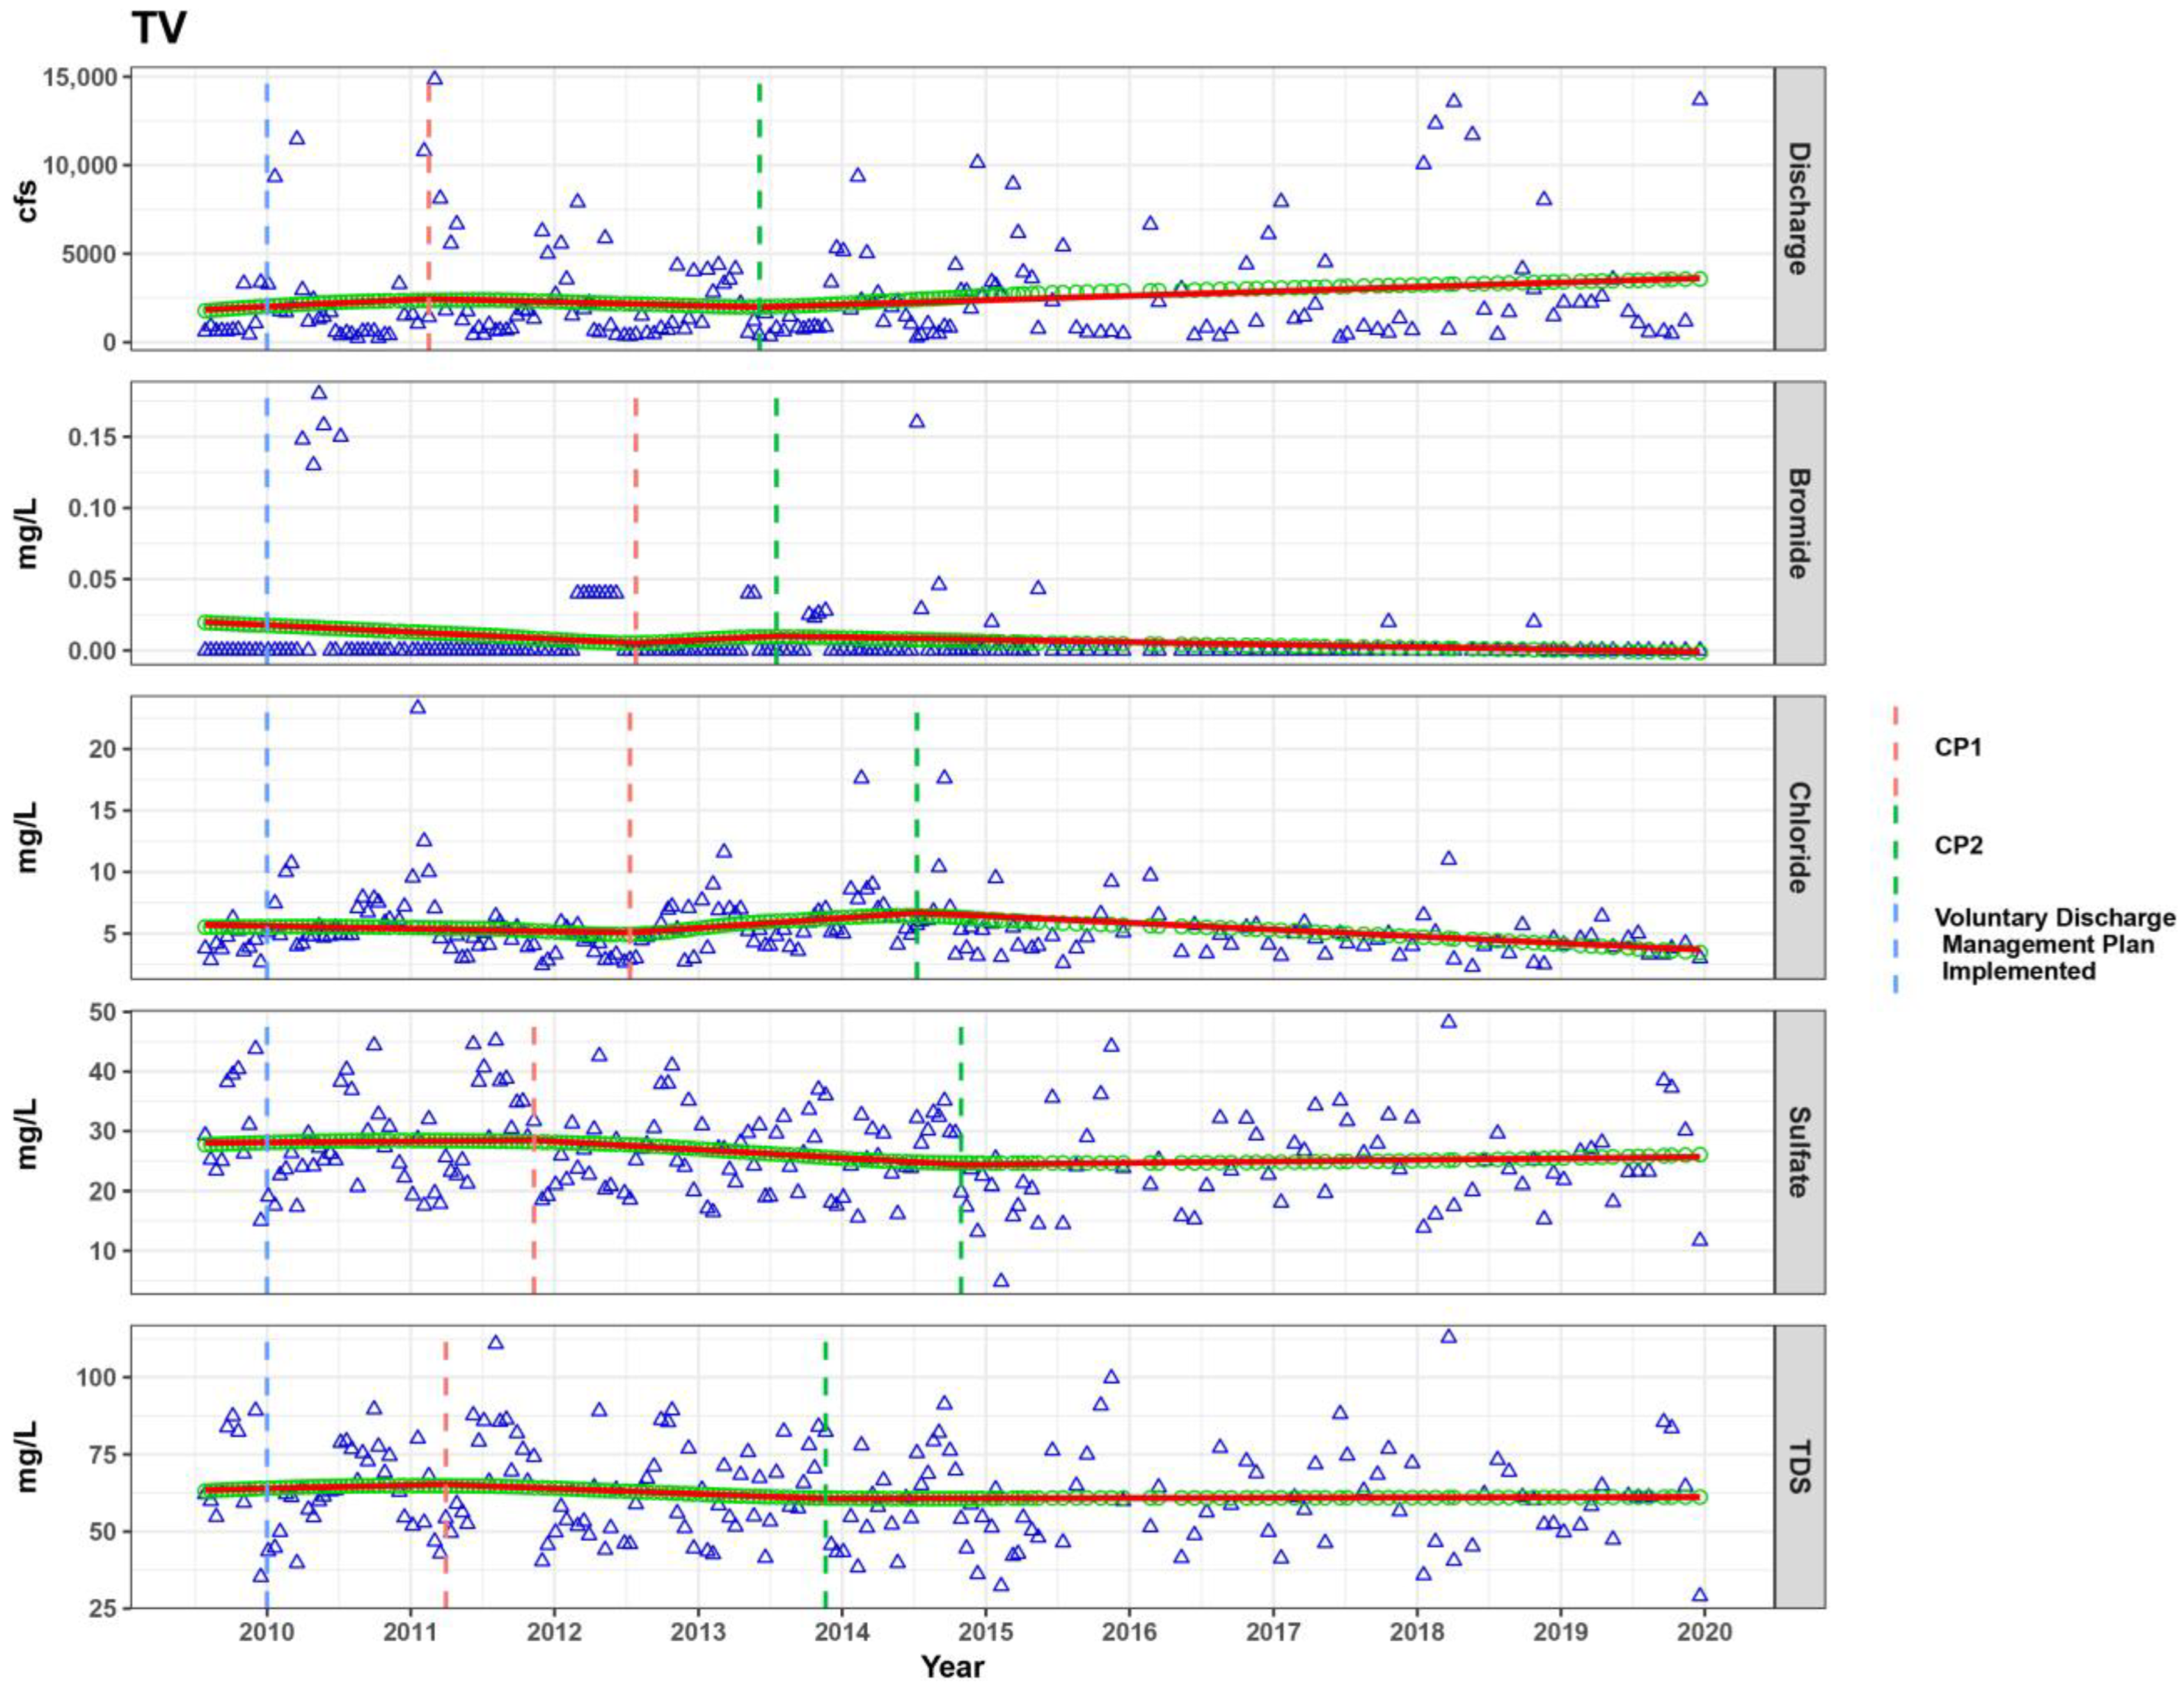
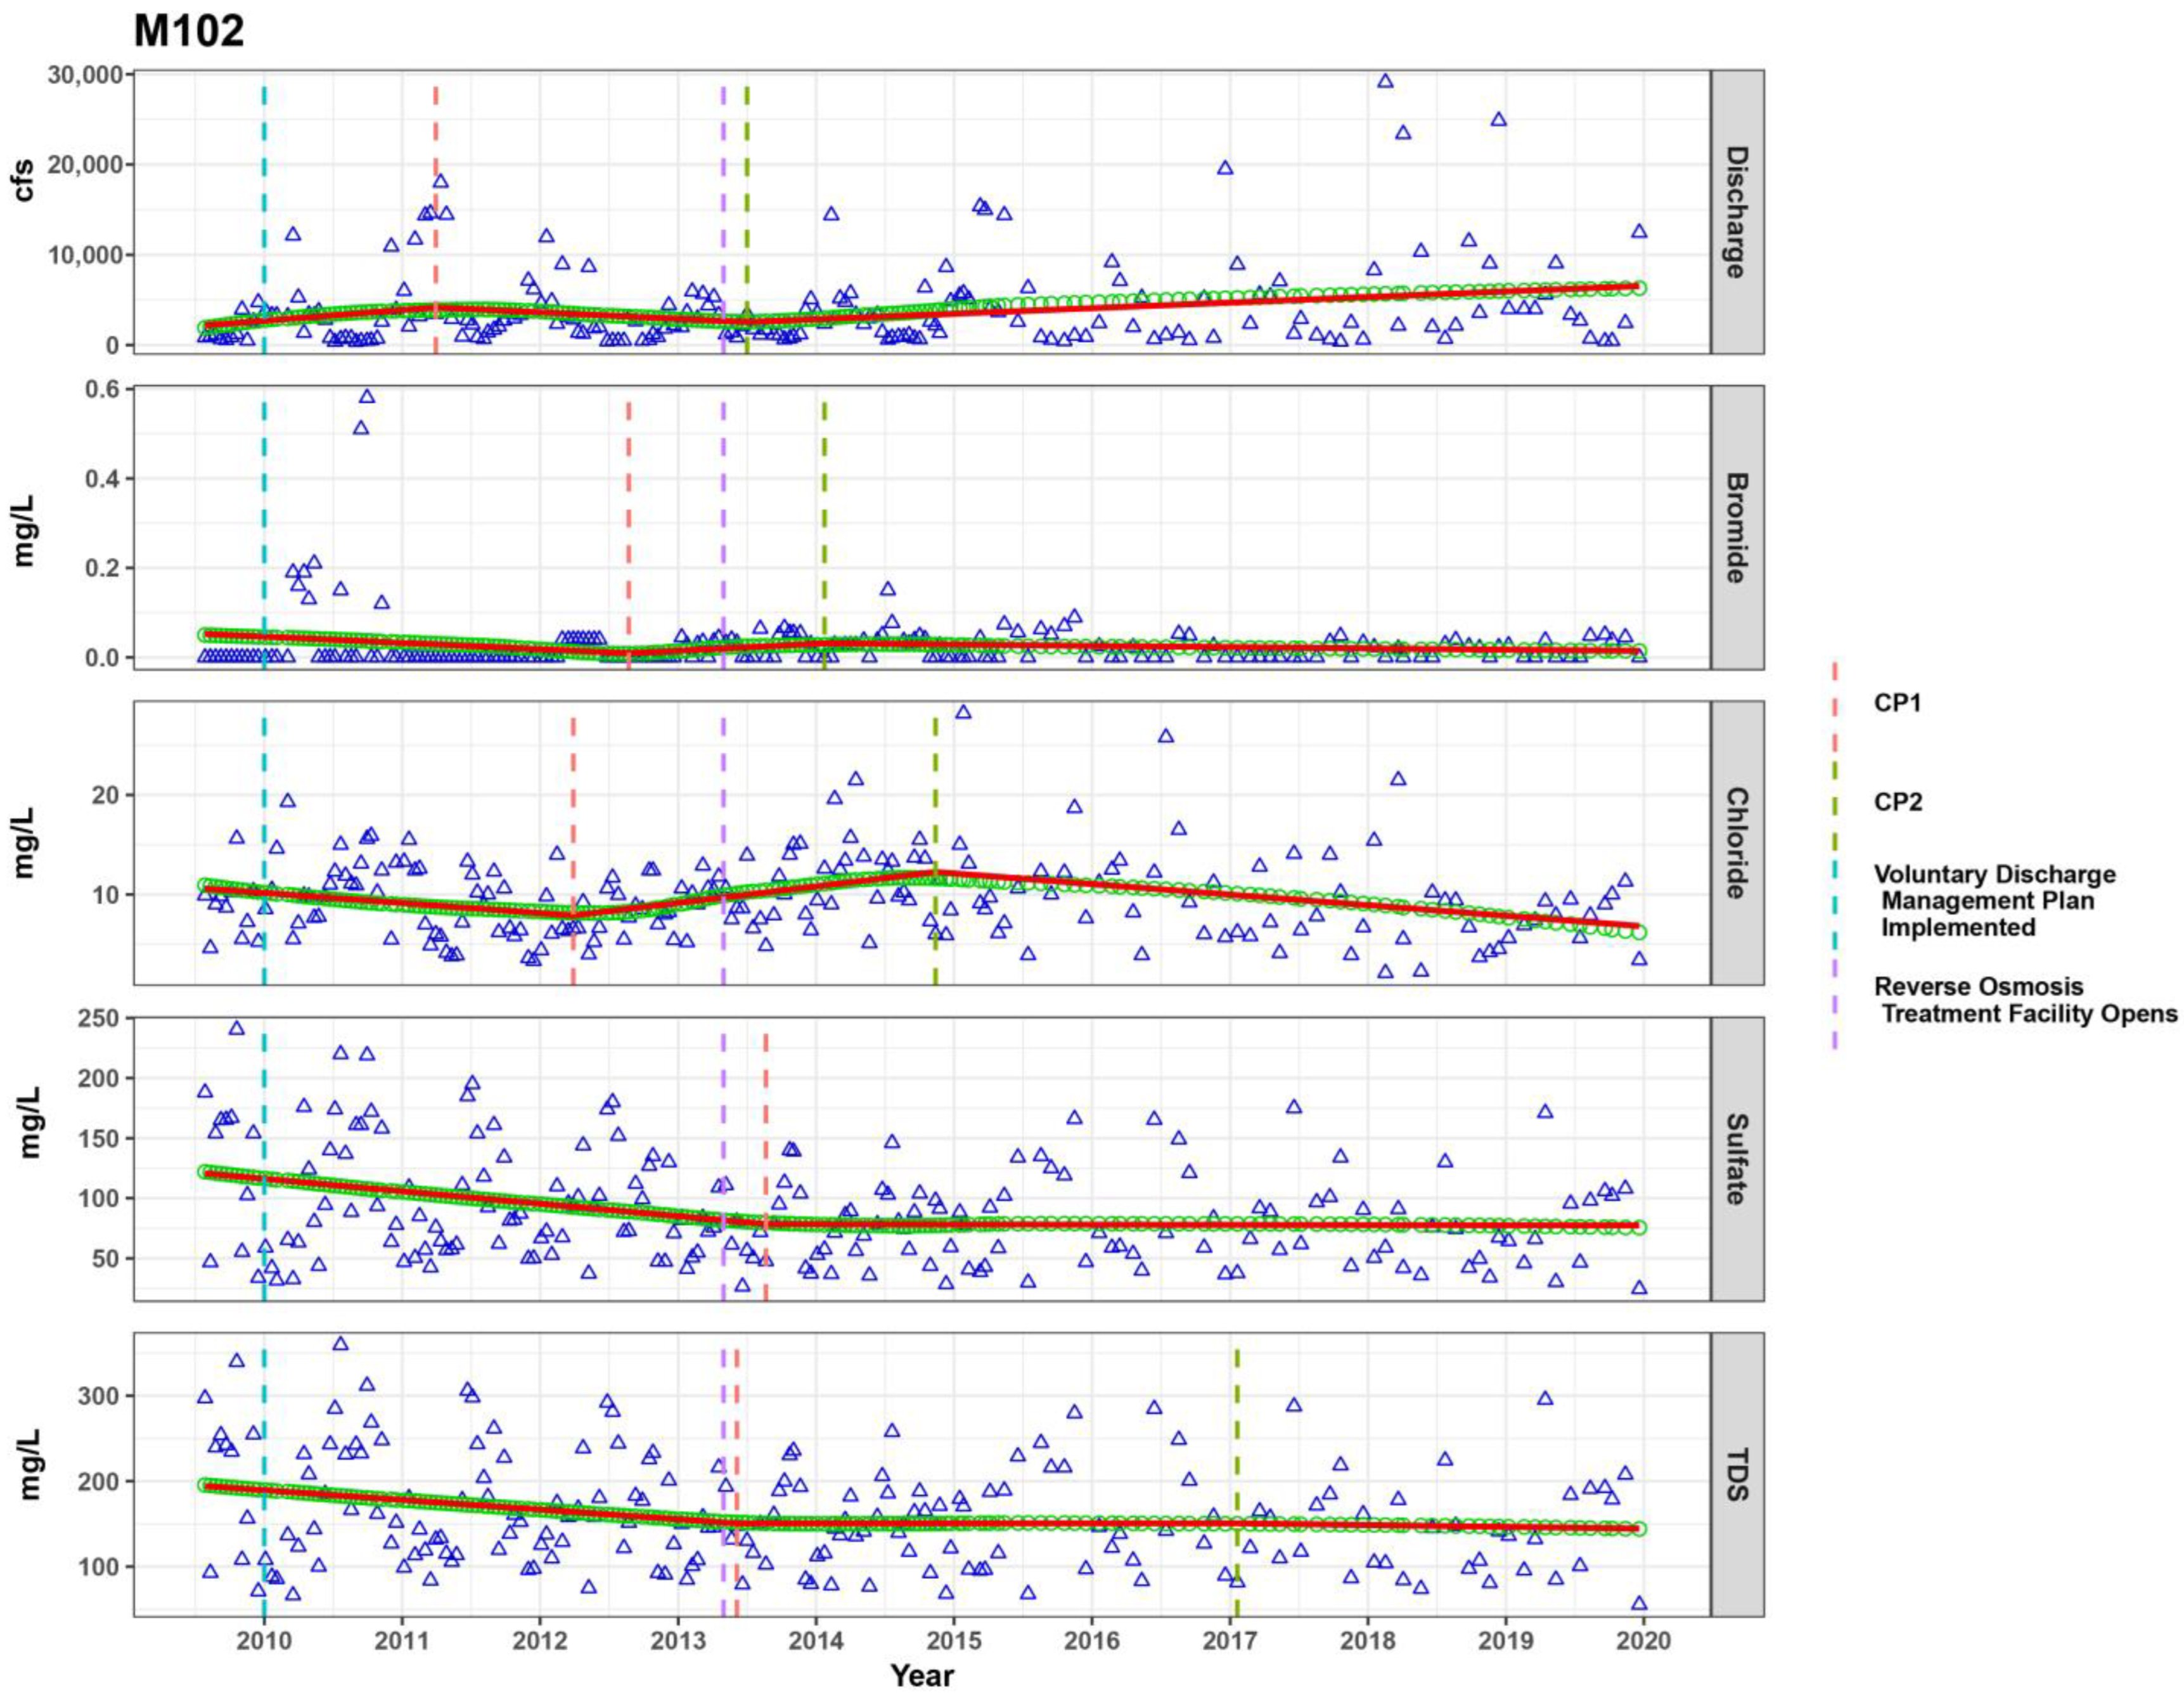
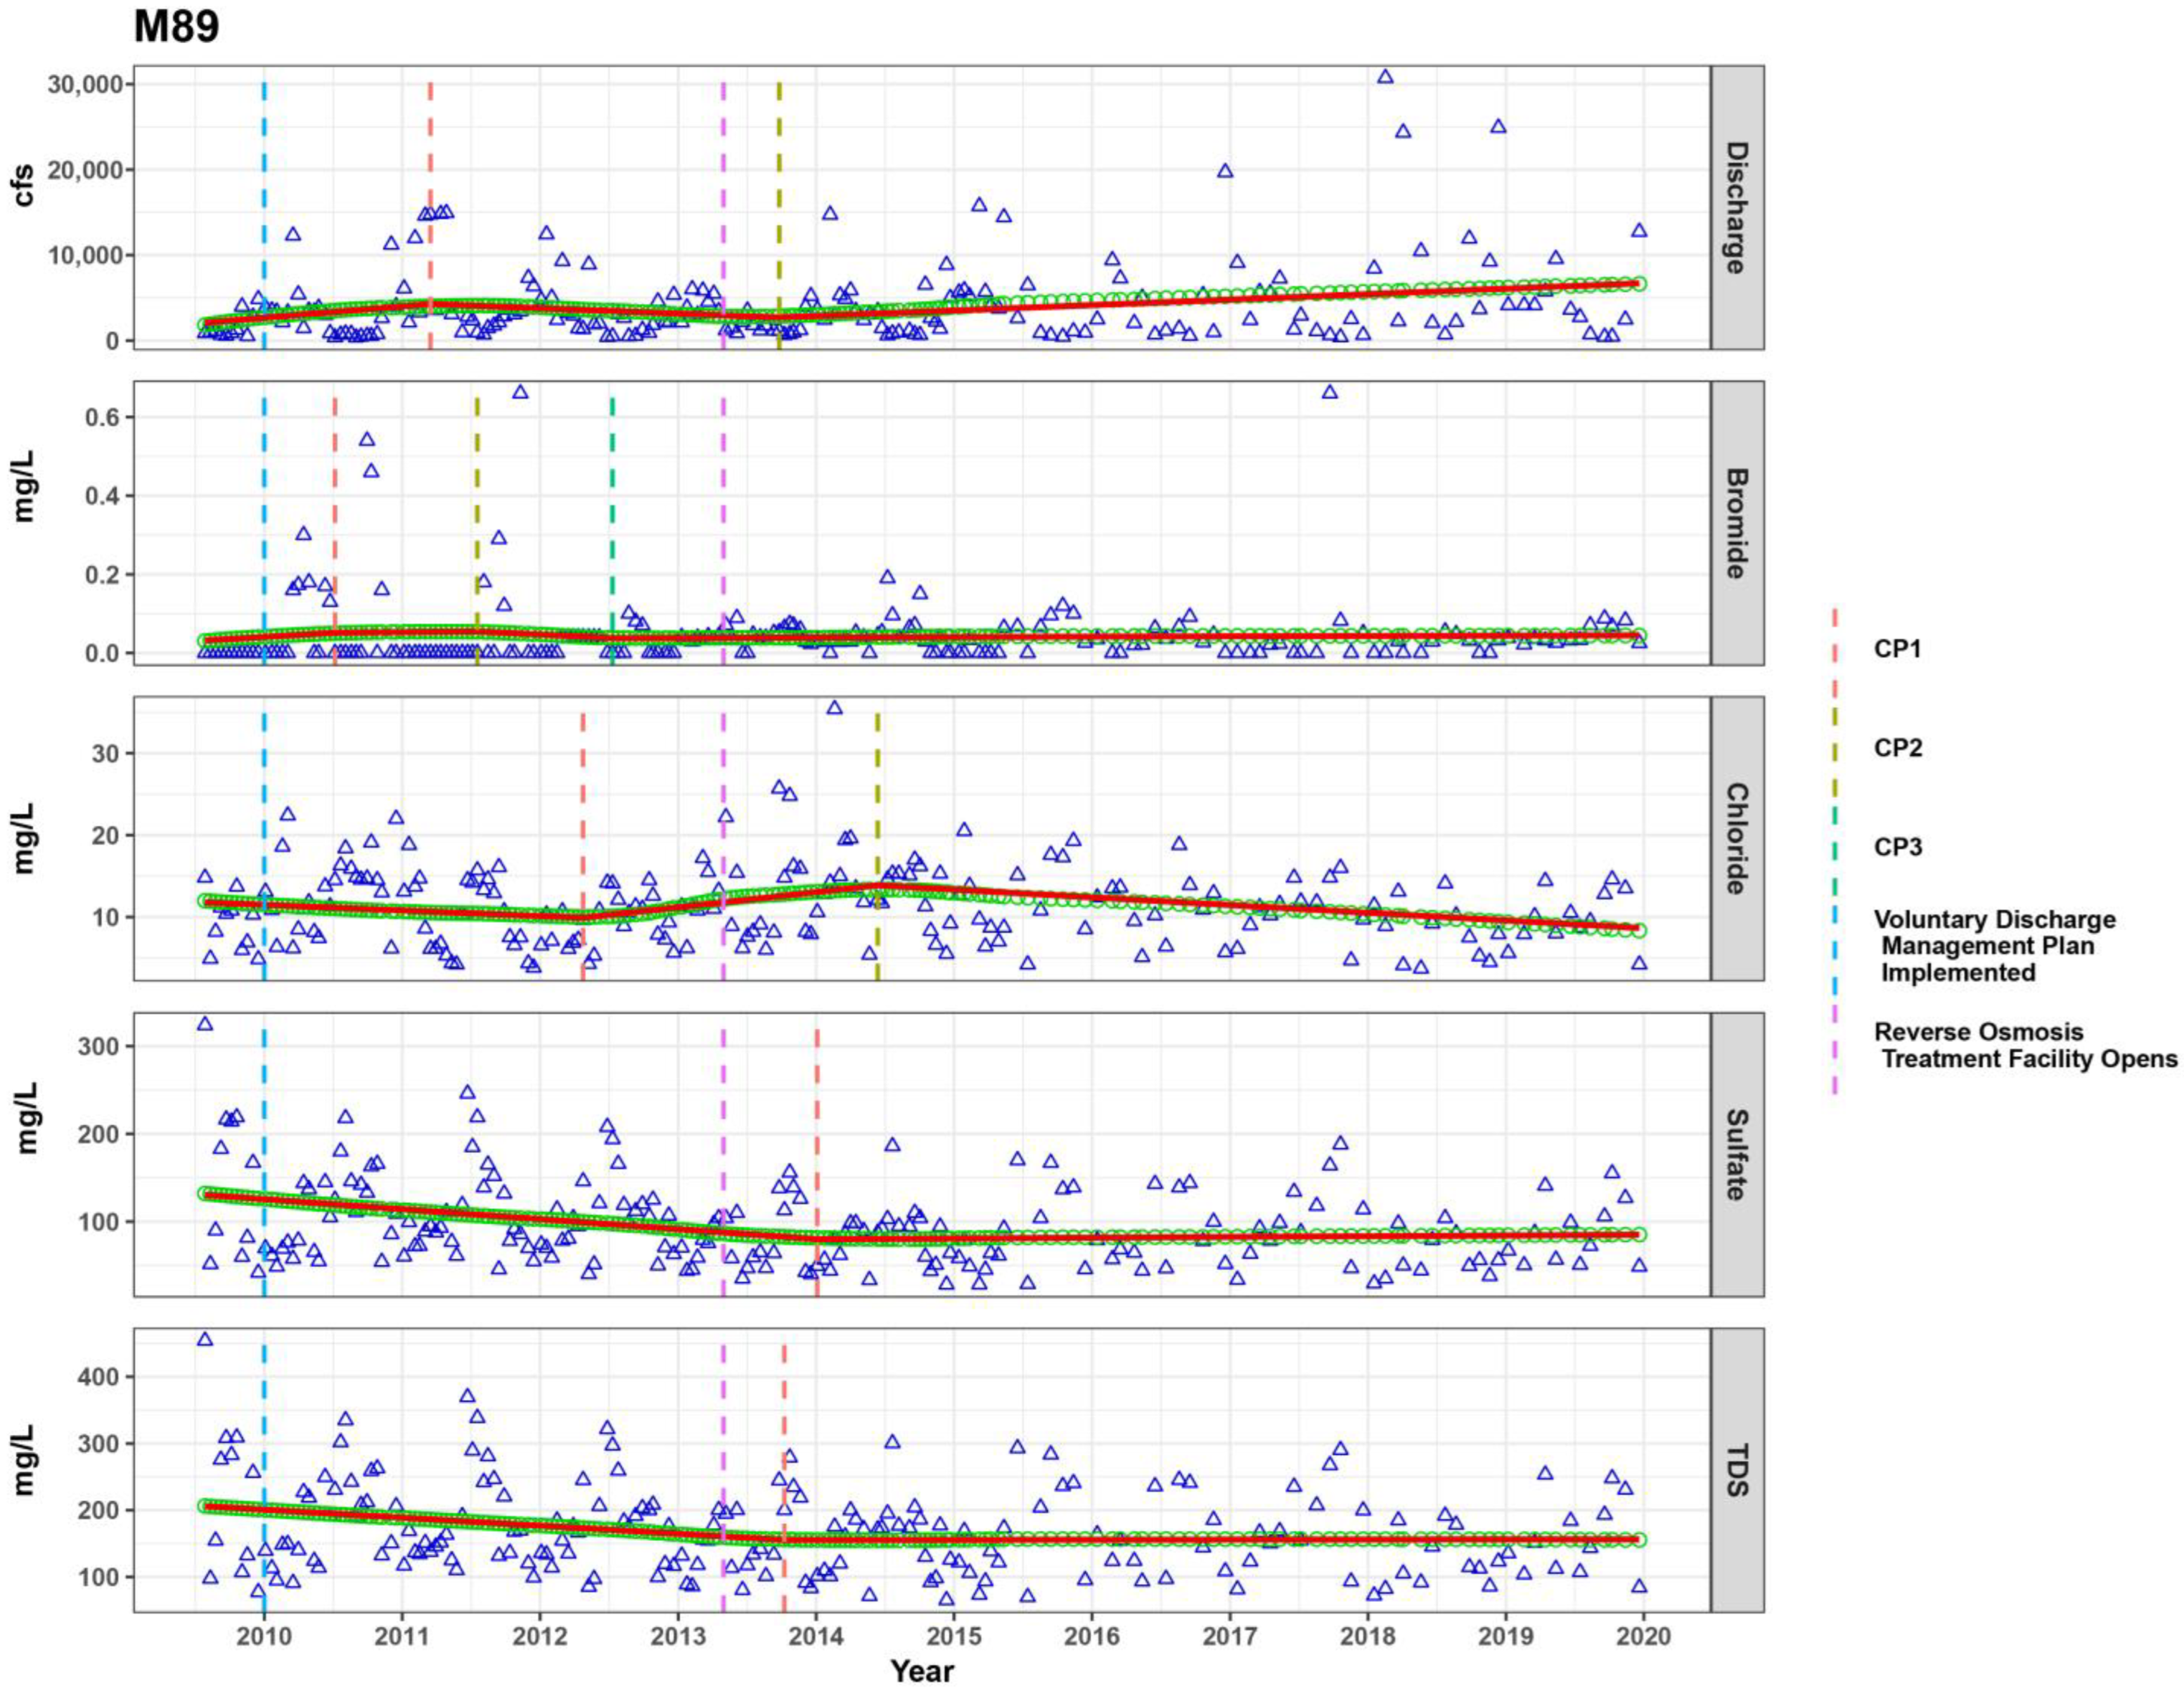
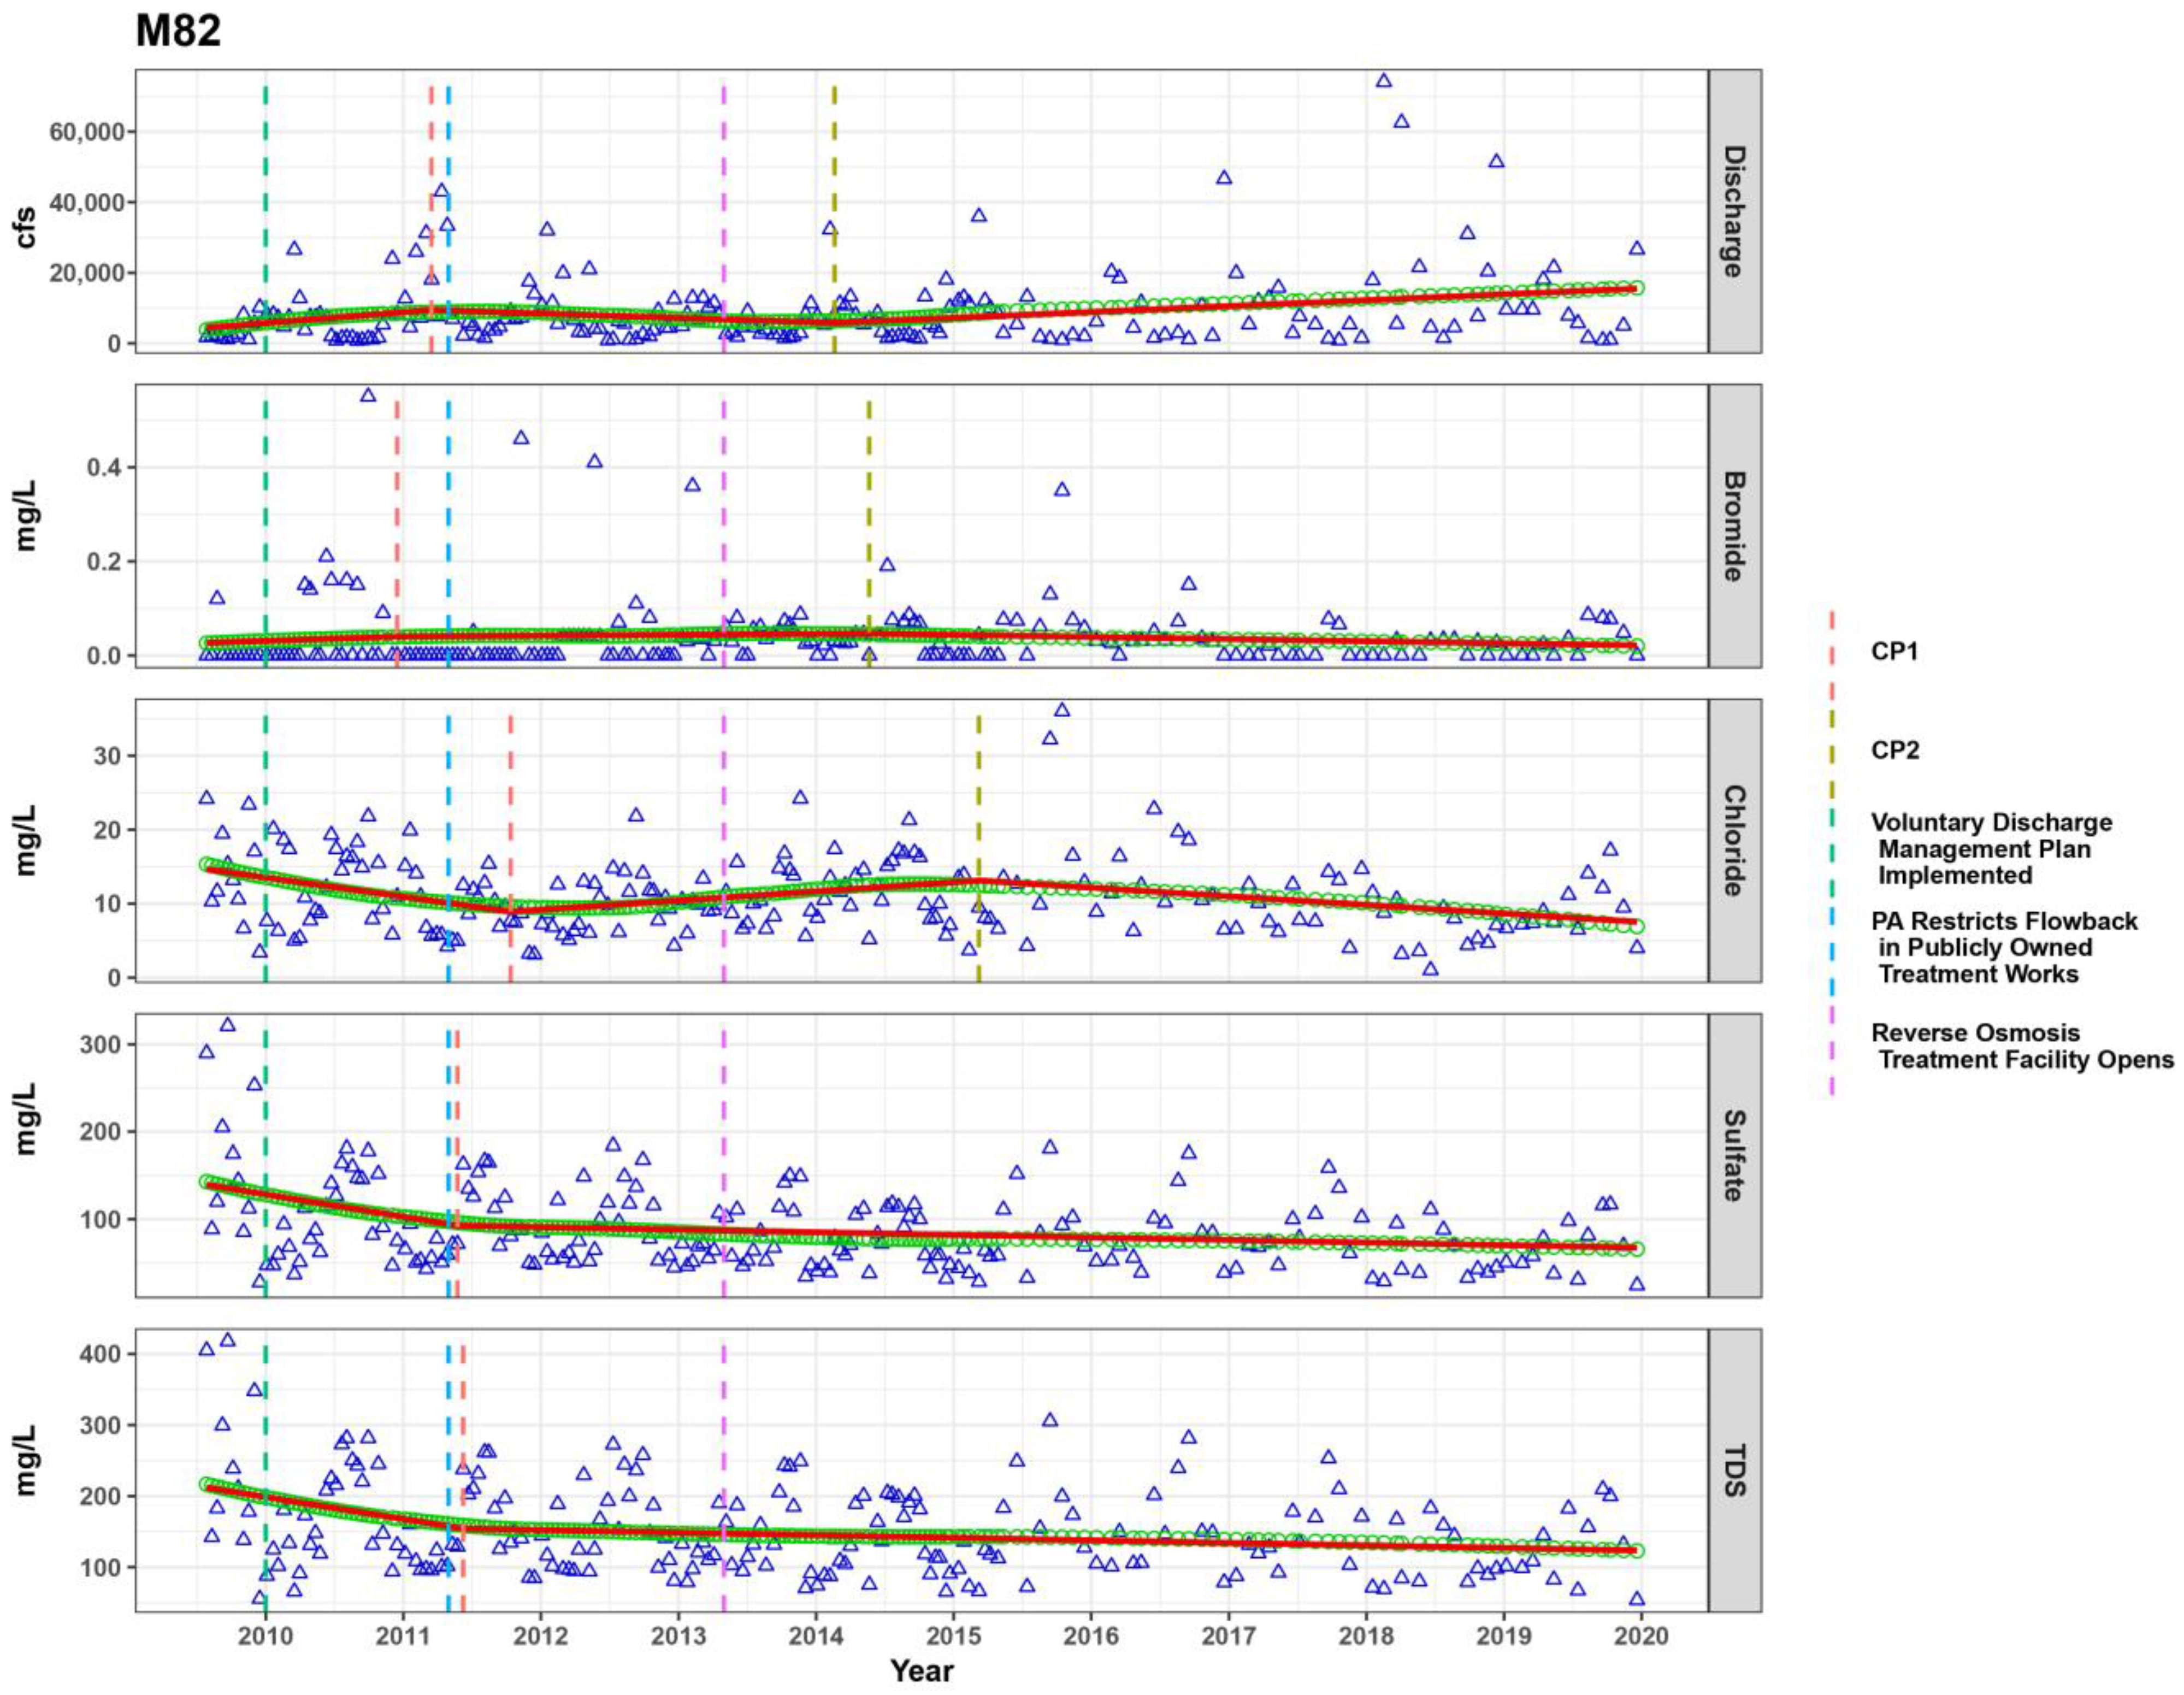
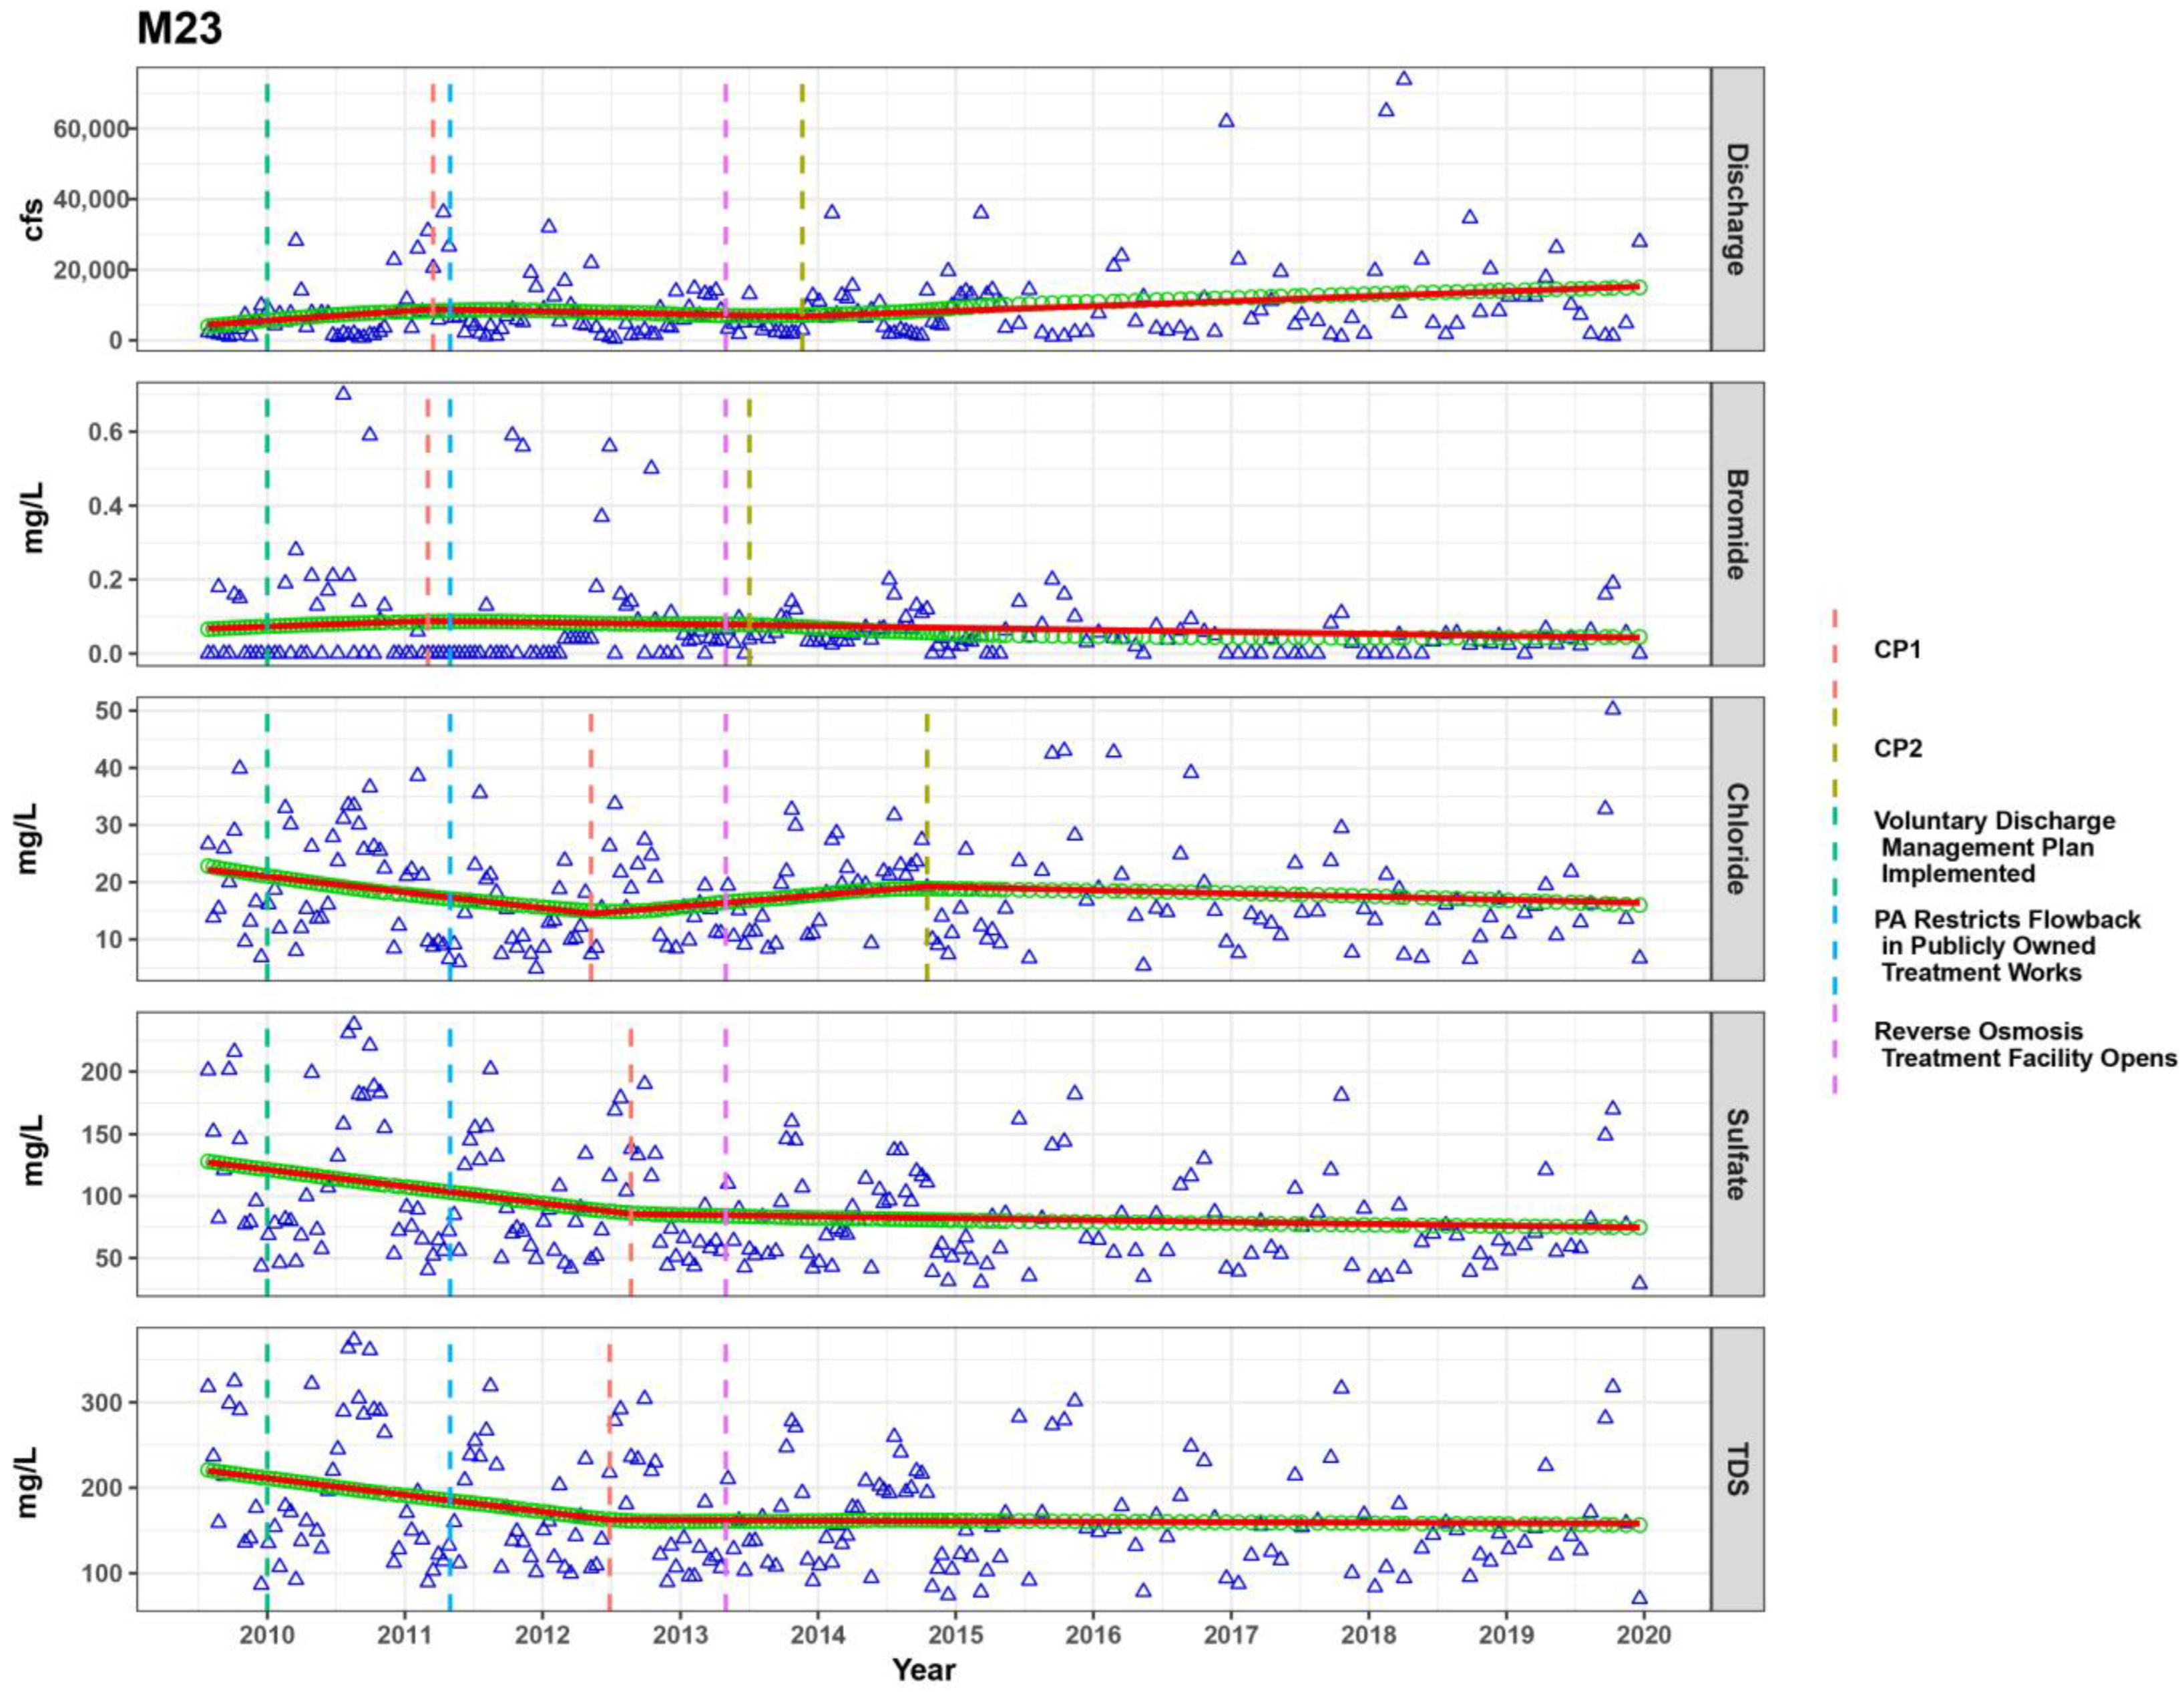
The following figures show the results of the LWPR-SegReg models for the mainstem sites of the Monongahela River. Within each site discharge (cfs), bromide (mg/L), chloride (mg/L), sulfate (mg/L), and TDS (mg/L) were modeled and changepoints were estimated based on the segmented regression. Also included within the figures are key dates for each site, which may include the implementation of the voluntary discharge management plan, Pennsylvania’s prohibition on depositing produced water into publicly owned treatment works, and the opening of a new reverse osmosis treatment facility.
Figure A1. Model output for the West Fork River showing key dates and changepoints. Color coded dashed lines are key dates and changepoints, blue triangles represent the raw data, green circles represent the smoothed data from the locally weighted polynomial regression, and the red lines are the segments from the segmented regression.
Water 15 00631 g0a1
Figure A2. Model output for the Tygart Valley River showing key dates and changepoints. Color coded dashed lines are key dates and changepoints, blue triangles represent the raw data, green circles represent the smoothed data from the locally weighted polynomial regression, and the red lines are the segments from the segmented regression.
Water 15 00631 g0a2
Figure A3. Model output for the Monongahela River at river mile 102 showing key dates and changepoints. Color coded dashed lines are key dates and changepoints, blue triangles represent the raw data, green circles represent the smoothed data from the locally weighted polynomial regression, and the red lines are the segments from the segmented regression.
Water 15 00631 g0a3
Figure A4. Model output for the Monongahela River at river mile 89 showing key dates and changepoints. Color coded dashed lines are key dates and changepoints, blue triangles represent the raw data, green circles represent the smoothed data from the locally weighted polynomial regression, and the red lines are the segments from the segmented regression.
Water 15 00631 g0a4
Figure A5. Model output for the Monongahela River at river mile 82 showing key dates and changepoints. Color coded dashed lines are key dates and changepoints, blue triangles represent the raw data, green circles represent the smoothed data from the locally weighted polynomial regression, and the red lines are the segments from the segmented regression.
Water 15 00631 g0a5
Figure A6. Model output for the Monongahela River at river mile 23 showing key dates and changepoints. Color coded dashed lines are key dates and changepoints, blue triangles represent the raw data, green circles represent the smoothed data from the locally weighted polynomial regression, and the red lines are the segments from the segmented regression.
Water 15 00631 g0a6
Table A1. LWPR-SegReg model results for the mainstem sites.
SiteModelParameterEstimateStd. errp-ValueSiteModelParameterEstimateStd. errp-ValueSiteModelParameterEstimateStd. errp-Value
WFDischargeα116.4060.319<0.001TVDischargeα118.8760.404<0.001M102Dischargeα148.5221.274<0.001
α2−4.9990.222 α2−8.2670.223 α2−29.2140.828
α313.080.222 α316.5400.010 α340.4860.352
α4−2.5540.355 AAPC9.0930.054 AAPC22.2340.0185
AAPC5.4110.058 CP12011-020.488 CP12013-060.279
CP12011-040.505 CP22013-060.377 CP22017-010.942
CP22013-080.562 Adjusted R20.996 Adjusted R20.999
CP32016-070.708 Bromideα1−0.00021.35 × 10−6<0.001 Bromideα1−0.00066.57 × 10−6 <0.001
Adjusted R20.992 α20.00027.00 × 10−6 α20.00074.01 × 10−5
Bromideα1−0.00023.56 × 10−6 <0.001 α3−0.00019.30 × 10−7 α3−0.00025.37 × 10−6
α2−0.00082.33 × 10−5 AAPC−0.00013.96 × 10−7 AAPC−0.00022.00 × 10−6
α30.00041.39 × 10−5 CP12012-070.287 CP12012-080.416
α4−0.00034.38 × 10−6 CP22013-070.350 CP22014-010.594
AAPC−0.00021.17 × 10−6 Adjusted R20.998 Adjusted R20.984
CP12012-080.531 Chlorideα1−0.0090.0005<0.001 Chlorideα1−0.0410.002<0.001
CP22013-070.332 α20.0340.0011 α20.0690.002
CP32014-100.473 α3−0.0410.0006 α3−0.0830.002
Adjusted R20.995 AAPC−0.0100.0002 AAPC−0.1920.0004
Chlorideα1−0.0690.002<0.001 CP12012-070.880 CP12012-030.761
α20.1260.003 CP22014-070.500 CP22014-110.551
α3−0.0990.001 Adjusted R20.977 Adjusted R20.968
AAPC−0.0360.001 Sulfateα10.0080.001<0.001 Sulfateα1−0.4220.002<0.001
CP12012-050.601 α2−0.0570.001 α2−0.0120.002
CP22014-030.504 α30.0200.001 AAPC−0.2210.001
Adjusted R20.976 AAPC−0.0120.0003 CP12013-080.472
Sulfateα1−1.2270.015<0.001 CP12011-110.771 Adjusted R20.998
α2−0.06630.004 CP22014-100.629 TDSα1−0.4600.001<0.001
α30.3550.005 Adjusted R20.991 α20.0040.003
AAPC−0.3760.002 TDSα10.0420.002<0.001 α3−0.1770.007
CP12010-120.633 α2−0.0710.001 AAPC−0.2540.001
CP22014-070.274 α30.0060.001 CP12013-060.279
Adjusted R20.999 AAPC−0.0120.0002 CP22017-010.942
TDSα1−1.5090.013<0.001 CP12011-030.421 Adjusted R20.999
α2−0.6020.004 CP22013-110.511
α30.1410.004 Adjusted R20.995
AAPC−0.4880.002
CP12011-020.381
CP22014-060.379
Adjusted R20.999
M89Dischargeα153.2351.124<0.001M82Dischargeα1122.1503.009<0.001M23Dischargeα1106.7602.365<0.001
α2−25.9680.627 α2−52.3741.369 α2−31.6771.200
α343.0660.341 α3116.0301.045 α394.7250.754
AAPC23.4620.165 AAPC56.4010.446 AAPC54.7980.347
CP12011-030.446 CP12011-030.527 CP12011-030.529
CP22013-090.419 CP22014-020.452 CP22013-120.477
Adjusted R20.994 Adjusted R20.992 Adjusted R20.995
Bromideα10.00081.55 × 10−5 <0.001 Bromideα10.00041.33 × 10−5 <0.001 Bromideα15.05 × 10⁻⁴ 1.30 × 10⁻⁵ <0.001
α20.00011.30 × 10−5 α20.00083.73 × 10−6 α2−1.82 × 10⁻⁴ 7.90 × 10⁻⁵
α3−0.00071.55 × 10−5 α3−0.00034.16 × 10−6 α3−6.48 × 10⁻⁴ 9.07 × 10⁻⁶
α40.00011.35 × 10−6 AAPC−2.70 × 10⁻⁵ 1.66 × 10⁻⁶ α4−2.74 × 10⁻⁵ 1.02 × 10⁻⁵
AAPC0.00011.17 × 10−6 CP12010-121.095 AAPC0.00012.08 × 10−6
CP12010-070.410 CP22014-050.650 CP12011-030.584
CP22011-070.354 Adjusted R20.970 CP22013-070.807
CP32012-070.300 Chlorideα1−0.1030.003<0.001 CP32015-120.634
Adjusted R20.990 α20.0520.001 Adjusted R20.997
Chlorideα1−0.0280.0010<0.001 α3−0.0940.001 Chlorideα1−0.1110.001<0.001
α20.0790.0016 AAPC−0.0360.001 α20.0820.002
α3−0.0680.0009 CP12011-090.687 α3−0.0420.001
AAPC−0.0160.0003 CP22015-040.712 AAPC−0.0290.0003
CP12012-040.590 Adjusted R20.964 CP12012-050.397
CP22014-060.419 Sulfateα1−1.0180.066<0.001 CP22014-100.620
Adjusted R20.981 α2−0.1650.005 Adjusted R20.985
Sulfateα1−0.4590.002<0.001 AAPC−0.3660.003 Sulfateα1−0.5430.001<0.001
α20.0610.003 CP12011-050.651 α2−0.0910.001
AAPC−0.2310.001 Adjusted R20.992 AAPC−0.2670.0003
CP12014-010.497 TDSα1−1.2270.016<0.001 CP12012-080.146
Adjusted R20.998 α2−0.1350.004 Adjusted R20.999
TDSα1−0.4860.002<0.001 α3−0.4760.033 TDSα1−0.7840.005<0.001
α20.0110.002 AAPC−0.4490.004 α2−0.0340.002
AAPC−0.2530.001 CP12011-060.495 AAPC−0.3130.001
CP12013-100.298 CP22017-061.898 CP12012-060.339
Adjusted R20.999 Adjusted R20.994 Adjusted R20.998

Appendix B

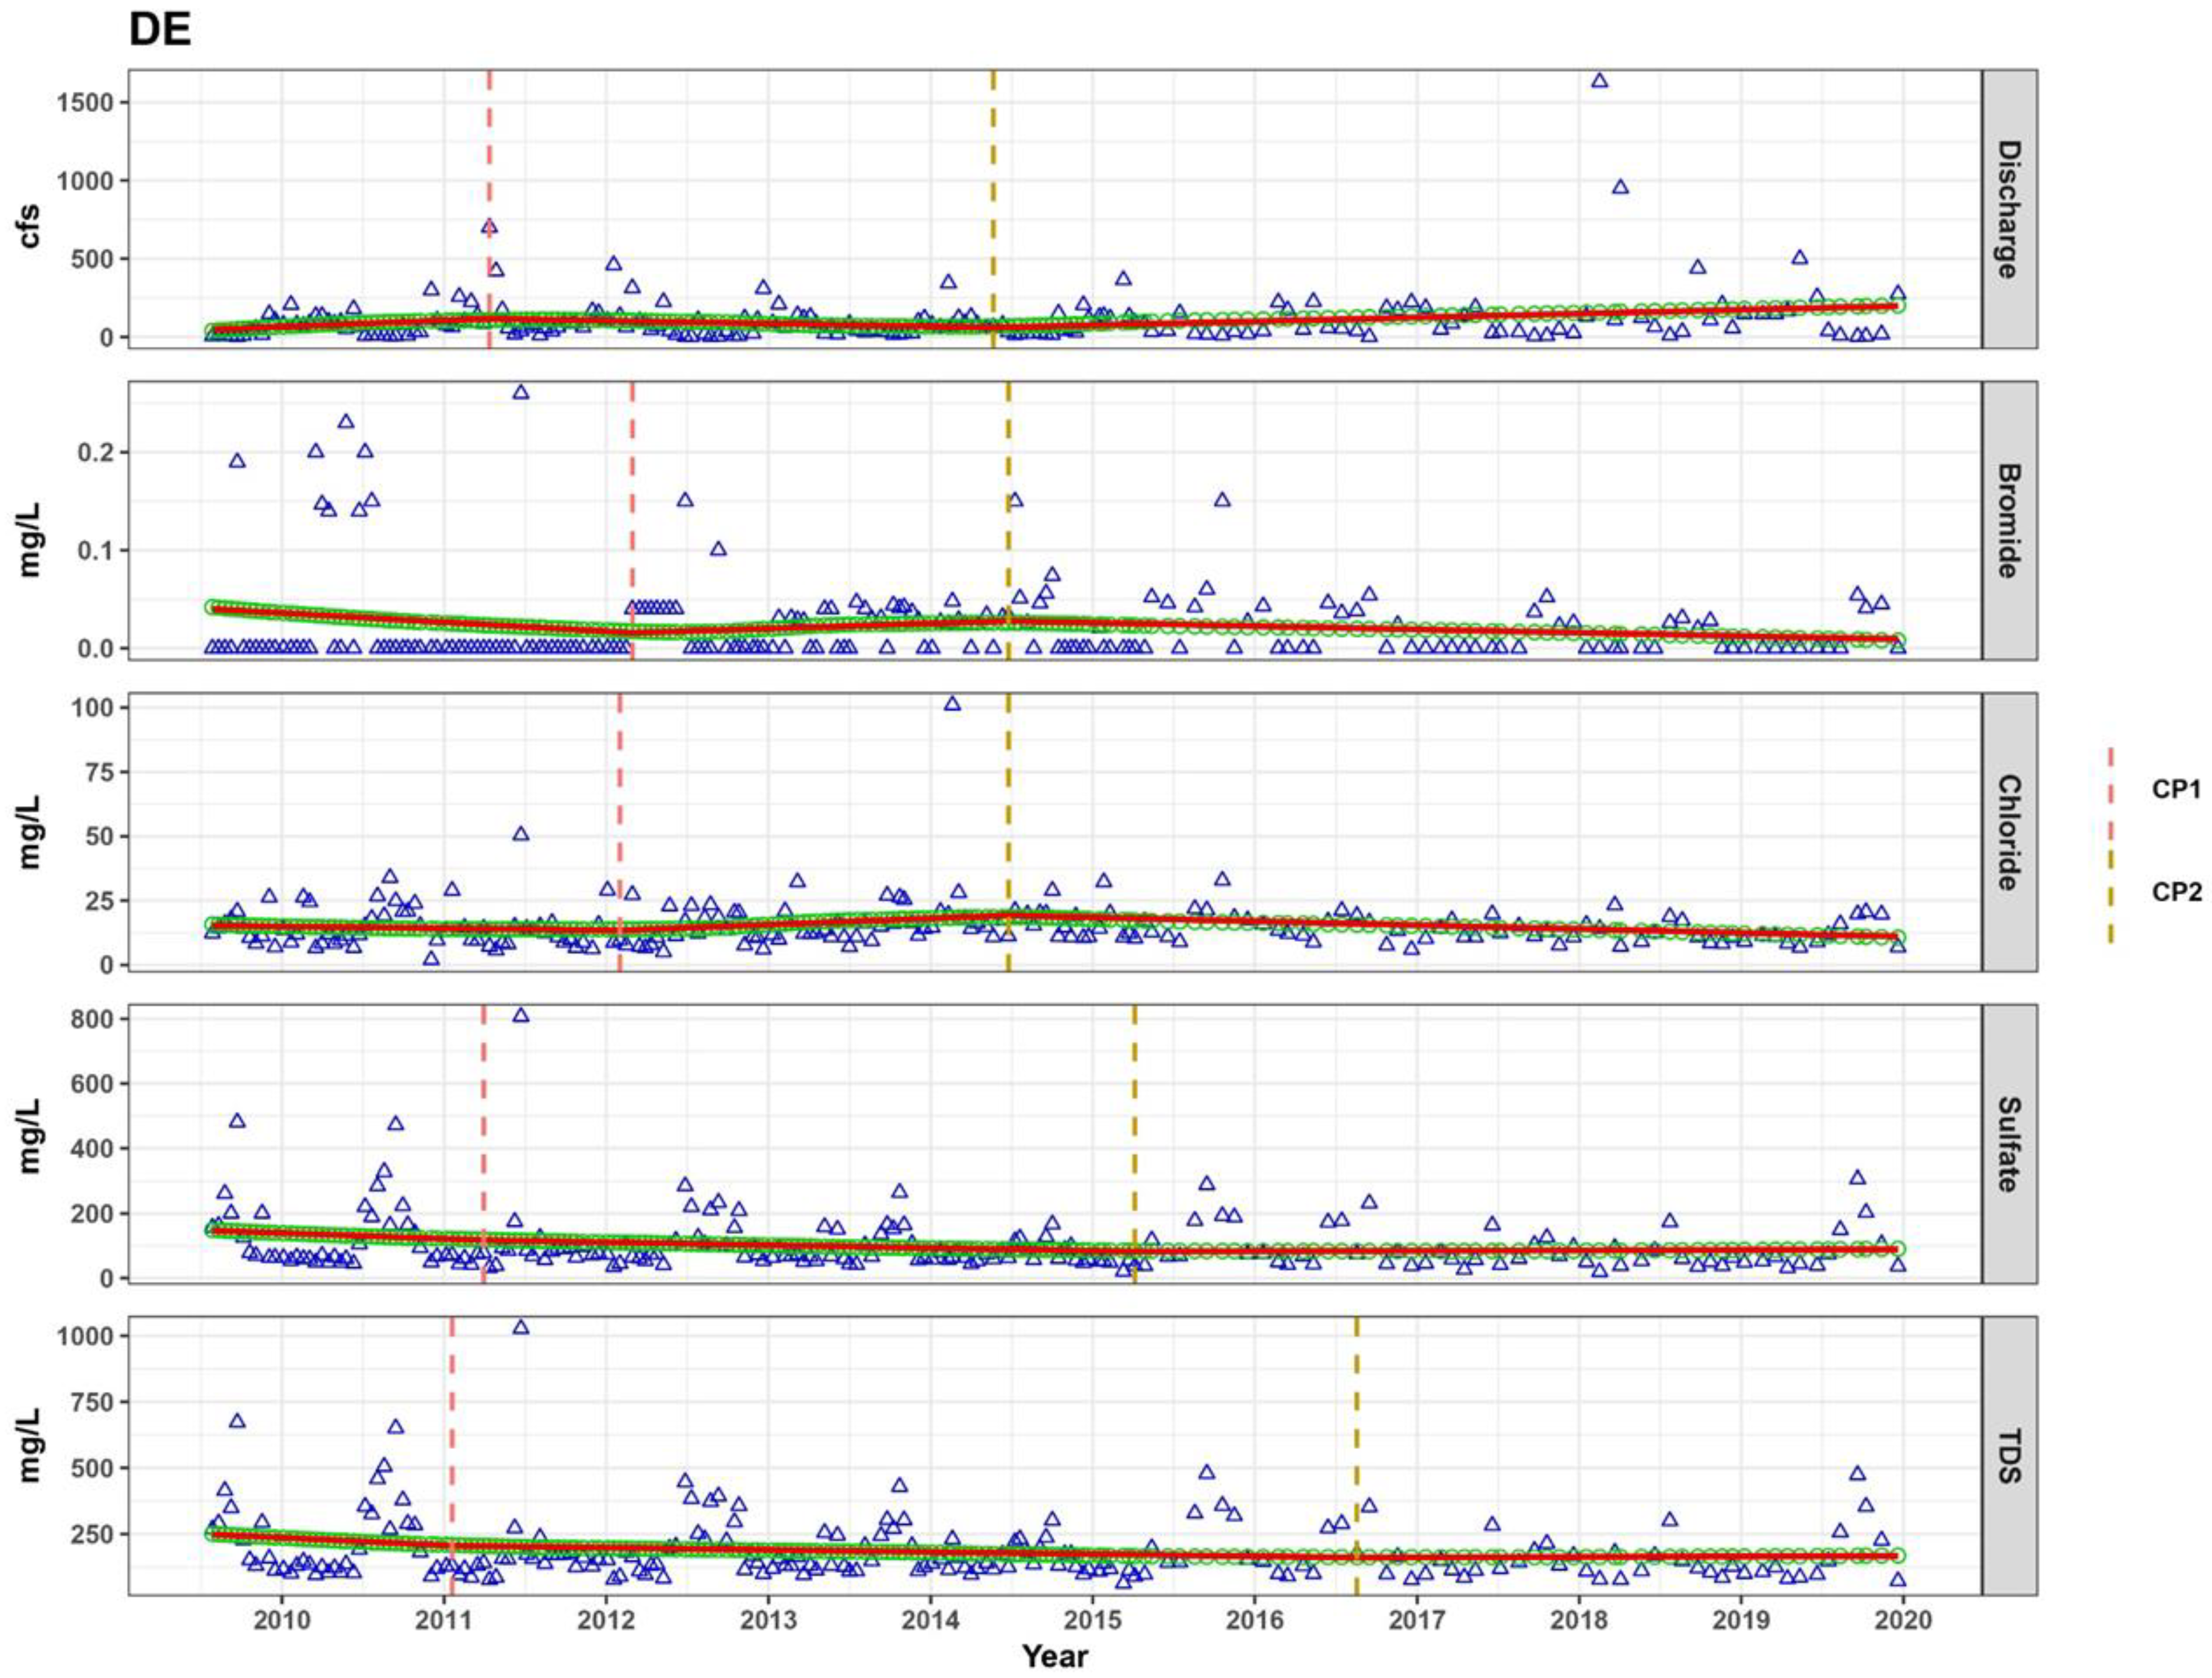
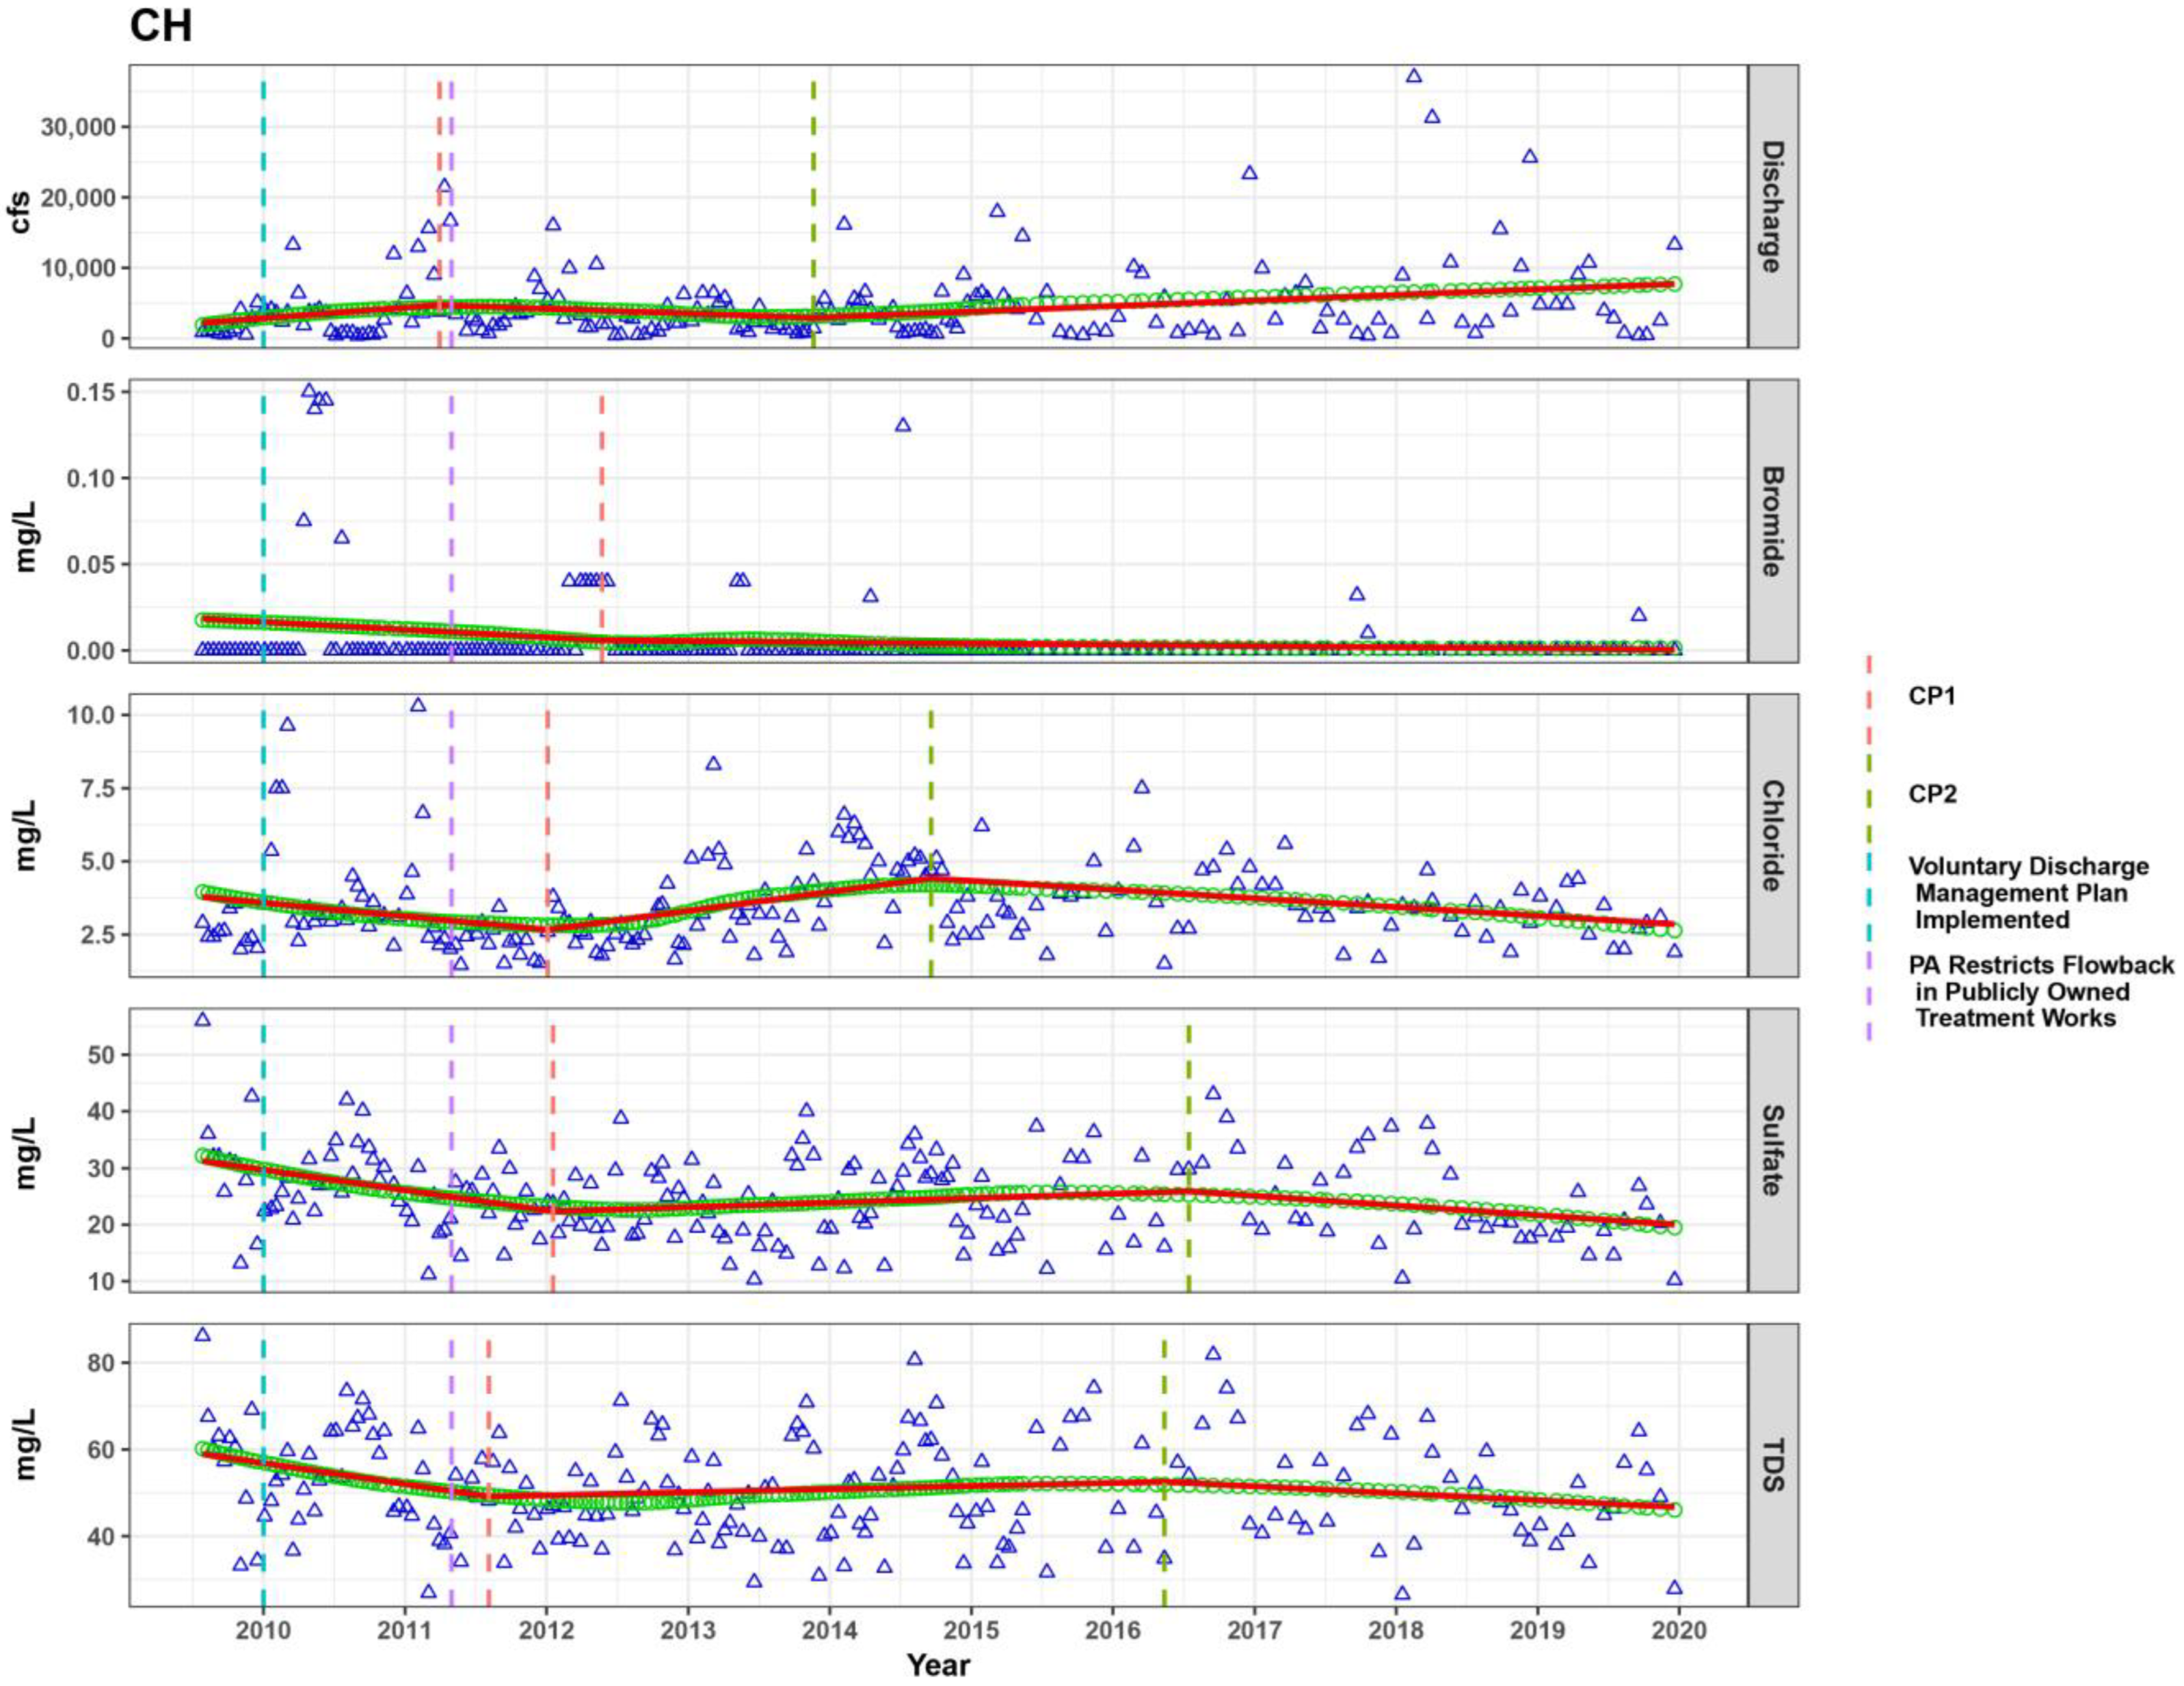
The following figures show the results of the LWPR-SegReg models for the mainstem sites of the Monongahela River. Within each site discharge (cfs), bromide (mg/L), chloride (mg/L), sulfate (mg/L), and TDS (mg/L) were modeled and changepoints were estimated based on the segmented regression. Also included within the figures are key dates for each site, which may include the implementation of the voluntary discharge management plan, Pennsylvania’s prohibition on depositing produced water into publicly owned treatment works, and the opening of the new reverse osmosis treatment facility.
Figure A7. Model output for Deckers Creek showing key dates and changepoints. Color coded dashed lines are key dates and changepoints, blue triangles represent the raw data, green circles represent the smoothed data from the locally weighted polynomial regression, and the red lines are the segments from the segmented regression.
Water 15 00631 g0a7
Figure A8. Model output for the Cheat River showing key dates and changepoints. Color coded dashed lines are key dates and changepoints, blue triangles represent the raw data, green circles represent the smoothed data from the locally weighted polynomial regression, and the red lines are the segments from the segmented regression.
Water 15 00631 g0a8
Figure A9. Model output for Dunkard Creek showing key dates and changepoints. Color coded dashed lines are key dates and changepoints, blue triangles represent the raw data, green circles represent the smoothed data from the locally weighted polynomial regression, and the red lines are the segments from the segmented regression.
Water 15 00631 g0a9
Figure A10. Model output for Whiteley Creek showing key dates and changepoints. Color coded dashed lines are key dates and changepoints, blue triangles represent the raw data, green circles represent the smoothed data from the locally weighted polynomial regression, and the red lines are the segments from the segmented regression.
Water 15 00631 g0a10
Figure A11. Model output for Tenmile Creek showing key dates and changepoints. Color coded dashed lines are key dates and changepoints, blue triangles represent the raw data, green circles represent the smoothed data from the locally weighted polynomial regression, and the red lines are the segments from the segmented regression.
Water 15 00631 g0a11
Figure A12. Model output for the Youghiogheny River showing key dates and changepoints. Color coded dashed lines are key dates and changepoints, blue triangles represent the raw data, green circles represent the smoothed data from the locally weighted polynomial regression, and the red lines are the segments from the segmented regression.
Water 15 00631 g0a12
Table A2. LWPR-SegReg model results for the tributary sites.
SiteModelParameterEstimateStd. errp-ValueSiteModelParameterEstimateStd. errp-ValueSiteModelParameterEstimateStd. errp-Value
CHDischargeα159.9171.350<0.001DEDischargeα11.6130.040<0.001DUDischargeα17.0020.156<0.001
α2−28.2580.726 α2−0.7570.017 α2−3.5110.081
α353.6440.446 α31.7730.017 α36.8060.067
AAPC27.9740.204 AAPC0.7610.006 AAPC3.1200.026
CP12011-030.489 CP12011-040.533 CP12011-050.504
CP22013-110.436 CP22014-050.426 CP22014-040.442
Adjusted R20.993 Adjusted R20.991 Adjusted R20.991
Bromideα1−2.00 × 10⁻⁴ 4.12 × 10⁻⁶ <0.001 Bromideα1−0.00045.58 × 10−6 <0.001 Bromideα10.00348.10 × 10−5 <0.001
α2−4.00 × 10⁻⁵ 1.72 × 10⁻⁶ α20.00027.33 × 10−6 α2−0.00038.44 × 10−5
AAPC−0.00011.06 × 10−6 α3−0.00024.42 × 10−6 α3−0.00681.30 × 10−4
CP12012-051.578 AAPC−0.00021.45 × 10−6 α4−0.00214.02 × 10−5
Adjusted R20.980 CP12012-020.529 α5−0.00627.49 × 10−5
Chlorideα1−0.0180.0007<0.001 CP22014-060.653 AAPC−0.00221.20 × 10−5
α20.0270.0006 Adjusted R20.985 CP12011-010.671
α3−0.0220.0006 Chlorideα1−0.0290.002<0.001 CP22012-060.410
AAPC−0.0050.0002 α20.1010.002 CP32013-070.512
CP12012-010.745 α3−0.1080.001 CP42016-100.523
CP22014-090.662 AAPC−0.0220.0004 Adjusted R20.999
Adjusted R20.961 CP12012-020.687 Chlorideα1−1.6510.037<0.001
Sulfateα1−0.1440.002<0.001 CP22014-060.409 α20.0850.010
α20.0390.001 Adjusted R20.984 α3−0.9080.017
α3−0.1440.004 Sulfateα1−0.7060.013<0.001 AAPC−0.5820.005
AAPC−0.0570.001 α2−0.3580.004 CP12011-020.573
CP12012-010.583 α30.1020.008 CP22014-110.847
CP22016-070.675 AAPC−0.2990.002 Adjusted R20.988
Adjusted R20.981 CP12011-031.078 Sulfateα1−39.4630.772<0.001
TDSα1−0.1920.003<0.001 CP22015-040.741 α2−4.2650.085
α20.0570.002 Adjusted R20.997 AAPC−10.7610.091
α3−0.1350.005 TDSα1−1.1640.013<0.001 CP12011-010.517
AAPC−0.0620.001 α2−0.3770.002 Adjusted R20.990
CP12012-010.556 α30.1520.011 TDSα1−44.4950.602<0.001
CP22016-050.800 AAPC−0.4150.002 α2−3.1840.142
Adjusted R20.978 CP12011-010.412 α3−8.9840.341
CP22016-080.586 AAPC−12.9610.088
Adjusted R20.999 CP12011-020.388
CP22015-042.408
Adjusted R20.994
TMDischargeα13.5000.078<0.001WHDischargeα13.0180.078<0.001YODischargeα122.9870.737<0.001
α2−1.7570.041 α2−1.7350.037 α2−10.4870.237
α33.4030.033 α33.3960.030 α356.8200.271
AAPC1.5590.013 AAPC1.4470.012 AAPC21.8370.102
CP12011-050.504 CP12011-060.515 CP12011-020.599
CP22014-040.441 CP22014-040.402 CP22014-060.244
Adjusted R20.991 Adjusted R20.992 Adjusted R20.998
Bromideα10.0011.85 × 10−4 <0.001 Bromideα1−0.0310.0005<0.001 Bromideα1−0.00023.25 × 10−6 <0.001
α2−0.0073.40 × 10−4 α20.0050.0003 α2−0.00018.33 × 10−6
α30.0023.48 × 10−5 α3−0.0260.0008 α3−0.00075.34 × 10−6
AAPC−0.0022.59 × 10−5 AAPC−0.0140.0001 AAPC−0.00031.29 × 10−6
CP12011-030.825 CP12012-030.714 CP12013-012.303
CP22012-051.218 CP22015-120.883 CP22014-120.505
Adjusted R20.992 Adjusted R20.984 Adjusted R20.998
Chlorideα1−0.3160.009<0.001 Chlorideα1−3.7300.085<0.001 Chlorideα1−0.3190.015<0.001
α20.5920.017 α21.0280.038 α20.4570.011
α3−0.5820.008 α3−3.6460.093 α3−0.5420.010
AAPC−0.2080.003 AAPC−1.4710.019 AAPC−0.1320.003
CP12012-060.647 CP12011-100.689 CP12011-090.847
CP22014-050.495 CP22015-100.715 CP22014-070.609
Adjusted R20.979 Adjusted R20.973 Adjusted R20.966
Sulfateα1−1.0370.023<0.001 Sulfateα1−12.8880.218<0.001 Sulfateα1−0.2840.014<0.001
α21.0770.031 α20.8510.060 α2−0.0170.015
α3−1.2050.018 α3−9.5300.243 α3−0.1360.002
AAPC−0.5250.006 AAPC−4.4470.041 AAPC−0.1420.002
CP12012-030.625 CP12011-060.479 CP12010-121.569
CP22014-050.559 CP22016-070.652 CP22012-042.835
Adjusted R20.979 Adjusted R20.988 Adjusted R20.986
TDSα1−0.9430.032<0.001 TDSα1−17.7480.339<0.001 TDSα1−0.7000.028<0.001
α22.0600.055 α22.1990.100 α20.3990.011
α3−2.0250.027 α3−14.4050.362 α3−0.7780.013
AAPC−0.6230.009 AAPC−6.2810.066 AAPC−0.2780.004
CP12012-050.675 CP12011-060.543 CP12011-040.796
CP22014-050.485 CP22016-040.664 CP22014-070.630
Adjusted R20.978 Adjusted R20.983 Adjusted R20.973

References

  1. Wilson, J.M.; Van Briesen, J.M. Source Water Changes and Energy Extraction Activities in the Monongahela River, 2009–2012. Environ. Sci. Technol. 2013, 47, 12575–12582. [Google Scholar] [CrossRef] [PubMed]
  2. Tetra Tech. Evaluation of High TDS Concentrations in the Monongahela River; Tetra Tech NUS, Inc.: Pittsburgh, PA, USA, 2019. [Google Scholar]
  3. Sams, J.I.; Beer, K.M.; US Department of Interior (DOI); US Geological Survey (USGS). Effects of Coal-Mine Drainage on Stream Water Quality in the Allegheny and Monongahela River Basin: Sulfate Transport and Trends; Water-Resources Investigations Report; United States Geological Survey, Branch of Information Services: Denver, CO, USA, 2000; pp. 99–4208.
  4. United States Army Corps of Engineers (USACE). Monongahela River Initial Watershed Assessment. US Army Corps of Engineers Pittsburgh District. Available online: https://www.lrp.usace.army.mil/Portals/72/docs/HotProjects/signed%20IWA_final_revised%20FEB12%20public%20comments%20incorporated.pdf (accessed on 7 July 2021).
  5. Ziemkiewicz, P. Wastewater from Coal and Gas Development: Chemical Signatures in the Monongahela Basin. West Virginia Surface Mine Drainage Task Force. Available online: https://wvmdtaskforce.files.wordpress.com/2016/01/11-ziek.doc (accessed on 20 February 2020).
  6. Merriam, E.R.; Petty, J.T.; O’Neal, M.; Ziemkiewicz, P.F. Flow-mediated vulnerability of source waters to elevated TDS in an Appalachian River Basin. Water 2020, 12, 384. [Google Scholar] [CrossRef]
  7. Ziemkiewicz, P. Discharge Management to Control TDS in the Upper Monongahela Basin. West Virginia Surface Mine Drainage Task Force. Available online: Wvmdtaskforce.files.wordpress.com/2016/01/10-ziemk-tds-water-quality-flow-monitoring-upper.doc (accessed on 20 February 2020).
  8. Ferrar, K.J.; Michanowicz, D.R.; Christen, C.L.; Mulcahy, N.; Malone, S.L.; Sharma, R.K. Assessment of Effluent Contaminants from Three Facilities Discharging Marcellus Shale Wastewater to Surface Waters in Pennsylvania. Environ. Sci. Technol. 2013, 47, 3472–3481. [Google Scholar] [CrossRef]
  9. He, C.; Zhang, T.; Zheng, X.; Li, Y.; Vidic, R.D. Management of Marcellus Shale Produced Water in Pennsylvania: A Review of Current Strategies and Perspectives. Energy Technol. 2014, 2, 968–976. [Google Scholar] [CrossRef]
  10. Warner, N.R.; Christie, C.A.; Jackson, R.B.; Vengosh, A. Impacts of Shale Gas Wastewater Disposal on Water Quality in Western Pennsylvania. Environ. Sci. Technol. 2013, 47, 11849–11857. [Google Scholar] [CrossRef]
  11. Symons, J.M.; Krasner, S.W.; Simms, L.A.; Sclimenti, M. Measurement of THM and Precursor Concentrations Revisited: The Effect of Bromide Ion. J. Am. Water Work. Assoc. 1993, 85, 51–62. [Google Scholar] [CrossRef]
  12. Hua, G.; Reckhow, D.A.; Kim, J. Effect of Bromide and Iodide Ions on the Formation and Speciation of Disinfection Byproducts during Chlorination. Environ. Sci. Technol. 2006, 40, 3050–3056. [Google Scholar] [CrossRef] [PubMed]
  13. Bird, J.C. The Effect of Bromide on Trihalomethane Formation. Master’s Thesis, University of Tennessee, Knoxville, TN, USA, 1979. [Google Scholar]
  14. DEP Calls on Natural Gas Drillers to Stop Giving Treatment Facilities Wastewater; Pennsylvania Department of Environmental Protection (PADEP): Harrisburg, PA, USA, 2011.
  15. United States Environmental Protection Agency (USEPA). Hydraulic Fracturing for Oil and Gas: Impacts from the Hydraulic Fracturing Water Cycle on Drinking Water Resources in the United States (Executive Summary); US Environmental Protection Agency: Washington, DC, USA, 2016.
  16. Wilson, J.M.; VanBriesen, J.M. Research Articles: Oil and Gas Produced Water Management and Surface Drinking Water Sources in Pennsylvania. Environ. Pract. 2012, 14, 288–300. [Google Scholar] [CrossRef]
  17. Jernejcic, F.; Wellman, D. Dunkard Creek Fish Kill Assessment September 2009. Available online: http://www.uppermon.org/Dunkard_Creek/WQF3Dec09/Frank%20Jernejcic%20_Dunkard%20Ck%20Fish%20kill%2012-3-09.pdf (accessed on 9 October 2009).
  18. Hartman, K.J.; Wellman, D.I.; Kingsbury, J.W.; Cincotta, D.A.; Clayton, J.L.; Eliason, K.M.; Jernejcic, F.A.; Owens, N.V.; Smith, D.M. A Case Study of a Prymnesium parvum Harmful Algae Bloom in the Ohio River Drainage: Impact, Recovery and Potential for Future Invasions/Range Expansion. Water 2021, 13, 3233. [Google Scholar] [CrossRef]
  19. Consent Decree, State of West Virginia through West Virginia Department of Environmental Protection vs CONSOL Energy, Inc.; CONSOLIDATION COAL COMPANY; and WINDSOR COAL COMPANY. Available online: www.epa.gov/sites/production/files/2013-09/documents/consol-cd.pdf (accessed on 30 June 2021).
  20. Owsiany, J. Chloride-TDS Reduction Strategy for Operating Mines in Northern West Virginia. West Virginia Mine Drainage Task Force 2013 Symposium. Available online: https://wvmdtaskforce.files.wordpress.com/2016/01/13-owsiany-final.pdf (accessed on 10 July 2021).
  21. Garud, R.M.; Kore, S.V.; Kore, V.S.; Kulkarni, G.S. A Short Review on Process and Applications of Reverse Osmosis. Univers. J. Environ. Res. Technol. 2011, 1, 233–238. [Google Scholar]
  22. Wenten, I.G. Reverse osmosis applications: Prospect and challenges. Desalination 2016, 391, 112–125. [Google Scholar] [CrossRef]
  23. Oyewo, O.A.; Agboola, O.; Onyango, M.S.; Popoola, P.; Bobape, M.F. Current Methods for the Remediation of Acid Mine Drainage Including Continuous Removal of Metals From Wastewater and Mine Dump. In Bio-Geotechnologies for Mine Site Rehabilitation; Elsevier: Amsterdam, The Netherlands, 2018; pp. 103–114. [Google Scholar] [CrossRef]
  24. United States Geological Survey (USGS). National Hydrography Dataset Medium-Resolution Data (Published 20180206). Available online: https://www.usgs.gov/core-science-systems/ngp/national-hydrography/access-national-hydrography-products (accessed on 6 April 2021).
  25. Bodo, B.A. Robust graphical methods for diagnosing trend in irregularly spaced water quality time series. Environ. Monit. Assess. 1989, 13, 407–428. [Google Scholar] [CrossRef] [PubMed]
  26. Cleveland, W.S.; Devlin, S.J. Locally-Weighted Regression: An Approach to Regression Analysis by Local Fitting. J. Am. Stat. Assoc. 1988, 83, 596–610. [Google Scholar] [CrossRef]
  27. Rajagopalan, B.; Lall, U. Locally weighted polynomial estimation of spatial precipitation. J. Geogr. Inf. Decis. Anal. 1998, 2, 44–51. [Google Scholar]
  28. Luati, A.; Proietti, T. On the equivalence of the weighted least squares and the generalised least squares estimators, with applications to kernel smoothing. Ann. Inst. Stat. Math. 2011, 63, 851–871. [Google Scholar] [CrossRef]
  29. R Core Team. R: A Language and Environment for Statistical Computing; R Foundation for Statistical Computing: Vienna, Austria, 2022; Available online: https://www.R-project.org/ (accessed on 12 April 2022).
  30. Huang, H.; Wang, Z.; Xia, F.; Shang, X.; Liu, Y.; Zhang, M.; Dahlgren, R.A.; Mei, K. Water quality trend and change-point analyses using integration of locally weighted polynomial regression and segmented regression. Environ. Sci. Pollut. Res. 2017, 24, 15827–15837. [Google Scholar] [CrossRef]
  31. Kazemnejad, A.; Arsang Jang, S.; Amani, F.; Omidi, A. Global epidemic trend of tuberculosis during 1990-2010: Using segmented regression model. J. Res. Health Sci. 2014, 14, 115–121. [Google Scholar]
  32. McDowall, D.; McCleary, R.; Bartos, B.J. Interrupted Time Series Analysis; Oxford University Press: Oxford, UK, 2019. [Google Scholar]
  33. Clegg, L.X.; Hankey, B.F.; Tiwari, R.; Feuer, E.J.; Edwards, B.K. Estimating average annual per cent change in trend analysis. Stat. Med. 2009, 28, 3670–3682. [Google Scholar] [CrossRef]
  34. Davies, R.B. Hypothesis testing when a nuisance parameter is present only under the alternative: Linear model case. Biometrika 2002, 89, 484–489. [Google Scholar] [CrossRef]
  35. Muggeo, V.M.R. Interval estimation for the breakpoint in segmented regression: A smoothed score-based approach. Aust. N. Z. J. Stat. 2017, 59, 311–322. [Google Scholar] [CrossRef]
  36. Mathews, T.J.; Hamilton, B.E. Trend analysis of the sex ratio at birth in the United States. National Vital Statistics Reports: From the Centers for Disease Control and Prevention, National Center for Health Statistics. Natl. Vital Stat. Syst. 2005, 53, 1–17. [Google Scholar]
  37. Wu, J.-L.; Chang, P.-C. A Trend-Based Segmentation Method and the Support Vector Regression for Financial Time Series Forecasting. Math. Probl. Eng. 2012, 2012, 615152. [Google Scholar] [CrossRef]
  38. Zuur, A.F.; Ieno, E.N.; Walker, N.J.; Saveliev, A.A.; Smith, G.M. Mixed Effects Models and Extensions in Ecology with R; Springer: New York, NY, USA, 2009; Volume 574. [Google Scholar]
  39. Arnold, T.W. Uninformative Parameters and Model Selection Using Akaike’s Information Criterion. J. Wildl. Manag. 2010, 74, 1175–1178. [Google Scholar] [CrossRef]
  40. Kuznetsova, A.; Brockhoff, P.B.; Christensen, R.H.B. lmerTest Package: Tests in Linear Mixed Effects Models. J. Stat. Softw. 2017, 82, 1–26. [Google Scholar] [CrossRef]
  41. Bates, D.; Maechler, M.; Bolker, B.; Walker, S. Fitting Linear Mixed-Effects Models Using lme4. J. Stat. Softw. 2015, 67, 1–48. [Google Scholar] [CrossRef]
  42. Bartoń, K. MuMIn: Multi-Model Inference. R Package Version 1.47.1. Available online: https://CRAN.R-project.org/package=MuMIn (accessed on 12 April 2022).
  43. Petty, J.T.; Barker, J. Water quality variability in tributaries of the Cheat River, a mined Appalachian watershed. In Proceedings of the Joint Conference of the 21st Annual Meeting of the American Society of Mining and Reclamation and 25th West Virginia Surface Mine Drainage Task Force Symposium, Morgantown, WV, USA, 18–22 April 2004. [Google Scholar]
  44. Nilsson, C.; Renöfält, B.M. Linking flow regime and water quality in rivers: A challenge to adaptive catchment management. Ecol. Soc. 2008, 13, 18. [Google Scholar] [CrossRef]
  45. Elshorbagy, A.; Teegavarapu, R.S.; Ormsbee, L. Total maximum daily load (TMDL) approach to surface water quality management: Concepts, issues, and applications. Can. J. Civ. Eng. 2005, 32, 442–448. [Google Scholar] [CrossRef]
  46. Copeland, C. Clean Water Act and Pollutant Total Maximum Daily Loads (TMDLs); Congressional Research Service: Washington, DC, USA, 2012.
  47. Linker, L.C.; Batiuk, R.A.; Shenk, G.W.; Cerco, C.F. Development of the Chesapeake Bay Watershed Total Maximum Daily Load Allocation. JAWRA J. Am. Water Resour. Assoc. 2013, 49, 986–1006. [Google Scholar] [CrossRef]
  48. United States Environmental Protection Agency (USEPA). Restoring the Legendary Lynnhaven Oysters in Virginia: Coordinated Actions Lower Bacteria Levels and Reopen Shellfish Areas in the Lynnhaven River Watershed; US Environmental Protection Agency: Washington, DC, USA, 2009. Available online: https://nepis.epa.gov/Exe/ZyPDF.cgi/P1007N7U.PDF?Dockey=P1007N7U.PDF (accessed on 2 June 2022).
  49. United States Environmental Protection Agency (USEPA). Letting the Middle Cuyahoga River Run: TMDL Implementation Restores Flow, Improves Water Quality, and Preserves a Community’s Sense of History; US Environmental Protection Agency: Washington, DC, USA, 2009. Available online: https://nepis.epa.gov/Exe/ZyPDF.cgi/P1007N80.PDF?Dockey=P1007N80.PDF (accessed on 2 June 2022).
  50. Bonacquisti, T.P. A drinking water utility’s perspective on bromide, bromate, and ozonation. Toxicology 2006, 221, 145–148. [Google Scholar] [CrossRef]
  51. Chen, S.S.; Sun, Y.; Tsang, D.C.; Graham, N.J.; Ok, Y.S.; Feng, Y.; Li, X.D. Potential impact of flowback water from hydraulic fracturing on agricultural soil quality: Metal/metalloid bioaccessibility, Microtox bioassay, and enzyme activities. Sci. Total Environ. 2017, 579, 1419–1426. [Google Scholar] [CrossRef]
  52. Blewett, T.A.; Weinrauch, A.M.; Delompré, P.L.; Goss, G.G. The effect of hydraulic flowback and produced water on gill morphology, oxidative stress and antioxidant response in rainbow trout (Oncorhynchus mykiss). Sci. Rep. 2017, 7, 46582. [Google Scholar] [CrossRef] [PubMed]
  53. Vaclav, P.; Eva, G. Desalting of Acid Mine Drainage by Reverse Osmosis Method–Field Tests. In Proceedings of the 9th International Mine Water Congress, Oviedo, Spain, 5–7 September 2005; pp. 369–373. Available online: https://www.imwa.info/docs/imwa_2005/IMWA2005_052_Pisa.pdf (accessed on 10 December 2021).
  54. Rook, J.J. Haloforms in Drinking Water. J. Am. Water Work. Assoc. 1976, 68, 168–172. [Google Scholar] [CrossRef]
  55. Trussell, R.R.; Umphres, M.D. The Formation of Trihalomethanes. J. Am. Water Work. Assoc. 1978, 70, 604–612. [Google Scholar] [CrossRef]
  56. Costet, N.; Villanueva, C.M.; Jaakkola, J.J.K.; Kogevinas, M.; Cantor, K.P.; King, W.D.; Lynch, C.F.; Nieuwenhuijsen, M.J.; Cordier, S. Water disinfection by-products and bladder cancer: Is there a European specificity? A pooled and meta-analysis of European case-control studies. Occup. Environ. Med. 2011, 68, 379–385. [Google Scholar] [CrossRef] [PubMed]
  57. Dodds, L.; King, W.; Woolcott, C.; Pole, J. Trihalomethanes in Public Water Supplies and Adverse Birth Outcomes. Epidemiology 1999, 10, 233–237. [Google Scholar] [CrossRef]
  58. King, W.D.; Marrett, L.D. Case-control study of bladder cancer and chlorination by-products in treated water (Ontario, Canada). Cancer Causes Control. 1996, 7, 596–604. [Google Scholar] [CrossRef]
  59. Li, X.-F.; Mitch, W.A. Drinking Water Disinfection Byproducts (DBPs) and Human Health Effects: Multidisciplinary Challenges and Opportunities. Environ. Sci. Technol. 2018, 52, 1681–1689. [Google Scholar] [CrossRef]
  60. Wright, J.M. Effect of trihalomethane exposure on fetal development. Occup. Environ. Med. 2003, 60, 173–180. [Google Scholar] [CrossRef]
  61. Wright, J.M.; Evans, A.; Kaufman, J.A.; Rivera-Núñez, Z.; Narotsky, M.G. Disinfection By-Product Exposures and the Risk of Specific Cardiac Birth Defects. Environ. Health Perspect. 2017, 125, 269–277. [Google Scholar] [CrossRef]
  62. Corsi, S.R.; Graczyk, D.J.; Geis, S.W.; Booth, N.L.; Richards, K.D. A Fresh Look at Road Salt: Aquatic Toxicity and Water-Quality Impacts on Local, Regional, and National Scales. Environ. Sci. Technol. 2010, 44, 7376–7382. [Google Scholar] [CrossRef]
  63. Baldwin, D.S.; Fraser, M. Rehabilitation options for inland waterways impacted by sulfidic sediments–A synthesis. J. Environ. Manag. 2009, 91, 311–319. [Google Scholar] [CrossRef]
  64. United States Environmental Protection Agency (USEPA). Health Effects from Exposure to Sulfate in Drinking Water Workshop; US Environmental Protection Agency: Washington, DC, USA, 1999. Available online: https://nepis.epa.gov/Exe/ZyPDF.cgi/200021JF.PDF?Dockey=200021JF.PDF (accessed on 1 December 2021).
  65. Pradhan, B. Corrosion behavior of steel reinforcement in concrete exposed to composite chloride–sulfate environment. Constr. Build. Mater. 2014, 72, 398–410. [Google Scholar] [CrossRef]
  66. Pennsylvania Department of Environmental Protection (PADEP). 2014 Pennsylvania Integrated Water Quality Monitoring and Assessment Report. Clean Water Act Section 305(b) Report and 303(d) List. Available online: www.pennfuture.org/Files/Admin/2014-Pennsylvania-Integrated-Water-Quality-MonitoringandAssessmentReport.pdf (accessed on 1 December 2021).
  67. Fleming, R.A. Statistical advantages in, and characteristics of, data from long-term research. For. Chron. 1999, 75, 487–489. [Google Scholar] [CrossRef] [Green Version]
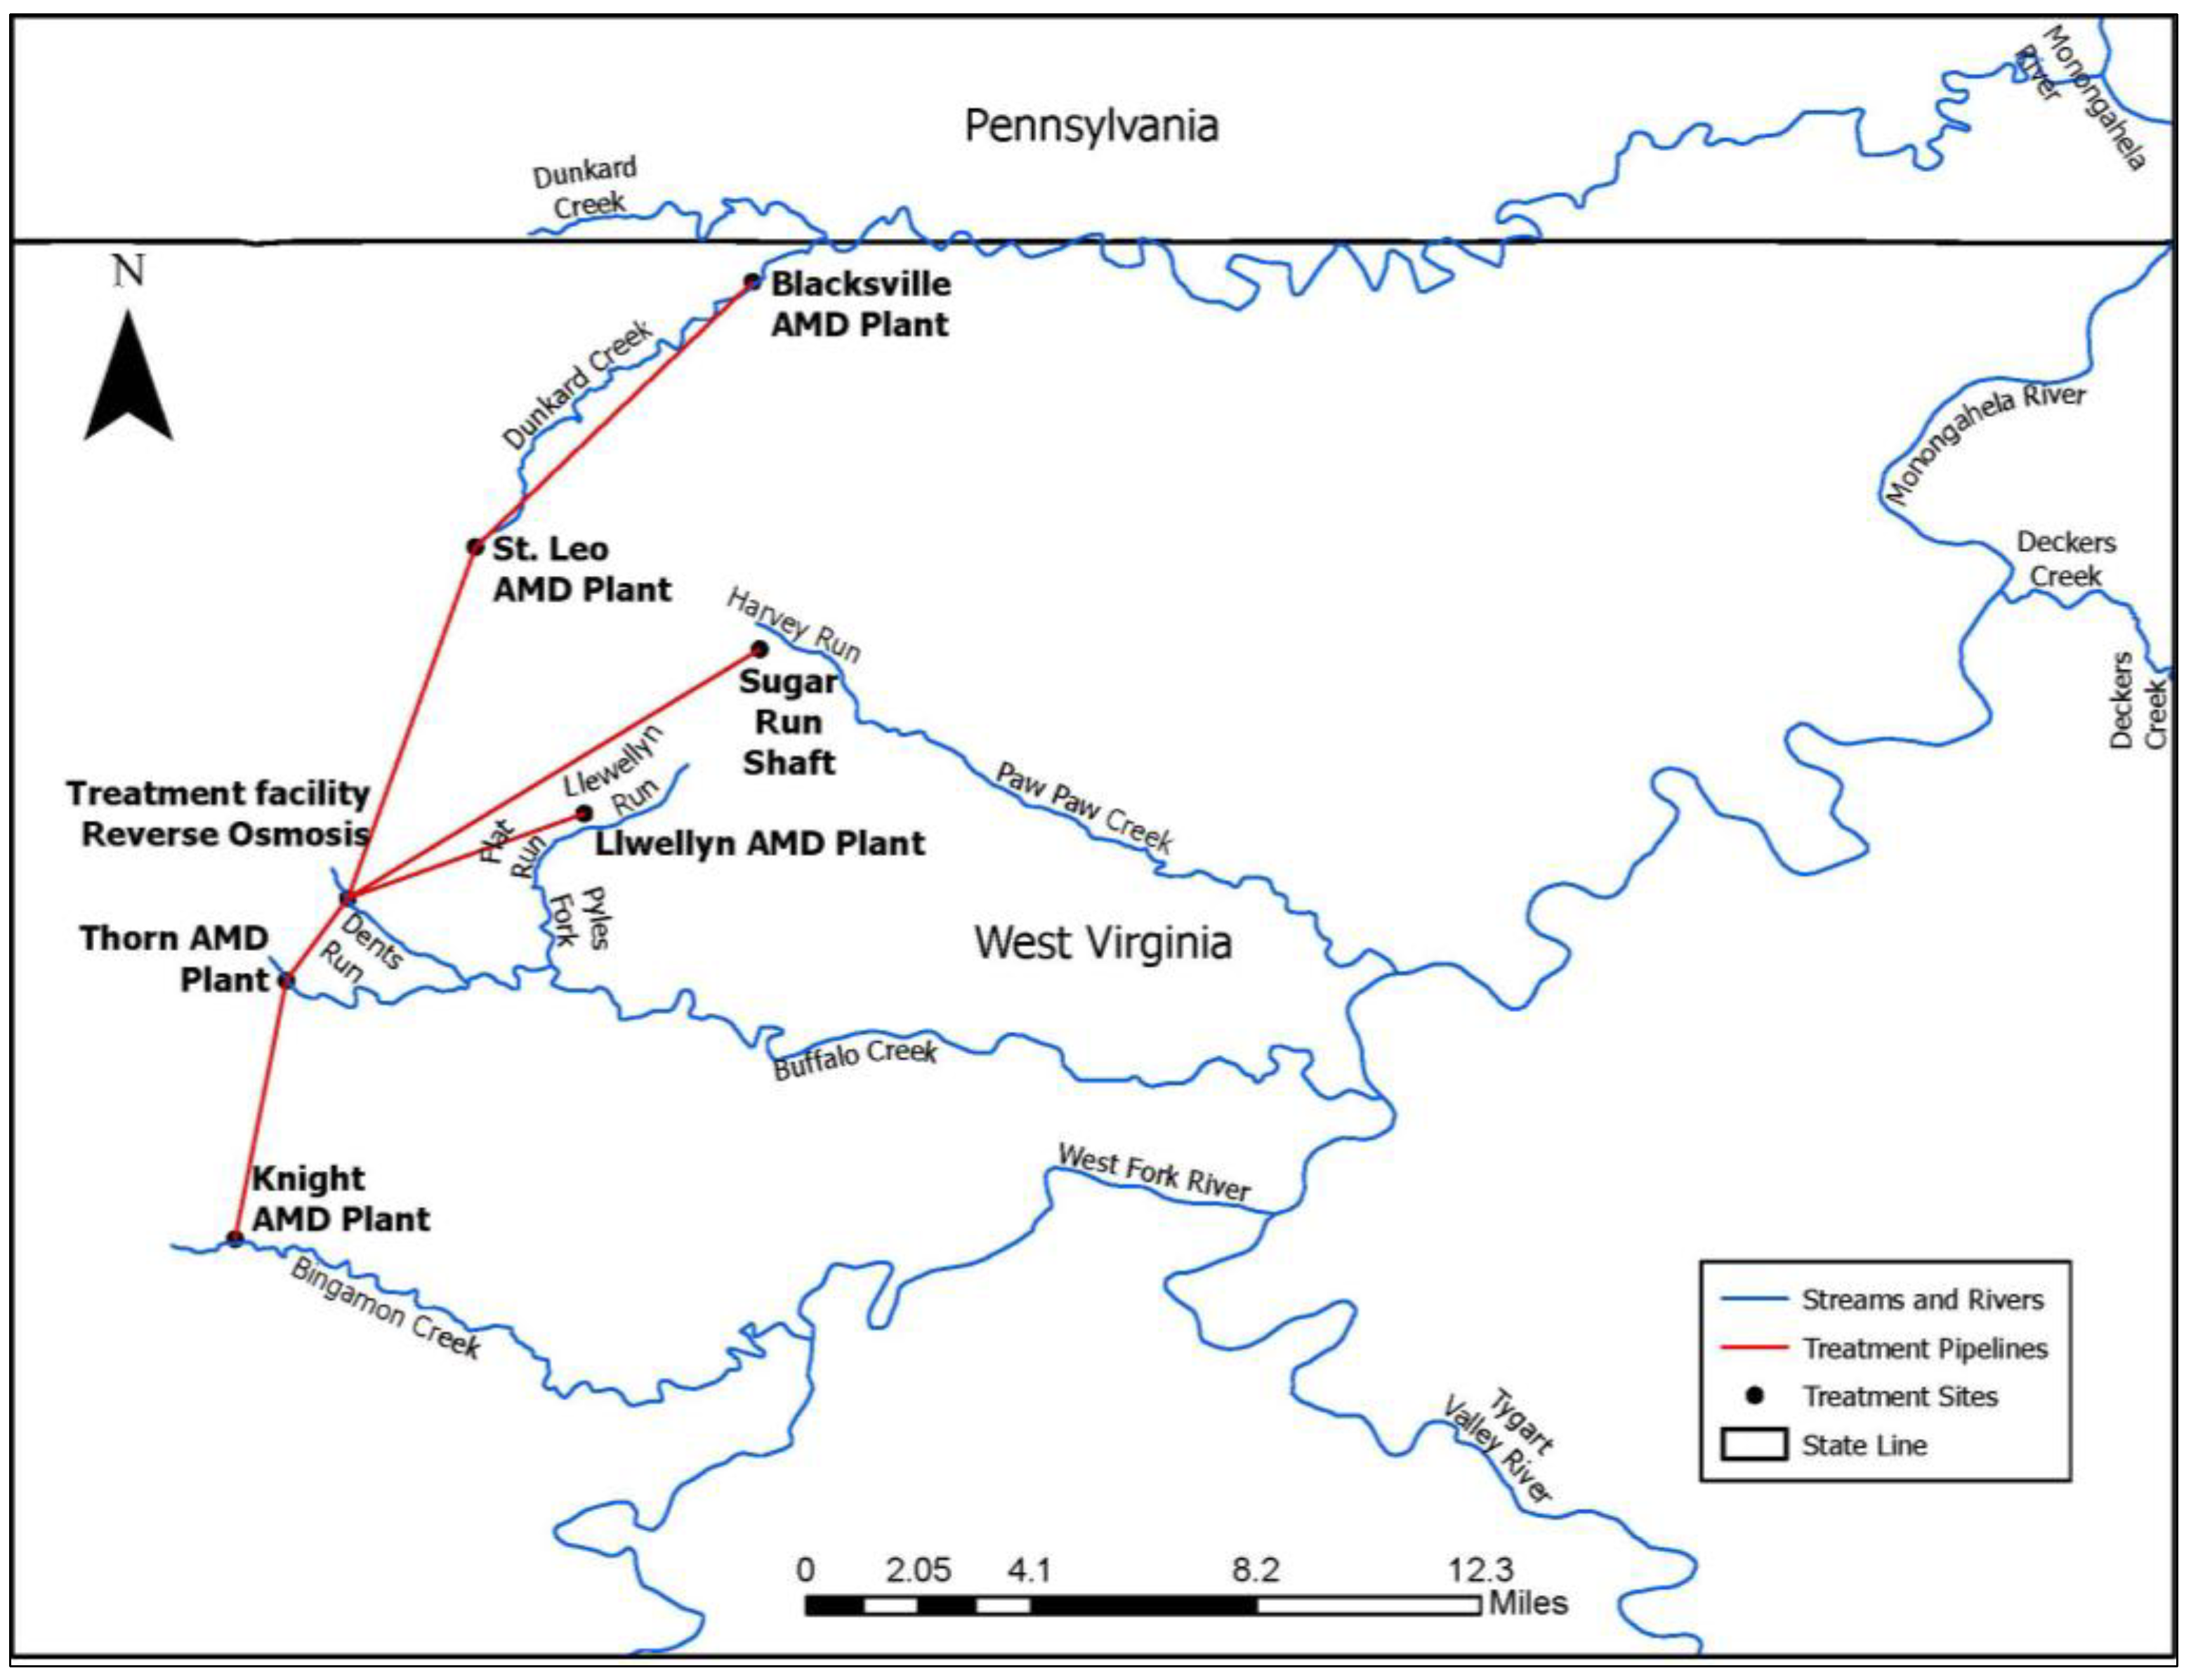
Figure 1. Location of the reverse osmosis plant relative to other AMD treatment facilities. Pipelines on the map are not representative of exact location.
Water 15 00631 g001
Figure 2. Location of all water quality sampling sites (n = 12) within the Monongahela River Basin.
Water 15 00631 g002
Figure 3. Subway map showing sampling sites relative to known pollution sources and treatment facilities. A key note is the brine treatment facility on the YO handles produced water.
Water 15 00631 g003
Figure 4. AAPC values across sites and parameters.
Water 15 00631 g004
Figure 5. Changepoints across all sites in relation to management events.
Water 15 00631 g005
Figure 6. (AC) Scatterplots of log-transformed TDS and discharge showing how slopes and intercepts vary based on the site. (D) Scatterplot showing the overall slope when all sites are combined into a single group.
Water 15 00631 g006
Figure 7. Observed sulfate and TDS concentrations from all four Monongahela River Mainstem (M102, M89, M82, and M23) sites with dashed lines representing the three key management changes.
Water 15 00631 g007
Table 1. River and tributary discharge data sources and/or relative formulas used to estimate discharge based on known discharges.
SiteCFS Formula
Youghiogheny River (YO)USGS Gauge 03083500
Monongahela River Mile 23 (M23)USGS Gauge 03075071
Tenmile Creek (TM)USGS Gauge 03073000
Monongahela River Mile 82 (M82)USGS Gauge 03072655
Whiteley Creek (WH)DU/2
Dunkard Creek (DU)USGS Gauge 03072000
Cheat River (CH)M82/2
Monongahela River Mile 89 (M89)M82-WH-DU-CH
Deckers Creek (DE)USGS Gauge 03062500
Monongahela River Mile 102 (M102)M89-DE
Tygart Valley River (TV)USGS Gauge 03056250 + USGS Gauge 03056250
West Fork River (WF)USGS 03061000
Table 2. Discharge in cubic feet per second (cfs) and concentration (mg/L) averages with confidence intervals for all 12 sample sites. Mainstem sites are identified as ‘M’ followed by river mile, increasing upstream.
DischargeBromideChlorideSO4TDS
TV2536 ± 4060.01 ± 0.0045.5 ± 0.3726.5 ± 1.0662.5 ± 2.13
WF1061 ± 2530.05 ± 0.01714.9 ± 1.16190.0 ± 11.57334.0 ± 16.51
M1024003 ± 6500.03 ± 0.0099.6 ± 0.5889.3 ± 6.27161.1 ±8.84
M894082 ± 6490.04 ± 0.01311.3 ± 0.6795.4 ± 6.84169.5 ± 9.53
M828949 ± 14780.04 ± 0.01111.0 ± 0.7388.1 ± 6.63152.3 ± 9.08
M239192 ± 14860.07 ± 0.01617.8 ± 1.2090.6 ± 6.50172.1 ± 9.58
DE106 ± 22.40.02 ± 0.00615.2 ± 1.27102.6 ± 12.29186.8 ± 16.93
CH4541 ± 7450.01 ± 0.0033.5 ± 0.2024.8 ± 1.0351.0 ± 1.65
DU338 ± 90.30.37 ± 0.08256.2 ± 6.40692.4 ± 117.5922.5 ± 136.88
WH172 ± 46.01.01 ± 0.208132.9 ± 19.70607.8 ± 73.17966.8 ± 101.13
TM169 ±45.20.35 ± 0.08157.3 ± 6.93157.0 ± 16.44351.2 ± 25.98
YO3485 ± 5760.07 ± 0.02059.5 ± 6.3094.5 ± 5.24242.6 ± 11.30
Table 3. Parameter estimates for the most optimal hierarchical linear mixed effects model predicting log[x] transformed total dissolved solids within the Monongahela River Basin. VDMP (voluntary discharge management plan), PA_Pro (Pennsylvania’s prohibition on produced water in POTWs), VDMP_PA (combined treatments of the voluntary discharge management plan and Pennsylvania’s prohibition on produced water in POTWs), VDMP_ROP (combined treatments with the voluntary discharge management plan and the reverse osmosis plant), VDMP_PA_ROP (combination of all three treatments).
ParameterEstimateSEt-Valuep-Value
Fixed Effects
Intercept153.1415.0810.15<0.001
Log[cfs]−19.952.17−9.21<0.001
Year−0.070.01−9.68<0.001
VDMP−0.120.04−3.100.002
PA_Pro0.050.031.530.126
VDMP_PA−0.160.04−3.65<0.001
VDMP_ROP−0.190.05−4.12<0.001
VDMP_PA_ROP−0.370.05−7.93<0.001
Log[cfs]:Year0.010.009.08<0.001
Random effects
σ1|Site1.36------
σ1cfs|Site0.01------
σResidual0.09------
Disclaimer/Publisher’s Note: The statements, opinions and data contained in all publications are solely those of the individual author(s) and contributor(s) and not of MDPI and/or the editor(s). MDPI and/or the editor(s) disclaim responsibility for any injury to people or property resulting from any ideas, methods, instructions or products referred to in the content.