
Assessing Spatial Variability and Trends of Droughts in Eastern Algeria Using SPI, RDI, PDSI, and MedPDSI—A Novel Drought Index Using the FAO56 Evapotranspiration Method
 , ,
, ,
Abstract
:1. Introduction
2. Materials and Methods
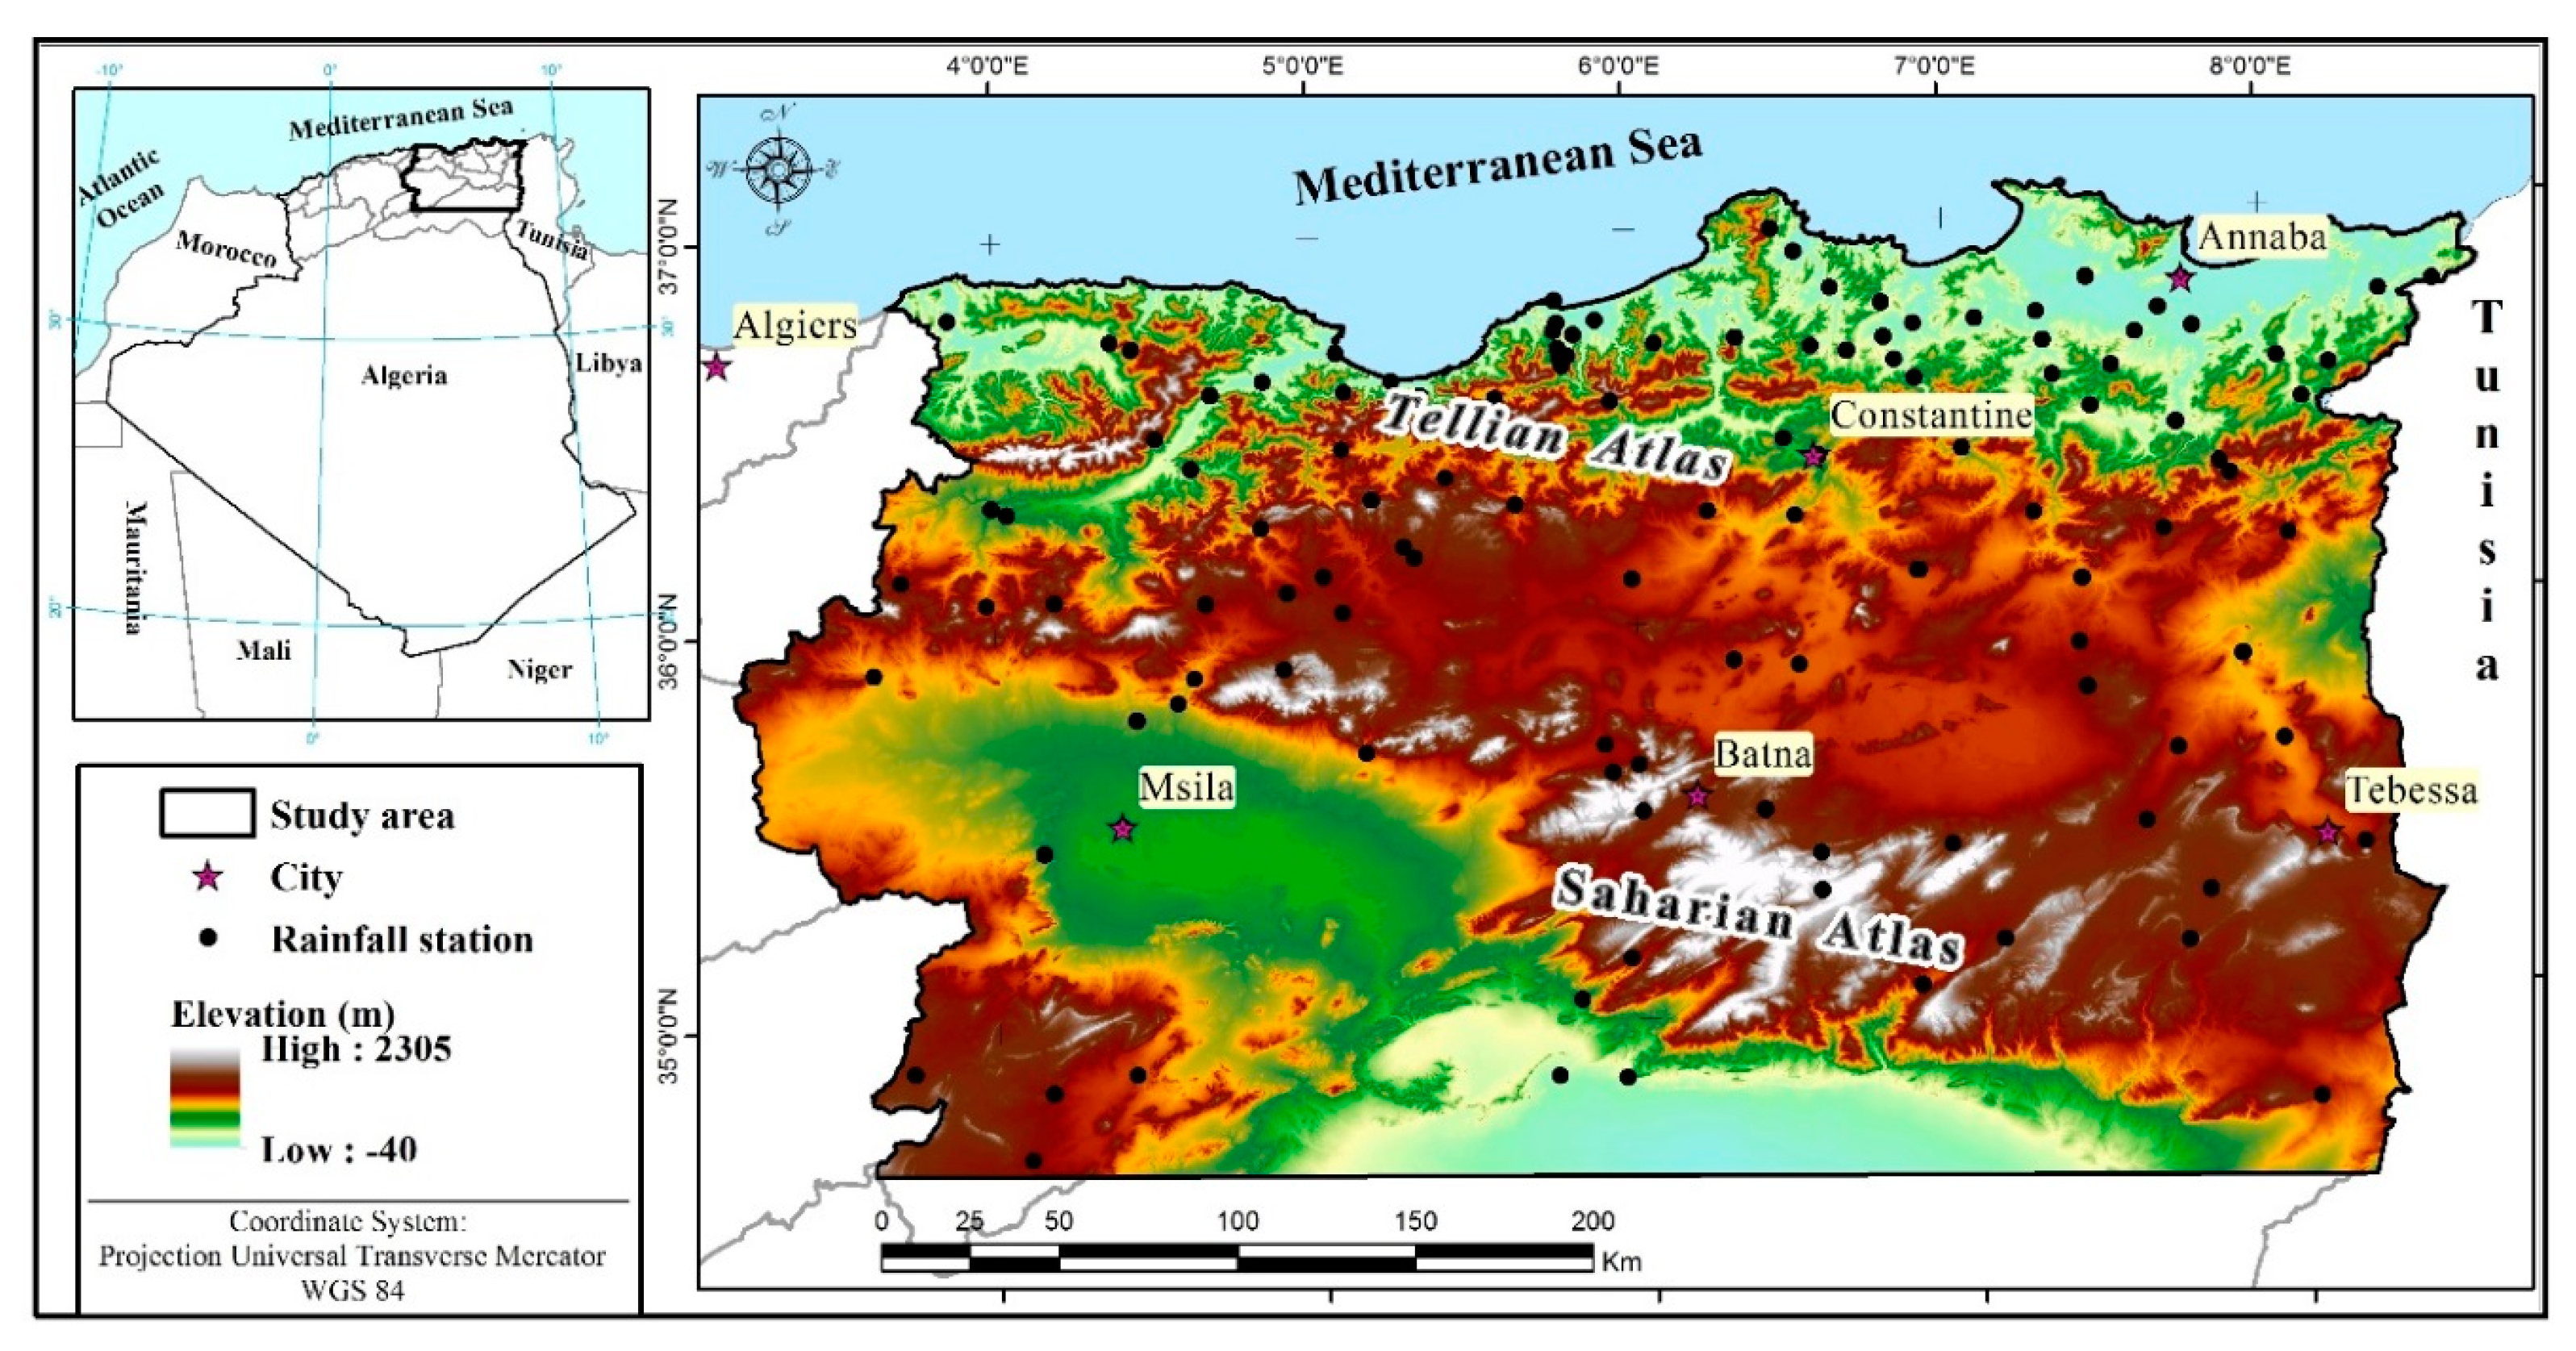
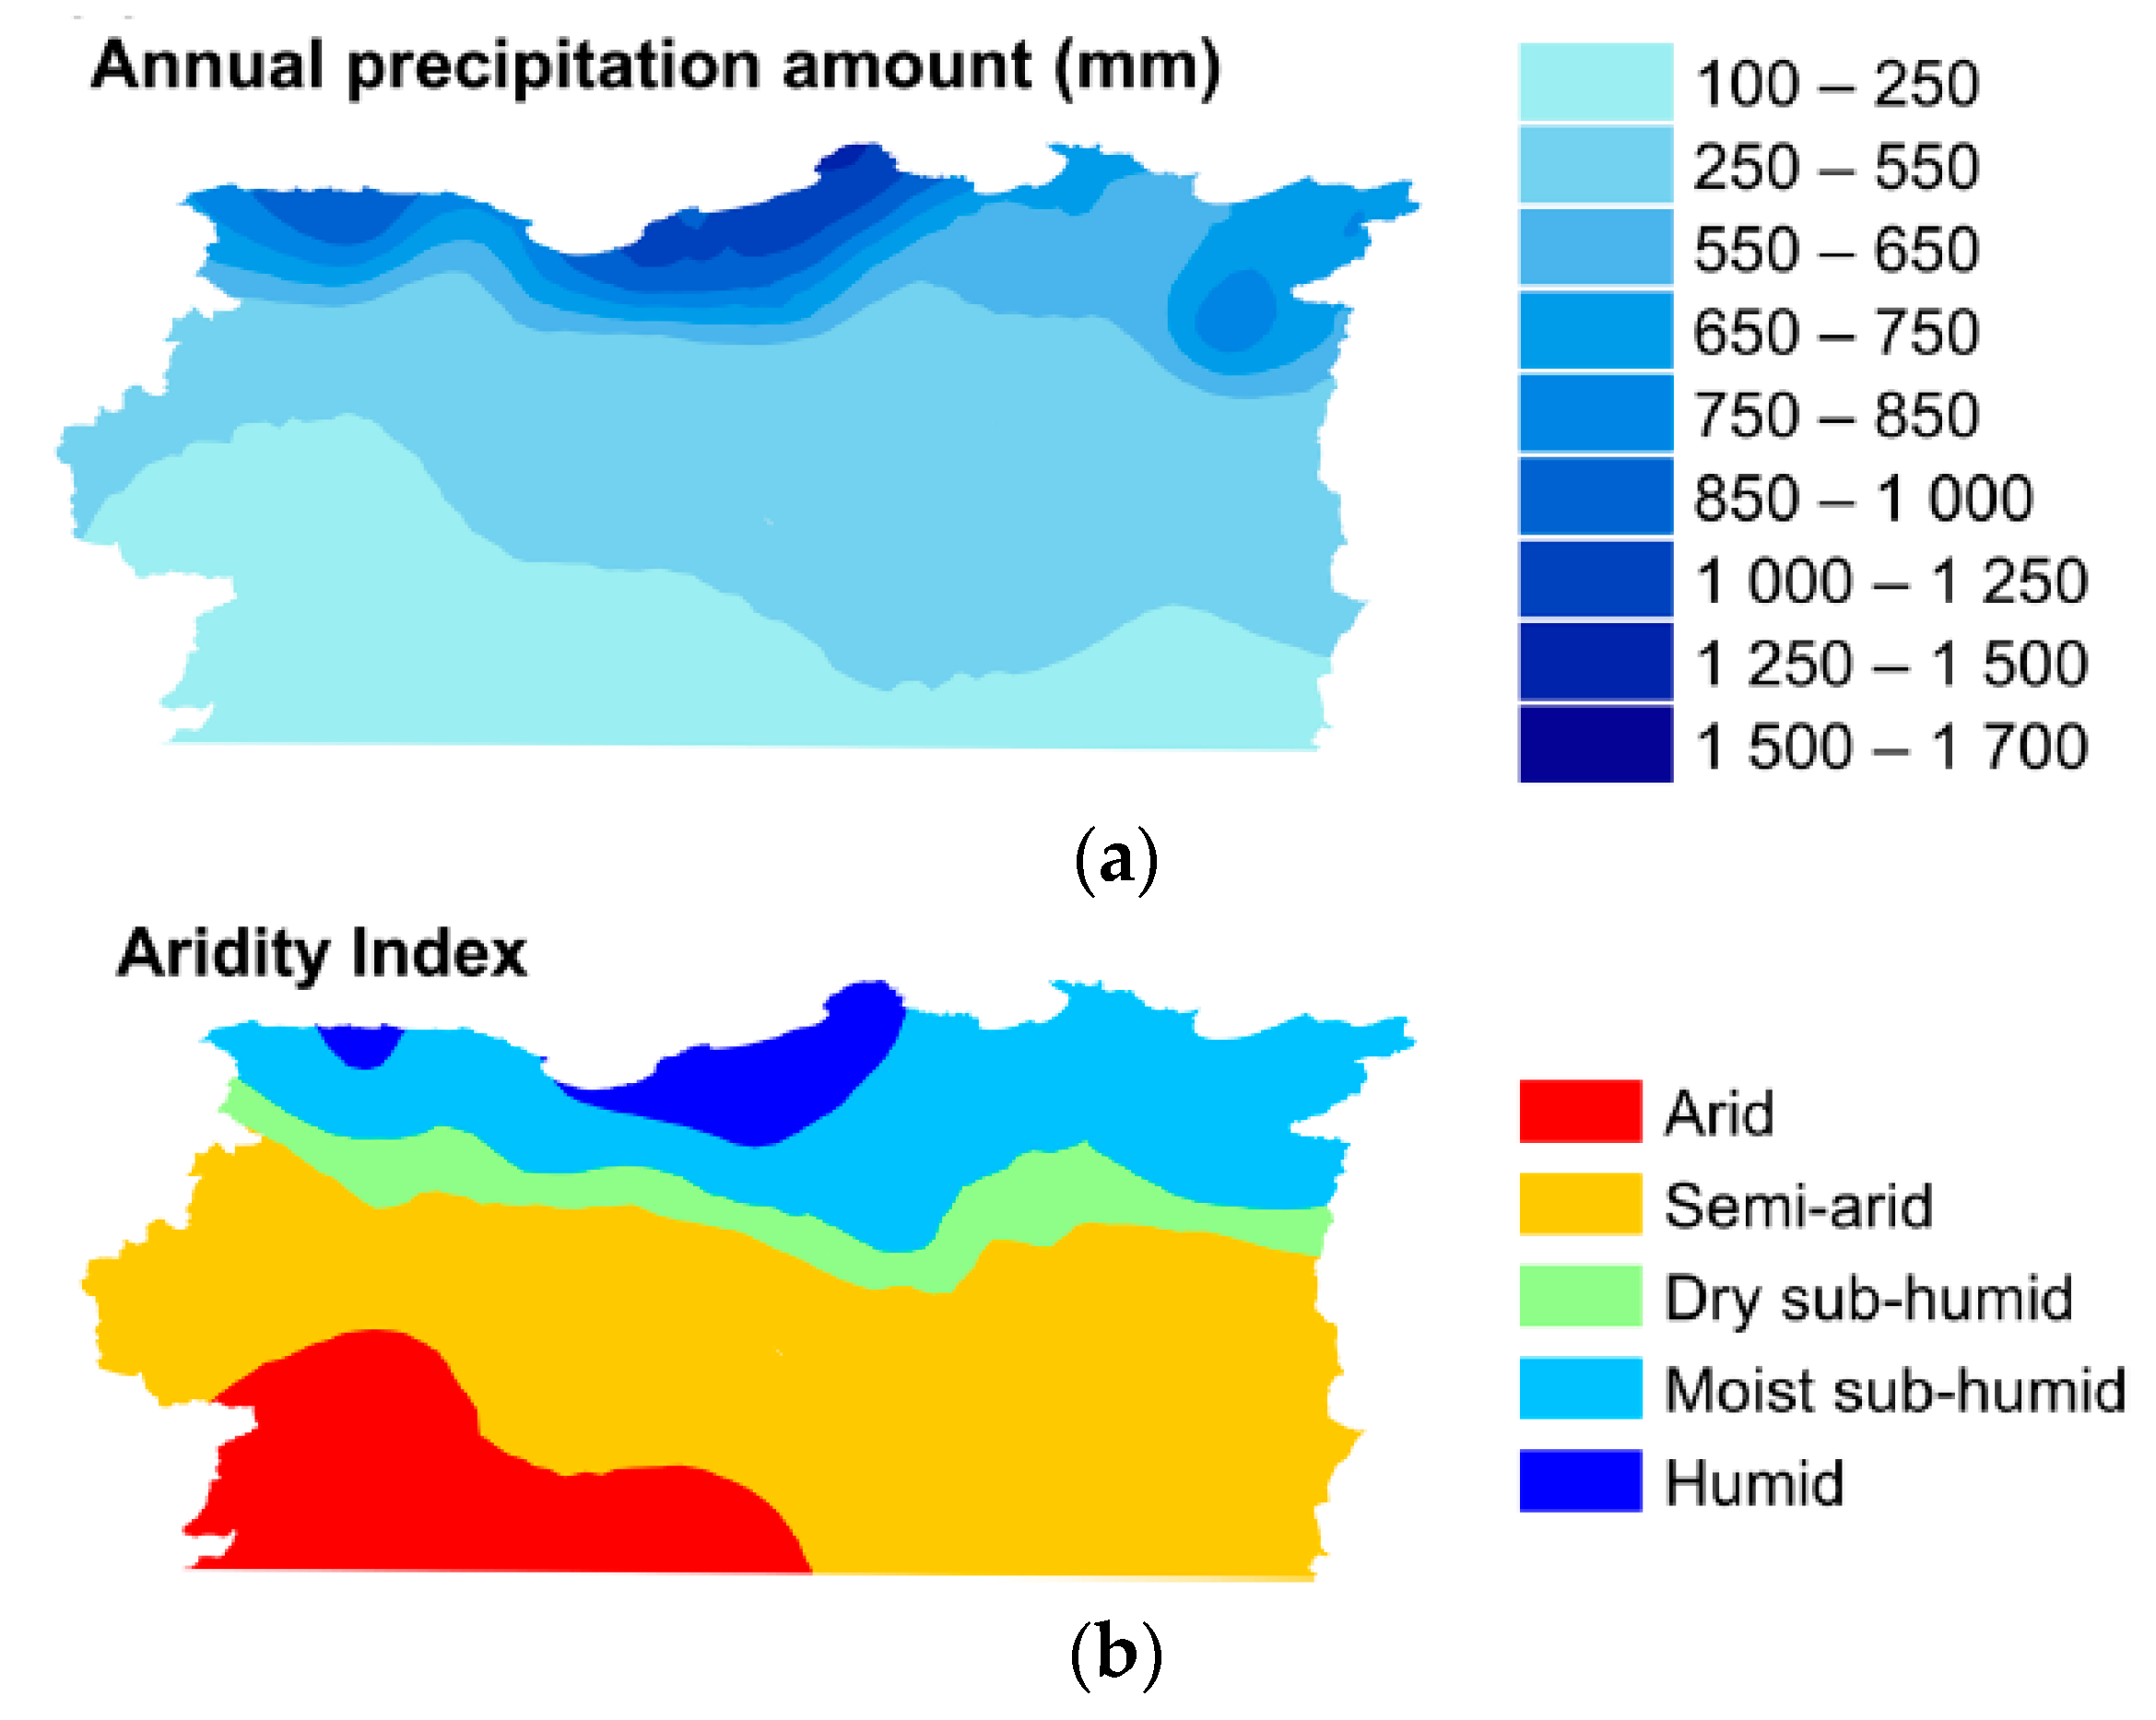
2.1. Study Area—Northeastern Algeria
2.2. Drought Indices
2.2.1. The Self-Calibrating Palmer Drought Severity Index (Sc-PDSI)
2.2.2. The Modified PDSI for Mediterranean Regions, MedPDSI
2.2.3. Standardized Precipitation Index (SPI) and Reconnaissance Drought Index (RDI)
2.3. Drought Spatial and Temporal Analyses
2.3.1. Principal Component Analysis (PCA)
2.3.2. The Modified Mann–Kendall (MMK) Trend Test and Sen’s Slope Estimator
3. Results and Discussion
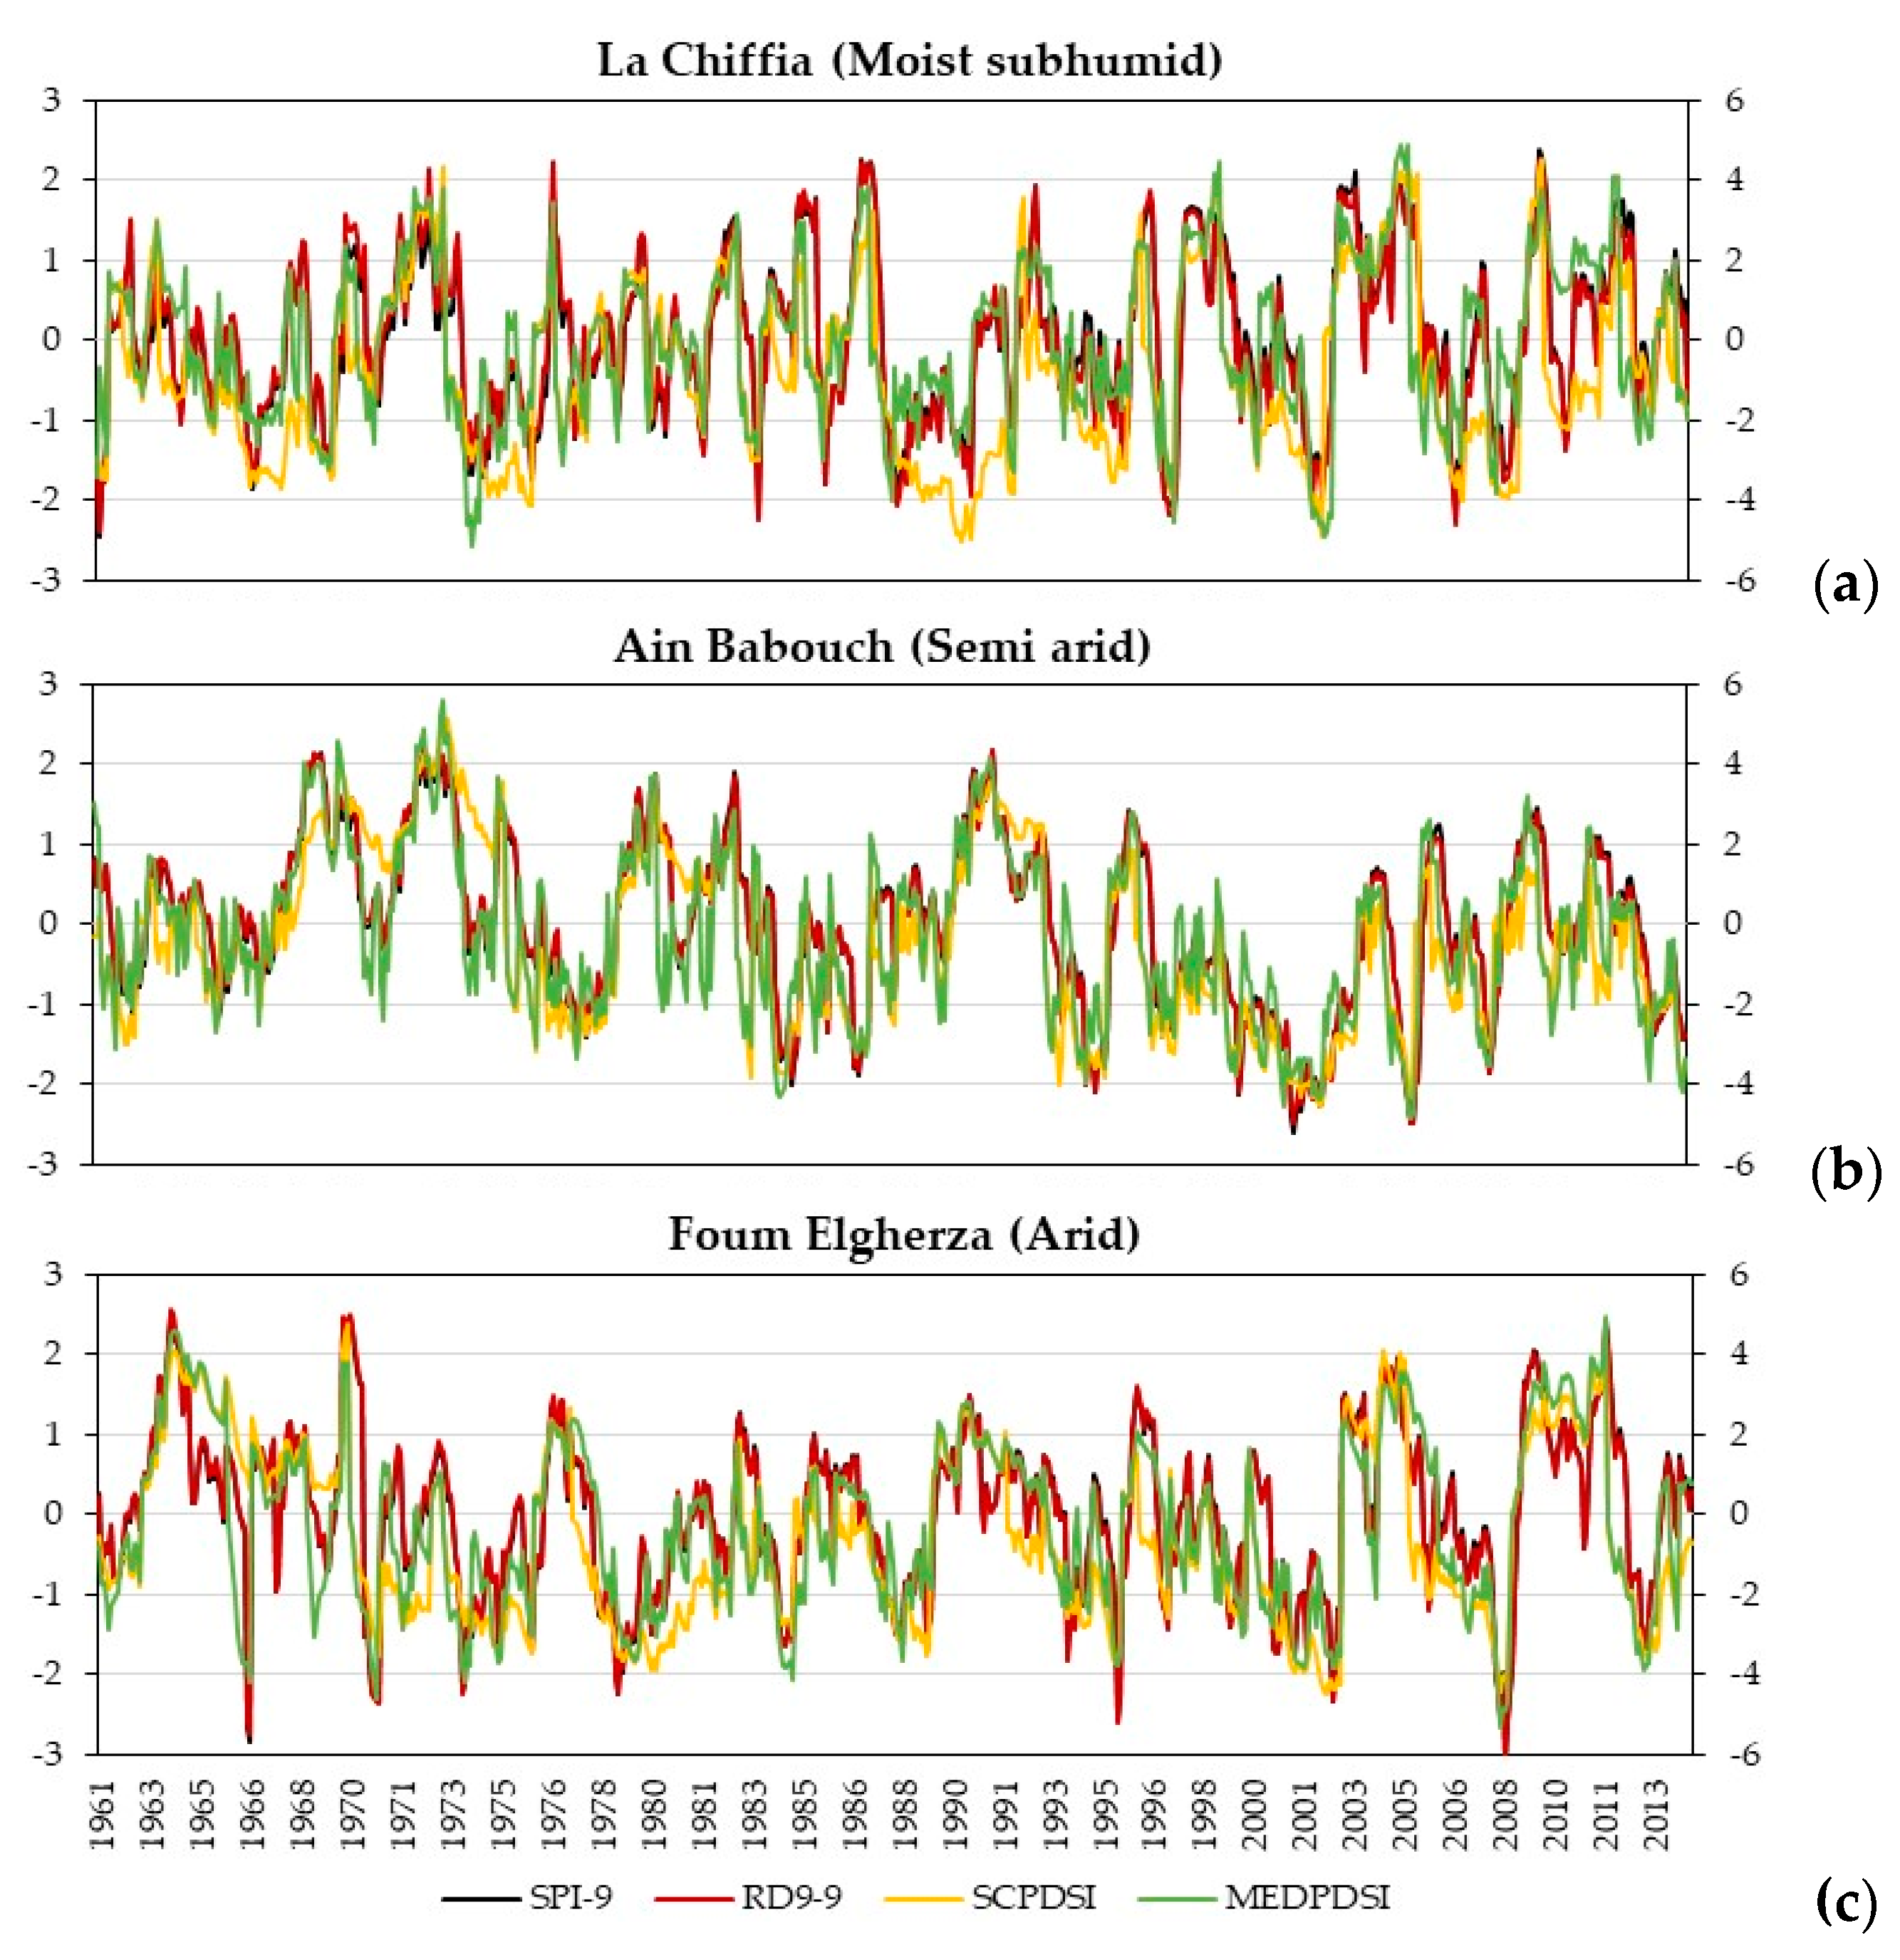
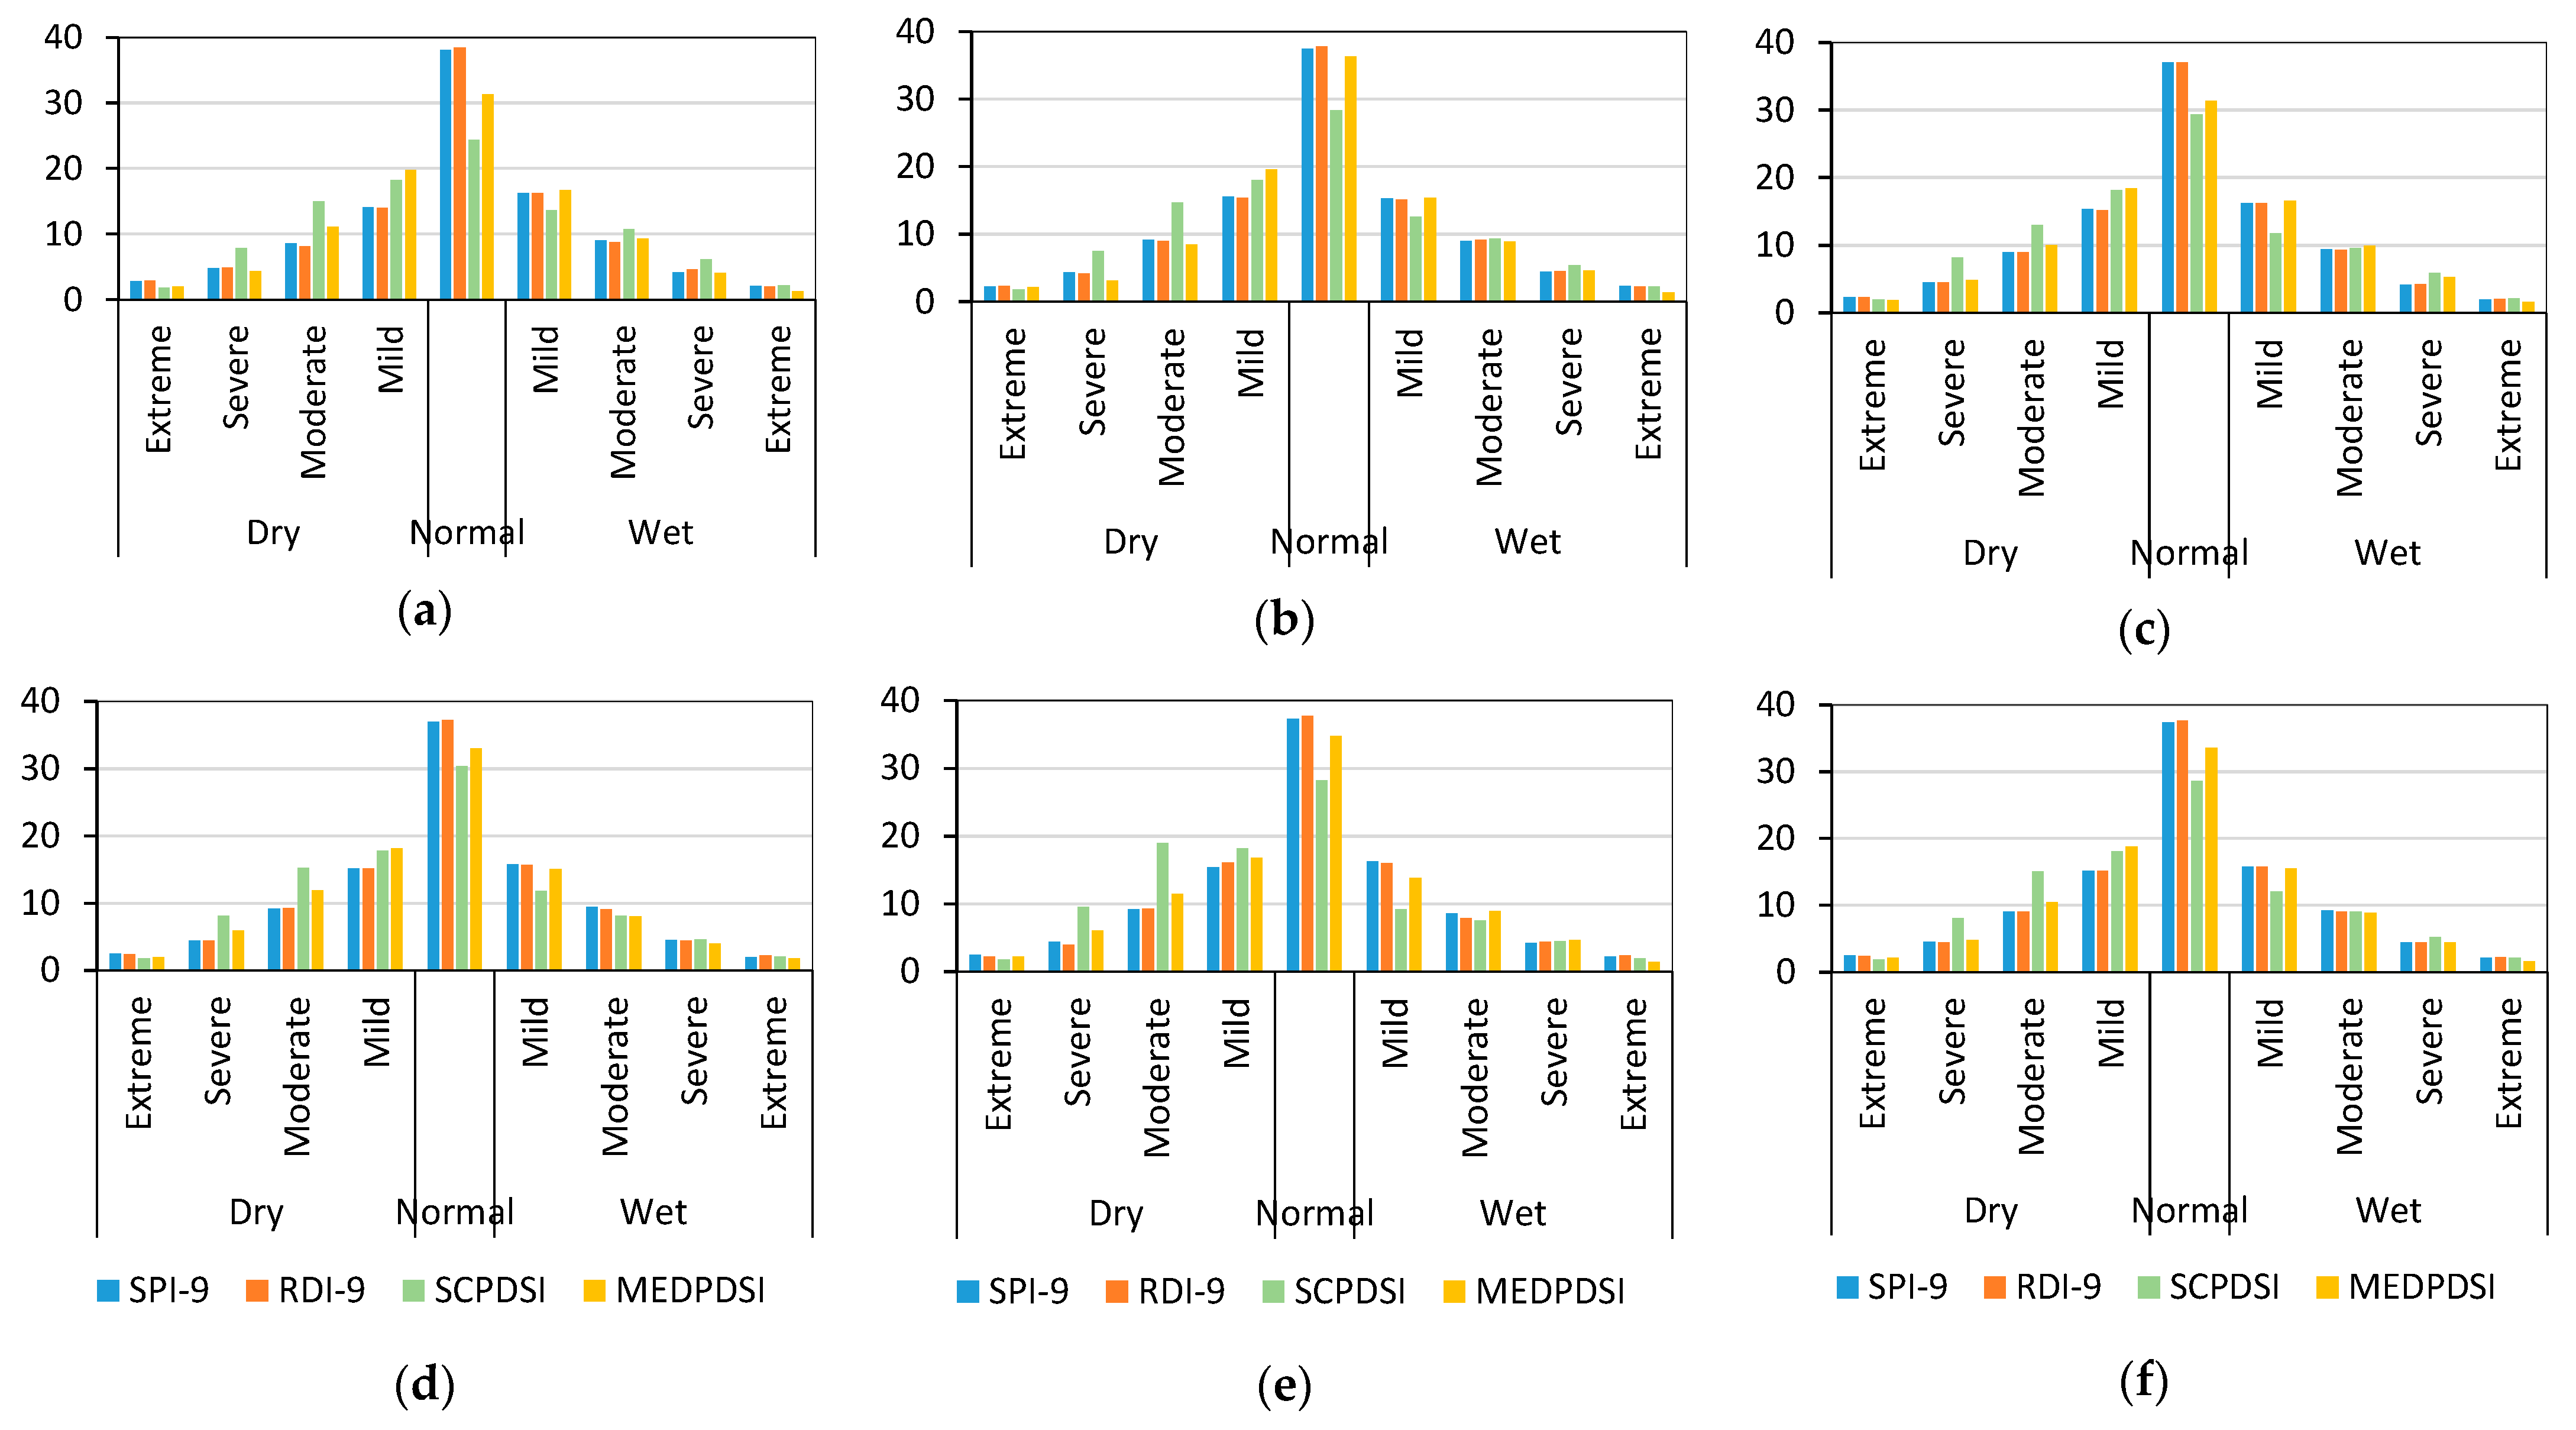
3.1. Behavior of the Drought Indices
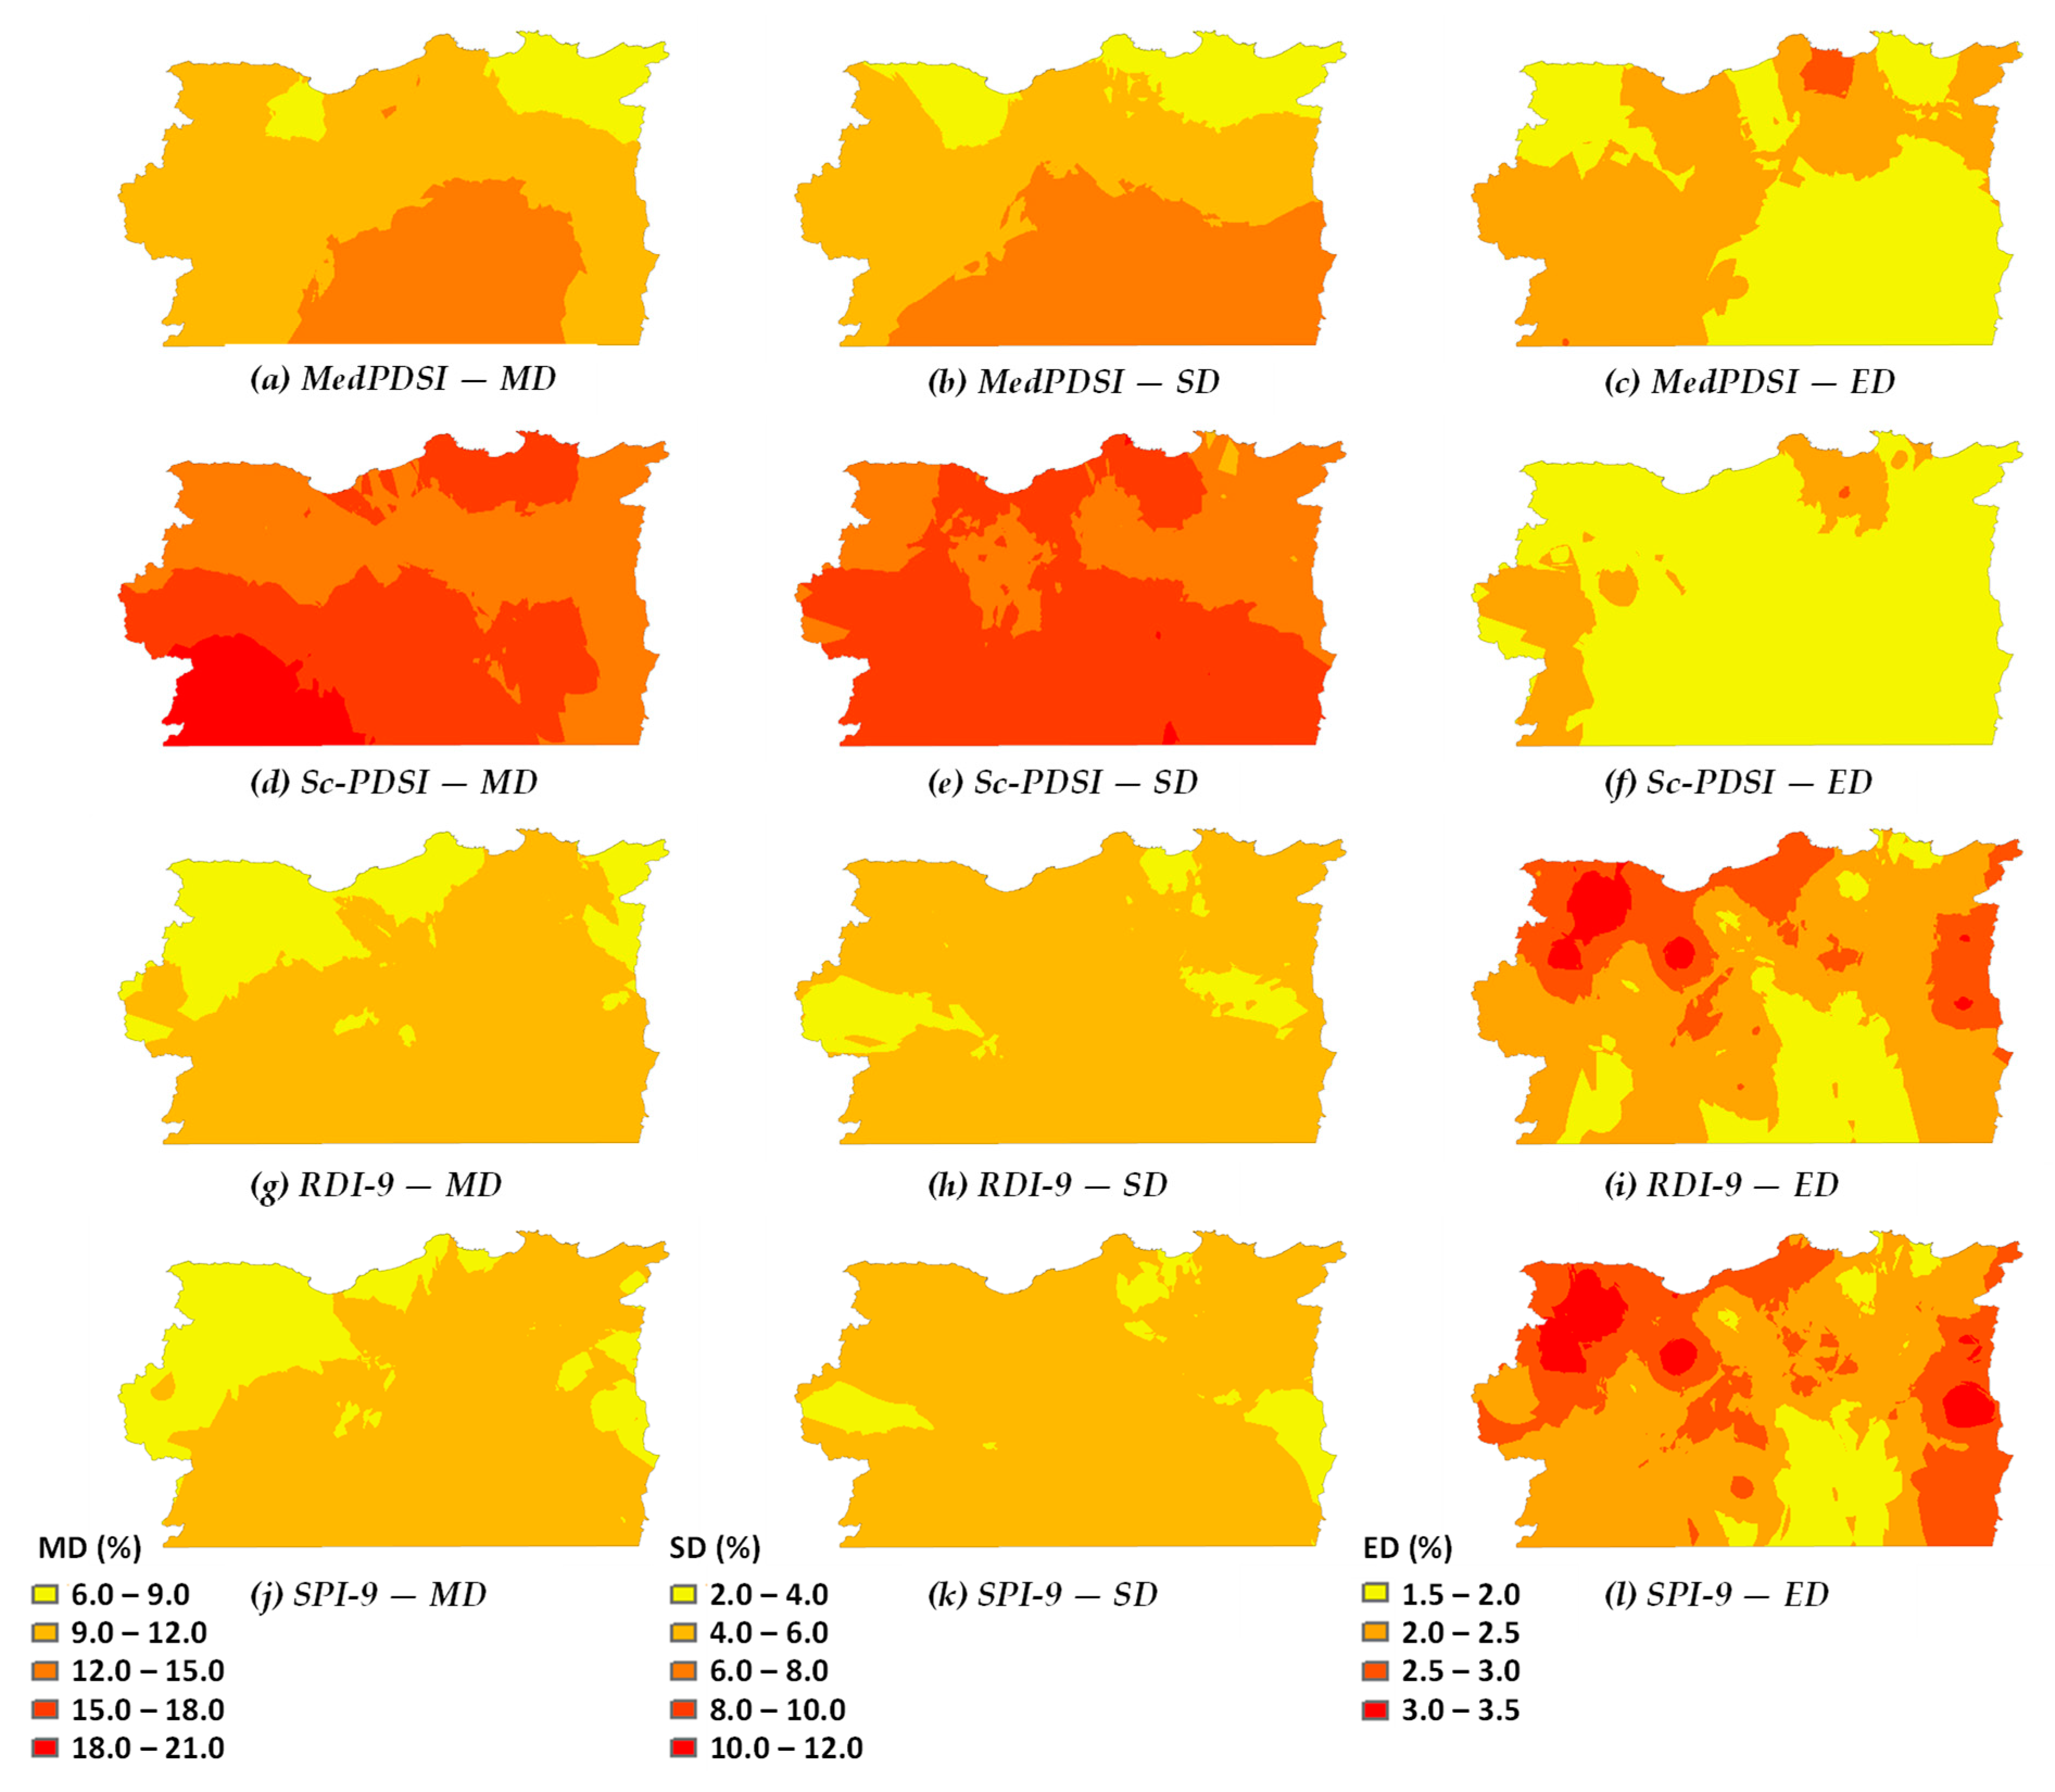
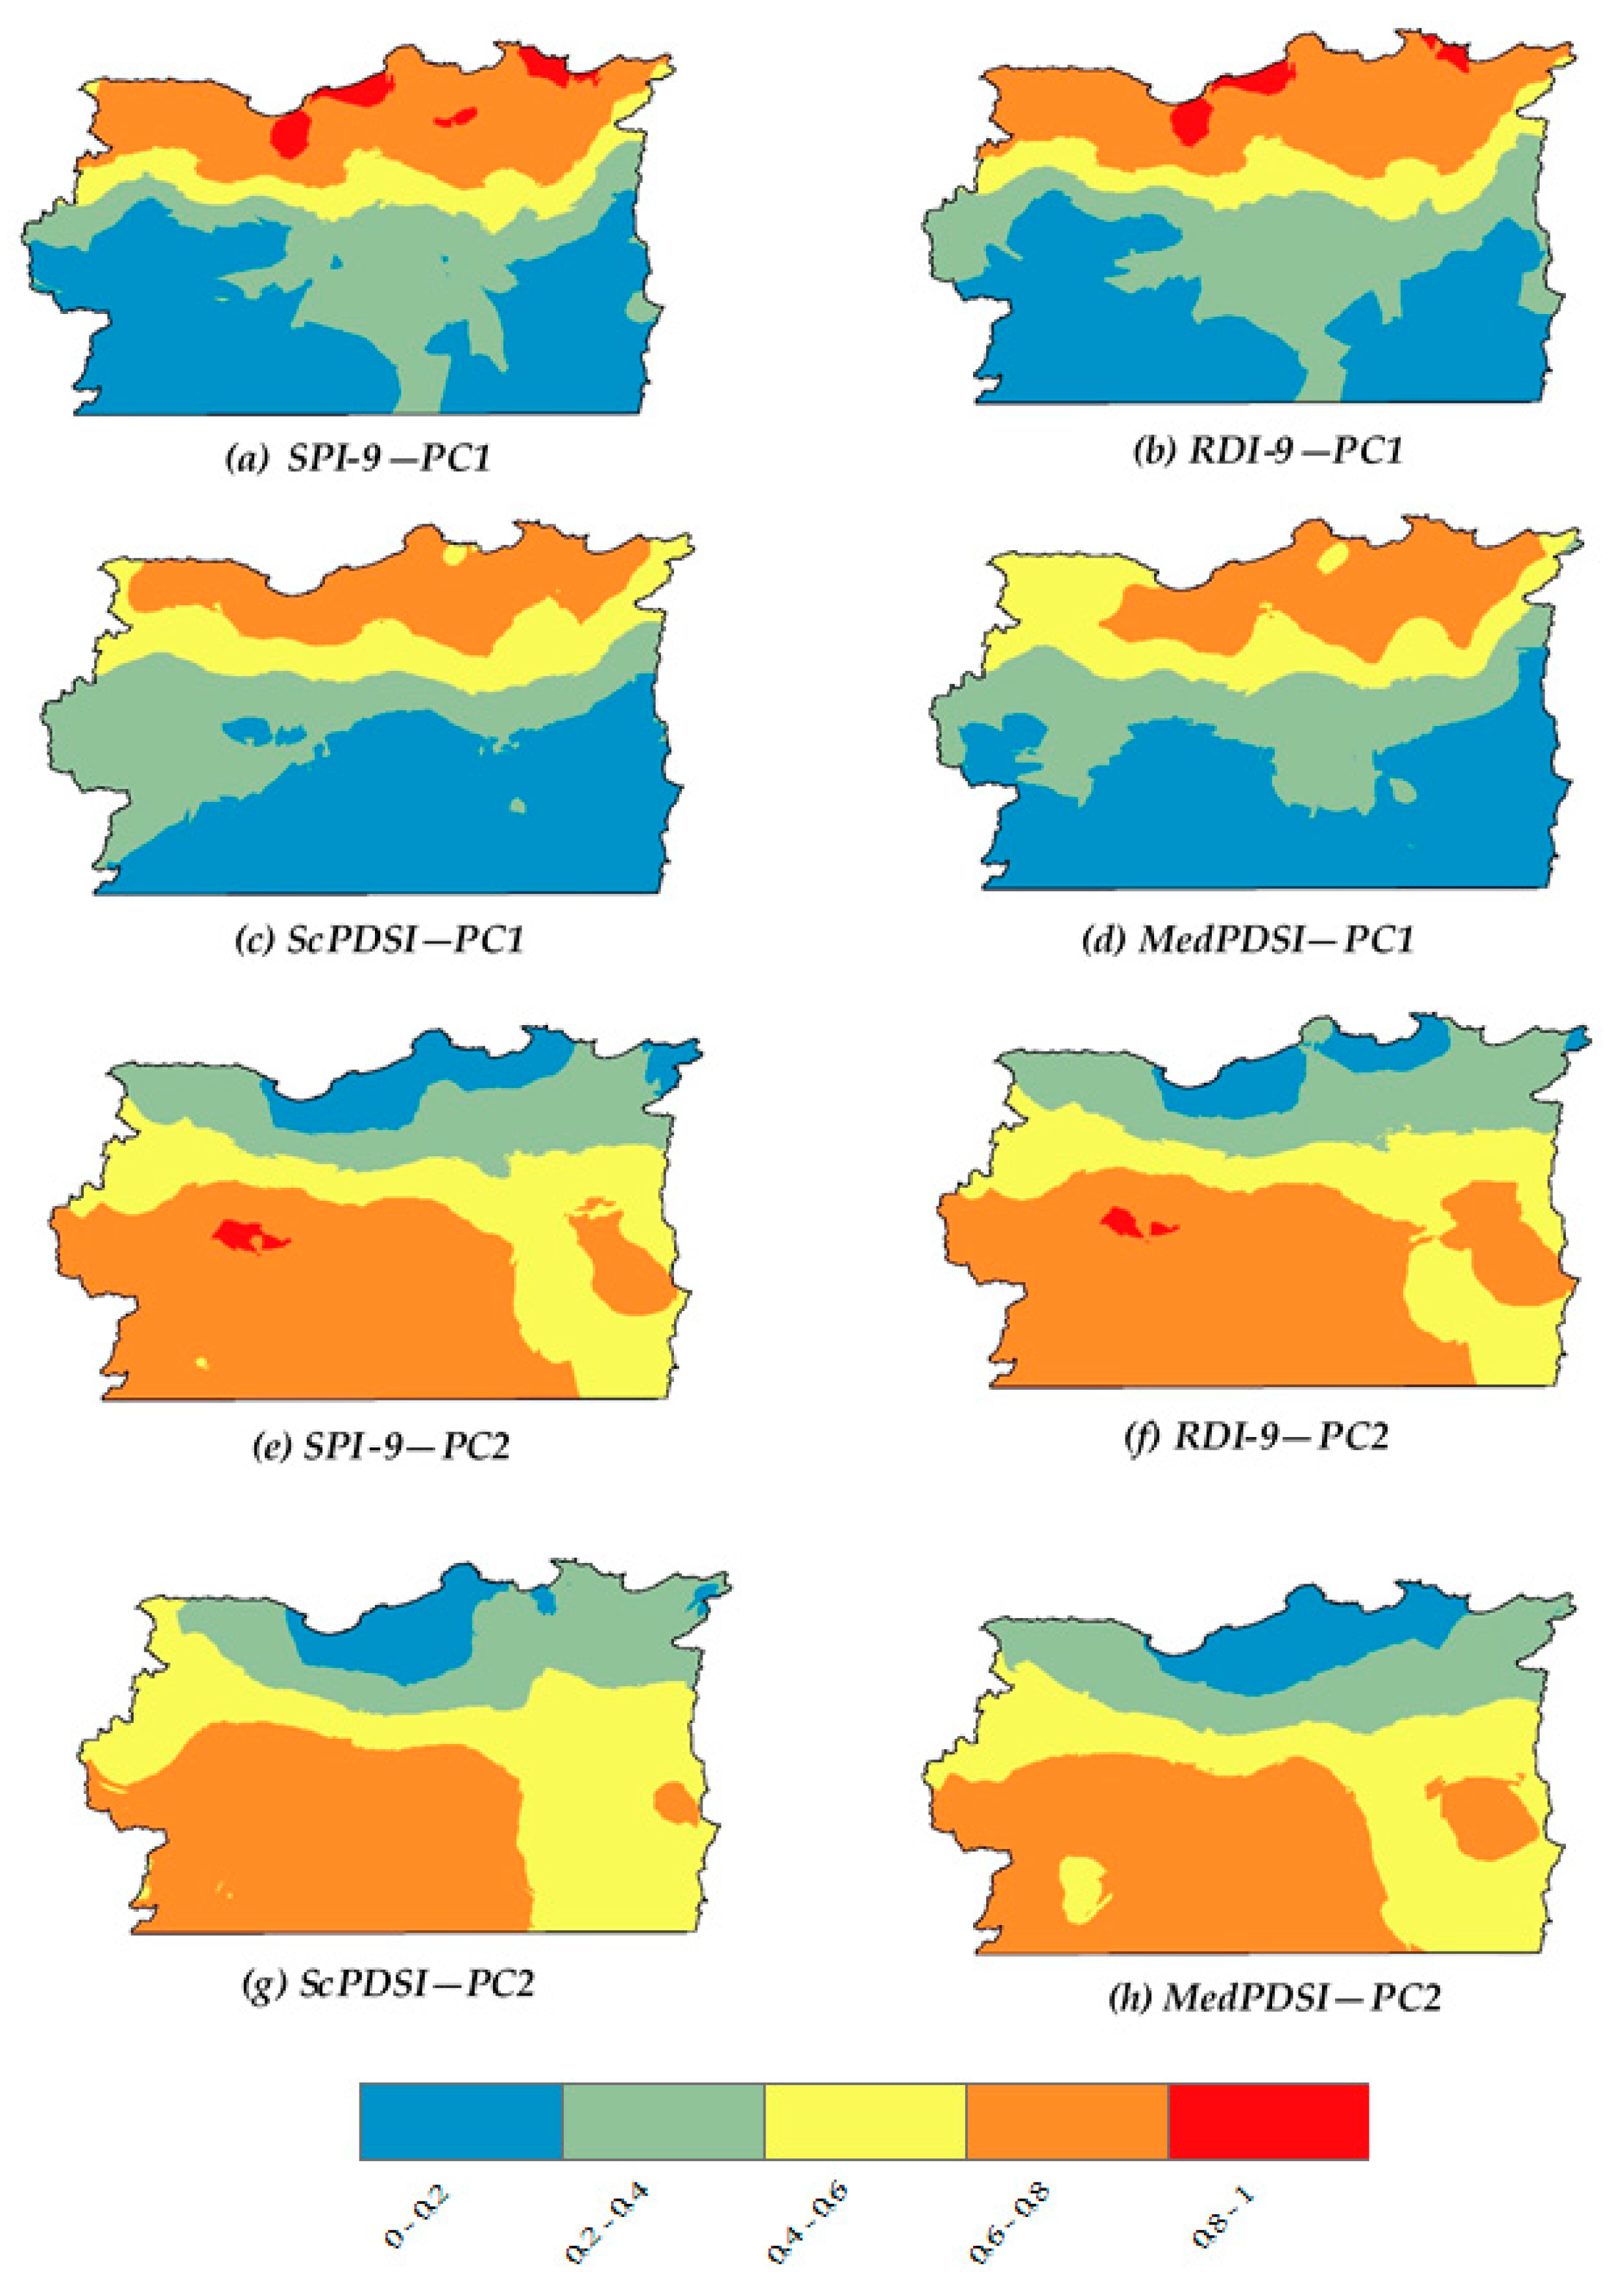
3.2. Spatial Patterns of Droughts
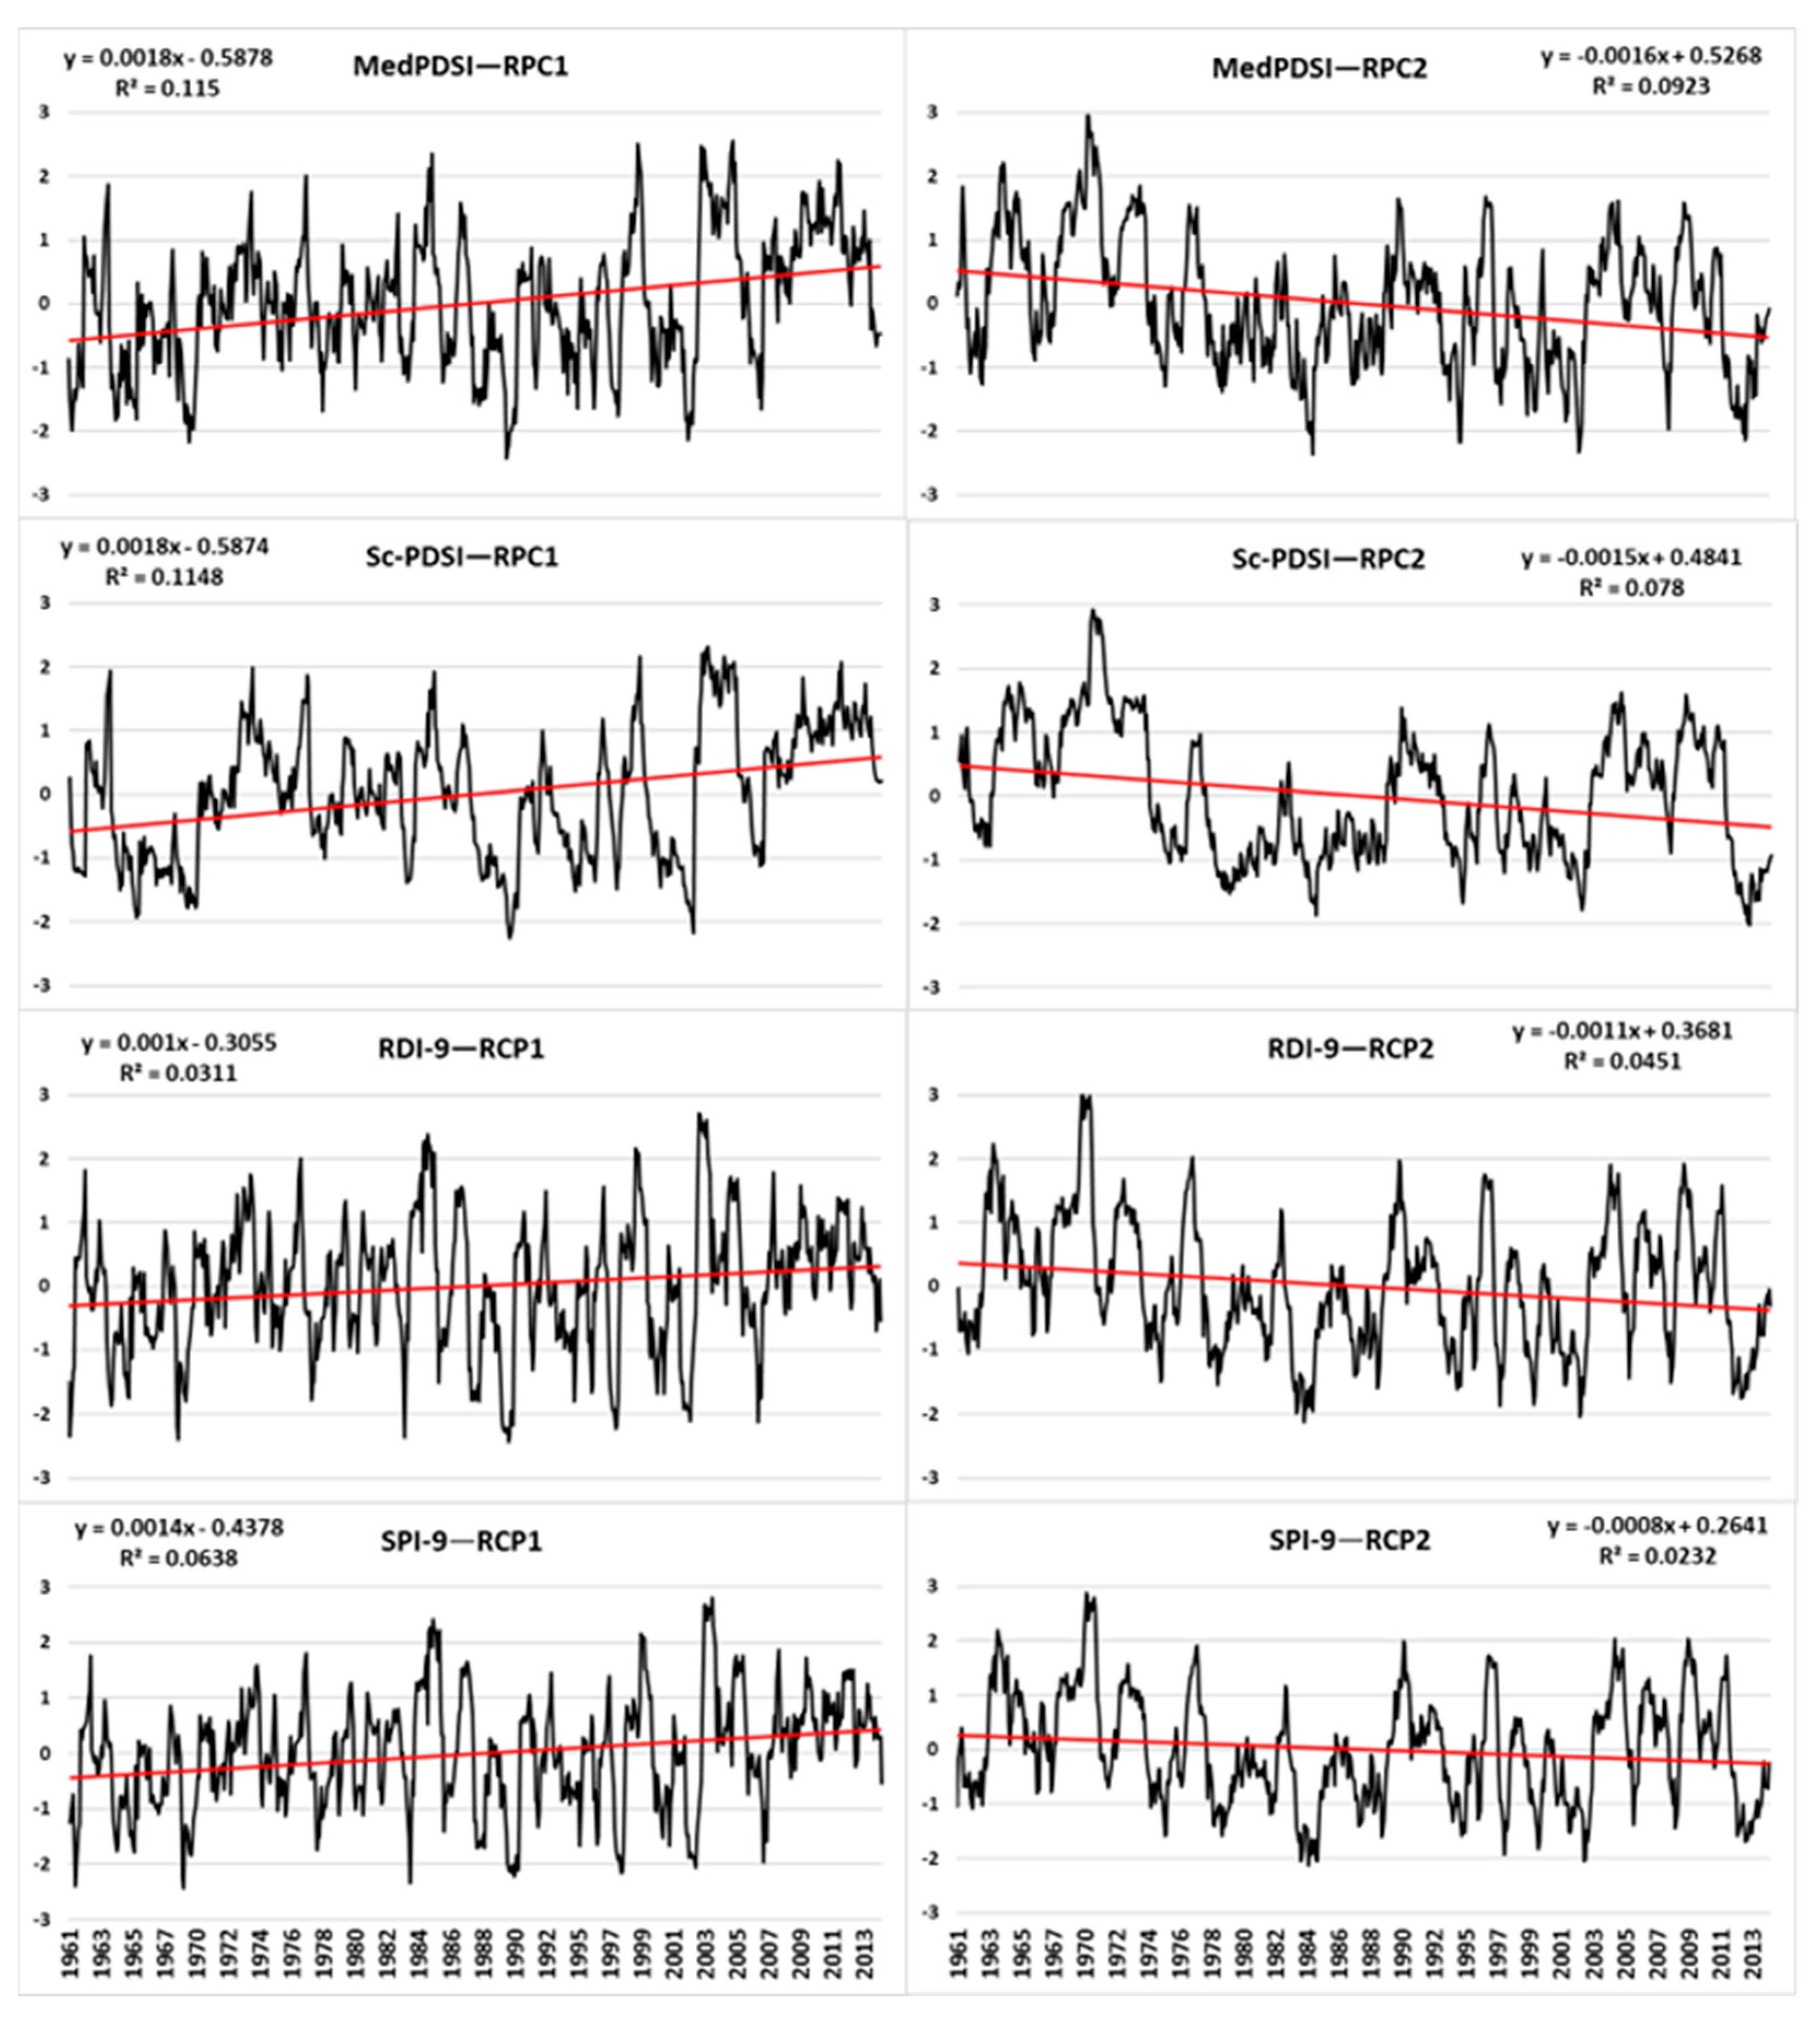
3.3. Trend Analysis of Droughts
4. Conclusions
Author Contributions
Funding
Data Availability Statement
Acknowledgments
Conflicts of Interest
References
- Pereira, L.S.; Cordery, I.; Iacovides, I. Coping with Water Scarcity: Addressing the Challenges; Springer: Dordrecht, The Netherlands, 2009. [Google Scholar]
- Pires, C.A.L.; Pereira, L.S. (Eds.) Predictabilidade Sazonal de Secas—Avaliação ao Nível Regional e Agrícola; ISA Press: Lisbon, Portugal, 2015; (In Portuguese). [Google Scholar] [CrossRef]
- Tsakiris, G. Drought risk assessment and management. Water Resour. Manag. 2017, 31, 3083–3095. [Google Scholar] [CrossRef]
- Tramblay, Y.; Koutroulis, A.; Samaniego, L.; Vicente-Serrano, S.M.; Volaire, F.; Boone, A.; Le Page, M.; Llasat, M.C.; Albergel, C.; Burak, S.; et al. Challenges for Drought Assessment in the Mediterranean region under future climate scenarios. Earth-Sci Rev 2020, 210, 103348. [Google Scholar] [CrossRef]
- Merabti, A.; Martins, D.S.; Meddi, M.; Pereira, L.S. Spatial and time variability of drought based on SPI and RDI with various time scales. Water Resour. Manag. 2018, 32, 1087–1100. [Google Scholar] [CrossRef]
- McKee, T.B.; Doesken, N.J.; Kleist, J. The relationship of drought frequency and duration to time scales. In Proceedings of the 8th Conference on Applied Climatology, Boston, MA, USA, 17–22 January 1993; pp. 179–184. [Google Scholar]
- Tsakiris, G.; Pangalou, D.; Vangelis, H. Regional drought assessment based on the reconnaissance drought index (RDI). Water Resour. Manag. 2007, 21, 821–833. [Google Scholar] [CrossRef]
- Ripple, W.J.; Wolf, C.; Gregg, J.W.; Levin, K.; Rockström, J.; Newsome, T.M.; Betts, M.G.; Huq, S.; Law, B.E.; Kemp, L.; et al. World scientists’ warning of a climate emergency 2022. BioScience 2022, 72, 1149–1155. [Google Scholar] [CrossRef]
- Hoerling, M.; Eischeid, J.; Perlwitz, J.; Quan, X.; Zhang, T.; Pegion, P. On the increased frequency of Mediterranean drought. J. Clim. 2012, 25, 2146–2161. [Google Scholar] [CrossRef]
- Giorgi, F.; Lionello, P. Climate change projections for the Mediterranean region. Glob. Planet. Change 2008, 63, 90–104. [Google Scholar] [CrossRef]
- Sousa, P.M.; Trigo, R.M.; Aizpurua, P.; Nieto, R.; Gimeno, L.; Garcia-Herrera, R. Trends and extremes of drought indices throughout the 20th century in the Mediterranean. Nat. Hazards Earth Syst. Sci. 2011, 11, 33–51. [Google Scholar] [CrossRef]
- Moreira, E.; Pires, C.; Pereira, L. SPI Drought Class Predictions driven by the North Atlantic Oscillation index using log-linear modeling. Water 2016, 8, 43. [Google Scholar] [CrossRef] [Green Version]
- Hallouz, F.; Meddi, M.; Mahé, G.; Ali Rahmani, S.; Karahacane, H.; Brahimi, S. Analysis of meteorological drought sequences at various timescales in semi-arid climate: Case of the Cheliff watershed (Northwest of Algeria). Arab. J. Geosci. 2020, 13, 280. [Google Scholar] [CrossRef]
- Spinoni, J.; Naumann, G.; Carrao, H.; Barbosa, P.; Vogt, J. World drought frequency, duration, and severity for 1951–2010. Int. J. Climatol. 2014, 34, 2792–2804. [Google Scholar] [CrossRef]
- Stagge, J.H.; Kingston, D.G.; Tallaksen, L.M.; Hannah, D.M. Observed drought indices show increasing divergence across Europe. Sci. Rep. 2017, 7, 14045. [Google Scholar] [CrossRef] [PubMed]
- Moreira, E.E.; Mexia, J.T.; Pereira, L.S. Are drought occurrence and severity aggravating? A study on SPI drought class transitions using log-linear Models and ANOVA-like inference. Hydrol. Earth Syst. Sci. 2012, 16, 3011–3028. [Google Scholar] [CrossRef]
- Domínguez-Castro, F.; Vicente-Serrano, S.M.; Tomás-Burguera, M.; Peña-Gallardo, M.; Beguería, S.; Kenawy, A.; Luna, Y.; Morata, A. High spatial resolution climatology of drought events for Spain: 1961–2014. Int. J. Climatol. 2019, 39, 5046–5062. [Google Scholar] [CrossRef]
- Vicente-Serrano, S.M.; Domínguez-Castro, F.; Murphy, C.; Hannaford, J.; Reig, F.; Peña-Angulo, D.; Tramblay, Y.; Trigo, R.M.; Mac Donald, N.; Luna, M.Y.; et al. Long-term variability and trends in meteorological droughts in western Europe (1851–2018). Int. J. Climatol. 2021, 41 (Suppl. 1), E690–E717. [Google Scholar] [CrossRef]
- Lloyd-Hughes, B. The Impracticality of a universal drought definition. Theor. Appl. Climatol. 2014, 117, 607–611. [Google Scholar] [CrossRef]
- Wilhite, D.A.; Pulwarty, R.S. Drought as hazard: Understanding the natural and social context. In Drought and Water Crises: Integrating Science, Management, and Policy, 2nd ed.; Wilhite, D., Pulwarty, R.S., Eds.; CRC Press: Boca Raton, FL, USA, 2017; pp. 3–20. [Google Scholar] [CrossRef]
- Tanasijevic, L.; Todorovic, M.; Pereira, L.S.; Pizzigalli, C.; Lionello, P. Impacts of climate change on olive crop evapotranspiration and irrigation requirements in the Mediterranean region. Agric. Water Manag. 2014, 144, 54–68. [Google Scholar] [CrossRef]
- Saadi, S.; Todorovic, M.; Tanasijevic, L.; Pereira, L.S.; Pizzigalli, C.; Lionello, P. Climate change and Mediterranean agriculture: Impacts on winter wheat and tomato crop evapotranspiration, irrigation requirements and yield. Agric. Water Manag. 2015, 147, 103–115. [Google Scholar] [CrossRef]
- Pulwarty, S.R.; Sivakumar, M.V.K. Information systems in a changing climate: Early warnings and drought risk management. Weather. Clim. Extrem. 2014, 3, 14–21. [Google Scholar] [CrossRef]
- Meddi, M.M.; Assani, A.A.; Meddi, H. Temporal variability of annual rainfall in the Macta and Tafna catchments, northwestern Algeria. Water Resour. Manag. 2010, 24, 3817–3833. [Google Scholar] [CrossRef]
- Hamlaoui-Moulai, L.; Mesbah, M.; Souag-Gamane, D.; Medjerab, A. Detecting hydro-climatic change using spatiotemporal analysis of rainfall time series in western Algeria. Nat. Hazards 2013, 65, 1293–1311. [Google Scholar] [CrossRef]
- Taibi, S.; Meddi, M.; Mahé, G.; Assani, A. Relationships between atmospheric circulation indices and rainfall in northern Algeria and comparison of observed and RCM-generated rainfall. Theor. Appl. Climatol. 2017, 127, 241–257. [Google Scholar] [CrossRef]
- Merabti, A.; Meddi, M.; Martins, D.S.; Pereira, L.S. Comparing SPI and RDI applied at local scale as influenced by climate. Water Resour. Manag. 2018, 32, 1071–1085. [Google Scholar] [CrossRef]
- Meddi, M.; Meddi, H.; Toumi, S.; Mehaigue, M. Regionalization of rainfall in north-western Algeria. Geogr. Tech. 2013, 17, 56–69. [Google Scholar]
- Habibi, B.; Meddi, M.; Torfs, P.J.J.F.; Remaoun, M.; Van Lanen, H.A.J. Characterisation and prediction of meteorological drought using stochastic models in the semi-arid Chéliff–Zahrez basin (Algeria). J. Hydrol. Reg. Stud. 2018, 16, 15–31. [Google Scholar] [CrossRef]
- Habibi, B.; Meddi, M. Meteorological drought hazard analysis of wheat production in the semi-arid basin of Cheliff–Zahrez nord, Algeria. Arab. J. Geosci. 2021, 14, 1045. [Google Scholar] [CrossRef]
- Vicente-Serrano, S.M.; Beguería, S.; López-Moreno, J.I. A Multiscalar drought index sensitive to global warming: The standardized precipitation evapotranspiration index. J. Clim. 2010, 23, 1696–1718. [Google Scholar] [CrossRef]
- Palmer, W. Meteorological Drought; U.S. Weather Bureau: Washington, DC, USA, 1965.
- Thornthwaite, C.W. An approach toward a rational classification of climate. Geogr. Rev. 1948, 38, 55–94. [Google Scholar] [CrossRef]
- Werick, W.J.; Willeke, G.E.; Guttman, N.B.; Hosking, J.R.M.; Wallis, J.R. National drought atlas developed. EOS 1994, 75, 89–90. [Google Scholar] [CrossRef]
- Nalbantis, I.; Tsakiris, G. Assessment of hydrological drought revisited. Water Resour. Manag. 2009, 23, 881–897. [Google Scholar] [CrossRef]
- Wu, H.; Hayes, M.J.; Weiss, A.; Hu, Q. An evaluation of the standardized precipitation index, the China-Z index and the statistical Z-score. Int. J. Clim. 2001, 21, 745–758. [Google Scholar] [CrossRef]
- Morid, S.; Smakhtin, V.; Moghaddasi, M. Comparison of seven meteorological indices for drought monitoring in Iran. Int. J. Clim. 2006, 26, 971–985. [Google Scholar] [CrossRef]
- Byun, H.R.; Wilhite, D.R. Objective quantification of drought severity and duration. J. Clim. 1999, 12, 2747–2756. [Google Scholar] [CrossRef]
- Ogunrinde, A.T.; Oguntunde, P.G.; Olasehinde, D.A.; Fasinmirin, J.T.; Akinwumiju, A.S. Drought spatiotemporal characterization using self-calibrating Palmer drought severity index in the northern region of Nigeria. Results Eng. 2020, 5, 100088. [Google Scholar] [CrossRef]
- Wells, N.; Goddard, S.; Hayes, M.J. A self-calibrating Palmer drought severity index. J. Clim. 2004, 17, 2335–2351. [Google Scholar] [CrossRef]
- Pereira, L.S.; Rosa, R.D.; Paulo, A.A. Testing a modification of the Palmer drought severity index for Mediterranean environments. In Methods and Tools for Drought Analysis and Management; Rossi, G., Vega, T., Bonaccorso, B., Eds.; Springer: Dordrecht, The Netherlands, 2007; Volume 62, pp. 149–167. [Google Scholar] [CrossRef]
- Paulo, A.; Martins, D.S.; Paredes, P.; Rosa, R.D.; Pereira, L.S. Modification of the Palmer drought severity index for Mediterranean environments. Eur. Water 2017, 60, 195–201. [Google Scholar]
- Karl, T.R.; Williams, C.N. An approach to adjusting climatological time series for discontinuous inhomogeneities. J. Appl. Meteorol. Climatol. 1987, 26, 1744–1763. [Google Scholar] [CrossRef]
- Allen, R.G.; Pereira, L.S.; Raes, D.; Smith, M. Crop Evapotranspiration-Guidelines for Computing Crop Water Requirements; FAO Irrigation and Drainage Paper 56; FAO: Rome, Italy, 1998; p. 300.
- Harris, I.; Osborn, T.J.; Jones, P.; Lister, D. Version 4 of the CRU TS monthly high-resolution gridded multivariate climate dataset. Sci. Data 2020, 7, 109. [Google Scholar] [CrossRef]
- Harris, I.; Jones, P.D.; Osborn, T.J.; Lister, D.H. Updated high-resolution grids of monthly climatic observations—The CRU TS3.10. Int. J. Climatol. 2014, 34, 623–642. [Google Scholar] [CrossRef] [Green Version]
- Ahmed, K.; Shahid, S.; Sachindra, D.A.; Nawaz, N.; Chung, E.-S. Fidelity assessment of general circulation model simulated precipitation and temperature over Pakistan using a feature selection method. J. Hydrol. 2019, 573, 281–298. [Google Scholar] [CrossRef]
- Oduro, C.; Shuoben, B.; Ayugi, B.; Beibei, L.; Babaousmail, H.; Sarfo, I.; Ullah, S.; Ngoma, H. Observed and coupled model intercomparison Project 6 multimodel simulated changes in near-surface temperature properties over Ghana during the 20th century. Int. J. Climatol. 2022, 42, 3681–3701. [Google Scholar] [CrossRef]
- Pour, S.H.; Wahab, A.K.A.; Shahid, S. Spatiotemporal changes in aridity and the shift of drylands in Iran. Atmospheric Res. 2020, 233, 104704. [Google Scholar] [CrossRef]
- Rosa, R.D.; Paredes, P.; Rodrigues, G.C.; Alves, I.; Fernando, R.M.; Pereira, L.S.; Allen, R.G. Implementing the dual crop coefficient approach in interactive software. 1. Background and computational strategy. Agr. Water Manag. 2012, 103, 8–24. [Google Scholar] [CrossRef]
- Tsakiris, G.; Vangelis, H.J.E.W. Establishing a drought index incorporating evapotranspiration. Eur. Water 2005, 9, 3–11. [Google Scholar]
- Guttman, N.B. Accepting the standardized precipitation index: A calculation algorithm. J. Am. Water Resour. Assoc. 1999, 35, 311–322. [Google Scholar] [CrossRef]
- Tigkas, D.; Vangelis, H.; Tsakiris, G. DrinC: A software for drought analysis based on drought indices. Earth Sci. Inform. 2015, 8, 697–709. [Google Scholar] [CrossRef]
- Paulo, A.A.; Rosa, R.D.; Pereira, L.S. Climate trends and behaviour of drought indices based on precipitation and evapotranspiration in Portugal. Nat. Hazards Earth Syst. Sci. 2012, 12, 1481–1491. [Google Scholar] [CrossRef]
- Smith, L.I. A tutorial on principal components analysis. Computer Sciences, 26th ed.; University of Otago: Dunedin, New Zealand, 2002. [Google Scholar]
- Prajapati, V.K.; Khanna, M.; Singh, M.; Kaur, R.; Sahoo, R.N.; Singh, D.K. PCA–based composite drought index for drought assessment in Marathwada region of Maharashtra state, India. Theor. Appl. Climatol. 2022, 149, 207–220. [Google Scholar] [CrossRef]
- Schwartz, C.; Ellenburg, W.L.; Mishra, V.; Mayer, T.; Griffin, R.; Qamer, F.; Matin, M.; Tadesse, T. A Statistical evaluation of earth-observation-based composite drought indices for a localized assessment of agricultural drought in Pakistan. Int. J. Appl. Earth Obs. Geoinf. 2022, 106, 102646. [Google Scholar] [CrossRef]
- Mathbout, S.; Lopez-Bustins, J.A.; Martin-Vide, J.; Bech, J.; Rodrigo, F.S. Spatial and temporal analysis of drought variability at several time scales in Syria during 1961–2012. Atmos. Res. 2018, 200, 153–168. [Google Scholar] [CrossRef]
- Zarei, A.R.; Moghimi, M.M.; Mahmoudi, M.R. Analysis of changes in spatial pattern of drought using RDI index in south of Iran. Water Resour. Manag. 2016, 30, 3723–3743. [Google Scholar] [CrossRef]
- Zarei, A.R.; Moghimi, M.M.; Mahmoudi, M.R. Parametric and non-parametric trend of drought in arid and semi-arid regions using RDI index. Water Resour. Manag. 2016, 30, 5479–5500. [Google Scholar] [CrossRef]
- Sharma, S. Applied Multivariate Technique; John Wiley & Sons: New York, NY, USA, 1995. [Google Scholar]
- Rencher, A.C. Multivariate Statistical Inference and Applications; Wiley: New York, NY, USA, 1998. [Google Scholar]
- North, G.R.; Bell, T.L.; Cahalan, R.F.; Moeng, F.J. Sampling errors in the estimation of empirical orthogonal functions. Mon. Wea. Rev. 1982, 110, 699–706. [Google Scholar] [CrossRef]
- Raziei, T.; Saghafian, B.; Paulo, A.A.; Pereira, L.S.; Bordi, I. Spatial patterns and temporal variability of drought in western Iran. Water Resour. Manag. 2009, 23, 439–455. [Google Scholar] [CrossRef]
- Goovaerts, P. Geostatistics for Natural Resources Evaluation; Oxford University Press: New York, NY, USA, 1997. [Google Scholar]
- Minasny, B.; McBratney, A.B.; Whelan, B.M. VESPER, version 1.6; Australian Centre for Precision Agriculture, The University of Sydney: Sydney, NSW, Australia, 2006.
- Hamed, K.H.; Ramachandra Rao, A. A modified Mann-Kendall trend test for autocorrelated data. J. Hydrol. 1998, 204, 182–196. [Google Scholar] [CrossRef]
- Mann, H.B. Nonparametric tests against trend. Econometrica 1945, 13, 245–249. [Google Scholar] [CrossRef]
- Kendall, M.G. Rank Correlation Methods; Charles Griffin: London, UK, 1975. [Google Scholar]
- Mitchell, J.M.; Dzerdzeevskii, B.; Flohn, H. Climate Change, 79th ed.; World Meteorological Organization: Geneva, Switzerland, 1966. [Google Scholar]
- Daufresne, M.; Lengfellner, K.; Sommer, U. Global warming benefits the small in aquatic ecosystems. Proc. Natl. Acad. Sci. USA 2009, 106, 12788–12793. [Google Scholar] [CrossRef]
- Sen, P.K. Estimates of the regression coefficient based on Kendall’s tau. J. Am. Stat. Assoc. 1968, 63, 1379–1389. [Google Scholar] [CrossRef]
- Svoboda, M.; LeComte, D.; Hayes, M.; Heim, R.; Gleason, K.; Angel, J.; Rippey, B.; Tinker, R.; Palecki, M.; Stooksbury, D.; et al. The drought monitor. B Am. Meteorol. Soc. 2002, 83, 1181–1190. [Google Scholar] [CrossRef]
- Lloyd-Hughes, B.; Saunders, M.A. A Drought Climatology for Europe. Int. J. Climatol. 2002, 22, 1571–1592. [Google Scholar] [CrossRef]
- Dai, A. Characteristics and trends in various forms of the Palmer Drought Severity Index during 1900–2008. J. Geophys. Res. 2011, 116, D12115. [Google Scholar] [CrossRef]
- Taibi, S.; Meddi, M.; Souag-Gamane, D.; Mahe, G. Évolution et régionalisation des précipitations au nord de l’Algérie (1936–2009). IAHS 2013, 359, 191–197. [Google Scholar]
- Bessaklia, H.; Serrano-Notivoli, R.; Ghenim, A.N.; Chikh, H.A.; Megnounif, A. Extreme precipitation trends in northeast Algeria using a high-resolution gridded daily dataset. Int. J. Climatol. 2021, 41, 6573–6588. [Google Scholar] [CrossRef]
- Mrad, D.; Dairi, S.; Boukhari, S.; Djebbar, Y. Applied Multivariate analysis on annual rainfall in the northeast of Algeria. J. Water Clim. Change 2020, 11, 1165–1176. [Google Scholar] [CrossRef]
- Zerouali, B.; Chettih, M.; Abda, Z.; Mesbah, M.; Santos, C.A.G.; Brasil Neto, R.M. A new regionalization of rainfall patterns based on wavelet transform information and hierarchical cluster analysis in northeastern Algeria. Theor. Appl. Climatol. 2022, 147, 1489–1510. [Google Scholar] [CrossRef]
- Di Lena, B.; Vergni, L.; Antenucci, F.; Todisco, F.; Mannocchi, F. Analysis of drought in the region of Abruzzo (Central Italy) by the standardized precipitation index. Theor. Appl. Clim. 2014, 115, 41–52. [Google Scholar] [CrossRef]
- Mathbout, S.; Lopez-Bustins, J.A.; Royé, D.; Martin-Vide, J. Mediterranean-scale drought: Regional datasets for exceptional meteorological drought events during 1975–2019. Atmosphere 2021, 12, 941. [Google Scholar] [CrossRef]


| PDSI Value | PDSI Category |
|---|---|
| ≥4.00 | Extreme wet spell |
| 3.00 to 3.99 | Severe wet spell |
| 2.00 to 2.99 | Moderate wet spell |
| 1.00 to 1.99 | Mild wet spell |
| 0.50 to 0.99 | Incipient wet spell |
| 0.49 to −0.49 | Normal |
| −0.50 to −0.99 | Incipient drought |
| −1.00 to −1.99 | Mild drought |
| −2.00 to −2.99 | Moderate drought |
| −3.00 to −3.99 | Severe drought |
| ≤−4.00 | Extreme drought |
| SPI and RDI Values | Category |
|---|---|
| ≥2.00 | Extremely wet |
| 1.50 to 1.99 | Very wet |
| 1.49 to 1.00 | Moderately wet |
| −0.99 to 0.99 | Near normal |
| −1.00 to −1.50 | Moderate drought |
| −1.50 to −1.99 | Severe drought |
| ≤−2.00 | Extreme drought |
| Variable | Nugget | Partial Sill | Range (m) | RMSE | AIC |
|---|---|---|---|---|---|
| MedPDSI ED | 0.2578 | 0.0653 | 33,107 | 0.0238 | −49.90 |
| Sc-PDSI ED | 0.2442 | 0.0486 | 23,517 | 0.0236 | −50.06 |
| RI-9 ED | 0.5592 | 0.2507 | 35,978 | 0.1008 | −18.11 |
| SPI-9 ED | 0.5732 | 0.2829 | 33,068 | 0.1027 | −17.70 |
| MedPDSI SD | 2.2440 | 2.4260 | 168,022 | 0.1549 | −8.65 |
| Sc-PDSI SD | 9.7900 | 0.7759 | 51,592 | 0.3689 | 10.44 |
| RI-9 SD | 0.8527 | 0.3267 | 111,550 | 0.0535 | −32.02 |
| SPI-9 SD | 0.8667 | 0.5316 | 128,980 | 0.1991 | −3.13 |
| MedPDSI MD | 4.0610 | 2.7810 | 158,959 | 0.3996 | 12.20 |
| Sc-PDSI MD | 7.7280 | 2.9190 | 73,205 | 1.3070 | 38.27 |
| RID-9 MD | 2.2920 | 0.4493 | 30,052 | 0.1580 | −8.21 |
| SPI-9 MD | 2.3430 | 0.2711 | 27,289 | 0.1206 | −14.15 |
| Explained Variance (%) | |||
|---|---|---|---|
| PC1 | PC2 | Cumulative | |
| Sc-PDSI | 33.8 | 27.3 | 61.1 |
| MedPDSI | 33.2 | 24.7 | 57.9 |
| SPI-9 | 42.1 | 27.7 | 69.8 |
| RDI-9 | 42.4 | 29.2 | 71.5 |
| Variable | Nugget | Partial Sill | Range (m) | RMSE | AIC |
|---|---|---|---|---|---|
| MedPDSI RPC1 | 0.0041 | 0.0252 | 82,727 | 0.038 | −90.07 |
| MedPDSI RPC2 | 0.0078 | 0.0131 | 69,312 | 0.033 | −98.48 |
| Sc-PDSI RPC1 | 0.0122 | 0.0134 | 55,152 | 0.049 | −74.43 |
| Sc-PDSI RPC2 | 0.0194 | 0.0161 | 55,152 | 0.032 | −100.70 |
| RDI-9 RPC1 | 0.0047 | 0.0148 | 50,680 | 0.066 | −56.33 |
| RDI-9 RPC2 | 0.0066 | 0.0109 | 50,000 | 0.040 | −86.68 |
| SPI-9 RPC1 | 0.0036 | 0.0180 | 55,152 | 0.069 | −56.46 |
| SPI-9 RPC2 | 0.0063 | 0.0126 | 50,680 | 0.041 | −85.70 |
| RDI-9 | SPI-9 | |||||||
| RPC1 | RPC2 | RPC1 | RPC2 | |||||
| MMK | Sen’s Slope | MMK | Sen’s Slope | MMK | Sen’s Slope | MMK | Sen’s Slope | |
| Jan | 0.084 | 0.013 | 0.338 | −0.012 | 0.131 | 0.014 | 0.369 | −0.008 |
| Feb | 0.195 | 0.009 | 0.131 | −0.013 | 0.300 | 0.010 | 0.812 | −0.002 |
| Mar | 0.082 | 0.014 | 0.211 | −0.014 | 0.052 | 0.017 | 0.607 | −0.006 |
| Apr | 0.087 | 0.014 | 0.206 | −0.014 | 0.042 | 0.018 | 0.466 | −0.008 |
| May | 0.099 | 0.015 | 0.109 | −0.017 | 0.026 | 0.016 | 0.505 | −0.007 |
| Jun | 0.217 | 0.012 | 0.045 | −0.021 | 0.102 | 0.013 | 0.247 | −0.010 |
| Jul | 0.093 | 0.012 | 0.034 | −0.022 | 0.036 | 0.017 | 0.361 | −0.011 |
| Aug | 0.476 | 0.006 | 0.071 | −0.019 | 0.020 | 0.018 | 0.338 | −0.010 |
| Sep | 0.332 | 0.009 | 0.216 | −0.011 | 0.016 | 0.021 | 0.355 | −0.010 |
| Oct | 0.551 | 0.005 | 0.571 | −0.005 | 0.019 | 0.021 | 0.132 | −0.016 |
| Nov | 0.170 | 0.012 | 0.379 | −0.008 | 0.016 | 0.019 | 0.069 | −0.019 |
| Dec | 0.161 | 0.012 | 0.289 | −0.010 | 0.179 | 0.012 | 0.136 | −0.017 |
| Year | 0.041 | 0.014 | 0.098 | −0.013 | 0.008 | 0.017 | 0.251 | −0.009 |
| MedPDSI | ScPDSI | |||||||
| RPC1 | RPC2 | RPC1 | RPC2 | |||||
| MMK | Sen’s Slope | MMK | Sen’s Slope | MMK | Sen’s Slope | MMK | Sen’s Slope | |
| Jan | 0.003 | 0.029 | 0.102 | −0.013 | 0.009 | 0.023 | 0.216 | −0.011 |
| Feb | 0.014 | 0.026 | 0.012 | −0.023 | 0.023 | 0.023 | 0.095 | −0.017 |
| Mar | 0.001 | 0.030 | 0.018 | −0.024 | 0.007 | 0.026 | 0.032 | −0.019 |
| Apr | 0.017 | 0.023 | 0.041 | −0.022 | 0.020 | 0.023 | 0.032 | −0.018 |
| May | 0.008 | 0.025 | 0.022 | −0.023 | 0.011 | 0.020 | 0.052 | −0.018 |
| Jun | 0.026 | 0.018 | 0.031 | −0.026 | 0.032 | 0.021 | 0.046 | −0.019 |
| Jul | 0.033 | 0.018 | 0.033 | −0.021 | 0.029 | 0.021 | 0.049 | −0.017 |
| Aug | 0.066 | 0.018 | 0.062 | −0.016 | 0.038 | 0.020 | 0.095 | −0.015 |
| Sep | 0.101 | 0.014 | 0.310 | −0.011 | 0.034 | 0.019 | 0.179 | −0.012 |
| Oct | 0.110 | 0.014 | 0.289 | −0.010 | 0.037 | 0.021 | 0.148 | −0.012 |
| Nov | 0.026 | 0.022 | 0.047 | −0.016 | 0.009 | 0.025 | 0.086 | −0.014 |
| Dec | 0.015 | 0.024 | 0.052 | −0.018 | 0.006 | 0.023 | 0.098 | −0.015 |
| Year | 0.009 | 0.021 | 0.015 | −0.020 | 0.008 | 0.021 | 0.069 | −0.015 |
Disclaimer/Publisher’s Note: The statements, opinions and data contained in all publications are solely those of the individual author(s) and contributor(s) and not of MDPI and/or the editor(s). MDPI and/or the editor(s) disclaim responsibility for any injury to people or property resulting from any ideas, methods, instructions or products referred to in the content. |
© 2023 by the authors. Licensee MDPI, Basel, Switzerland. This article is an open access article distributed under the terms and conditions of the Creative Commons Attribution (CC BY) license (https://creativecommons.org/licenses/by/4.0/).
Share and Cite
Merabti, A.; Darouich, H.; Paredes, P.; Meddi, M.; Pereira, L.S. Assessing Spatial Variability and Trends of Droughts in Eastern Algeria Using SPI, RDI, PDSI, and MedPDSI—A Novel Drought Index Using the FAO56 Evapotranspiration Method. Water 2023, 15, 626. https://doi.org/10.3390/w15040626
Merabti A, Darouich H, Paredes P, Meddi M, Pereira LS. Assessing Spatial Variability and Trends of Droughts in Eastern Algeria Using SPI, RDI, PDSI, and MedPDSI—A Novel Drought Index Using the FAO56 Evapotranspiration Method. Water. 2023; 15(4):626. https://doi.org/10.3390/w15040626
Chicago/Turabian StyleMerabti, Abdelaaziz, Hanaa Darouich, Paula Paredes, Mohamed Meddi, and Luis Santos Pereira. 2023. "Assessing Spatial Variability and Trends of Droughts in Eastern Algeria Using SPI, RDI, PDSI, and MedPDSI—A Novel Drought Index Using the FAO56 Evapotranspiration Method" Water 15, no. 4: 626. https://doi.org/10.3390/w15040626