Article

Does the Nature of Floods Matter in the Risk Perception of Households? A Comparative Assessment among the Rural Households Prone to Flash and Riverine Floods in Pakistan

1
School of Agricultural Resources, Chulalongkorn University, Bangkok 10330, Thailand
2
CRIMEDIM–Center for Research and Training in Disaster Medicine, Humanitarian Aid, and Global Health, Università del Piemonte Orientale (UPO), 28100 Novara, Italy
3
Institute of Agricultural Extension, Education and Rural Development, University of Agriculture, Faisalabad 38000, Pakistan
4
Directorate of Commerce Education and Management Sciences, Higher Education, Archives and Libraries Department Khyber Pakhtunkhwa, Peshawar 25000, Pakistan
*
Author to whom correspondence should be addressed.
Water 2023, 15(3), 504; https://doi.org/10.3390/w15030504
Submission received: 6 December 2022 / Revised: 17 January 2023 / Accepted: 25 January 2023 / Published: 27 January 2023
(This article belongs to the Section Hydrology)

Abstract

:
Floods have caused major losses and damages to people, infrastructure, and the environment. This study aims to assess the risk perception of households prone to riverine and flash floods and the perceived damages to infrastructure and livelihoods. Data were collected from 382 households through a questionnaire survey and analyzed using chi-squared and t-tests. Overall, risk perception was higher for riverine floods. Similarly, ‘flood coping capacities’, ‘livelihood disruption’, ‘change in lifestyle/adjusting to floods’, and ‘change in the relationship’ were also high for riverine floods and statistically significant (p-value < 0.05). The ‘likelihood of future flood damages’ perception was higher for flash floods (mean values: 0.913 vs. 0.779), while the ‘infrastructural damages’ showed the same results. The perceptions of ‘livelihoods’ and perceived ‘economic loss’ were greater for riverine floods (p-value < 0.05). The perceptions of ‘livestock damages’ and ‘household damages’ were higher for flash floods.

1. Introduction

Hydro-metrological disasters are rising worldwide, with floods considered among the most frequent disasters, accounting for about 51.62% of all hydro-meteorological disasters in 2021 [1]. Since the 1980s, floods account for about 40% of all loss-related catastrophes, with global losses totaling more than USD one trillion [2]. As a result of climate change, land use changes, infrastructure, and population explosion, catastrophic floods are occurring at increasing frequency and intervals [3]. Compared to other environmental hazards, flood events are considered to be the most damaging to both people and the sustainable development of the affected communities, where unsustainable development causes enormous damage to the environment in the absence of sustainable development [4]. The occurrence of floods and the scale and nature of communities affected are changing as a result of rapid urbanization, encroachment in floodplains, and flood-related mitigation infrastructure [5,6,7]. The global population exposed to floods has increased tenfold from 2000 to 2015 [3]. A reduction in flood-related mortalities and property loss will require further investment in adaptation practices globally [8,9].
Flood damages vary according to the type of flood. Riverine floods are considered to be the main type affecting most of the world’s population living in floodplains [10]. Riverine floods are caused mainly by factors such as heavy rainfall, human-induced changes in the climate, and land use response [11]. Since 1945, studies have consistently been conducted to investigate interactions between humans and floods [12] and how floodplain inundation affects human settlements [13]. Data suggest that one billion people still live in floodplains [14], arguably exposing them to further catastrophic impacts under current and future climatic scenarios [15,16]. Human intervention through urbanization, land use change, and flood control actions affect the frequency and magnitude of floods [17,18,19]. Floodplains provide favorable conditions for trade, agriculture, economic development, and recreational facilities. People have always tried to mitigate the adverse impacts of floods by implementing safety measures, such as flood protection walls, embankments, early warning systems, and zonation [20]. However, efforts toward reducing losses from these riverine floods occur after floods strike the communities [8]. Riverine floods are mostly large-scale floods affecting wide areas irrespective of the political boundaries and economic situation. Thus, it is important to understand these large-scale floods, as their impacts are continuously growing with the global climate.
Flash floods are also one of the major sources of destruction in many parts of the world. Especially in mountainous areas, flash floods are localized and characterized by large water discharge, in a short period of time, with huge economic damages to the surrounding communities [21]. Due to the sudden and rapid occurrence over a relatively small geographical area, flash floods pose a significant threat to human settlements [22]. Likewise, flash floods are more catastrophic than riverine floods, as they are typically unexpected incidents with rapid onset over a small area. According to WHO (2022) [23], flash floods are among the deadliest disasters worldwide, with more than 5000 annual lives lost and substantial impacts on the economy, environment, and society. Flash floods also account for almost 85% of cases of flooding and have the highest mortality rate among different flooding types [24] and compared to riverine floods, which affect wider areas but result in low prevention of human fatalities [24]. The main difference between a flash flood and riverine floods is the short basin response time to rainfall, which provides a very short lead time for the detection, forecasting, and warning of a flash flood [25]. Flash floods occur worldwide, and the time thresholds differ across regions, from a few minutes to several hours, depending on the region’s land surface and geomorphological and hydro climatological characteristics [26]. In this regard, rising atmospheric and sea surface temperatures influence precipitation patterns. Climate change also worsens and increases the likelihood of extreme rainfall in many regions. This leads to more recurrent flash floods and disastrous consequences [2].
Risk perception has been discussed within the domain of social science for a long time and has gained prominence in the field of risk analysis [27,28]. Understanding people’s risk perception is critical for effective communication [29,30]. Without a comprehensive risk perception assessment, risk communication measures will be less effective [31]. Risk perception assessment studies play a key role in accurately applying mitigation measures [32]. Generally, an expert’s risk perception differs from a laymen’s risk perception [33]. It is also crucial to recall that most studies on flood risk perception have focused on individual socio-demographic variables and personal experience with prior floods [34,35]. Risk perception analysis involves probability judgments, the severity of the catastrophic consequences, and the level of perceived control over the impacts [28,35]. In the same manner, understanding people’s risk perception can be useful for those communicating the risk: to achieve and establish communication efforts and properly select the content of information and their arrangements [36,37]. Previous studies have assessed risk perception in the context of riverine floods, i.e., [38,39,40]. For example, Ref. [39] analyzed people’s flood risk perception in the context of Jingdezhen city in China and found that socioeconomic factors contributed to higher risk perception. Similarly, research has been conducted in the context of flash floods elsewhere [41,42,43,44] in different parts of the world.
Pakistan is a disaster-prone country, ranked 22nd among 191 countries in the Global Risk Index from the 2022 Index for Risk Management [45]. It is also vulnerable to climate change impacts because of its geography, elevation, and demography [46]. Frequent flooding along the Indus River basin has exposed the 120 million people living there prone to floods. From 1947 to 2013, Pakistan faced a catastrophic flood once every three years [47]. The 2010 floods killed 1985 people, affecting 20 million more and causing a total of USD 10 billion loss to the country’s economy [48].
In general, floods in Pakistan are the worst of all hydro-meteorological hazards, as historically, floods have affected almost all provinces. The 2010 floods were the worst in the region in the past 80 years. Pakistan has experienced an overall loss of more than USD 38 billion during the past 70 years [47]. According to the same report, floods had, so far, caused the deaths of 12,502 people, whereas about 197,273 villages had suffered severe damages in the past [47]. In addition to this, more than 616,598 square kilometers of land had been affected due to floods occurrence. The 2010 floods were significantly higher in impact and magnitude compared to the other disasters recorded over the past two decades [46]. The overall duration of the 2010 floods was six months, affecting almost every province in the country [49]. Therefore, assessing flood damage and community risk perception is crucial for flood risk management [38].
Few studies have evaluated risk perception regarding floods in different contexts and regions across Pakistan, i.e., [50,51,52,53,54,55,56]. However, to the best of our knowledge, no study has been conducted in Pakistan that has compared the risk perception between riverine and flash flood-prone areas. Thus, to answer the question ‘does the nature of floods matter in flood risk perception?’, we aimed to measure people’s perceived flood risk and perceived flood damages in two communities exposed to riverine and flash floods. This is our first attempt to conduct this kind of study in Pakistan. We assume that, due to the different socio-cultural and geomorphological conditions of the study area from the rest of the country, this research will highlight the importance of a uniform policy at national, provincial, and regional levels for riverine as well as flash floods.

2. Materials and Methods

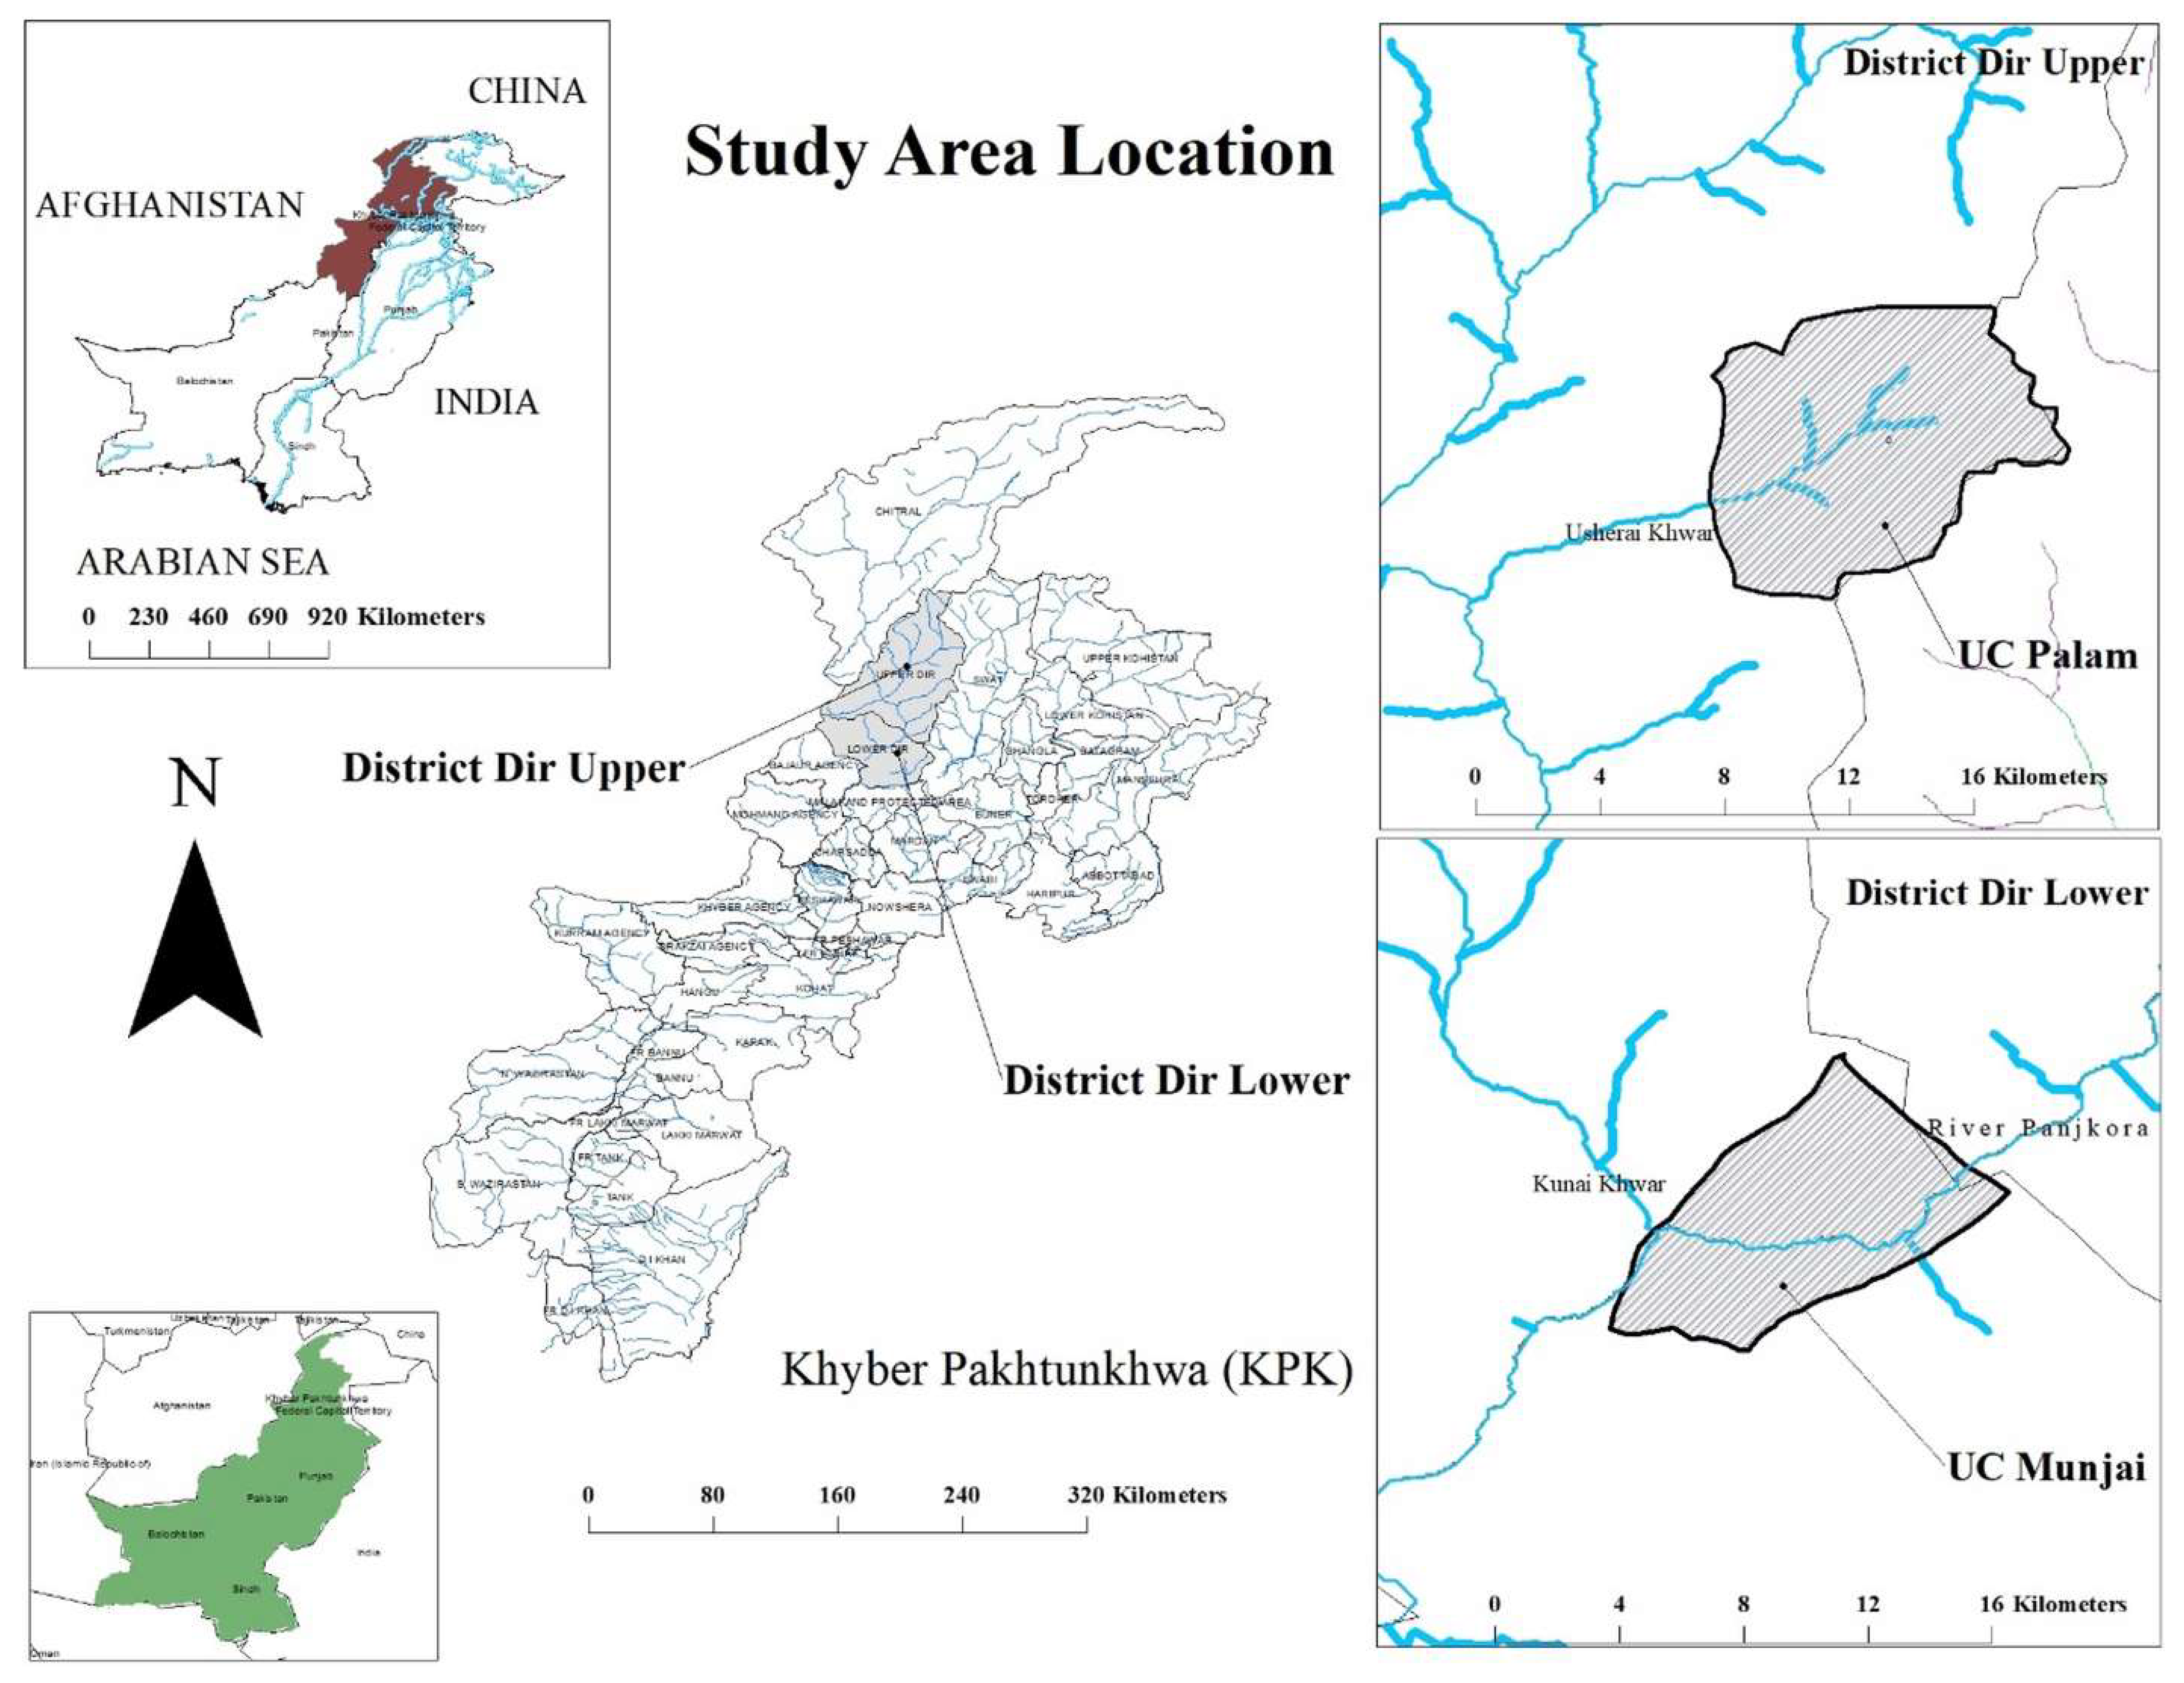
2.1. Study Area Selection

Khyber Pakhtunkhwa (KP) province was selected because it is highly prone to flash and riverine floods. At the time of the 2010 floods, all of the 25 districts in the province were severely affected by the historical floods [57]. For example, the disastrous floods of 2010 affected about 544 villages in the province, with severe consequences and damages to 257,294 houses and 121,500 hectares of cropped land. About 3.8 million people in this province were affected by these floods, resulting in 1156 deaths along with 1198 being injured [58]. Two districts, Lower Dir District and Upper Dir District, were selected for participation in this study because these two selected districts were categorized as being at high risk of flooding in the annual contingency plans of the province [59]. The selected districts were also listed among the top ten districts in the province to be most affected by the 2010 floods [60]. These two districts were also selected based on the types of floods they experience; the “flash flood phenomenon” (also known as a pluvial flood) is common in Upper Dir District, and riverine floods (also known as fluvial floods) are a common phenomenon in Lower Dir District, with some parts also exposed to flash flooding (Figure 1). In addition, these districts are composed of natural waterways (rivers and water channels) that consistently possess the risk of flooding during the annual monsoon season [57].

2.2. Sampling Method and Data Collection Procedure

For data collection, a multistage sampling method was adopted. Two Union Councils (UCs) were selected concerning their high vulnerability in the selected districts and close proximity to water bodies [60]. Data on vulnerable households were obtained from the Provincial Monsoon Contingency Plan 2014 [60]. In total, there were 8685 vulnerable households in the two UCs. Employing Yamane’s (1967) [61] formula, a sample size of 382 was calculated. The total sample was proportionally allocated between the two districts. A total of 106 households were interviewed from riverine flood-prone areas, whereas 276 were interviewed from flash flood-prone areas. The lists of households were prepared, and data were collected through random sampling.
An interviewer-administered questionnaire was used to collect the data. In the questionnaire, there were both open-ended and closed-ended questions. However, the open-ended questions’ responses and explanations were either incomplete or the same as closed-ended answers. Therefore, we excluded them from the analysis. From 1 September to 30 November 2018, data were collected. There were four major sections to the questionnaire. Section 1 contained questions on demographic data, such as age, education, household size, flood experience, household location, and household distance from the main water source. Section 2 was about the economic status of the households, such as monthly income, employment status, and household ownership. Section 3 was about flood risk perception factors. Section 4 contained questions related to infrastructural and livelihood damages. In order to improve clarity and comprehension, the questionnaire was pre-tested with 50 non-sample respondents, and any necessary modifications were made. The entire dataset was analyzed using SPSS (SPSS Statistics for Windows v.23 IBM, USA).

2.3. Developing an Index for Risk Perception

A composite risk perception index was calculated to analyze the respondents’ risk perceptions. The methodology of developing a composite index has been previously established by Rana and Rautray (2016) [52]. The composite index for risk perception was obtained after distributing weights to the classes for each individual indicator (Table 1). Different domains were measured through a combination of various indicators to form an index. However, this study allocated proper weights (0.2, 0.4, 0.6, 0.8, and 1.0) to classes of phenomenon (very low, low, moderate, high, very high) for each indicator and formulated indices based on Equation (1). The original datasets were standardized using the respective weights for the computation of the composite index through methods suggested by [52].
C I = W 1 + W 2 + W 3 + W n n CI = i = 1 n W i n
where, CI = the composite index, W1 to Wn = the corresponding weights of the indicators, and n = the number of indicators used for calculating the composite index (CI).
Following this general principle, Household Risk Perception Index (HRPI) scores were calculated for each household within the study area using Equation (2).
H R P I = 1 9 W i n
where i represents the ith household.

2.4. Indicators and Related Weights

With the support of a literature review on risk perception, indicators were carefully chosen for this study (Table 1). All of the indicators were chosen from previously conducted research [52] in the fields of disaster science and climate change. These indicators were evaluated in similar socio-cultural contexts in various regions and areas worldwide. In total, nine risk perception indicators were chosen and distributed into five categories. These categories were developed to illustrate the level of variation. Similarly, the weights for these five categories of occurrences were 0.20, 0.40, 0.60, 0.80, and 1. Thus, the composite index for each component ranged from 0.0 to 1.0.

3. Results

3.1. Socio-Economic Profile

The socio-economic statuses of the study’s respondents are mentioned in Table 2. The ages of the 382 total respondents were classified into four groups (age limit = ≥ 18). Overall, 17.80% of participants were under 30 years of age, 28.80% were between 30 and 40 years, 35.34% were between 41 and 50 years, and 18.06% were over 50 years of age. This demonstrates that most respondents (81.94%) were of working age and young. The households’ monthly incomes were measured in Pakistani rupees (PKR). Around 42% of the households earned less than 10,000 Pakistani rupees per month, while 34.29% earned between PKR 10,000 and 20,000 per month. Additionally, 61.52% of households were comprised of fewer than 8 individuals, while 29.84% had between 8 and 10 members. Overall, 35.34% of the 382 households investigated were found to be illiterate, while 24.87% were reported to have only completed elementary school.

3.2. Analysis of Risk Perception Indicators for Riverine and Flash Flood

To assess the risk perception of households in the study area, nine indicators were used (Table 1). The Likert scale was used to obtain respondents’ views on the nine selected indicators. Below, we have provided a comparative analysis of these nine indicators (Table 3). The independent sample t-test results show that five of nine indicators’ mean score values were significantly different at a 99% confidence interval. Results showed that the mean value of ‘flood damage likelihood in future’ for flash floods was higher (0.913) than that of riverine floods (0.779), with a p-value = 0.000. In addition, results showed that the mean value for ‘level of ability to cope with floods’ for riverine floods (0.449) was higher than for flash floods (0.337), with a p-value = 0.000. Moreover, the mean value for the indicator ‘likelihood of disruption in supplies from floods’ for riverine floods was higher (0.470) than for flash floods (0.291), with a p-value = 0.000. Similarly, the mean value for ‘adjusting to floods or changes in lifestyle after floods’ was higher for riverine floods (0.470) than for flash floods (0.330), with a p-value = 0.000. Likewise, the mean value for the indicator ‘likelihood of altering relationships in the community’ was higher for riverine floods (0.587) than for flash floods (0.440), with a p-value = 0.000, whereas four indicators were not found to be significant using independent sample t-tests.

3.3. Comparison of Impacts of Riverine Floods and Flash Floods

In addition to finding the risk perceptions of vulnerable people from flash floods and riverine floods for each indicator, this study attempted to find the impacts of both types of floods in the study area. Pearson’s chi-square test was used to find any significant differences between the impacts of the respective flood types. These impacts were categorized into two main groups, i.e., infrastructural damages and livelihood damages mentioned in Table 4. The infrastructural damages indicators were further categorized into four sub-operational indicators, i.e., level of damage to communication channels, level of damage to the water supply, level of damage to electrical lines, and level of damage to the road network. Results revealed that the level of perceived damages to communication channels (RCC bridges, suspension bridges, etc.) was higher in flash floods (42.39%) than in riverine floods (35.85%), but the result was not significant. Whereas the level of perceived damages to water supply schemes was found to be very high in the case of riverine floods (49.06%) compared to flash floods (46.38%), there was no significant difference between the two flood types. Furthermore, the results also revealed that the level of damage to electrical lines was found to be very high in riverine floods compared to flash floods, i.e., flash floods (44.93%) and riverine floods (44.34%), with no significance between the two flood types. Similarly, the level of damage to the road network was found to be very high in the case of riverine floods (55.66%) compared to flash floods (51.45%), although the results were not significant.
Similarly, livelihood damages were further categorized into five sub-operational indicators, i.e., level of damages to businesses/shops, level of damages to agricultural land/crops, level of damages to livestock, level of damages to households, and overall range of economic losses from the 2010 floods. Results revealed that the level of damages to businesses and shops was found to be very high in the case of riverine floods (53.77%) compared to flash floods (52.54%), with a significant difference between the two (p-value = 0.034). In the same way, the level of damages to agricultural land was found to be very high in the case of riverine floods (50%) compared to flash floods (25.72%), with a significance of p-value = 0.000. Additionally, the level of damages to the livestock sector was found to be very high in flash floods (38.41%) compared to riverine floods (21.70%), along with a significant difference (p-value = 0.003). Furthermore, the level of damages to households was found to be very high in the case of flash floods (13.77%) compared to riverine floods (9.43%), with a significant result (p-value = 0.042). Moreover, the range of economic loss was found to be high for riverine floods (25.47%) compared to flash floods (21.38%), as well as significant (p-value = 0.021).

4. Discussion

Flood risk perception among people vulnerable to flash floods and riverine floods is crucial for inclusive flood risk management. Risk perception research has grown remarkably in recent years; nevertheless, there is room for further research in this field [70]. This attempt is the continuation of such efforts, where we studied risk perception and their indicators individually for both flash floods and riverine floods. Similarly, we attempted to analyze the impacts of both types of floods and investigated which type was perceived as more severe in terms of its impacts on infrastructural damages and livelihood damages. For flood risk perception, our study answered the initial question raised, i.e., ‘does the nature of floods matter in flood risk perception’, and showed that risk perception was higher in the case of riverine floods compared to flash floods. Furthermore, we analyzed each of the nine indicators used in this study separately to see if there was any difference between the two flood types. However, the risk was based on perceptions, not the actual level of risk. For actual risk calculation, the indicators were different [55]. The results revealed that riverine floods have a higher risk perception among the study participants than flash floods. This comparison of the two types of floods, so that they were not treated under the same umbrella, is the unique point of the present study. Further, the findings have policy implications, as they indicate that separate plans are needed to cope with these floods.
Results revealed that the perception of the ‘likelihood of damages from floods’ was higher in the case of flash floods than in riverine floods. One reason for the high perception of the ‘likelihood of damages from flash floods’ can be explained by their nature, as they occur suddenly without much time for early warning [21]. Moreover, people have built houses close to the streams in flash flood-prone areas. Similarly, due to the shortage of agricultural land in the hilly areas, terrace farming is usually practiced, thus increasing their vulnerability to flash floods. Previous research carried out in the context of Europe has also highlighted that flash floods are mostly localized over a short period of time and cause huge economic damage [21]. Likewise, a study in Central Spain revealed that flash floods seriously threaten human settlements [22]. Furthermore, Jonkman and Vrijling have reviewed studies on losses from floods and revealed that flash floods are more catastrophic, as they are typically unexpected incidents with rapid onset over a small area [71].
The findings of the present study indicate that people prone to riverine floods are more able to cope with flooding compared to flash floods. During data collection, it was observed that people in the riverine flood-affected areas were much more stable in terms of access to government facilities, emergency services, and income stability and were more aware of different types of hazards compared to people living in the flash flood-affected areas. Likewise, respondents from the riverine flood area showed a higher perception of the ‘likelihood of disruption in supplies from floods’ to the community. This was evident from the post-2010 flood, where the main connecting highways in the study area were severely damaged, as reported in the data from the District Disaster Management Unit’s report [72]. The supply to the study area was cut off for many days, owing to serious damage to the main source of communication across the entire study area. For instance, there was significant damage to the main Timergara highway near the Timergara bypass, Khazana bypass, Odigram bridge, and Suspension Bridge at Baroon (fully eroded) [72].
Similarly, perceptions regarding ‘adjusting to floods or change in lifestyle to floods’ was higher for the riverine floods than for flash floods. This implies that these households were willing and able to change their lifestyle in the aftermath of a disaster. This may be explained by the fact that many people from the area were associated with diverse income sources, such as services, education, businesses, and remittances [73]. Moreover, the respondents living in riverine flood areas had a higher perception of the ‘likelihood of altering relationships in the community’ than respondents in flash flood areas. This was mostly reported in the areas where the government has no documented record of land ownership. The study area is one of them. In addition to this, people do not keep official land records for themselves. In this situation, whenever floods occur, it inundates and washes away the land. This provides the opportunity for land grabbers and encroachers to extend their land boundaries to land owned by others. This has been the bone of contention among the people within the study area in the aftermath of the 2010 floods. Resultantly, their relationships alter and their community relationships become weak. This eventually leads to weak social bonds in the community. However, previous studies [74] revealed that social capital plays an important role in post-disaster recovery. A study reported that social capital acts as informal insurance, as observed within the context of India [74]. In addition to this, social capital can play an important role in pre- and post-disaster situations, in terms of community cooperation and mobilization [75].
This study is further extended to measure the perceived damages to infrastructure and livelihoods. The findings revealed no significant difference among almost all of the indicators for infrastructure damages. One explanation for the results could be that the study area under consideration has the same physical infrastructure facilities provided by the government [76]. The two areas possess almost the same kind of network of roads, bridges, and communication channels [76]. The only difference between these two areas is their elevation from the sea level. For instance, flash flood-prone areas are higher and composed of more mountain ranges than riverine flood-prone areas [77].
Unlike the infrastructure damages, the findings for livelihoods showed that riverine floods had caused severe damage to the people’s businesses and shops. Trade and commerce in the study areas were mostly situated in plain areas (riverine flood areas). Therefore, most of the markets and trading centers were located close to the river, which was washed away in the historic floods of 2010 [72]. Additionally, based on this study’s findings, the agricultural land and crop experienced heavy damage in the case of riverine floods compared to flash floods. This is attributed to the fact that most of the agricultural land is situated very close to the Panjkora River. People in the riverine floodplain are associated with agricultural activities, which were inundated at the time of flooding [78]. Furthermore, findings revealed that livestock damages were reported to be higher in the case of flash floods compared to riverine floods. Households in flash flood-prone areas were reported to have more damage than people prone to riverine floods. The riverine flood-prone area was relatively more urbanized than the flash flood-prone area. Agricultural and cattle farming was the source of income for the households in the flash flood area. In terms of economic damages, the people living in the riverine floodplain reported more serious economic damages than those in flash floods. It is also evident from the data obtained from the relevant district’s government offices that the study areas were impacted very severely in terms of loss to the economy of the local people [72]. This could also be related to the damages incurred to other sectors, such as communication and agriculture.

5. Limitations and Strengths of the Study

This study was conducted in rural areas of Pakistan; therefore, the findings might differ from urban areas. Furthermore, this study was about measuring perceived risk and perceived flood damages, whereas the actual risk and damages might vary according to the nature of floods. This is the first study that has compared the risk perceptions of two areas prone to flash floods and riverine floods. The results may be carefully applied to other areas, and actual flood risk might differ. The study is associated with several limitations; however, it can serve as a baseline study for the research to be conducted in the future. This risk perception might be compared with socio-economic characteristics in the future. The respondents’ risk perceptions were measured and compared with the actual risk perception. The results are explanatory in nature, while they can be explanatory when compared with the socio-economic characteristics of the respondents.

6. Conclusions

Our study findings conclude that risk perception differs when it comes to the nature and type of floods and, in this case, does not remain the same in areas affected by flash floods versus riverine floods. This study showed that perceived risk was higher for households living in riverine floodplains compared to flash floodplains. In addition, the damages from riverine and flash floods are the same, given that they are within the same infrastructure facilities. However, the livelihood damages changed with the nature of floods. The Provincial Disaster Management Authority (PDMA) and the District Disaster Management Unit (DDMU) should work out different contingency plans for flash and riverine floods. In a post-disaster situation, the local leaders should be involved in the settlements of land disputes. It is further recommended that the local municipality allocate safer areas for economic activities away from the river basins. Further studies should focus on assessing flood vulnerability and the preparedness level of the study area. Second, risk perceptions must be checked for their association with the socio-economic characteristics of the respondents.

Author Contributions

Conceptualization, M.Y. and F.U.; methodology, S.E.S.; software, S.V.; validation, M.Y., F.U. and S.E.S.; formal analysis, S.A.; data curation, F.U. and S.E.S.; writing—original draft preparation, S.V.; writing—review and editing, S.A.; visualization, S.V.; supervision. All authors have read and agreed to the published version of the manuscript.

Funding

This research received no external funding.

Data Availability Statement

Data and other materials will be provided upon suitable request.

Acknowledgments

This research project is supported by the Second Century Fund (C2F), Chulalongkorn University. The authors are also grateful to all study participants who spared their time to provide the necessary data and information.

Conflicts of Interest

The authors declare no conflict of interest.

References

  1. CRED. 2021 Disasters in Numbers; CRED: Brussels, Belgium, 2022. [Google Scholar]
  2. MunichRe. Risk from Floods, Storm Surges and Flash Floods. Munich Re 2022. Available online: https://www.munichre.com/en/risks/natural-disasters-losses-are-trending-upwards/floods-and-flash-floods-underestimated-natural-hazards.html (accessed on 1 June 2022).
  3. Tellman, B.; Sullivan, J.A.; Kuhn, C.; Kettner, A.J.; Doyle, C.S.; Brakenridge, G.R.; Erickson, T.A.; Slalyback, D.A. Satellite imaging reveals increased proportion of population exposed to floods. Nature 2021, 596, 80–86. [Google Scholar] [CrossRef]
  4. Hallegatte, S.; Vogt-Schilb, A.; Bangalore, M.; Rozenberg, J. Unbreakable: Building the Resilience of the Poor in the Face of Natural Disasters; World Bank: Washington, DC, USA, 2017. [Google Scholar] [CrossRef] [Green Version]
  5. Ceola, S.; Laio, F.; Montanari, A. Satellite nighttime lights reveal increasing human exposure to floods worldwide. Geophys. Res. Lett. 2014, 41, 7184–7190. [Google Scholar] [CrossRef]
  6. Grill, G.; Lehner, B.; Thieme, M.; Geenen, B.; Tickner, D.; Antonelli, F.; Babu, S.; Borrelli, P.; Cheng, L.; Crochetiere, H.; et al. Mapping the world’s free-flowing rivers. Nature 2019, 569, 215–221. [Google Scholar] [CrossRef] [PubMed]
  7. Liu, X.; Huang, Y.; Xu, X.; Li, X.; Li, X.; Ciais, P.; Lin, P.; Gong, K.; Ziegler, A.D.; Chen, A.; et al. High-spatiotemporal-resolution mapping of global urban change from 1985 to 2015. Nat. Sustain. 2020, 3, 564–570. [Google Scholar] [CrossRef]
  8. Jongman, B.; Winsemius, H.C.; Aerts, J.C.J.H.; de Perez, E.C.; van Aalst, M.K.; Kron, W.; Ward, P.J. Declining vulnerability to river floods and the global benefits of adaptation. Proc. Natl. Acad. Sci. USA 2015, 112, E2271–E2280. [Google Scholar] [CrossRef] [PubMed] [Green Version]
  9. Ward, P.J.; Jongman, B.; Aerts, J.C.J.H.; Bates, P.D.; Botzen, W.J.W.; Loaiza, A.D.; Hallegatte, S.; Kind, J.M.; Kwadijk, J.; Scussolini, P.; et al. A global framework for future costs and benefits of river-flood protection in urban areas. Nat. Clim. Chang. 2017, 7, 642–646. [Google Scholar] [CrossRef] [Green Version]
  10. Alfieri, L.; Cohen, S.; Galantowicz, J.; Schumann, G.J.-P.; Trigg, M.A.; Zsoter, E.; Prudhomme, C.; Kruczkiewicz, A.; de Perez, E.C.; Flamig, Z.; et al. A global network for operational flood risk reduction. Environ. Sci. Policy 2018, 84, 149–158. [Google Scholar] [CrossRef]
  11. François, B.; Schlef, K.E.; Wi, S.; Brown, C.M. Design considerations for riverine floods in a changing climate—A review. J. Hydrol. 2019, 574, 557–573. [Google Scholar] [CrossRef]
  12. White, G. Human Adjustment to Floods. Ph.D. Thesis, The University of Chicago, Chicago, IL, USA, 1945. [Google Scholar]
  13. Myers, C.A.; Slack, T.; Singelmann, J. Social vulnerability and migration in the wake of disaster: The case of Hurricanes Katrina and Rita. Popul. Environ. 2008, 29, 271–291. [Google Scholar] [CrossRef]
  14. Alfieri, L.; Bisselink, B.; Dottori, F.; Naumann, G.; de Roo, A.; Salamon, P.; Wyser, K.; Feyen, L. Global projections of river flood risk in a warmer world: River flood risk in a warmer world. Earths Future 2017, 5, 171–182. [Google Scholar] [CrossRef]
  15. Arnell, N.W.; Gosling, S.N. The impacts of climate change on river flood risk at the global scale. Clim. Chang. 2016, 134, 387–401. [Google Scholar] [CrossRef] [Green Version]
  16. Winsemius, H.C.; Aerts, J.C.J.H.; van Beek, L.P.H.; Bierkens, M.F.P.; Bouwman, A.; Jongman, B.; Kwadijk, J.C.J.; Ligtvoet, W.; Lucas, P.L.; Van Vuuren, D.P.; et al. Global drivers of future river flood risk. Nat. Clim. Chang. 2016, 6, 381–385. [Google Scholar] [CrossRef] [Green Version]
  17. Di Baldassarre, G.; Castellarin, A.; Brath, A. Analysis of the effects of levee heightening on flood propagation: Example of the River Po, Italy. Hydrol. Sci. J. 2009, 54, 1007–1017. [Google Scholar] [CrossRef]
  18. Heine, R.A.; Pinter, N. Levee effects upon flood levels: An empirical assessment: Levee Effects Upon Flood Levels. Hydrol. Process. 2012, 26, 3225–3240. [Google Scholar] [CrossRef]
  19. Remo, J.W.F.; Carlson, M.; Pinter, N. Hydraulic and flood-loss modeling of levee, floodplain, and river management strategies, Middle Mississippi River, USA. Nat. Hazards 2012, 61, 551–575. [Google Scholar] [CrossRef]
  20. Woodward, M.; Gouldby, B.; Kapelan, Z.; Khu, S.-T.; Townend, I. Real Options in flood risk management decision making: Real Options in flood risk management. J. Flood Risk Manag. 2011, 4, 339–349. [Google Scholar] [CrossRef] [Green Version]
  21. Borga, M.; Stoffel, M.; Marchi, L.; Marra, F.; Jakob, M. Hydrogeomorphic response to extreme rainfall in headwater systems: Flash floods and debris flows. J. Hydrol. 2014, 518, 194–205. [Google Scholar] [CrossRef]
  22. Bodoque, J.M.; Amérigo, M.; Díez-Herrero, A.; García, J.A.; Cortés, B.; Ballesteros-Cánovas, J.A.; Olcina, J. Improvement of resilience of urban areas by integrating social perception in flash-flood risk management. J. Hydrol. 2016, 541, 665–676. [Google Scholar] [CrossRef] [Green Version]
  23. World Health Organization. Working for a Brighter, Healthier Future: How WHO Improves Health and Promotes Well-Being for the World’s Adolescents; World Health Organization: Geneva, Switzerland, 2021. [Google Scholar]
  24. Ceola, S.; Domeneghetti, A.; Schumann, G.J.P. Unraveling Long-Term Flood Risk Dynamics Across the Murray-Darling Basin Using a Large-Scale Hydraulic Model and Satellite Data. Front. Water 2022, 3, 797259. [Google Scholar] [CrossRef]
  25. Oğuz, E.; Sayin, A.; Ulupinar, Y.; Aksoy, M.; Köse, S.; Akbaş, A. Black Sea and Middle East Flash Flood Guidance System Implementation; Republic of Turkey Ministry of Forestry and Water Affairs Turkish Meteorological Service: Ankara, Turkey, 2015. [Google Scholar]
  26. World Meteorol Organ. Flash Flood Guidance System (FFGS) with Global Coverage. World Meteorol Organ 2022. Available online: https://community.wmo.int/hydrology-and-water-resources/flash-flood-guidance-system-ffgs-global-coverage (accessed on 20 May 2022).
  27. Slovic, P. Perception of Risk. Science 1987, 236, 280–285. [Google Scholar] [CrossRef]
  28. Schanze, J.; Zeman, E.; Marsalek, J. (Eds.) Flood Risk Management: Hazards, Vulnerability and Mitigation Measures; Springer: Dordrecht, The Netherlands, 2006. [Google Scholar]
  29. Keller, C.; Siegrist, M.; Gutscher, H. The Role of the Affect and Availability Heuristics in Risk Communication. Risk Anal. 2006, 26, 631–639. [Google Scholar] [CrossRef] [PubMed]
  30. Morrow, B.H. Risk Behavior and Risk Communication: Synthesis and Expert Interviews; National Oceanic and Atmospheric Administration: Washington, DC, USA, 2009.
  31. Terpstra, T.; Gutteling, J.M.; Geldof, G.D.; Kappe, L.J. The perception of flood risk and water nuisance. Water Sci. Technol. 2006, 54, 431–439. [Google Scholar] [CrossRef]
  32. Bier, V.M. On the state of the art: Risk communication to the public. Reliab. Eng. Syst. Saf. 2001, 71, 139–150. [Google Scholar] [CrossRef] [Green Version]
  33. Wright, G.; Bolger, F.; Rowe, G. An Empirical Test of the Relative Validity of Expert and Lay Judgments of Risk. Risk Anal. 2002, 22, 1107–1122. [Google Scholar] [CrossRef] [PubMed]
  34. Armaş, I.; Avram, E. Perception of flood risk in Danube Delta, Romania. Nat. Hazards 2009, 50, 269–287. [Google Scholar] [CrossRef]
  35. Zaalberg, R.; Midden, C.; Meijnders, A.; McCalley, T. Prevention, Adaptation, and Threat Denial: Flooding Experiences in the Netherlands. Risk Anal. 2009, 29, 1759–1778. [Google Scholar] [CrossRef] [PubMed]
  36. Fischhoff, B.; Bostrom, A.; Quadrel, M.J. Risk Perception and Communication. Annu. Rev. Public Health 1993, 14, 183–203. [Google Scholar] [CrossRef]
  37. Chusai, C.; Manomaiphiboon, K.; Saiyasitpanich, P.; Thepanondh, S. NO2 and SO2 dispersion modeling and relative roles of emission sources over Map Ta Phut industrial area, Thailand. J. Air Waste Manag. Assoc. 2012, 62, 932–945. [Google Scholar] [CrossRef]
  38. Kellens, W.; Zaalberg, R.; Neutens, T.; Vanneuville, W.; De Maeyer, P. An Analysis of the Public Perception of Flood Risk on the Belgian Coast: An Analysis of the Public Perception of Flood Risk. Risk Anal. 2011, 31, 1055–1068. [Google Scholar] [CrossRef] [Green Version]
  39. Wang, Z.; Wang, H.; Huang, J.; Kang, J.; Han, D. Analysis of the Public Flood Risk Perception in a Flood-Prone City: The Case of Jingdezhen City in China. Water 2018, 10, 1577. [Google Scholar] [CrossRef] [Green Version]
  40. Whitmarsh, L. Are flood victims more concerned about climate change than other people? The role of direct experience in risk perception and behavioural response. J. Risk Res. 2008, 11, 351–374. [Google Scholar] [CrossRef]
  41. Benight, C.C.; Gruntfest, E.C.; Hayden, M.; Barnes, L. Trauma and short-fuse weather warning perceptions. Environ. Hazards 2007, 7, 220–226. [Google Scholar] [CrossRef] [Green Version]
  42. Knocke, E.T.; Kolivras, K.N. Flash Flood Awareness in Southwest Virginia. Risk Anal. 2007, 27, 155–169. [Google Scholar] [CrossRef]
  43. Lave, T.R.; Lave, L.B. Public Perception of the Risks of Floods: Implications for Communication. Risk Anal. 1991, 11, 255–267. [Google Scholar] [CrossRef] [PubMed]
  44. Ruin, I.; Gaillard, J.; Lutoff, C. How to get there? Assessing motorists’ flash flood risk perception on daily itineraries. Environ. Hazards 2007, 7, 235–244. [Google Scholar] [CrossRef]
  45. Iasc, E. Inform Report 2022, Shared Evidence for Managing Crises and Disasters; Publications Office of the European Union: Luxembourg, 2022. [Google Scholar]
  46. National Disaster Management Authority. Annual Flood Report 2010; National Disaster Management Authority: Islamabad, Pakistan, 2010.
  47. Federal Flood Comission. Annual Flood Report 2017; Federal Flood Comission, Ministry of Water Resources: Islamabad, Pakistan, 2017.
  48. Rahman, A.-U.-; Khan, A.N.; Shaw, R. Disaster Risk Reduction Approaches in Pakistan; Springer: Tokyo, Japan, 2015. [Google Scholar]
  49. Kirsch, T.D.; Wadhwani, C.; Sauer, L.; Doocy, S.; Catlett, C. Impact of the 2010 Pakistan Floods on Rural and Urban Populations at Six Months. PLoS Curr. 2012, 4, e4fdfb212d2432. [Google Scholar] [CrossRef]
  50. Qasim, S.; Nawaz Khan, A.; Prasad Shrestha, R.; Qasim, M. Risk perception of the people in the flood prone Khyber Pukhthunkhwa province of Pakistan. Int. J. Disaster Risk Reduct. 2015, 14, 373–378. [Google Scholar] [CrossRef]
  51. Qasim, S.; Qasim, M.; Shrestha, R.P.; Khan, A.N.; Tun, K.; Ashraf, M. Community resilience to flood hazards in Khyber Pukhthunkhwa province of Pakistan. Int. J. Disaster Risk Reduct. 2016, 18, 100–106. [Google Scholar] [CrossRef]
  52. Rana, I.A.; Routray, J.K. Actual vis-à-vis perceived risk of flood prone urban communities in Pakistan. Int. J. Disaster Risk Reduct. 2016, 19, 366–378. [Google Scholar] [CrossRef]
  53. Saqib S e Ahmad, M.M.; Panezai, S.; Ali, U. Factors influencing farmers’ adoption of agricultural credit as a risk management strategy: The case of Pakistan. Int. J. Disaster Risk Reduct. 2016, 17, 67–76. [Google Scholar] [CrossRef]
  54. Saqib, S.E.; Ahmad, M.M.; Panezai, S.; Rana, I.A. An empirical assessment of farmers’ risk attitudes in flood-prone areas of Pakistan. Int. J. Disaster Risk Reduct. 2016, 18, 107–114. [Google Scholar] [CrossRef]
  55. Ullah, R.; Jourdain, D.; Shivakoti, G.P.; Dhakal, S. Managing catastrophic risks in agriculture: Simultaneous adoption of diversification and precautionary savings. Int. J. Disaster Risk Reduct. 2015, 12, 268–277. [Google Scholar] [CrossRef]
  56. Ullah, R.; Shivakoti, G.P.; Kamran, A.; Zulfiqar, F. Farmers versus nature: Managing disaster risks at farm level. Nat. Hazards 2016, 82, 1931–1945. [Google Scholar] [CrossRef]
  57. Provincial Disaster Management Authority. Contingency Plan Monsoon 2012; Provincial Disaster Management Authority: Peshawar, Pakistan, 2012.
  58. Federal Flood Commission. Annual Flood Report 2010; Federal Flood Commission, Ministry of Water and Power: Islamabad, Pakistan, 2010.
  59. Provincial Disaster Management Authority. Contingency Plan Monsoon 2016; Provincial Disaster Management Authority: Peshawar, Pakistan, 2016.
  60. Provincial Disaster Management Authority. Contingency Plan Monsoon 2014; Provincial Disaster Management Authority: Peshawar, Pakistan, 2014.
  61. Yamane, T. Statistics: An Introductory Analysis; Harper & Row: Manhattan, NY, USA, 1967. [Google Scholar]
  62. Adelekan, I.O.; Asiyanbi, A.P. Flood risk perception in flood-affected communities in Lagos, Nigeria. Nat. Hazards 2016, 80, 445–469. [Google Scholar] [CrossRef]
  63. Ho, M.-C.; Shaw, D.; Lin, S.; Chiu, Y.-C. How Do Disaster Characteristics Influence Risk Perception? Risk Anal. 2008, 28, 635–643. [Google Scholar] [CrossRef] [PubMed]
  64. Armaş, I. Multi-criteria vulnerability analysis to earthquake hazard of Bucharest, Romania. Nat. Hazards 2012, 63, 1129–1156. [Google Scholar] [CrossRef]
  65. Miceli, R.; Sotgiu, I.; Settanni, M. Disaster preparedness and perception of flood risk: A study in an alpine valley in Italy. J. Environ. Psychol. 2008, 28, 164–173. [Google Scholar] [CrossRef]
  66. Baan, P.J.A.; Klijn, F. Flood risk perception and implications for flood risk management in the Netherlands. Int. J. River Basin. Manag. 2004, 2, 113–122. [Google Scholar] [CrossRef] [Green Version]
  67. Rana, I.A.; Routray, J.K. Multidimensional Model for Vulnerability Assessment of Urban Flooding: An Empirical Study in Pakistan. Int. J. Disaster Risk Sci. 2018, 9, 359–375. [Google Scholar] [CrossRef] [Green Version]
  68. Pagneux, E.; Gísladóttir, G.; Jónsdóttir, S. Public perception of flood hazard and flood risk in Iceland: A case study in a watershed prone to ice-jam floods. Nat. Hazards 2011, 58, 269–287. [Google Scholar] [CrossRef]
  69. Yu, H.; Wang, B.; Zhang, Y.-J.; Wang, S.; Wei, Y.-M. Public perception of climate change in China: Results from the questionnaire survey. Nat. Hazards 2013, 69, 459–472. [Google Scholar] [CrossRef]
  70. Kellens, W.; Terpstra, T.; De Maeyer, P. Perception and Communication of Flood Risks: A Systematic Review of Empirical Research: Perception and Communication of Flood Risks. Risk Anal. 2013, 33, 24–49. [Google Scholar] [CrossRef] [PubMed] [Green Version]
  71. Jonkman, S.N.; Vrijling, J.K. Loss of life due to floods: Loss of life due to floods. J. Flood Risk Manag. 2008, 1, 43–56. [Google Scholar] [CrossRef]
  72. District Government Office. Assessment of Flood/Rain Damages 2010; District Dir Government Office, 2010. Available online: https://reliefweb.int/report/pakistan/pakistan-floods-2010-preliminary-damage-and-needs-assessment (accessed on 1 January 2023).
  73. Ullah, R.; Shivakoti, G.P. Adoption of On-Farm and Off-Farm Diversification to Manage Agricultural Risks: Are These Decisions Correlated? Outlook Agric. 2014, 43, 265–271. [Google Scholar] [CrossRef]
  74. Sanyal, S.; Routray, J.K. Social capital for disaster risk reduction and management with empirical evidences from Sundarbans of India. Int. J. Disaster Risk Reduct. 2016, 19, 101–111. [Google Scholar] [CrossRef] [Green Version]
  75. Koh, H.K.; Cadigan, R.O. Disaster Preparedness and Social Capital; Kawachi, I., Subramanian, S.V., Kim, D., Eds.; Soc. Cap. Health; Springer: New York, NY, USA, 2008; pp. 273–285. [Google Scholar] [CrossRef]
  76. Pakistan Poverty Alleviation Fund. Development Profile of Lower Dir District; Pakistan Poverty Alleviation Fund: Islamabad, Pakistan, 2015. [Google Scholar]
  77. Government of Pakistan. 1998 District Census Report of Lower Dir; Government of Pakistan: Islamabad, Pakistan, 1999.
  78. District Government Office. Monsoon Contingency Plan District Dir Lower; Government of Khyber Pakhtunkhwa: Peshawar, Pakistan, 2017.
Figure 1. Study area map.
Water 15 00504 g001
Table 1. Indicators used in the study to represent respondents’ flood risk perceptions, their respective weights, and sources.
IndicatorsVery LowLowModerateHighVery HighSources
1. Flood likelihood of occurrence0.20.40.60.81.0[62,63]
2. Flood damage likelihood in future0.20.40.60.81.0[52,64,65]
4. Level of ability to cope with floods0.20.40.60.81.0[52,63]
5. Likelihood of disruption in supplies from floods0.20.40.60.81.0[52,65]
3. Level of adjusting to floods or changes in lifestyle0.20.40.60.81.0[64]
6. Level of threat to life from floods0.20.40.60.81.0[63,66,67]
7. Likelihood of altering relationships in the community0.20.40.60.81.0[34,52]
8. Level of fear and dread from floodsNot AfraidSlightly AfraidNeutralAfraidVery Much Afraid[62,63,68]
0.20.40.60.81.0
9. Level of agreement with government policies on DRRStrongly DisagreeDisagreeNeutralAgreeStrongly Agree[67,69]
0.20.40.60.81.0
Table 2. Socio-economic characteristics of the respondents.
Socio-Economic Characteristicsn%
Age (Years)
<306817.80
30–4011028.80
41–5013535.34
>506918.06
Monthly Income (PKR)
<10,00016142.15
10,000–20,00013134.29
20,001–30,000369.42
>30,0005414.14
Household Members
<823561.52
8–1011429.84
>10338.64
Education Level
Illiterate13535.34
Primary9524.87
Secondary9224.08
Higher secondary and above6015.71
Table 3. Risk perception statistics for riverine floods and flash floods.
IndicatorsFlash FloodRiverine Floodp-ValueCI of Difference
Lower–Upper
MeanS. DMeanS. D
Flood Likelihood of occurrence0.5880.31220.6360.27710.165(−0.1162)–(0.0199)
Flood damage likelihood in future0.9130.15720.7790.22070.000 **(0.0940) –(0.1736)
Level of ability to cope with floods0.3370.19880.4490.21170.000 **(−0.1576)–(−0.0666)
Likelihood of disruption in supplies from floods 0.2910.21390.4700.29860.000 **(−0.2325)–(−0.1245)
Adjusting to floods or changes in lifestyle 0.3300.21260.4700.24380.000 **(−0.1892)–(−0.0896)
Level threat to life from floods0.3680.28570.4280.29790.069(−0.1251)–(0.0048)
Likelihood of altering relationships in the community0.4400.12060.5870.23790.000 **(−0.1833)–(−0.1106)
Level of fear and dread from floods0.9190.16210.9380.10820.268(−0.0524)–(0.0146)
Level of agreement with government policies on DRR0.39200.176660.37740.221370.500(−0.02803)–(0.05737)
Source: Field Survey, 2018, ** significant at a 99% level of confidence, S. D = standard deviation.
Table 4. Statistics on the perceived risk of damages from riverine and flash floods, respectively.
Indicators Used for Infrastructure Damages Very HighHighModerateLowVery Lowχ2 p-Value
Level of Damages to Communication ChannelFlash Floodn (%)117 (42.39)95(34.42)34 (12.32)19 (6.99)11 (3.99)0.113
Riverine Floodn (%)38 (35.85)29 (27.36)20 (18.87)13 (12.26)6 (5.66)
Level of Damages to Water supplyFlash Floodn (%)128 (46.38)75 (27.27)39 (14.13)19 (6.88)15(5.43)0.823
Riverine Floodn (%)52 (49.06)23 (21.70)17 (16.04)9 (8.49)5 (4.72)
Level of Damages to Electricity LinesFlash Floodn (%)124 (44.93)85 (30.80)39 (14.13)16 (5.80)12 (4.35)0.837
Riverine Floodn (%)47 (44.34)29 (27.36)15 (14.15)8 (7.55)7 (6.60)
Level of Damages to Road NetworkFlash Floodn (%)142 (51.45)81 (29.35)35 (12.68)13 (4.71)5 (1.81)0.392
Riverine Floodn (%)59 (55.66)24 (22.64)14 (13.21)4 (3.77)5 (4.72)
Indicators used for Livelihood Damages
Level of Damages to Businesses/ShopsFlash Floodn (%)145 (52.54)56 (20.29)47 (17.03)12 (4.35)16 (5.80)0.034 *
Riverine Floodn (%)57 (53.77)33 (31.13)13 (12.26)2 (1.89)1 (0.94)
Level of Damages to Agricultural Land/CropsFlash Floodn (%)71 (25.72)99 (35.85)60 (21.74)25 (9.06)21 (7.61)0.000 **
Riverine Floodn (%)53 (50.00)23 (21.70)19 (17.92)8 (7.55)3 (2.83)
Level of Damages to LivestockFlash Floodn (%)106 (38.41)88 (31.88)35 (12.68)27 (9.78)20 (7.25)0.003 **
Riverine Floodn (%)23 (21.70)31 (29.25)21 (19.81)14 (13.21)17 (16.04)
Level of Damages to Households Heavy DamagesModerate DamagesLight DamagesNo Damages
Flash Floodn (%)38 (13.77)28 (10.14)78 (28.26)132 (47.83) 0.042 *
Riverine Floodn (%)10 (9.43)12 (11.32)18 (16.98)66 (62.26)
Range of Economic Loss from 2010 Floods >100,00050,000–100,000<50,000No loss
Flash Floodn (%)59 (21.38)27 (9.78)42 (15.22)148 (53.62) 0.021 *
Riverine Floodn (%)27 (25.47)21 (19.81)16 (15.09)42 (39.62)
Source: Field Survey, 2018, * significant at a 95% level of confidence, ** significant at a 99% level of confidence.
Disclaimer/Publisher’s Note: The statements, opinions and data contained in all publications are solely those of the individual author(s) and contributor(s) and not of MDPI and/or the editor(s). MDPI and/or the editor(s) disclaim responsibility for any injury to people or property resulting from any ideas, methods, instructions or products referred to in the content.

