
Fish Biomonitoring and Ecological Assessment in the Dianchi Lake Basin Based on Environmental DNA
 ,
,
Abstract
:1. Introduction
2. Methods
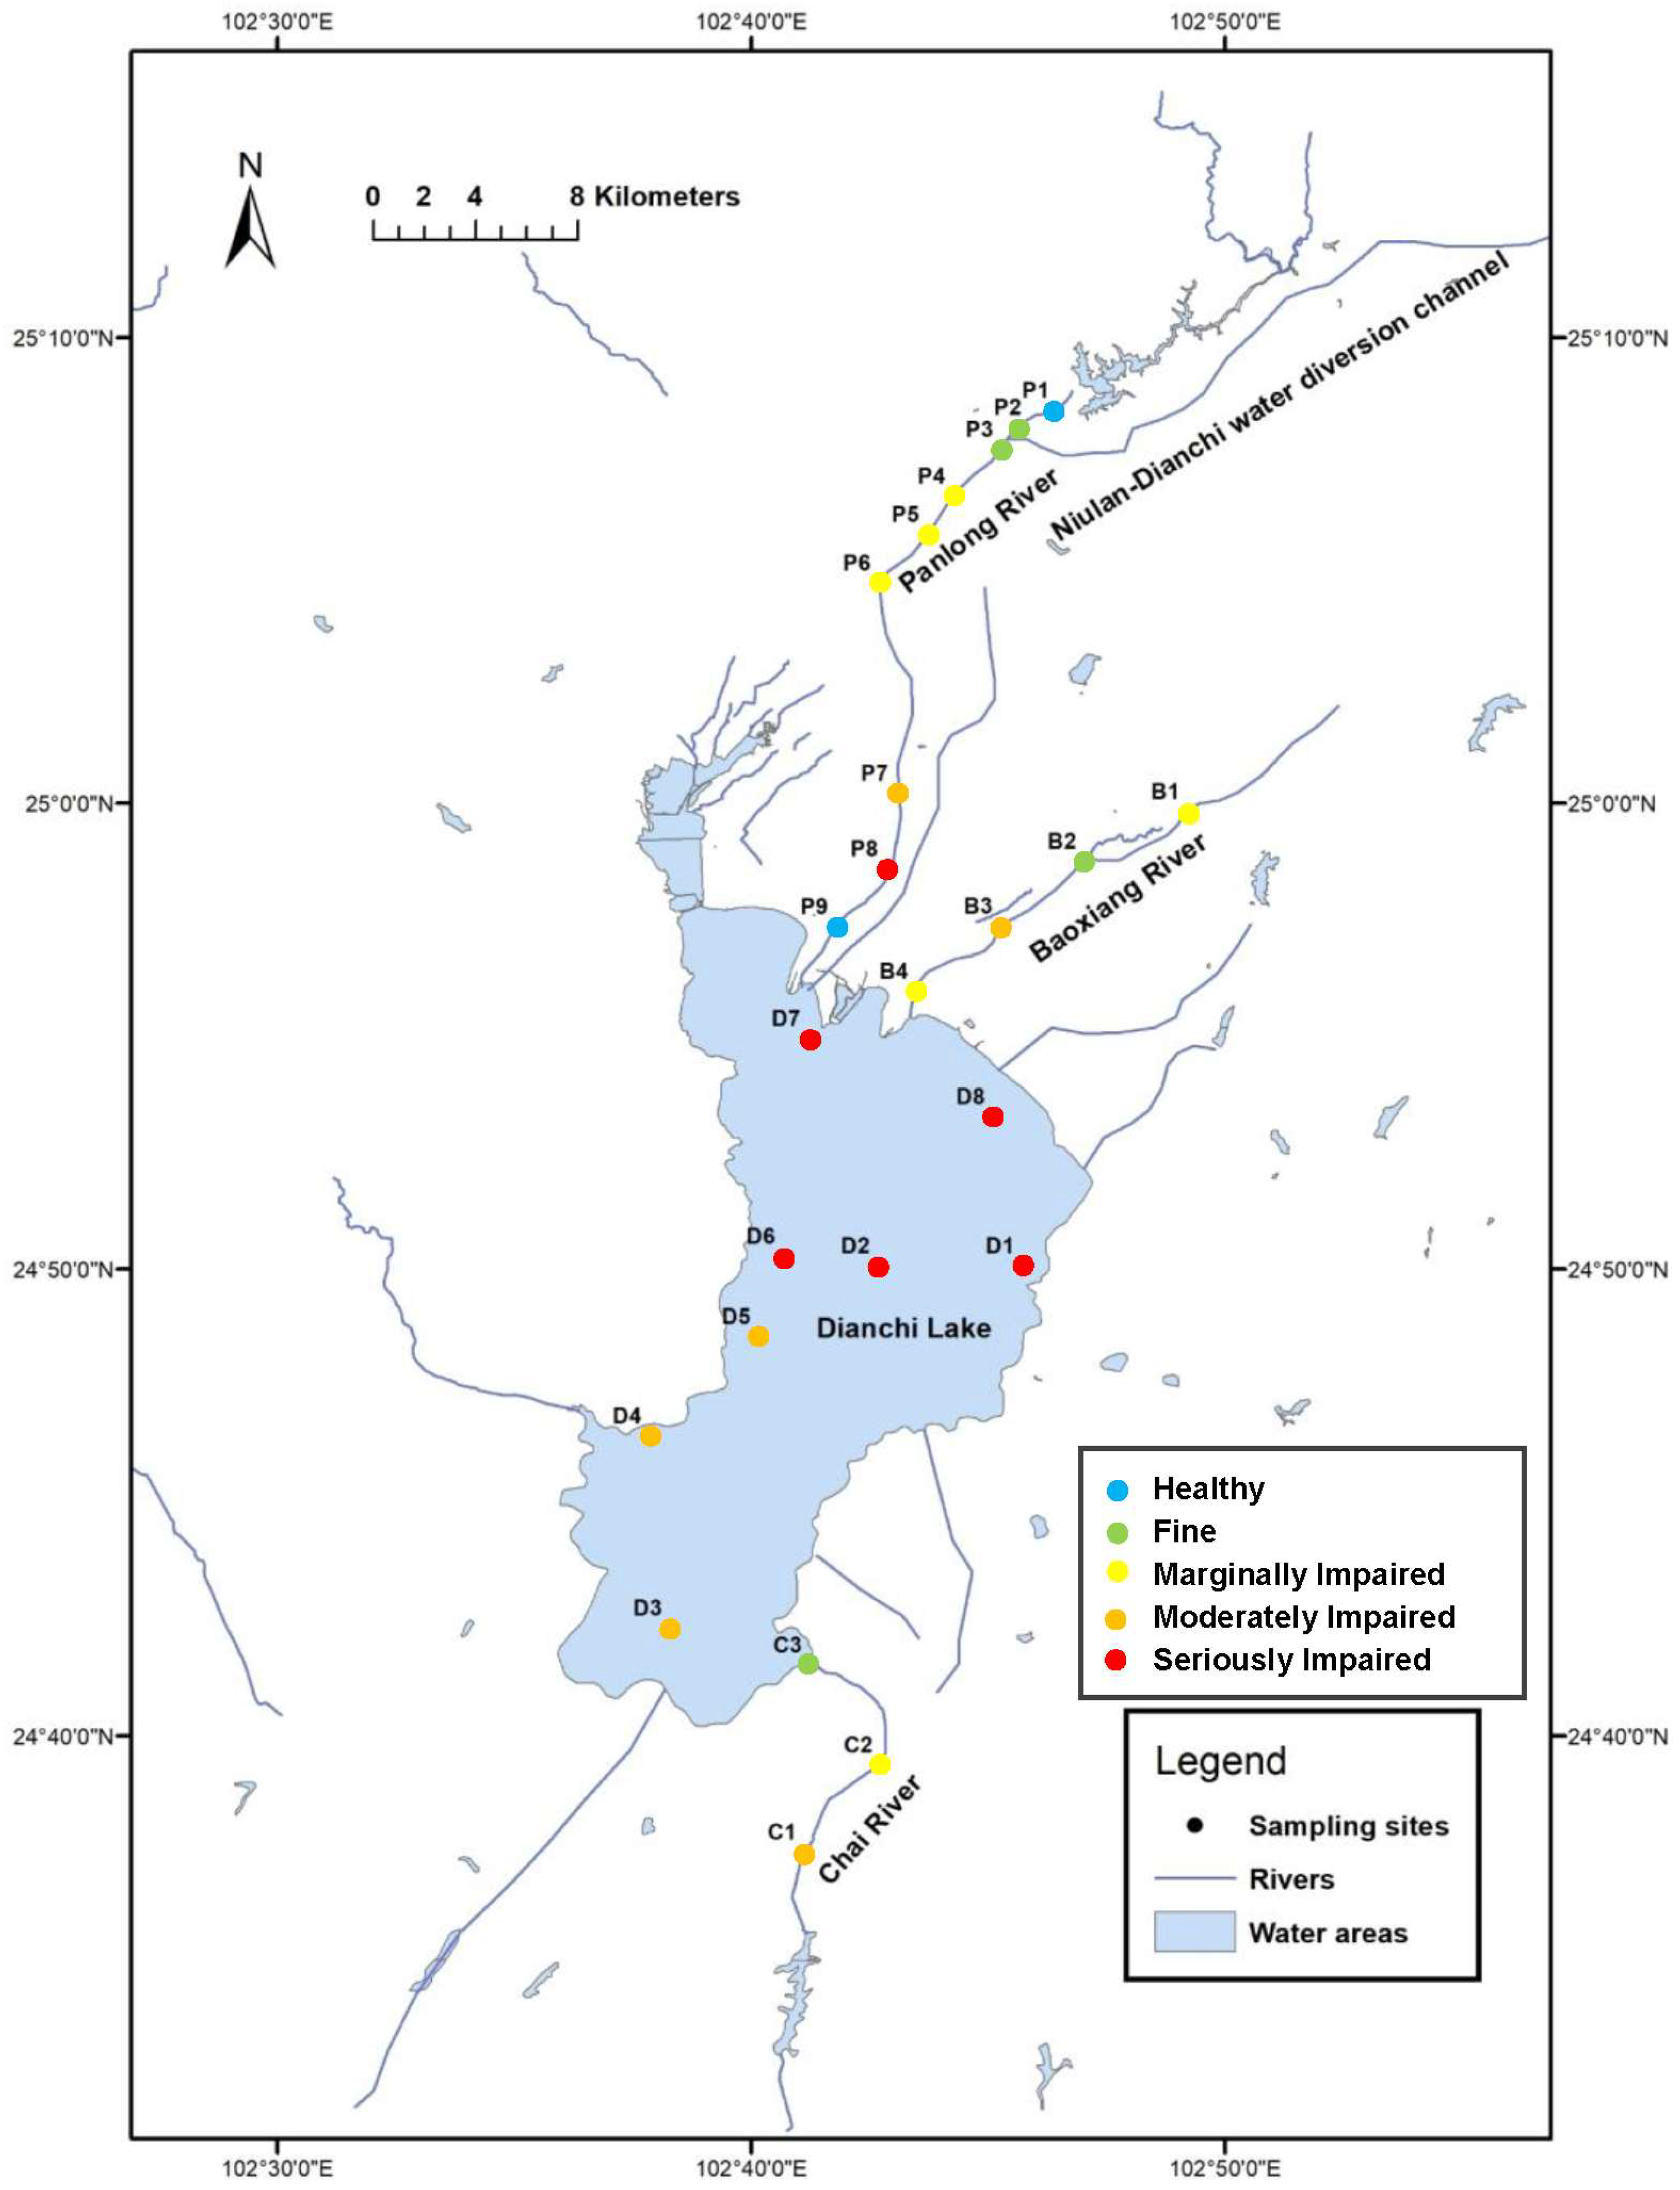
2.1. Study Area
2.2. Collection and Treatment of Water Samples
2.3. DNA Extraction, PCR Amplification, and High-Throughput Sequencing
2.4. Bioinformatics and Fish Biodiversity Analysis
2.5. Construction of F-IBI

| Number | Type of the Candidate Parameter | Name of the Candidate Parameter | Expected Response to Disturbance | References |
|---|---|---|---|---|
| M1 | Species composition and abundance | Number of fish species | Negative | [45] |
| M2 | Sequence number of fish | Negative | [45] | |
| M3 | Relative abundance of exotic fish | Positive | [45] | |
| M4 | Percentage of indigenous fish species in Yunnan, China * | Negative | [45] | |
| M5 | Percentage of Perciformes | Negative | [48] | |
| M6 | Percentage of Siluriformes | Positive | [48] | |
| M7 | Percentage of Cyprinidae | Negative | [48] | |
| M8 | Percentage of Cobitidae | Positive | [48] | |
| M9 | Shannon–Wiener diversity index | Negative | [48] | |
| M10 | Nutrition structure | Relative abundance of omnivorous fish | Positive | [45] |
| M11 | Relative abundance of herbivorous fish | Negative | [45] | |
| M12 | Relative abundance of carnivorous fish | Negative | [45] | |
| M13 | Relative abundance of plankton-eating fish | Negative | [32] | |
| M14 | Tolerance | Relative abundance of sensitive fish | Negative | [45] |
| M15 | Relative abundance of Pollution-resistant fish | Positive | [45] | |
| M16 | Relative abundance of moderately pollution-resistant fish | Positive | [32] | |
| M17 | Breeding co-located group | Relative abundance of slimy egg fish | Positive | [32] |
| M18 | Relative abundance of demersal egg fish | Negative | [32] | |
| M19 | Relative abundance of floating egg fish | Negative | [48] | |
| M20 | Relative abundance of drifting egg fish | Negative | [32] | |
| M21 | Relative abundance of fish by other spawning methods | Negative | [45] |
3. Results
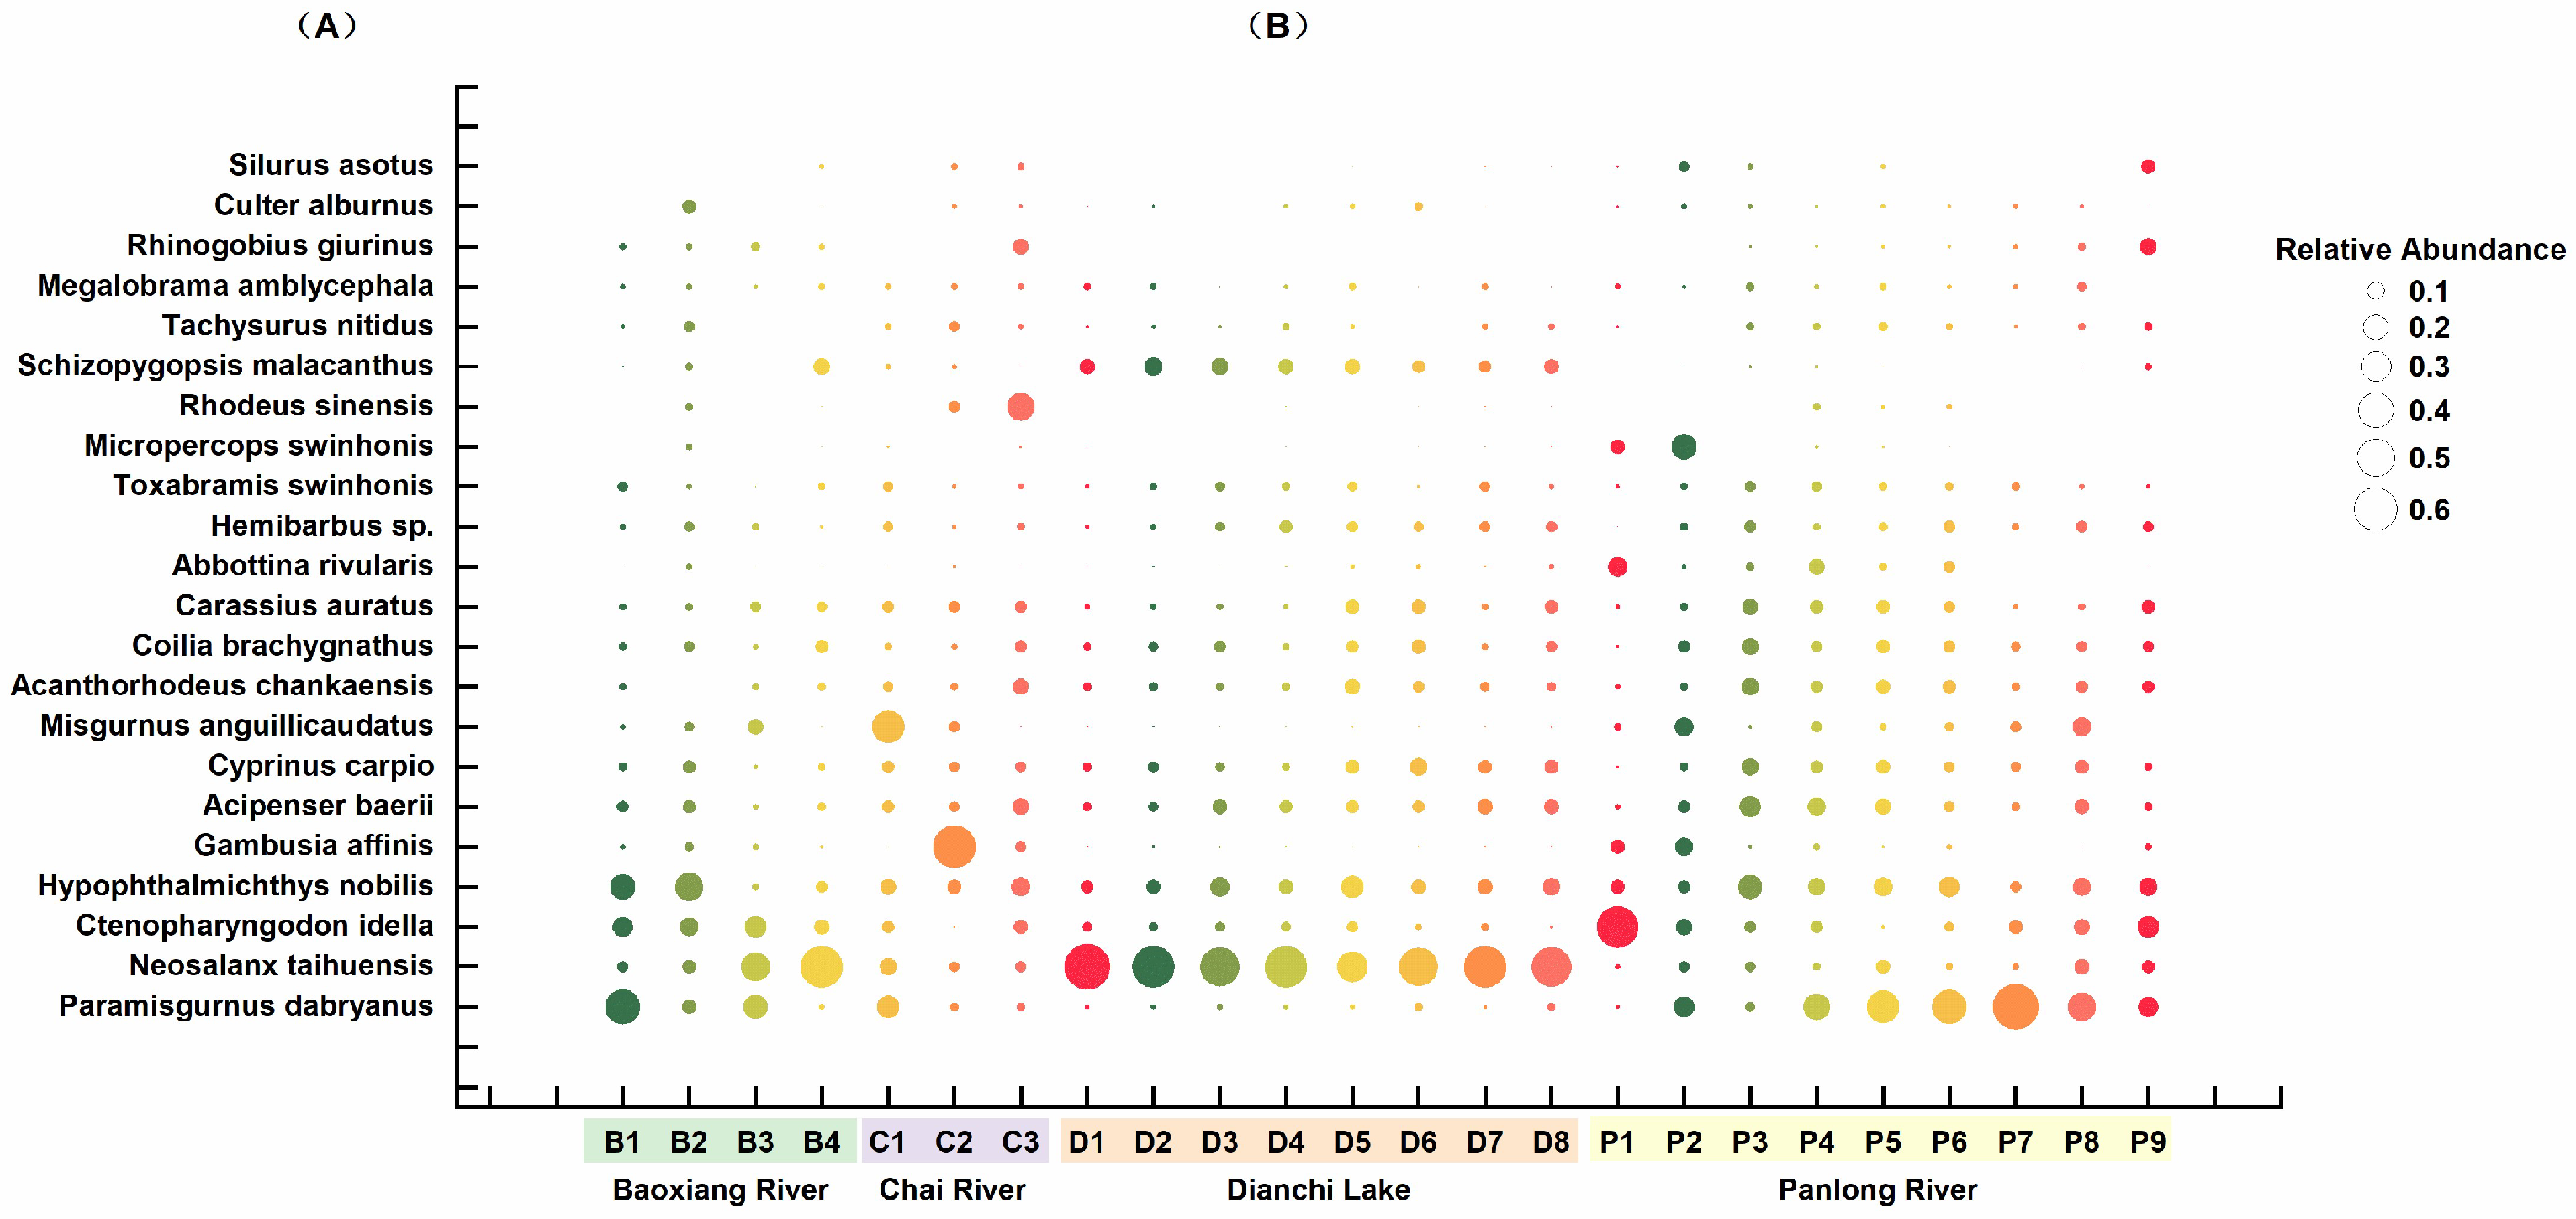
3.1. Overall Fish Diversity
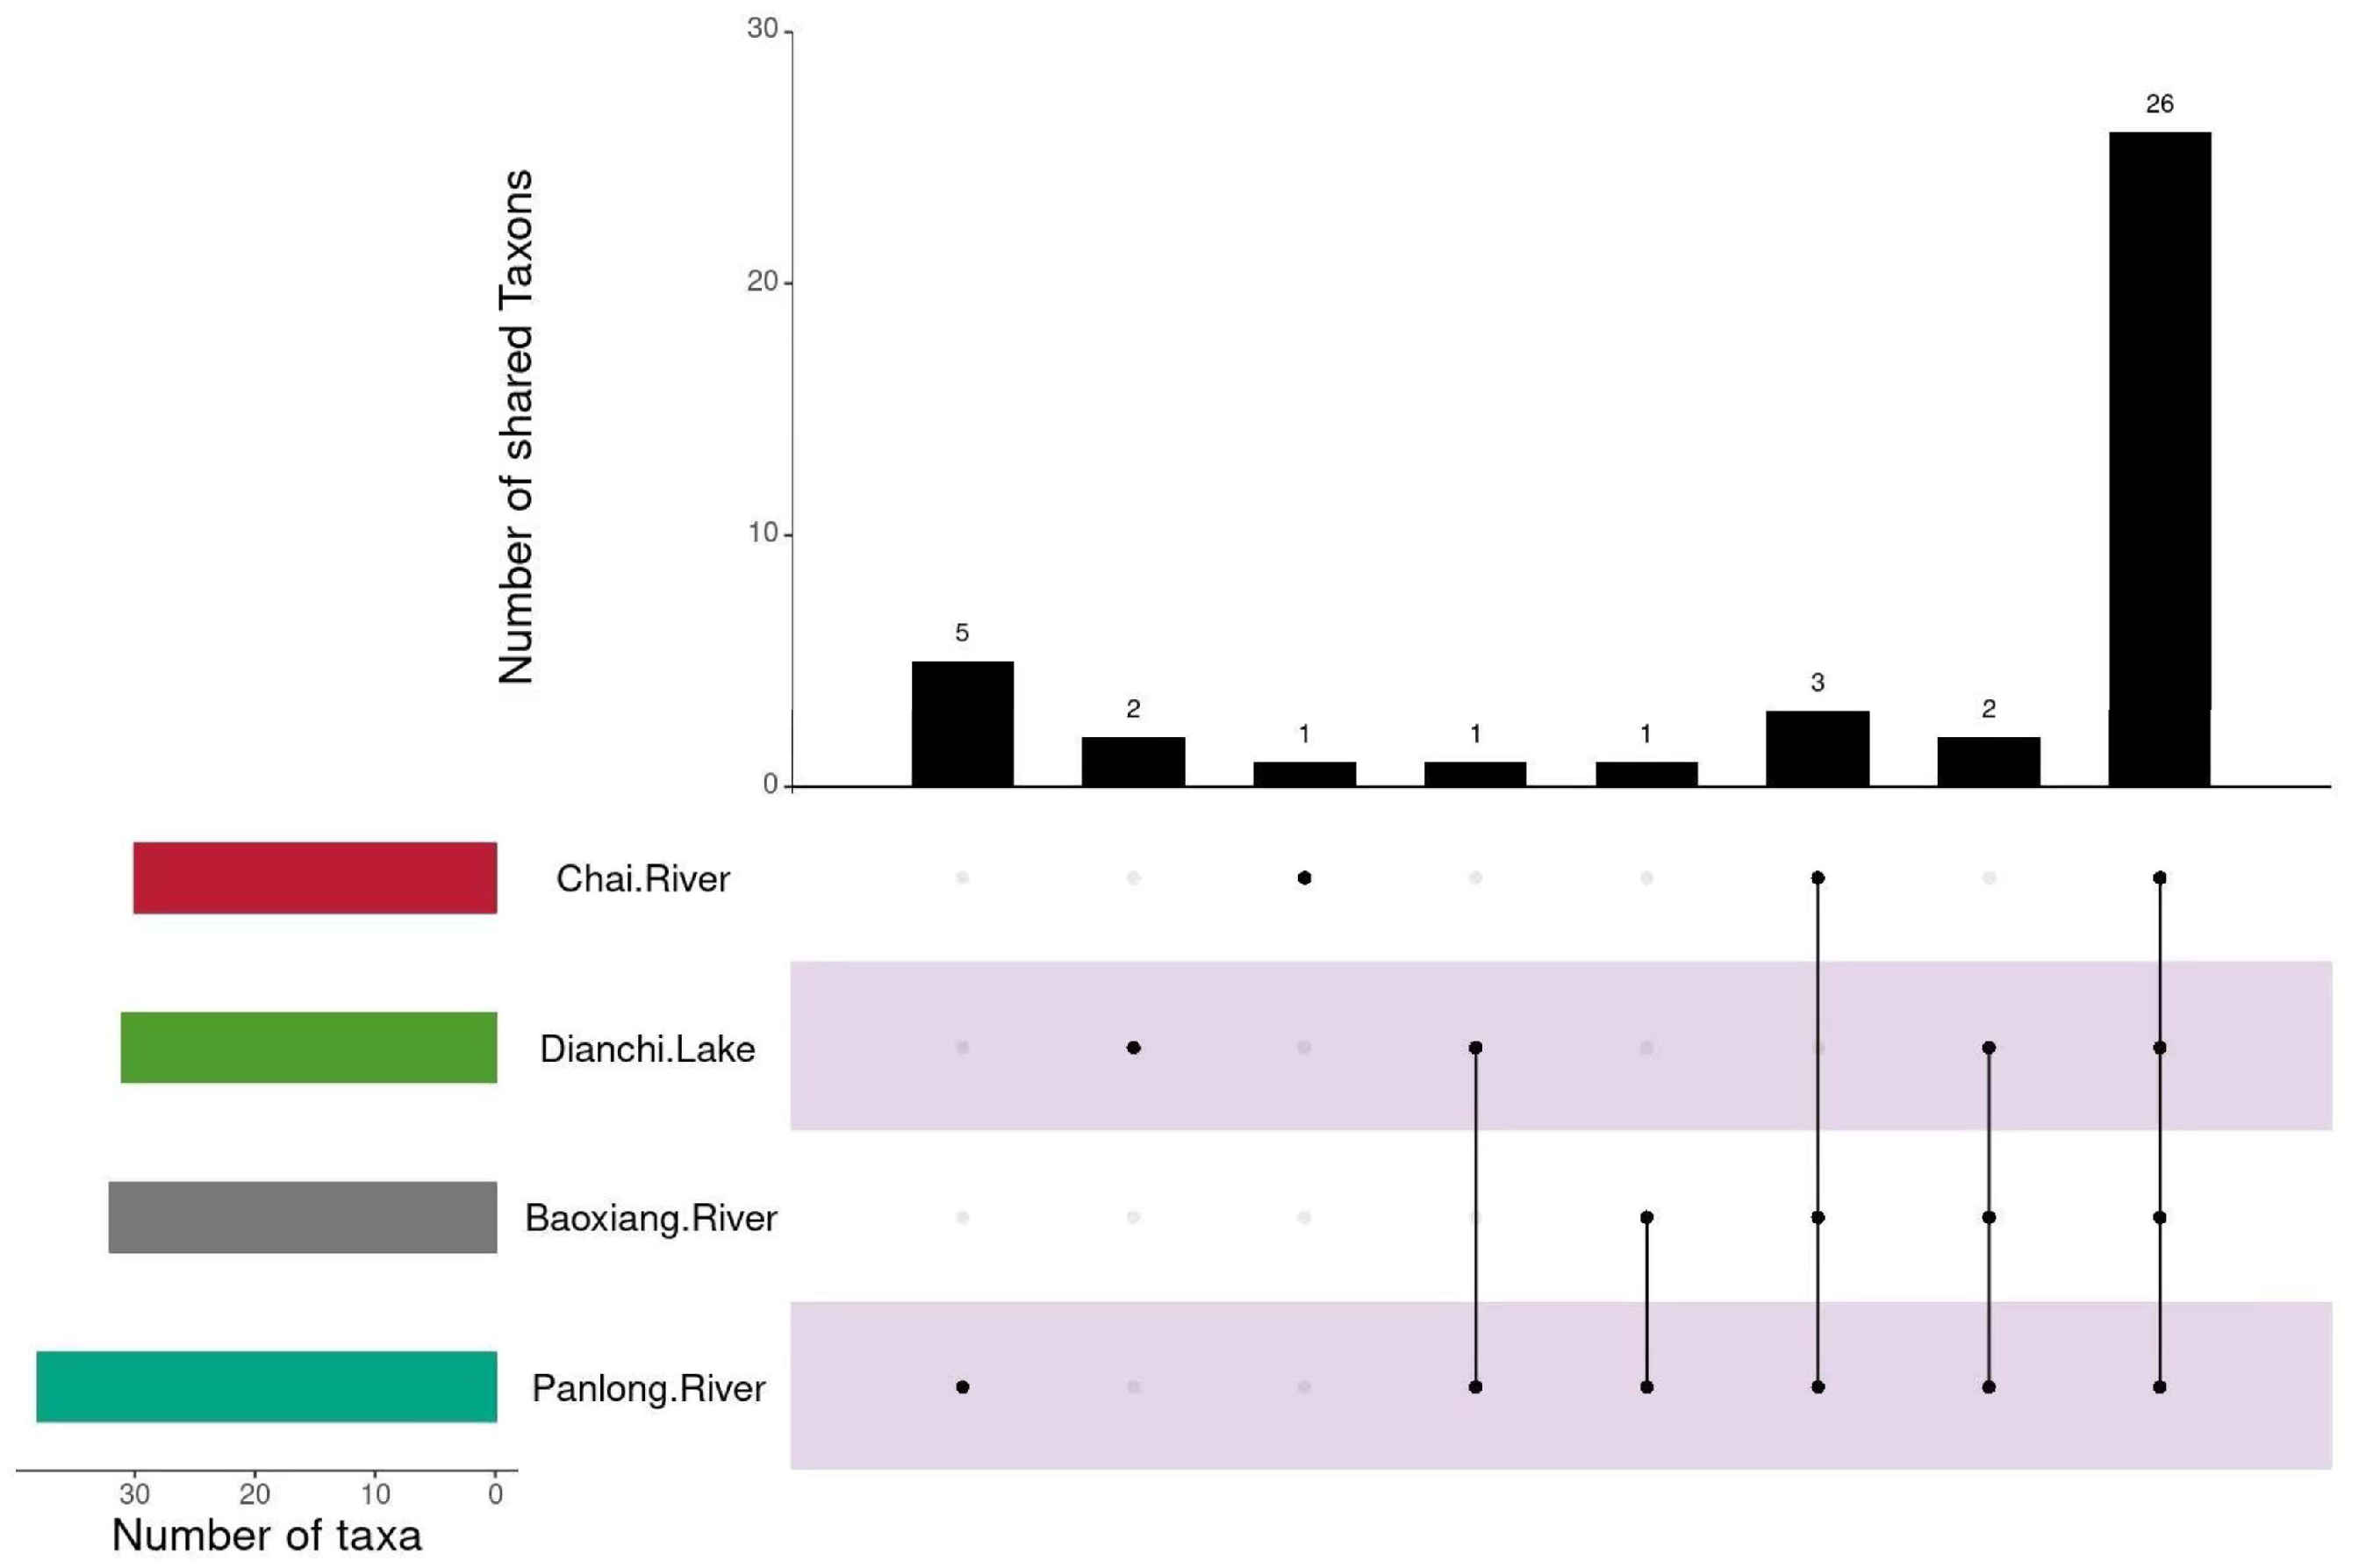
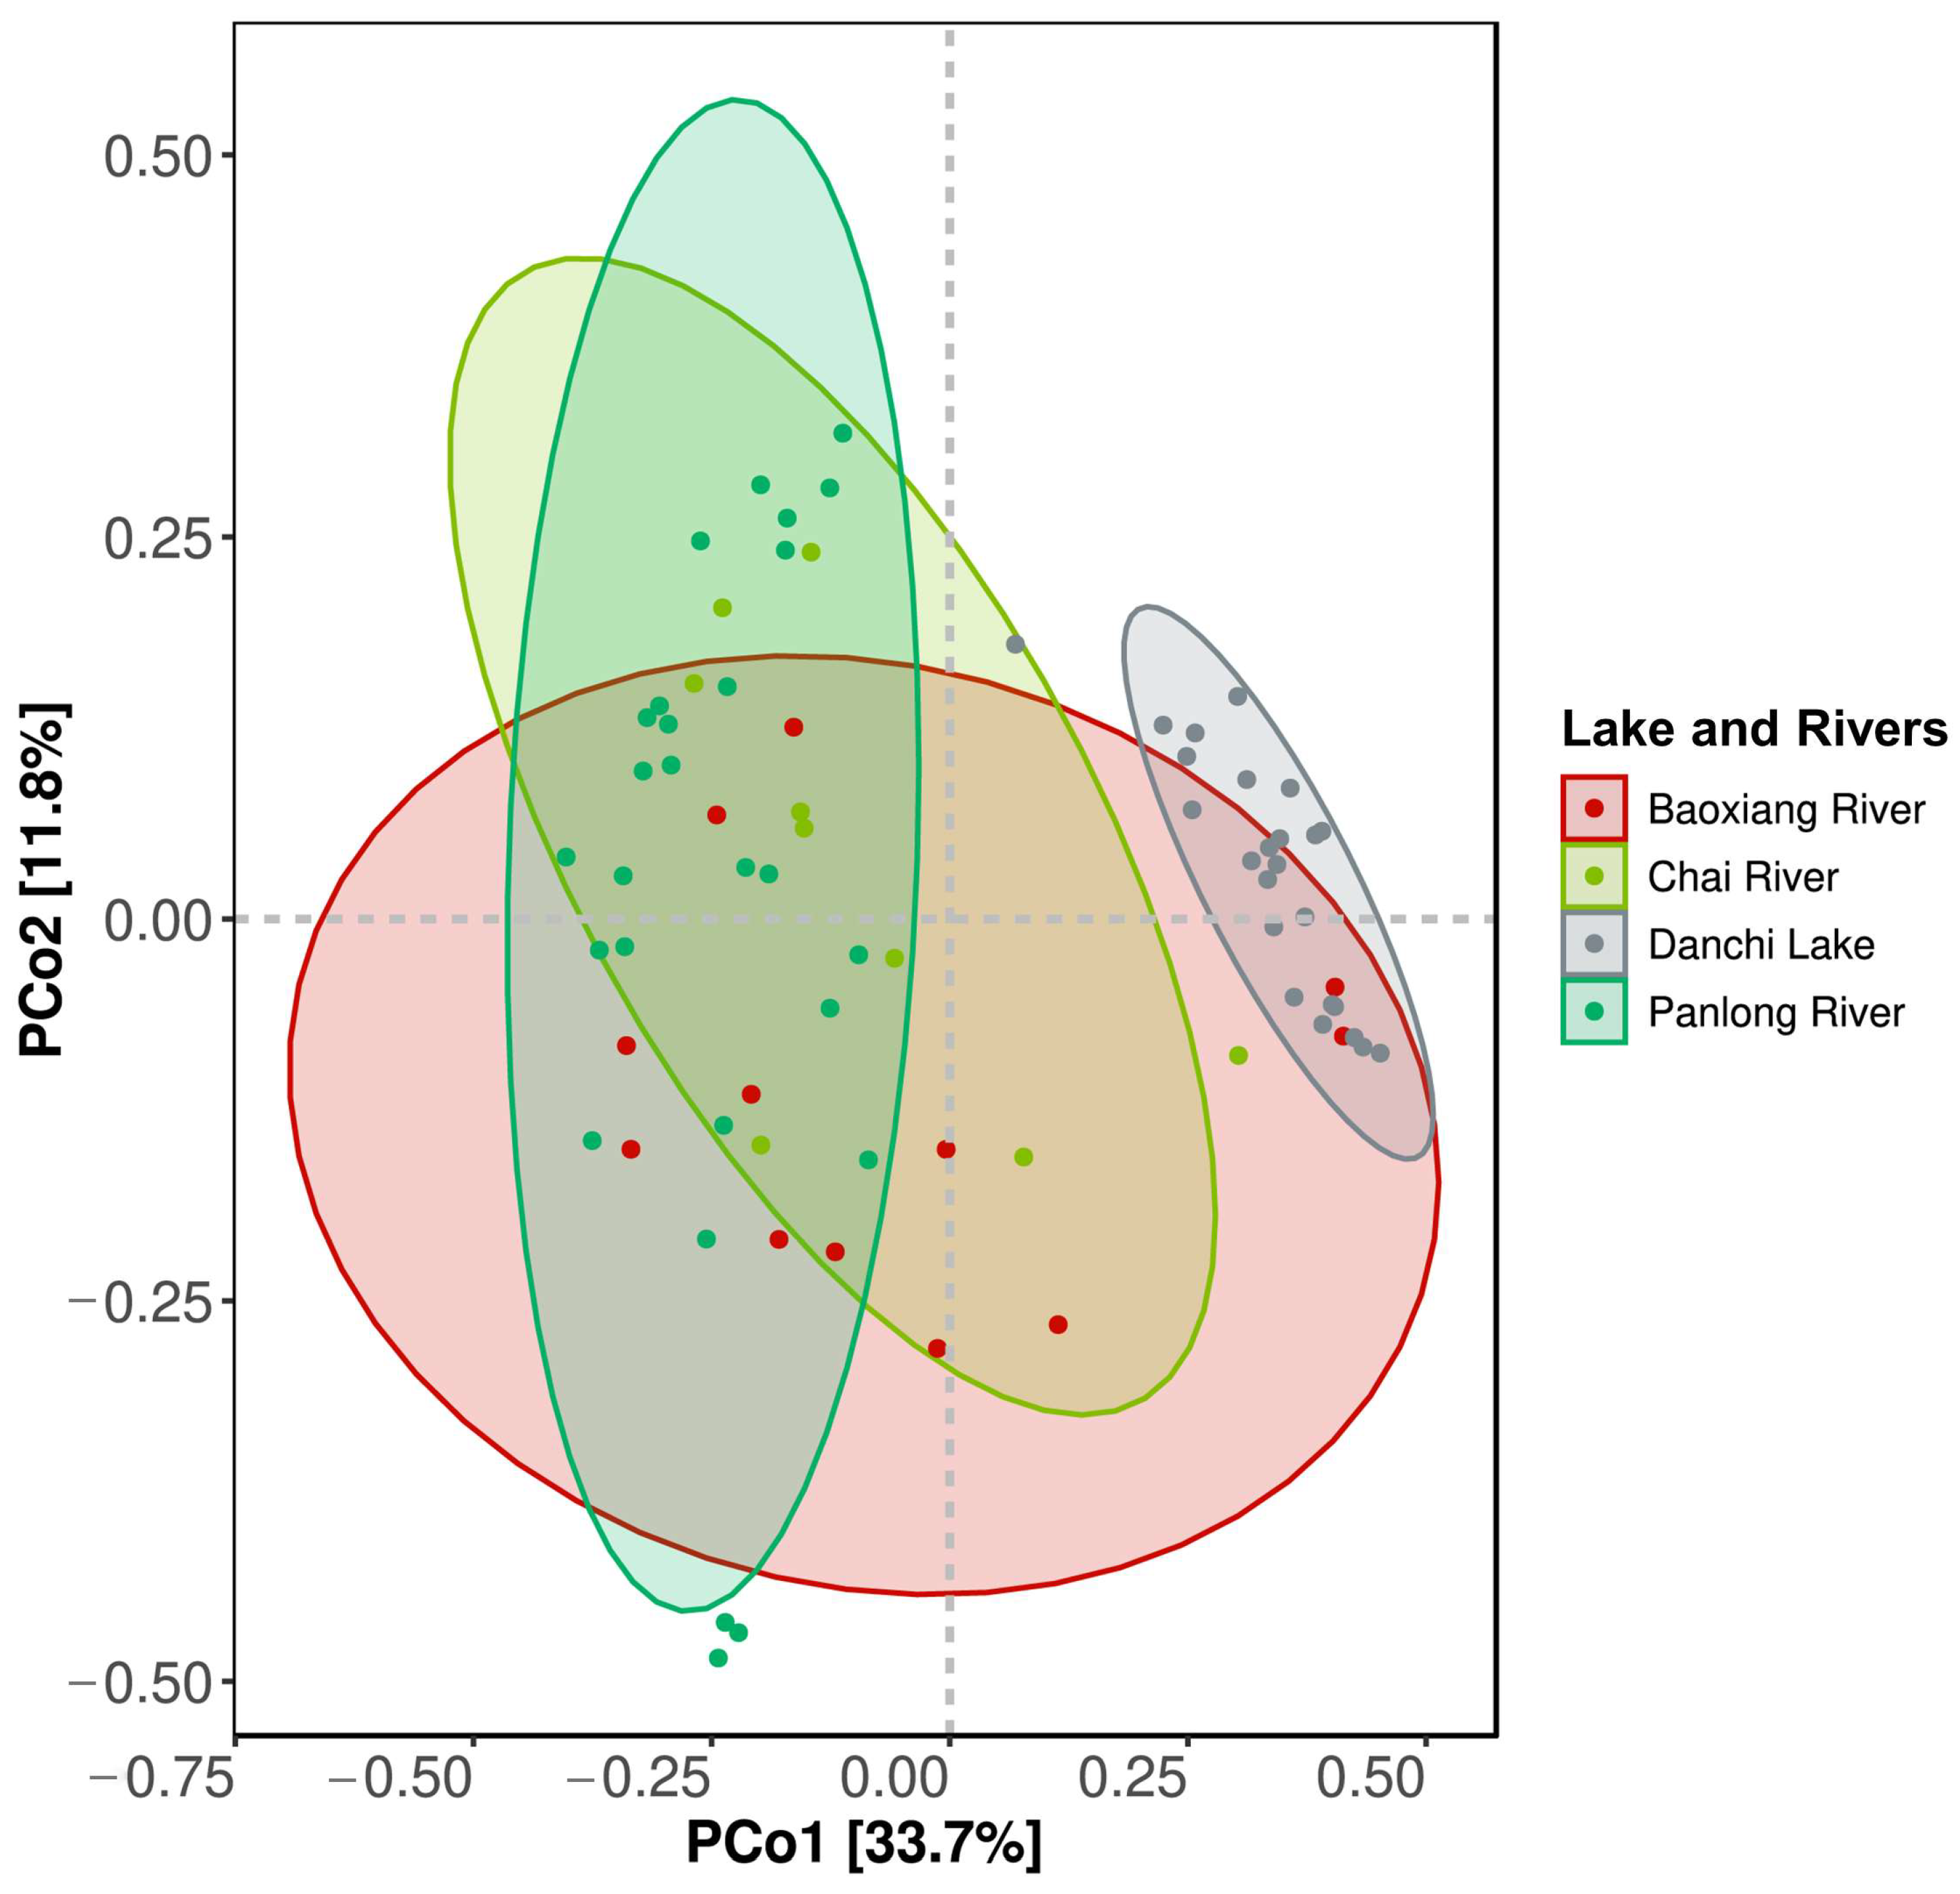
3.2. Differences in the Composition of the Fish Community in Dianchi Lake and the Three Inflowing Rivers
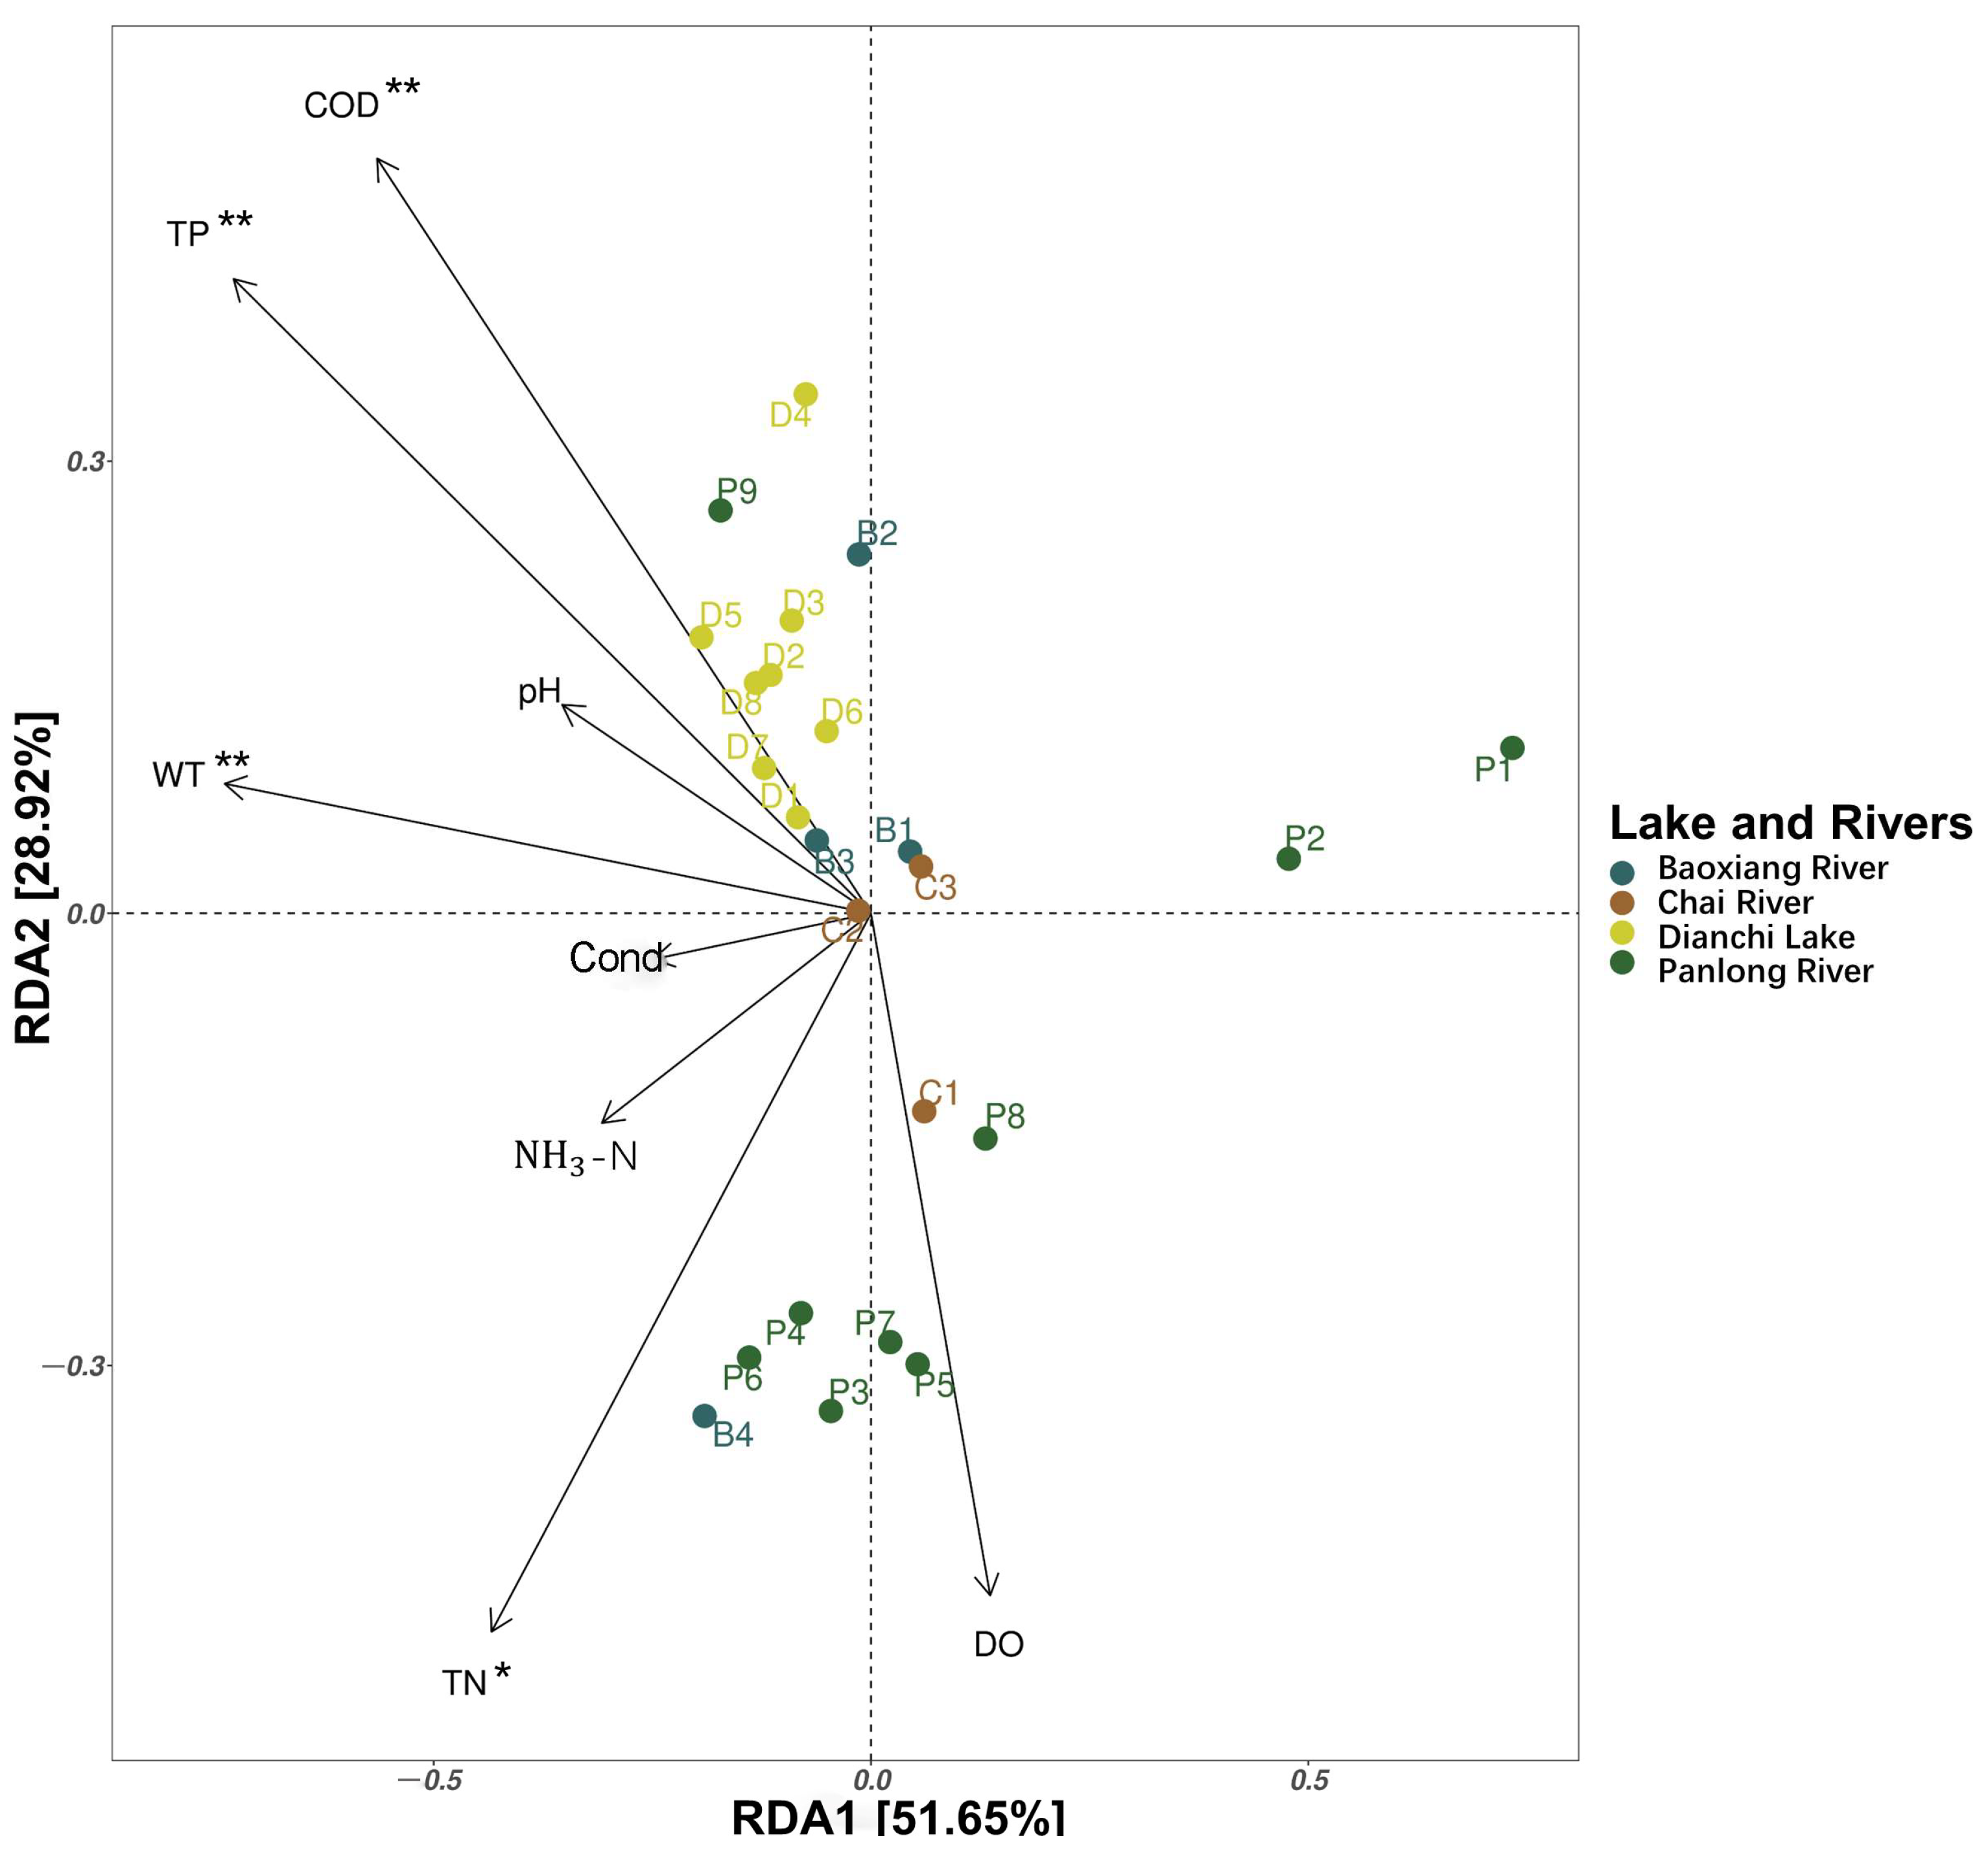
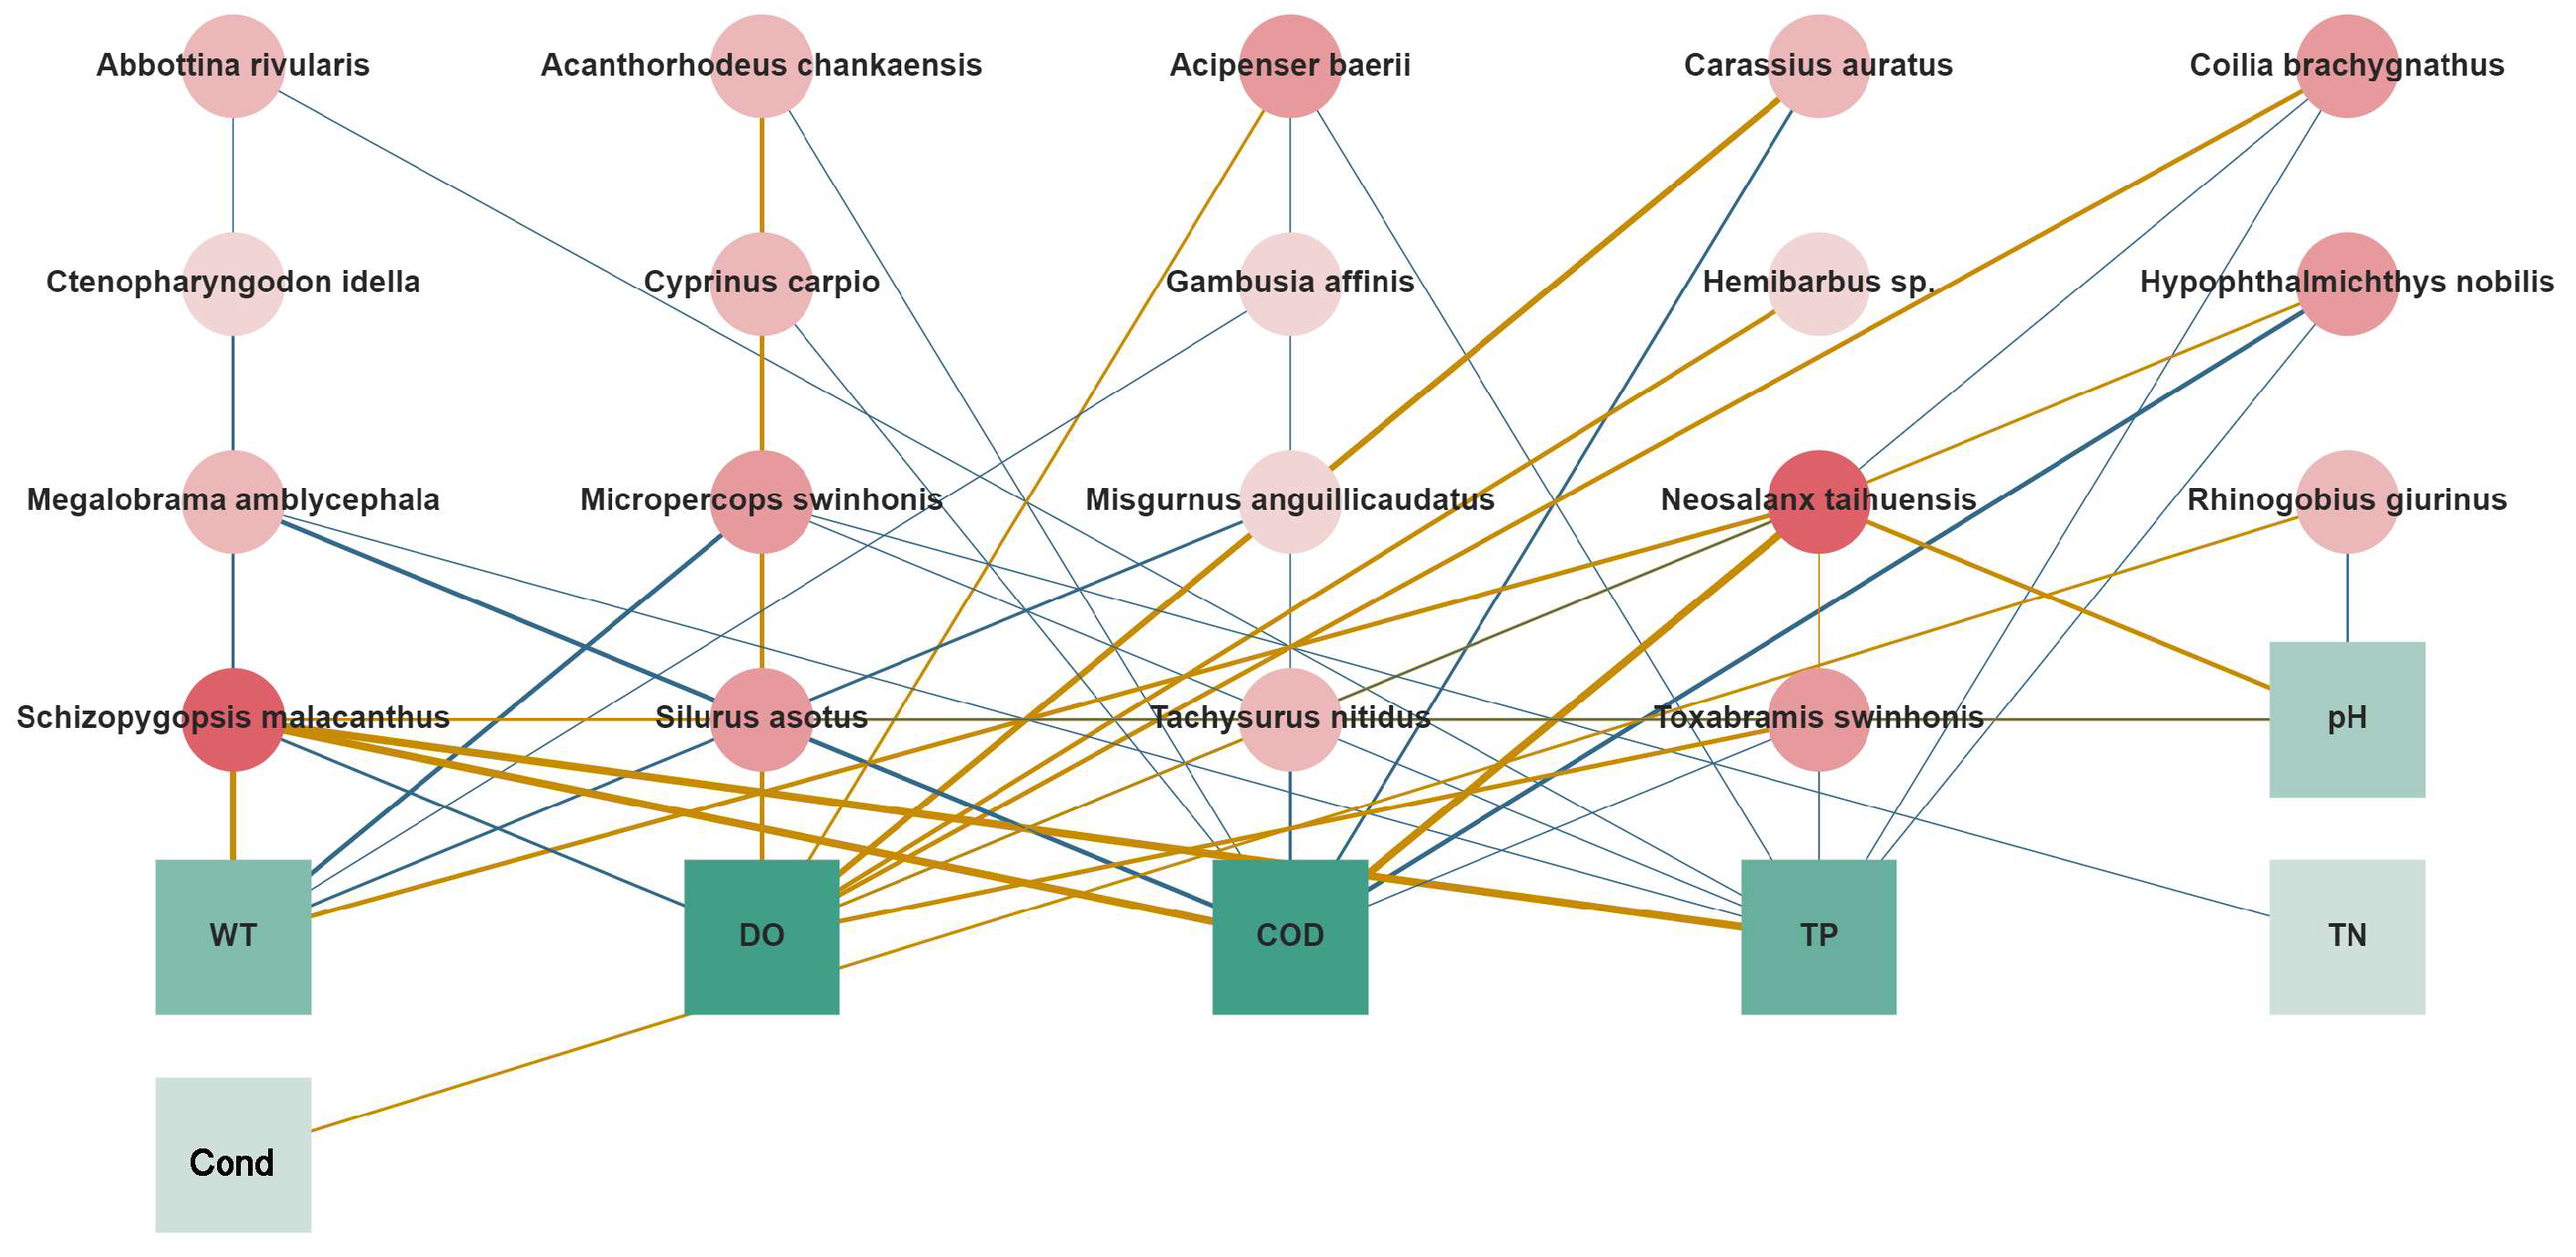
3.3. Relationship between the Fish Community and Environmental Factors in Dianchi Lake and the Three Inflowing Rivers
3.4. Ecological Assessment of Aquatic Environments Based on F-IBI
4. Discussion
4.1. Patterns of Fish Diversity in Dianchi Lake and the Three Inflowing Rivers
4.2. Effects of Environmental Factors on the Fish Communities in Dianchi Lake and the Three Inflowing Rivers
4.3. Aquatic Ecological Condition of Dianchi Lake and the Three Inflowing Rivers
5. Conclusions
Supplementary Materials
Author Contributions
Funding
Data Availability Statement
Conflicts of Interest
References
- Karr, J.R. Biological monitoring and environmental assessment: A conceptual framework. Environ. Manag. 1987, 11, 249–256. [Google Scholar] [CrossRef]
- Abell, R.; Thieme, M.L.; Revenga, C.; Bryer, M.; Kottelat, M.; Bogutskaya, N.; Coad, B.; Mandark, N.; Balderas, S.C.; Bussing, W.; et al. Freshwater ecoregions of the world: A new map of biogeographic units for freshwater biodiversity conservation. Bioscience 2008, 58, 403–414. [Google Scholar] [CrossRef] [Green Version]
- Gao, X.; Ding, S.; Zhang, Y.; Ma, S.Q.; Liu, S.S.; Meng, W. Exploring the relationship among land-use, riparian habitat quality, and biological integrity of a fish community. Acta Ecol. Sin. 2015, 35, 7198–7206. [Google Scholar]
- Zou, K.S.; Chen, J.W.; Ruan, H.T.; Li, Z.H.; Guo, W.J.; Li, M.; Liu, L. eDNA metabarcoding as a promising conservation tool for monitoring fish diversity in a coastal wetland of the Pearl River Estuary compared to bottom trawling. Sci. Total Environ. 2020, 702, 134704. [Google Scholar] [CrossRef] [PubMed]
- He, J.; Xu, X.M.; Yang, Y.; Wu, X.; Wang, L.; Li, S.; Zhou, H.B. Problems and effects of comprehensive management of water environment in Lake Dianchi. J. Lake Sci. 2015, 27, 195–199. [Google Scholar]
- Liu, S.S.; Chen, S.Y.; Yao, M.; Yuan, X.Z.; Liu, H. Water environment revealed by aquatic communities of lakes: A case study on Dongping Lake. Chin. J. Appl. Environ. Biol. 2017, 23, 318–323. [Google Scholar]
- Luo, M.B.; Duan, C.Q.; Shen, X.Q.; Yang, L. Environmental degradation and loss of species diversity in Dianchi Lake. Mar. Fish. 2006, 28, 71–78. [Google Scholar]
- Bohmann, K.; Evans, A.; Gilbert, M.T.P.; Carvalho, G.R.; Creer, S.; Knapp, M.; Yu, D.G.; Debruyn, M. Environmental DNA for wildlife biology and biodiversity monitoring. Trends Ecol. Evol. 2014, 29, 358–367. [Google Scholar] [CrossRef]
- Zhang, S.; Zhao, J.D.; Yao, M. A comprehensive and comparative evaluation of primers for metabarcoding eDNA from fish. Methods Ecol. Evol. 2020, 11, 1609–1625. [Google Scholar] [CrossRef]
- Deiner, K.; Bik, H.M.; Mächler, E.; Seymour, M.; Lacoursière-Roussel, A.; Altermatt, F.; Creer, S.; Bista, I.; Lodge, D.M.; Bernatchez, L.; et al. Environmental DNA metabarcoding: Transforming how we survey animal and plant communities. Mol. Ecol. 2017, 26, 5872–5895. [Google Scholar] [CrossRef]
- Hao, Y.B.; Zhang, A.J.; Liu, J.D.; Gu, Z.M. Application of environmental DNA technology in the study of fish resources. Biotechnol. Bull. 2018, 34, 56–62. [Google Scholar]
- Xu, N.; Xiong, M.H.; Shao, K.; Que, Y.F.; Li, J.Y. Preliminary study on environmental DNA metabarcoding for detecting biodiversity in the middle and lower reaches of the Yangtze River. Res. Environ. Sci. 2020, 33, 1187–1196. [Google Scholar]
- Li, F.L.; Yang, J.H.; Yang, Y.N.; Zhang, X.W. Using environmental DNA metabarcoding to monitor the changes and health status of aquatic ecosystems. Environ. Monit. China 2018, 34, 37–46. [Google Scholar]
- Debroas, D.; Domaizon, I.; Humbert, J.F.; Jardillier, L.; Lepère, C.; Oudart, A.; Taïb, N. Overview of freshwater microbial eukaryotes diversity: A first analysis of publicly available metabarcoding data. FEMS Microbiol. Ecol. 2017, 93, fix023. [Google Scholar] [CrossRef] [Green Version]
- Gibson, J.; Shokralla, S.; Porter, T.M.; King, I.; van Konynenburg, S.; Janzen, D.H.; Hallwachs, W.; Hajibabaei, M. Simultaneous assessment of the macrobiome and microbiome in a bulk sample of tropical arthropods through DNA metasystematics. Proc. Natl. Acad. Sci. USA 2014, 111, 8007–8012. [Google Scholar] [CrossRef] [PubMed] [Green Version]
- Zhang, X.W. Environmental DNA shaping a new era of ecotoxicological research. Environ. Sci. Technol. 2019, 53, 5605–5612. [Google Scholar] [CrossRef]
- Aglieri, G.; Baillie, C.; Mariani, S.; Cattano, C.; Calò, A.; Turco, G.; Spatafora, D.; Di Franco, A.; Di Lorenzo, M.; Milazzo, M.; et al. Environmental DNA effectively captures functional diversity of coastal fish communities. Mol. Ecol. 2021, 30, 3127–3139. [Google Scholar] [CrossRef]
- Hänfling, B.; Lawson Handley, L.; Read, D.S.; Hahn, C.; Li, J.L.; Nichols, P.; Blackman, R.C.; Oliver, A.; Winfield, I.J. Environmental DNA metabarcoding of lake fish communities reflects long-term data from established survey methods. Mol. Ecol. 2016, 25, 3101–3119. [Google Scholar] [CrossRef] [Green Version]
- Doi, H.; Inui, R.; Akamatsu, Y.; Kanno, K.; Yamanaka, H.; Takahara, T.; Minamoto, T. Environmental DNA analysis for estimating the abundance and biomass of stream fish. Freshw. Biol. 2017, 62, 30–39. [Google Scholar] [CrossRef]
- Eichmiller, J.J.; Miller, L.M.; Sorensen, P.W. Optimizing techniques to capture and extract environmental DNA for detection and quantification of fish. Mol. Ecol. Resour. 2016, 16, 56–68. [Google Scholar] [CrossRef]
- Liu, B.; Wang, H.; Qin, B.; Fan, Z.R.; Xiong, W.; Chen, Y.Y. Environmental DNA metabarcoding-based monitoring of fish diversity and screening invasion risk of non-native fishes in the Beijing area. J. Biosaf. 2021, 30, 220–229. [Google Scholar]
- Harper, L.R.; Griffiths, N.P.; Lawson Handley, L.; Sayer, C.D.; Read, D.S.; Harper, K.J.; Blackman, R.C.; Li, J.; Hänfling, B. Development and application of environmental DNA surveillance for the threatened crucian carp (Carassius carassius). Freshw. Biol. 2019, 64, 93–107. [Google Scholar] [CrossRef] [Green Version]
- Thomsen, P.F.; Kielgast, J.O.S.; Iversen, L.L.; Wiuf, C.; Rasmussen, M.; Gilbert, M.T.P.; Orlando, L.; Willerslev, E. Monitoring endangered freshwater biodiversity using environmental DNA. Mol. Ecol. 2012, 21, 2565–2573. [Google Scholar] [CrossRef] [PubMed]
- Karr, J.R. Assessment of biotic integrity using fish communities. Fisheries 1981, 6, 21–27. [Google Scholar] [CrossRef]
- Kim, J.J.; Atique, U.; An, K.G. Long-term ecological health assessment of a restored urban stream based on chemical water quality, physical habitat conditions and biological integrity. Water 2019, 11, 114. [Google Scholar] [CrossRef] [Green Version]
- Lyons, J.; Gutiérrez-Hernández, A.; Díaz-Pardo, E.; Soto-Galera, E.; Medina-Nava, M.; Pineda-López, R. Development of a preliminary index of biotic integrity (IBI) based on fish assemblages to assess ecosystem condition in the lakes of central Mexico. Hydrobiologia 2000, 418, 57–72. [Google Scholar] [CrossRef]
- Raburu, P.O.; Masese, F.O. Development of a fish-based index of biotic integrity (F-IBI) for monitoring riverine ecosystems in the Lake Victoria drainage Basin, Kenya. River Res. Appl. 2012, 28, 23–38. [Google Scholar] [CrossRef]
- Yang, Z.; Zhu, D.; Zhu, Q.G.; Hu, L.; Wan, C.Y.; Zhao, N.; Liu, H.; Chen, X.J. Development of new fish-based indices of biotic integrity for estimating the effects of cascade reservoirs on fish assemblages in the upper Yangtze River, China. Ecol. Indic. 2020, 119, 106860. [Google Scholar] [CrossRef]
- Zhu, D.; Chang, J.J. Annual variations of biotic integrity in the upper Yangtze River using an adapted index of biotic integrity (IBI). Ecol. Indic. 2008, 8, 564–572. [Google Scholar] [CrossRef]
- Liu, M.D.; Chen, D.Q.; Duan, X.B.; Wang, K.; Liu, S.P. Assessment of ecosystem health of upper and middle Yangtze River using fish-index of biotic integrity. J. Yangtze River Sci. Res. Inst. 2010, 27, 10. [Google Scholar]
- Li, T.H.; Huang, X.L.; Jiang, X.H.; Wang, X.G. Assessment of ecosystem health of the Yellow River with fish index of biotic integrity. Hydrobiologia 2018, 814, 31–43. [Google Scholar] [CrossRef]
- Zhang, X.; Zhou, G.D.; Wang, L. Construction of index of biotic integrity and health evaluation of fish in Taihu Lake. Chin. J. Fish. 2020, 33, 25–32. [Google Scholar]
- Chen, Y.C. Application of Environmental DNA Technology in Fish Resources Investigation in the Upper Reach of Liuchong River; Xinan University: Chongqing, China, 2020. [Google Scholar] [CrossRef]
- Valentini, A.; Taberlet, P.; Miaud, C.; Civade, R.; Herder, J.; Thomsen, P.F.; Bellemain, E.; Besnard, A.; Coissac, E.; Boyer, F.; et al. Next-generation monitoring of aquatic biodiversity using environmental DNA metabarcoding. Mol. Ecol. 2016, 25, 929–942. [Google Scholar] [CrossRef] [Green Version]
- Zhang, Y.; Pavlovska, M.; Stoica, E.; Prekrasna, I.; Yang, J.H.; Slobodnik, J.; Zhang, X.W.; Dykyi, E. Holistic pelagic biodiversity monitoring of the Black Sea via eDNA metabarcoding approach: From bacteria to marine mammals. Environ. Int. 2020, 135, 105307. [Google Scholar] [CrossRef]
- Caporaso, J.G.; Kuczynski, J.; Stombaugh, J.; Bittinger, K.; Bushman, F.D.; Costello, E.K.; Fierer, N.; Gonzales, P.A.; Goodrich, J.K.; Gordon, J.I. QIIME allows analysis of high-throughput community sequencing data. Nat. Methods 2010, 7, 335–336. [Google Scholar] [CrossRef] [PubMed] [Green Version]
- Edgar, R.C. UPARSE: Highly accurate OTU sequences from microbial amplicon reads. Nat. Methods 2013, 10, 996–998. [Google Scholar] [CrossRef] [PubMed]
- Core, R.; Team, R.R. A Language and Environment for Statistical Computing; R Foundation for Statistical Computing: Vienna, Austria, 2019. [Google Scholar]
- Barbour, M.T.; Gerritsen, J.; Griffith, G.; Frydenborg, R.; McCarron, E.; White, J.S.; Bastian, M.L. A framework for biological criteria for Florida streams using benthic macroinvertebrates. J. N. Am. Benthol. Soc. 1996, 15, 185–211. [Google Scholar] [CrossRef]
- Liu, K.; Zhou, W.; Li, F.L.; Lan, J.H. A fish-based biotic integrity index selection for rivers in Hechi Prefecture, Guangxi and their environmental quality assessment. Zool. Res. 2010, 31, 531–538. [Google Scholar]
- Morley, S.A.; Karr, J.R. Assessing and restoring the health of urban streams in the Puget Sound Basin. Conserv. Biol. 2002, 16, 1498–1509. [Google Scholar] [CrossRef] [Green Version]
- Chun, K.; Weaver, M.J.; Deegan, L.A. Assessment of fish communities in New England embayments: Application of the estuarine biotic integrity index. Biol. Bull. 1996, 191, 320–321. [Google Scholar] [CrossRef]
- Zhang, S.S.; Gao, W.F.; Sun, S.M.; Sun, H.; Zhang, Y.; Ding, S.; Wang, W. Assessment of ecosystem health in Hun River Basin using fish-index of biotic integrity. Res. Environ. Sci. 2015, 28, 1570–1577. [Google Scholar]
- Karr, J.R.; Fausch, K.D.; Angermeier, P.L.; Yant, P.R.; Schlosser, I.J. Assessing biological integrity in running waters. A method and its rationale. Ill. Nat. Hist. Surv. Champaign Spec. Publ. 1986, 5, 1–28. [Google Scholar]
- Li, H.Q.; Luo, Z.L.; Sun, G.; Shi, N.N.; Xiao, N.W. Health assessment of North Canal River by Fish-Index of Biotic Integrity. J. Hydroecol. 2022. [Google Scholar] [CrossRef]
- Qu, X.D.; Liu, Z.G.; Zhang, Y. Discussion on the standardized method of reference sites selection for establishing the Benthic-Index of Biotic Integrity. Acta Ecol. Sin. 2012, 32, 4661–4672. [Google Scholar]
- Zhou, Y.; Qu, X.D.; Zhao, R.; Ma, S.Q.; Zhang, Y.; Yin, X.W. Standardized methods for selecting reference and impaired sites to evaluate river health. Res. Environ. Sci. 2013, 26, 410–417. [Google Scholar]
- Yuan, L.L.; Wang, X.M.; Yang, W.B.; Chen, Y.X.; Ding, F.; Li, D.H.; Wang, Y.X. River Ecosystem Health Evaluation of Juma River in Beijing Based on Fish-Index of Biotic Integrity. Asian J. Ecotoxicol. 2021, 16, 160–169. [Google Scholar]
- Xu, X.; Ni, Z.H.; Shen, Z.W.; Wang, N.; Liu, B.Q. Research on Ecological Impact Identification and Evaluation Index System in Water Source of Inter Basin Water Diversion Project. Ecol. Econ. 2018, 34, 174–178. [Google Scholar]
- Guo, C.B.; Chen, Y.S.; Gozlan, R.E.; Liu, H.; Lu, Y.; Qu, X.; Xia, W.T.; Xiong, F.Y.; Xie, S.G.; Wang, L.Z. Patterns of fish communities and water quality in impounded lakes of China’s south-to-north water diversion project. Sci. Total Environ. 2020, 713, 136515. [Google Scholar] [CrossRef]
- Zhang, L.J.; Yang, J.H.; Zhang, Y.; Shi, J.Z.; Yu, H.X.; Zhang, X.W. eDNA biomonitoring revealed the ecological effects of water diversion projects between Yangtze River and Tai Lake. Water Res. 2022, 210, 117994. [Google Scholar] [CrossRef]
- Härer, A.; Torres-Dowdall, J.; Meyer, A. The imperiled fish fauna in the Nicaragua Canal zone. Conserv. Biol. 2017, 31, 86–95. [Google Scholar] [CrossRef]
- Chen, X.Y. Checklist of fishes of Yunnan. Zool. Res. 2013, 34, 281–343. [Google Scholar]
- Luo, J.S. Assessing Fish Diversity in Plateau Lake in Central Yunnan Province Using Environmental DNA. Yunnan University. 2019. Available online: https://kns.cnki.net/KCMS/detail/detail.aspx?dbname=CMFD202001&filename=1019174963.nh (accessed on 11 September 2022).
- Jane, S.F.; Wilcox, T.M.; McKelvey, K.S.; Young, M.K.; Schwartz, M.K.; Lowe, W.H.; Letcher, B.H.; Whiteley, A.R. Distance, flow and PCR inhibition: eDNA dynamics in two headwater streams. Mol. Ecol. Resour. 2015, 15, 216–227. [Google Scholar] [CrossRef] [PubMed]
- Goldberg, C.S.; Strickler, K.M.; Pilliod, D.S. Moving environmental DNA methods from concept to practice for monitoring aquatic macroorganisms. Biol. Conserv. 2015, 183, 1–3. [Google Scholar] [CrossRef] [Green Version]
- Zhong, W.J.; Zhang, J.Y.; Wang, Z.H.; Lin, J.Q.; Huang, X.Y.; Liu, W.H.; Li, H.J.; Pellissier, L.; Zhang, X.W. Holistic Impact Evaluation of Human Activities on the Coastal Fish Biodiversity in the Chinese Coastal Environment. Environ. Sci. Technol. 2022, 56, 6574–6583. [Google Scholar] [CrossRef] [PubMed]
- Dejean, T.; Valentini, A.; Miquel, C.; Taberlet, P.; Bellemain, E.; Miaud, C. Improved detection of an alien invasive species through environmental DNA barcoding: The example of the American bullfrog Lithobates catesbeianus. J. Appl. Ecol. 2012, 49, 953–959. [Google Scholar] [CrossRef]
- Shan, X.J.; Li, M.; Wang, W.J. Application of environmental DNA technology in aquatic ecosystem. Prog. Fish. Sci. 2018, 39, 23–29. [Google Scholar]
- Wang, M.; Yang, X.; Wang, W.; Duan, C.; Liu, Z.H.; Chen, Q.L.; Li, Y.W.; Shen, Y.J. Fish diversity in chongqing section of the national nature reserve for rare and endemic fish in the upper Yangtze River based on eDNA technology. Acta Hydrobiol. Sin. 2022, 46, 2–16. [Google Scholar]
- Xiong, F.Y.; Liu, H.; Lu, Y.; Wang, C.C.; Cheng, L.; Li, Y.P.; Yang, X.; Wu, X.H.; Chen, Y.S. Water quality and fish assemblage patterns in rivers and typical lakes in the source region of the Yangtze River during the wet period. Environ. Monit. China 2022, 38, 86–94. [Google Scholar]
- Svobodová, Z.; Lloyd, R.; Máchová, J.; Vykusová, B. Water Quality and Fish Health; EIFAC Technical Paper. No. 54; FAO: Rome, Italy, 1993; p. 59. [Google Scholar]
- Yoon, J.D.; Jang, M.H.; Joo, G.J. Effect of flooding on fish assemblages in small streams in South Korea. Limnology 2011, 12, 197–203. [Google Scholar] [CrossRef]
- Ngor, P.B.; Legendre, P.; Oberdorff, T.; Lek, S. Flow alterations by dams shaped fish assemblage dynamics in the complex Mekong—3S river system. Ecol. Indic. 2018, 88, 103–114. [Google Scholar] [CrossRef]
- Kashulinxc, N.A.; Ratkin, N.E.; Dauvalter, V.A.; Lukin, A.A. Impact of airborne pollution on the drainage area of subarctic lakes and fish. Chemosphere 2001, 42, 51–59. [Google Scholar] [CrossRef] [PubMed]
- Mao, J.Z.; Sun, Y.L.; He, K.D.; Kong, G.F.; Yang, Z.L. Study of water environment improvement effect by Niulan River-Dianchi Lake Water Supplement Project in Waihai area of Dianchi Lake. Water Resour. Prot. 2017, 33, 47–51. [Google Scholar]
- Li, X.M.; Yang, S.P.; Zhang, Y.; Zhao, S.M.; Gao, L.C.; Xu, T. Planktonic algae diversity and its water quality monitoring in Chai River, Baoxiang River and Panlong River, three inflow River of Dianchi Lake. J. Yunnan Univ. 2014, 36, 950–958. [Google Scholar]
- Zhang, X.Z. The Impacts of Characteristic Pollution Sources on the Water Quality and Plankton Communities of Inflowing Rivers in Dianchi Lake Basin; Shanghai Jiao Tong University: Shanghai, China, 2016. [Google Scholar] [CrossRef]
- Wang, C.; Tao, M.; Li, A.M.; Shi, P.; Yang, J.H.; Wang, Z.H.; Zhang, X.W. Research on the biodiversity of Qinhuai River based on environmental DNA metabarcoding. Acta Ecol. Sin. 2022, 42, 611–624. [Google Scholar]
- Gao, K.W.; Zhu, Y.R.; Sun, F.H.; Chen, Y.Q.; Liao, H.Q.; Ma, H.H.; Hu, X.Y. A study on the collaborative control of water quality of nitrogen and phosphorus between typical lakes and their inflow rivers in China. J. Lake Sci. 2021, 33, 1400–1414. [Google Scholar]
- Huang, M.Y. Water quality characteristics and pollution load estimation of main rivers around Erhai Lake. Yangtze River 2022, 53, 61–66. [Google Scholar]
- Upadhyay, K.D.; Mainali, J.; Ghimire, N.P. Diversity of aquatic plants and macroinvertebrates and their spatial patterns in a Himalayan Watershed, Central Nepal. Aquat. Bot. 2022, 180, 103529. [Google Scholar] [CrossRef]
- Brown, L.R. Fish communities and their associations with environmental variables, lower San Joaquin River drainage, California. Environ. Biol. Fishes 2000, 57, 251–269. [Google Scholar] [CrossRef]
- Li, X.N.; Zhang, W.W.; Wu, J.Y.; Li, H.J.; Zhao, T.K.; Zhao, C.Q.; Shi, R.S.; Li, Z.S.; Wang, C.; Li, C. Loss of nitrogen and phosphorus from farmland runoff and the interception effect of an ecological drainage ditch in the North China Plain—A field study in a modern agricultural park. Ecol. Eng. 2021, 169, 106310. [Google Scholar] [CrossRef]
- Yang, J.H. Biodiversity of Zooplankton and Community Effects of Environmental Pollution in Tai Lake Basin; Nanjing University: Nanjing, China, 2017; Available online: https://kns.cnki.net/KCMS/detail/detail.aspx?dbname=CDFDLAST2018&filename=1018031338.nh (accessed on 14 September 2022).
- Zheng, C.Q.; Wu, W.; Wei, J.; Zhuang, H.B.; Sang, G.Q. Fish diversity and its influencing factors in the Dawen River, a tributary of the lower Yellow River. Water Resour. Prot. 2020, 36, 31–38. [Google Scholar]
- Dong, J.; Gao, Y.N.; Li, G.B. A review: Responses of phytoplankton communities to eutrophication and climate warming in freshwater lakes. Acta Hydrobiol. Sin. 2016, 40, 615–623. [Google Scholar]
- Rogora, M.; Mosello, R.; Arisci, S. The effect of climate warming on the hydrochemistry of alpine lakes. Water Air Soil Pollut. 2003, 148, 347–361. [Google Scholar] [CrossRef]
- Yu, L.Y.; Yang, H.; Huang, C.C.; Huang, T.; Yu, Y.H.; Jiang, Q.L.; Liu, D.; Li, S.D. Characteristic of nitrogen and phosphorous pollution in Lake Dianchi and its inflow rivers in summer. J. Lake Sci. 2016, 28, 961–971. [Google Scholar]
- Guo, Y.Y.; He, F.; Li, A.J.; Han, Y.P. Temporal and spatial variation of phytoplankton community and main pollution indicators in the cyanophyte enrichment area of north Dianchi lake. J. Anhui Agric. Sci. 2013, 40, 17781–17783. [Google Scholar]


| Group | Fish | |
|---|---|---|
| Baoxiang River, Chai River, and Panlong River | R2 | 0.1342 |
| F | 3.4872 | |
| p | 0.001 *** | |
| Baoxiang River and Chai River | R2 | 0.1518 |
| F | 3.4004 | |
| p | 0.002 ** | |
| Baoxiang River and Panlong River | R2 | 0.0870 |
| F | 3.5246 | |
| p | 0.001 *** | |
| Chai River and Panlong River | R2 | 0.0932 |
| F | 3.4956 | |
| p | 0.001 *** |
Disclaimer/Publisher’s Note: The statements, opinions and data contained in all publications are solely those of the individual author(s) and contributor(s) and not of MDPI and/or the editor(s). MDPI and/or the editor(s) disclaim responsibility for any injury to people or property resulting from any ideas, methods, instructions or products referred to in the content. |
© 2023 by the authors. Licensee MDPI, Basel, Switzerland. This article is an open access article distributed under the terms and conditions of the Creative Commons Attribution (CC BY) license (https://creativecommons.org/licenses/by/4.0/).
Share and Cite
Meng, H.; Lin, Y.; Zhong, W.; Zhao, Z.; Shen, L.; Ling, Z.; Zhao, K.; Xu, S. Fish Biomonitoring and Ecological Assessment in the Dianchi Lake Basin Based on Environmental DNA. Water 2023, 15, 399. https://doi.org/10.3390/w15030399
Meng H, Lin Y, Zhong W, Zhao Z, Shen L, Ling Z, Zhao K, Xu S. Fish Biomonitoring and Ecological Assessment in the Dianchi Lake Basin Based on Environmental DNA. Water. 2023; 15(3):399. https://doi.org/10.3390/w15030399
Chicago/Turabian StyleMeng, Han, Yuanyuan Lin, Wenjun Zhong, Zheng Zhao, Liang Shen, Zhen Ling, Kaisong Zhao, and Shan Xu. 2023. "Fish Biomonitoring and Ecological Assessment in the Dianchi Lake Basin Based on Environmental DNA" Water 15, no. 3: 399. https://doi.org/10.3390/w15030399