1. Introduction
Floods are defined as natural disasters that occur as a result of a group of factors beyond human control and cause material and human losses. Floods paralyze life, create environmental imbalance at all levels, both natural or human, and lead to loss of property and life along with poor economic development. Flooding is a major natural disaster that occurs in many parts of the world [
1], and its frequency and magnitude are expected to increase with global warming [
2]. A flood is a significant rise in water levels within a river, lake, or reservoir that overflows the banks [
3]. Floods often occur without warning, with a sudden surge that always causes disasters for unprepared communities [
4]. Flooding remains one of the most devastating natural disasters in the world, despite significant investments in prevention and management in recent decades [
5].
Riverine areas are naturally at risk of flooding [
6]. Socio-environmental systems are also exposed to a large number of risks, which represent a potential threat to the survival of the entire global system; these risks can be classified in different ways according to their severity and frequency [
7]. Floods generally affect social and economic conditions, cause widespread unemployment, deteriorate public health, and destroy the ecosystem [
8,
9]. Flood control policy and regulation are important in reducing the risks of economic and social downturns, threats to human existence, and environmental preservation [
10]. Civil societies, local and central governments, specialized academics, and commercial actors play influential roles as primary drivers of innovation in national programs for environmental conservation and sustainability [
11].
Flood vulnerability can be reduced by timely and accurate warning, forecasting, and impact mitigation measures [
12]. Floods can be predicted using the River Analysis System model from the Hydrological Engineering Center (HEC-RAS). It is useful in preparing a plan for mitigating and controlling the effects of floods [
13]. The HEC-RAS 5.0.3 model is well developed and the models generated by the software are realistic, very easy to use, and highly accepted in the hydraulics community [
14]. Hydraulic modeling using the HEC-RAS model with ArcGIS 10.8 software makes the modeling process easy and produces accurate and easy-to-understand flood results [
15]. In the recent literature, one of the most recent methods of mapping flood subdivisions is the use of GIS integrated with hydraulic and hydrological models, as was done in [
16,
17,
18,
19,
20,
21], among others.
Moreover, there have been a large number of studies related to floods and their economic and social consequences around the world. Among these studies, we mention one that dealt with the exposure of the city of Hong Kong, located on the southeastern coast of China, to the combined risks of floods caused by heavy rainstorms and extreme sea levels; the study highlighted the urgent need to develop a multi-hazard flood risk management strategy [
22]. Another study evaluated the impacts of flooding on social and economic activities in Oleh in the Southern Isoko Local Government Area, Delta State, Nigeria, where floods caused by both natural processes and human activities cause great environmental destruction, destroying lives, property, agricultural land, and social infrastructure. The study recommended the developing an early warning system for floods at the community level as well as educating the population about flood risks [
3]. Floods caused by heavy rains and the melting of snow and glaciers in the Hindukush region of Pakistan caused social and economic damage; the water overflowed natural dams and caused huge losses in lives, homes, agricultural land, permanent crops, and other property. Based on the analysis of research results, proper attention to the environmental aspects of unchecked deforestation and degradation of rangelands and watersheds can represent a sustainable strategy for managing flood risk management [
23]. Studying the impact of floods on the social and economic situation in Uttarakhand’s Chamoli district, India, where Uttarakhand faces the problem of cloud explosions that cause flash flooding affecting agriculture, employment, education, infrastructure, health, water, and hydroelectric power projects, another paper recommended the formulation of a disaster management system can reduces the effects of disasters and ensure the evacuation, relief, and rehabilitation of disaster victims quickly and efficiently [
24]. A comprehensive analysis of floods that occurred in Turkey during the period from 2014 to 1960 was carried out. These floods were the result of climatic changes and the resulting heavy rains, and caused great human and economic losses while constituting a major obstacle to sustainable development. The study recommended that stakeholders and decision-makers establish better mitigation measures based on clear definitions of risk, classification of flood events, and consistent loss estimates [
25].
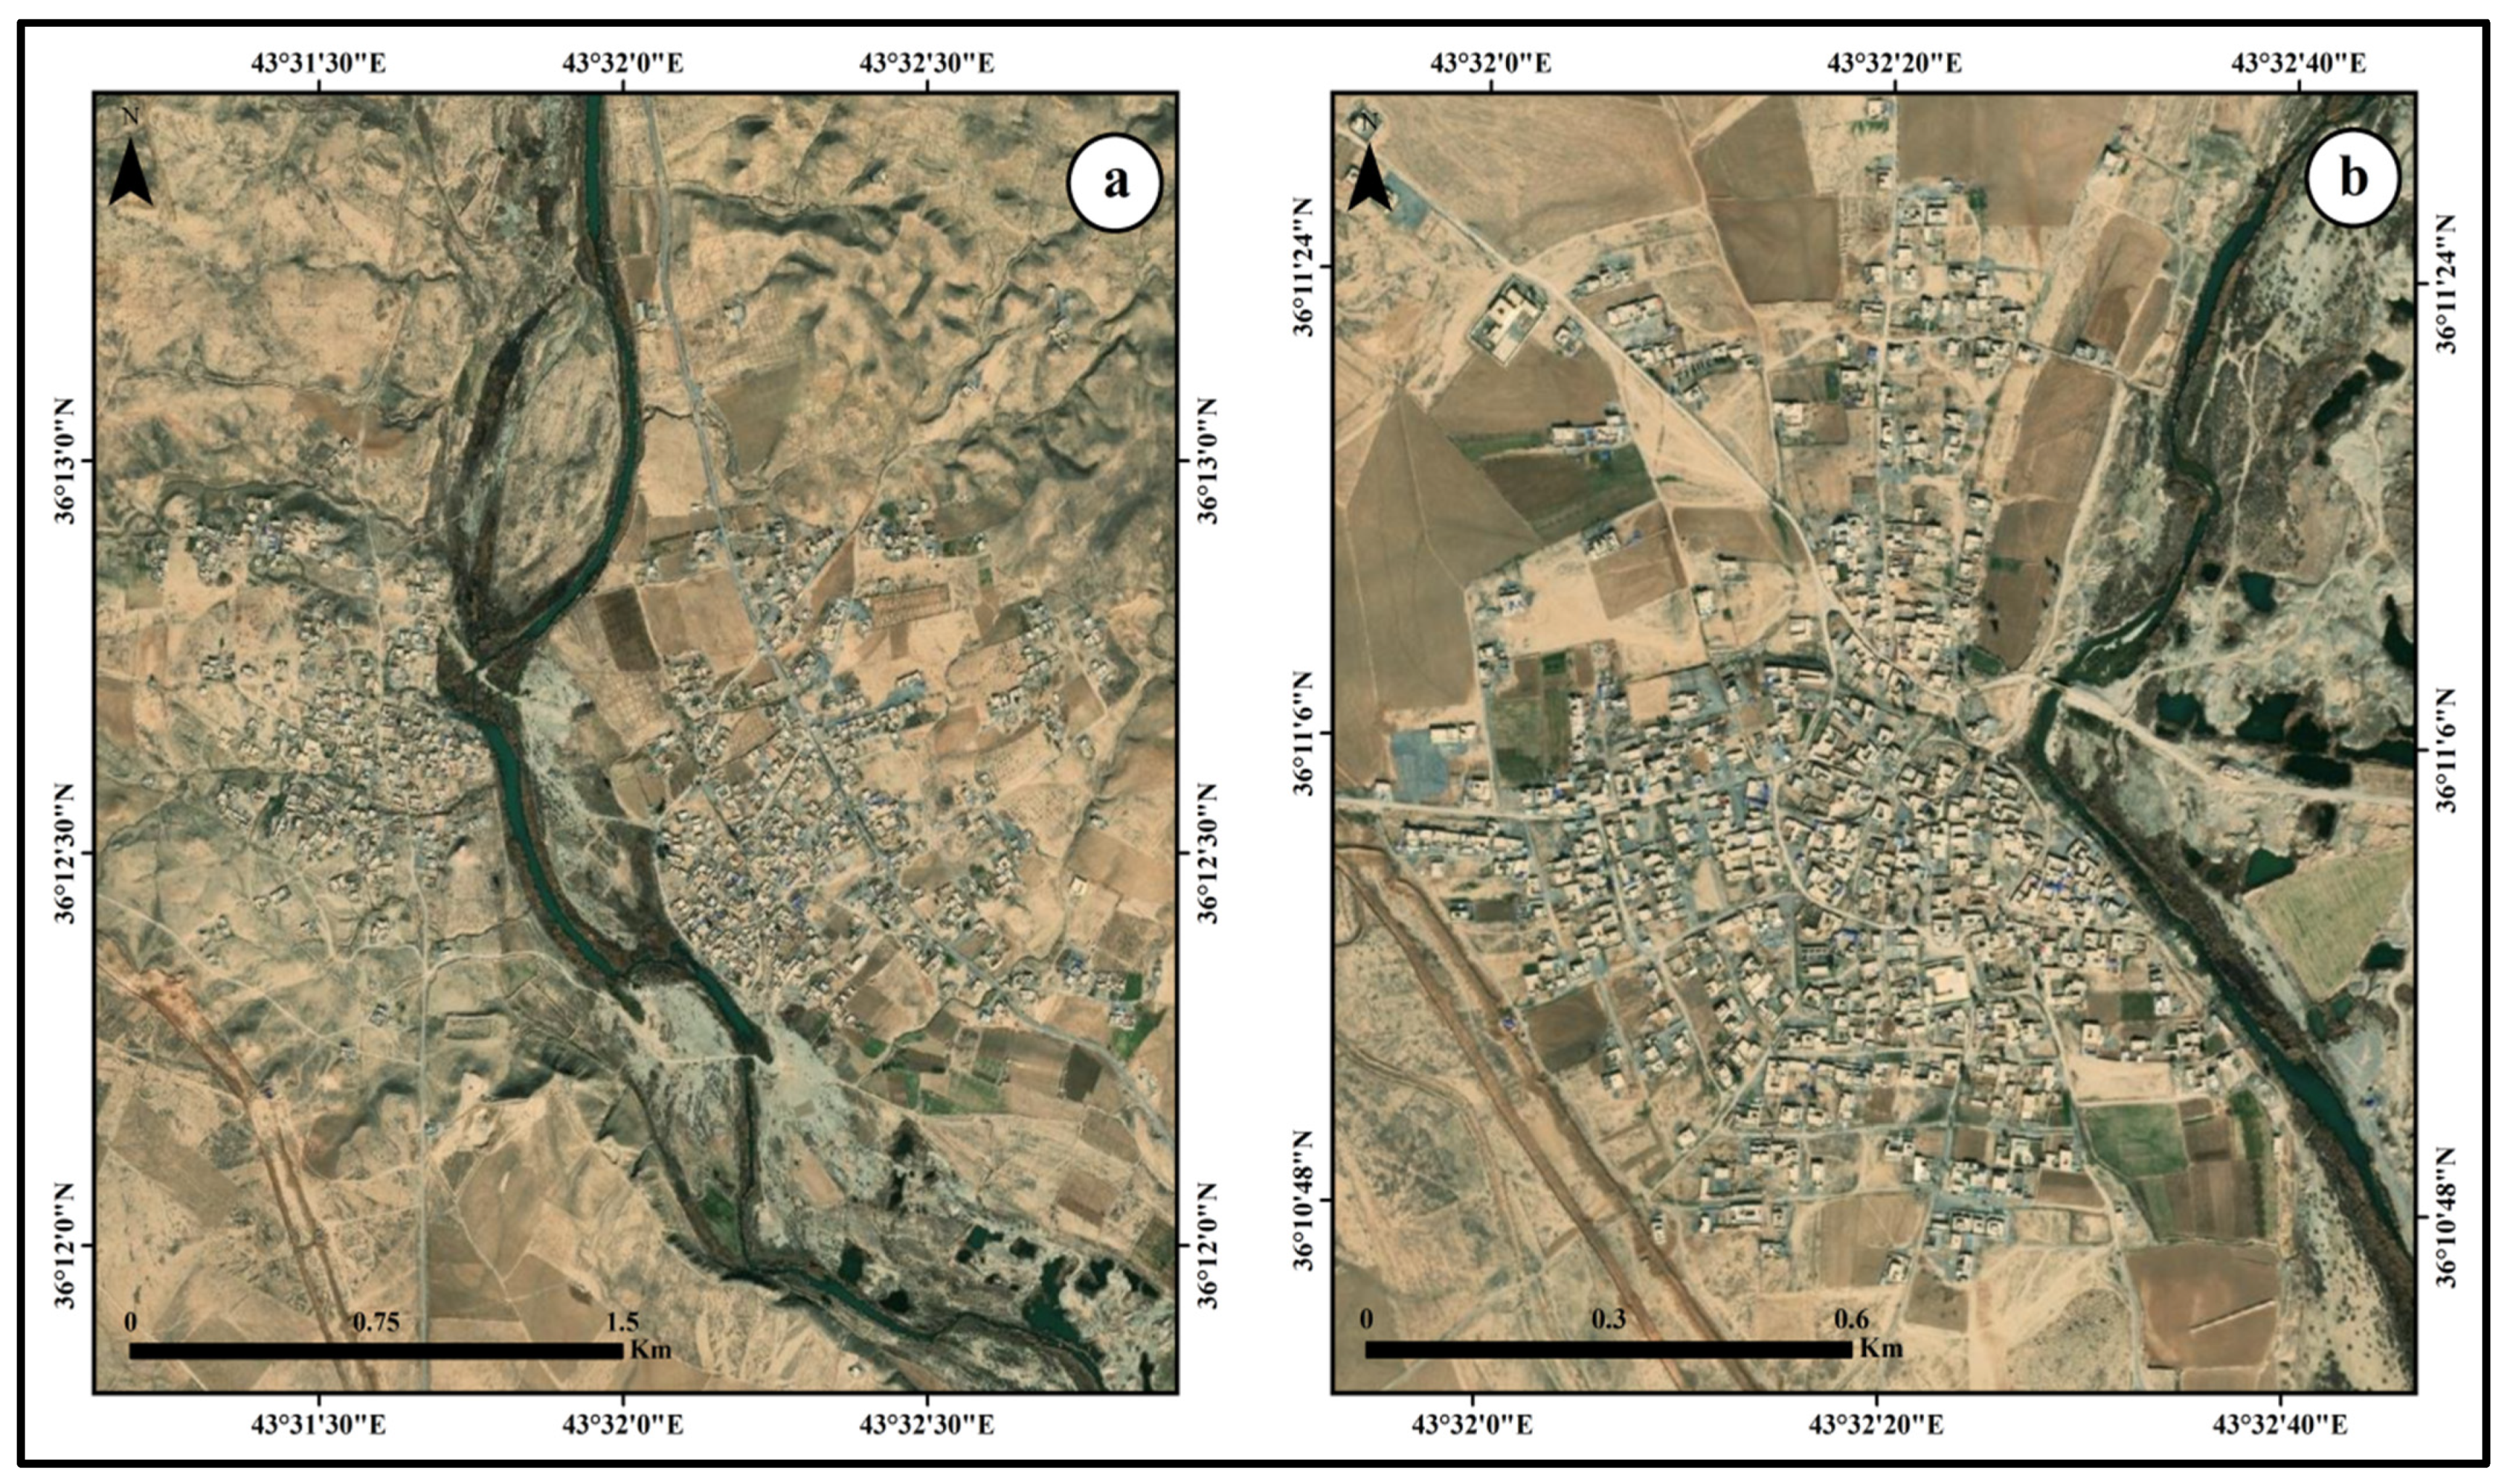
In the present paper, our study area has been exposed to many floods over time as a result of the high water levels within the course of the Khazir River. Among them, we mention several recent floods that affected areas near the banks of the river during the twentieth century as a result of rainstorms that lasted for more than two days, especially in the year 2013, when the river discharge reached 372.15 m
3/s, and in 2018, with a river discharge of 506.16 m
3/s [
18]. These floods had a wide variety of economic and social impacts on the people of the river basin. They caused the closure of many transportation routes between scattered villages on both sides of the river, power outages, the closure of schools for both students and teachers, destruction of crops, the demolition of some homes, the spread of diseases, and the drowning of livestock. Therefore, in the current study we have conducted an interpretation and spatial–temporal analysis of these floods to assess their effects on society and economic activities in order to prevent flooding or reduce related risks through proper planning and effective preparation with the use of modern scientific methods and techniques.
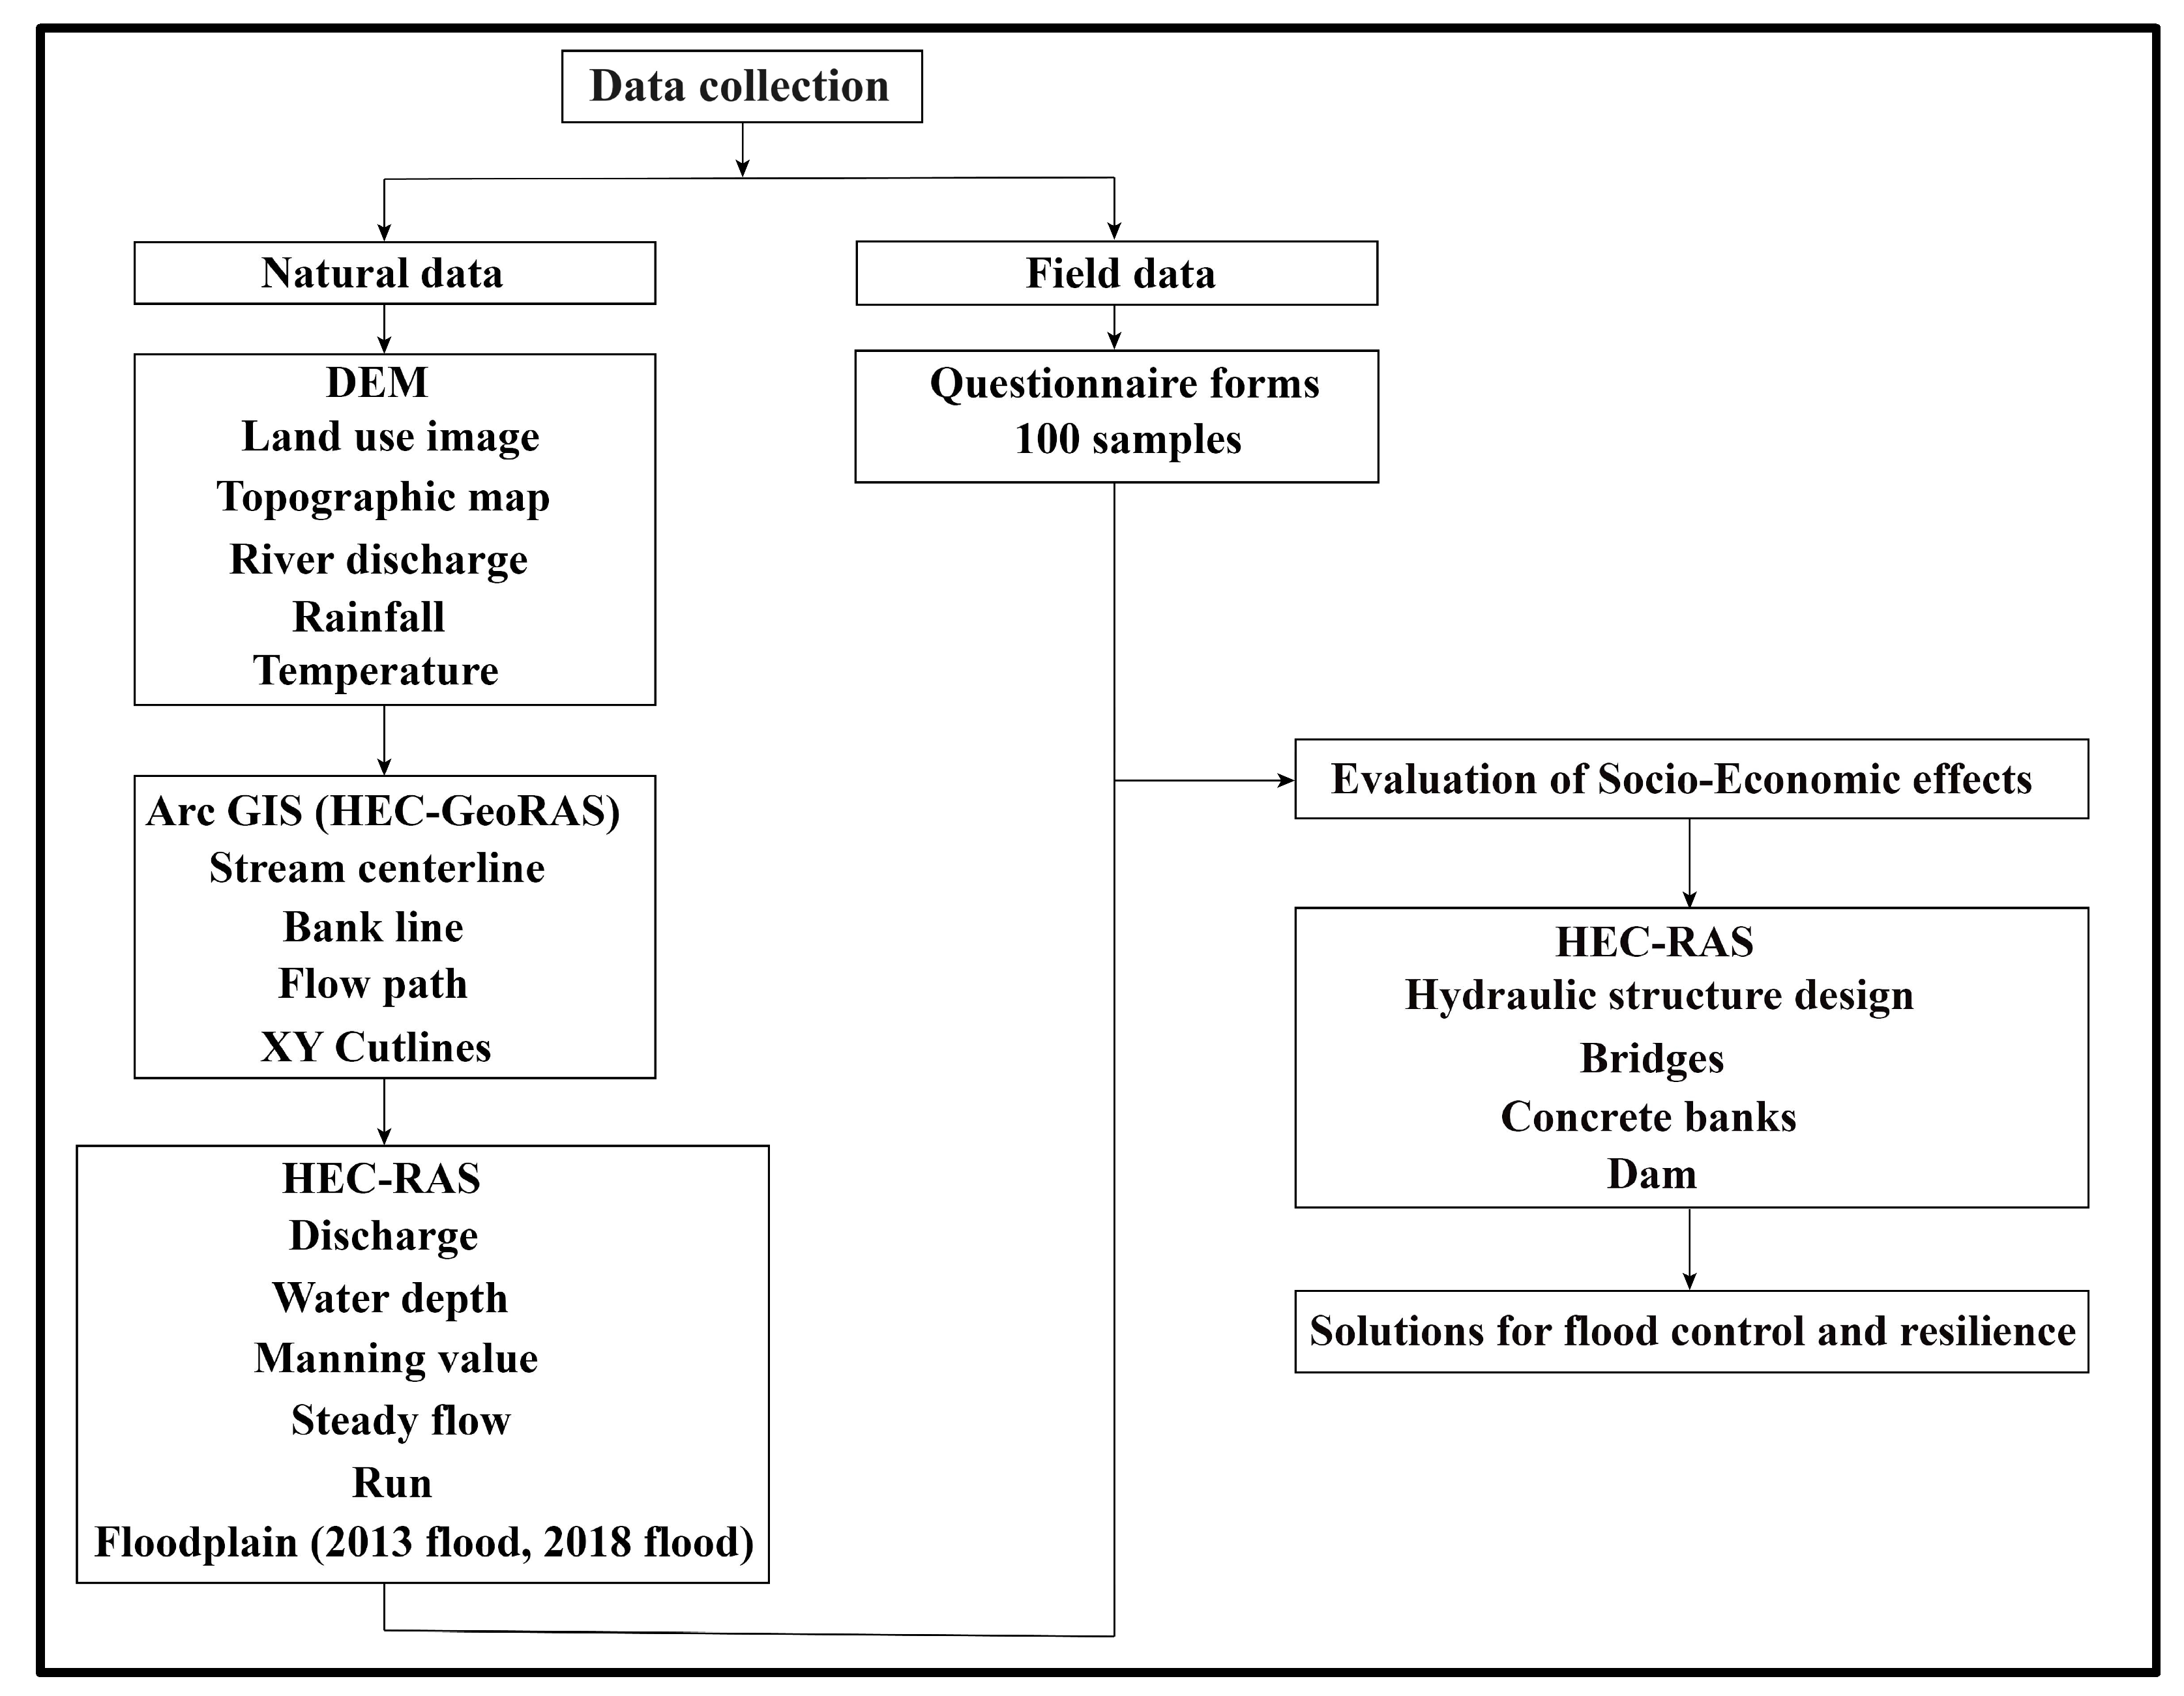
This paper uses an interdisciplinary approach to analyze the social and economic impacts of increased flood events and reduce their risks. The first part of the research began with a field study of the study area to identify the morphology of the Khazir River, followed by a theoretical analysis of the rise in water levels within the river’s course and its relationship to the occurrence of floods. The field study included personal interviews with residents of villages exposed to floods to identify and evaluate the social and economic problems that floods cause. The second part of the study dealt with proposing a set of engineering solutions to control floods and reduce their impacts on areas near the riverbed. The highlights of the research are:
Socio-economic activities in the Khazir River basin are affected by flooding;
Hydraulic structures (bridges, concrete banks, and dam) are designed according to various discharges that cause floods;
A number of hydraulic designs of the riverbed are modeled and simulated according to different scenarios using HEC-RAS 5.0.3 software;
Improved engineering solutions and recommendations are suggested to improve flood control and resilience.
3. Results and Discussion
There is a big difference between the past and the present with regard to natural disasters (earthquakes, volcanoes, floods, landslides, etc.). In the past, society viewed natural disasters as unavoidable events; however, today, thanks to the news spread by the media and social communication, people are less inclined to think about the serious social and economic consequences of inevitable extreme weather events. The media displaying images of natural hazards that occur on the surface of the earth reinforces the idea in society that these devastating events are less rare now than before, and that natural disasters are inevitable in the future [
28]. Nearly 30 years ago, economic studies began to investigate and reveal the magnitude of the costs of natural disasters [
8]. Many studies have found that natural disasters harm economic growth in the short term, while the results on the long-term effects are inconclusive [
29].
3.1. Impact of Floods on the Study Area
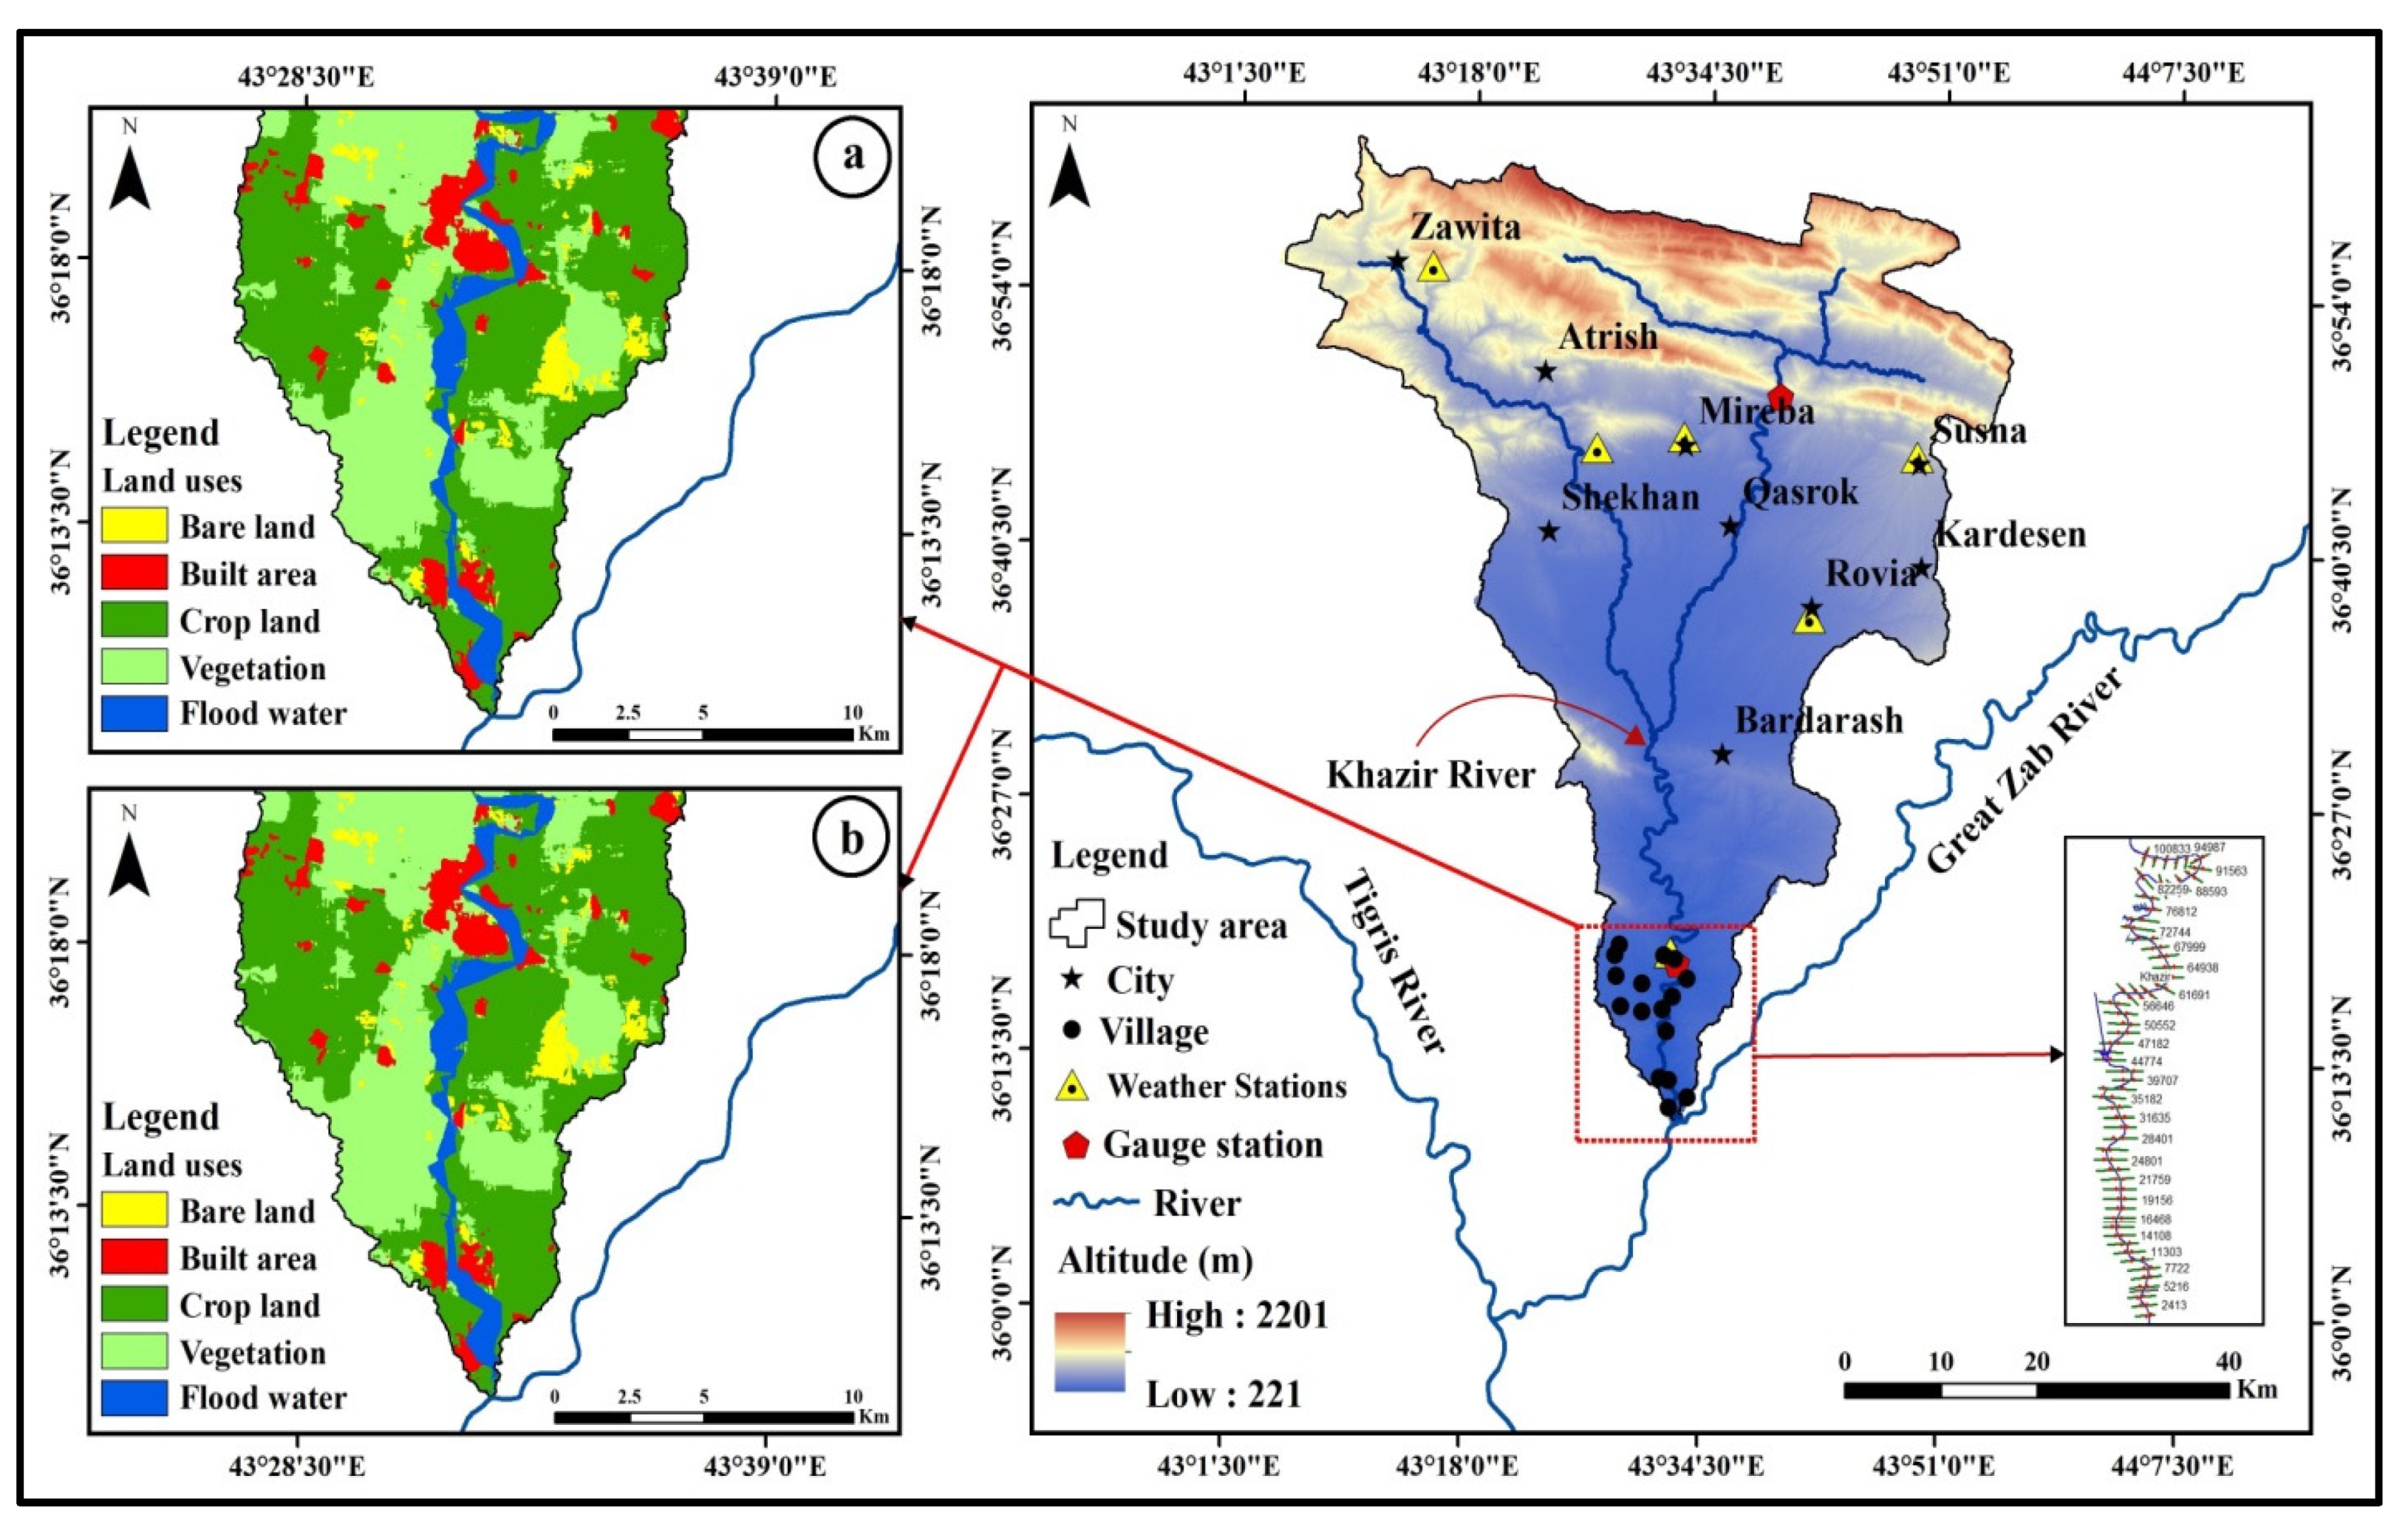
The extent of the damage caused by flooding in the Al-Khazir River basin varied due to the difference in the severity of the floods from one region to another; it was most severe in the southern parts, that is, in the plains close to the mouth of the basin, while the mountainous and hilly northern highlands did not witness any floods due to the elevation of the land surface. The matching of the flood map for the years 2013 and 2018 with the land uses map of the study area (
Figure 4) shows that agricultural crop lands are most affected by floods, followed by vegetation and residential buildings, then barren lands (
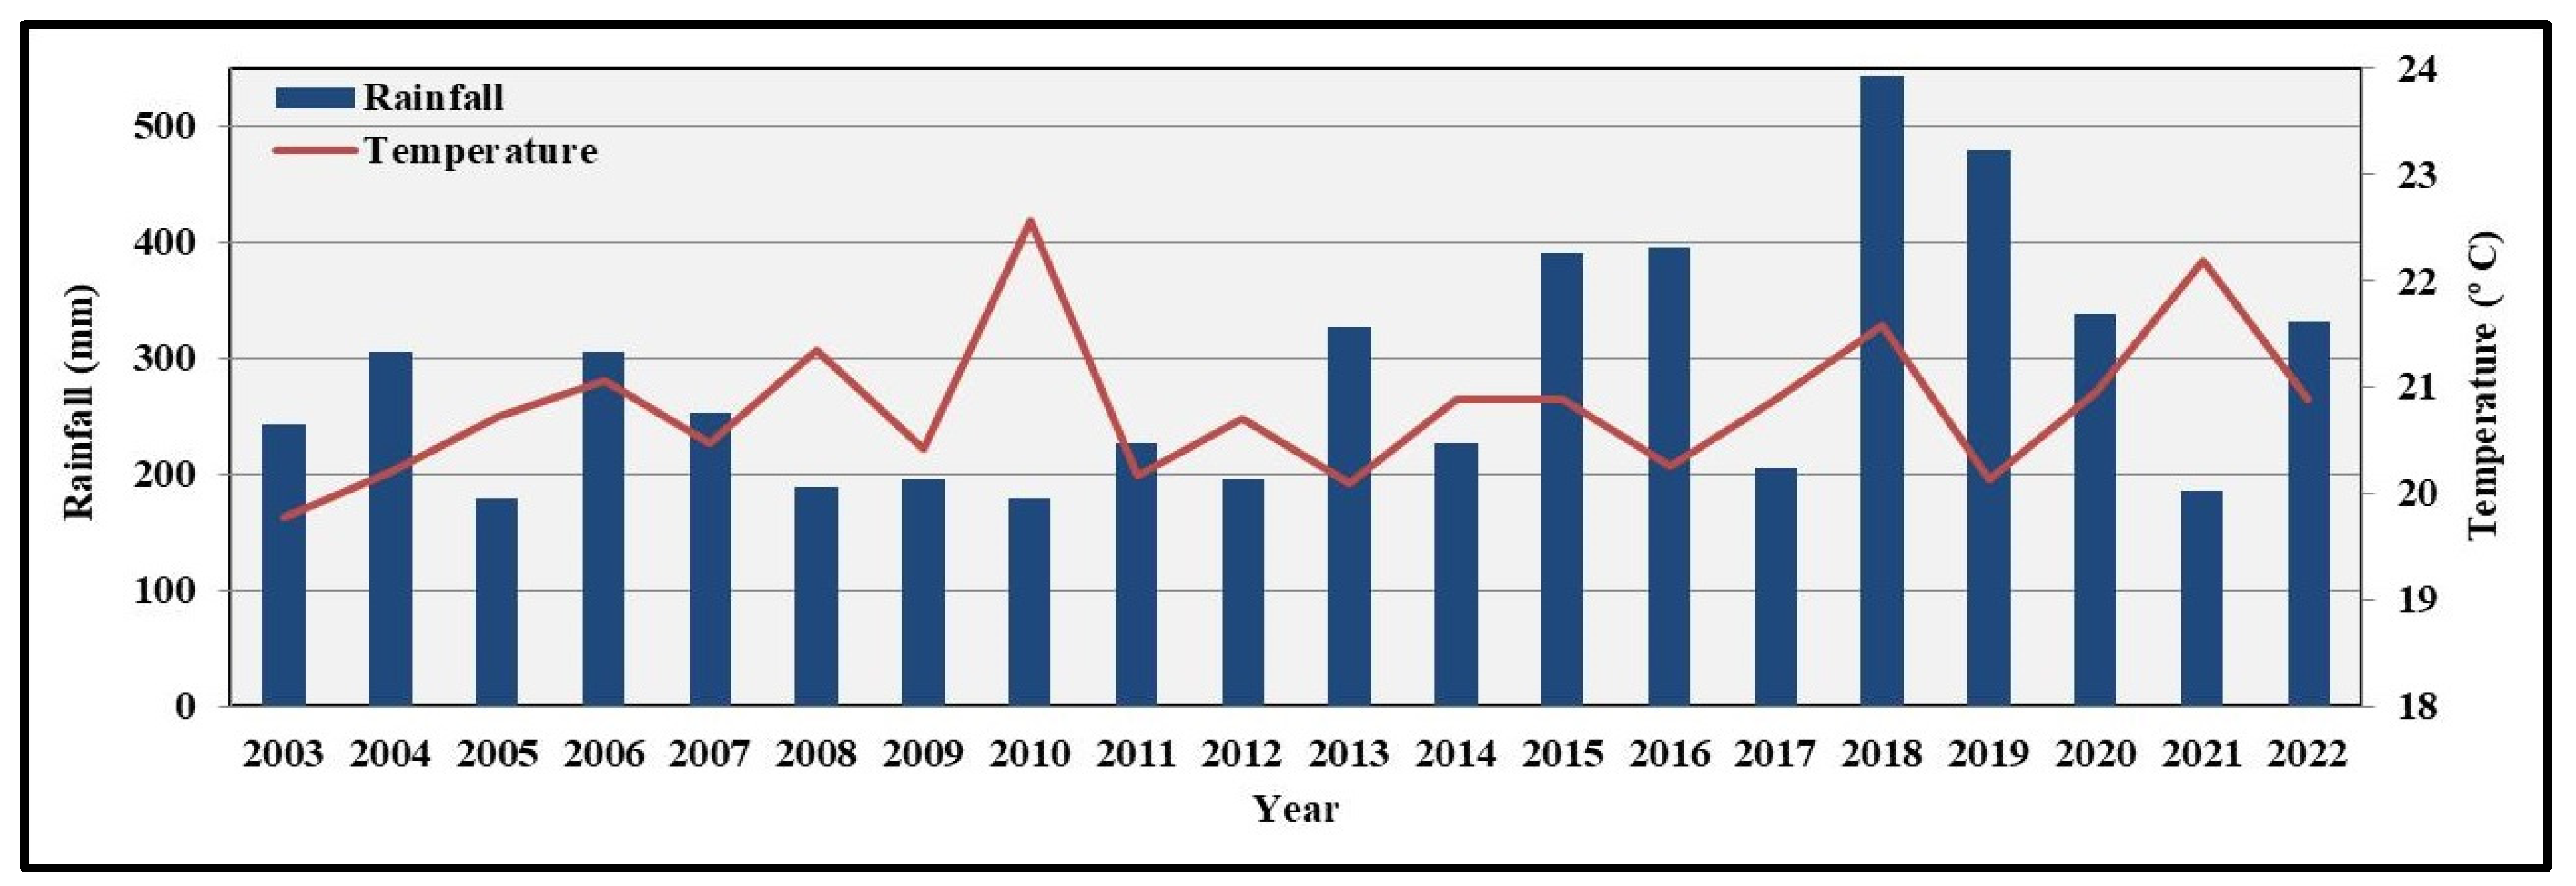
Table 3). Based on the questionnaire forms, all the floods recorded in the study area occurred during the months that witnessed rainfall, especially the winter season (25%) and the spring season (75%). The water level rises within the course of the river and flows towards the banks, affecting the land near it. Floods have a great impact on the social and economic lives of residents of the villages near the riverbed. They affect infrastructure and services such as public and private buildings, road networks, electricity supply facilities, agricultural lands, and animals.
3.1.1. Damage to Residential Complexes
Most flood damage studies have focused on assessing the costs of buildings and contents for apartment complexes [
30], while others have addressed property damage for public and private companies [
31]. When estimating economic losses due to floods, flood depth and depth of flood infrastructure are required [
32]. A group of villages in the Khazir River basin is exposed to the danger of flooding from year to year, as the villages consist of a large number of houses built of stone and cement and a small part made of stone and mud. The houses built of mud and stone have very little resistance to flooding, and as such are prone to collapse over time. The results of our field survey and analysis showed that several village houses built directly on the river bank or active floodplains are affected by danger of flooding because of water penetrating the houses and affecting their foundations, which led to some of them being exposed to cracking in the walls and others collapsing entirely. It can be noted from
Figure 5 that the river paths vary between meandering and straight in the areas exposed to the risk of flooding, which indicates a variation in the size and speed of the water current, and thus a difference in the intensity of the flood wave and the damages resulting from it. Houses close to the straight riverbed are at greater risk than homes close to the meandering stream. Therefore, according to the perception of the researchers and to the results of this study, it is recommended that the villagers build their homes away from the riverbed and active floodplains in order to avoid the risk of flooding in the future.
Table 4 shows a difference in the level of exposure of homes, schools, dispensaries, enterprises, and shops to losses as well as the differences from one region to another within the villages. The floods caused some residents to migrate from their homes to other safe areas farther from the danger of floods. The results of the questionnaire indicated that 75% of the reasons for buildings being exposed to floods mentioned their proximity to the river. Therefore, according to the perceptions of the researchers and the results of the study, it is recommended that villagers build their homes away from the riverbed and active floodplains to avoid the risks of flooding in the future.
3.1.2. Damage to Bridges and Roads
Land transportation is the most affected by floods, as most of the rural roads that connect residential settlements are laid on floodplains and are often unpaved dirt roads, making them highly vulnerable [
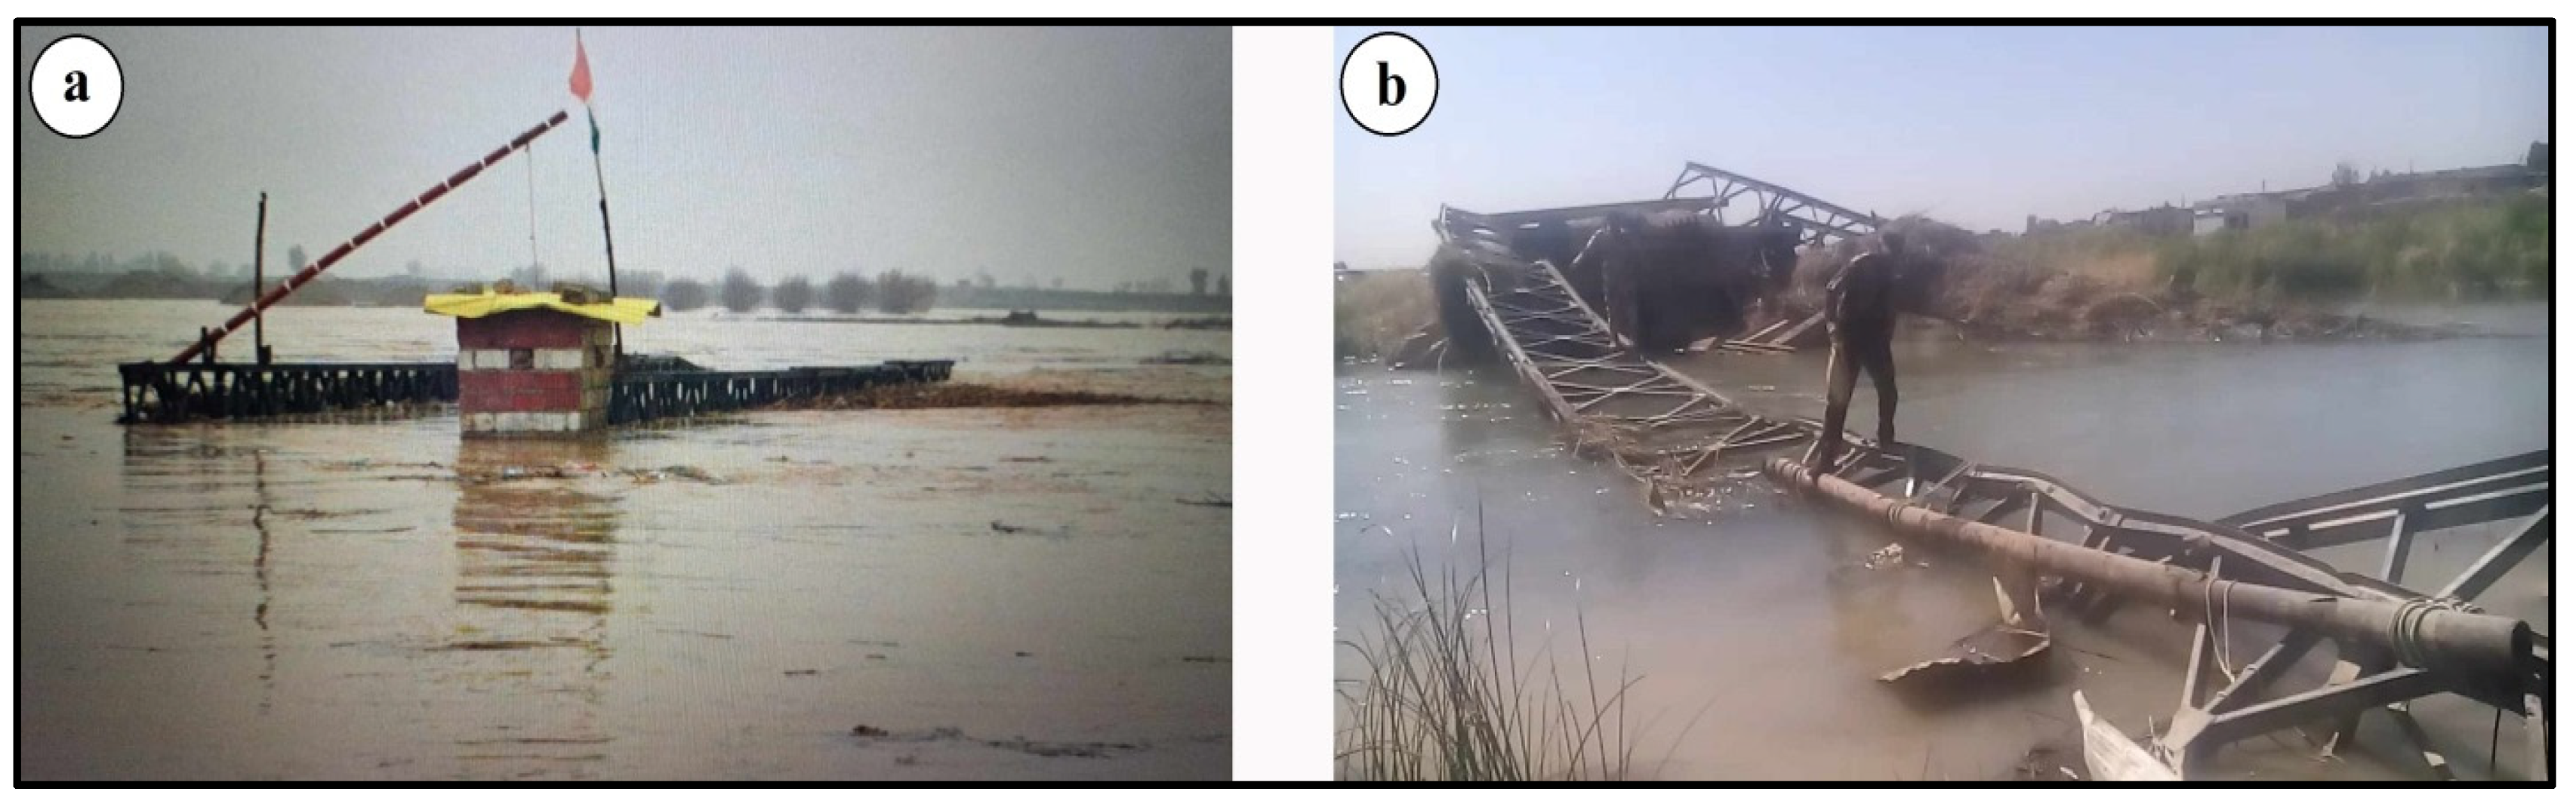
6]. The movement of transport and connections between cities and villages can only be achieved by the presence of well-constructed roads and bridges. The study area is characterized by the presence of many roads and bridges that connect cities and villages. The monsoon valleys cut off the roads in many villages due to the high flow density. Several bridges were subjected to flooding and others collapsed as a result of the floods that occurred in the years 2013 and 2018 in the three villages of Kazkan, Tal al-Laban, and Wardak. This was due to poor planning during the construction of the bridges, not taking into account the topography of the land or the high water level, and the height of the bridge being insufficient to allow flood waters to pass through. The higher discharge of water along with its maximum hydraulic pressure at the bridge site and the destroyed load, including logs, were directly responsible for the destruction of the bridges. In addition, the collapsed bridges were formed of reinforced iron in a primitive and simple way, as opposed to strong concrete bridges able to resist high flood waves (
Figure 6).
The roads and bridges in the three villages were greatly affected by flood waters; the bridges were exposed to breakage and collapse at a rate of 86.67% according to the results of the questionnaire. Several roads inside and outside the villages were exposed to being blocked by flood waters at a rate of 76.94% according to the residents of the villages. The floods additionally affected shopping traffic for village residents (see
Table 5).
3.1.3. Damage to Agriculture and Livestock
Floods all over the world have a wide range of negative impacts on economic growth, especially in areas with a large population base where the force of the water surge harms the agricultural sector [
33]. In any region, the agricultural sector is the main economic activity, and people earn their livelihood from it [
34]. This sector is the most affected by flooding in the study area. Crop waterlogging is the most serious adverse effect of floods on agriculture, as crops cannot survive underwater for long periods of time [
24]. Most of the residents of villages exposed to floods depend on agriculture for their daily sustenance, which includes both wheat and barley crops in a large proportion and winter vegetables in a very small percentage; the percentage of village residents owning agricultural land is approximately 42.22% (
Table 6). Floods cause damage to crops, especially wheat and barley crops, as being submerged in water leads to their rotting and death as a result of flood water remaining within agricultural lands for a period of 1–3 days The previous floods caused great losses to farmers, which led to their reluctance to continue in the agricultural profession for fear of flood waters, which led to huge material losses in the field of agricultural production in general and family income in particular. Flood-affected agricultural lands lie directly on the banks of the river and active floodplains.
Livestock represent an important and integral part of the agricultural economy, and fall within the agricultural activities in the study area. The source of livelihood for the residents of the villages in the river basin varies between agriculture and animal husbandry, with livestock mostly divided between cows and sheep (
Table 6). Material losses of livestock were recorded in the villages near the riverbed, where the flood wave caused the death of some animals and the spread of diseases in others, in addition to a shortage of fodder as a result of damage caused by the flood waters.
3.1.4. Damage to Health
The health costs caused by floods can be measured by the number of deaths and the spread of various diseases [
8]. Floods pose a major challenge to the health care system [
10] and cause a deterioration of the environment in terms of health as a result of the negative effects resulting from them. Flooding has long-term effects that are not generally seen immediately after a flood [
3]. These effects include the spread of diseases among the population as a result of stress and trauma during and after the flood, which exacerbates the epidemiological effects and increases psychological and physical stress, anxiety, and depression. Floods pollute clean potable water through contamination of water supplies and mixing with water reservoirs formed behind dams as well as mixing with groundwater represented by wells, which results in unsanitary conditions and the spread of waterborne diseases [
35]. Waterborne diseases include diarrhea, typhoid, scabies, cholera, malaria, dysentery, and others.
Access to medical care and medicines is a major concern in flood-affected villages. The villages in the study area are distinguished by their small health centers, which lack the medical equipment and medicines necessary to treat those sick and injured as a result of floods. According to the field survey of the study area, deaths were recorded in the selected villages during flood events of 2013 and 2018. Field monitoring and analysis revealed that the residents of the three villages were exposed to diarrheal disease as a result of their use of wells contaminated with flood water, as wells are the main source of water used by the residents of the villages in various aspects of life. In addition, the water and irrigation system is sometimes subjected to significant damage due to flooding.
In addition to the above, the results of the field survey based on questionnaires distributed to village residents indicated that the phenomenon of flooding is expected every year as a result of people’s awareness of the dangers in light of climate variability and the resulting rainfall. Because villages are exposed to recurring floods every year, some have taken simple preventive measures before they occur, in particular migrating to less dangerous areas, organizing people into groups for education and awareness about the dangers of floods via television and social media, and holding workshops and seminars. The results of our questionnaire indicate that the government and community support provided to families affected by the flood is very little, and is neither at the required level nor at the appropriate time.
3.2. Flood Prevention
Flood protection is a method or set of measures to prevent damage and eliminate loss of life and property in the future; plans for protection are made, necessary tools are chosen, and the economic viability of these plans is assessed in light of probable harm predictions. This depends on the strength of the flood waves and the population and properties at risk. The plans, strategies, tools, and software available to prevent problems and protect people from floods have been developed over many years. These methods can reduce the loss of life and property to a minimum [
15]. Among the advanced modern software and technologies is HEC-RAS 5.0.3 software, which is used to control floods. It is an advanced computing technology that provides warnings about floods, controls water flow, and calculates the water surface section [
36].
The main reasons for the occurrence of floods in the Khazir River basin are heavy rainfall, the poor drainage system, subsidence of the ground level, sedimentation in the drainage channels that leads to a decrease in their water capacity, the growth of shrubs and weeds and their introduction into the river channel, and the collision of the Khazir River with its mouth, represented by the Great Zab River, which reduces the speed of the water and causes it to collect in large areas, affecting the nearby villages. In order to reduce and control flooding, HEC-RAS 5.0.3 software was used to help prepare an integrated plan to control and mitigate floods in the river basin. In addition, the process of cleaning the course of the river from sediments, trees, shrubs, jungles, and waste and deepening and adjusting its course is one of the most important means of preserving its water capacity and preventing water from flowing towards neighboring lands, thereby preventing damage due to flood waters. The cleaning process involves the use of modern machines, especially excavators, bulldozers, and blades.
Flood losses can be reduced by controlling flood waters using a set of modern methods and software that allow the construction of structures along the course of the river, such as bridges, culverts, concrete banks, and dams, as described below.
3.2.1. Bridges
Bridges are one of the main river structures that have an important role in building and extending main and secondary roads, and many may be damaged due to floods [
37]. Bridge collapses cause economic losses and can be responsible for human injuries and deaths [
38]. Therefore, a number of factors must be studied when designing and building bridges, especially hydrological and hydraulic variables. Taking into account the geomorphology of the study area when choosing the location of the bridge design, the geomorphological conditions must be evaluated in order to analyze the stability of the water current. The geomorphological condition of the river is ensured by the meanders and lateral migration of the river channel. The bridge must be designed and built on a straight riverbed in order to facilitate the flow of the water current under it and avoid collision with the winding banks; thus, the water pool and its impact on the bridge when floods occur must be assessed.
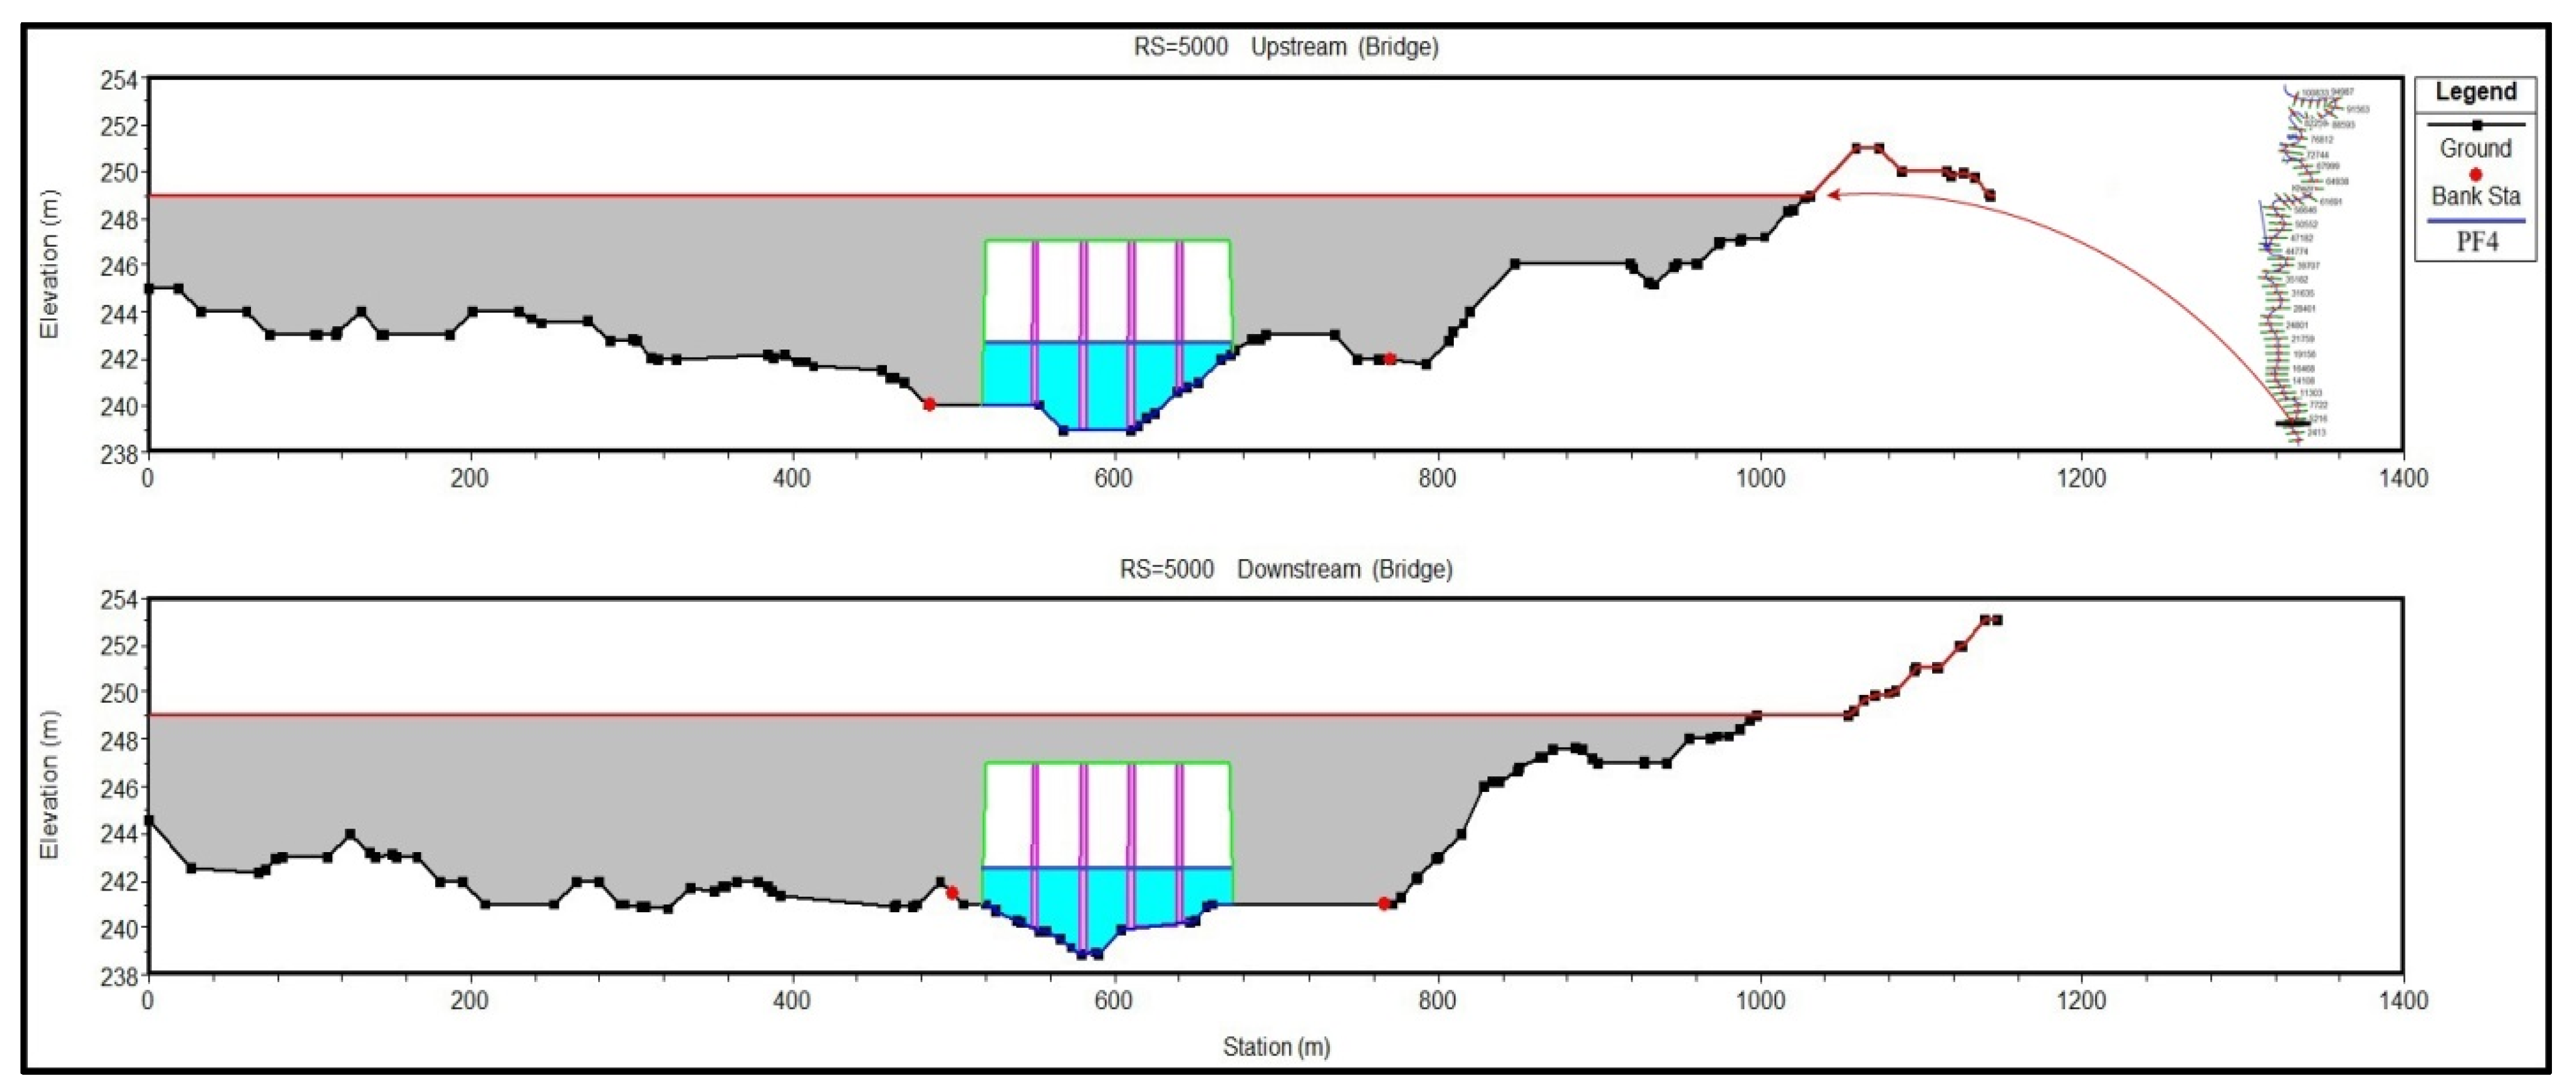
The number of bridges built along the course of the Khazir River has decreased, compared to the population, creating a great obstacle to the movement of people, cars, and animals. These bridges were designed in a very primitive manner and were not studied in terms of hydrology, hydraulics, and geomorphology, which exposed some bridges to fracture and collapse during the years when floods occurred. HEC-RAS 5.0.3 software was used to make future predictions of quantitative changes in stream bed height due to changes in the stream characteristics (discharge, depth) and watershed. A model was developed for the design and construction of the first bridge between the villages of Kazkan and Tel al-Laban (
Table 7) and the second bridge in the village of Wardak (
Table 8). Then, four different scenarios were taken into account for the volume of water discharged to the riverbed (
Table 9 and
Table 10) in order to determine the extent of the effect of the volume of discharge causing floods on the bridge body in the future.
After modeling and simulations of the data were entered into the HEC-RAS 5.0.3 software, it was found that the two bridges designed over the course of the Khazar River were not affected by the flood waters of 2013 (PF1) or 2018 (PF2) or by the discharge waters of the two proposed scenarios, which were 700 m
3/s (PF3) and 1000 m
3/s (PF4), respectively (
Figure 7 and
Figure 8). This indicates the appropriateness of the choice of place for designing and building the bridge as well as the dimensions with respect to different sizes of flood waves.
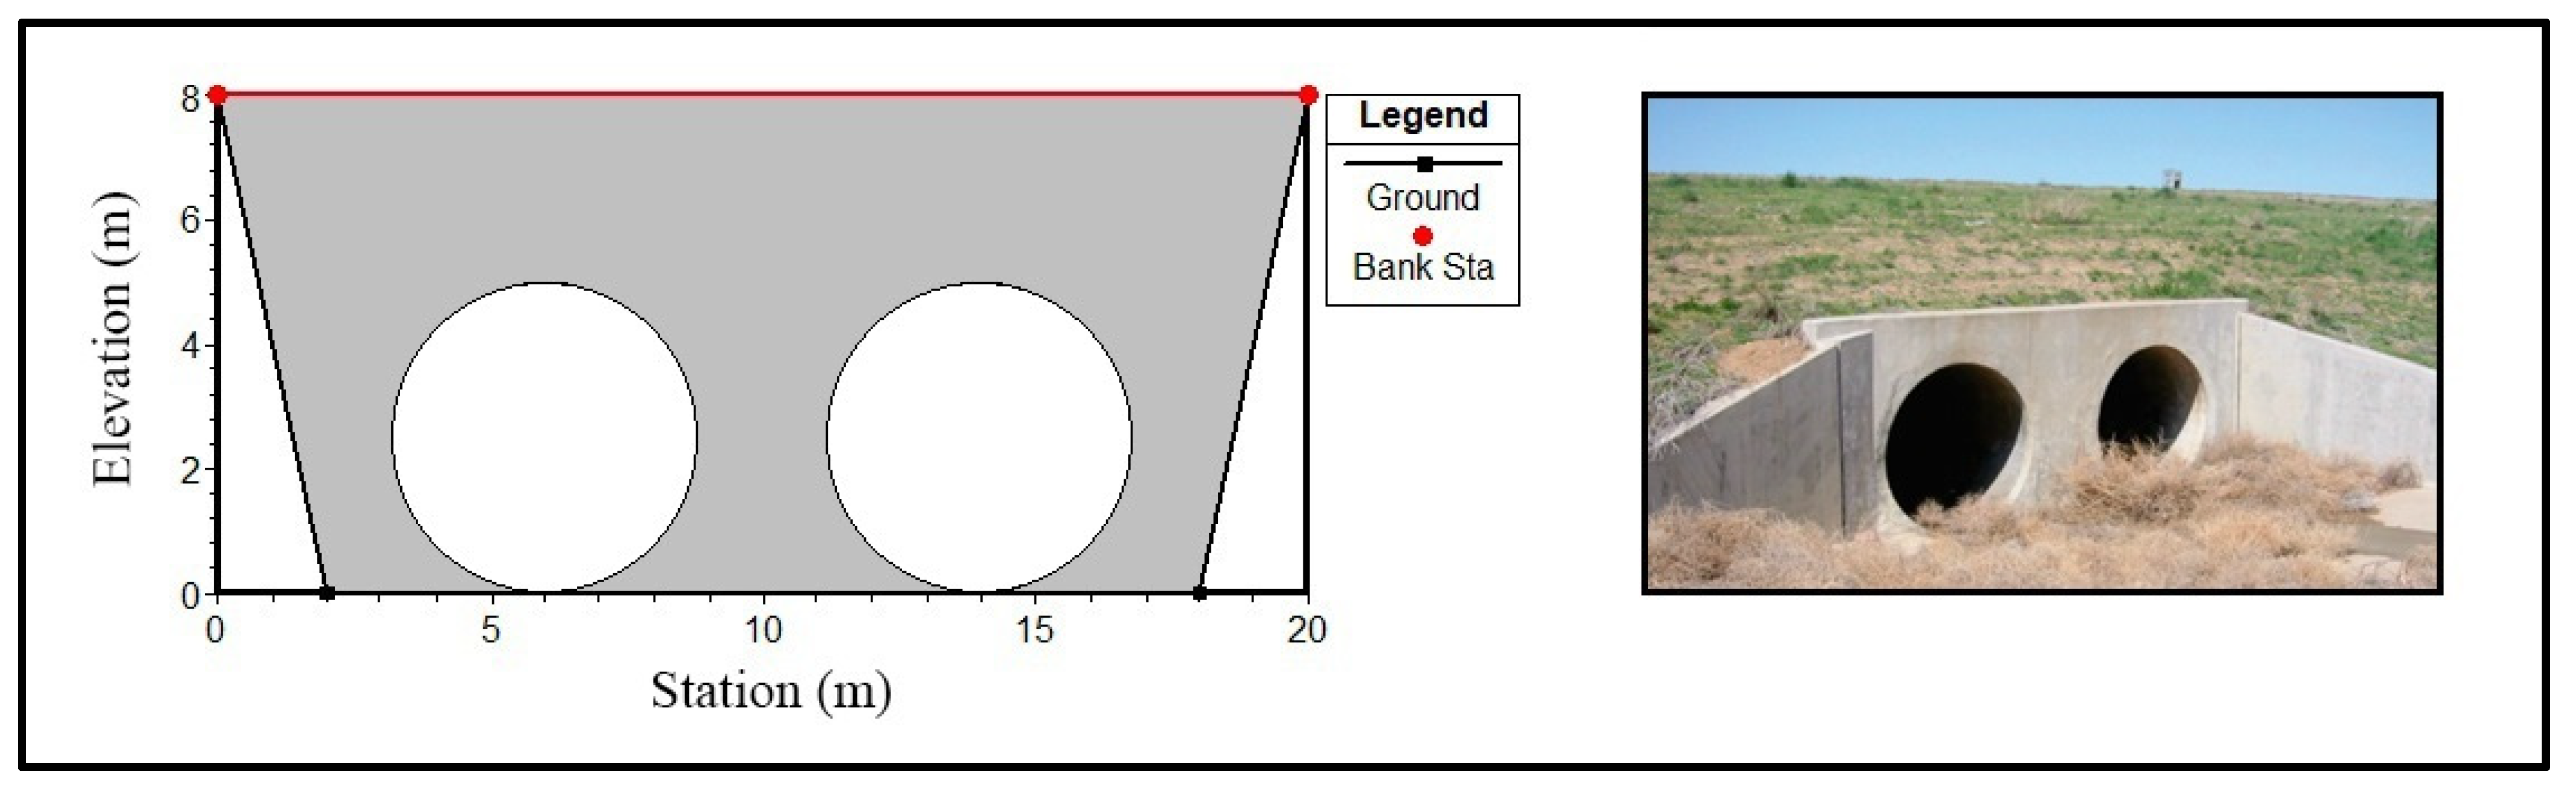
3.2.2. Culverts
Culverts are an important hydraulic structure used to manage natural and artificial canals. The culvert hydraulics in HEC-RAS 5.0.3 software are based on standard equations issued by the Federal Highway Administration [
39]. HEC-RAS has the ability to design multiple models in one location within a water channel. Culverts can have different shapes, sizes, heights, and loss coefficients [
27]. Culvert procedures include the ability to design circular, box, pipe arch, ellipse, arch, low arch, high arch, and semi-circular varieties.
It was found from the results of the field survey of the study area that the Khazir River does not bear the construction of a culvert within its course due to the high amounts of discharge during floods, which leads to the breaking and collapse of any culvert in front of it as well as an increase in the width of the river. However, it is possible to design and construct a number of concrete culverts of suitable dimensions within the paved and dirt roads (
Figure 9) where these roads were cut by the river flood waters and seasonal waters in the valleys. In this way, culverts could work to facilitate transportation and communication between villages and cities located within the watershed.
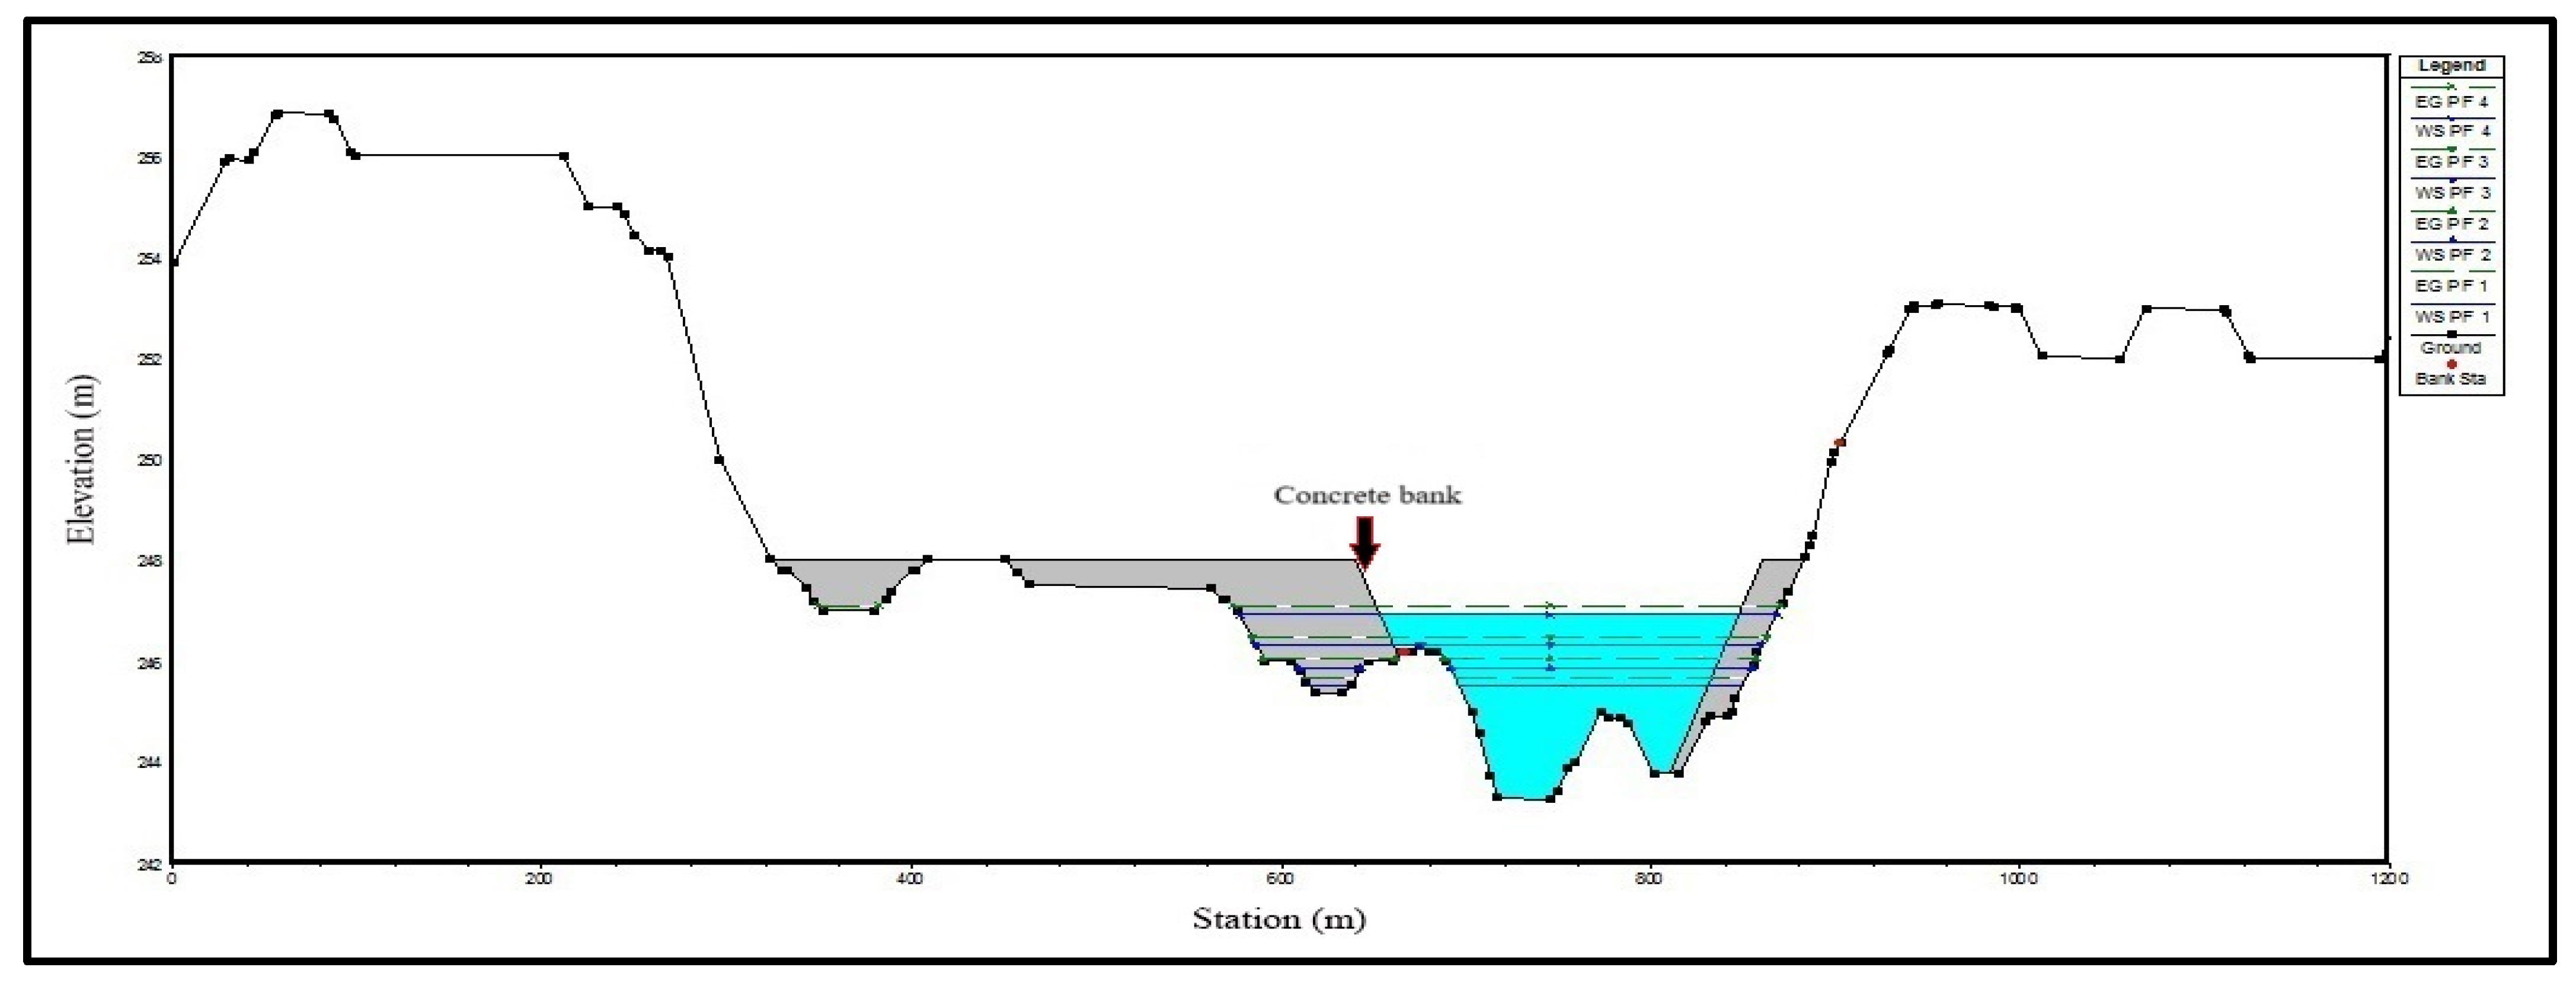
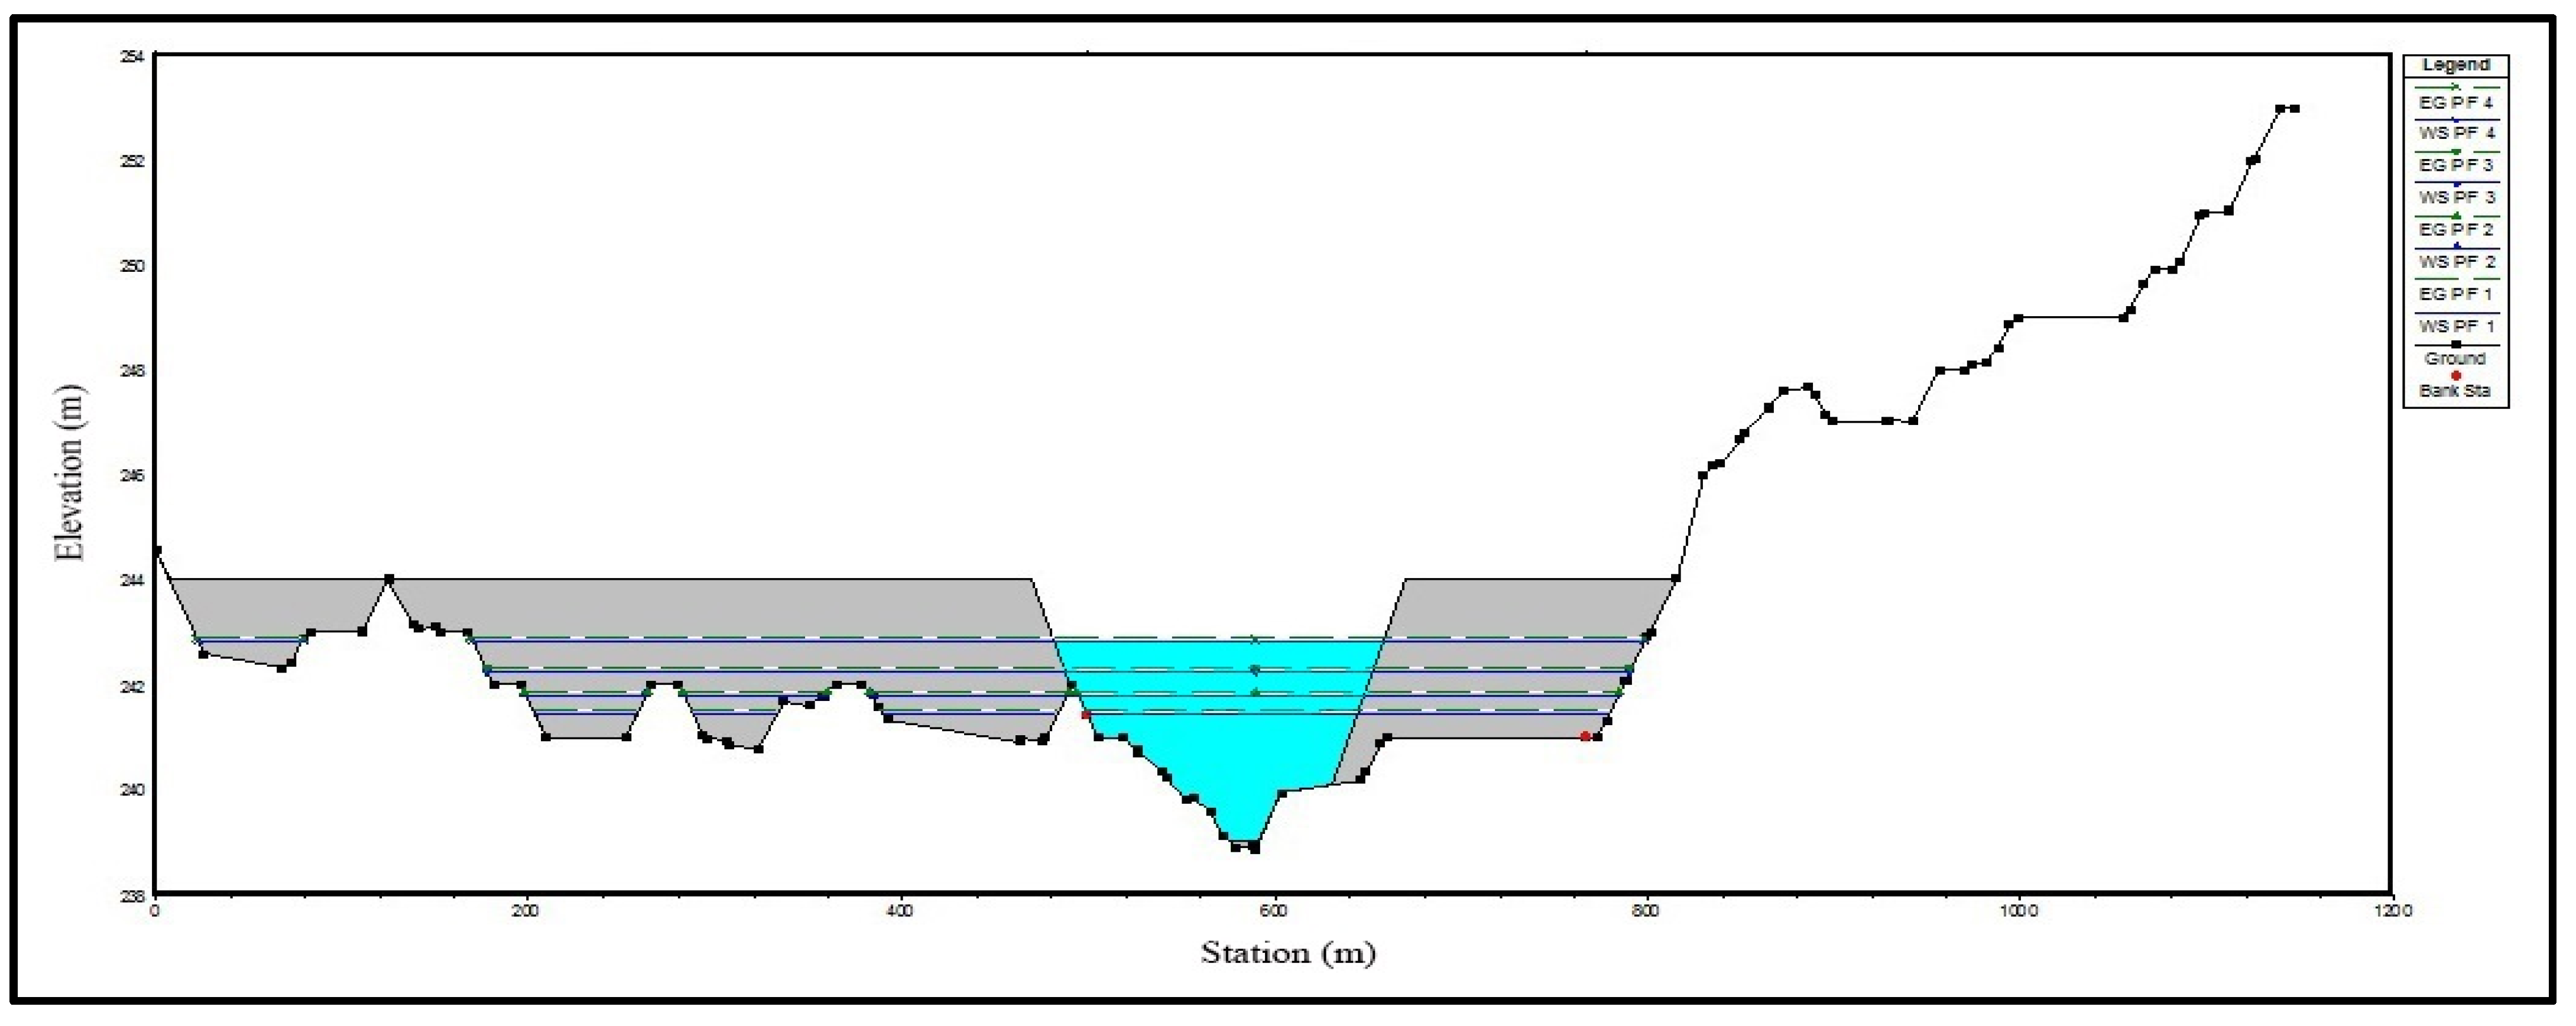
3.2.3. Concrete Banks
The river banks are sometimes exposed to collapse due to the rise and fall of the water level within the river channel as well as the fragility or lack of cohesion of the banks’ materials and the lack or absence of vegetation. There are two types of factors that lead to the collapse of the banks: natural factors (rainfall, river load, topography, vegetation cover, river twists, slopes, sedimentary components of the banks) and human factors, represented by gravel and sand quarries and other human activities related to the morphological changes of the river [
40].
Taking care of the banks is one of the most important necessities in managing rivers to prevent flooding, as the banks protect the areas close to the river from floods caused by high discharges. There are two types of banks: the first is an earthen bank consisting of gravel, sand, and mud; rock blocks can be placed on top of it, to protect the bank from collapsing into the stream. The second type consists of a reinforced concrete bank with steel or iron inside it to protect the concrete from fracture; it has greater resistance than the first type, as the concrete is not affected by the force of water impact and keeps the bank from collapsing, unlike the dirt bank which is affected by the direction and speed of the water flow.
After repeated field visits to the study area, it was found that the banks of the Khazir River are in dire need of concrete barriers, specifically for the course of the river that passes between the villages of Kazkan and Tal al-Laban and for the course of the river in the village of Wardak, as a result of the collapse of large parts of the river banks within the mentioned villages. This caused the water to flow towards the residential complexes and drowned them with flood waters. The HEC-RAS program was used to design the banks of the river after taking into account the topography, slope, depth of the stream, and morphology of the river. In the designed model, the water discharges for four different scenarios (PF1 = 372.15, PF2 = 506.16, PF3 = 700, and PF4 = 1000) are in m
3/s (
Figure 10 and
Figure 11).
3.2.4. Dam
Dams to control the course of rivers and other natural waterways are considered one of the oldest engineering structures known to man. The aim of building dams is to organize and manage the available water resources and provide for needs including drinking water, agriculture, industry, and other uses, with the aim of reducing recurring risks such as floods. The construction of water dams in vulnerable locations directs the river and reduces the risk of flooding [
23]. Dams are divided into two main types depending on the material constituting the dam. The first type is concrete, usually reinforced concrete. When building this type of dam, it is required that the rocks and the underlying soil bear the enormous pressure resulting from the weight of the concrete. The second type is represented by earthen dams, which consist mainly of gravel or rubble in addition to sand, although in all cases this barrier mass is lined with a cement layer. This type of dam is characterized by its relatively low construction cost compared to concrete dams, and its construction does not require huge substructures; however, this makes it more prone to cracking or collapse compared to the first type [
41].
When planning and designing dams on riverbeds, it is necessary to take into account a set of basic factors such as geomorphology, geology, hydrogeology, soil, topography, and slope. The upstream and downstream hydrological conditions must be considered and investigated in order to determine the negative impacts on lands threatened by flood waters with regard to agricultural and environmental aspects [
42,
43,
44,
45]. The purpose of the dam’s design is to control the frequent floods that the villages in the lower part of the river basin are exposed to, as the discharge of the river water coming from the high mountainous areas can be controlled during the rainy seasons. The storage of the accumulated discharge is then utilized in the dry seasons, especially during the summer.
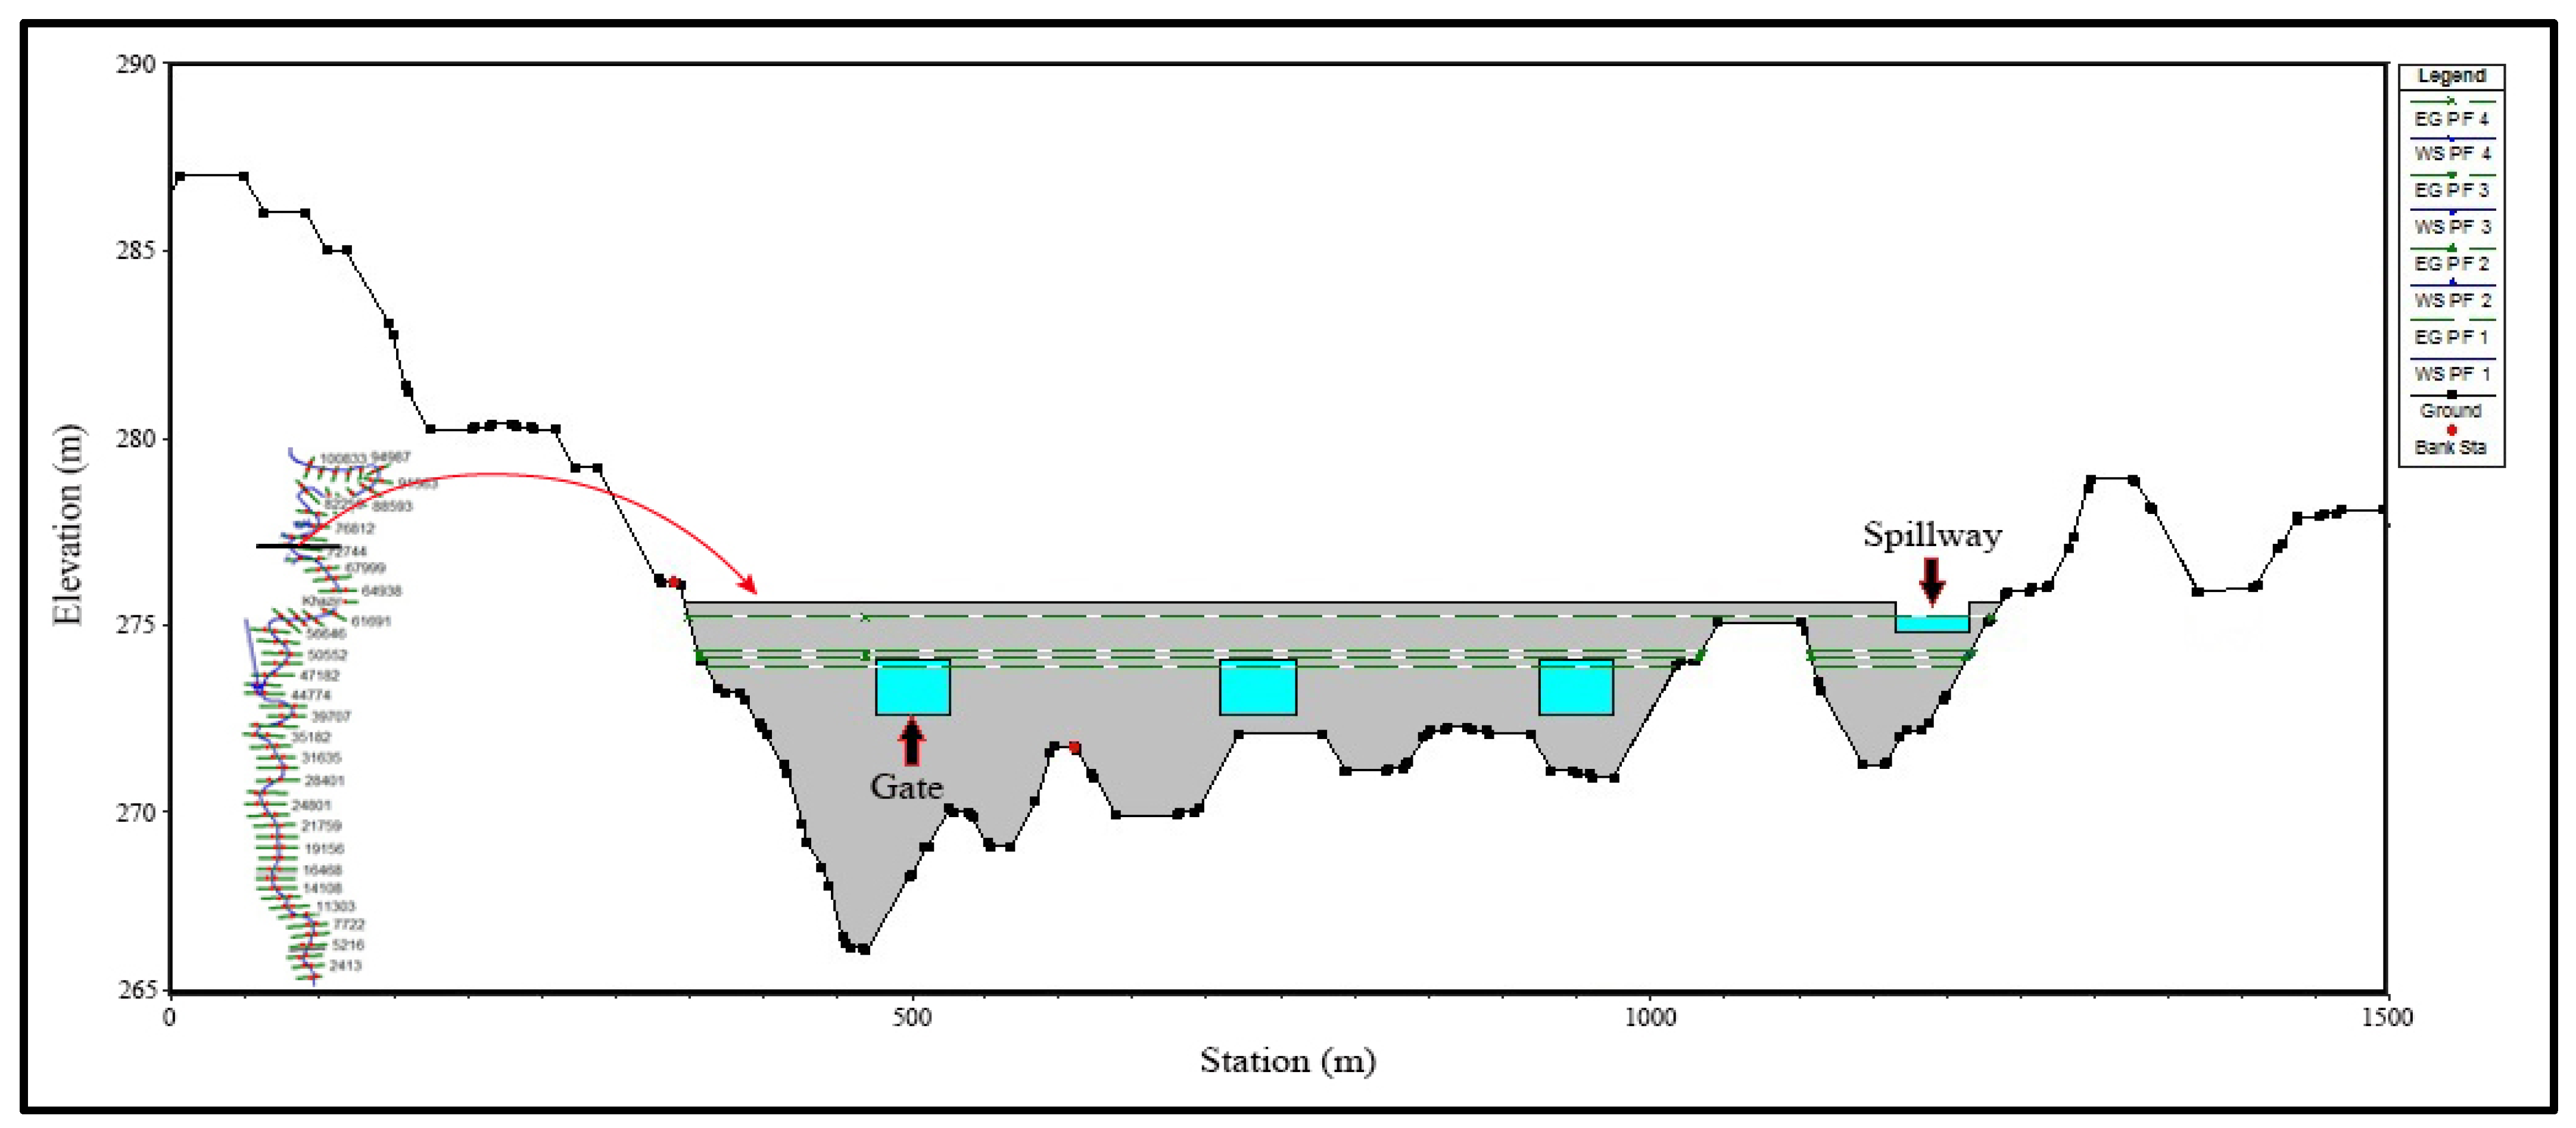
The proposed dam was designed based on the HEC-RAS 5.0.3 software by defining all its engineering features. The dam is proposed on the course of the Khazir River, considering the factors mentioned above, and is confined between two hills with a height of (278–280) meters above sea level. In the proposed dam model, the water discharges for four the different scenarios (PF1 = 372.15, PF2 = 506.16, PF3 = 700, and PF4 = 1000) are in m
3/s (
Table 11). The dam contains three lower outlets used to drain excess water from the reservoir formed behind it, and contains a spillway that works to evacuate the flood wave from the reservoir and keep the dam from collapsing from the great water pressure on it. The general equation for spillway flow through a lower gate can be applied using Bernoulli’s equation, as follows:
where Q
gate = discharge (spillway gate flow); C
d = coefficient of discharge, typically 0.5–0.7; w = vertical opening of the gate; B = gate width; g = gravitational constant; and H = a head term.
There is a close relationship between the storage and outflow of the tank with the water drainage gates, which depends on the number of gates proposed. The total spillway discharge (Q
sp) of the three gates of the proposed dam can be calculated as detailed in Equation (5).
Figure 12 shows the cross-section of the proposed dam on the riverbed along with the drainage channels and control gates. The dam begins to drain excess water through the spillway when the river’s discharge reaches 1000 m
3/s.
4. Conclusions
Flood risk assessment is a vital tool for the predictive planning of adaptation measures based on risk analysis. This article has concluded that the villages located in the lower part of the Khazir River basin are vulnerable to the negative effects of the floods, which have led to the deterioration of their economic and social status. The study area has witnessed frequent floods in the villages near the course of the river, with each of the villages of Kazkan, Tel al-Laban, and Wardak being exposed to floods that caused severe damage to buildings, infrastructure, agricultural crops, livestock, and other property. Floods on the Khazir River are considered a seasonal phenomenon, as the results of our analysis revealed that winter and spring monsoon rains during the months of January, February, March, and April were responsible for the increase in the discharge of the river, the occurrence of floods, and the resulting damage along its course. Residents of the floodplains were found to have built and rebuilt their homes in flood-prone areas without regard to future flood risks. Those houses built with mud and stone were badly damaged due to their lack of resistance to flood events, and it was noted that most of the damage was due to the encroachment of the villages along the banks of the river. The results of our analysis of 100 questionnaires indicated that floods are an expected and recurring phenomenon in the study area and that they occur every year, with varying degrees of damage and losses from year to year and from one region to another.
The 2013 flood covered an area of 10,371.98 m2, while the 2018 flood covered an area of 10,963.45 m2. The flooded areas were estimated using HEC-RAS 5.0.3 software. The areas of different land uses (bare land, cropland, built area, vegetation) exposed to the flooding were varied. Based on the results of the questionnaire, 50.55% of the respondents indicated that their homes were sometimes exposed to flooding that caused them to migrate and leave their homes for fear of flood dangers. According to the results of the questionnaire and the opinion of village residents, bridges were broken and collapsed at a rate of 86.67% and some roads inside and outside the villages were exposed to torrential waters at a rate of 76.94%, respectively. Moreover, 63.05% of respondents indicated that water remained within agricultural lands for three days, causing damage to crops, and that wheat and barley crops were more affected by floods than other crops. The results of our field study indicated that some village residents were exposed to diseases and even death as a result of drowning in flood waters.
The next part of the study addressed the challenges facing flood management and proposed a set of new solutions, methods, models, and tools to understand and improve flood resilience. HEC-RAS 5.0.3 software was used as a means to protect the river basin from recurrent floods. The steps of the methodology in HEC-RAS consisted of evaluating hydrological events (risks), modelling, and simulating river behavior by calculating river discharge variables according to four different scenarios (PF1 = 372.15, PF2 = 506.16, PF3 = 700, and PF4 = 1000) in m3/s. In addition, we included these scenarios in the engineering and hydraulic designs proposed along the course of the river. The first scenario was the 2013 flood, the second scenario was the 2018 flood, and the third and fourth scenarios were theoretical scenarios proposed for this research. The hydraulic structures (bridges, concrete banks, and dam) were designed according to the four proposed flood discharges and the results of the field surveys. A group of culverts were constructed along both paved and dirt roads as an important means of movement between villages and towns within the watershed. After analyzing the results of modeling and simulation, it was found that the proposed hydraulic facilities were not affected by any of the water discharges resulting from the floods.
The velocity of the water current differed in the two cross-sections of the two proposed bridges on the riverbed, as the velocity of the water current ranged from 2.235 m/s in scenario PF1 to 3.040 m/s in scenario PF4 for the first bridge and from 1.4 m/s in scenario PF1 to 2.68 m/s in scenario PF4 for the second bridge. This is due to the water velocity decreasing downstream as a result of the decrease in slope, which is between 0.006 at the first bridge and 0.001 at the second. The proposed concrete banks were compatible with the river discharges for all four scenarios (PF1, PF2, PF3, and PF4) with respect to the height, thickness, and slope of the banks towards the river bed. The water surface levels of the reservoir formed behind the proposed dam varied, and was 273.8 m in scenario PF1, 274.1 m in scenario PF2, 274.3 m in scenario PF3, and 275.2 m in scenario PF4 at sea level. The spillway begins to discharge water in scenario PF4, which represents the maximum discharge of the river, because the dam body cannot withstand the force of water pressure in front of it, which increases with the increase in the volume of water.
This study recommends the creation of an advanced warning system in the proposed dam which is linked to a sensor network with a direct connection to the river discharge data measuring devices. This system could provide signals to the responsible authorities about any rise in the river’s water level in the event of possible flooding and provide information and advice to people in order to evacuate to a safe place and avoid the risk of flooding. It further recommends that government agencies concerned with the matter educate people not to reside and cultivate on the banks of the river, to move residential complexes that are already located at the edges of the riverbed to safer areas, and to provide alternative land away from the danger of floods.


 ,
, 


