1. Introduction
Agricultural land is an important ecosystem that provides food essential for human survival. In particular, rice paddies are an important land use type that is indispensable for survival in countries in Asia and Africa that use rice as their main food source. However, rice paddy wetlands are disappearing due to development, urbanization, and industrialization. In the case of South Korea, rapid urbanization and industrialization since the 1970s converted agricultural land, including rice paddies, into development areas, leading to a sharp decline in such lands. In addition, changes in dietary habits have reduced the demand for rice, leading to a shift to a more diverse diet, an increase in idle agricultural land, and the gradual disappearance of rice paddy wetlands, which is also a major change in land use. Rice paddy wetlands provide important ecosystem services and functions to both humans and the surrounding natural ecosystem. The ecosystem services provided by rice paddy wetlands have ecological, economic, and social values. The main ecosystem services of rice paddy wetlands include food production, provision of habitat for creatures, carbon absorption/storage, soil stabilization, erosion prevention, buffering against floods and droughts, water purification, cultural and social values, ecological maintenance and economic support, and recreation. Rice paddies also have aesthetic value.
In recent years, the natural disaster buffering function and carbon absorption/storage function of rice paddy wetlands for adaptation to and mitigation of climate change have been receiving attention, as the negative effects of climate change have become more serious and the need to reduce greenhouse gases has increased. In order to sustainably utilize the benefits provided by the ecosystem as a kind of environmental goods, the importance of sustainable and holistic management of the ecosystem has emerged, and research is being promoted to emphasize the importance of such services by evaluating them in monetary value. Jiang et al. [
1] analyzed ecosystem service values (ESV) based on the literature on such ESVs over 20 years and also showed spatial changes. These are the rich and diverse services that paddy wetlands provide to both the natural world and human welfare. The benefits were comprehensively demonstrated. Yu et al. [
2] analyzed ecosystem service areas for rice fields, agricultural lands, forests, grasslands, water, settlements, and unused lands. Rice paddy wetlands are particularly responsible for supply services and hydrological and gas regulation. Regulating services such as maintenance of nutrient cycles were evaluated as high.
In the Economics of Ecosystems and Biodiversity (TEEB) approach, three primary categories are commonly employed to quantify Ecosystem Service Values (ESVs) in monetary terms [
3,
4]: the direct market method, equivalent factor method, and replacement costs method [
5]. The economic value assessment of the ecosystem services of environmental goods, such as the ecosystem services of rice paddy wetlands, mainly uses market methods, revealed preference methods, stated preference methods, and simulated market analysis methods. The market method usually estimates the value of environmental goods by using the prices traded in the market. However, markets exist only in very limited ecosystem services. None of the analysis approaches can fully capture the value of ecosystems, including rice paddy wetlands. This study evaluated the ecosystem service value of rice paddy wetlands based on the virtual valuation method in order to raise awareness of the importance of rice paddy wetlands and provide basic data and implications for rice paddy wetland management. To this end, we conducted a survey targeting 1000 South Korean citizens on rice paddy wetlands as environmental goods and estimated the monetary value of the ecosystem services of Korean rice paddy wetlands.
2. Literature Review
There are various wetlands around the world. Major wetlands include rice paddy wetlands, riparian wetlands, coastal wetlands, freshwater wetlands, alpine wetlands, peatlands, lakes and reservoirs, swamps, bog pools, and artificial wetlands. Research on the value of wetlands has been conducted to determine the value of the ecosystem services provided by wetlands. Grazie and Gill [
6] promoted research and analysis on ecosystem services related to wetlands and showed that related research has been rapidly increasing since the 2010s. As the case analysis research on wetland value increases, meta-analyses of various research cases are also emerging. De Groot et al. [
2] conducted a meta-analysis using monetized values derived from more than 300 case studies. The annual value per unit area of inland wetlands was highest for regulating services at 17,364 USD, followed by cultural services at 4203 USD, habitat services at 2455 USD, and provisional services at 1659 USD. Brander et al. [
7] estimated the economic value of wetland ecosystem services in agricultural landscapes through meta-analysis, focusing especially on three functions: flood control, water supply, and water purification. The result shows that the flood control function was estimated to have an annual average value of 6923 USD/ha, the water supply function to have an annual average value of 3389 USD/ha, and the water purification function to have an annual average value of 5788 USD/ha. The total value of the three main functions of wetlands worldwide has been estimated to be more than 26 billion USD per year. In addition, there is great variation in the value of wetlands by region around the world and wetlands in West Africa have been confirmed to be particularly valuable, valued at approximately 4.5 billion USD.
However, while previous research mainly focuses on coastal wetlands, palustrine wetlands, riverine wetlands, and several other types of wetlands, relatively little research has been performed on paddy wetlands. Among the few studies, Kim et al. [
8] summarized the multifaceted functions of rice fields and irrigation water and discussed their economic values. Flood control in rice paddy wetlands, groundwater recovery, water purification, soil erosion control, air purification and climate change mitigation, biodiversity preservation, and leisure and comfort were presented as positive effects of rice paddy farming. On the other hand, methane gas emissions, ecosystem disturbance and extinction, excessive use of fertilizers and pesticides, and excessive use of surface water and groundwater were pointed out as negative effects of rice paddy farming. Issues discussed include the economic value of pluralistic functions and the results of existing domestic empirical studies using non-market valuation methodologies such as the contingent valuation method (CVM), travel cost method (TCM), and contingent ranking method (CRM). The value of positive externalities varies from study to study but is summarized as being in the range of 3.4 to 16.7 billion USD (as of 2005).
Liu et al. [
9] quantified the external economic value generated by rice paddies in Taiwan by applying the replacement cost method to investigate the spatial and temporal changes in the multifunctionality and benefits of rice paddies. In addition, compensating variation was used to evaluate the appropriate level of green subsidies for rice fields. The multi-functional benefits of rice paddies gradually decreased between 1999 and 2007, and the cause of this decrease in value was mainly attributed to the sharp decrease in the area for planting rice. In addition, a reasonable green subsidy for rice fields across Taiwan was estimated at 21,000 NTD/ha.
Meanwhile, paddy field dams that utilize the storage function of rice paddies are being implemented in many prefectures of Japan, and they were found to be especially important as a means of preventing/alleviating flooding. Oishi et al. [
10] conducted a survey in Nara Prefecture, Japan, to estimate the economic value of these rice field dams using a virtual valuation method. Economic value was estimated based on the responses of 943 households to a double-bounded dichotomous choice questionnaire. Specifically, willingness to pay (WTP) was estimated assuming a log-logistic distribution. The average annual WTP per household was estimated to be 3600 to 5600 YEN, and the median was estimated to be 2200 to 3000 YEN (about 14.5 to 20 USD).
Ecosystem service research on wetlands is gradually expanding based on the monetary value of wetlands, and so is an approach that combines spatial analysis with the spatial distribution of ESVs by ecosystem type based on land use maps, including wetlands [
2,
11]).
3. Methods
3.1. Survey Analysis
In order to determine the monetary value of rice paddy wetland ecosystem services, this study asked, with a questionnaire, the amount each individual was willing to pay. We asked 1000 people nationwide through an online survey process, and the effective number of respondents was 988, limiting responses to those under 70 years of age. The survey was conducted in December 2019, right before the outbreak of COVID-19, so issues of specificity due to COVID-19 could be avoided. The questionnaire first explained the ecosystem services provided by rice paddy wetlands and asked about the amount they are willing to pay to preserve the ecosystem services of paddy wetlands. It also contained items on the respondents’ personal characteristics. The basic survey structure is as shown in
Table 1.
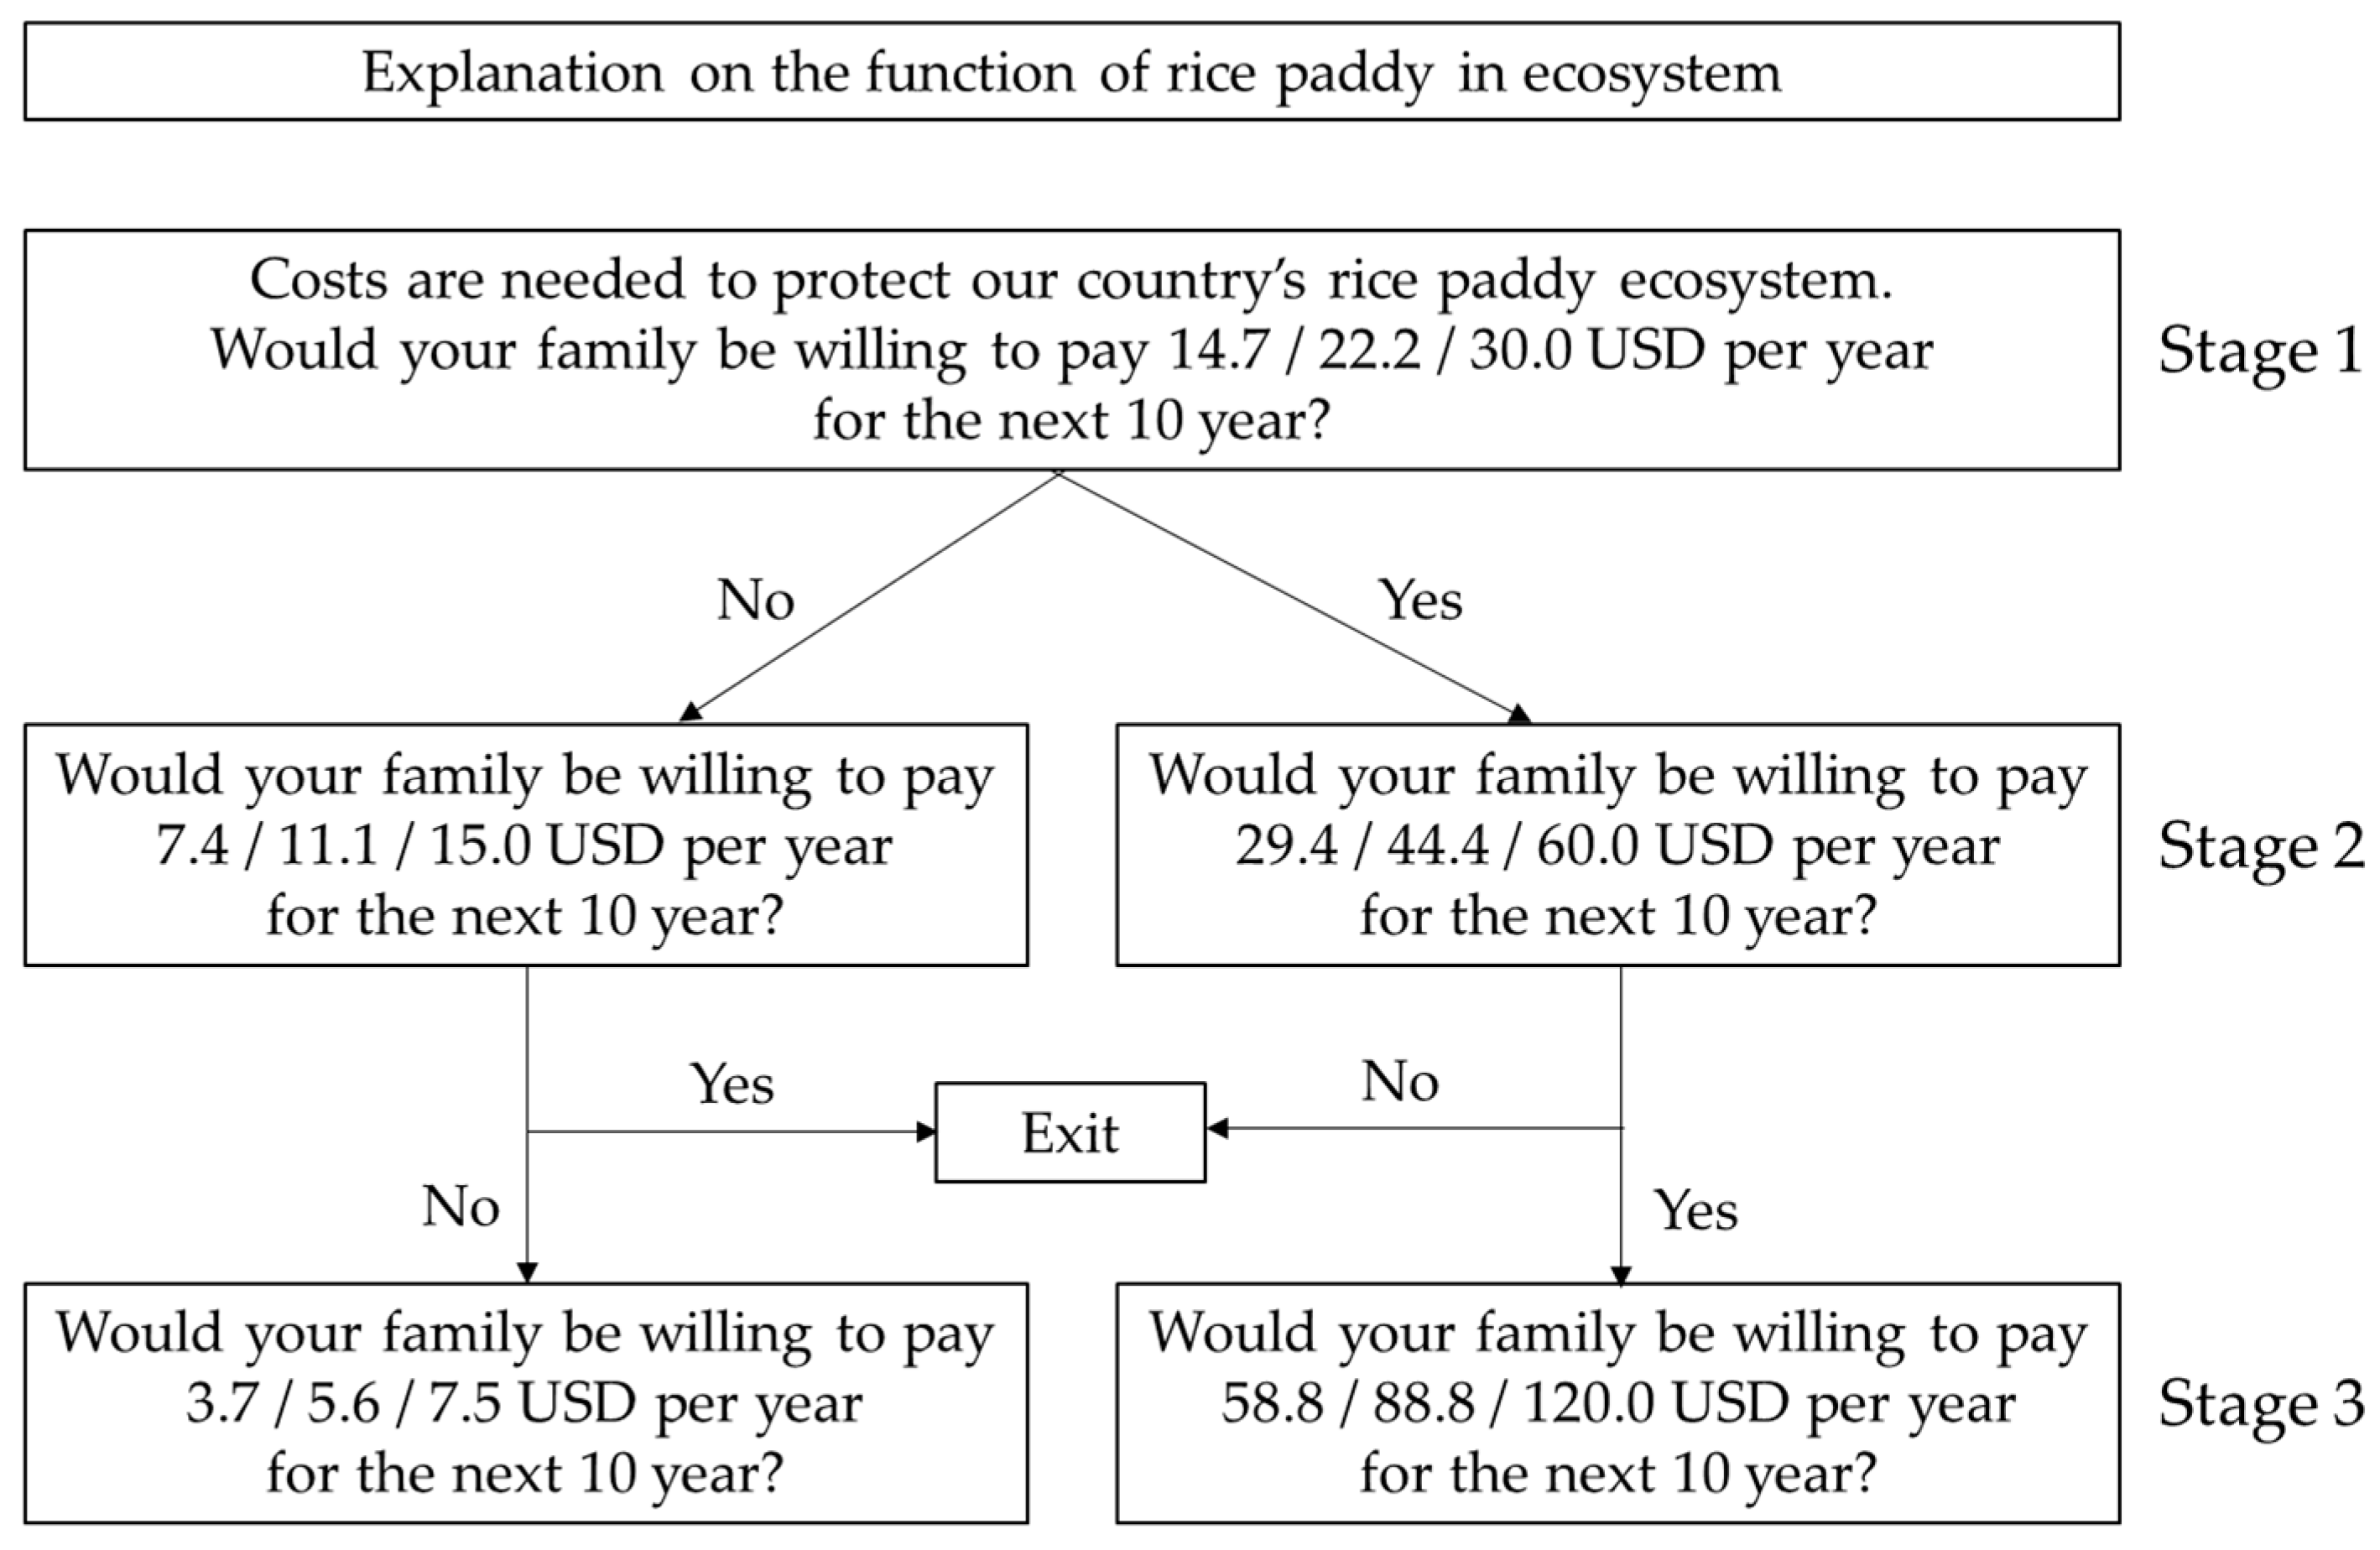
The questionnaire adopted the double-bounded dichotomous choice method. In stage 1, the respondents are asked if they are willing to pay a specific amount annually for rice paddy preservation. Then, in stage 2, depending on their answer in stage 1, they were asked if they would be willing to pay twice or half the amount suggested in stage 1. In stage 3, depending on their answer in stage 2, they were asked if they would be willing to pay twice or half the amount suggested in stage 2. Those who consecutively answered ‘Yes’ or ‘No’ were included in the study and those who did not were excluded (see
Figure 1). There is no set number of times for this process, but the maximum number of questions asked in this study was three.
There is an advantage in securing a sufficient sample size by asking the question three times, but there is a possibility of bias in the results because repeated questions have the potential for strategic responses [
12]. In order to solve this problem to a certain extent, an additional open-ended question is asked to directly answer the amount of money they are willing to pay for preserving paddy ecosystem services, followed by an open-ended model, double-bounded dichotomous choice, and pseudo referendum using only the first question. The models were compared and analyzed. In addition, based on a preliminary survey, this study investigated the initial bidding amounts by categorizing them into three groups: 20,000 KRW (14.7 USD) for 300 surveyees, 30,000 KRW (22.2 USD) for 400 surveyees, and 40,000 KRW (30 USD) for 300 surveyees. The amount presented in this study is the annual payment amount to be paid over the next 10 years, and the monthly payment conversion amount is also presented in parentheses.
The total number of samples for double-bounded dichotomous choice is 2529, and although it is stated in detail that 988 respondents are asked three times, the reason why the sample size is not 2964 is that if the response pattern changes in the amount presented in stage 2, it is necessary to proceed to stage 3. This is because the question related to WTP was completed with the second question. In other words, if they answer ‘Yes’ in the first stage, an amount twice as large as the one in the first stage will be offered, and if you also answer ‘Yes’ here, in stage 3, an amount four times larger than the one in stage 1 will be presented. However, if the answer is ‘No’ in stage 2, the amount is halved again, becoming the same as the amount in stage 1, and the range of the respondent’s WTP is already limited by the response in stage 2, so questioning is not continued. Likewise, if they answer ‘No’ in stage 1 and ‘Yes’ in stage 2, they will not proceed to stage 3, and the questions about WTP will end.
Personal characteristic variables that can be included in the model’s estimation equation include questions about gender, age, education level, income, residential area, number of household members, full-time housewife status, student status, and unemployed status. In the later estimation equation, gender was set as a dummy variable, and male was set to 1. Education level was also set as a dummy variable, with college graduates or higher set to 1. Income refers to monthly income and is presented as a section, so when converting it to a variable in the actual analysis, the median of the section was applied. However, the minimum section (less than 1 million KRW was set at 500,000 KRW, and the maximum section (over 10 million KRW) was set at 13 million KRW. The residential area was used as a dummy variable in the estimation equation, and two types of variables, a dummy for whether it was a metropolitan area (Seoul, Gyeonggi, Incheon), used in the initial estimation equation to determine whether to include it in the final estimation equation. Among personal characteristics, occupation is quite broad, so for use in the estimation equation, only three variables were used: student dummy, full-time housewife dummy, and unemployed dummy.
3.2. Establishment of Probability Utility Model and Derivation of Willingness to Pay Amount
The random utility model designed by McFadden [
13] is generally used in the estimation of the WTP amount using the survey results of the voting model. The probability utility model shows how the discrete choice model fits the economic theory of utility maximization of individual decision choices. Choosing one of the options is interpreted as giving greater utility than the other options. In this context, the act of responding to a CVM survey can also be interpreted as a process of maximizing one’s utility. Since the response options in a CVM survey are discrete (‘Yes’ or ‘No’), the logit model can be used among quantitative analysis techniques.
For the convenience of discussion, let us consider a referendum model in which the selection options are ‘Yes’ and ‘No’, like the survey in our study. If the ith (
) respondent accepts the offered amount (subscript 1), the utility function (
) is the part determined by observable factors such as environment-related characteristics and social and demographic characteristics (
) and a part (
) determined by unobservable stochastic factors. And the observable part consists of the respondent’s personal attributes (
), which are observed variables, and the cost of the choice option presented to the ith respondent (
). On the other hand, if the respondent does not accept the amount (subscript 0), the cost of the utility function (
) is excluded. The case where the respondent accepts the offered amount can be expressed in a formula as follows:
where
.
At this time, assuming that the random variable
follows a Type I extreme value distribution, the probability that each respondent accepts or rejects the amount proposed at the kth stage in the probability utility model (
,
) is expressed as follows.
Then, the likelihood function (
) for the first response of all survey respondents is organized as follows.
where
is a decision dummy; if the ith respondent chose ‘Yes’ in the 1st stage CVM question, then
otherwise
.
In a similar way, the likelihood functions (
) for responses in steps 2 and 3 can also be obtained, and the likelihood functions (
) for responses in all steps can be used to calculate maximum likelihood estimation (MLE). By applying MLE, we estimate the parameters (
,
,
) we want to find. And the average WTP of respondents is expressed in a simple formula as follows.
where
,
,
are estimated coefficients and
is average characteristics corresponding to the parameters.
In this study, we basically apply the double-bounded dichotomous choice method, as explained in the survey design earlier. Although this method is efficient in that it can obtain more data than a single-bounded dichotomous choice, there is a possibility of convenience, such as strategic responses by respondents. There is a limit to the ability to increase further, so to compensate for this, three models were applied to estimate the parameters needed to calculate WTP. The first is a typical double-bounded dichotomous choice model, which pools all respondents’ multiple responses into individual responses and estimates the coefficients using a logit model (Model 1). The next method is to classify respondents’ multiple responses by respondent, create panel data, and estimate coefficients using the panel logit model (Model 2). Compared to Model 1, this method is expected to reflect better the survey response results given by the respondents because it analyzes 2 to 3 responses per person separately for each person. Lastly, the pseudo referendum model mentioned earlier is a method of estimating coefficients using logit by constructing data based on only the responses to the first stage of the double-bounded dichotomous choice questions (Model 3). By doing this, data of the same form as the single-bounded dichotomous choice is constructed, and the nature of the response is expected to be similar to single-bounded dichotomous choice.
The biggest advantage of single-bounded dichotomous choice is that it can minimize the respondent’s strategic convenience. However, as the survey is conducted online, one question must be answered before moving on to the next question. When answering the first question of a double-bounded dichotomous choice, the respondents do not know whether the second question will be asked, and as a result, from the respondent’s perspective, it can be assumed that the conditions for answering the suggested amount in stage 1 will be quite similar to those for answering the single-bounded dichotomous choice survey. In light of this, although it is not a complete single-bounded dichotomous choice, it is believed that similar effects can be expected, and this study calls it the pseudo-referendum model.
As such, each model has both advantages and disadvantages. In this study, we employ all three econometric and open-ended question models and subsequently compare the results derived from each model. Through this process, we examine how well the quantitative analysis results of this study align with the theoretical characteristics of CVM quantitative analysis. Ultimately, our goal is to determine which model result is closest to capturing actual preferences.
Additionally, this study’s empirical analysis models (Models 1, 2, and 3) estimate two estimation equations depending on the configuration of variables for each model. First, when estimating an estimating equation including all of the individual characteristic variables obtained from the survey, the estimating equation was re-constructed only with statistically significant variables and the logit model was run. ‘−1’ is added after each model number (i.e., 1–1, 2–1, and 3–1). Basically, the individual characteristic variables obtained from the survey include gender, age, education level, income, residential area, number of household members, full-time housewife, student, and unemployed status. However, as a result of running a model including all of these variables, statistically significant variables were different for each model, and this can be confirmed through the results in the next chapter. The second is to exclude all personal characteristic variables and estimate only the coefficient and constant term of the bid amount using only the bid amount (offered amount) as a variable. Each model was differentiated by adding ‘−2’ after each model (i.e., 1–2, 2–2, and 3–2). This is a commonly used method in CVM. In this case, WTP is simplified to .
4. Results of Rice Paddy Ecosystem Service Value Analysis
Results of the Survey
A total of 988 respondents participated in the CVM survey used in this study, and the basic statistics for the respondents are summarized in
Table 2 below. Meanwhile, in the logit model, every single response from respondents becomes an observation, and each respondent responds from 2 to a maximum of 3 times, making a total of 2529 observations (435 respondents exited after stage 2, and 553 respondents progressed to stage 3 (2529 = 435 × 2 + 553 × 3)).
The distribution of responses to the double-bounded dichotomous choice question is shown in
Table 3. As mentioned above, depending on the responses in stage 1, in stage 2, half or twice the amount of that in stage 1 was offered and asked to answer again, and all 988 people responded. And in stage 3, responses in stages 1 and 2 were in the same direction. Only 553 people proceeded to the third stage of the question, as it was conducted only in cases where the answer was (Yes—Yes or No—No).
When all personal characteristic variables are included in the estimation equation in Models 1, 2, and 3 and logit is run, the statistically significant variables are different for each model, as can be seen in
Table 4. In Models 1 and 2, only the education dummy was statistically significant, but in Model 3, gender, number of family members, and whether or not the person was a full-time housewife were significant variables. The signs of statistically significant variables in each model seem generally reasonable. In theory, as the bid amount increases, the income decreases, and the utility function decreases. Therefore, the coefficient of the bid amount should be negative, which is the most basic characteristic showing that the analysis results are in line with economic rationality. It can be said that the negative coefficient of the gender dummy shows that women are more willing to pay to maintain the rice paddy ecosystem than men. It is consistent with the results of previous studies that show gender differences in environmental value [
14,
15,
16].
The result that the coefficient of the full-time housewife dummy is negative does not conflict with the fact that ‘women are willing to pay more.’ It seems natural to interpret whether a person is a full-time housewife in relation to the housewife’s economic power rather than the housewife’s gender. In other words, this means that full-time housewives are relatively less willing to pay for rice paddy ecosystem services than those engaged in economic activities. Judging from the size of the coefficient, the WTP is due to not the effect of gender but the effect of roles. The negative coefficient for education level implies that groups with a high level of education place less value on the rice paddy ecosystem. In Kim & Lee [
17], although the target is different, the same negative coefficient was observed, which means that the level of education may not match the level of environmental education and that people with a high level of education are, on average, more interested in other fields than in the environment.
The finding that the coefficient for the number of household members is positive seems to indicate that the more children there are, the more value is placed on environmental issues in consideration of future generations. In addition, the coefficient for the bid amount was quite similar when individual characteristic variables were included in each model and when factors other than the bid amount were implicitly estimated through the constant term. This means that the estimated WTPs are quite robust.
The estimation results of the average annual WTP per household for each model are intuitively judged to support the CVM theory well. First, the average annual WTP per household ranged from 45,740 to 97,733 KRW (39.6 to 84.5 USD with the exchange rate as of the year 2019), depending on the model. Since payments are assumed to be spread over 10 years, the present value of the total WTP per household over 10 years, with a 4.5% social discount rate, ranges from 327 to 699 USD (
Table 5). The social discount rate of 4.5% was used here because this figure is officially used in South Korea when conducting cost–benefit analyses of national projects. Among the double-bounded models, pooled logit shows that it does not sufficiently control the respondent’s convenience due to repeated questions. This is because the WTP was approximately 1.9 times greater than the pseudo-referendum model, in which this bias is expected to be best controlled, and is similar to the average WTP in the open-ended question, in which the bias is expected to be most reflected, but estimated to be approximately 11% lower than that. The average WTP in the open-ended question was more than 2.1 times greater than the WTP in the pseudo-referendum model, reaffirming that the difference in WTP can be significant if the respondent’s strategic bias is not controlled.
On the other hand, even in the double-bounded model, when the responses are separated by individuals and analyzed as panel data without pooling, the difference from the pseudo-referendum model is only 6%, showing that the respondent’s convenience is better controlled than the pooled model. This difference is believed to be due to the fact that more information can be utilized by distinguishing between responses made several times by an individual. However, it was still larger than the pseudo-referendum model. Considering this, the results of Models 2 and 3 are expected to be closer to reality than those of Model 1 and the open–question model. Therefore, it would be a more reasonable interpretation to view the total WTP per household as 327 to 347 USD. At the time of the survey in 2019, there were approximately 20.3 million households in South Korea [
18]. When the survey results are extrapolated nationally, the total WTP of households across the country amounts to 6.7 to 7.1 billion USD.
Meanwhile, if we look at the distribution ratio of respondents’ WTP by function in the survey on the distribution of WTP by rice paddy wetland ecosystem service function, it is possible to determine how much more respondents are willing to pay on average for each rice paddy wetland function (
Table 6). In the survey, the four main functions of rice paddy wetland ecosystem services were introduced, and we asked how each person wanted their WTP to be distributed to each function. The four functions were biodiversity preservation, food supply, traditional/recreational/cultural service, and control, such as natural disaster buffering and pollution purification. During the survey process, people responded by allocating percentages to each function. It was okay to allocate 0% to a specific function. The sum of the distribution percentages for each of the four functions must satisfy 100%, and if the sum of the distribution percentages was not 100%, it was converted proportionally.
When the people who did not respond were excluded, the average distribution rate by function for a total of 971 samples was 27.2% for biodiversity, 33.8% for food supply, 14.8% for cultural services, and 24.2% for disaster and pollution control. The agricultural functions were considered the most important. On the other hand, the cultural service function was the least important. However, combining the response distribution rate and individual WTP and converting it into WTP by function is a controversial approach due to the possibility of an ‘adding-up problem’ [
19,
20], so it was not calculated separately in this study. If the entire environmental good consists of multiple components, the ‘adding-up problem’ arises where the WTP for the entire good is not equal to the sum of the WTP for each part. Some studies, like Whitehead [
21], show that CVM survey data passes the adding-up test, while other studies, like Desvousges et al. [
22], show opposite results. The debate on the adding-up test proposed by Diamond [
23] continues.
5. Discussion and Conclusions
This study used the CVM to evaluate the monetary value of rice paddy wetlands based on the results of a survey related to rice paddy wetland ecosystem services to estimate the ecosystem service value of rice paddy wetlands. The results show that the present value of the total WTP per household to preserve rice paddy ecosystem services ranges from 327 to 699 USD in the four models. According to Johnston et al. [
12], the single-bounded (referendum) model is more recommendable. Therefore, we posit that Model 3 (pseudo referendum model) is more fitting for capturing real preference (the estimated WTP: 327 USD) than the other three models. In this context, the overestimation problems of the open-ended question model (the estimated WTP: 699 USD) and the double-bounded model (the estimated WTP: 619 USD) were confirmed again, which were theoretically addressed during the analysis process and empirically tested through the pseudo referendum model. In addition, the empirical comparative analysis shows that it may be freer from convenience to construct and analyze double-bounded dichotomous choice data by constructing a panel (the estimated WTP: 347 USD) rather than pooling and analyzing it. Consequently, the most plausible estimates are judged to be the results of Models 2 and 3 (327~347 USD). For the entire country, the households in South Korea are calculated to have a WTP ranging from 6.7 to 7.1 billion USD, which is consistent with the results of Kim et al. [
8].
This study also shows some findings about the relationship between households’ WTP and their characteristics. Based on the results of Model 3, three household attributes are statistically significant. First, a gender difference in the WTP to preserve rice paddies is observed, with women tending to exhibit higher WTP than men. Secondly, the increase in the number of family members is associated with higher WTP, suggesting that households with children are more inclined to value the ecosystem of rice paddies. Thirdly, housewives show a lower WTP, implying that economic independence may influence WTP.
Meanwhile, the functions of rice paddy wetlands were broadly divided into four categories: biodiversity enhancement, food supply, cultural services, and disaster and pollution control. The level of distribution of WTP for each function was evaluated in the following order: food supply, biodiversity, disaster and pollution control, and cultural services. While allocations to food supply, biodiversity, natural disaster, and pollution control functions did not show significant differences, allocations to cultural services were relatively close to half. Although there are analytical limitations due to the simultaneous application of several models in one survey based on stated preferences, policymakers need to refer to the ecosystem service value of rice paddy wetlands implied in the estimation results.
Due to the limitations of the analysis model, both theoretical and practical, it is important to be cautious about accepting the estimation results of the WTP amount based on statements as the true WTP of individuals. In reality, the respondents may not pay as stated. In the survey, we cannot rule out the possibility that respondents choose the amount they think they would have to pay based on their values or social norms rather than the amount they would likely pay in actual situations. Nevertheless, in order to analyze costs and benefits in the policy implementation process, it is necessary to estimate the ecosystem service value of rice paddy wetlands, one of non-market goods, by any means. For this reason, CVM continues to be used despite its fundamental limitations and is recognized as the most representative means to evaluate the value of environmental goods.
From this perspective, it can be concluded that the analysis process used to estimate the ecological value of rice paddies in this paper sufficiently ensures procedural validity. Particularly, considering the possibility of overestimation, it is meaningful for policymakers to conservatively refer to the lowest value among the estimates in this study as the value of rice paddy ecosystem services in the process of policy implementation. The estimated value of the rice paddy ecosystem in this study (327 ~ 347 USD per household) can serve as a benchmark for determining the appropriate level of financial resources the government should invest in conserving the area or the degree to which policies should be actively established. Additionally, the proportion of WTP for each major function of paddy wetland ecosystem services, as shown in this study, can also serve as a reference for policymaking.
This information is valuable when prioritizing functions of paddy fields or determining the allocation ratio of financial resources for future policy design related to paddy wetlands. For example, the size of South Korea’s direct agricultural payments to paddy crops is projected to increase to 5 trillion KRW (3.8 billion USD) in 2023. This scale constitutes more than half of the total WTP estimated in this study and can be considered somewhat excessive, given the WTP distribution ratio by function in this study (33.8%). On the other hand, the subsidy directly related to biodiversity, which is less than 1/10 of the direct payment budget, appears relatively small when we consider the estimated total WTP (6.7~7.1 billion USD) and the WTP distribution ratio for biodiversity (27.2%) in this study. He et al.’s [
24] study on the factors influencing rice farmers’ WTP can be utilized in policy development, such as ecological compensation. Therefore, this study suggests that more active investment and support for rice paddy wetland biodiversity are needed to respond to the policy demands of the people.
As the impacts of climate change grow, the ecosystem function as a nature-based solution is attracting attention. Adaptation to climate change based on the climate buffering function of the ecosystem is becoming important, along with the preservation and expansion of ecosystems such as forests, agricultural lands, and wetlands as greenhouse gas sinks. These ecosystems need to be promoted to receive the ecosystem services they provide to respond to climate change.
However, in South Korea, agricultural lands, especially rice paddy wetlands, are continuously decreasing due to development and urbanization. In addition, changes in eating habits are reducing the demand for raw rice, leading to changes in the fallow land use for rice paddies. According to Statistics Korea [
25], the rice paddies, which were 1276 thousand ha in 1975, are continuously decreasing to 1149.04 thousand ha in 2000, 984.14 thousand ha in 2010, and 824 thousand ha in 2020. In 2022, the rice paddy field area is 776 thousand ha; about 39.2% of the 1975 rice paddy area has disappeared.
This phenomenon has the potential to exacerbate climate change, alter the food import situation, and may consequently impact future rice supply. Wetlands, particularly rice paddies, offer significant advantages for climate change adaptation through their natural disaster buffering functions. Hence, it is crucial to conserve wetlands and advocate for their ecosystem services
The decline of wetlands is not confined to South Korea; it is a global issue, observed in many nations where rapid development and land use changes driven by population growth are occurring. Lately, countries like North Korea, which have suffered from the loss of agricultural fields including wetlands, are endeavoring to establish agricultural fields to address food shortages.
These research results will be helpful in promoting the value of rice field wetlands and developing policies to utilize rice field wetlands sustainably. In the future, more research should be promoted to identify the ecosystem services provided by rice paddy wetlands and to understand their values in detail. Rice paddy wetland ecosystems not only contribute to food production but also provide various ecosystem services to humans. The decline of rice paddy wetlands will result in a reduction of various ecosystem services, leading to an acceleration of reduced capacity for climate change adaptation and an increase in climate change vulnerability. Additional analyses on the valuation of rice paddy wetlands based on various monetary valuation methods should be conducted in order to assist related decision-making. Research on the value of rice paddy wetlands, such as WTP for wetland conservation, should be the foundation for policy development and implementation for the conservation of rice paddy wetlands.


