Article

Comparative Screening Study on the Adsorption of Aqueous Pb(II) Using Different Metabolically Inhibited Bacterial Cultures from Industry

1
Department of Chemical Engineering, University of Pretoria, Pretoria 0002, South Africa
2
Bemical CC, Johannesburg 2000, South Africa
3
Td Lab Sustainable Mineral Resources, University for Continuing Education Krems, Dr.-Karl-Dorrek-Straße 30, 3500 Krems, Austria
*
Author to whom correspondence should be addressed.
Water 2023, 15(24), 4259; https://doi.org/10.3390/w15244259
Submission received: 20 November 2023 / Revised: 5 December 2023 / Accepted: 11 December 2023 / Published: 12 December 2023

Abstract

:
The global concern about the water pollution caused by heavy metals necessitates effective water treatment methods. Adsorption, with its substantial advantages, stands out as a promising approach. This study delves into the efficiency of Pb(II) removal using metabolically inhibited microbial cultures. These cultures encompass waste-activated sewage sludge (SS), industrially sourced bioremediation microbes (commercial 1—C1 and commercial 2—C2), an industrially acquired Pb(II) remediating consortium (Cons), and refined strains (derived from Cons) of Paraclostridium bifermentans (PB) and Klebsiella pneumoniae (KP). Our findings reveal maximum Pb(II) adsorption capacities of 141.2 mg/g (SS), 208.5 mg/g (C1), 193.8 mg/g (C2), 220.4 mg/g (Cons), 153.2 mg/g (PB), and 217.7 mg/g (KP). The adsorption kinetics adhere to a two-phase pseudo-first-order model, indicative of distinct fast and slow adsorption rates. Equilibrium isotherms align well with the two-surface Langmuir model, implying varied adsorption sites with differing energies. The Crank mass transfer model highlights external mass transfer as the primary mechanism for Pb(II) removal. Surface interactions between sulfur (S) and lead (Pb) point to the formation of robust surface complexes. FTIR analysis detects diverse functional groups on the adsorbents’ surfaces, while BET analyses reveal non-porous agglomerates with a minimal internal surface area. The Pb(II) recovery rates are notable, with values of 72.4% (SS), 68.6% (C1), 69.7% (C2), 69.6% (Cons), 61.0% (PB), and 72.4% (KP), underscoring the potential of these cost-effective adsorbents for treating Pb(II)-contaminated aqueous streams and contributing to enhanced pollution control measures. Nevertheless, optimization studies are imperative to evaluate the optimal operational conditions and extend the application to adsorb diverse environmental contaminants.

1. Introduction

Lead is a ubiquitous pollutant in the environment; however, an increased amount in our environment can be attributed to human activities, including burning fossil fuels, mining, and manufacturing [1]. The most hazardous form of lead pollution is in the ionic or aqueous form, i.e., Pb(II) [2].
Lead is one of a limited class of elements that can be described as purely toxic [1]. The health risks associated with Pb(II) include, but are not limited to, kidney damage; a decreased IQ, memory score and capacity and learning ability; and other cognitive declines [3,4,5]. Also, due to the decrease in global lead reserves, lead recovery from wastewater streams is of ultimate importance as it offers an economic incentive [6].
Contemporary methods for treating wastewater, including membrane filtration, chemical precipitation, ion exchange, and electrodialysis, are utilized to mitigate lead pollution in waste streams by transforming Pb(II) ions into a less detrimental form. However, an additional treatment is necessary for the recovery of Pb(0) [2]. Moreover, numerous of these methods face constraints such as low efficacy and elevated operational expenses [7]. In contrast, adsorption has showcased numerous advantages compared to conventional approaches, including heightened efficiency, reduced production of chemical and biological sludge, regeneration of adsorbents, cost-effectiveness, and the potential for metal recovery [8].
Bacterial strains have found extensive application in effectively carrying out various biotechnological processes, including the elimination of organic and inorganic pollutants from both the soil and water [9]. Their ability to withstand harsh environmental conditions and resist metals contributes to their success in these applications [9]. Certain bacterial strains have shown notable efficacy in bioremediation efforts focused on extracting potentially harmful elements like Pb(II) and Cd(II) from polluted sites [10,11].
This research is a comparative screening study that investigated the bioremediation removal effectiveness of Pb(II) using six different microbially derived dried biosorbents: three waste-activated sludge related biosorbents (industrially obtained waste-activated sludge—SS—and industrially supplied consortia: commercial 1 and 2—C1 and C2) and three Pb(II) resistant microbial cultures (an industrially obtained consortium [2]—Cons—and two microbial strains purified from the microbial consortium: Klebsiella pneumonia—KP—and Paraclostridium bifermentans [12]—PB). The bio-removal approach presented here could represent the initial phase in developing a continuous reactor suitable for widespread adoption in diverse industries. It offers a straightforward and cost-effective means to remediate and regenerate effluents containing lead (Pb).

2. Materials and Methods

2.1. Microbial Culture

The waste-activated sludge (SS) was obtained from the active sludge pond at the Daspoort Wastewater Treatment Plant in Pretoria, South Africa (25.7395° S, 28.1640° E). The commercially sourced industrial bioremediation microbes (C1 and C2) were obtained from Bemical CC, Johannesburg, South Africa. These (SS, C1, C2) bacteria were cultivated by dosing 0.5 mL of the microbes into 100 mL of clarified sewage collected from the Daspoort Wastewater Treatment Plant.
The preparation of the consortium (Cons) is described by Van Veenhuyzen et al. [2]. Klebsiella pneumoniae (KP) and Paraclostridium bifermentans (PB) were identified using 16S rDNA sequencing as microbial strains present in Cons and were found likely to be the main organisms responsible for the bioprecipitation of lead [12]. The preparation of PB and KP is described by Neveling et al. [13].
All cultures (SS, C1, C2, Cons, PB, and KP) underwent centrifugation at 9000 rpm for 10 min at 4 °C. Afterward, they were washed with ultrapure water, subjected to another round of centrifugation, and subsequently oven-dried at 74 °C for 24 h [14]. This process effectively suppressed metabolic activity, ensuring that Pb(II) removal occurred solely via adsorption.

2.2. Metabolic Activity Measurement

Metabolic activity measurements were conducted using the yellow dye 3-(4,5-dimethylthiazol-2-yl)-2,5-diphenyl tetrazolium bromide (MTT), which is reduced into formazan crystals by the action of the nicotinamide adenine dinucleotide phosphate (NADPH)-dependent cellular oxidoreductase in the metabolically active cells. The formazan is subsequently extracted by the organic solvent dimethyl sulfoxide (DMSO) and spectrophotometrically analyzed at a wavelength of 550 nm (Sigma-Aldrich, St. Louis, MO, USA) [12]. After one hour of incubation, dimethyl sulfoxide was introduced into the solution to dissolve the formazan crystals [2]. A spectrophotometer was employed to assess the light absorption at 550 nm for both the unfiltered and filtered samples, allowing for the deduction of variances in metabolic activity [15].

2.3. Lead Removal Experiments

Sterilized reactors comprising 100 mL of ultrapure water were prepared using 1 mL of a 1.711 M N a N O 3 salt substitute, along with the oven-dried and sterilized bacteria, with an added 100 ppm of Pb(II). This concentration serves as the baseline for comparison with other microbial strains within the consortium. The replication of the reactor was conducted three times to ensure reproducibility, and the investigation into Pb(II) removal spanned a 14 h duration.
The samples from the reactors were collected at different time intervals, filtered through a 0.45 µm filter, and subjected to initial and final pH measurements. The Pb(II) concentration in these samples was determined using atomic absorption spectroscopy (PerkinElmer AAnalyst 400, Waltham, MA, USA).
The mass of aqueous lead adsorbed onto the adsorbents was computed using Equation (1):
q t = C o C f V W
Here, q t represents the mass of adsorbed Pb(II) in milligrams per gram (mg/g). The initial and final concentrations of Pb(II) are denoted as C o and C f , respectively, measured in milligrams per liter (mg/L). V stands for the volume of the solution in liters, while W represents the dry mass of the adsorbent in grams.

2.4. Adsorption Kinetics

The sampled adsorptions were fit to pseudo-first-order, two-phase pseudo-first-order, and pseudo-second-order isotherms as described in Equation (2) [16], Equation (3) [17], and Equation (4) [16], respectively. PercentFast as mathematically expressed in Equation (5) is the ratio of the rate at which Pb(II) adsorbed fast or slowly to the newly created adsorption interface, expressed as a percentage.
Q t = Q e 1 e x p ( k 1 t )
Q t = Q e ,   f a s t 1 e x p ( k 1 , f a s t t ) + Q e , s l o w 1 e x p ( k 1 ,   s l o w t )
Q t = Q e 2 k 2 t 1 + Q e k 2 t
PercentFast = Q e ( f a s t / s l o w ) Q t × 100
where Q e is the value of Pb(II) adsorbed at equilibrium in mg/g, t is the time in min, k 1 and k 2 are the rate constants in 1/min and g/(mg min) for the pseudo-first- and pseudo-second-order, respectively. The sum of Q e ,   f a s t and Q e ,   s l o w in Equation (3) gives the overall equilibrium adsorption capacity.

2.5. Diffusion Model of Crank

Crank’s diffusion model is based on Fick’s second law. Largitte and Pasquier [18] described the internal mass transfer as Equation (6).
δ Q δ t = D e r 2 δ δ r r 2 δ Q δ r
where D e is the effective adsorbate diffusivity in m2/s. The effective adsorbate diffusivity, D e , can be calculated from Equation (7) using the integrated solution of Equation (6) given by Boyd et al. [19], as shown in Equation (7).
Q Q e = 1 6 π 2 n = 1 1 n 2 e x p D e π 2 n 2 t r 2

2.6. Adsorption Equilibrium Experiments

To determine the equilibrium behavior of the adsorbents, batch adsorption experiments were conducted. Serum bottles, each containing 1.352 g/L of adsorbate, were prepared with 100 mL of Pb(II) solution, with concentrations varying from 0 to 600 mg/L Pb, and sealed with rubber stoppers. These bottles were agitated using a water bath shaker (Labotec EcoBath Model 207, Labotec, Midrand, South Africa) at a constant speed of 120 rpm and maintained at temperatures of 25 °C, 35 °C, and 45 °C. The pH and lead concentrations were measured well after reaching equilibrium (24 h) using atomic absorbance spectrophotometry (PerkinElmer, Waltham, MA, USA).
The Langmuir isotherm model, introduced by Langmuir in 1918, relies on the equilibrium between the adsorption and desorption kinetics [20]. According to this model, the adsorption energy remains constant across all surface sites and is independent of the surface coverage. This suggests a homogenous adsorption surface, where the adsorbate is taken up at specific, localized sites, with each site capable of accommodating only one adsorbent species. Consequently, the model implies that surface adsorption is localized [21,22].
The Langmuir isotherm equation is presented as Equation (8):
q e = q m a x K L C e 1 + K L C e
where q e is the amount adsorbed, q m a x is the maximum amount adsorbed (mg/L), C e is the equilibrium concentration (mg/L), and K L is the Langmuir constant (L/mg).
A separation factor ( R L ) which is a dimensionless constant defined by Webber and Chakravorti [23], is presented in Equation (9):
R L = 1 1 + K L C o
where K L (L/mg) and C o (mg/L) refer to the Langmuir constant and the adsorbate initial concentration, respectively. The R L value suggests the nature of the adsorption to be favorable (0 < R L < 1), unfavorable ( R L > 1), or irreversible ( R L = 0) [23,24].
The Langmuir isotherm model with two surfaces posits that sorption occurs on two distinct surfaces, each characterized by different binding energies [20,25]. This model offers a mechanistic explanation for adsorption on heterogeneous surfaces [6]. The two-surface Langmuir isotherm model is presented in Equation (10):
Q e = Q m a x , 1 K L 1 C e 1 + K L 1 C e + Q m a x , 2 K L 2 C e 1 + K L 2 C e
The Freundlich isotherm model is used to represent the nonlinear adsorption phenomenon [26] as used in describing non-ideal sorption on heterogeneous surfaces and multilayer sorption [27]. The model describes the non-ideal, reversible, multilayer adsorption commonly employed for heterogeneous adsorbents such as biomass [24]. The Freundlich adsorption isotherm is summarized according to Equation (11):
Q e = K F C e a = K F C e 1 n
where Q e is the amount of Pb(II) adsorbed at equilibrium (mg/g), C e is the equilibrium concentration (mg/L), K f is the Freundlich constant (L/mg), and n is the heterogeneity factor. The isotherm exhibits linearity when a equals 1, is considered favorable when a < 1, and is deemed unfavorable when a > 1 [28]. Also, studies show that a value for a between 0 and 1 shows surface heterogeneity, and values closer to 0 indicate more heterogeneous surfaces [16].

2.7. Characterization of Adsorbents

To examine the particle morphologies of the adsorbents, we employed an ultrahigh-resolution field emission scanning electron microscope (HR FESEM Zeiss Ultra Plus 55, Carl Zeiss AG, Oberkochen, Germany) equipped with an InLens detector. Additionally, the scanning electron microscope was equipped with an energy-dispersive X-ray spectrophotometer (EDS), which played a role in analyzing the elemental composition (Pb, S, C, O, N) of the metabolically inhibited adsorbents.
The EDS maps for different elements that were obtained for each adsorbent were further processed for quantitative comparison by initially cropping them to the same size and coordinates (to ensure the pixelwise comparability of the images) using the Python Image Library (PIL) image.crop function (Python 3.10.9 distributed with Anaconda 3 and run using Jupyter Notebook 3.5.3). The images were subsequently converted into grayscale using the PIL image.convert(‘L’) function, which codes the image as a matrix of values between 0 and 255 corresponding to the luminescence of the image pixel and consequently the relative elemental concentrations of the pixels [29]. To compare the pixels concerning the elemental abundance, the matrices with first flattened using the (PIL) image.flatten (function) and then correlated using the Python numpy library’s Pearson’s correlation coefficient (corrcoef) function, which measured the linear correlation between two variables [30]. This measure indicates the relative prevalence of elemental distribution across the surface and therefore the likely relationship between the elements in terms of bonds and interactions. Additionally, comparisons of the elemental maps was performed, termed the “cosine similarity”; a measure of the cosine angle between vectors and therefore an indication of whether the vectors point in roughly the same direction. This measure is regularly applied in assessing the similarity of texts [31]. To determine the cosine similarity, the grayscale matrices were converted into black-and-white (binary) images by using the median values as the cut-off with all values greater than the median = 1 and the remainder = 0; this was applied to limit false positive results in the matrices. The cosine similarity was calculated using Equation (12) [32].
C o s i n e   s i m i l a r i t y = A · B A B = i = 1 n A i B i i = 1 n A i 2 i = 1 n B i 2
with A and B representing the grayscale matrices for the elements being compared.
A Micrometrics TriStar II BET analyzer, manufactured by Micrometrics Inc. in Norcross, GA, USA, was employed to determine the Brunauer–Emmett–Teller (BET)-specific surface area of the adsorbent material both before and after activation. Liquid nitrogen was utilized at a temperature of 77 K during the measurement process. Before measurement, the samples were degassed via vacuum-drying at 110 °C for 10 h to eliminate any moisture and impurities.
The Fourier-transform infrared (FTIR) spectra of the cultures were recorded using a PerkinElmer Spectrum 2000GX FTIR spectrometer (PerkinElmer, Waltham, MA, USA) equipped with an attenuated total reflection attachment (ATR). The measurements were taken before and after Pb(II) adsorption.
The initial measurement occurred following a 24 h bacterial growth period, while the second measurement was taken after exposing the bacteria to 100 ppm of Pb(NO₃)₂ for 24 h. All FTIR spectra were captured across a wavelength range from 4000 cm–1 to 500 cm–1 and were based on the average of 30 scans [2].

2.8. Regeneration

Experiments to regenerate the metabolically inhibited adsorbents were conducted using HNO₃ [6,33]. In the regeneration process, adsorbents at a concentration of 1.48 g/L were subjected to an initial Pb(II) concentration of 200 mg/L for 24 h. Following this, the adsorbents were recovered using filter paper, rinsed with distilled water, and then placed at a concentration of 1.48 g/L into a 0.1 M HNO₃ solution for an additional 24 h [6]. The desorption efficiency was calculated using the equation provided below [34]:
Desorption   efficiency   ( % ) = C d e C a d × 100
where C d e denotes the concentration of Pb(II) desorbed and C a d is the amount of Pb(II) adsorbed. The recovered adsorbent was dried at 105 °C until a constant mass was achieved [35]. Consequently, the regenerated adsorbent was employed in multiple adsorption–desorption cycles to assess the reusability of the metabolically inhibited adsorbents.
The quantity of Pb(II) desorbed by each metabolically inhibited adsorbent into the solution, per unit mass of adsorbent at equilibrium, is computed using [34]:
Q d = C d e m × V
where Q d is the amount of Pb(II) desorbed in mg/g, C d e is the liquid phase Pb(II) concentration in the desorbing solution at equilibrium in mg/L, m is the mass of the adsorbents in mg, and V is the volume of the desorbing solution in mL.

3. Results and Discussion

3.1. Lead Removal Experiments

The results of the Pb adsorption experiments are shown in Figure 1.
It was found that the rate of adsorption of Pb(II) increased with an increase in contact time until an equilibrium was reached. Equilibrium was not observed in the SS during 180 min of investigation. Equilibrium was reached in 30 min, 15 min, 15 min, 120 min, and 60 min in C1, C2, Cons, PB, and KP, respectively. Metabolically inactive Cons, PB, KP, SS, C1, and C2 removed 54.44 mg/g, 27.39 mg/g, 23.10 mg/g, 55.35 mg/g, 54.60 mg/g, and 50.63 mg/g of Pb(II) in 3 h, respectively. The removal of Pb(II) from the solution occurred via a passive process, as the metabolic activity was not detected using MTT. There was no observable black or gray precipitate within the 14 h period, indicating the absence of both PbS and Pb(0) formation [2,12].
From the pH results (Table S1), it can be observed that there was an increase in pH in the Cons, PB, SS, C1, and C2. According to Gupta et al. 2021 [36], a higher pH promotes electrostatic attraction between the negatively charged biosorbent surfaces and positively charged metal ions, increasing the adsorption efficiency. The observed decline in pH in KP is probably attributed to the release of protons from the bacterial surface, resulting from cation exchange processes where H⁺ ions are displaced by Pb(II) ions on the surface [6].

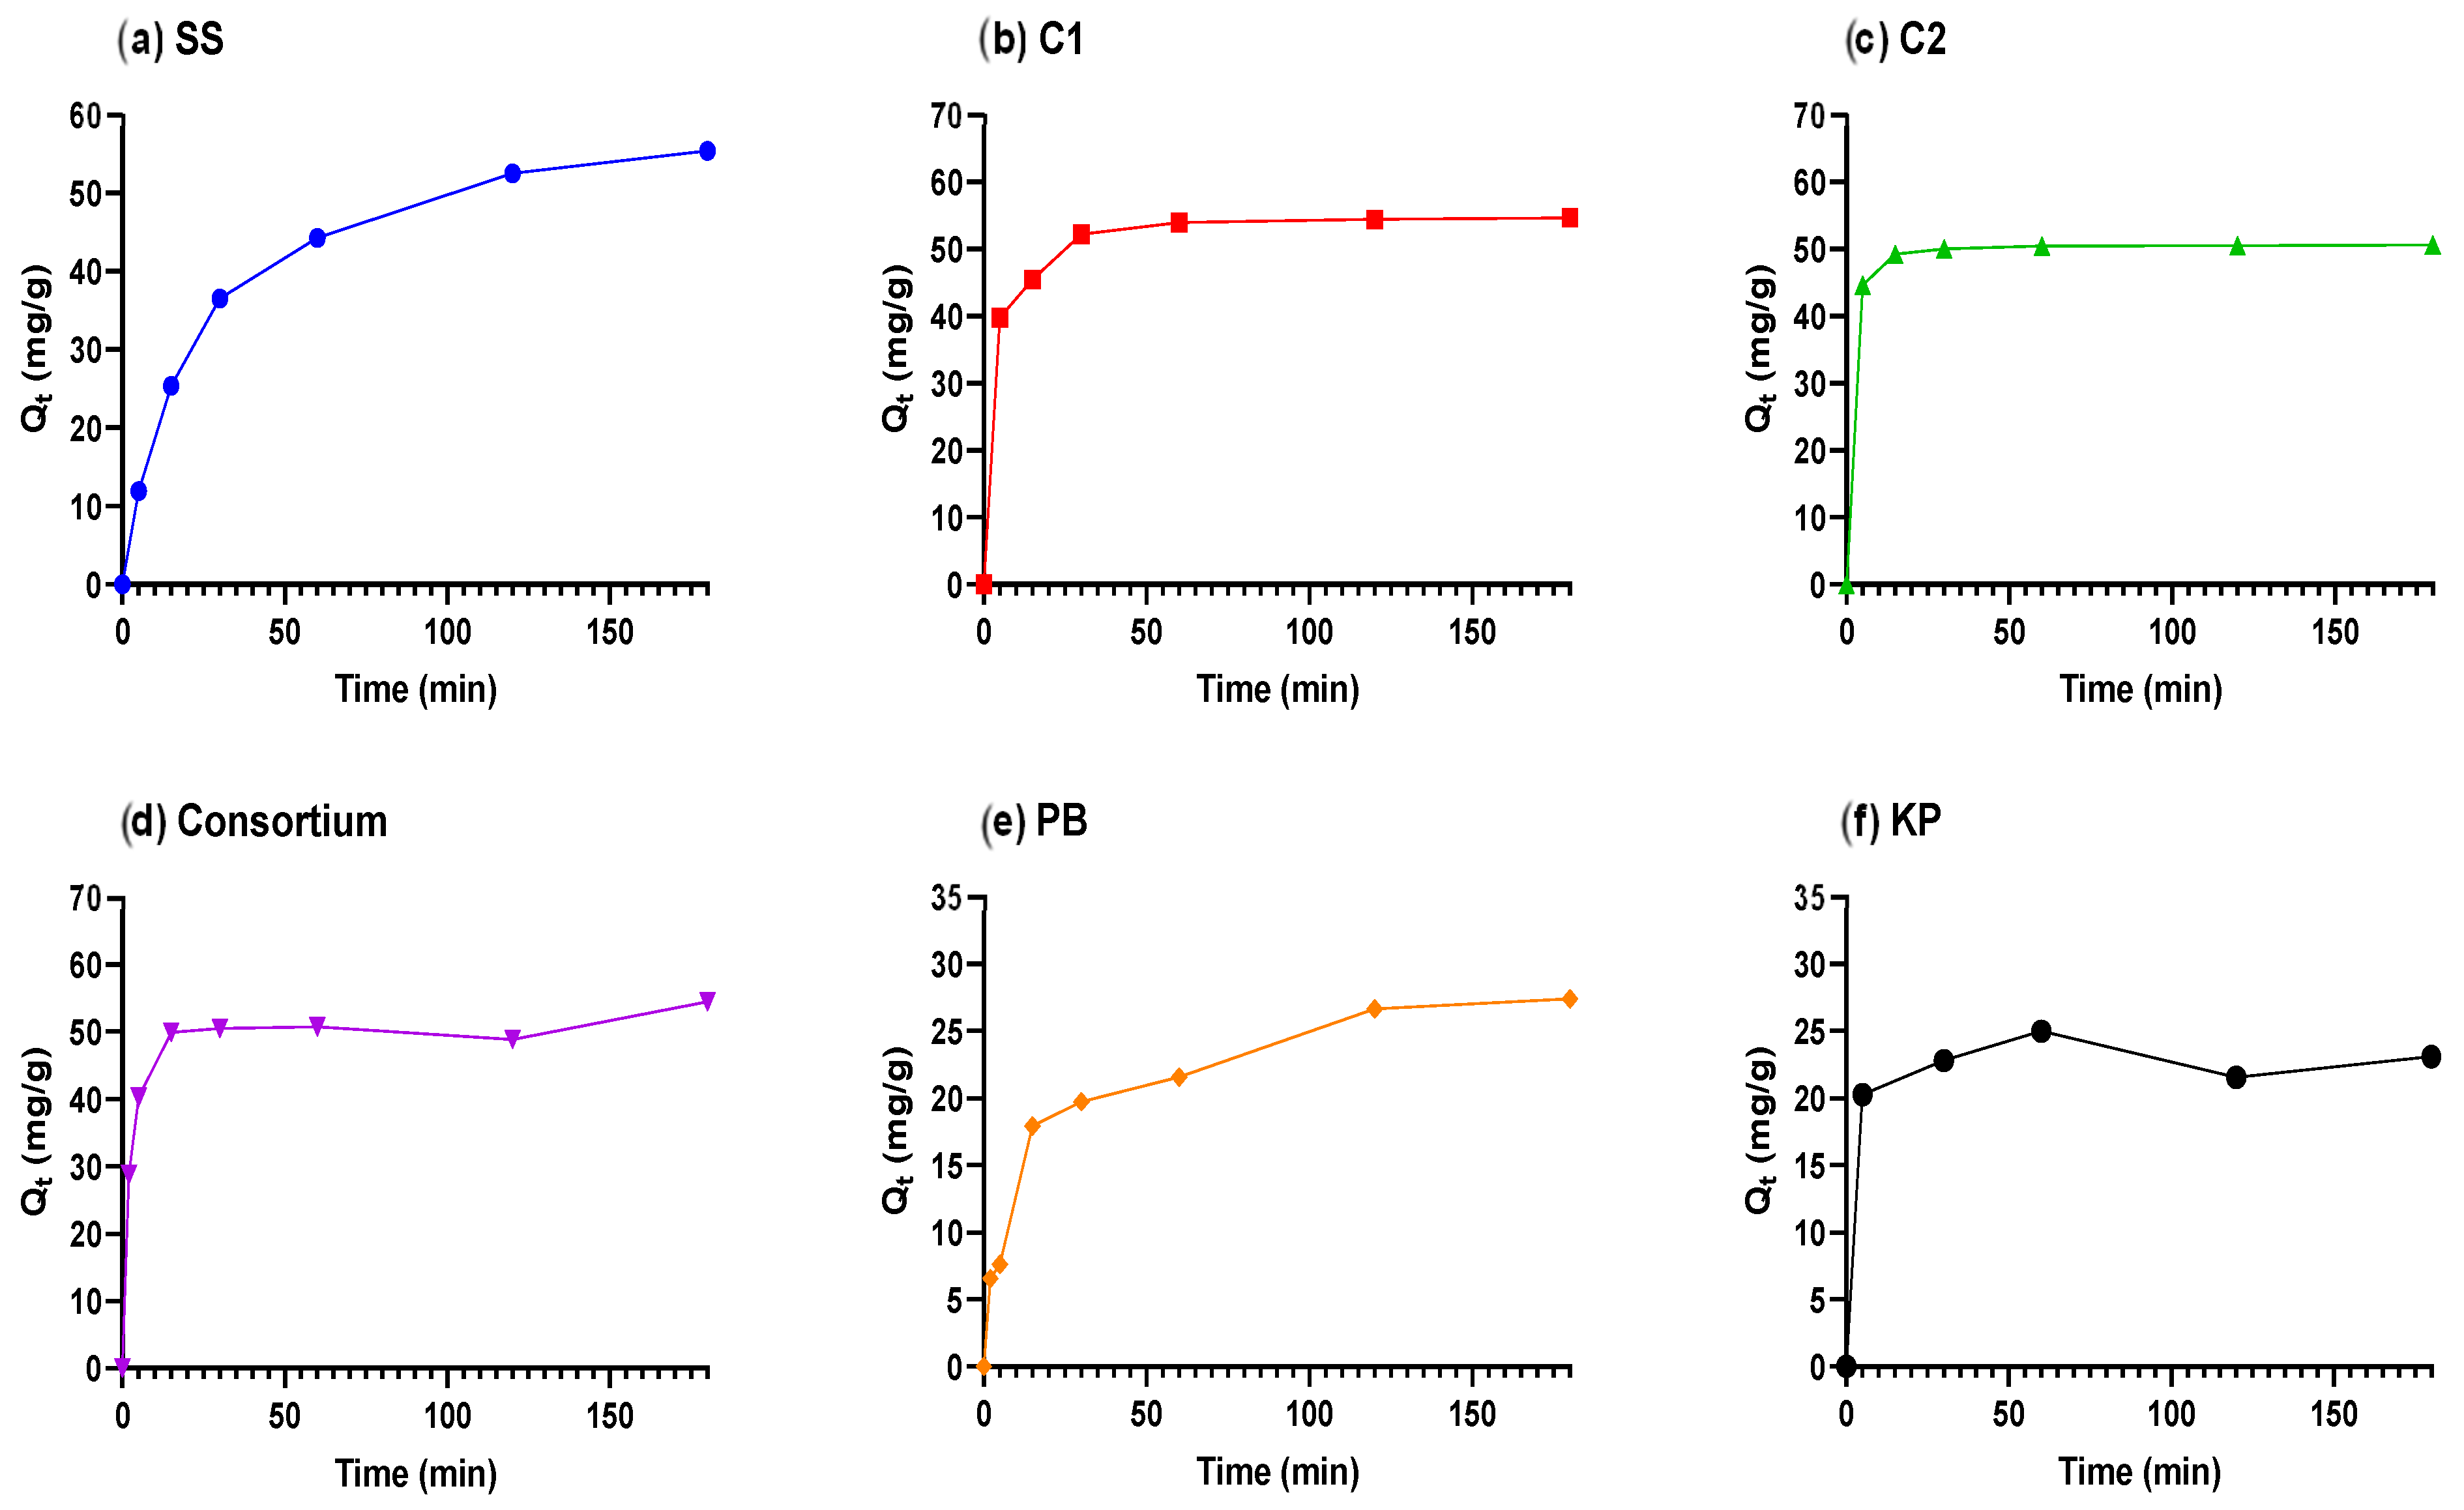
3.2. Adsorption Kinetics

In the experimental runs for all six adsorbents, it was found that two-phase pseudo-first-order kinetics fits had the highest coefficients of determination (R2), and the lowest average sum of squares (SSE), standard error of estimates (Sy.x), and root mean square error (RMSE), as presented in Table 1 and displayed in Figure 2. This could be an outcome of segregating the fast and slow adsorption rates into distinct compartments, thereby providing a more accurate depiction of a heterogeneous surface [6].
It was further found that the pseudo-second-order kinetic model fit the data relatively well, displaying a high R2, and a low sum of squares (SSE), standard error of estimates (Sy.x), and root mean square error (RMSE), as presented in Table 1 and displayed in Figure S1. This model represents the data better as compared to the pseudo-first-order kinetic model (Table 1 and Figure S2). The better representation of the pseudo-second-order kinetic model in comparison to the pseudo-first-order kinetic model suggests a surplus of adsorption sites relative to the Pb(II) ions in the solution [38,39]. According to Vishan et al. [40], this implies that valence forces may be involved in the sharing and exchange of electrons between the functional groups of the adsorbent and the adsorbate.

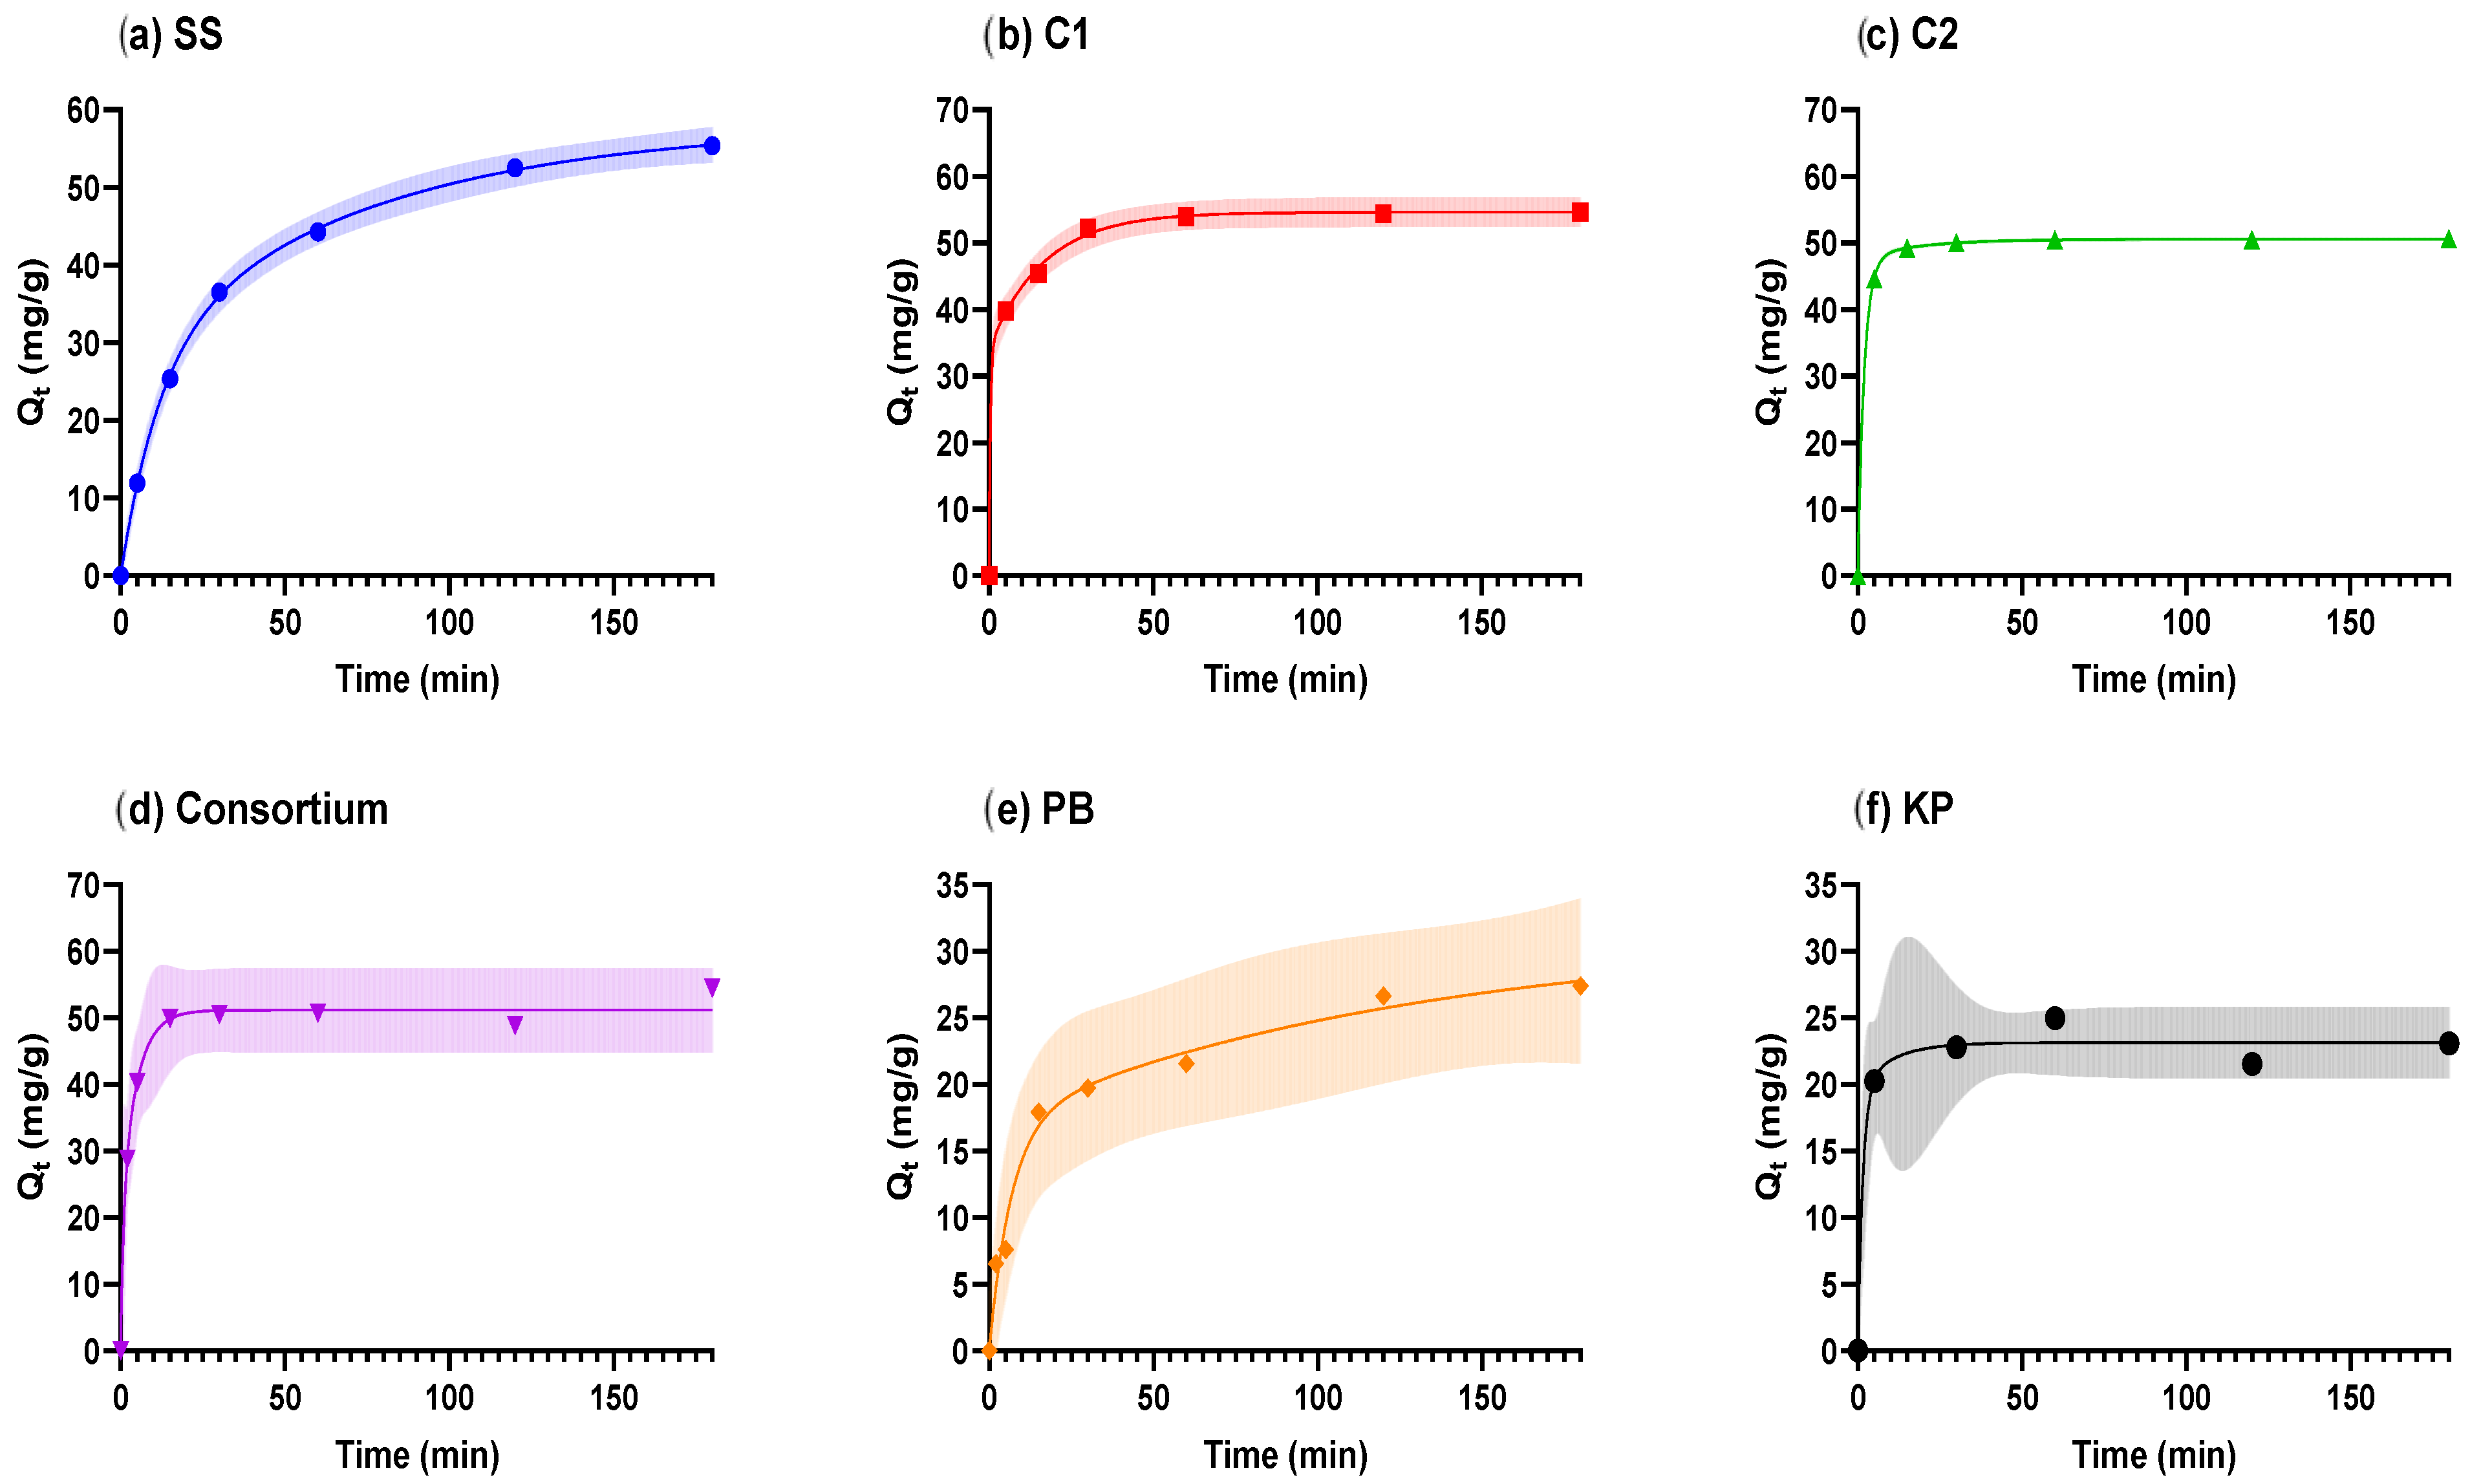
3.3. Crank Mass Transfer Model

Based on the results from the Crank mass transfer model, as presented in Table 1 and displayed in Figure S3, the metabolically inactive adsorbents could be placed in the following sequence based on their diffusion coefficients: C2 > KP > PB > Cons > SS > C1.
The low effective diffusion coefficients of the adsorbents as compared to the molecular diffusivity of Pb(II), which is 9.39 × 10 9 m/s [41], will result in the formation of thermodynamically stable structures due to the large time for which Pb(II) must roam the surface of the adsorbents and attain minimum energy configuration before attaching to the growing island nuclei [42].
This suggests that external mass transfer is the main mechanism of Pb(II) removal due to the high molecular diffusivity of Pb(II) as compared to the diffusion coefficients of the metabolically inactive adsorbents. This agrees with the literature, as an adsorbate with a higher molecular diffusivity diffuses more rapidly through the bulk solution, which results in a limited rate of mass transfer due to the slow diffusion within the boundary layer of the adsorbent with a lower effective diffusion coefficient [43].

3.4. Adsorption Isotherm

The two-surface Langmuir equilibrium isotherm model better described the adsorption of Pb(II) by all the metabolically inactive biosorbents, as presented in Table 2 and displayed in Figure 3. This might be due to the grouping of different adsorption sites into different binding sites, which allows a comparably better description of the adsorption [6].
The Langmuir equilibrium adsorption model better described the adsorption of Pb(II) by the metabolically inhibited Cons, as presented in Table 2 and displayed in Figure S4. This implies that the homogeneous adsorption surfaces (monolayer adsorption) on the adsorbents are involved in the adsorption of Pb(II).
The Freundlich isotherm model better described the adsorption of Pb(II) by the metabolically inactive SS, C1, PB, and KP, as presented in Table 2 and displayed in Figure S5, when compared with the Langmuir isotherm model because the Freundlich model takes the surface roughness into account, while the Langmuir model works with the assumption that the adsorption is limited to the formation of a monolayer [44]. In addition, the Freundlich isotherm model takes the assumption that the number of uniform adsorption sites is finite and that lateral interactions between adsorbed species should be absent, and none of these assumptions likely apply in biological systems [45].The adsorption intensity 1 n for the Freundlich isotherm models for all adsorbents was less than 1, which indicates favorable sorption.
Although the sorption process was described poorly by the Langmuir isotherm model for all adsorbents except Cons and C2 when compared to the two-surface Langmuir and Freundlich isotherm models, the adsorption process was favorable, as the separation factor R L was found to be between 0 and 1 [24]. The fitting of the equilibrium adsorption data to the Langmuir and Freundlich isotherm models shows that both homogeneous and heterogeneous adsorption surfaces on the adsorbents were involved in the adsorption of Pb(II).
It was assessed via the mixed-effects model restricted maximum likelihood statistical test for the temperature effect on the adsorbents that the temperature range across which the adsorption experiments were performed did not have a significant effect on the adsorption capacity of the adsorbents (Table S2). Consequently, thermodynamic analyses were not possible. This implies that the adsorption process of these adsorbents was insensitive to temperature and therefore an industrial adsorption process should be relatively robust to a wide range of operational temperatures.

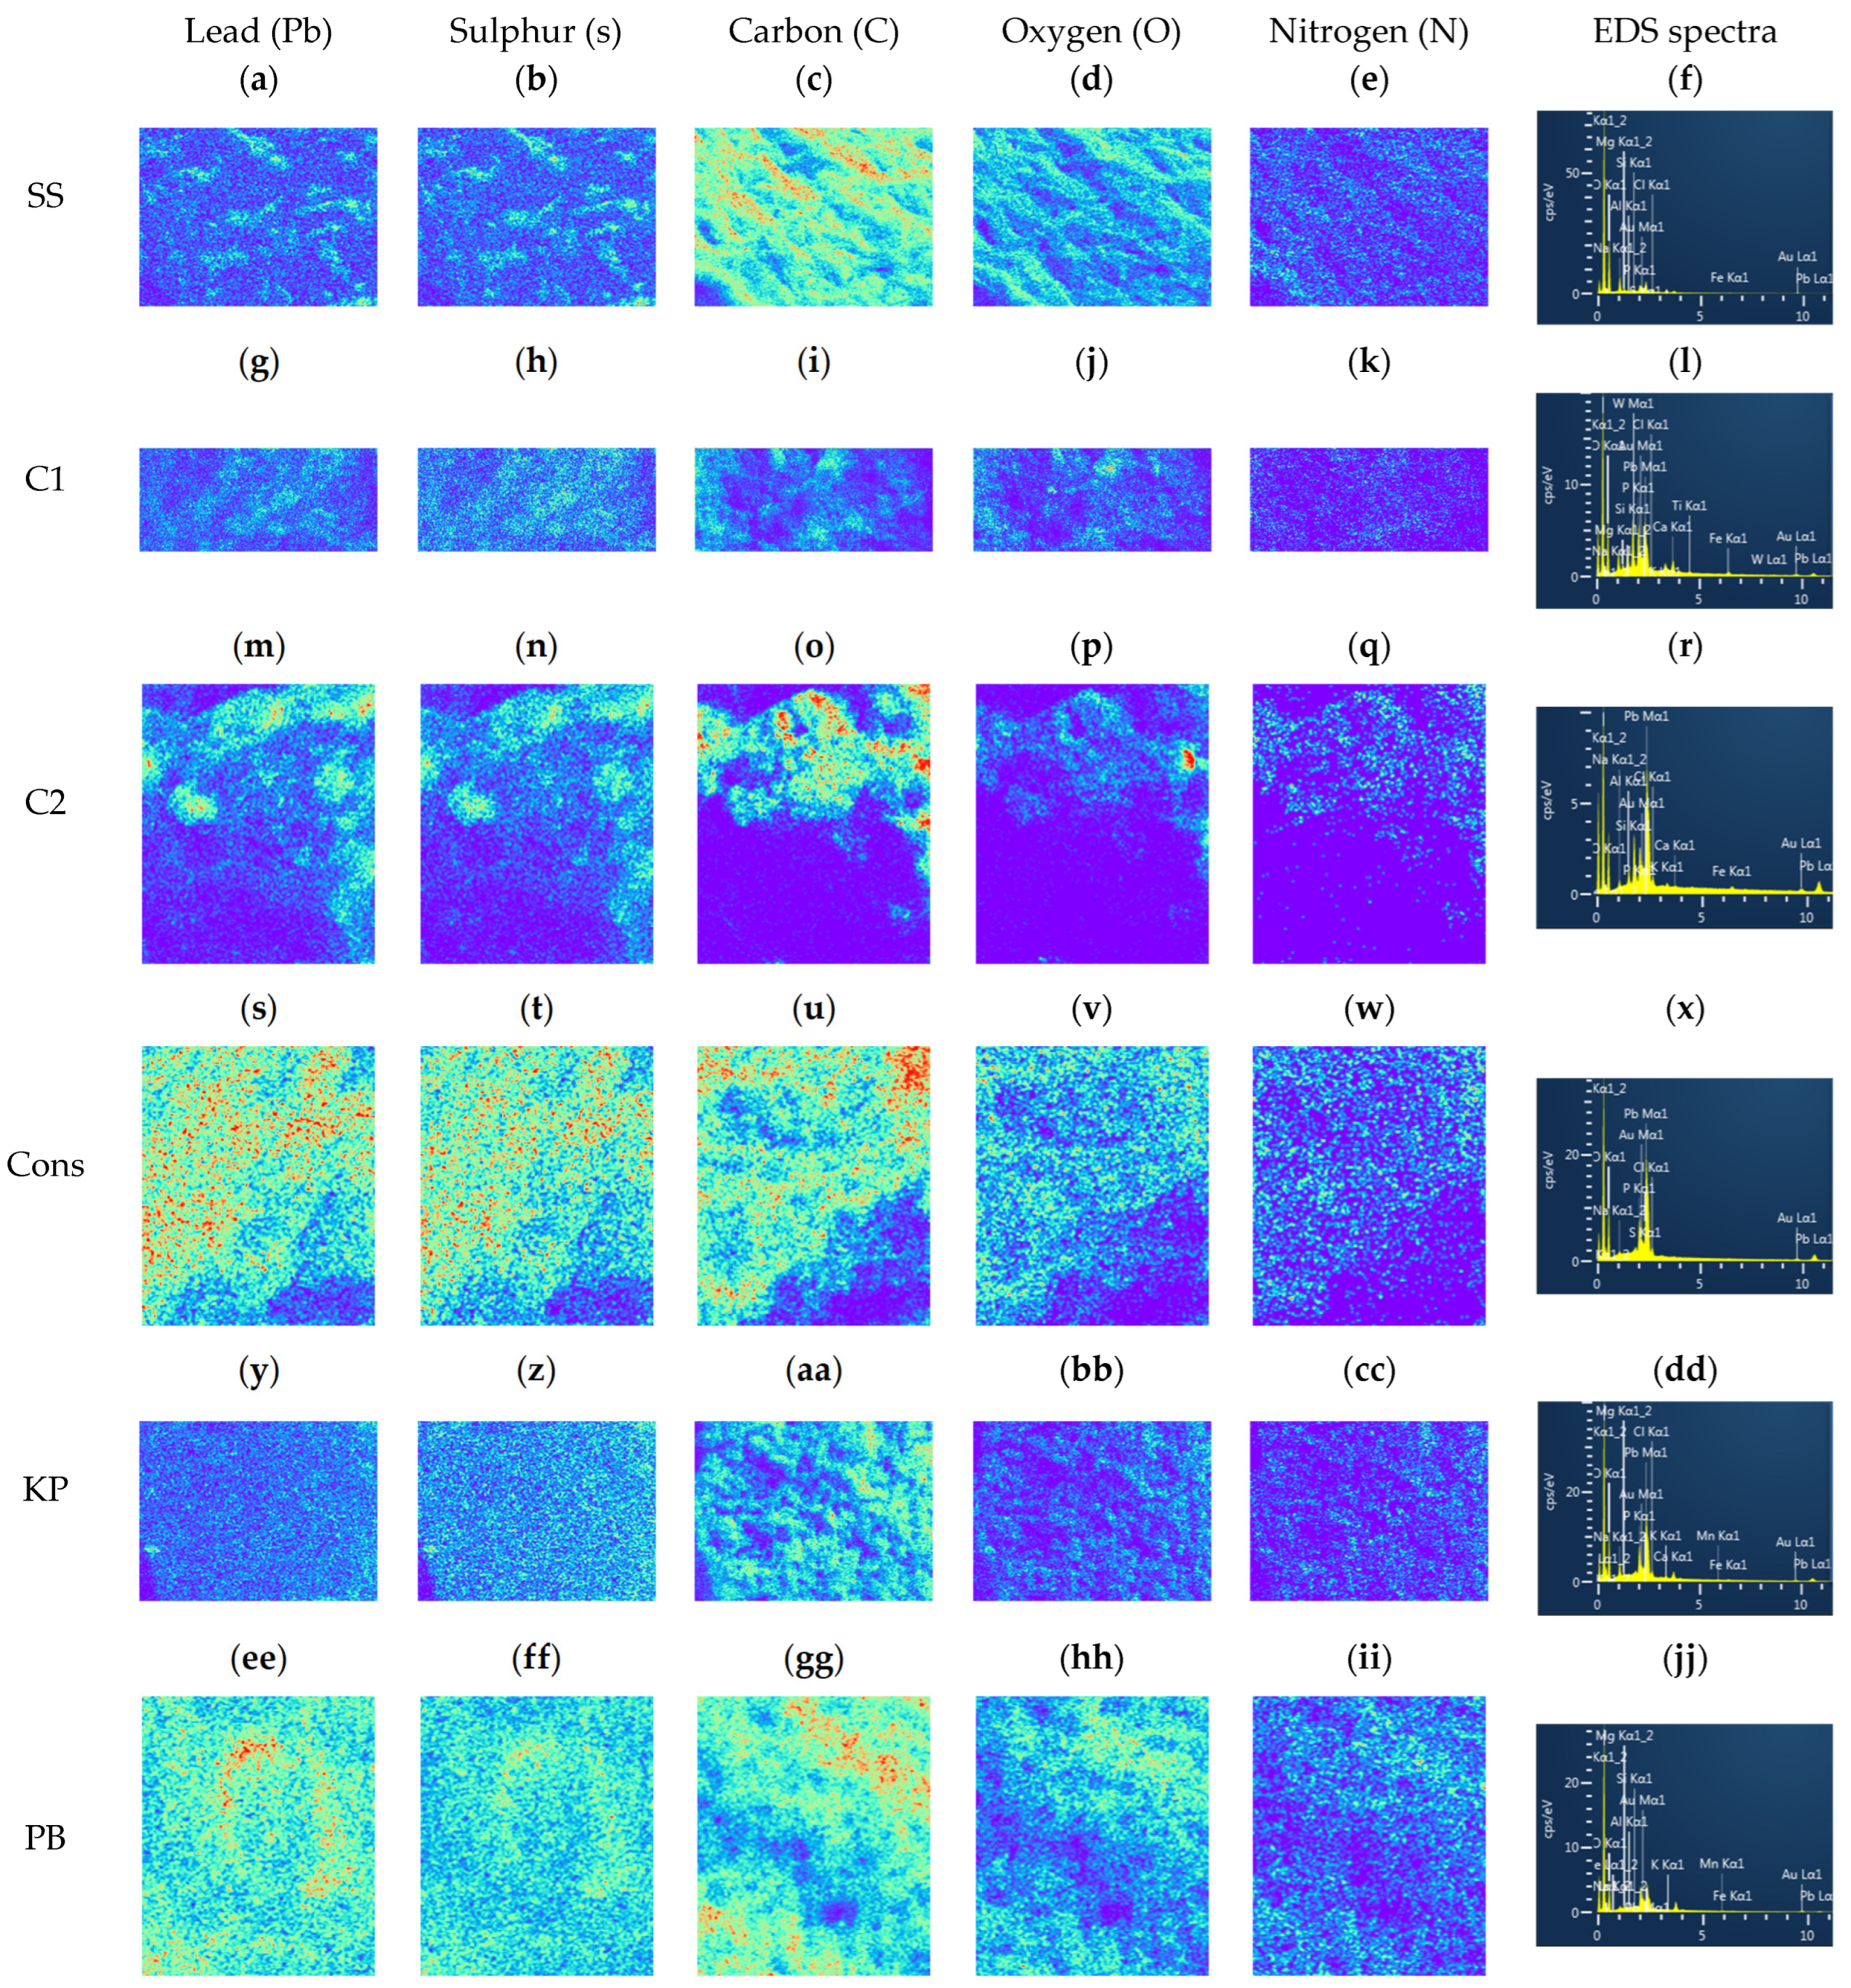
3.5. Characterization of Adsorbents
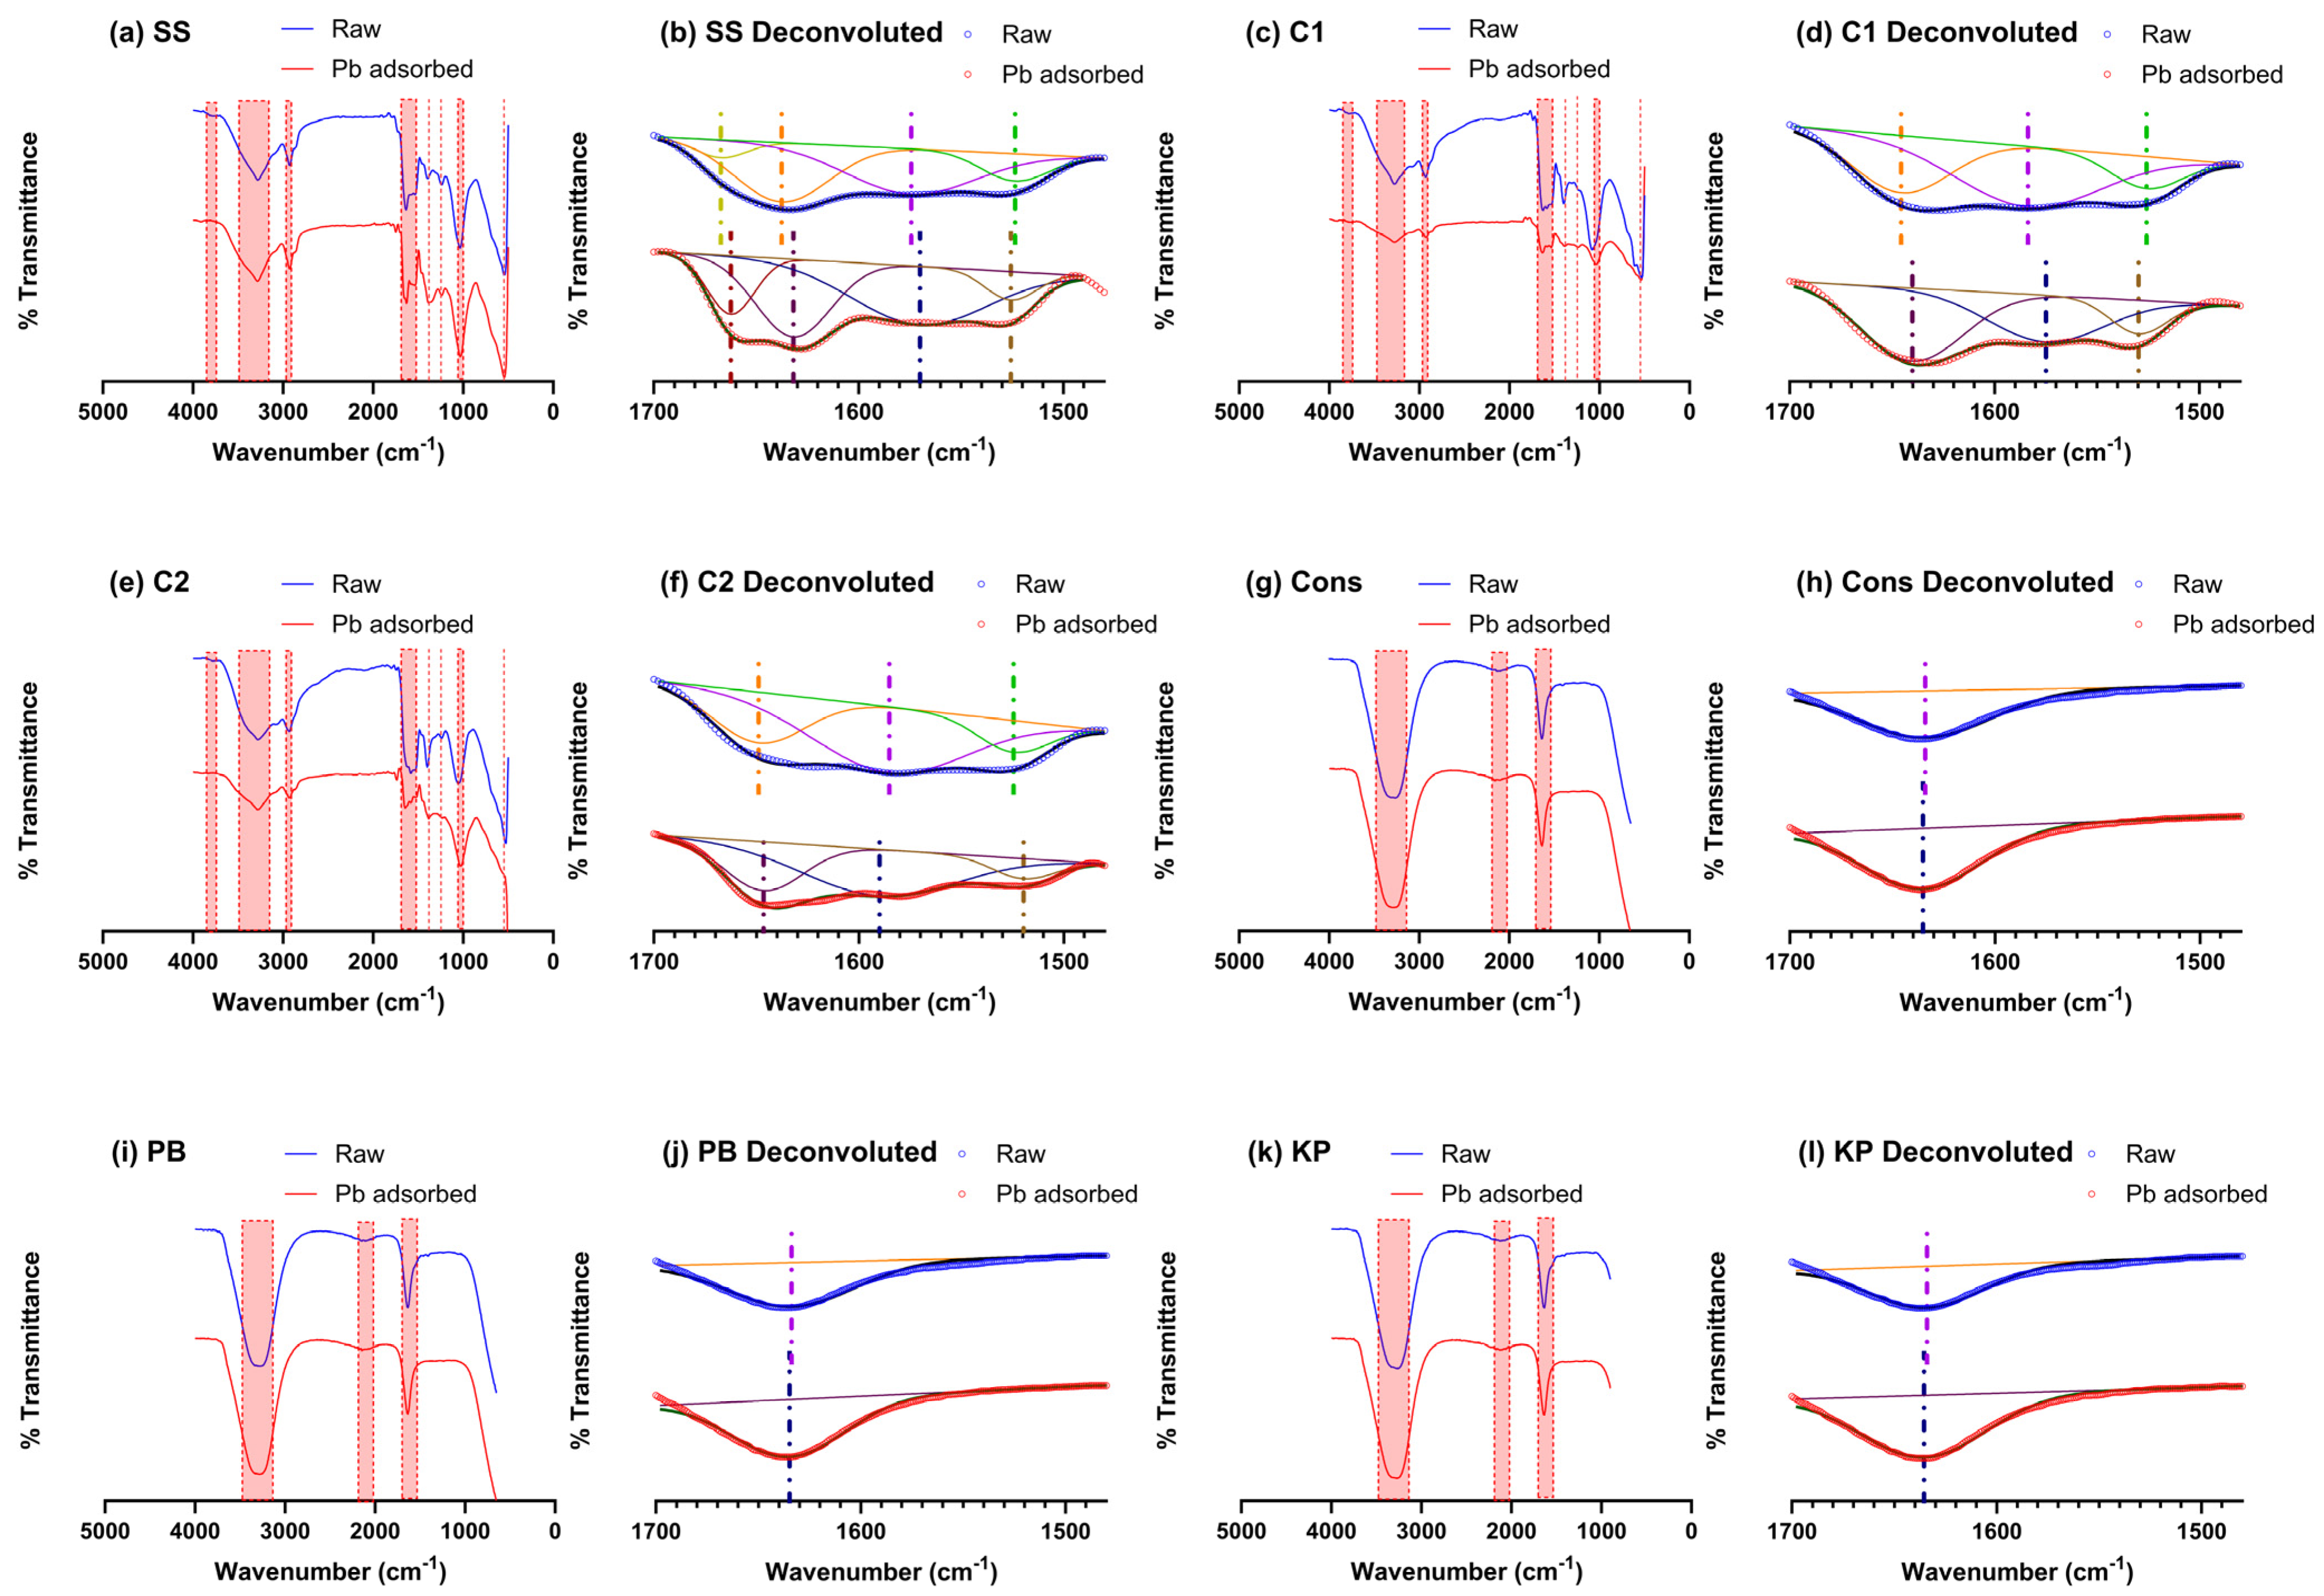
SEM-EDS analysis of the surface morphology and the elemental composition of the adsorbents was carried out and the images obtained are shown in Figure 4.
Based on the findings, it was noted that the surfaces of the metabolically inactive adsorbents exhibited uneven and heterogeneous morphologies, which could significantly influence the adsorption process [46]. The surfaces of the adsorbents display roughness characterized by irregular crevices, with this feature being particularly pronounced in the metabolically inactive SS. Micropores were observed in the metabolically inactive C1, Cons, C2, and PB, respectively. The modifications on the surface may be attributed to the impact of the sorption processes on the adsorbents, as the aqueous adsorbate interacts with them [47].
The EDS analyses of the metabolically inactive adsorbents after Pb(II) sorption, as shown in Figure 5, lend credence to the observation that the metabolically inhibited adsorbents were able to remove Pb from the aqueous solutions, as they clearly demonstrate the fate of the Pb(II) on the surface of the adsorbents.
In addition, the EDS spectrum for each metabolically inhibited adsorbent clearly shows the peaks for Pb, confirming its existence on the surface of the adsorbents after sorption was carried out. This observation was also reported by [6]. From the qualitative analysis of the respective EDS maps, significant similarities between the distributions of the S and the Pb could be observed, indicating that there are likely strong interactions between these species on the surfaces.
The quantitative comparisons of the elemental EDS maps for the respective adsorbents are shown in Figure 6. The results indicate very high Pearson’s correlation coefficients (>0.8) (Figure 6a) and cosine similarities (>0.75) (Figure 6b) for all adsorbents when comparing the Pb and S EDS maps. This observation agrees with results observed by Hamilton et al. [48], Macías-García et al. [49], and Li et al. [50] in which it was observed that Pb chemically interacts with S during adsorption, forming strong surface complexes. It is also very interesting to note the strong correlation between the correlation coefficients and cosine similarities measured (Figure 6c), providing strong support for the validity of the observations in Figure 6a,b, since the correlation coefficients and cosine similarities were determined using completely different methods.
Interestingly, there were limited correlations or similarities for the C, O, or N as these relate to Pb. This does not necessarily exclude the interaction of Pb with these species: in contrast, it could be an indication that the relative association of Pb with S was the dominant interaction. There is strong evidence for the interaction of Pb with -OH, -C=O, -COOH, and -NH groups [51,52], and therefore these interactions cannot be excluded.
In addition, the correlation and similarities for C vs. O, C vs. N, and O vs. N were relatively close, indicating the likely presence of C–O, C–N, and O–N bonds on the surface.
The BET results of the metabolically inhibited adsorbents (SS, C1, C2, Cons, PB, and KP) are presented in Table 3 below. Based on these results, the metabolically inhibited adsorbents could be placed in the following sequence on account of their specific surface areas: SS > C1 > Cons > PB > C2 > KP. In the characterization of adsorbents, the pore size is an important parameter as it gives information on the structural heterogeneity of a porous material [47]. The low BET surface areas of the metabolically inhibited biosorbents, as well as the reversible type II isotherm characteristics of the isotherms measured (Figure S6), provide strong evidence that the biosorbents behaved as non-porous solid particles [53], with Sauter equivalent diameters reported in Table 3. The Sauter mean diameter is the diameter of a sphere with the same surface-to-volume ratio of the specific particles considered [54]. The surface results imply that the biosorbents effectively behaved as solid non-porous particles with approximate diameters between 30 and 350 μm (much greater than the average size of bacterial cells—most bacterial cells are in the range of 0.1–0.9 μm diameter and 1–2 μm long, which yields Sauter Equivalent diameters between 1.5 and 30 μm [55], indicating that the biosorbents consisted of solidly compacted non-porous agglomerates of biomass, thereby resulting in markedly attenuated BET surface areas. It should, however, be noted that the results for the BET surface areas measured are consistent with unactivated biomass adsorbents from the literature [56,57].

3.6. FTIR Analysis

FTIR analysis for the functional groups as presented in Figure 7 revealed the presence of functional groups in the metabolically inhibited adsorbents. The wavelength and functional group obtained from the spectra are presented in Table 4. This demonstrated that the metabolically inactive SS, C1, C2, Cons, PB, and KP surfaces contained active functional groups. To determine the identities of active organic species, the region between 1400 and 1700 cm−1 was deconvoluted as per Nekvapil et al. [58], as shown below in Table 4.
In the KP microbial strain, the hydroxyl functional group was revealed due to the occurrence of the broad peak found at a wavenumber 3298 cm−1 [67]. The band occurring at 1640 was attributed to the occurrence of C=O in amide [68].
The functional groups identified in the SS, C1, and C2 were alkyl halides, ethers, alkyl ketones, diketones, and methyl group at wavenumbers 524–544, 1034–1080, 1240, 1528–1632, and 2924–2934, respectively. Hydroxyl compounds and alcohol functional groups were identified in the SS and the C1 at wavenumbers 3282 and 3792, respectively. N O 2 stretching was identified in both C1 and C2 at wavenumbers 1398, respectively. The functional groups and aromatic and phenol rings were identified in the SS at wavenumbers 1400 and 1530, respectively. The anhydride functional group was identified at the wavenumber 1800. Carboxylic acid was identified at the wavenumber 3276 in C2.
These finding align with the literature, which identifies hydroxyl [69]; carboxyl [70]; ether, alcohol, and amino acids [71]; and alkyl halide and amine [72] functional groups for the removal of Pb and other divalent metals from aqueous solutions. The shift in peaks identified at the wavenumber range of 1500 ( N O 2 stretch)–1700 ( c a r b o x y l i c   a c i d ) might be because of changes in the two overlapped bands [73]. No significant changes were observed in the FTIR spectra for Cons, PB, or KP before and after adsorption. This shows that oven-drying the cultures at 74 °C for 24 h did not rupture the cell wall [2].

3.7. Regeneration and Reusability

Adsorbents regenerated using 0.1 M H N O 3 showed an efficiency of 72.35%, 68.62%, 69.73%, 69.58%, 60.99%, and 72.38% in Pb(II) recovery by the metabolically inactive SS, C1, C2, Cons, PB, and KP, respectively, as presented in Table 5. The adsorption capacity of the metabolically inactive SS, C1, C2, PB, and KP after the second cycle of regeneration decreased by 66.95%, 75.53%, 67.47%, 18.93%, and 1.19%. According to Tao et al. [74], the reduction in the adsorption capacity following regeneration could stem from the eluent’s incapacity to overcome the high affinity between the binding sites and Pb(II). In contrast, the metabolically inactive Cons had a 63.23% increase in adsorption capacity.
The maximum adsorption capacities of certain microbial and sludge-based adsorbents are presented in Table 6 for comparison. The metabolically inhibited SS, C1, C2, Cons, PB, and KP have a comparatively high adsorption capacity. This characteristic, in addition to the low cost of microbial preparations, makes them a favorable adsorbent for Pb(II) removal from industrial effluents.

4. Conclusions

In summary, this research aimed at elucidating the efficacy of metabolically inactive sewage sludge, commercial bacteria 1, commercial bacteria 2, and an industrially obtained Pb-resistant consortium, specifically focusing on the Pb-reducing constituents P. bifermentans and K. pneumoniae, as adsorbents for the removal of Pb(II) from aqueous solutions. Kinetic studies revealed the superior applicability of the two-phase pseudo-first-order model to these metabolically inhibited adsorbents, showcasing their potential for practical applications.
Crucially, our investigation unveiled that external mass transfer serves as the primary mechanism for Pb(II) adsorption, as indicated by the Crank mass transfer model. FTIR spectroscopy provided evidence supporting the chemisorption of Pb(II) onto functional groups, underscoring the pivotal role played by these constituents in the removal process. The isotherm study demonstrated a strong correlation of adsorption data with the two-surface Langmuir model, further substantiating the effectiveness of the biosorbents.
Moreover, comprehensive analyses using BET, SEM, and EDS shed light on the morphology and chemical nature of the adsorbents. Notably, qualitative analysis revealed significant similarities between the distributions of sulfur (S) and lead (Pb), with quantitative comparisons employing Pearson’s correlation coefficients and cosine similarities reinforcing these findings.
This study provides robust evidence supporting the potential of metabolically inhibited adsorbents for the efficient removal of Pb(II) from aqueous systems, while also highlighting their capability for the recovery of Pb(II) for subsequent reuse. The environmentally friendly and cost-effective nature of this bioremediation process positions it as a promising alternative to traditional chemical and physical methods for the remediation of Pb-contaminated waste streams.
To further enhance the applicability of these biosorbents, it is recommended to conduct more detailed studies elucidating the mechanisms of adsorption specific to each adsorbent. Additionally, optimization studies should be undertaken to assess the optimal operational conditions for adsorption, considering the diverse nature of the different adsorbents. Such endeavors will contribute to the development of more effective and scalable solutions for the removal of Pb from contaminated environments.

Supplementary Materials

The following supporting information can be downloaded at https://www.mdpi.com/article/10.3390/w15244259/s1. Table S1. Experimental data for two-phase pseudo-first-order kinetics for metabolically inactive adsorbents; Table S2. Statistical test for temperature effect; Figure S1. Pseudo-second-order kinetics of Pb(II) onto metabolically inactive adsorbents; Figure S2. Pseudo-first-order kinetics of Pb(II) onto metabolically inactive adsorbents; Figure S3. Crank mass transfer model of Pb(II) onto metabolically inactive adsorbents; Figure S4. Langmuir isotherm for metabolically inactive adsorbents; Figure S5. Freundlich isotherm for metabolically inactive adsorbents; Figure S6. Hysteresis loops for BET for the different biosorbents; Figure S7. Correlation graphs of elemental compositions and location obtained from SEM-EDX.

Author Contributions

Conceptualization, P.Y.K., J.N., E.M.N.C. and H.G.B.; formal analysis, P.Y.K. and H.G.B.; funding acquisition, J.N., N.H., E.M.N.C. and H.G.B.; investigation, P.Y.K.; methodology, P.Y.K. and H.G.B.; project administration, H.G.B.; resources, J.N., N.H., E.M.N.C. and H.G.B.; software, H.G.B.; supervision, E.M.N.C. and H.G.B.; validation, P.Y.K., N.H. and H.G.B.; visualization, P.Y.K. and H.G.B.; writing—original draft, P.Y.K., N.H. and H.G.B.; writing—review and editing, P.Y.K., J.N., E.M.N.C. and H.G.B. All authors have read and agreed to the published version of the manuscript.

Funding

This research was partially funded by the National Research Foundation of South Africa, under grant number CSRP220420402. Additionally, support for this work was provided by the Federal Ministry of Education, Science, and Research (BMBWF) via Austria’s Agency for Education and Internationalization (OeAD), with grant number Africa UNINET P056.

Data Availability Statement

Data for this study can be found within the article.

Conflicts of Interest

The research described in this paper utilized commercially supplied bacteria, Commercial 1 and 2, provided by Bemical CC. It is important to disclose that Jaco Nel, one of the co-authors of this paper, is affiliated with Bemical CC and holds a financial interest in the company. While the primary function of the commercial bacteria is to supplement activated sludge in wastewater treatment plants, the bacteria was employed in this study for biosorption research. The involvement of Jaco Nel as a co-author and their affiliation with Bemical CC could potentially introduce a conflict of interest. To address this, we affirm that the experimental design, data collection, analysis, and interpretation were conducted with the utmost scientific rigor and integrity. Hendrik G Brink (as corresponding author and research leader) and the other co-authors have taken all the reasonable measures to minimize the impact of any potential bias on the research findings. This paper is presented with transparency, and readers are encouraged to consider this conflict of interest when interpreting the results. The integrity of the research process and the validity of the findings have been upheld to the best of our ability. If further clarification is needed, please feel free to contact the corresponding author directly.

References

  1. Tiwari, S.; Tripathi, I.P.; Tiwari, H.I. Effects of lead on Environment. Int. J. Emerg. Res. Manag. Technol. 2013, 2, 23–45. [Google Scholar]
  2. Van Veenhuyzen, B.; Chirwa, E.M.N.; Brink, H.G. Microbial Pb(II) Precipitation: The Role of Biosorption as a Pb(II) Removal Mechanism. Chem. Eng. Trans. 2021, 86, 181–185. [Google Scholar] [CrossRef]
  3. Mason, L.H.; Harp, J.P.; Han, D.Y. Pb Neurotoxicity: Neuropsychological Effects of Lead Toxicity. Biomed Res. Int. 2014, 2014, 840547. [Google Scholar] [CrossRef] [PubMed]
  4. Jakubowski, M. Low-level environmental lead exposure and intellectual impairment in children—The current concepts of risk assessment. Int. J. Occup. Med. Environ. Health 2011, 24, 1–7. [Google Scholar] [CrossRef] [PubMed]
  5. Klingberg, T. Training and plasticity of working memory. Trends Cogn. Sci. 2010, 14, 317–324. [Google Scholar] [CrossRef]
  6. van Veenhuyzen, B.; Tichapondwa, S.; Hörstmann, C.; Chirwa, E.; Brink, H.G. High capacity Pb(II) adsorption characteristics onto raw- and chemically activated waste activated sludge. J. Hazard. Mater. 2021, 416, 125943. [Google Scholar] [CrossRef]
  7. Yang, X.; Wan, Y.; Zheng, Y.; He, F.; Yu, Z.; Huang, J.; Wang, H.; Ok, Y.S.; Jiang, Y.; Gao, B. Surface functional groups of carbon-based adsorbents and their roles in the removal of heavy metals from aqueous solutions: A critical review. Chem. Eng. J. 2019, 366, 608–621. [Google Scholar] [CrossRef]
  8. Gupta, A.; Yunus, M.; Sankararamakrishnan, N. Chitosan-and iron–chitosan-coated sand filters: A cost-effective approach for enhanced arsenic removal. Ind. Eng. Chem. Res. 2013, 52, 2066–2072. [Google Scholar] [CrossRef]
  9. Heidari, P.; Panico, A. Sorption Mechanism and Optimization Study for the Bioremediation of Pb(II) and Cd(II) Contamination by Two Novel Isolated Strains Q3 and Q5 of Bacillus sp. Int. J. Environ. Res. Public Health 2020, 17, 4059. [Google Scholar] [CrossRef]
  10. Cui, Z.; Zhang, X.; Yang, H.; Sun, L. Bioremediation of heavy metal pollution utilizing composite microbial agent of Mucor circinelloides, Actinomucor sp. and Mortierella sp. J. Environ. Chem. Eng. 2017, 5, 3616–3621. [Google Scholar] [CrossRef]
  11. Choińska-Pulit, A.; Sobolczyk-Bednarek, J.; Łaba, W. Optimization of copper, lead and cadmium biosorption onto newly isolated bacterium using a Box-Behnken design. Ecotoxicol. Environ. Saf. 2018, 149, 275–283. [Google Scholar] [CrossRef]
  12. Hörstmann, C.; Brink, H.G.; Chirwa, E.M.N. Pb(II) bio-removal, viability, and population distribution of an industrial microbial consortium: The ediect of Pb(II) and nutrient concentrations. Sustainability 2020, 12, 2511. [Google Scholar] [CrossRef]
  13. Neveling, O.; Ncube, T.M.C.; Ngxongo, Z.P.; Chirwa, E.M.N.; Brink, H.G. Microbial Precipitation of Pb(II) with Wild Strains of Paraclostridium bifermentans and Klebsiella pneumoniae Isolated from an Industrially Obtained Microbial Consortium. Int. J. Mol. Sci. 2022, 23, 12255. [Google Scholar] [CrossRef]
  14. Singh, M.; Raorane, C.J.; Alka; Shastri, D.; Raj, V.; Kim, S.-C.; Tuteja, M. Recent Progress on Modified Gum Katira Polysaccharides and Their Various Potential Applications. Polymers 2022, 14, 3648. [Google Scholar] [CrossRef]
  15. Peens, J.; Wu, Y.W.; Brink, H.G. Microbial Pb(II) precipitation: The influence of elevated Pb(II) Concentrations. Chem. Eng. Trans. 2018, 64, 583–588. [Google Scholar] [CrossRef]
  16. Tan, K.L.; Hameed, B.H. Insight into the adsorption kinetics models for the removal of contaminants from aqueous solutions. J. Taiwan Inst. Chem. Eng. 2017, 74, 25–48. [Google Scholar] [CrossRef]
  17. Wang, X.; Liang, X.; Wang, Y.; Wang, X.; Liu, M.; Yin, D.; Xia, S.; Zhao, J.; Zhang, Y. Adsorption of Copper (II) onto activated carbons from sewage sludge by microwave-induced phosphoric acid and zinc chloride activation. Desalination 2011, 278, 231–237. [Google Scholar] [CrossRef]
  18. Largitte, L.; Pasquier, R. A review of the kinetics adsorption models and their application to the adsorption of lead by an activated carbon. Chem. Eng. Res. Des. 2016, 109, 495–504. [Google Scholar] [CrossRef]
  19. Boyd, G.E.; Adamson, A.W.; Myers Jr, L.S. The exchange adsorption of ions from aqueous solutions by organic zeolites. II. Kinetics1. J. Am. Chem. Soc. 1947, 69, 2836–2848. [Google Scholar] [CrossRef]
  20. Langmuir, I. The adsorption of gases on plane surfaces of glass, mica and platinum. J. Am. Chem. Soc. 1918, 40, 1361–1403. [Google Scholar] [CrossRef]
  21. Yang, R.T. Gas Separation by Adsorption Processes; World Scientific: Singapore, 1997; Volume 1, ISBN 1911298100. [Google Scholar]
  22. Do, D.D. Adsorption Analysis: Equilibria and Kinetics (with Cd Containing Computer MATLAB Programs); World Scientific: Singapore, 1998; Volume 2, ISBN 1783262249. [Google Scholar]
  23. Weber, T.W.; Chakravorti, R.K. Pore and solid diffusion models for fixed-bed adsorbers. AIChE J. 1974, 20, 228–238. [Google Scholar] [CrossRef]
  24. Foo, K.Y.; Hameed, B.H. Insights into the modeling of adsorption isotherm systems. Chem. Eng. J. 2010, 156, 2–10. [Google Scholar] [CrossRef]
  25. Bolster, C.H.; Hornberger, G.M. On the Use of Linearized Langmuir Equations. Soil Sci. Soc. Am. J. 2007, 71, 1796–1806. [Google Scholar] [CrossRef]
  26. Freundlich, H.M.F. Over the adsorption in solution. J. Phys. chem 1906, 57, 1100–1107. [Google Scholar]
  27. Berkessa, Y.W.; Mereta, S.T.; Feyisa, F.F. Simultaneous removal of nitrate and phosphate from wastewater using solid waste from factory. Appl. Water Sci. 2019, 9, 28. [Google Scholar] [CrossRef]
  28. Tran, H.N.; You, S.J.; Hosseini-Bandegharaei, A.; Chao, H.P. Mistakes and inconsistencies regarding adsorption of contaminants from aqueous solutions: A critical review. Water Res. 2017, 120, 88–116. [Google Scholar] [CrossRef]
  29. Duma, Z.S.; Sihvonen, T.; Havukainen, J.; Reinikainen, V.; Reinikainen, S.P. Optimizing energy dispersive X-Ray Spectroscopy (EDS) image fusion to Scanning Electron Microscopy (SEM) images. Micron 2022, 163, 103361. [Google Scholar] [CrossRef]
  30. Pearson, K. VII. Note on regression and inheritance in the case of two parents. Proc. R. Soc. London 1895, 58, 240–242. [Google Scholar] [CrossRef]
  31. Han, J.; Kamber, M.; Pei, J. Getting to Know Your Data. In Data Mining; Elsevier: Amsterdam, The Netherlands, 2012; pp. 39–82. [Google Scholar]
  32. Foreman, J. Cosine Distance, Cosine Similarity, Angular Cosine Distance, Angular Cosine Similarity. Available online: https://www.itl.nist.gov/div898/software/dataplot/refman2/auxillar/cosdist.htm (accessed on 27 October 2023).
  33. Goyal, P.; Sharma, P.; Srivastava, S.; Srivastava, M.M. Saraca indica leaf powder for decontamination of Pb: Removal, recovery, adsorbent characterization and equilibrium modeling. Int. J. Environ. Sci. Technol. 2008, 5, 27–34. [Google Scholar] [CrossRef]
  34. Katsou, E.; Malamis, S.; Tzanoudaki, M.; Haralambous, K.J.; Loizidou, M. Regeneration of natural zeolite polluted by lead and zinc in wastewater treatment systems. J. Hazard. Mater. 2011, 189, 773–786. [Google Scholar] [CrossRef] [PubMed]
  35. Lazim, Z.M.; Hadibarata, T.; Puteh, M.H.; Yusop, Z. Adsorption characteristics of bisphenol A onto low-cost modified phyto-waste material in aqueous solution. Water Air Soil Pollut. 2015, 226, 34. [Google Scholar] [CrossRef]
  36. Gupta, A.; Sharma, V.; Sharma, K.; Kumar, V.; Choudhary, S.; Mankotia, P.; Kumar, B.; Mishra, H.; Moulick, A.; Ekielski, A.; et al. A review of adsorbents for heavy metal decontamination: Growing approach to wastewater treatment. Materials 2021, 14, 4702. [Google Scholar] [CrossRef]
  37. Muedi, K.L.L.; Brink, H.G.G.; Masindi, V.; Maree, J.P.P. Effective removal of arsenate from wastewater using aluminium enriched ferric oxide-hydroxide recovered from authentic acid mine drainage. J. Hazard. Mater. 2021, 414, 125491. [Google Scholar] [CrossRef]
  38. Wang, J.; Guo, X. Adsorption kinetic models: Physical meanings, applications, and solving methods. J. Hazard. Mater. 2020, 390, 122156. [Google Scholar] [CrossRef]
  39. Guo, X.; Wang, J. A general kinetic model for adsorption: Theoretical analysis and modeling. J. Mol. Liq. 2019, 288, 111100. [Google Scholar] [CrossRef]
  40. Vishan, I.; Saha, B.; Sivaprakasam, S.; Kalamdhad, A. Evaluation of Cd (II) biosorption in aqueous solution by using lyophilized biomass of novel bacterial strain Bacillus badius AK: Biosorption kinetics, thermodynamics and mechanism. Environ. Technol. Innov. 2019, 14, 100323. [Google Scholar] [CrossRef]
  41. Sato, H.; Yui, M.; Yoshikawa, H. Ionic Diffusion Coefficients of Cs, Pb2+, Sm3+, Ni2+, SeO2-4 and TcO−4 in Free Water Determined from Conductivity Measurements. J. Nucl. Sci. Technol. 1996, 33, 950–955. [Google Scholar] [CrossRef]
  42. Sick, T. Synthesis and Characterization of Nanoporous Covalent Organic Frameworks for Optoelectronic Applications. Ph.D. Thesis, LMU Munich, Munich, Germany, 2018. [Google Scholar]
  43. Ruthven, D.M. Principles of Adsorption and Adsorption Processes; John Wiley & Sons: Hoboken, NJ, USA, 1984; ISBN 0471866067. [Google Scholar]
  44. Kowanga, K.D.; Gatebe, E.; Mauti, G.O.; Mauti, E.M. Kinetic, sorption isotherms, pseudo-first-order model and pseudo-second-order model studies of Cu (II) and Pb (II) using defatted Moringa oleifera seed powder. J. Phytopharm. 2016, 5, 71–78. [Google Scholar] [CrossRef]
  45. Igwe, J.C.; Abia, A.A. Equilibrium sorption isotherm studies of Cd (II), Pb (II) and Zn (II) ions detoxification from waste water using unmodified and EDTA-modified maize husk. Electron. J. Biotechnol. 2007, 10, 536–548. [Google Scholar] [CrossRef]
  46. Ge, X.; Wu, Z.; Wu, Z.; Yan, Y.; Cravotto, G.; Ye, B.-C. Microwave-assisted modification of activated carbon with ammonia for efficient pyrene adsorption. J. Ind. Eng. Chem. 2016, 39, 27–36. [Google Scholar] [CrossRef]
  47. Asuquo, E.; Martin, A.; Nzerem, P.; Siperstein, F.; Fan, X. Adsorption of Cd (II) and Pb (II) ions from aqueous solutions using mesoporous activated carbon adsorbent: Equilibrium, kinetics and characterisation studies. J. Environ. Chem. Eng. 2017, 5, 679–698. [Google Scholar] [CrossRef]
  48. Hamilton, T.; Huai, Y.; Peng, Y. Lead adsorption on copper sulphides and the relevance to its contamination in copper concentrates. Miner. Eng. 2020, 154, 106381. [Google Scholar] [CrossRef]
  49. Macías-García, A.; Valenzuela-Calahorro, C.; Espinosa-Mansilla, A.; Bernalte-García, A.; Gómez-Serrano, V. Adsorption of Pb2+ in aqueous solution by SO2-treated activated carbon. Carbon N. Y. 2004, 42, 1755–1764. [Google Scholar] [CrossRef]
  50. Li, F.; Wang, X.; Yuan, T.; Sun, R. A lignosulfonate-modified graphene hydrogel with ultrahigh adsorption capacity for Pb(II) removal. J. Mater. Chem. A 2016, 4, 11888–11896. [Google Scholar] [CrossRef]
  51. Mohapatra, R.K.; Parhi, P.K.; Pandey, S.; Bindhani, B.K.; Thatoi, H.; Panda, C.R. Active and passive biosorption of Pb(II)using live and dead biomass of marine bacterium Bacillus xiamenensis PbRPSD202: Kinetics and isotherm studies. J. Environ. Manag. 2019, 247, 121–134. [Google Scholar] [CrossRef]
  52. Muñoz, A.J.; Espínola, F.; Moya, M.; Ruiz, E. Biosorption of Pb(II) Ions by Klebsiella sp. 3S1 Isolated from a Wastewater Treatment Plant: Kinetics and Mechanisms Studies. Biomed Res. Int. 2015, 2015, 719060. [Google Scholar] [CrossRef]
  53. Thommes, M.; Kaneko, K.; Neimark, A.V.; Olivier, J.P.; Rodriguez-Reinoso, F.; Rouquerol, J.; Sing, K.S.W. Physisorption of Gases, with Special Reference to the Evaluation of Surface Area and Pore Size Distribution (IUPAC Technical Report). Pure Appl. Chem. 2015, 87, 1051–1069. [Google Scholar] [CrossRef]
  54. Kowalczuk, P.B.; Drzymala, J. Physical meaning of the Sauter mean diameter of spherical particulate matter. Part. Sci. Technol. 2016, 34, 645–647. [Google Scholar] [CrossRef]
  55. Levin, P.A.; Angert, E.R. Small but mighty: Cell size and bacteria. Cold Spring Harb. Perspect. Biol. 2015, 7, a019216. [Google Scholar] [CrossRef] [PubMed]
  56. Pareek, N.; Gillgren, T.; Jönsson, L.J. Adsorption of proteins involved in hydrolysis of lignocellulose on lignins and hemicelluloses. Bioresour. Technol. 2013, 148, 70–77. [Google Scholar] [CrossRef]
  57. Gale, M.; Nguyen, T.; Moreno, M.; Gilliard-Abdulaziz, K.L. Physiochemical Properties of Biochar and Activated Carbon from Biomass Residue: Influence of Process Conditions to Adsorbent Properties. ACS Omega 2021, 6, 10224–10233. [Google Scholar] [CrossRef]
  58. Nekvapil, F.; Mihet, M.; Lazar, G.; Pinzaru, S.C.; Gavrilović, A.; Ciorîță, A.; Levei, E.; Tamaș, T.; Soran, M.L. Comparative Analysis of Composition and Porosity of the Biogenic Powder Obtained from Wasted Crustacean Exoskeletonsafter Carotenoids Extraction for the Blue Bioeconomy. Water 2023, 15, 2591. [Google Scholar] [CrossRef]
  59. Venkatesan, S.; Pugazhendy, K.; Sangeetha, D.; Vasantharaja, C.; Prabakaran, S.; Meenambal, M. Fourier transform infrared (FT-IR) spectoroscopic analysis of Spirulina. Int. J. Pharm. Biol. Arch 2012, 3, 969–972. [Google Scholar]
  60. Muruganantham, S.; Anbalagan, G.; Ramamurthy, N. FT-IR and SEM-EDS comparative analysis of medicinal plants, Eclipta alba Hassk and Eclipta prostrata Linn. Rom. J. Biophys. 2009, 19, 285–294. [Google Scholar]
  61. Tipson, R.S. Infrared Spectroscopy of Carbohydrates: A Review of the Literature; National Institute of Standards and Technology: Gaithersburg, MD, USA, 1968.
  62. Lingegowda, D.C.; Kumar, J.K.; Prasad, A.D.; Zarei, M.; Gopal, S. FTIR spectroscopic studies on cleome gynandra-Comparative analysis of functional group before and after extraction. Rom. J. Biophys 2012, 22, 137–143. [Google Scholar]
  63. Sitko, R.; Turek, E.; Zawisza, B.; Malicka, E.; Talik, E.; Heimann, J.; Gagor, A.; Feist, B.; Wrzalik, R. Adsorption of divalent metal ions from aqueous solutions using graphene oxide. Dalt. Trans. 2013, 42, 5682–5689. [Google Scholar] [CrossRef]
  64. Alizadeh, B.; Ghorbani, M.; Salehi, M.A. Application of polyrhodanine modified multi-walled carbon nanotubes for high efficiency removal of Pb(II) from aqueous solution. J. Mol. Liq. 2016, 220, 142–149. [Google Scholar] [CrossRef]
  65. Li, K.; Cao, J.; Li, H.; Liu, J.; Lu, M.; Tang, D. Nitrogen functionalized hierarchical microporous/mesoporous carbon with a high surface area and controllable nitrogen content for enhanced lead(II) adsorption. RSC Adv. 2016, 6, 92186–92196. [Google Scholar] [CrossRef]
  66. Salimon, J.; Abdullah, B.M.; Salih, N. Hydrolysis optimization and characterization study of preparing fatty acids from Jatropha curcas seed oil. Chem. Cent. J. 2011, 5, 67. [Google Scholar] [CrossRef] [PubMed]
  67. Francioso, O.; Rodriguez-Estrada, M.T.; Montecchio, D.; Salomoni, C.; Caputo, A.; Palenzona, D. Chemical characterization of municipal wastewater sludges produced by two-phase anaerobic digestion for biogas production. J. Hazard. Mater. 2010, 175, 740–746. [Google Scholar] [CrossRef] [PubMed]
  68. Liu, Y.; Alessi, D.S.; Owttrim, G.W.; Kenney, J.P.L.; Zhou, Q.; Lalonde, S.V.; Konhauser, K.O. Cell surface acid-base properties of the cyanobacterium Synechococcus: Influences of nitrogen source, growth phase and N:P ratios. Geochim. Cosmochim. Acta 2016, 187, 179–194. [Google Scholar] [CrossRef]
  69. Yang, X.; Cui, X. Adsorption characteristics of Pb (II) on alkali treated tea residue. Water Resour. Ind. 2013, 3, 1–10. [Google Scholar] [CrossRef]
  70. Atieh, M.A.; Bakather, O.Y.; Al-Tawbini, B.; Bukhari, A.A.; Abuilaiwi, F.A.; Fettouhi, M.B. Effect of carboxylic functional group functionalized on carbon nanotubes surface on the removal of lead from water. Bioinorg. Chem. Appl. 2010, 2010, 603978. [Google Scholar] [CrossRef]
  71. Sheng, P.X.; Ting, Y.P.; Chen, J.P.; Hong, L. Sorption of lead, copper, cadmium, zinc, and nickel by marine algal biomass: Characterization of biosorptive capacity and investigation of mechanisms. J. Colloid Interface Sci. 2004, 275, 131–141. [Google Scholar] [CrossRef]
  72. Muhaisen, L.F. Nickel Ions Removal From Aqueous Solutions Using Sawdust As Adsorbent: Equilibrium, Kinetic and Thermodynamic Studies. J. Eng. Sustain. Dev. 2017, 21, 60–71. [Google Scholar]
  73. Ryu, S.R.; Noda, I.; Jung, Y.M. What is the origin of positional fluctuation of spectral features: True frequency shift or relative intensity changes of two overlapped bands? Appl. Spectrosc. 2010, 64, 1017–1021. [Google Scholar] [CrossRef]
  74. Tao, Y.; Zhang, C.; Lü, T.; Zhao, H. Removal of Pb (II) ions from wastewater by using polyethyleneimine-functionalized Fe3O4 magnetic nanoparticles. Appl. Sci. 2020, 10, 948. [Google Scholar] [CrossRef]
  75. Hu, X.; Cao, J.; Yang, H.; Li, D.; Qiao, Y.; Zhao, J.; Zhang, Z.; Huang, L. Pb2+ biosorption from aqueous solutions by live and dead biosorbents of the hydrocarbon-degrading strain Rhodococcus sp. HX-2. PLoS ONE 2020, 15, e0226557. [Google Scholar] [CrossRef]
  76. Selatnia, A.; Boukazoula, A.; Kechid, N.; Bakhti, M.Z.; Chergui, A.; Kerchich, Y. Biosorption of lead (II) from aqueous solution by a bacterial dead Streptomyces rimosus biomass. Biochem. Eng. J. 2004, 19, 127–135. [Google Scholar] [CrossRef]
  77. He, Y.; Wu, P.; Xiao, W.; Li, G.; Yi, J.; He, Y.; Chen, C.; Ding, P.; Duan, Y. Efficient removal of Pb (II) from aqueous solution by a novel ion imprinted magnetic biosorbent: Adsorption kinetics and mechanisms. PLoS ONE 2019, 14, e0213377. [Google Scholar] [CrossRef] [PubMed]
  78. Ifthikar, J.; Wang, T.; Khan, A.; Jawad, A.; Sun, T.; Jiao, X.; Chen, Z.; Wang, J.; Wang, Q.; Wang, H.; et al. Highly Efficient Lead Distribution by Magnetic Sewage Sludge Biochar: Sorption Mechanisms and Bench Applications. Bioresour. Technol. 2017, 238, 399–406. [Google Scholar] [CrossRef]
  79. Wang, S.; Guo, W.; Gao, F.; Yang, R. Characterization and Pb(II) removal potential of corn straw- and municipal sludge-derived biochars. R. Soc. Open Sci. 2017, 4, 170402. [Google Scholar] [CrossRef] [PubMed]
  80. Rozada, F.; Otero, M.; Morán, A.; García, A.I. Adsorption of heavy metals onto sewage sludge-derived materials. Bioresour. Technol. 2008, 99, 6332–6338. [Google Scholar] [CrossRef] [PubMed]
Figure 1. Graph of Pb(II) removal by metabolically inhibited (a) consortium, (b) P. bifermentans, (c) K. pneumoniae, (d) sewage sludge, (e) commercial 1 bacteria, and (f) commercial 2 bacteria.
Water 15 04259 g001
Figure 2. Two-phase pseudo-first-order kinetics of Pb(II) onto metabolically inactive adsorbents. The shaded area represents the 95% prediction interval [37].
Water 15 04259 g002
Figure 3. Two-surface Langmuir isotherm for metabolically inactive adsorbents. The shaded area represents the 95% prediction interval.
Water 15 04259 g003
Figure 4. SEM images for (a) SS, (b) C1, (c) C2, (d) Cons, (e) KP, (f) PB.
Water 15 04259 g004
Figure 5. Pseudo color images of EDS maps and corresponding EDS spectra on (af) SS, (gl) C1, (mr) C2, (sx) Cons, (ydd) KP, (eejj) PB (indicated on the left). The maps represent Pb, S, C, O, N, and the EDS spectra (as indicated at the top).
Water 15 04259 g005
Figure 6. The (a) correlation coefficients and (b) cosine similarities for the relationships between the respective elements observed using EDS depicted in Figure 5. (c) The relationship between the correlation coefficients and cosine similarities presented in (a,b).
Water 15 04259 g006
Figure 7. The full FTIR spectrum (a,c,e,g,i,k) and deconvoluted spectrum, with colored lines indicating the deconvoluted peaks (b,d,f,h,j,l), for the (a,b) SS; (c,d) C1; (e,f) C2; (g,h) Cons; (i,j) PB; (k,l) and KP biosorbents.
Water 15 04259 g007
Table 1. Experimental data for fitted kinetic models for Pb(II) adsorption to metabolically inactive adsorbents.
AdsorbentsSSC1C2ConsPBKP
Two-Phase Pseudo-First-Order
Q t (mg/g)58.0454.6250.5551.1631.1523.14
PercentFast48.7162.6094.0240.3154.9984.33
Q e ,   f a s t   ( mg/g)28.2734.1947.5320.6217.1319.51
Q e ,   s l o w (mg/g)29.7720.433.0230.5414.023.63
k f a s t (1/min)0.0842.4910.5131.1130.1490.662
k s l o w (1/min)0.0140.0600.0570.2080.0080.102
R 2 0.9990.99910.9930.9850.986
SSE0.8001.8350.01316.5310.335.946
Sy.x0.5160.6770.0662.0331.6071.408
RMSE0.3650.5530.0461.5371.2151.09
Pseudo-Second-Order
Q t (mg/g)61.5855.1351.0152.8227.9423.33
k 2 (g/mg·min)0.00080.00090.02840.01200.00340.0589
R 2 0.9990.9960.9990.9910.9770.985
SSE1.78110.470.37220.5216.256.408
Sy.x0.5971.4470.2731.8491.6461.266
RMSE0.5451.3210.2491.7121.5241.132
Pseudo-First-Order
Q t (mg/g)52.9652.5350.1750.7124.9223.10
k 1 (1/min)0.0400.2640.4390.3730.0750.420
R 2 0.9890.9790.9990.9880.9490.986
SSE28.5148.881.14728.8835.796.002
Sy.x2.3883.1270.4792.1942.4421.225
RMSE2.182.8540.4372.0312.2611.096
Crank Mass Transfer Model
Q t ( m g / g ) 58.1653.4250.2151.182723.10
k2.6 × 10−52.4 × 10−45.7 × 10−43.5 × 10−44.5 × 10−55.4 × 10⁻⁴
D e   ( m 2 / s ) 2.6 × 10−132.4 × 10−125.7 × 10−123.5 × 10−124.5 × 10−135.4 × 10⁻¹²
R 2 0.9920.9880.9990.9930.9770.986
SSE22.1128.280.94716.6816.636.002
Sy.x2.1032.3780.4351.6671.6651.225
RMSE1.922.1710.3971.5441.5411.096
Table 2. Isotherm parameters for the adsorption of Pb(II) by metabolically inactive adsorbents.
AdsorbentsSSC1C2ConsPBKP
Two-Surface Langmuir
Q m a x 1 (mg/g)72.4686.0752.61 0 45.8246.13
Q m a x 2 (mg/g)83.83144.20156.70221.40430.80223.60
K L 1   ( L/mg)
K L 2   ( L/mg)0.0240.0350.0220.0250.00130.015
R 2 0.8270.8330.7370.7880.6480.664
SSE74462381833143263321916647731
Sy.x13.3121.6125.4925.9821.3630.59
RMSE13.0121.2025.0125.3420.8730.01
Langmuir
Q m a x (mg/g)141.20208.50193.80220.40153.20217.70
K L (L/mg)3.680.2580.0580.0250.0220.043
R L 0.003–0.00050.04–0.0060.145–0.0280.29–0.0640.48–0.110.32–0.06
R 2 0.6480.6440.6810.7880.3500.568
SSE151165266640210262823537161358
Sy.x18.7531.8227.8125.6328.6834.03
RMSE18.5431.5227.5425.3228.3534.03
Freundlich
K f (L/mg)82.9689.7654.5533.3921.1734.39
n10.116.1724.5163.2952.9732.804
R 2 0.8020.8260.7070.7030.4960.628
SSE85042568636942368052745952938
Sy.x14.0622.2326.6530.3325.2731.91
RMSE13.9022.0126.4029.9624.9831.60
Table 3. BET and BJH characterization of metabolically inactive adsorbents.
AdsorbentsBET Surface Area (m2/g)Sauter Equivalent Diameter (μm)
SS0.2031
C10.08372
C20.021290
Cons0.06592
PB0.025240
KP0.017350
Table 4. FTIR frequency range and functional groups present in the metabolically inhibited adsorbents.
Wavenumber (1/cm)BondFunctional GroupAdsorbentReference
553C–C, C–N, -CH2C–C and C–N ring deformation; CH2 wagging and rockingSS, C1, C2[59]
1034–1080C–O–C, S=OEthers, symmetric stretching of S=OSS, C1, C2[50,60,61]
1240C=O, C=SAlkyl ketone, thioketone stretchingSS, C1, C2[62]
1375-CH2, S=OCH2 wagging, sulphonic ester stretchingSS, C1, C2[59,61]
1525C=OStretching vibration in ketones and estersSS, C1, C2[62]
1575C=CStretching vibration in alkenesSS, C1, C2[62,63]
1635C=O, C–C, N–H, C=N, C–N, Stretching vibration in aldehydes and ketones. N –H vibration coupled with C=N bending vibration or C–N stretchingSS, C1, C2,
Cons, PB, KP
[50,62,64,65]
1665C=O, C=SStretching vibration in ketones, aldehydes, and esters/thioestersSS[61,62]
2000-2200C≡C, C≡N, C=SAlkynes, nitrile, isothiocyanate asymmetric stretchingCons, PB, KP[61,66]
2924–2934-CH2Stretching vibration of C–HSS, C1, C2[62,65]
Circa 3400C–OHHydroxyl groupSS, C1, C2,
Cons, PB, KP
[62,65]
Circa 3790O–H stretchingAlcoholSS, C1, C2[66]
Table 5. Desorption efficiency and amount of Pb(II) desorbed by metabolically inactive adsorbents.
AdsorbentsPb(II) Desorbed 1st CyclePb(II) Desorbed 2nd Cycle
(%) Q d (mg/g)(%) Q d (mg/g)
SS72.3564.9714.0313.45
C168.6270.642.323.26
C269.7371.463.354.08
Cons69.5866.760.872.11
PB60.9950.160.742.43
KP72.3879.534.9412.32
Table 6. Langmuir adsorption capacity for Pb(II) on adsorbents from previous studies.
Adsorbent Description Q m a x
(mg/g)
Reference
Rhodococcus sp. HX-288.74[75]
Streptomyces rimosus135[76]
Ion-imprinted magnetic biosorbent116.28[77]
Magnetic sewage sludge biochar99.90[78]
Sludge-derived biochar40.80[79]
Pyrolyzed sewage sludge40.30[80]
Raw WAS307[6]
Z n C l 2 -activated WAS274[6]
SS141.20This study
C1208.50This study
C2193.80This study
Cons220.40This study
PB153.20This study
KP217.70This study
Disclaimer/Publisher’s Note: The statements, opinions and data contained in all publications are solely those of the individual author(s) and contributor(s) and not of MDPI and/or the editor(s). MDPI and/or the editor(s) disclaim responsibility for any injury to people or property resulting from any ideas, methods, instructions or products referred to in the content.

