Article

Spatial and Temporal Variation in the Fish Diversity in Dianchi Lake and the Influencing Factors

1
College of Agronomy and Life Sciences, Kunming University, Kunming 650214, China
2
Faculty of Geography, Yunnan Normal University, Kunming 650500, China
3
College of Architecture and Civil Engineering, Kunming University, Kunming 650214, China
4
State Key Laboratory of Pollution Control & Resource Reuse, School of the Environment, Nanjing University, Nanjing 210023, China
*
Authors to whom correspondence should be addressed.
Water 2023, 15(24), 4244; https://doi.org/10.3390/w15244244
Submission received: 2 November 2023 / Revised: 7 December 2023 / Accepted: 9 December 2023 / Published: 11 December 2023

Abstract

:
The survey of fish diversity is an important part of the protection of the ecological health of rivers and lakes. Environmental DNA technology is a new tool to improve the accuracy of traditional morphological surveys of biodiversity and to monitor the amount of diversity. At present, there are few studies on monitoring fish diversity in lake inlets using eDNA technology. In this study, we used various types of estuaries in the Dianchi basin as the research object, used environmental DNA technology to monitor the fish diversity in typical estuaries, and analyzed the temporal and spatial changes and the relationship between environmental factors and fish diversity. In the Dianchi basin, we identified a total of 63 fish species belonging to 8 different orders, 21 families, and 51 genera across two seasons. The Carpidae family had the highest number of species, with Carassius auratus being the most prevalent species. The Shannon index analysis yielded a p-value of 0.0018 (<0.05), suggesting significant seasonal variations in the fish community structure within the typical estuaries of the Dianchi basin. Furthermore, the β-diversity accounted for 59.6% and 57% of the variations in fish communities among the various estuary types in March and July, respectively. Fish species varied considerably between estuaries, with Carassius auratus, Cyprinus carpio, Rhodeus sinensis, Acheilognathus chankaensis, and Coilia nasus all occurring at various points. The agricultural estuary differed substantially from the urban, suburban, and lake areas. Redundancy analysis revealed that the fish community structure during the dry period was primarily influenced by total phosphorus, pH, total nitrogen (TN), and chlorophyll. Conversely, during the rich period, the fish community structure was mainly influenced by dissolved oxygen and TN. This study demonstrated the utilization of environmental DNA technology in assessing the ecological health of rivers and lakes, specifically highlighting its effectiveness in exposing the ecological condition of a representative Dianchi estuary.

1. Introduction

Fish play a crucial role in biodiversity, representing 53% of all vertebrates on Earth. China has an even larger variety of fish, with a species count that surpasses the global average, accounting for 61% of China’s vertebrates [1]. Preserving a rich variety of fish species is crucial not only for upholding global biodiversity but also for ensuring the ecological well-being of lakes. Presently, the primary approaches employed for assessing fish diversity include physical capture assays and environmental DNA (eDNA) metabarcoding methods. The physical capture method is a conventional approach to assessing fish biodiversity, involving the capture and subsequent morphological identification of fish specimens to determine the species present in a given region. Subsequently, the fish are subjected to weighing quantification, and their abundance is computed to acquire data regarding the variety and spatial and temporal dispersion of the fish population in the river [2,3]. However, because fish are removed for counting, this method is not only expensive in terms of people and material resources but also seriously affects other creatures in the river, particularly fish biodiversity, which can take a long time to return to its normal ecological state.
Environmental DNA metabarcoding is a high-throughput sequencing technology that identifies species in the environment and permits biodiversity evaluation. It requires extracting eDNA from various sources, such as water, soil, and air, amplifying it using primers in a polymerase chain reaction (PCR), and then repeating the process [4]. This novel technique for monitoring environmental biodiversity is faster, more precise, and less intrusive on the natural environment compared to traditional methods. Additionally, it is not affected by the subjective opinions of researchers when identifying species [5]. Consequently, it is partially revolutionizing the way we assess the Earth’s biodiversity [4]. This approach is being employed extensively in the identification of fish species present in aquatic environments [6]. The eDNA metabarcoding approach was initially utilized in microbiological research throughout the latter part of the 20th century, primarily for the purpose of investigating the categorization of bacteria and their metabolic activities [7,8]. Since its standardization in 2003, DNA barcoding has been progressively utilized for monitoring many aquatic organisms, including benthos, fish, and amphibians [9,10]. In 2017, the technology was employed to analyze the fish diversity in a reservoir. It successfully identified not only all fish species previously observed by conventional methods but also discovered 11 previously unknown fish species [11]. This method was effectively used to identify the diversity of fish species in both marine and freshwater sources [12].
Using a mitochondrial COI fragment as a marker, researchers effectively identified 22 fish species in the waters of the Pearl River Estuary in Hong Kong [13]. eDNA approaches have higher detection rates at sites than findings that are acquired using standard methods. In the Lake Tai basin, DNA metabarcoding techniques discovered an increased total number of fish compared to traditional capture methods. Furthermore, the detection rates were higher for less abundant, smaller, and individual species, including gobies, as opposed to traditional capture methods. eDNA has a higher level of sensitivity compared to capture-based sample approaches when it comes to detecting rare species, invading creatures, and uncommon species, such as the mosquito-eating fish Gambusia affinis (Baird and Girard) [14,15].
This study employed eDNA technology to efficiently and cost-effectively monitor fish populations in the Dianchi basin’s typical estuaries, requiring less time than conventional monitoring techniques. Conventional monitoring techniques necessitated a time of 12 h to collect fish samples in the Dianchi basin [16]. In comparison, fixed-point sampling for the eDNA monitoring of Fuxian Lake and the Dianchi basin took a maximum of 1 h. When employing high-throughput barcoding technology in conjunction with eDNA, Jeder et al. spent only 0.174 days monitoring Cyprinus carpio, compared to 93 days using the electrofishing monitoring method [17]. This highlights the benefit of eDNA technology in relation to the duration required for sampling. Furthermore, this study successfully identified endangered fish species, including Yunnan catfish, by utilizing eDNA in conjunction with high-throughput barcoding. This demonstrates the effectiveness of the eDNA technique in monitoring fish populations in Yunnan’s lakes.
Nevertheless, this outcome could potentially be a misleading indication, since it was only observed at one out of the 10 sample locations. Therefore, future studies should include many repetitions to ensure accuracy. In addition, the eDNA technique was employed to monitor endangered fish species, yielding dependable outcomes and demonstrating its feasibility in this study [7]. However, the eDNA technology was unable to accurately identify all the observed operational taxonomic units (OTUs) at the species level. Hence, it is advisable to currently employ a blend of eDNA methodologies and conventional monitoring methods to investigate fish diversity in the Dianchi basin, specifically for identifying fish diversity in the highland lakes of central Yunnan.
We employed eDNA macro barcodes to observe variations in fish composition during spatial and temporal fluctuations in various types of lake inlet estuaries within the Dianchi basin. The dominant fish species in the Dianchi basin in both periods were Carassius auratus (OTUs10306), Cyprinus carpio (OTUs3993), Misgurnus anguillicaudatus (OTUs2730), Hyporhamphus intermedius (OTUs1757), Hypophthalmichthys nobilis (OTUs384), and Acrossocheilus yunnanensis (OTUs911), where Carassius auratus, cyprinus carpio, Acrossocheilus yunnanensis, and Hyporhamphus intermedius are the indigenous fishes of Dianchi, which are gradually decreasing due to the influence of water quality, climate, humans, and other factors. The monitoring of native fishes in this study reflects the improvement in the water ecological health of Dianchi. Additionally, we examined the impact of alterations in aquatic environmental factors on fish diversity in the Dianchi basin. We aimed to produce new perspectives for the management and preservation of the Dianchi basin’s aquatic ecosystem.

2. Materials and Methods

2.1. Determination of the Sampling Points

Dianchi is located in Kunming, Yunnan Province, China, and the lake covers an area of 2920 km2. It is a first-order tributary on the lower right bank of the Jinsha River, the Yangtze River’s main stream. The Panlong River (D1), Baoxiang River (D2), Cailian River (D3), Luoyu River (D4), Nanchong River (D5), Dahe River (D6), Chai River (D7), Dongda River (D8), and Dachun River (D9) are among the approximately 35 rivers of all sizes that flow into Dianchi Lake in a centripetal fashion from the north, east, and south [18]. The rivers flowing into Dianchi can be categorized into four types based on their geographical locations and the contaminants they transport. These types include urban-type, suburban-type, agricultural-type, and estuaries with improved water quality [19]. The Panlong River and Cailian River traverse the urban region of Kunming and transport a substantial quantity of urban wastewater upon merging with Dianchi Lake, classifying them as characteristic urban estuaries within the Dianchi basin [20]. The Baoxiang River and Luoyu River are representative examples of suburban estuaries in the Dianchi basin. The water quality of these rivers, and consequently the lakes in Dianchi, is affected by the runoff from agricultural areas [21,22,23,24].
Furthermore, the Da River is a representative estuary with characteristics commonly found in suburban areas. The Dahe, Chaihe, and Dongdahe rivers are significant regions for vegetable and flower production. These areas experience high levels of land use and utilize a substantial amount of chemical fertilizers, organic fertilizers, and pesticides. They can be classified as agricultural-type estuaries [25]. Additionally, the Nanchonghe and Dachunhe rivers exhibit superior water quality areas in the southern region of Dianchi [26]. As a result, we eventually chose (Table 1), based on the specific characteristics of the above river flow area and the pollution situation, to be used for the fish diversity study (Figure 1).
The difference between abundant and dry periods has a great impact on the fish species in the watershed. Therefore, we sampled 10 sites in March (dry season) and July (rich time), and 10 L of water samples were taken from each site for eDNA and water quality tests to assess the spatial and temporal diversity of fishes in the Dianchi basin.

2.2. Sample Collection and Storage

The water samples were initially placed in sterilized wide-mouth bottles and, after that, introduced into a multi-channel water DNA filter (acquired from Nanjing Ekino Environmental Technology Co., Ltd., Nanjing, China) equipped with a 0.45 μm mixed cellulose filter membrane Zinten (Tianjin, China) for vacuum filtering. Subsequently, the membranes were preserved in a refrigerator at a temperature of −80 °C [27].

2.3. The Extraction of Total Aqueous DNA

The DNeasy Blood and Tissue Kit (Qiagen, Hilden, Germany) was used to extract the total aqueous DNA. The procedure involved placing the vacuum-filtered membrane in a 5 mL freezing tube, adding 0.2 g of Glass Beads X and 450 mL of Buffer ATL, mixing all completely, and centrifuging the mixture at 1300 rpm. Next, 30 μL of Proteinase K was introduced into the frozen tube and thoroughly mixed. The mixture was then subjected to centrifugation at a speed of 1300× g revolutions per minute for 10 s. Subsequently, the tube was placed in a water bath set at a temperature of 56 °C for a duration of 2 to 3 h until the membrane was fully dissolved. It was then centrifuged at 4000 rpm for 1 min after spinning for 15 s. The supernatant was then transferred to a fresh 2 mL tube and centrifuged at 13,000 rpm for 1 min. Following a one-minute centrifugation at 13,000 rpm, the supernatant was transferred to a fresh 2 mL tube, 400 μL of Buffer AL was added, and the entire mixture was thoroughly dissolved before the tube was placed in a 56 °C bath for 10 min. Subsequently, 400 μL of anhydrous ethanol was added, centrifuged for one minute at 13,000 rpm, and the supernatant was aspirated into the adsorption column. After that, 700 μL of Buffer AL was added to the adsorption column and the filtrate was eliminated. The filtrate was disposed of after adding 700 μL of Buffer AW1 to the column and centrifuging it for 1 min at 13,000 g. Subsequently, the column was filled with 700 μL of Buffer AW2, spun for one minute at 17,000 g, moved to a fresh 1.5 mL centrifuge tube, filled with 100 μL of Buffer AE, allowed to stand at room temperature for 2 min, and then centrifuged for an additional 2 min at 12,000 r/min. Finally, centrifugation was performed for 2 min at a speed of 12,000 revolutions per minute, and the resulting total aqueous DNA was collected and stored in a refrigerator at −80 °C [27].

2.4. Evaluation of Universal Detection Primers for Fish Screening

Three pairs of universal primers, namely Teleo [28], MiFish [29], and 1634 M [30], were initially selected for screening in fish identification (Table 2). The base sequences of these primers are presented in Table 2. Subsequently, a 2 × Taq PCR Mastermix (Novozymes, Bagsværd, Denmark) kit was employed to identify fish in the entirety of the aqueous DNA sample. The PCR reactions were prepared by combining 15 μL of 2 × Taq PCR Mastermix, 1 μL each of the upstream and downstream primers, 2 μL of total aqueous DNA, and 11 μL of ddH2O in sterilized PCR tubes. The total volume of each reaction was 30 μL. The PCR amplification conditions consisted of a pre-denaturation step at 95 °C for 3 min, followed by denaturation at 95 °C for 15 s, annealing at a temperature range of 52–60 °C for 15 s, and extension at 72 °C for 2 s. This cycle was repeated 32 times. Finally, a final extension step was performed at 72 °C for 5 min [31].

2.5. Analysis of the Environmental DNA Metabarcoding Sequencing Data

(1) The software MOTHUR (v1.8.12) was utilized to execute the subsequent procedures: the files were transformed from FASTQ format to FASTA format, and the associated quality files were produced. The comprehensive computing platform QIIME (v1.8.0) was then used to segment the sample sequences based on the various barcodes, and sequences with sequencing error rates greater than 1%, lengths less than 100 bp, and occurrences fewer than two were eliminated. After clustering the sequences into operational taxonomic units (OTUs) at 97% similarity using USEARCH7, the chimeras were eliminated by matching the OTUs to publicly available databases. The number of sequences per OTU in each sample was then determined by matching the sequences to each OTU [32].
(2) Using the Python programming language and the PR2 database (https://github.com/pr2database/pr2database; (accessed on 20 March 2023)), species annotation of the OTUs was carried out. This involved several processes including splicing, removing chimeras, filtering for high quality, and primer removal. Using the QIIME2 program, the remaining sequences were grouped according to >97% similarity; the resulting clusters were designated as OTUs [33].
(3) Using the Brocc annotation technique, the resulting OTU sequences were annotated with the species taxonomy. Any non-fish information was manually edited out of the annotated results. The fish OTUs with identity values > 97% and an e-value < 10–5 were then screened, and the OTUs belonging to the same species were removed. The OTU abundance table corresponding to the next taxonomic level—the genus or family—was obtained for the OTUs that could not be matched to a species [34].
(4) The compositional distribution was displayed at seven taxonomic levels: kingdom, phylum, order, family, genus, and species. The fish OTU abundance tables were annotated [6]. The number and diversity of fish in various seasons and types of rivers were assessed using relative abundance comparisons, principal coordinate analysis methods, and research techniques such as the Shannon and Simpson indices.

2.6. Identification of the Environmental Factors

In this experiment, a comprehensive assessment of 10 environmental parameters was conducted in the Dianchi basin. The pH and dissolved oxygen (DO), chemical oxygen demand (COD), and total dissolved solids were measured using specific devices: a portable water quality parameter meter (HACHSL1000, Colorado, USA) for pH and DO, a Hash COD meter (DR2800) for COD, and a conductivity meter for total dissolved solids. The levels of nitrite nitrogen (NO2-N) and nitrate nitrogen (NO3-N) were quantified using ion chromatography (Thermo Fisher ICS5000+, Waltham, MA, USA), whereas the concentration of chlorophyll a was determined using high-performance liquid chromatography. The concentrations of ammonia (NH3-N), total phosphorus (TP), and total nitrogen (TN) were measured using the spectrophotometry method, which is the national standard. The quantification of total ammonia nitrogen (TAN) levels was performed using the ammonia reagent method, which is often used in water and wastewater treatment.

3. Results

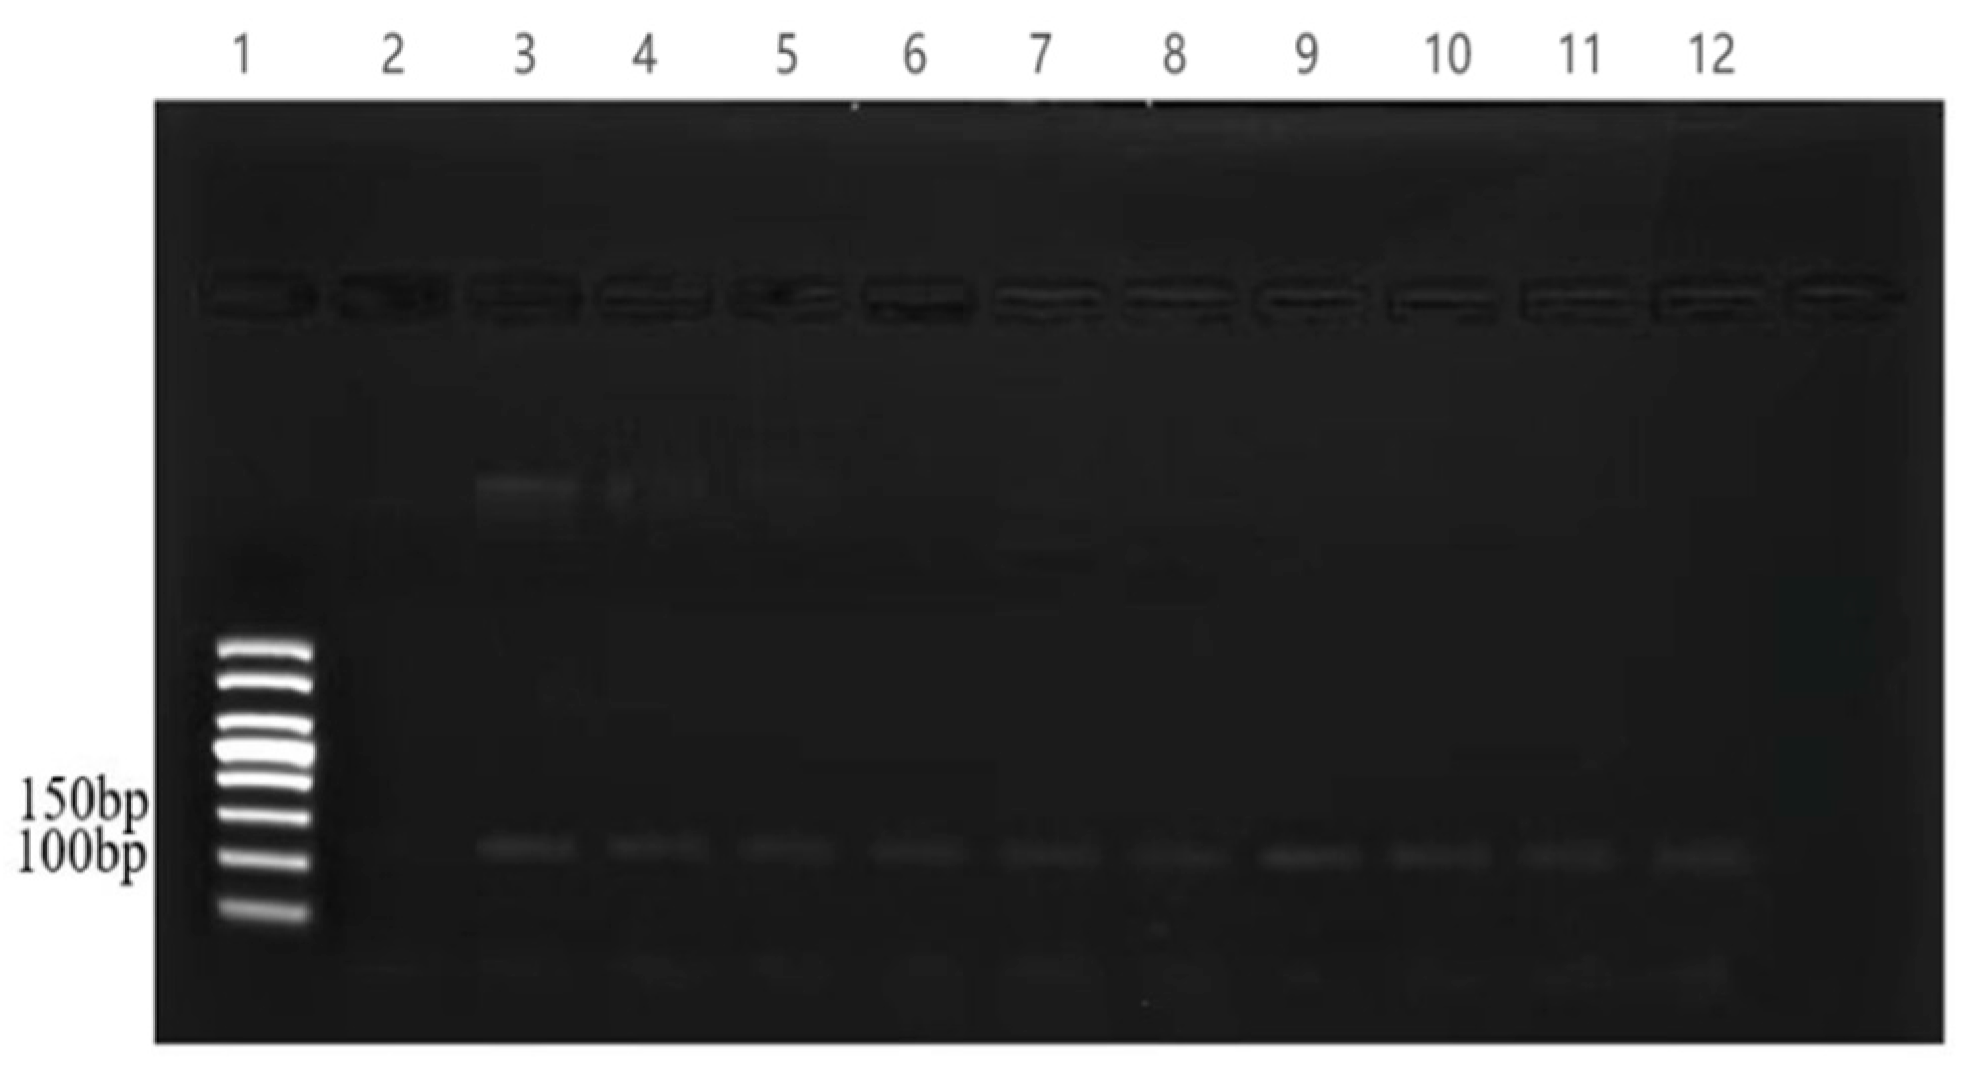
3.1. Screening of the Universal Primer for the Detection of Fish

Utilizing the combined DNA extracted from all 10 location samples as templates, three pairs of universal primers for fish detection, Teleo, MiFish, and Meta, were screened. The findings indicated that each pair of fish universal primers produced a single amplified band. The Teleo primer, at the same concentration as the template, exhibited a solitary brightly illuminated band. As a result, Teleo was selected to amplify the 10 locations via PCR assay (Figure 2).

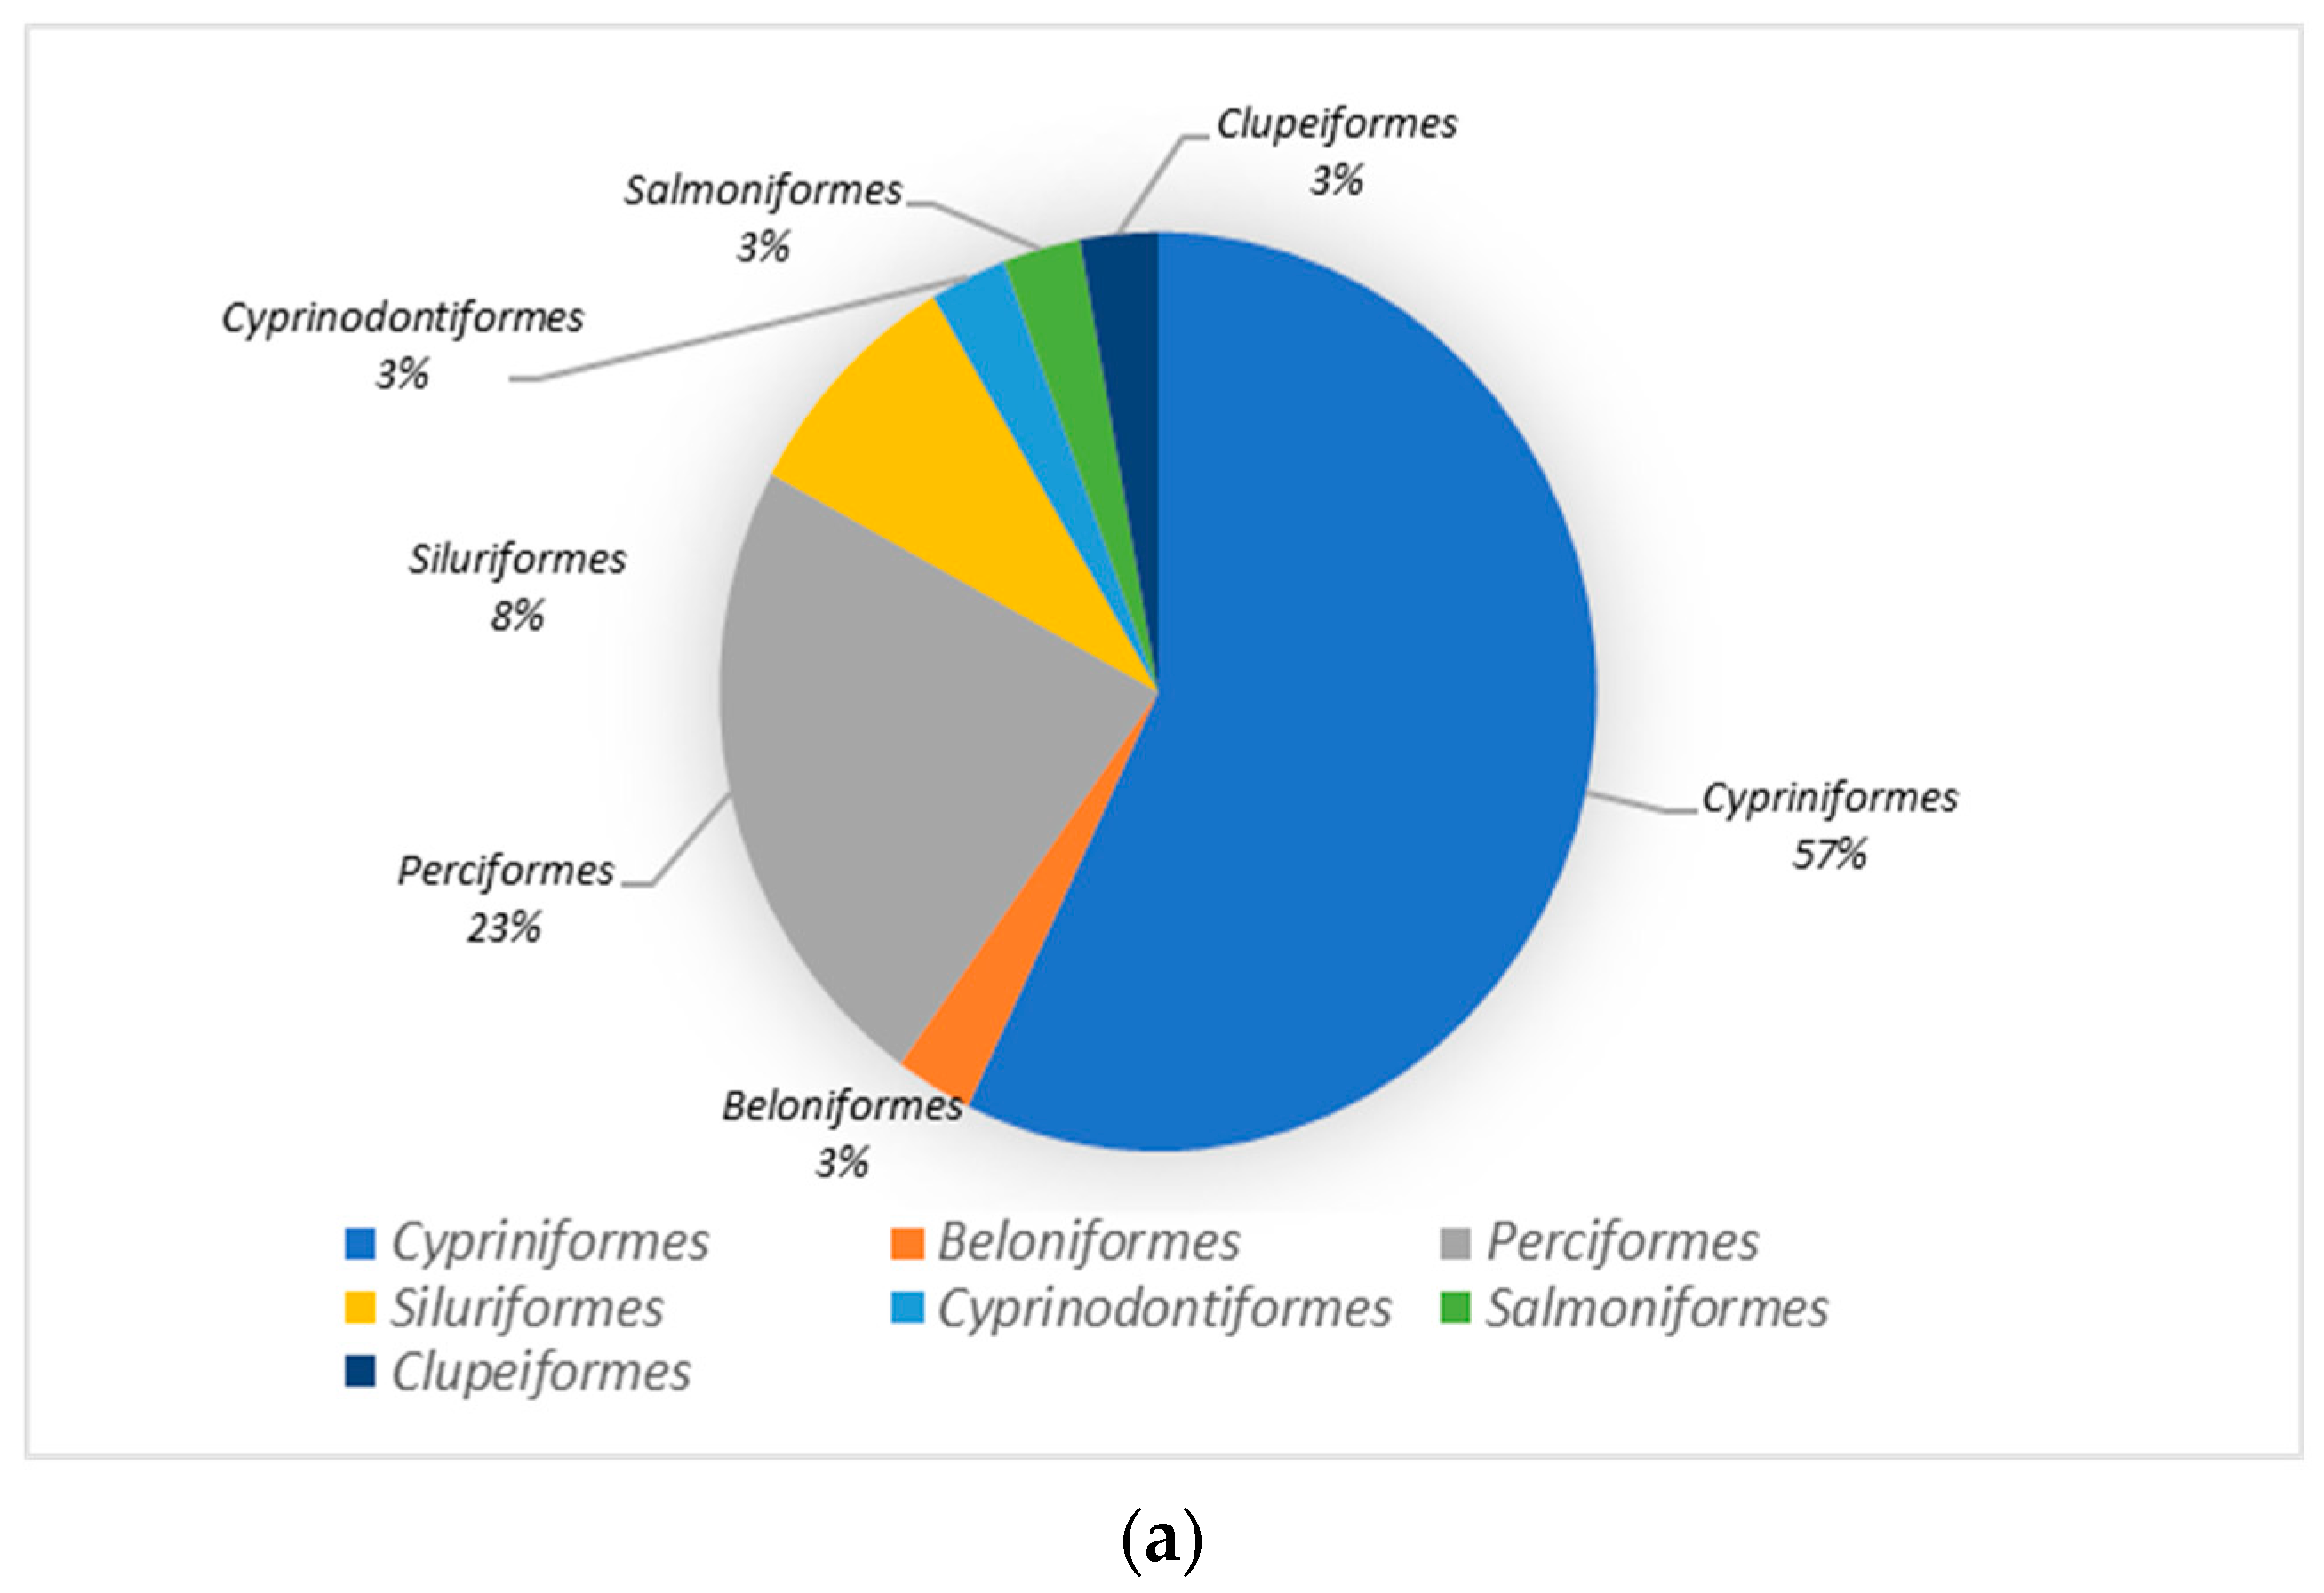
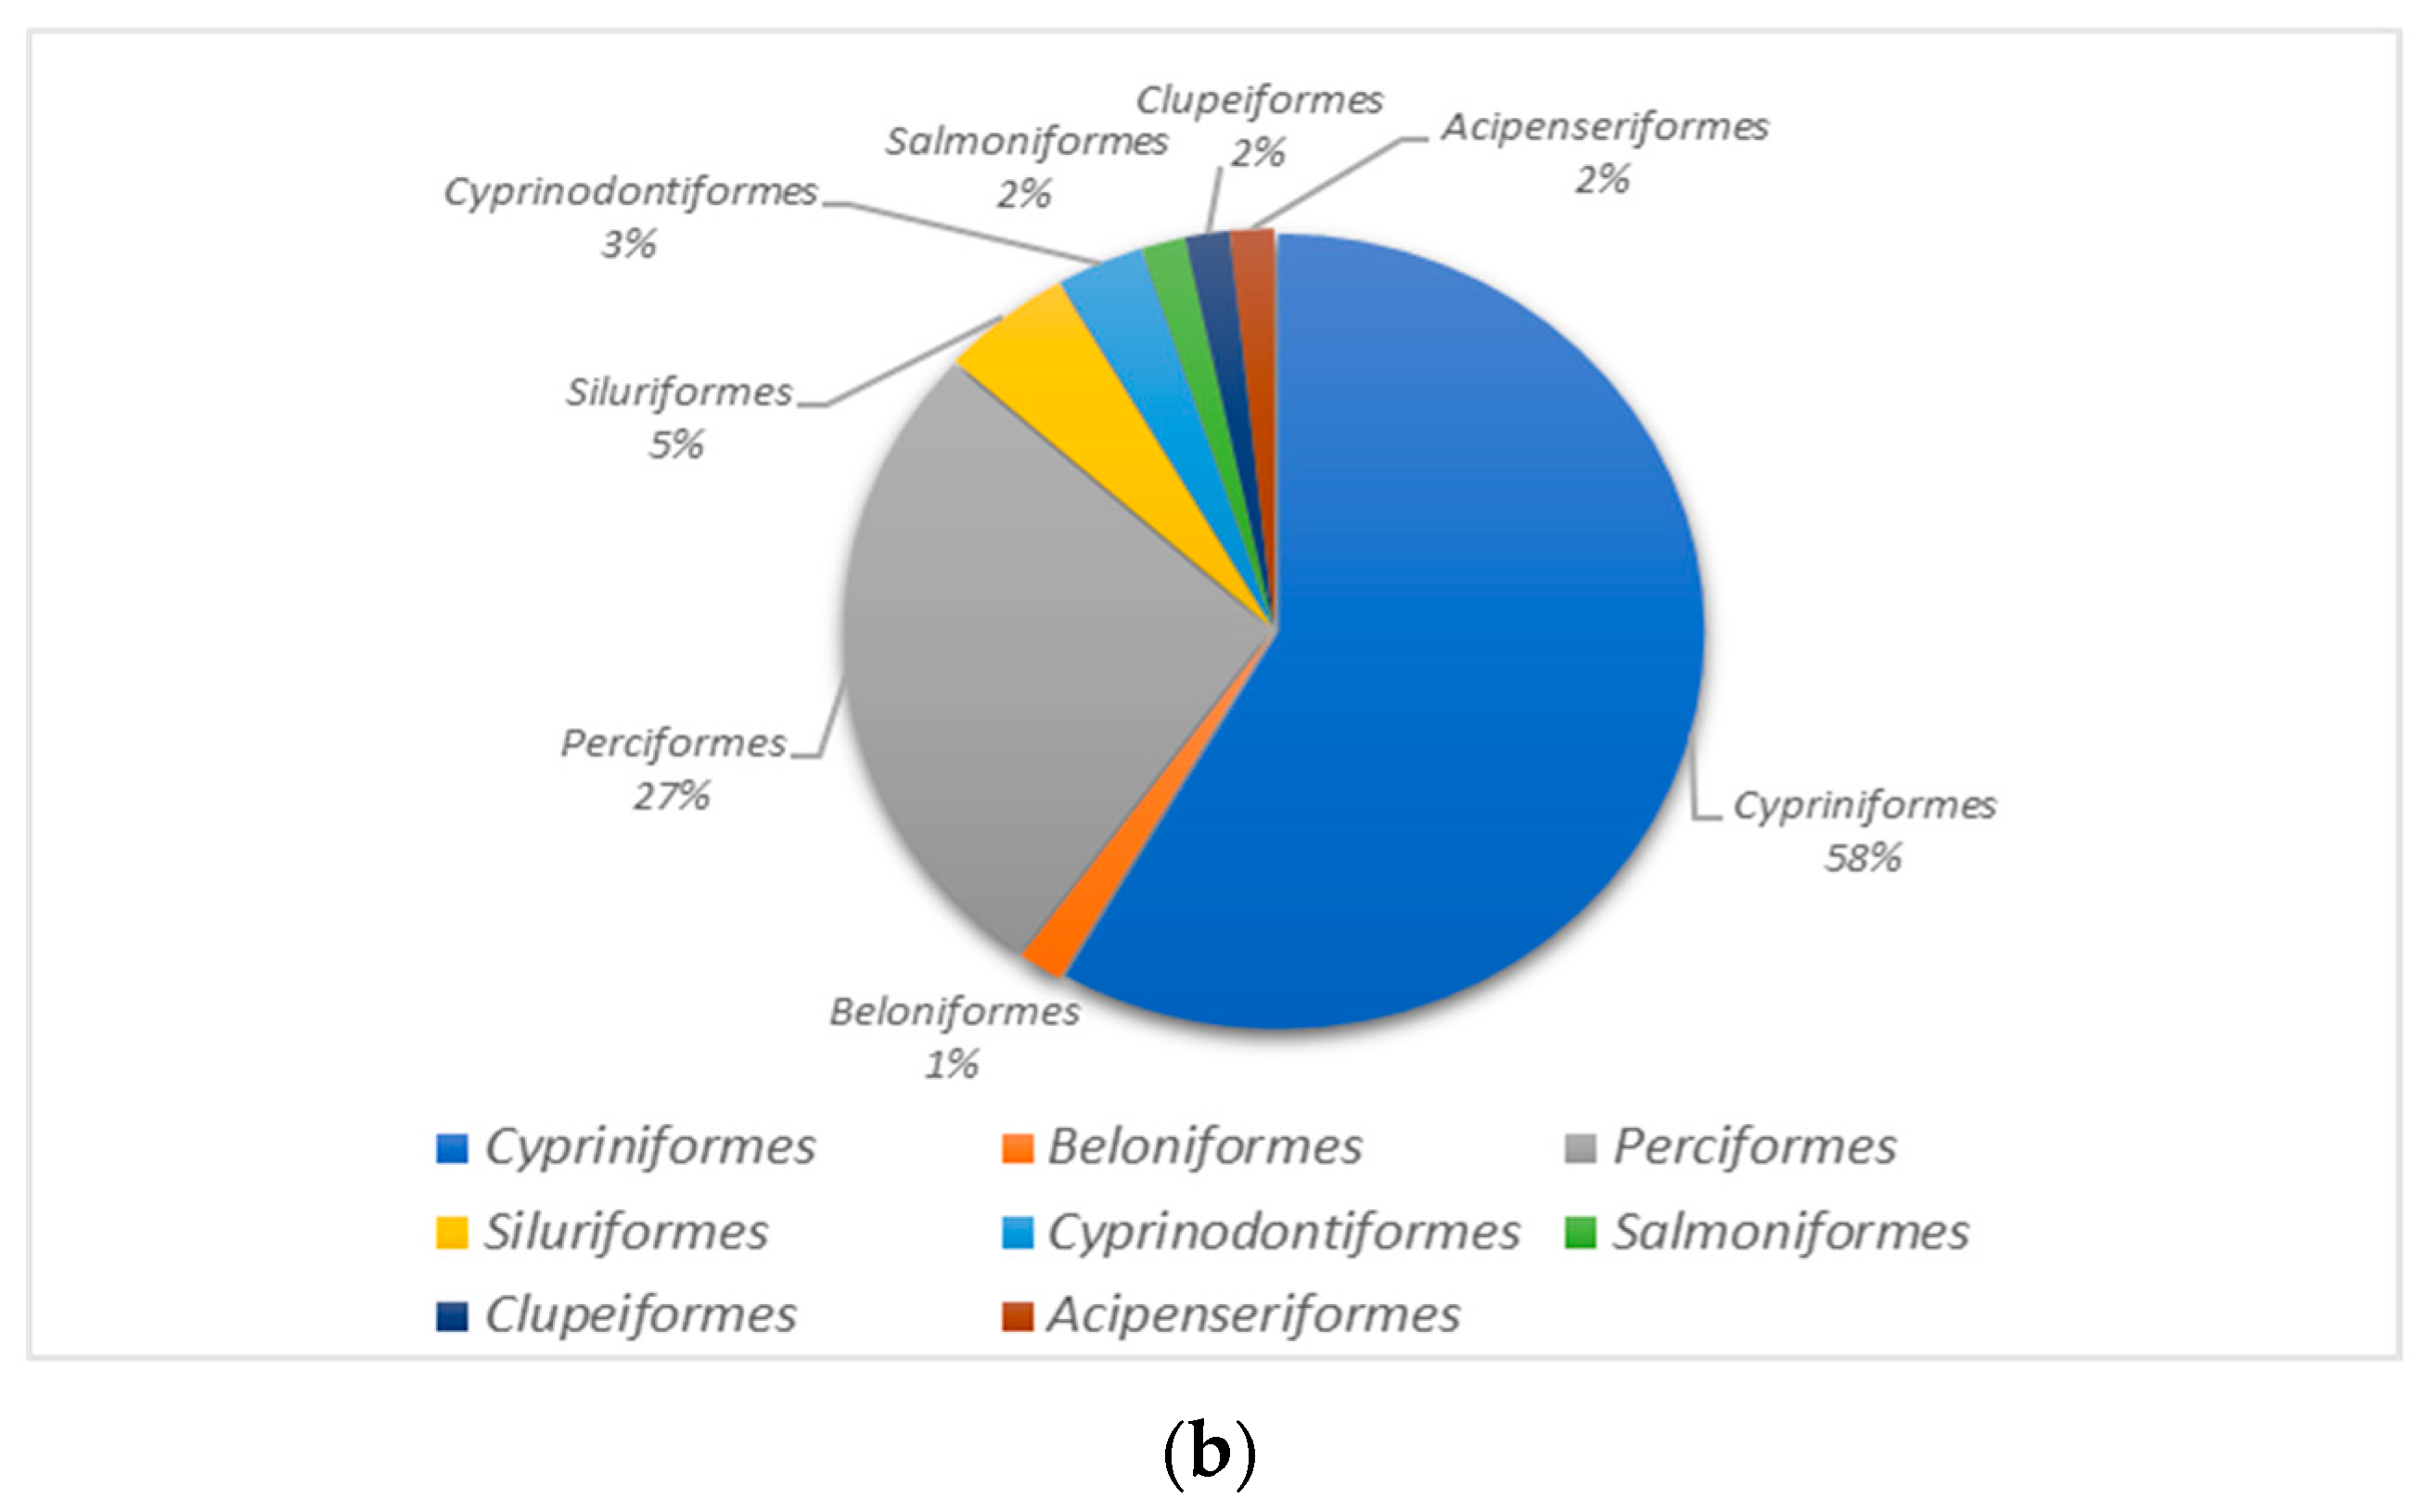
3.2. Species Analysis of the Dianchi Basin’s Fish Communities

The findings from the eDNA metabarcoding analysis of fish diversity at ten sites in the Dianchi basin during the dry season (March) revealed the presence of 35 species across 30 genera and 14 families, organized into seven orders (Figure 3). The order classification was as follows: Cypriniformes comprised 20 species, Beloniformes comprised 1 species, Perciformes contained 8 species, Siluriformes comprised 3 species, Cyprinodontiformes consisted of 1 species, Salmoniformes comprised 1 species, and Clupeiformes included 1 species. Cypriniformes, consisting of 15 genera and 16 species, made up 57% of the entire fish population. Next in the Perciformes order was Gobiidae, which consisted of one genus and four species of fish, making up 23% of the entire fish population. The analysis of fish diversity at the 10 sites in the Dianchi basin during the rich water period (July) revealed a total of 60 fish species belonging to 14 families and 31 genera from eight orders (Figure 3). These orders include Cypriniformes (35 species), Beloniformes (1 species), Perciformes (16 species), Siluriformes (3 species), Cyprinodontiformes (2 species), Salmoniformes (1 species), and Clupeiformes (1 species). Cypriniformes were the most prevalent, comprising 18 fish species in 16 genera, making up 55% of the whole fish population. Following that, Perciformes constituted 22% of the whole fish population. To summarize, the examination of fish species in the 10 locations within the Dianchi basin during both dry and rich water periods indicated a higher abundance of catadromous fish in the basin during the rich water period compared to the dry period.

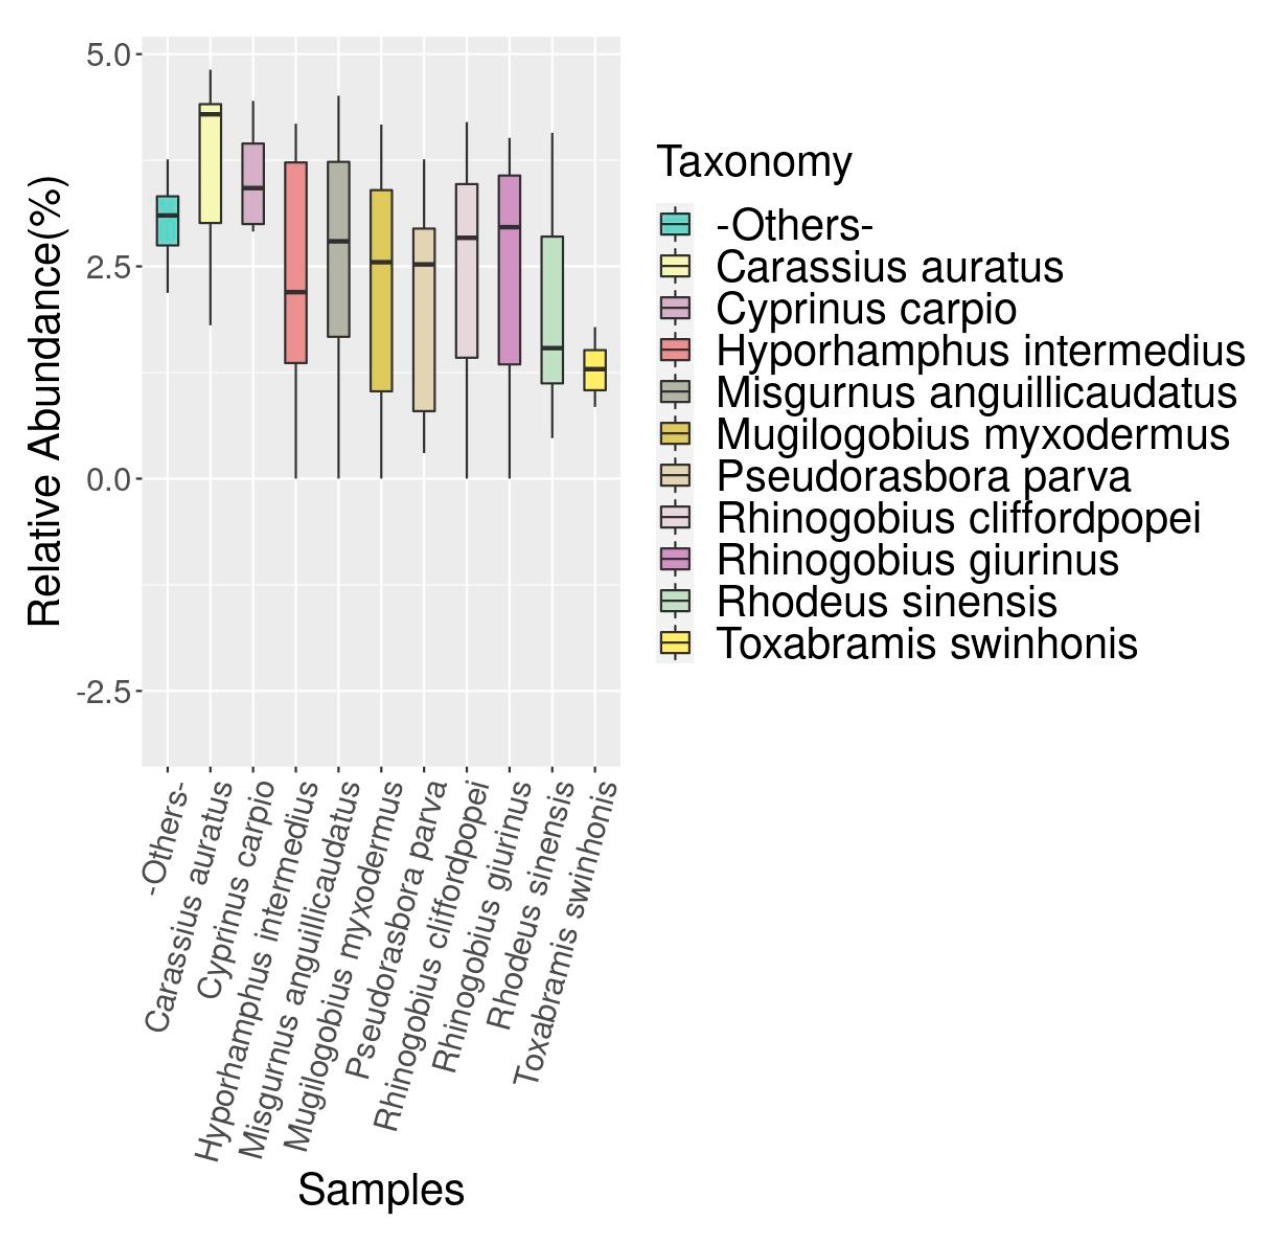
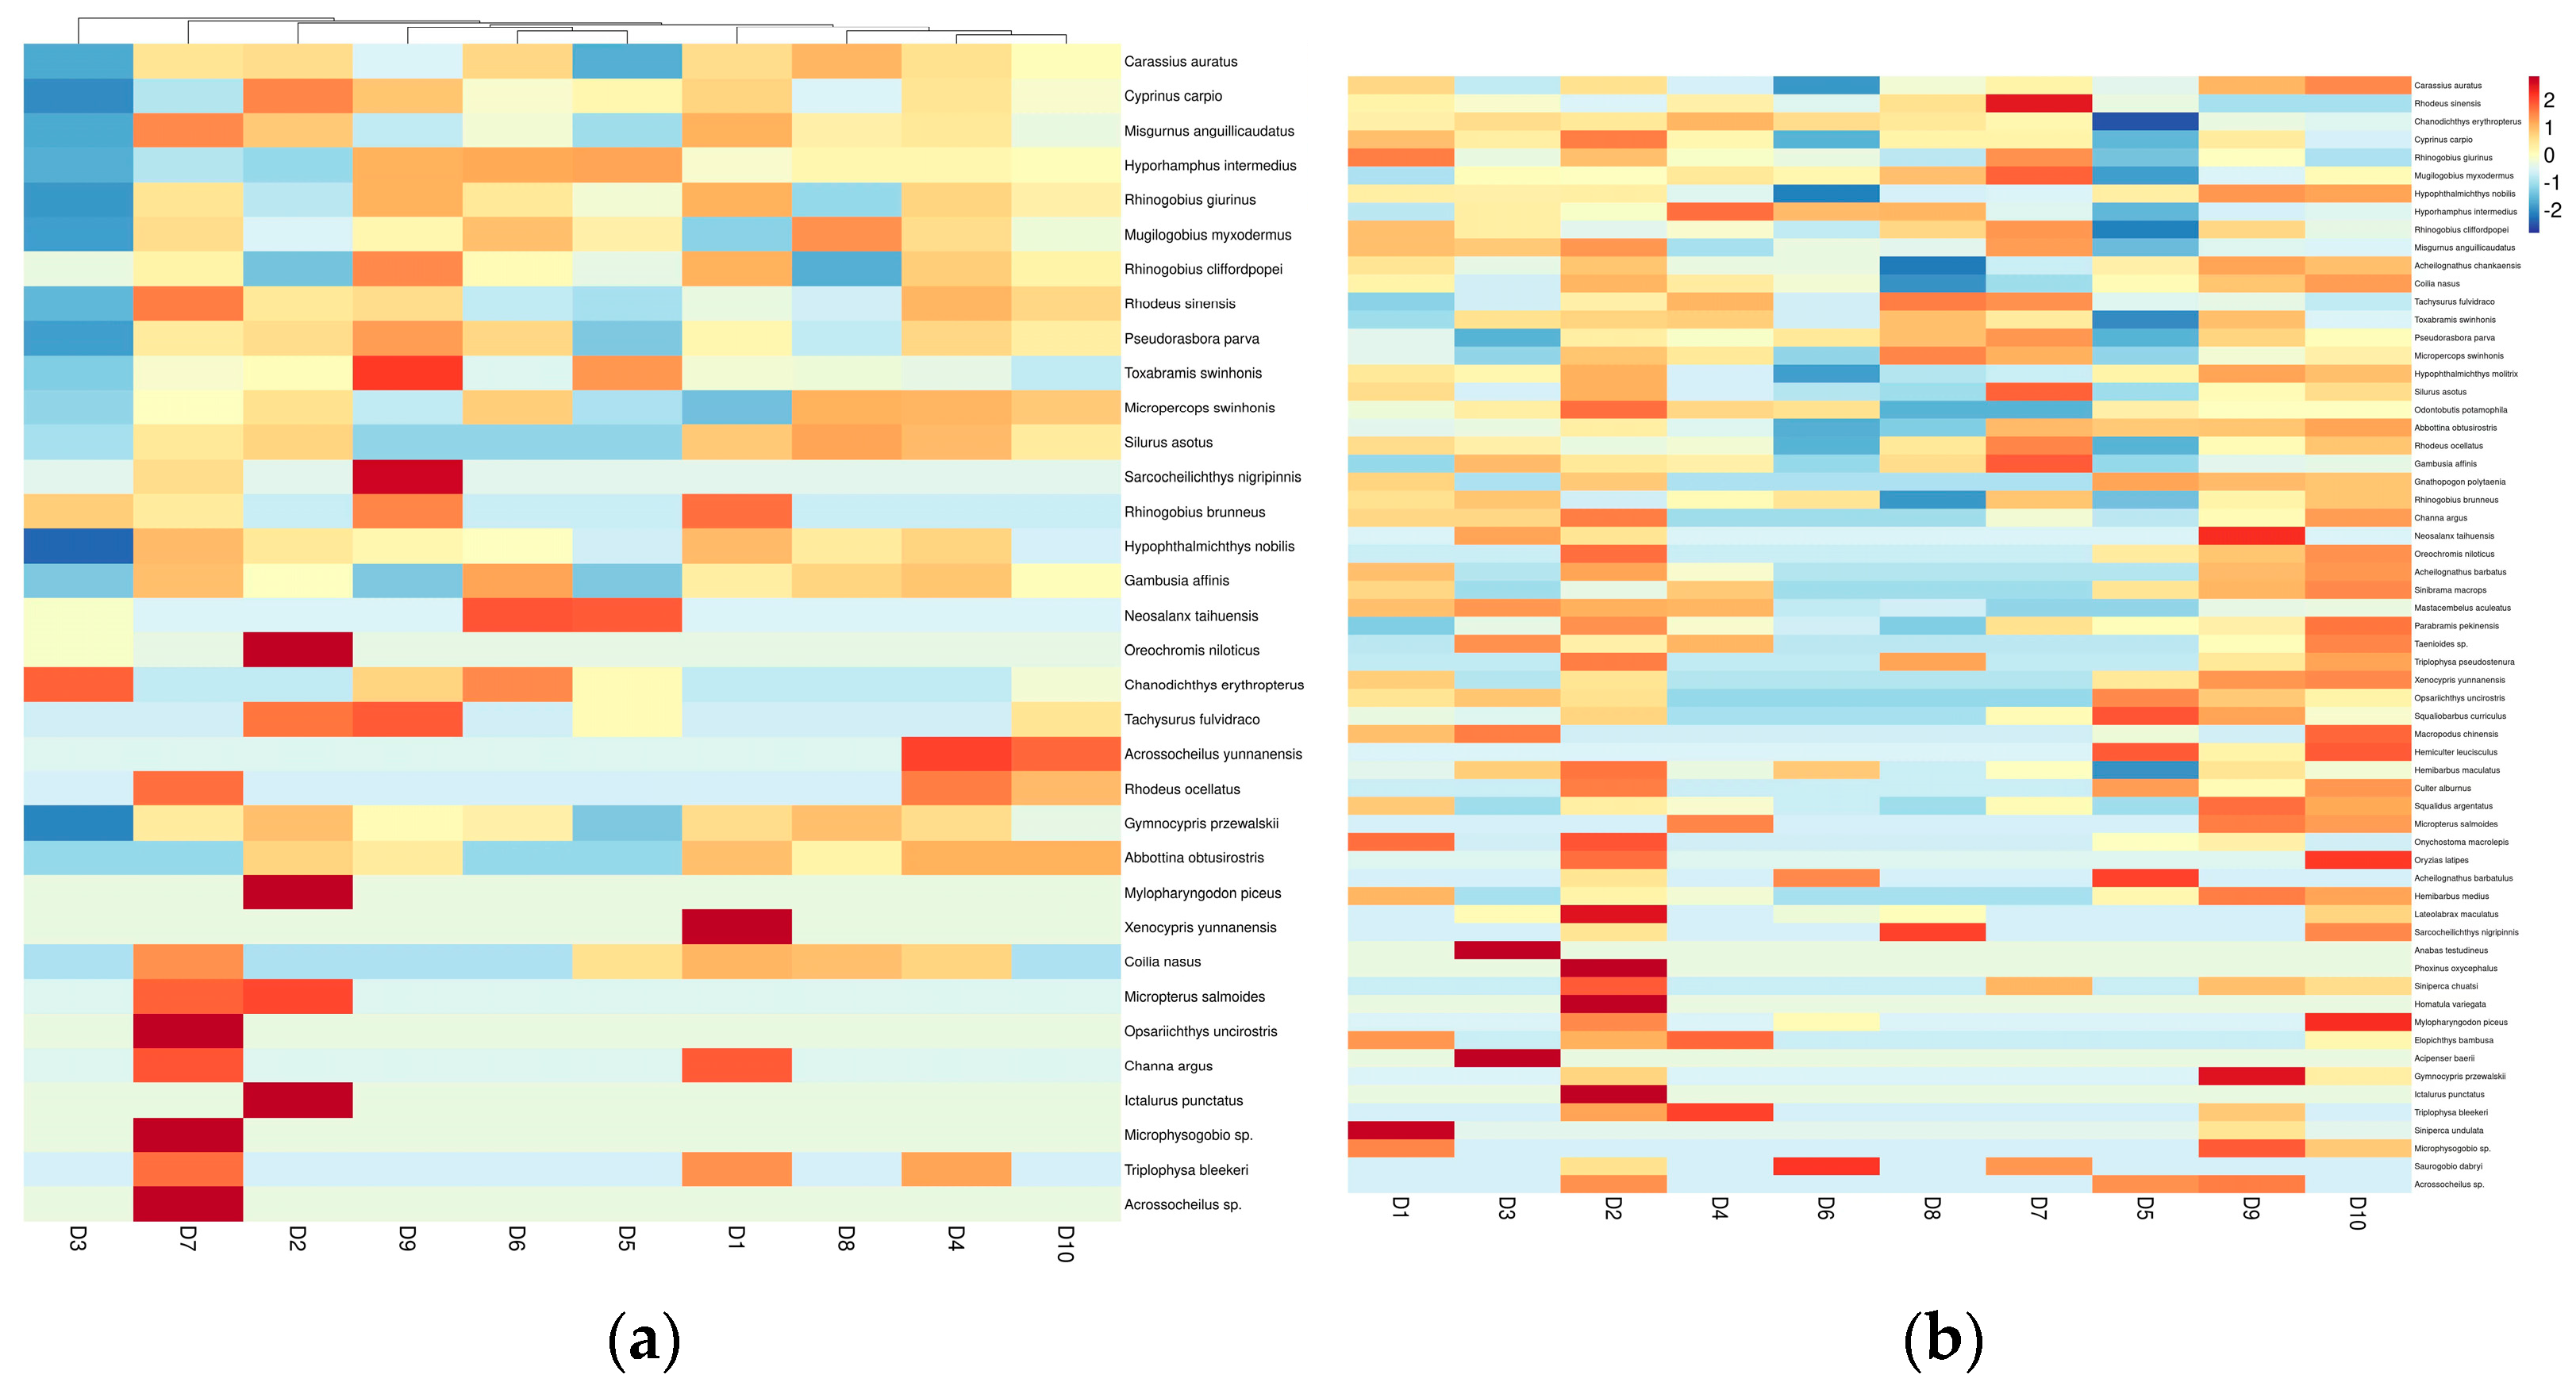
3.3. Analysis of Fish Species Abundance in the Dianchi Basin during Dry and Rich Seasons

The eDNA technique was used to monitor the top ten fish species in the Dianchi Lake basin, which include Carassius auratus, Cyporhamanuisintermedius, Misgurnus anguillicaudatus, Mugilogobius myxodermus, Pseudorasbora parva, Rhinogobius cliffordpopei, Rhinogobius giurinus, Rhodeus sinensis, and Toxabramis swinhonis. This study involved sampling and monitoring various fish communities in the Dianchi Lake basin, revealing the geographical and temporal heterogeneity of these communities. The Dianchi Lake basin recorded a total of 8 orders, 21 families, 51 genera, and 63 species in 2022. The order Cypriniformes contained the greatest number of species. Carassius auratus exhibited the greatest abundance and often held the position of dominating species (Figure 4).

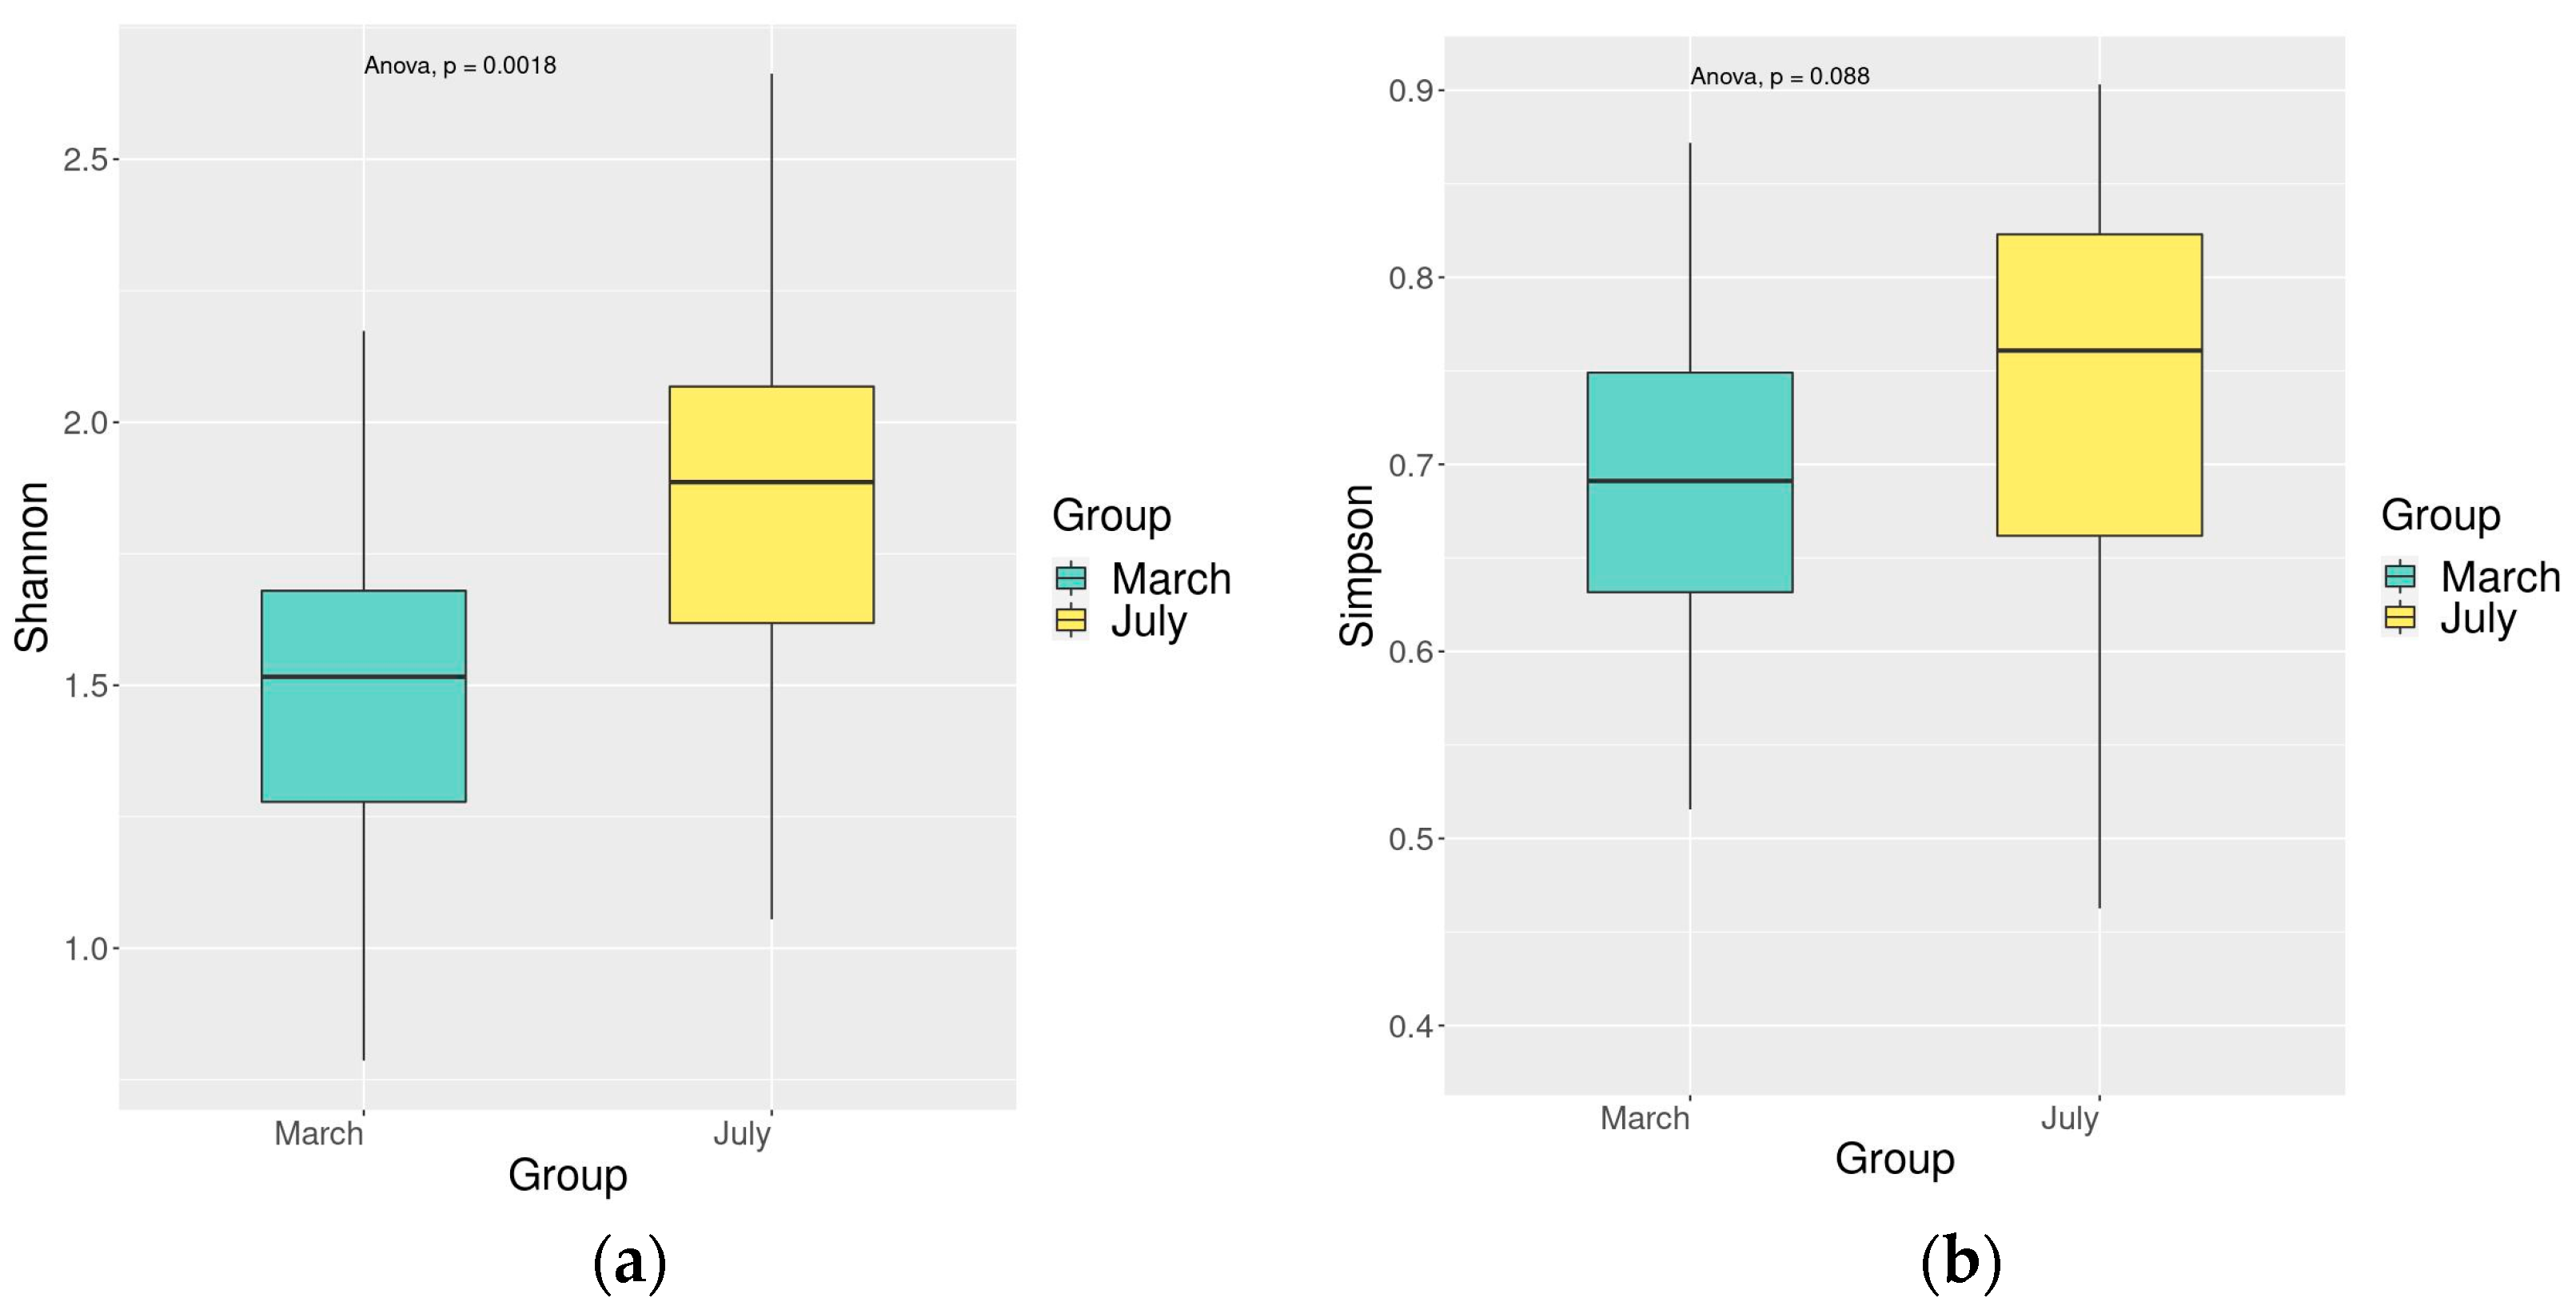
3.4. Comparison of Fish Diversity in the Dianchi Basin during Dry and Rich Periods

The examination of β-diversity in fish communities (OTUs) in the Dianchi basin, conducted during both dry and rich times, accounted for 47.7% of the variation observed in OTU 1 and OTU 2. The analysis was based on Jaccard OTU distances. Figure 5 clearly distinguishes the two seasons apart, and the first principal axis indicates that there is more similarity between fish communities during the drought period than during the rich period. This suggests that seasonal variations are the primary factors influencing the variation of β-diversity in the fish communities in the Dianchi basin (Figure 5).
The distribution patterns of Shannon’s index and Simpson’s index were similar during the dry period, suggesting an apparent difference in fish diversity between the dry and abundant periods. The average Shannon index value during the dry period was 1.504 (with a variance range of 1.79–3.71), as shown in (Figure 6). On the other hand, during the flood period, the Shannon’s index value was 1.849 (with a variance range of 1.56–2.32). This suggests that fish diversity was greater during the flood period compared to the dry period, with statistical significance (p < 0.05). The analysis of Simpson’s index revealed that fish diversity was greater during the period of abundant water compared to the dry period. Specifically, Simpson’s index averaged 0.685 (with a variance ranging from 0.4580 to 0.8725) during the dry period, while it averaged 0.737 (with a variance ranging from 0.6880 to 0.9218) during the abundant water period. Overall, fish diversity is substantially higher during periods characterized by abundant water availability compared to periods characterized by limited water availability. Additionally, temporal shifts are the primary factor driving fluctuations in fish diversity.
Different changes in the composition of the prevailing fish species were observed during the periods of abundance in March and July. Notably, the relative prevalence of key species, including the redfin culter Chanodichthys erythropterus (Basilewsky), Hypophthalmichthys nobilis (Richardson), and the whelk Pseudorasbora parva, emerged as the primary distinguishing characteristic between the periods of abundance and scarcity.

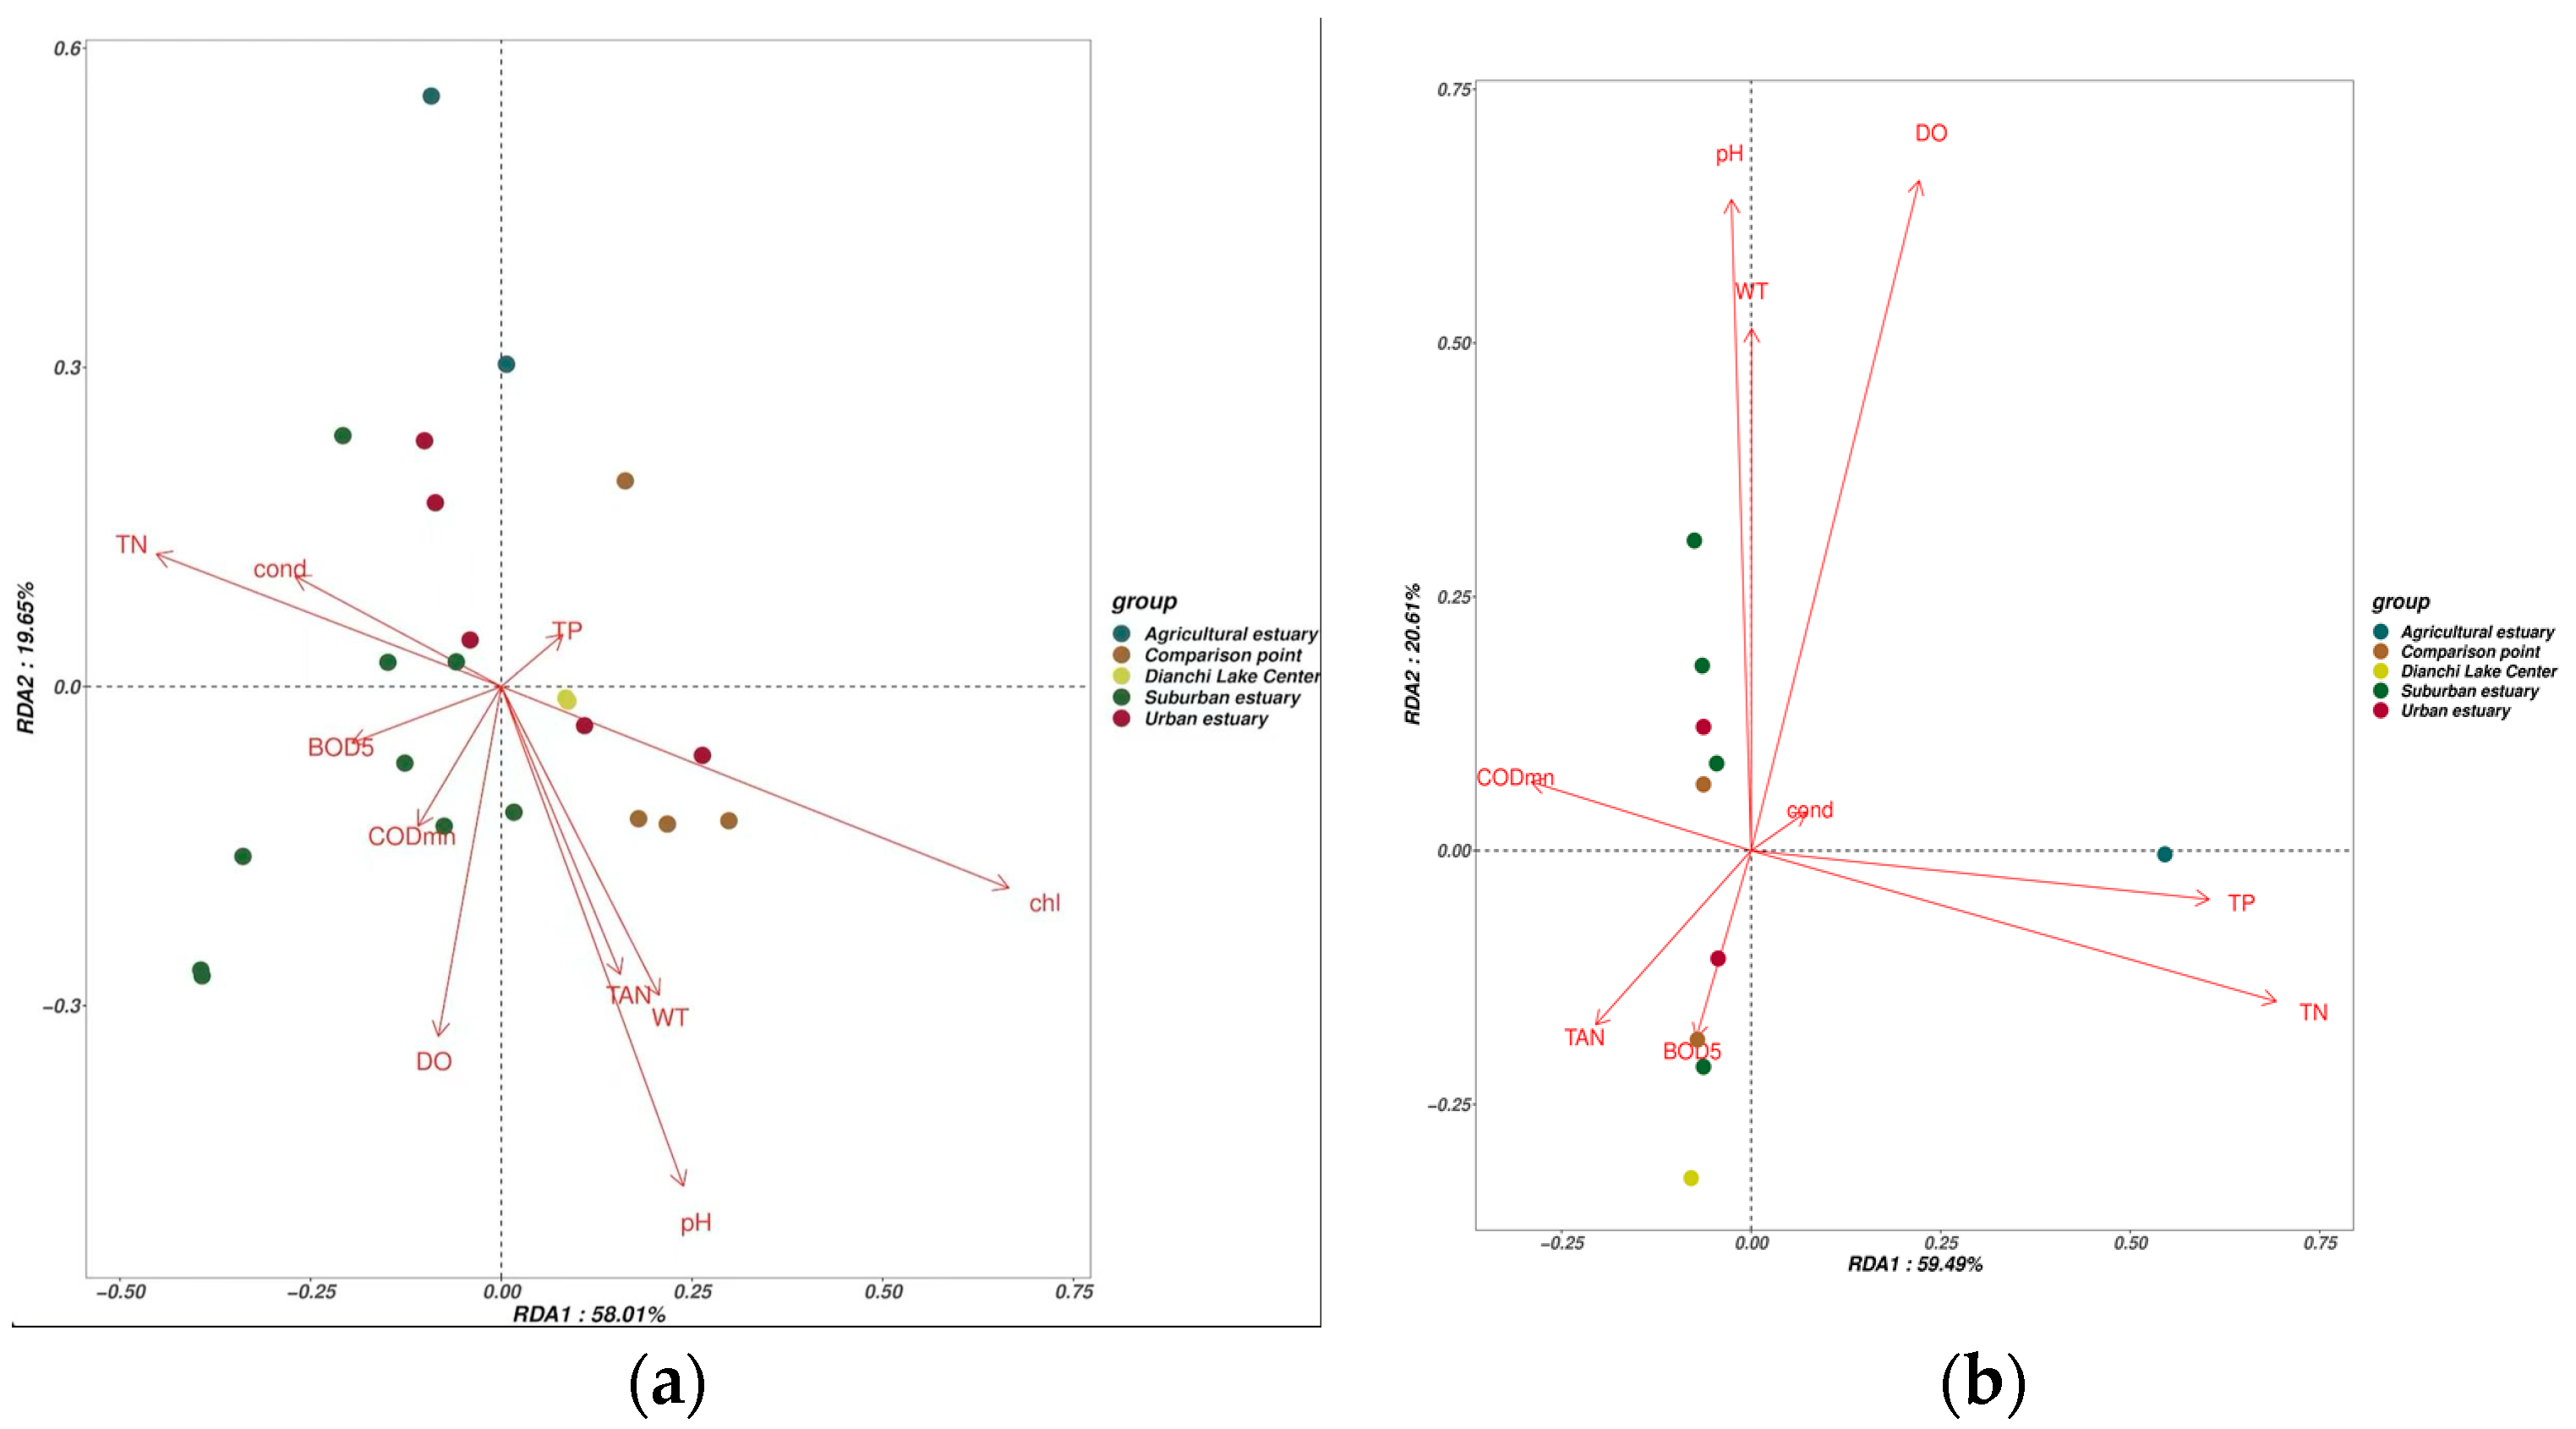
3.5. The Impact of Environmental Conditions on Fish Communities

The tb-RDA investigation examined the relationship between biodiversity and the environment. The study encompassed 10 environmental variables, including Cl, CODMn, BOD5, TN, TP, pH, DO, COD, cond, total dissolved solids, and TAN (Figure 7). Based on the variance expansion coefficients, the multi-collinearity of the environmental parameters revealed that there was no aggregation trend and scattered distribution for each site throughout the dry period. Furthermore, the agricultural and higher-quality estuaries were located at a distance from the other sampling locations, suggesting that the fish communities in these areas were less similar to those in the other sampling sites. The permutation test findings demonstrated that the fish community composition and distribution at the majority of the sampling locations were impacted by the selected environmental parameters Cl, CODMn, BOD5, TN, TP, pH, and DO. Additionally, the distribution and composition of the fish community were significantly impacted by Cl, CODMn, TN, and TP (RDA, p < 0.05). During the dry season, the following environmental impact factors had varying degrees of influence on changes in fish biodiversity in the Dianchi basin: Cl, pH, TN, and TP. There was a strong and positive correlation found between the CODMn and pH environmental impact parameters and the composition and distribution of the fish community at each sampling site in Dianchi during the high-water period. Furthermore, the WT, pH, COD, TN, TP, and DO environmental parameters influenced the composition and distribution of fish communities at the majority of the sampling locations. The magnitude of the effects of environmental conditions on fish community diversity was in the following order: pH > TN > Chl > DO > WT > TAN > cond > CODMn > BOD5 > TP during the dry period; pH > TN > Chl > DO > WT > CODMn > BOD5 > TP during the rich water period.

3.6. The Spatial Heterogeneity of Numerous Kinds of Estuarine Fishes

3.6.1. Differences in Fish Abundance Amongst Various Kinds of Estuaries

While Carassius auratus, Acrossocheilus yunnanensis (Regan), Siniperca undulata Fang and Chong, and Acipenser gueldenstaedtii Brandt and Ratzeburg had high sequence abundance values in the suburban-type estuaries, the urban-type estuaries had higher sequence abundance values for these species. The most prevalent species in the agricultural estuaries were Carassius auratus, Acrossocheilus yunnanensis, Mylopharyngodon piceus (Richardson), and Oreochromis mossambicus (Peters). Moreover, during the dry season, Rhodeus sinensis, Cyprinus carpio, and Carassius auratus dominated the species list. Additionally, in every sampling location, the following species were found: Misgurnus anguillicaudatus, Rhinogobius giurinus, Mugilogobius myxodermus, Rhinogobius cliffius, Rhinogobius cliffordpopei, Rhodeus sinensis, and Pseudorasbora parva. As shown in (Figure 8), the species that dominated during the rich season were the following: Carassius auratus, Rhodeus sinensis, Chanodichthys erythropterus, Cyprinus carpio, Rhinogobius giurinus, Mugilogobius myxo, Hypophthalmichthys nobilis, Hyporhamphus intermedius, Rhinogobius cliffordpopei, and Misgurnus anguillicaudatus. Hyporhamphus intermedius was not detected in either the Panlong or Nanchong Rivers, and the Nanchong River did not contain any of the following species: Chanodichthys erythropterus, Mugilogobius myxodermus, Rhinogobius giurinus, or Misgurnus anguillicaudatus.

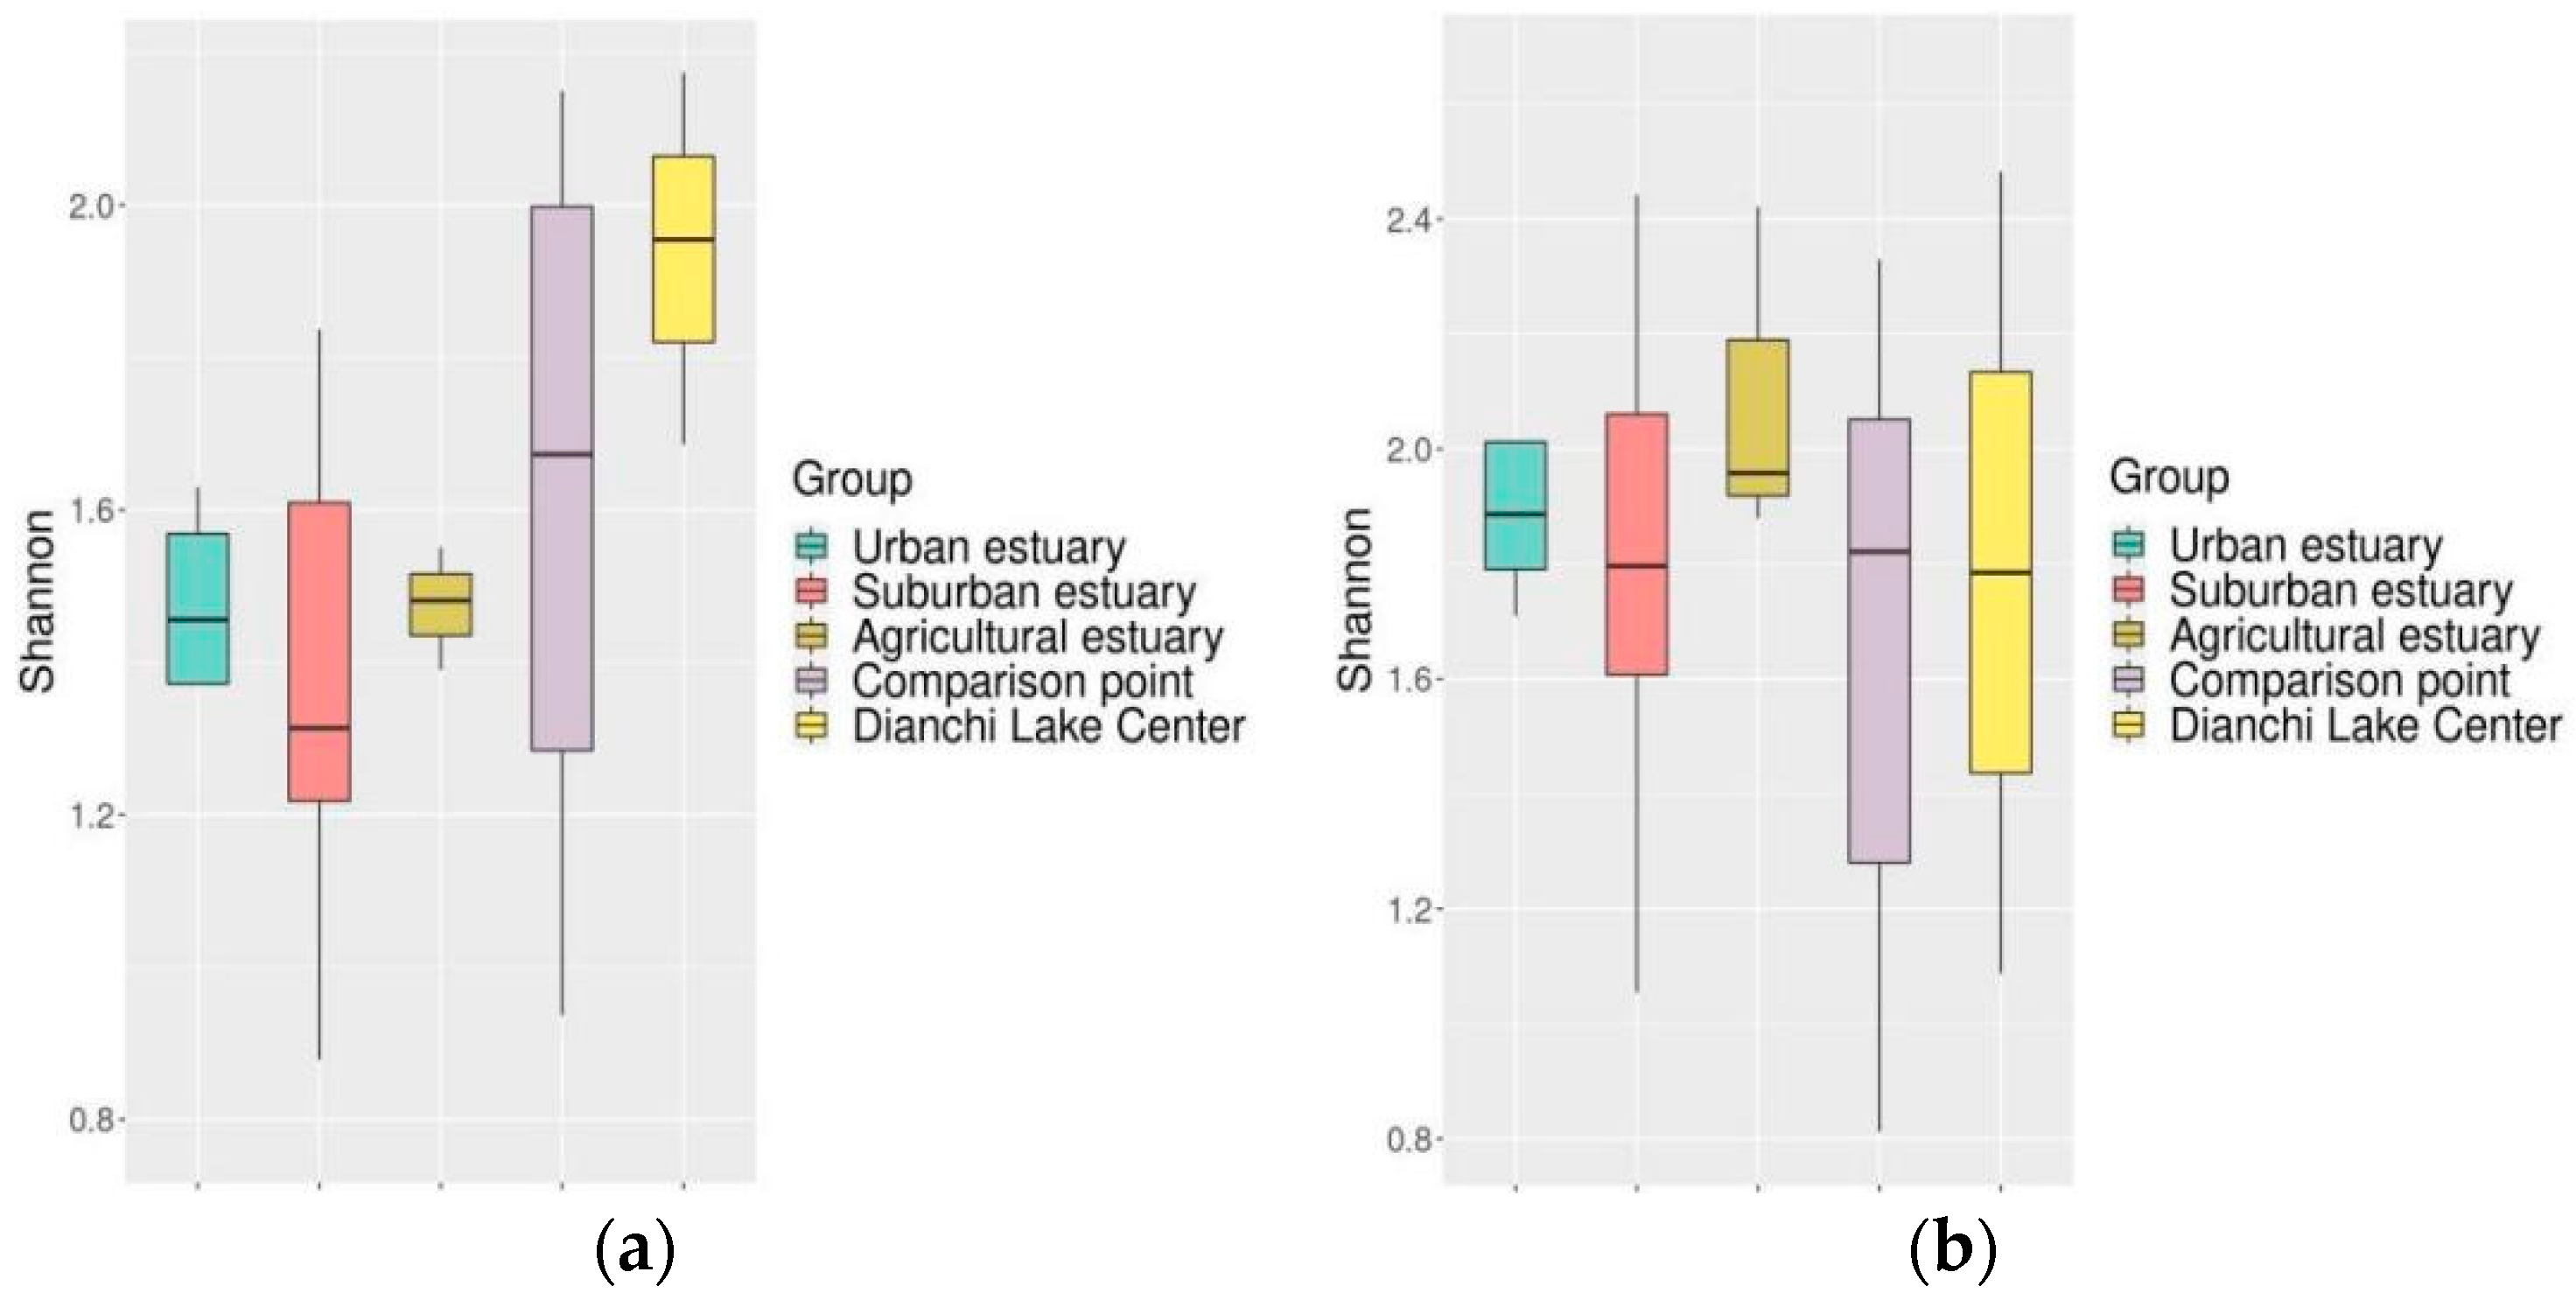
3.6.2. Of Fish Diversity among the Estuaries within the Lake

The Chao 1 index of the fish collected from the sampling sites in the Dianchi basin revealed that the Dongda River had the maximum number of OTUs (5497) during the dry season, while the Cailian River had the lowest number of OTUs (436). Furthermore, an analysis of the Shannon index revealed a statistically significant disparity in fish diversity between the estuaries of Dianchi Lake and the lake’s center (Figure 9). Seven of the thirty-five fish species that were observed at each sampling location were identified: Rhinogobius cliffordpopei, Rhinogobius giurinus, Hyporhamphus intermedius, Misgurnus anguillicaudatus, Cyprinus carpio, and Carassius auratus. Loach and carp are Dianchi River indigenous species.
During the rich water phase, the Nanchong River had the lowest number of OTUs (1680), while the Chai River had the largest number of OTUs (1827). According to the Shannon index, the fish diversity in the estuaries of the agricultural type differed considerably from that in the other locations (Figure 9). Carassius auratus, Cyprinus carpio, Rhodeus sinensis, Hypophthalmichthys nobilis, Acheilognathus chankaensis (Dybowski), and Rhinogobius giurius were the most abundant fish species among the sixty species that were observed. There was evidence of Rhinogobius giurinus at every sampling location. Dianchi Lake’s native fish is known as Carassius auratus.

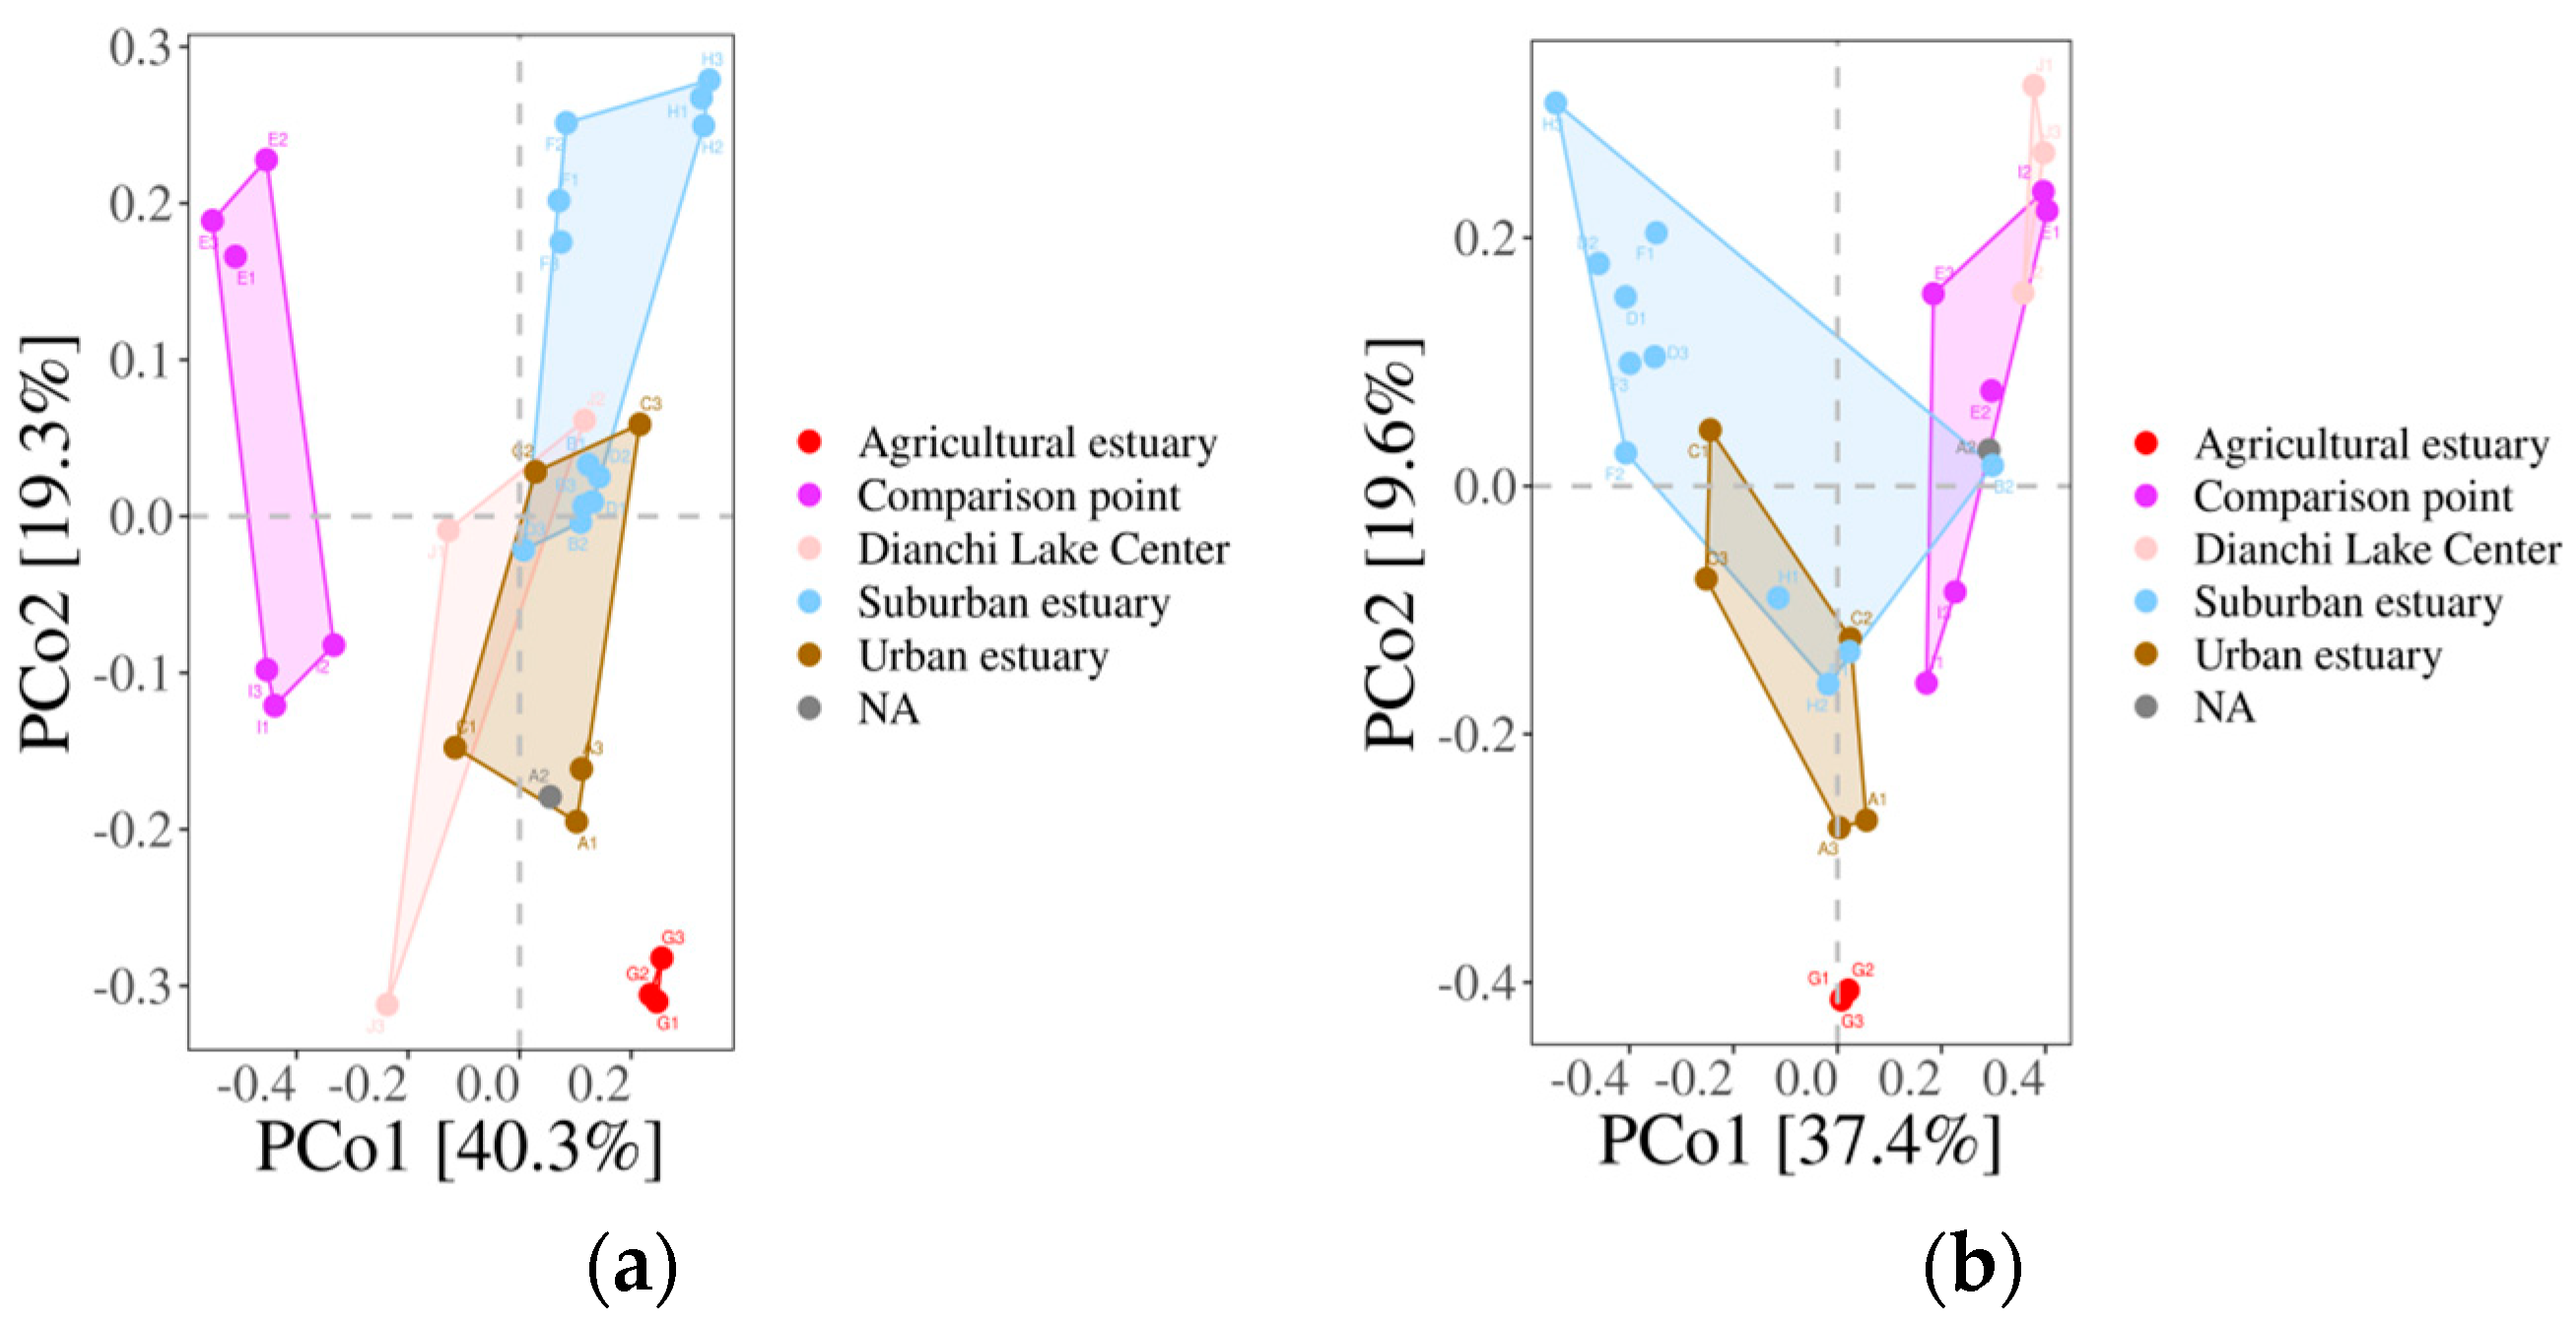
3.6.3. The β-Diversity of Fish Populations within the Dianchi Basin

The β-diversity of fish communities in various estuary types accounted for 59.6% of the change observed during the dry season, as shown in (Figure 10a). The fish communities in agricultural-type estuaries showed no overlap with the fish communities in suburban, urban, better water quality, and lake core estuaries in the principal coordinate analysis. This suggests that the fish biodiversity in agricultural-type estuaries significantly differs from that of the other four types of estuaries. The high-water period (Figure 10b) accounted for a 57% variation, with the agricultural estuaries differing significantly from the urban, peri-urban, core, and improved water quality estuaries.

4. Discussion

4.1. Fish Species Composition Monitored Using eDNA Techniques

This study utilized eDNA technology to identify 35 fish species during the dry season and 62 fish species during the rich season at 10 sampling locations in a typical estuary in the Dianchi basin. Out of all the fish species that were observed, the Carpiformes order stood out as the most prevalent in terms of species count. Eight fish species were observed during both the spring and autumn seasons. The dominant species were Carassius auratus, Cyprinus carpio, Mudskipper, Hypophthalmus, Ziling’s goby, Sticky mullet goby, Chinese Rhodeus, Bo’s goby, Bighead carp, Redfin bleak, and Wheatear. These species closely matched the fish species listed in the Yunnan Fish List for Dianchi Lake. As a result, the eDNA metabarcoding monitoring technique has shown a strong correlation with the historical fish records and is likely to have accurately depicted the condition of the fish population in Dianchi Lake. Both conventional and eDNA techniques were employed to observe the impact of urbanization on aquatic community structures. The eDNA approaches demonstrated superior accuracy compared to previous methods, and they exhibited a stronger correlation with water quality [35,36]. Molecular biology techniques can be employed to derive species richness and evenness indices, which serve to quantify community diversity. These indices can then be utilized for the purpose of evaluating the biological condition of water [37].

4.2. Effects of Changes in Environmental Factors on Fish Diversity in the Dianchi Basin during Different Periods

The temporal distribution pattern of fish in the Dianchi basin varied significantly, with fish abundance significantly lower during the dry season than during the abundant season. Due to an increase in water temperature and increased precipitation, fish experienced enhanced growth rates and more frequent breeding activity. During May to July, fish species such as Carassius auratus and Cyprinus carpio commenced their reproductive period. The number of juvenile fish increased substantially, so the trend of fish abundance was increasing [38]. The number of juvenile fish experienced a substantial increase, resulting in a corresponding rise in the overall abundance of fish. The Shannon index and Simpson index revealed a significant difference in fish species variety between the periods of abundant and reduced water. Additionally, fish abundance reached its peak during the abundant water phase.
The dynamics of fish resources are closely related to water environment factors [39], and it was found that pH, total nitrogen, chlorophyll, dissolved oxygen, and water temperature were the key environmental factors affecting fish diversity in Dianchi Lake in the dry season. The impacts of total nitrogen and chlorophyll were statistically significant. The presence of sufficient water resulted in the influence of several critical environmental parameters, including total nitrogen, dissolved oxygen, pH, and total phosphorus, on fish diversity. Environmental factors play a crucial role in influencing fish diversity. Maintaining good water quality is essential for the health of the Dianchi water ecosystem. However, the discharge of domestic and agricultural sewage has led to the water quality in the Dianchi basin being mildly to moderately eutrophic. Resolving the water quality issue has the potential to enhance the abundance and variety of fish species.

4.3. Prospects and Limitations

China has enforced a ten-year fishing prohibition in significant areas of the Yangtze River, including its main streams, important tributaries, and large rivers and lakes. This ban, known as “One River, Two Lakes and Seven Rivers”, completely prohibits the exploitation of natural fishery resources. The Dianchi basin, which is part of the Jinsha River system and the Yangtze River basin, is a crucial watershed. The Dianchi basin is a crucial water region within the Jinsha River system, which is also part of the Yangtze River Basin. It serves as a significant reservoir for Kunming. To mitigate the existing strain on the biological resources of Dianchi, a decade-long prohibition on fishing has been rigorously enforced. Consequently, the fishing restriction in Dianchi has rendered it impracticable to conduct experiments using conventional approaches in this study.
The integration of eDNA approaches and traditional morphological techniques has been extensively employed in the study of aquatic biodiversity. In this study, the investigation of fish variety was not conducted by combining traditional morphological methods, as a result of the ten-year fishing restriction in the Dianchi basin. Consequently, there was a deficiency in verifying the precision of the resulting data. This study also examined the effects of geographical and temporal fluctuations and water environment elements on fish diversity in the Dianchi basin. Furthermore, it is important to take into account the influences of climate change and human activities on fish diversity and ecosystems in this study. Hence, a decade-long prohibition on aquaculture in the Dianchi basin.
This study specifically examines the influence of water environment parameters on fish resources. However, it is important to note that the overall factors impacting fish resources are intricate and varied. Future research should concentrate on investigating the effects of climate change and human-induced disruptions on the ecosystem. Although fish reproduction has been protected by the ten-year fishing ban in the Dianchi basin, ecosystem recovery is a long-term process. Therefore, long-term monitoring and surveys are necessary to assess the effects of the fishing ban in the Dianchi basin and to produce novel concepts for the development of the Dianchi ecosystem.

4.4. Comparison of Previous Monitoring Data in the Dianchi Basin with the Present Study

Currently, there are few studies on the diversity of fish composition in the Dianchi basin. Fish diversity in the Dianchi basin was investigated using environmental DNA in a study that investigated the fish diversity of the highland lakes in central Yunnan. The results of the study revealed that 17 fish OTUs, representing 5 orders and 14 genera, were found at 8 sites in the Dianchi in 2018 [40]. In the study of the Yangtze River Basin, it was found that the upper reaches of the Yangtze River belonged to the high-altitude, deep-cut section of the river valley, and the composition of fishes was dominated by Cyprinidae and Cobitidae, which is more in line with the results of Dianchi fishes obtained in the present study [41]. The results of this study showed that a total of 63 species of 51 genera in 8 orders and 21 families were obtained from 10 sites in two seasons, among which the carp family was the main component of the fish community. The results of the previous study indicate that there has been a significant improvement in fish diversity in Dianchi in the last 5 years. With the improvement in agricultural wastewater management, the multi-layer treatment of wastewater entering the river, and the standardization of domestic and industrial drainage, the water quality of the Dianchi basin has been gradually improved, and changes in the water ecological environment always affect changes in aquatic biodiversity. Building a ‘community of life between man and nature’ is a scientific idea and guide for our actions.

5. Conclusions

In summary, in the present investigation, the ichthyic populations within the Dianchi basin were systematically monitored, employing diverse estuarine environments and cutting-edge eDNA techniques, unveiling the nuanced spatial and temporal heterogeneity inherent in these fish communities. This comprehensive survey identified a total of 8 orders, 21 families, 51 genera, and 63 distinct species inhabiting the Dianchi basin in 2022, with Carpidae emerging as the most populous family and Carassius auratus standing out as the quintessential dominant species. Notably, an examination of the dominant fish species during the arid March period versus the affluent July period highlighted variations in structural composition, notably in the relative abundance of Chanodichthys erythropterus, Hypophthalmichthys nobilis, and Pseudorasbora parva. Furthermore, β-diversity analysis discerned substantial distinctions between fish communities in agricultural estuaries and those in urban, suburban, good-water-quality, and core estuaries of Dianchi Lake, encompassing both dry and prosperous seasons. The application of the Shannon index to assess the correlation between fish abundance and diversity during dry and affluent water periods uncovered a noteworthy dissimilarity in fish diversity between the two distinct water periods.

Supplementary Materials

The following supporting information can be downloaded at: https://www.mdpi.com/article/10.3390/w15244244/s1, Table S1: Physical and chemical indicators of water quality in March; Table S2: Physical and chemical indicators of water quality in July.

Author Contributions

K.Z., S.X. and X.Z. designed the experiments. K.Z., H.M., Y.L., L.S. and Z.L. performed the experiments and analyzed the data. K.Z. and X.L. wrote the manuscript. All authors have read and agreed to the published version of the manuscript.

Funding

This work was supported by the Key Program of Joint Special Project (no. 202001BA070001-130). We would also like to thank the Dianchi Plateau Lakes Research Institute in Kunming, Yunnan Province, for their help in sample collection.

Data Availability Statement

Data are contained within the article or Supplementary Material. The data presented in this study are available in [https://www.kdocs.cn/l/coDOROR0BAeF, https://www.kdocs.cn/l/ccrAYE31Sec9].

Acknowledgments

“The Frontier Research Team of Kunming University 2023”, whose support was instrumental in facilitating the research endeavors and ensuring the successful execution of this study. Their commitment to advancing knowledge and fostering a conducive research environment is sincerely appreciated. The successful completion of this work was made possible through the invaluable support of the following research projects and institutions: 1. “Investigation and Health Assessment of Aquatic Biodiversity in Dianchi Lake Based on Environmental DNA Macro Barcode Technology”, which provided essential resources and guidance for the study. 2. The “Frontier Research Team of Kunming University 2023”, whose support was instrumental in facilitating the research endeavors and ensuring the successful execution of this study. Their commitment to advancing knowledge and fostering a conducive research environment is sincerely appreciated.

Conflicts of Interest

The authors declare that they have no competing interest.

References

  1. Qin, W.; Jia, W.-F.; Hang, X.-H. Fish Diversity Protection and Sustainable Development of Fisheries. Freshw. Fish. 1999, 29, 8–11. [Google Scholar]
  2. Bonar, S.A.; Mercado-Silva, N.; Hubert, W.A.; Beard, T.D., Jr.; Dave, G.; Kubečka, J.; Graeb, B.D.; Lester, N.P.; Porath, M.; Winfield, I.J. Standard methods for sampling freshwater fish: Opportunities for international collaboration. Fisheries 2017, 42, 150–156. [Google Scholar] [CrossRef]
  3. Bayley, P.-B.; Peterson, J.-T. An approach to estimate the probability of the presence and richness of fish species. Trans. Am. Fish. Soc. 2001, 130, 620–633. [Google Scholar] [CrossRef]
  4. Kang, Z.; Zhang, Y.; Wu, Y.; Xie, D.; Xue, J.; Hua, J. Application of environmental DNA metabarcoding in biodiversity research and monitoring. Biotechnol. Bull. 2022, 38, 299–310. [Google Scholar]
  5. Xu, L.-F.; Yao, D.-D.; Yang, Y.-W.; Guo, X.-C.; Li, J.-Y.; Jiang, H.-B.; An, M.; Dong, X.-H.; Shao, L. Analysis of Fish Diversity in Artificial Lakes in Karst Plateau Based on eDNA Macro Barcode Technology. J. South. Agric. 2022, 53, 11. [Google Scholar]
  6. Wang, R.-X.; Yang, G.; Geng, Z.; Zhao, F.; Feng, X.-S.; Zhang, T. Application of Environmental DNA Technology in Fish Diversity Analysis in the Yangtze River Estuary. J. Aquat. Biol. 2023, 47, 365–375. [Google Scholar]
  7. Olds, B.P.; Jerde, C.L.; Renshaw, M.A.; Li, Y.; Evans, N.T.; Turner, C.R.; Deiner, K.; Mahon, A.R.; Brueseke, M.A.; Shirey, P.D.; et al. Estimating species richness using environmental DNA. Ecol. Evol. 2016, 6, 4214–4226. [Google Scholar] [CrossRef]
  8. Zhu, Y.; Han, L.-P.; Liu, L.-J.; Qiu, Z.-R.; Wang, Y.-X.; Liu, Y.-X.; He, Y.; Wang, H. Study on the Evaluation of Water Environment Quality in Dianchi Lake in 2018. Environ. Sci. J. 2020, 39, 77–85. [Google Scholar]
  9. Wen, H.; Cai, J.-L.; Su, Y. Characteristics of algal communities and their relationship with water environmental factors during the flood season of rivers entering the Dianchi Lake Basin. Lake Sci. 2011, 23, 40–48. [Google Scholar]
  10. Dong, J.; Li, G.-B.; Song, L.-R. Evolution characteristics of planktonic algae functional groups in Fuxian Lake, Erhai Lake, and Dianchi Lake since the 1960s. Lake Sci. 2014, 26, 735–742. [Google Scholar]
  11. Evans, N.T.; Li, Y.; Renshaw, M.A.; Olds, B.P.; Deiner, K.; Turner, C.R.; Jerde, C.L.; Lodge, D.M.; Lamberti, G.A.; Pfrender, M.E. Fish community assessment with Edna metabarcoding: Effects of sampling design and bioinformatic filtering. Can. J. Fish. Aquat. Sci. 2017, 74, 1362–1374. [Google Scholar] [CrossRef]
  12. Ruppert, K.-M.; Kline, R.-J.; Rahman, M.-S. Past, present, and future perspectives of environmental DNA (eDNA) metabarcoding: A systematic review in methods, monitoring, and applications of global eDNA. Glob. Ecol. Conserv. 2019, 17, e00547. [Google Scholar] [CrossRef]
  13. Cheang, C.C.; Lee, B.Y.; Ip, B.H.Y.; Yiu, W.H.; Tsang, L.M.; Ang, P.O., Jr. Fish and crustacean biodiversity in an outer maritime estuary of the Pearl River Delta revealed by environmental DNA. Mar. Pollut. Bull. 2020, 161, 111707. [Google Scholar] [CrossRef] [PubMed]
  14. Balasingham, K.-D.; Walter, R.-P.; Mandrak, N.-E.; Heath, D.-D. Environmental DNA detection of rare and invasive fish species in two Great Lakes tributaries. Mol. Ecol. 2018, 27, 112–127. [Google Scholar] [CrossRef]
  15. Xu, C.-C.; Yen, I.-J.; Bowman, D.; Turner, C.R. Spider Web DNA: A New Spin on Noninvasive Genetics of Predator and Prey. PLoS ONE 2015, 10, e0142503. [Google Scholar] [CrossRef]
  16. Yuan, G.; Ru, H.-J.; Liu, X.-Q. 2007–2008 Fish Diversity and Resource Status in Yunnan Plateau Lakes. J. Lake Sci. 2010, 22, 837–841. [Google Scholar]
  17. Jerde, C.L.; Chadderton, W.L.; Mahon, A.R.; Renshaw, M.A.; Corush, J.; Budny, M.L.; Mysorekar, S.; Lodge, D.M. Detection of Asian carp DNA as part of a Grea Lakesbasin-wide surveillance program. Can. J. Fish. Aquat. Sci. 2013, 70, 522–526. [Google Scholar] [CrossRef]
  18. Zhang, L.-H. Establishment of a monitoring system for ecological compensation mechanism in the Dianchi Lake Basin. Water Resour. Hydropower Express 2019, 40, 53–56. [Google Scholar]
  19. Zhang, X.-Z. The Impact of Characteristic Pollution Sources in the Dianchi Lake Basin on the Water Quality and Plankton Community of Rivers Entering the Lake. Master’s Thesis, Shanghai Jiao TongUniversity, Shanghai, China, 2016. [Google Scholar]
  20. Wei, R.; Jin, Z.-J.; Zhang, X.-Z.; Huang, K.; Li, J.-H.; Kong, D.-p.; Yang, F.-L.; Zhou, B.-X. The impact of comprehensive treatment projects on ecological restoration and water quality of the Cailian River. Environ. Sci. Technol. 2016, 39, 174–179. [Google Scholar]
  21. Sun, Y.-X.; Wu, G.; Hu, H.; Guo, F.; Wu, Y.; Guo, Y. Evaluation of effluent quality of Kunming sewage treatment plant based on compliance assurance rate. China Environ. Sci. 2013, 33, 1113–1119. [Google Scholar]
  22. Zheng, L.-Q.; He, S.-Z. Soil phosphorus desorption pathways under different land use patterns in the Dianchi Lake Basin. Chin. J. Ecol. Agric. 2012, 20, 855–860. [Google Scholar] [CrossRef]
  23. Zheng, Y.-X.; Li, Z.-J.; Ni, J.-B. Research on Industrial Water Pollution Investigation Based on GIS: A Case Study of Dianchi Lake Basin. Environ. Prot. Sci. 2012, 38, 20–24. [Google Scholar]
  24. Ding, H.-X. Analysis and Research on the Emission Status of Industrial Pollutants in Kunming City from 1991 to 2007. Environ. Sci. J. 2009, 28, 53–56. [Google Scholar]
  25. Huang, W.-H.; Xiong, H.-J.; Deng, H.; Liu, J.; Li, J.-J.; Zhang, N.-M.; Bao, L. Distribution of inorganic phosphorus in soil under different land use patterns in typical areas on the south bank of Dianchi Lake. Environ. Pollut. Prev. 2018, 6, 689–692. [Google Scholar]
  26. Chen, J.-J. Analysis of Water Quality of Main Rivers Entering Dianchi Lake. J. Yunnan Agric. Univ. 2005, 4, 569–572. Available online: https://kns.cnki.net/kcms2/article/abstract?v=T-ziT3f7Rg9FLi2XjdfXnhzh6Xvv9RUOrKy7T0WbodPy0P3zcc7_ZbxxTYwwRv2BLQe-oMunHm10AMopp6HtDoBqrdE60cEhuAQFyoMzgWrEgkg1WiDbymhsBcnyYDNl&uniplatform=NZKPT&flag=copy (accessed on 2 January 2023).
  27. Chen, Y.-C. Application of Environmental DNA Technology in Fish Resources Investigation in the Upper Reach of Liuchong River. Master’s Thesis, Xinan University, Chongqing, China, 2020. [Google Scholar]
  28. Taberlet, P.; Bonin, A.; Zinger, L. Environmental DNA-for Biodiversity Research and Monitoring; Oxford University Press: New York, NY, USA, 2018. [Google Scholar]
  29. Miya, M.; Sato, Y.; Fukunaga, T.; Sado, T.; Poulsen, J.Y.; Sato, K.; Minamoto, T.; Yamamoto, S.; Yamanaka, H.; Araki, H.; et al. MiFish, a set of universal PCR primers for metabarcoding environmental DNA from fishes: Detection of more than 230 subtropical marine species. R. Soc. Open Sci. 2015, 2, 150088. [Google Scholar] [CrossRef] [PubMed]
  30. Evans, N.T.; Olds, B.P.; Renshaw, M.A.; Turner, C.R.; Li, Y.; Jerde, C.L.; Mahon, A.R.; Pfrender, M.E.; Lamberti, G.A.; Lodge, D.M. Quantification of mesocosm fish and amphibian species diversity via environmental DNA metabarcoding. Mol. Ecol. Resour. 2016, 16, 29–41. [Google Scholar] [CrossRef] [PubMed]
  31. Qiwen, X.; Jianghua, Y.; Lijuan, Z.; Xiaowei, Z.; Chunsheng, L. Using environmental DNA metabarcoding to monitor community diversity of protists in sediments. Asian J. Ecotoxicol. 2022, 17, 175–186. [Google Scholar]
  32. Wanwan, Z.; Yuwei, X.; Jianghua, Y.; Yanan, Y.; Di, L.; Yong, Z.; Hongxia, Y.; Xiaowei, Z. Application and prospects of metabarcoding in environmental monitoring of phytoplankton community. Asian J. Ecotoxicol. 2017, 12, 15–24. [Google Scholar]
  33. Morard, R.; Darling, K.F.; Mahé, F.; Audic, S.; Ujiié, Y.; Weiner, A.K.; André, A.; Seears, H.A.; Wade, C.M.; Quillévéré, F.; et al. PFR2: A curated database of planktonic foraminifera 18S ribosomal DNA as a resource for studies of plankton ecology, biogeography and evolution. Mol. Ecol. 2015, 15, 1472–1485. [Google Scholar] [CrossRef]
  34. Nilsson, R.H.; Ryberg, M.; Kristiansson, E.; Abarenkov, K.; Larsson, K.H.; Kõljalg, U. Taxonomic reliability of DNA sequences in public sequence databases: A fungal perspective. PLoS ONE 2006, 1, e59. [Google Scholar] [CrossRef]
  35. Chen, X.-Y. Yunnan Fish List. Zool. Res. 2013, 34, 281–337. [Google Scholar]
  36. Ji, F.; Han, D.; Yan, L.; Yan, S.; Zha, J.; Shen, J. Assessment of benthic invertebrate diversity and river ecological status along an urbanized gradient using environmental DNA metabarcoding and a traditional survey method. Sci. Total Environ. 2022, 806, 150587. [Google Scholar] [CrossRef] [PubMed]
  37. Lanz’en, A. Benthic eDNA metabarcoding provides accurate assessments of impact from oil extraction and ecological insights. Ecol. Indic. 2021, 130, 108064. [Google Scholar] [CrossRef]
  38. Chen, W.-J.; He, G.; Wu, B.; Fang, C.-L.; Lin, P.-C. Spatial distribution characteristics and resource assessment of fish in the Tongjiang waterway of Poyang Lake. J. Lake Sci. 2017, 29, 923–931. [Google Scholar]
  39. Rodríguez, M.-A.; Lewis, W.-M. Structure of fish assemblages along environmental gradients in floodplain lakes of the orinoco river. Ecol. Monogr. 1997, 67, 109–128. [Google Scholar] [CrossRef]
  40. Luo, J.-S. Assessing Fish Diversity in Plateau Lake in Central Yunnan Province Using Environmental DNA. Master’s Thesis, Yunnan University, Kunming, China, 2019. [Google Scholar]
  41. Liu, J.-K.; Cao, W.-X. Fish resources of the Yangtze River basin and the tactics for their conservation. Resour. Environ. Yangtze Basin 1992, 1, 17–23. [Google Scholar]
Figure 1. Schematic diagram of the sampling locations at the estuaries in the Dianchi basin. D1: Panlong River; D2: Baoxiang River; D3: Cailian River; D4: Laoyu River; D5: Nanchong River; D6: Da River; D7: Chai River; D8: Dongda River; D9: Dachun River; D10: Dianchi Lake Center.
Water 15 04244 g001
Figure 2. Plot of PCR amplification results of DNA extracted from the decamer site using teleo primers. 1: Takara 50 bp DNA Marker; 2: Teleo primer negative control; 3–12: 10 spot Teleo primer amplification products.
Water 15 04244 g002
Figure 3. Percentage of fish species composition in dry (a) vs. abundant (b) water periods.
Water 15 04244 g003aWater 15 04244 g003b
Figure 4. Boxplots of the differential analysis of fish abundance between the two periods of abundance and depletion using the calculation of α-diversity.
Water 15 04244 g004
Figure 5. β-diversity analysis of the fish communities (OTUs) in the Dianchi basin between the dry and rich water periods: Pco, principal coordinate.
Water 15 04244 g005
Figure 6. Difference analysis of Shannon index and Simpson index of fish community diversity between dry and abundant water periods. (a) Shannon index; (b) Simpson index analysis.
Water 15 04244 g006
Figure 7. tb-RDA analysis of the relationship between ten environmental factors and fish communities. (a) Dry period; (b) rich water period.
Water 15 04244 g007
Figure 8. Heat map of fish distribution based on the serial readings of the representative operational taxonomic units (genus taxonomic level) of the fish at each sampling site in the Dianchi basin during the (a) dry and (b) rich periods.
Water 15 04244 g008
Figure 9. Differences in fish community abundance in different types of estuaries during dry (a) and rich (b) water periods were analyzed using Alpha Diversity.
Water 15 04244 g009
Figure 10. Principal Coordinate Analysis (PCoA) of fish community composition between sites using beta diversity analysis for both periods. (a) Dry period; (b) rich water period.
Water 15 04244 g010
Table 1. Latitude and longitude of the sampling points.
Latitude and Longitude of the Sampling Points
Panlong River102.696451′ E, 24.959603′ N
Baoxian River102.722900′ E, 24.924700′ N
Cailian River102.664900′ E, 24.962800′ N
Laoyu River102.763900′ E, 24.826300′ N
Nanchong River102.740700′ E, 24.779500′ N
Da River102.713800′ E, 24.773400′ N
Chai River102.688600′ E, 24.691600′ N
Dongda River102.648900′ E, 24.670000′ N
Dachun River102.635800′ E, 24.684700′ N
Dianchi Lake102.691236′ E, 24.802030′ N
Table 2. Table of universal primer sequences for fish.
Primer NameBase Sequence
TeleoF: ACACCGCCCGTCACTCT
R: CTTCCGGTACACTTACCAT
MiFishF: GTCGGTAAAACTCGTGCCAGC
R: CATAGTGGGGTATCTAATCCCAGTTTG
MetaF: TCGTGCCAGCCACCGCGGTTA
R: ATAGTGGGGTATCTAATCCCAG
Disclaimer/Publisher’s Note: The statements, opinions and data contained in all publications are solely those of the individual author(s) and contributor(s) and not of MDPI and/or the editor(s). MDPI and/or the editor(s) disclaim responsibility for any injury to people or property resulting from any ideas, methods, instructions or products referred to in the content.

