Article

Determining the Changing Irrigation Demands of Maize Production in the Cukurova Plain under Climate Change Scenarios with the CROPWAT Model

Department of Biosystems Engineering, Faculty of Agricultural Sciences and Technologies, Nigde Omer Halisdemir University, Nigde 51240, Turkey
Water 2023, 15(24), 4215; https://doi.org/10.3390/w15244215
Submission received: 4 September 2023 / Revised: 13 November 2023 / Accepted: 4 December 2023 / Published: 7 December 2023
(This article belongs to the Special Issue Hydroclimatic Modeling and Monitoring under Climate Change)

Abstract

:
This study delves into the critical issue of climate change and its impact on maize cultivation, focusing on irrigation water requirements (IWR) and crop evapotranspiration (ETc) values over three distinct time periods: 1971–2000 (RF), 2025–2054 (P1), and 2069–2098 (P2), under the climate scenarios of RCP4.5 and RCP8.5 in the AR5 of the IPCC via the CROPWAT model. The research reveals significant increases in mean temperatures, particularly during summers, in both scenarios, signifying the substantial influence of climate change on the Cukurova Region’s climate. Daily average evapotranspiration (ETo) values for the study periods demonstrate noteworthy increases, with the most pronounced rise observed in July for P2 under RCP8.5, emphasizing the seasonality and magnitude of the change. Moreover, the study underscores a consistent escalation in irrigation water requirements from RF to P2 periods for both scenarios, highlighting the pressing need for water resource management strategies in agriculture. Under RCP4.5, the study found that average simulated ETc increased by 9.2% for P1 and 11.7% for P2 compared to the RF period. In the harsher RCP8.5 scenario, ETc values displayed a substantial 20.0% increase for P2 and exhibited a wide range of variation across the study periods. In the light of these escalating climate change impacts, this study underscores the imperative of understanding and addressing the challenges encountered in maize cultivation. The findings emphasize the consistent rise in temperature and irrigation demands, underscoring the necessity for proactive adaptive strategies to ensure the sustainability of agricultural practices and long-term food security. As climate change continues to exert its influence, this research serves as a call to action for policymakers, agricultural stakeholders, and researchers to prioritize adaptation efforts to safeguard the future of maize production and the global food supply.

1. Introduction

In terms of quantity, the first three places in world grain production are shared by maize, paddy rice, and wheat, respectively. Maize is a rich source of food for both humans and animals and, nowadays, also a source of biofuel. Despite its importance, maize farming is highly vulnerable to climate change, especially in regions with Mediterranean climates [1,2]. Maize output is expected to be significantly impacted by changes in temperature rise, rainfall patterns and the frequency of extreme weather events. These factors will also likely have an impact on maize yields and water use [3,4,5]. It is critical to comprehend how changes in long-term meteorological conditions change affects and understanding the impact it has on reducing corn production and to create plans to mitigate or adapt to these consequences. Furthermore, due to its high water requirements, optimizing irrigation is crucial for maize cultivation [6]. During the early 1900s, the production of maize saw a significant increase. Nowadays, the continent of America is the top producer, accounting for 55.9% of the world’s maize production. Asia and Europe followed with 21.6% and 15.6%, respectively, while Africa produced 6.9% of the world’s maize. In 2022, Turkey’s maize production amounted to 6.8 million tons, which represented 1.4% of the world’s total production [7]. The latest statistics from 2022 indicate that Adana, located in the Cukurova Plain, ranks third in Turkey for harvested area (86,698 hectares) and maize production (888,348 tons), placing Adana behind Konya and Şanlıurfa [8]. Maize is a crop that requires a considerable amount of water, as it grows in the hottest season of the year. However, compared to other field crops, maize is known to have high water use efficiency and can produce a significant quantity of dry matter relative to crop evapotranspiration.
Agriculture has always been a vital aspect of human life, providing sustenance for the expanding population. However, the changing climate has put the agricultural industry under immense pressure. Increasing temperatures and shifting patterns of precipitation, and extreme weather events are affecting crop yields and productivity [9,10,11,12]. In addition, soil erosion, nutrient depletion, and desertification are leading to the loss of arable land [13]. Due to these environmental effects and the growing population—the linked demand for food, creative, and sustainable styles need to be espoused in farming. By 2050, the population of the world is expected to reach 9.7 billion, placing additional strain on the planet’s resources, according to UN estimates. [14]. Among the many services affected by climate change, the availability of natural water resources is becoming increasingly limited due to changing rainfall patterns, rising temperatures, and the growing population. Numerous studies have emphasized that these factors are the main drivers behind the ever-growing scarcity of water sources [15,16,17,18,19,20].
The agricultural sector is a major water user, accounting for 70% of the world’s freshwater use. Sustainable and efficient use of water resources is crucial for human survival. [21,22]. Developing effective water management policies can lead to better management of groundwater resources and can have significant global implications. However, climate change poses a significant threat to water resources, and existing water management approaches might be insufficient to tackle this problem. The demand for agricultural production, which requires more irrigation water, continues to increase with the growing population. Embracing contemporary irrigation methods, implementing water collection infrastructure, and practicing deficit irrigation can contribute to water conservation and enhance agricultural production efficiency [23,24,25]. Careful consideration of factors such as soil texture, climate, crop type, water quality, and economic viability is necessary when choosing the irrigation method. To effectively manage water in agriculture, crop water requirements and irrigation schedule planning are essential. [26,27]. Although field studies are a common approach for calculating crop evapotranspiration, they can be expensive, labor-intensive, and time-consuming. To get over these restrictions, it is possible to calculate evapotranspiration for various plant species using equations based on climate data from earlier field investigations. With this method, estimating agricultural water usage may be carried out quickly and affordably without a lot of fieldwork. Improving water management policies and adopting sustainable practices in the agricultural sector can help ensure the efficient use of water resources, preserve groundwater resources, and mitigate the effects of climate change. Thus, the expeditious implementation of such an approach would enable more prompt adaptation to the consequences of burgeoning population growth and changing climatic conditions.
The estimation of evapotranspiration is critical for effective water management in agriculture [28,29]. To accurately estimate evapotranspiration, various methods have been developed over the years. However, these methods may have limitations in their applicability. To overcome this, researchers have come up with a method called reference evapotranspiration (ETo), which can estimate evapotranspiration for different plant varieties and climate conditions [30,31]. A generally used method for calculating evapotranspiration (ETo) or the movement of water from the Earth’s outside into the atmosphere through plant transpiration and evaporation, is the Penman–Monteith approach [32,33,34]. This method is based on physical principles and requires a range of input parameters, including meteorological data, soil properties, and plant characteristics. It has been suggested that the Penman–Monteith approach be used as the norm for ET estimates by the American Society of Civil Engineers (ASCE) and the Food and Agriculture Organization of the United Nations (FAO) because of its accuracy and ability to handle a wide range of environmental conditions.
A variety of models [35] are used to compute factors including evapotranspiration, plant water consumption, plant growth, irrigation water need, and yield, as well as the effects of present conditions or climate change on agricultural production. [36,37,38,39]. These can be spatial or point-based models. The CROPWAT model is available in the literature for plant water consumption, calculation of irrigation water, and total water consumption according to product pattern in a basin or region, as well as the calculation of changes that may occur in water consumption and irrigation water due to climate change [40,41,42,43,44,45]. It is widely used in determining the appropriate product pattern [46,47] and calculating the water footprint [48,49,50]. In studies conducted with CROPWAT, the water consumption and irrigation water need or water footprint of many crops such as groundnut [51], alfalfa [52], jatropha [42], coconut [53], rice [54], sorghum [55], chili and tomato [47], soybean [56], banana and sugarcane [57], eggplant, cucumber and cabbage [58], barley [47], wheat [42,47,55,57], cotton [42,55,58], potato [36], apple [43,44], carrots and onions [50], grape, vegetables with leaves and lettuce [44], and maize [35,45,47,51,59,60,61,62] have been calculated. Again, in various studies, researchers have attempted to determine the effect of climate change on water consumption for maize using CROPWAT [63,64,65,66]. Some of these are given below for a better understanding of the study.
Tangzhe Nie at al. [59] found the average values for the irrigation of maize, which were calculated with CROPWAT. The findings were nearly 170 mm, 230 mm, 280 mm, and 340 mm in the wet, normal, dry, and extremely dry years, respectively, obtained from a reference period from 1960 to 2020 in Heilongjiang Province at China.
The results of Abdoulaye et al. [60] are derived from IPCC AR5. Five global climate models were used for climate change scenarios. Smith’s CROPWAT approach was used to calculate the net irrigation water demand (IWR) of maize. These increases range from nearly 1% to 21% (in North America) in the RCP4.5 scenario, and from 4% in Sub-Saharan Africa to 68% in North America in the RCP8.5 scenario.
For Natural Agro-Ecological Region II in Zimbabwe, Temba Nkomozepi and Sang-Ok Chung [40] evaluated trends and uncertainties in net irrigation water demand forecasts based on global climate models derived using the Food and Agriculture CROPWAT model. Future periods are likely to have a decrease in precipitation and a rise in baseline temperature and evapotranspiration. Their findings indicate that in these 2020 time slices of the years 2050 and 2090, respectively, the net irrigation requirement (NIR) is predicted to rise by an average (and range) of 33% (−22 to 92%), 66% (15 to 168%), and 99% (17 to 205%).
Kidane Welde and Hintsa Libsekal Gebremariam [62] assessed how plant spacing and furrow affected the productivity and water usage efficiency of maize. Maize was used in their study, and all cultivation applications were handled identically. CROPWAT was run to predict the water needs of corn. The outputs demonstrated that the irrigation water use efficiency (IWUE), varied significantly (p < 0.05) amongst approaches.
In a study carried out by Zhihui Li et al. [45] CROPWAT evaluated the water footprints of maize, soybean, and rice. Their water consumption calculations were conducted at urban and 1 km mesh scales in Northeast China in 2019. The findings demonstrated that the average total water footprints of soybean, rice, and maize were, respectively, 1300 m3·ton−1, 620 m3·ton−1, and 530 m3·ton−1.
Mengran Fu et al.’s study [51] used geographic information system (GIS) technology to analyze the green, blue, and gray water footprints of corn, wheat, peanuts and cotton during the past 27 yearly period. This study is based on CROPWAT software 8.0 and agricultural and monthly meteorological measurements in Shandong province. They calculated and evaluated how the agricultural water footprint changes spatially from rainy year to rainy year.
In a study carried out by Xueqing Zhao et al. [61], CROPWAT evaluated the amount of IWR for spring corn production in Northeast China. This method was enhanced by combining it with the ArcGIS program to facilitate the computation and analysis of the blue, gray, green, and total water footprint values, at the provincial and municipal levels, of spring maize production in Northeast China.
CROPWAT, which calculates the response of crop water requirements (CWR) under different environmental conditions and irrigation applications, is used in this study. The reference climate data from 1971 to 2000 and future climate data from 2025 to 2054 and 2069 to 2098 will be used, as defined by the ICTP’s Regional Climate Model system version 4 (RegCM4). The reference evapotranspiration of the growing season, the irrigation water requirements for maize, and the crop evapotranspiration for the periods will all be examined in this study. The results of this study will aid in the adaptation of farmers and policymakers to these changes and further our understanding of the effects of climate change on maize growing in Mediterranean regions.

2. Material and Methods

2.1. Study Area

Adana Province, located in the southern part of Turkey, at 36.99° N latitude, 35.20° E longitude, and an elevation of 67 m, was chosen as the study area for the research. The study area, Adana Province, is in the Mediterranean region, marked by temperate and rainy winters, as well as scorching and arid summers. The climate data spanning from 1928 to 2020 obtained from the meteorological station can be found in Table 1.

2.2. Description of CROPWAT Model and Input Data

The Food and Agriculture Organization (FAO) Land and Water Development Division created the tool CROPWAT to assist in estimating irrigation water requirements under different management and meteorological situations, simulating crop evapotranspiration, and calculating reference evapotranspiration. The program is useful for developing water supply plans, evaluating drought impacts, assessing rain-fed production, and measuring the irrigation efficiency. It is widely recognized as an important tool for supporting sustainable agriculture and water management practices.
Crop water needs are calculated according to inputs of climate, crop, and soil variables. This can be determined by using established procedures to calculate the reference evapotranspiration (ETo), rainfall, and crop coefficients (Kc). The model also needs information on soil type, maximum rooting depth, total available soil moisture, and soil moisture depletion in order to schedule irrigation. The CROPWAT model computes ETo and irrigation water requirements after the necessary input data is entered, and it then presents the findings in tables or graphs. Developing efficient water supply strategies, maximizing irrigation applications, and supporting sustainable agricultural practices all depend on this information.

2.3. Climate Data

The study utilizes projections developed for the central meteorological station of Adana province, Turkey, for four distinct periods: the reference period of 1971–2000, near future (2025–2054), and far future (2069–2098). Daily total precipitation (mm), average humidity (%), average/minimum/maximum temperatures (°C) and average wind speed (m/s) will be measured for each period. The assessments were conducted using HadGEM2-ES global climate model and two different scenarios (RCP4.5 and RCP8.5). The selected models are widely recognized in the international literature and are among the global climate models accepted by the IPCC reports. The model was developed using RegCM4.3.4, a regional climate model. RegCM, the initial regional climate model, was created by the International Centre for Theoretical Physics (ICTP), located in Italy. The RegCM model has been effectively utilized in prior research to assess the possible impacts of future climate change [67,68,69]. RegCM4.3.4, with dynamic downscaling method at a resolution of 20 km, was employed to process the outputs of HadGEM2-ES global climate model (spatial resolution of 1° latitudes and 1.25° longitude and 18 vertical levels). The CROPWAT model was then applied to the climate data for each year, enabling determination of the daily average ETo, necessary irrigation needs during the growth season and annual ETc.

2.4. Crop Data

Zea mays L. (maize), was determined as the crop material. Maize data from previous trials conducted in Adana conditions were used to decrease the findings’ margin of error. For the maize cultivated in the selected location, the emergence, development, mid-season, and late-season values were determined to be 9, 35, 45, and 35 days, respectively. And 26 April was designated as the planting date and 27 August as the harvest date [70]. The Kc values of the maize grown in the location are 0.33, 1.14, and 0.31 for the early stage of the season, the middle of the season and the end of the season, respectively. They are taken from the records from the General Directorate of Agricultural Research and Policy of Turkey [71]. The total yield response factor was 1.23, as reported by [70], and the critical depletion value of 0.30 was allocated to the CROPWAT model [72]. The maize parameters are shown in Table 2.

2.5. Soil Data

The work conducted in Adana in a prior study formed the foundation for selecting the suitable soil texture for the current investigation [70]. The soil in the study location is clay. The other factors, initial soil moisture depletion (10%), total soil moisture (198 mm m−1), maximum rooting depth (120 cm), maximum rain infiltration rate (40 mm day−1), were utilized as input data.

2.6. CROPWAT Model Outputs

2.6.1. Reference Evapotranspiration (ETo)

Estimating potential evapotranspiration in the study area is essential because it influences the quantity of irrigation water requirements of maize. Higher values of evaporation would have been part of the understanding the effects of climate change when the IWR being higher. Because it needs easily available inputs like minimum and maximum temperatures (°C), wind speed (m/s), daily sunshine (h), and relative humidity (%), which were estimated with the RegCM for the Adana province, the FAO Penman–Monteith formula was used in this work to calculate evapotranspiration [30]. A mathematical equation is utilized to express the Penman–Monteith equation employed in this study (Equation (1)).
E T o = 0.408 R n G + γ 900 T + 273 u 2 e s e a + γ ( 1 + 0.34 u 2 )
In the equation;
  • Rn: net radiation at the crop canopy (MJ m−2 day−1);
  • G: soil heat flux density (MJ m−2 day−1);
  • T: average daily air temperature at 2 m height (°C);
  • u2: wind speed (at 2 m height (m s−1));
  • es: saturation vapor pressure (kPa);
  • ea: actual vapor pressure (kPa);
  • es – ea: saturation vapor pressure deficit (kPa);
  • ∆: slope vapor pressure curve (kPa °C−1);
  • γ: psychometric constant (kPa °C−1).

2.6.2. Crop Evapotranspiration (ETc)

When calculating ETc, the model makes use of the crop coefficient (Kc), which was established in accordance with climatic data. The crop coefficient is defined as the reference ETo to ETc ratio. ETc is calculated using the equation shown below (Equation (2)).
E T c = E T o × K c

2.6.3. Estimation of Irrigation Water Requirement (IWR)

By utilizing the calculated evapotranspiration figures along with the effective rainfall (Peff) values, the IWR was determined. To calculate Peff, the CROPWAT model’s USDA Soil Conservation Service approach was employed. Equations (3) and (4) illustrate the United States Department of Agriculture (USDA) SCS approach for determining Peff.
P e f f = P × 125 0.2 × P   i f   P 250   m m
P e f f = 125 + ( 0.1 × P )   i f   P 250   m m
In the equations:
  • Peff: effective rainfall;
  • P: rainfall.
IWR represents the volume of water that needs to be supplied to the crop through irrigation. When irrigation is the sole water source for the plant, IWR should surpass ETc. However, if the plant derives water from alternate sources such as rainfall, deep seepage, or runoff, IWR can be less than ETc [73]. In this study, the drip irrigation method was employed, focusing on replenishing insufficient moisture to reach field capacity, hence disregarding all sources except rainfall. Equation (5) was employed to calculate IWR.
I W R = E T c P e f f

2.7. Limitation of CROPWAT

It is important to remember that the study’s results were acquired within the constraints of the CROPWAT model while assessing all of the data. The user manual of CROPWAT thoroughly outlines the conditions and computations under which the software operates. It is not an open-source program. A summary of a few of these limitations can be seen below. CWR and IWR are calculated using plant and meteorological data by the empirical process-based model CROPWAT. Based on calculations of the daily soil water balance, it can also be used to evaluate crop performance under both irrigated and rainfed conditions. It should be noted that the soil moisture balance equation does not include the terms sub-surface flow and capillary rise because their values are typically negligible. In order to determine surface runoff and deep infiltration, which the model is unable to simulate, Peff is also used. Furthermore, the net irrigation demand does not take system losses into consideration; in that case, the gross irrigation requirement would apply. CROPWAT 8.0 is adaptable enough to take into consideration losses from surface runoff, percolation—which characterizes the storm water’s downward flow rate—and water capillary rise—by choosing one of the earlier choices for effective rainfall [74]. CROPWAT simulated larger soil water depletion and, as a result, higher ET according to the EPIC phase model since it did not take into account the limitation of being dependent on crop species due to changes in root distribution and density [75]. The lower simulated drainage may potentially be caused by the higher soil water depletion that CROPWAT simulated. Another drawback of the model is that CROPWAT uses the mean value of the crop coefficient for the plant growth periods. The user of the CROPWAT model can specify either two layers (i.e., topsoil and subsoil) or only one layer (i.e., maximum rooting depth). The disparities may also result from the interpolation of climatic data used by CROPWAT to determine the daily water balance. Furthermore, CROPWAT employs developmental time in days rather than degree-days, which improves yield predictions and increases the accuracy of development stage calculations.
A few CROPWAT shortcomings were noted by Vote et al. [76] in their work. Due to differences in microclimates, soil conditions, and nutrient availability, Ky values can differ significantly over time and space within single cultivars as well as between crop kinds and crops. As a result, the simplified method of giving a single empirically determined value of Ky across a predetermined period reduces estimate accuracy and raises uncertainty in the model’s results. Additional shortcomings of CROPWAT include its incapacity to transfer soil moisture over calendar years because simulations are set up to run for discrete, individual years even though it has the ability to employ daily rainfall and ETo values. Additionally, because it is a straightforward calculation that does not require local calibration, the USDA SCS approach is frequently employed as the default method when determining effective rainfall. However, the application should be restricted to similar bioclimatic regions and/or months where ETo is high, as this empirical connection was created inside a semi-arid climate with well-drained soils; otherwise, estimations of Peff may be underestimated. The model’s inability to replicate how increasing atmospheric carbon dioxide (CO2) concentrations might affect agricultural water demand is one of its other limitations. [76].
Despite being able to use daily rainfall and ETo readings, the CROPWAT model has numerous shortcomings that have been brought to light. One such shortcoming is that soil moisture cannot be carried over calendar years because simulations are set to run for discrete, individual years. Raeth [77,78] observed that CROPWAT seems to be calculating using incoming solar radiation rather than net radiation, which would lead one to anticipate larger irrigation requirements estimates.
CROPWAT predicts irrigation depth using the average monthly evapotranspiration value, which could lead to an under- or overestimation in the event of a significant daily weather variance. The current setup in CROPWAT only allows for the entry of three digits plus a decimal for a particular month, which is a limitation on rainfall data entry. In order to increase the precision of the CROPWAT model’s estimation of irrigation during the dry season, the groundwater level should be included. The percentage of water depletion that CROPWAT needed to forecast a yield drop was due to water stress. The calculation of crop irrigation needs was based on the assumption of an ideal water supply and efficient precipitation. The model carries out a daily soil water balance computation to anticipate root zone soil water content given water input and output from the irrigation system, infiltration properties, and soil water retention, coupled with estimates of rooting depth. The root zone stress conditions were related to the critical soil water content, which is defined as the soil moisture level below which plant transpiration is restricted by soil water content. This is expressed as the fraction of total available soil water (TAW). It fluctuates depending on the crop and stage of growth and is influenced by the crop’s root density, evaporation rate, and soil type, to some extent. Using an empirical yield response function, the relationship between the relative yield drop and the relative evapotranspiration deficit allowed for the quantification of the impact of water stress on yield. The most significant shortcoming of the CROPWAT model is that it only takes into account drought stress while ignoring other stresses, like salt. There may also be discrepancies between model results and real data due to model crop coefficients. This study demonstrates that using the CROPWAT model without first calibrating the crop coefficients and soil properties would lead to large errors, which is something that should be taken into account. [79]. The CROPWAT irrigation scheduling component offers the opportunity to assess actual efficiency values for various crop and soil situations using water balance calculations. The impact of a soil water deficit on crop evapotranspiration, which is thought to decline linearly in proportion to a drop in the amount of water available in the root zone, can be explained by the water stress coefficient (Ks).

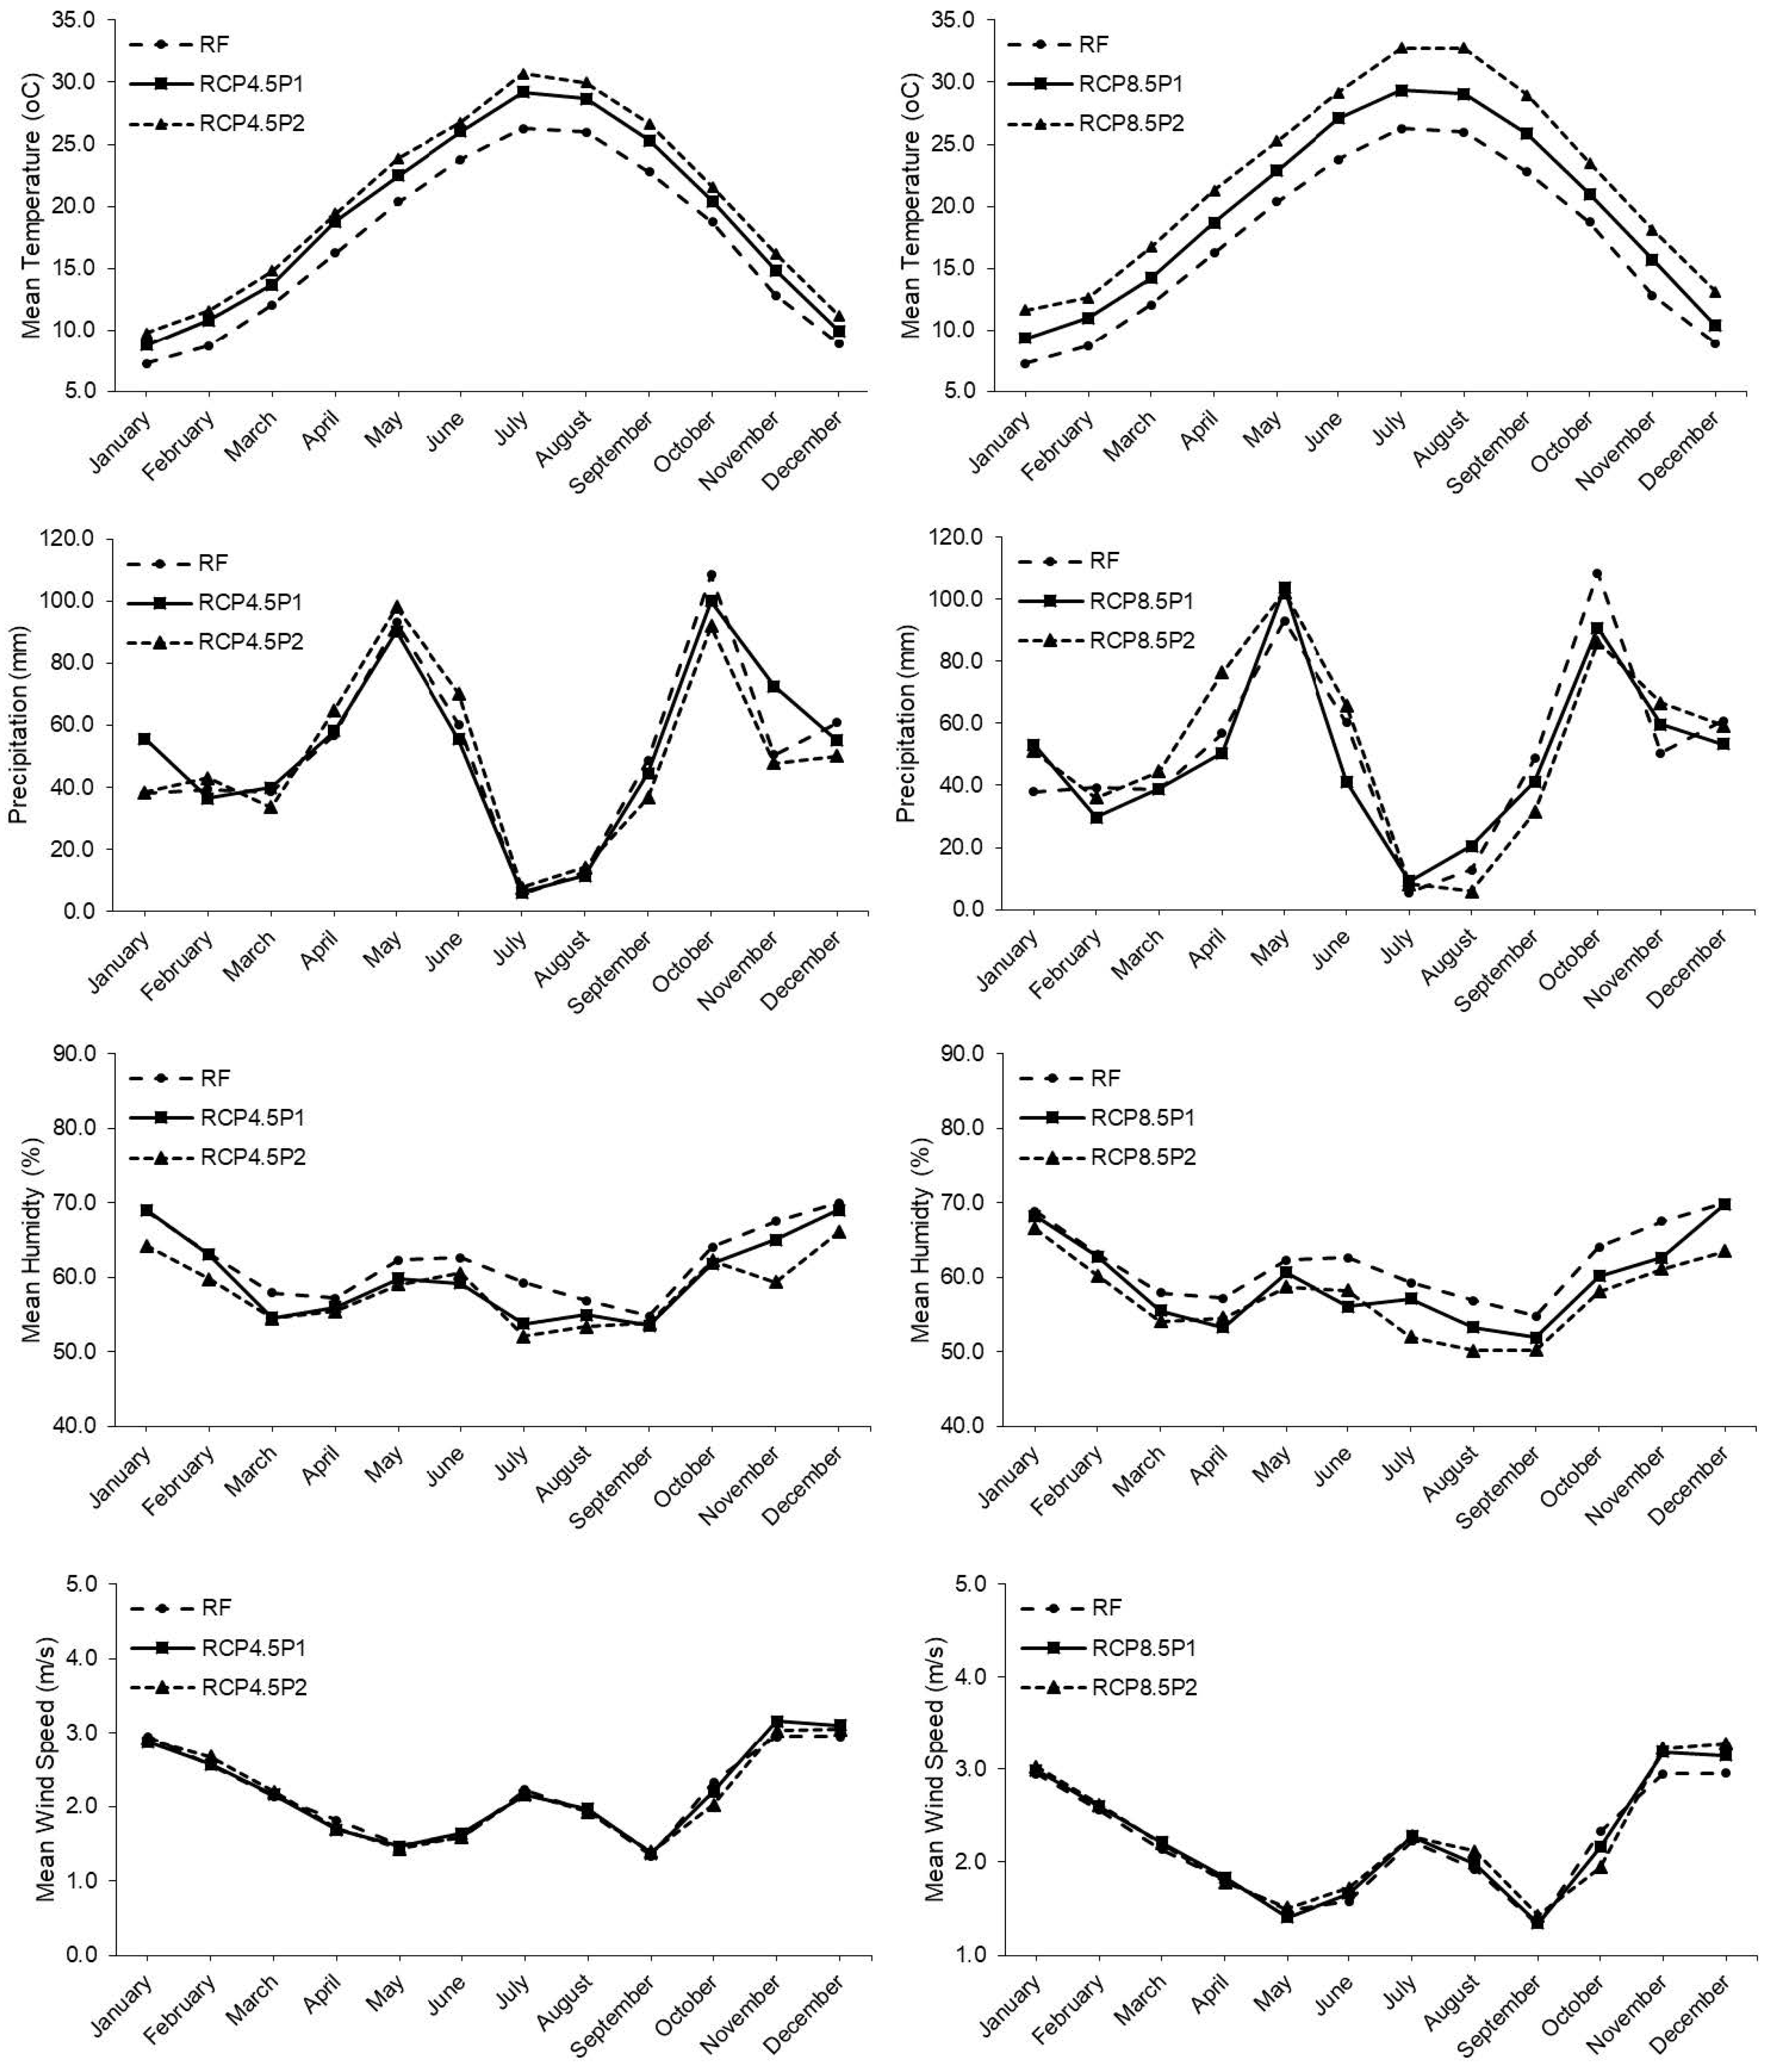
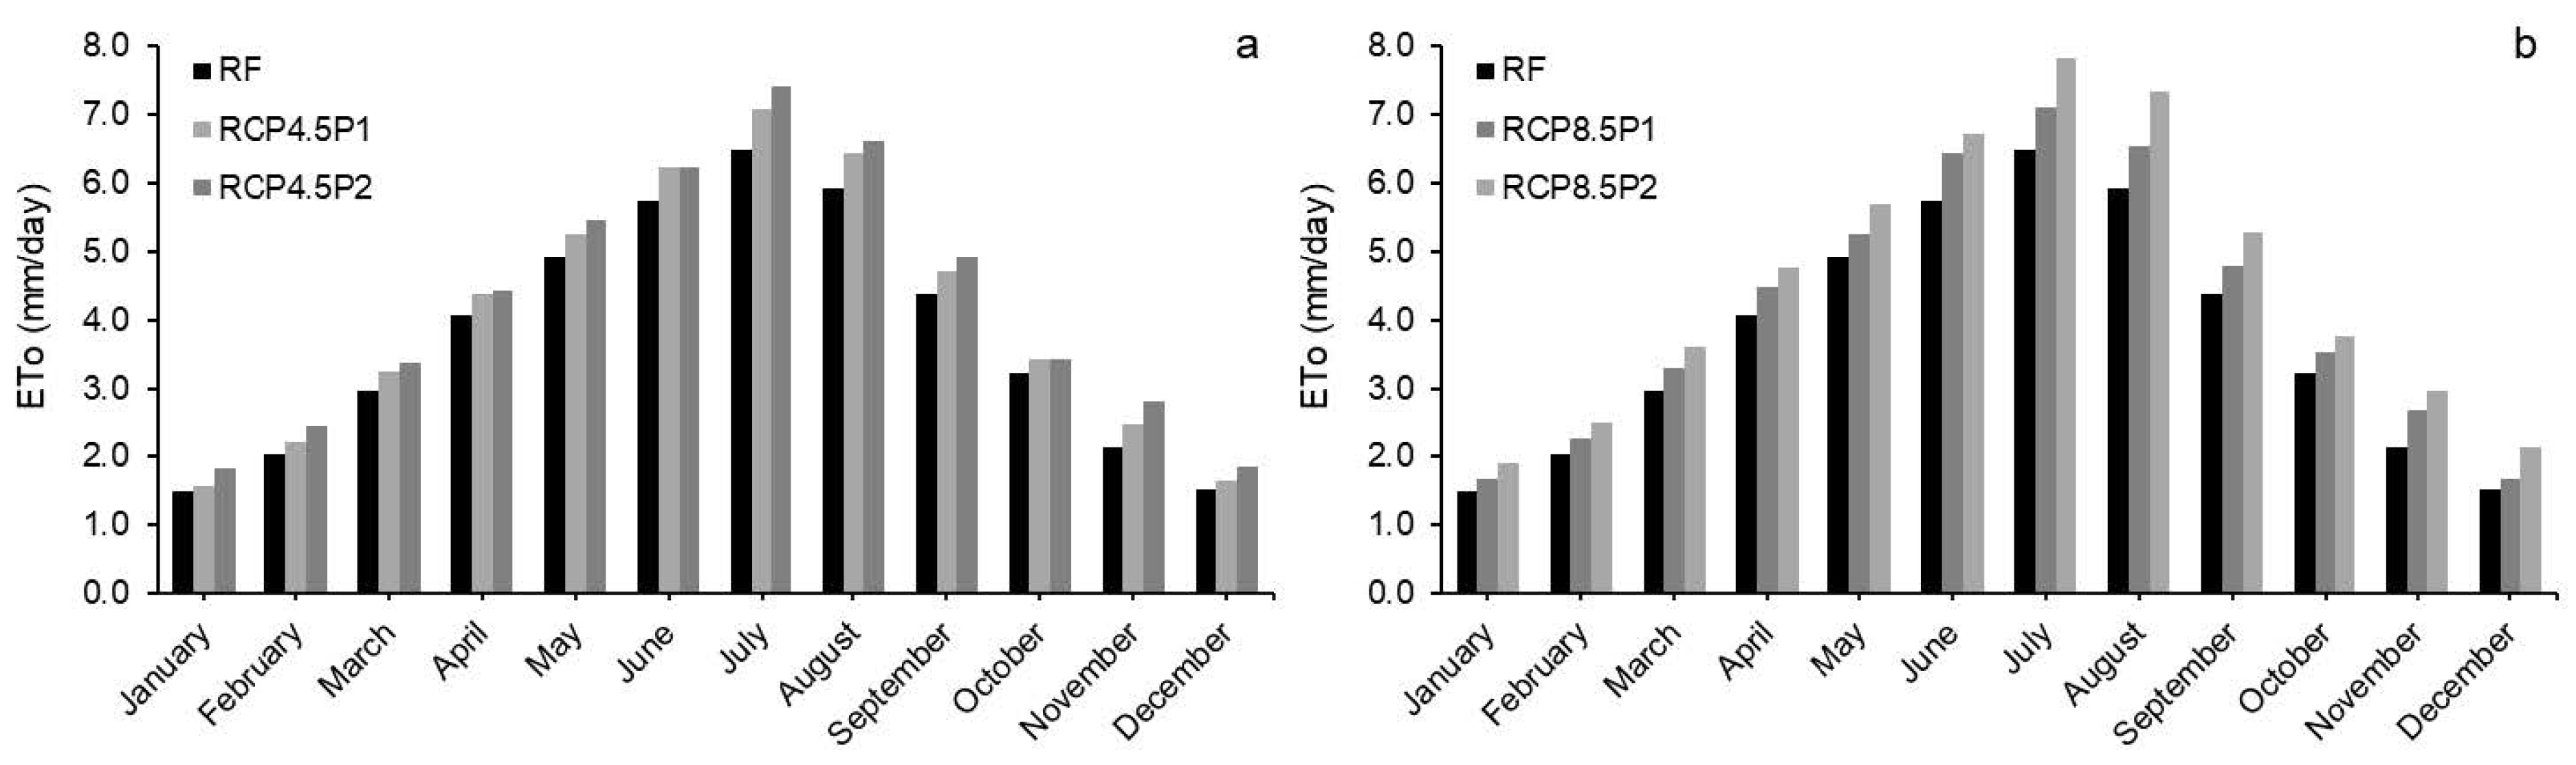
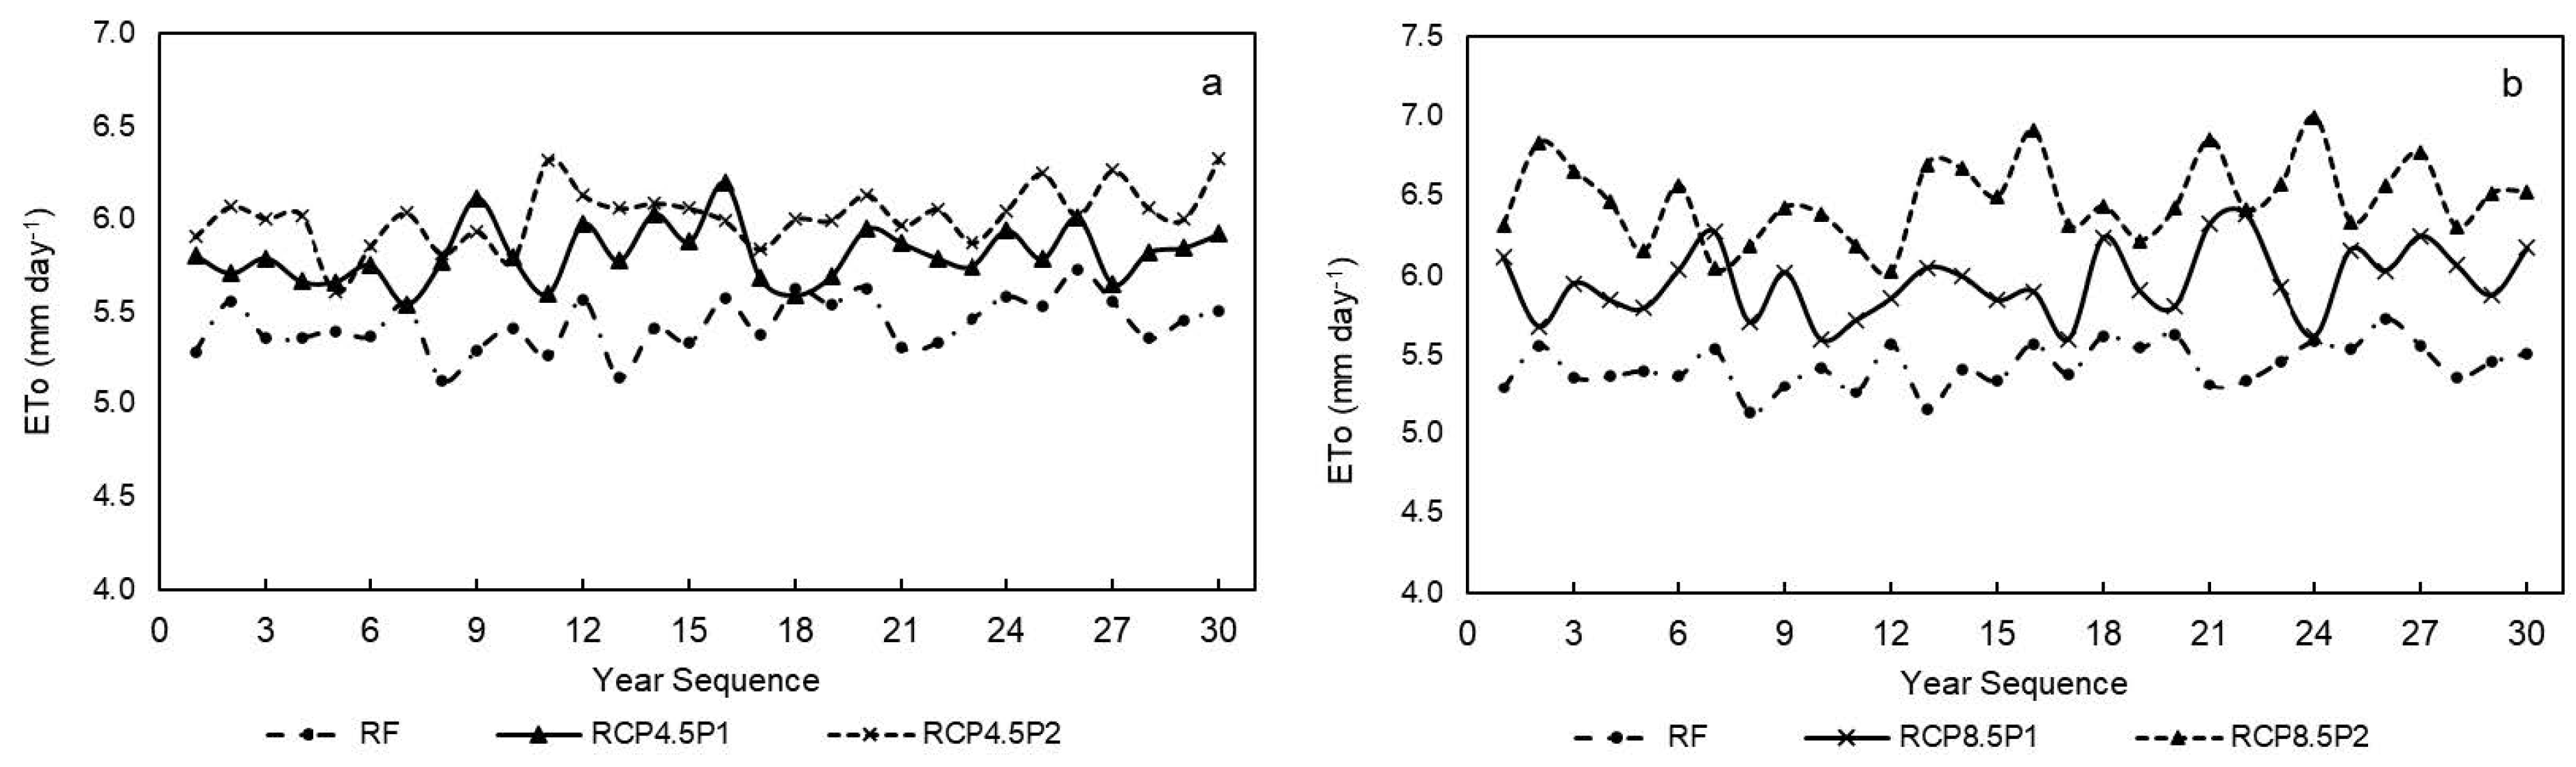
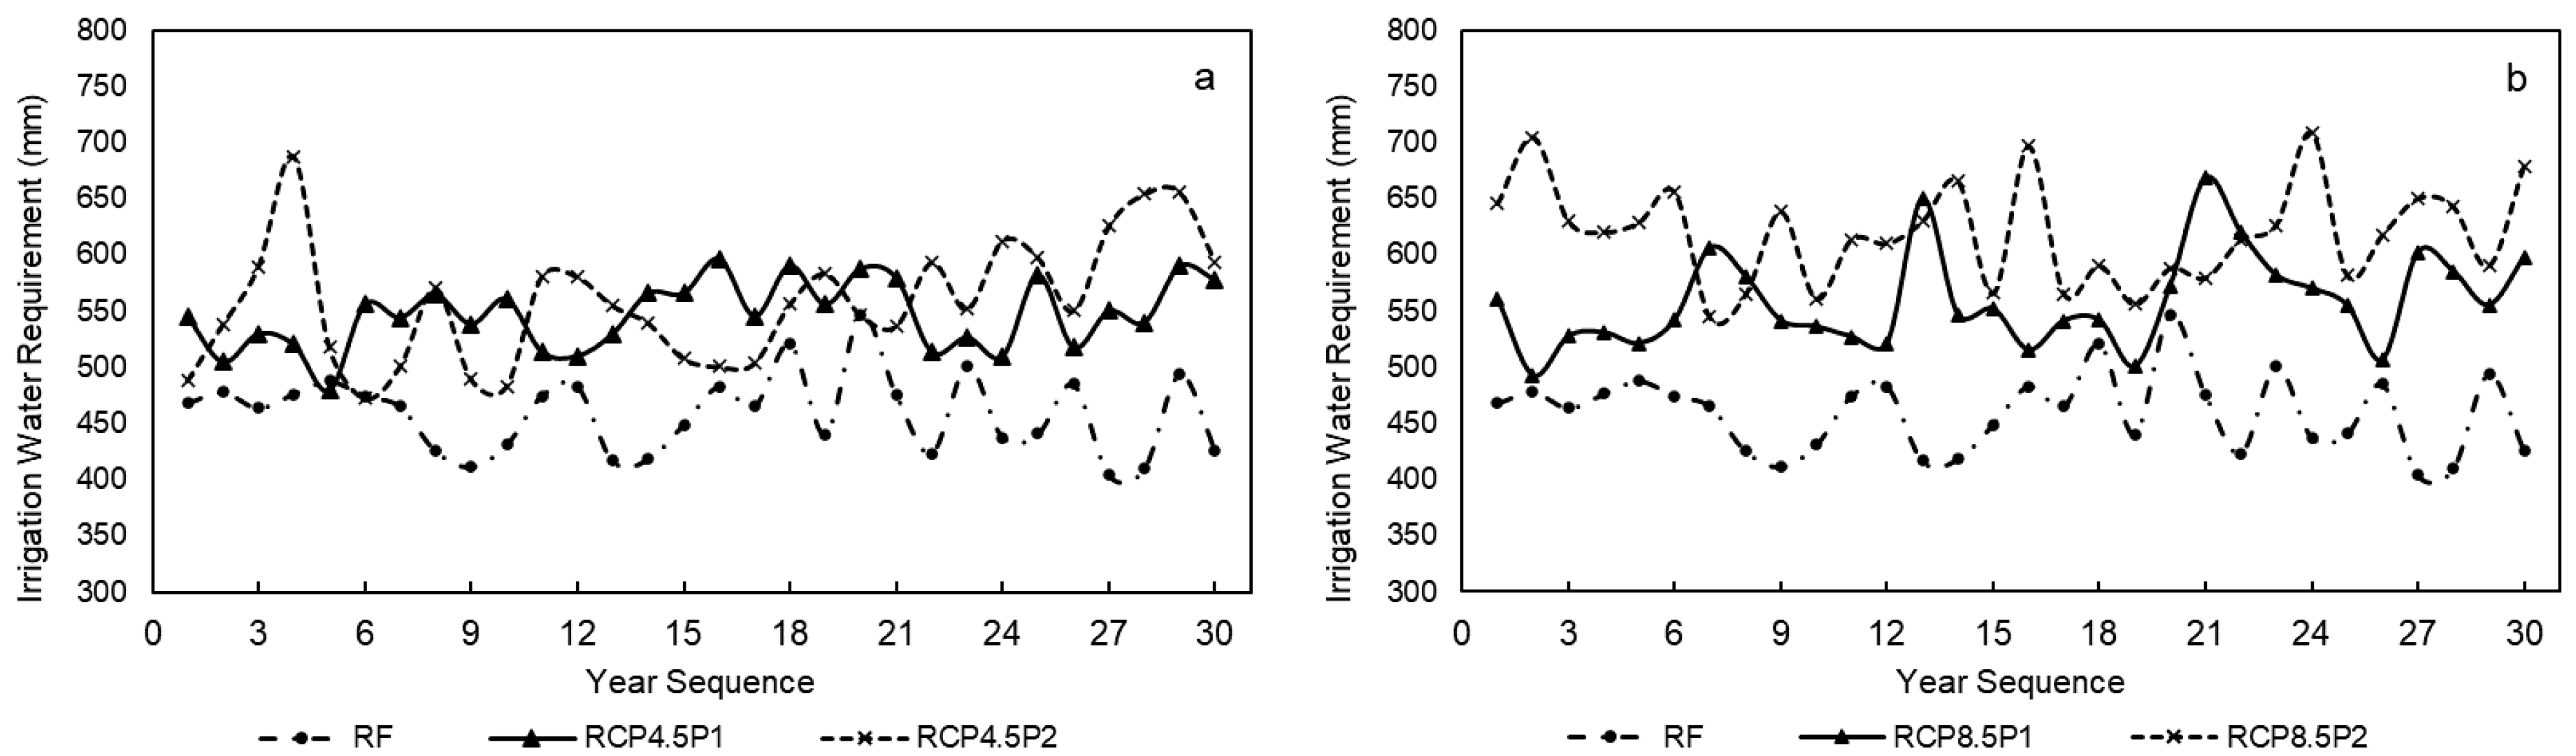
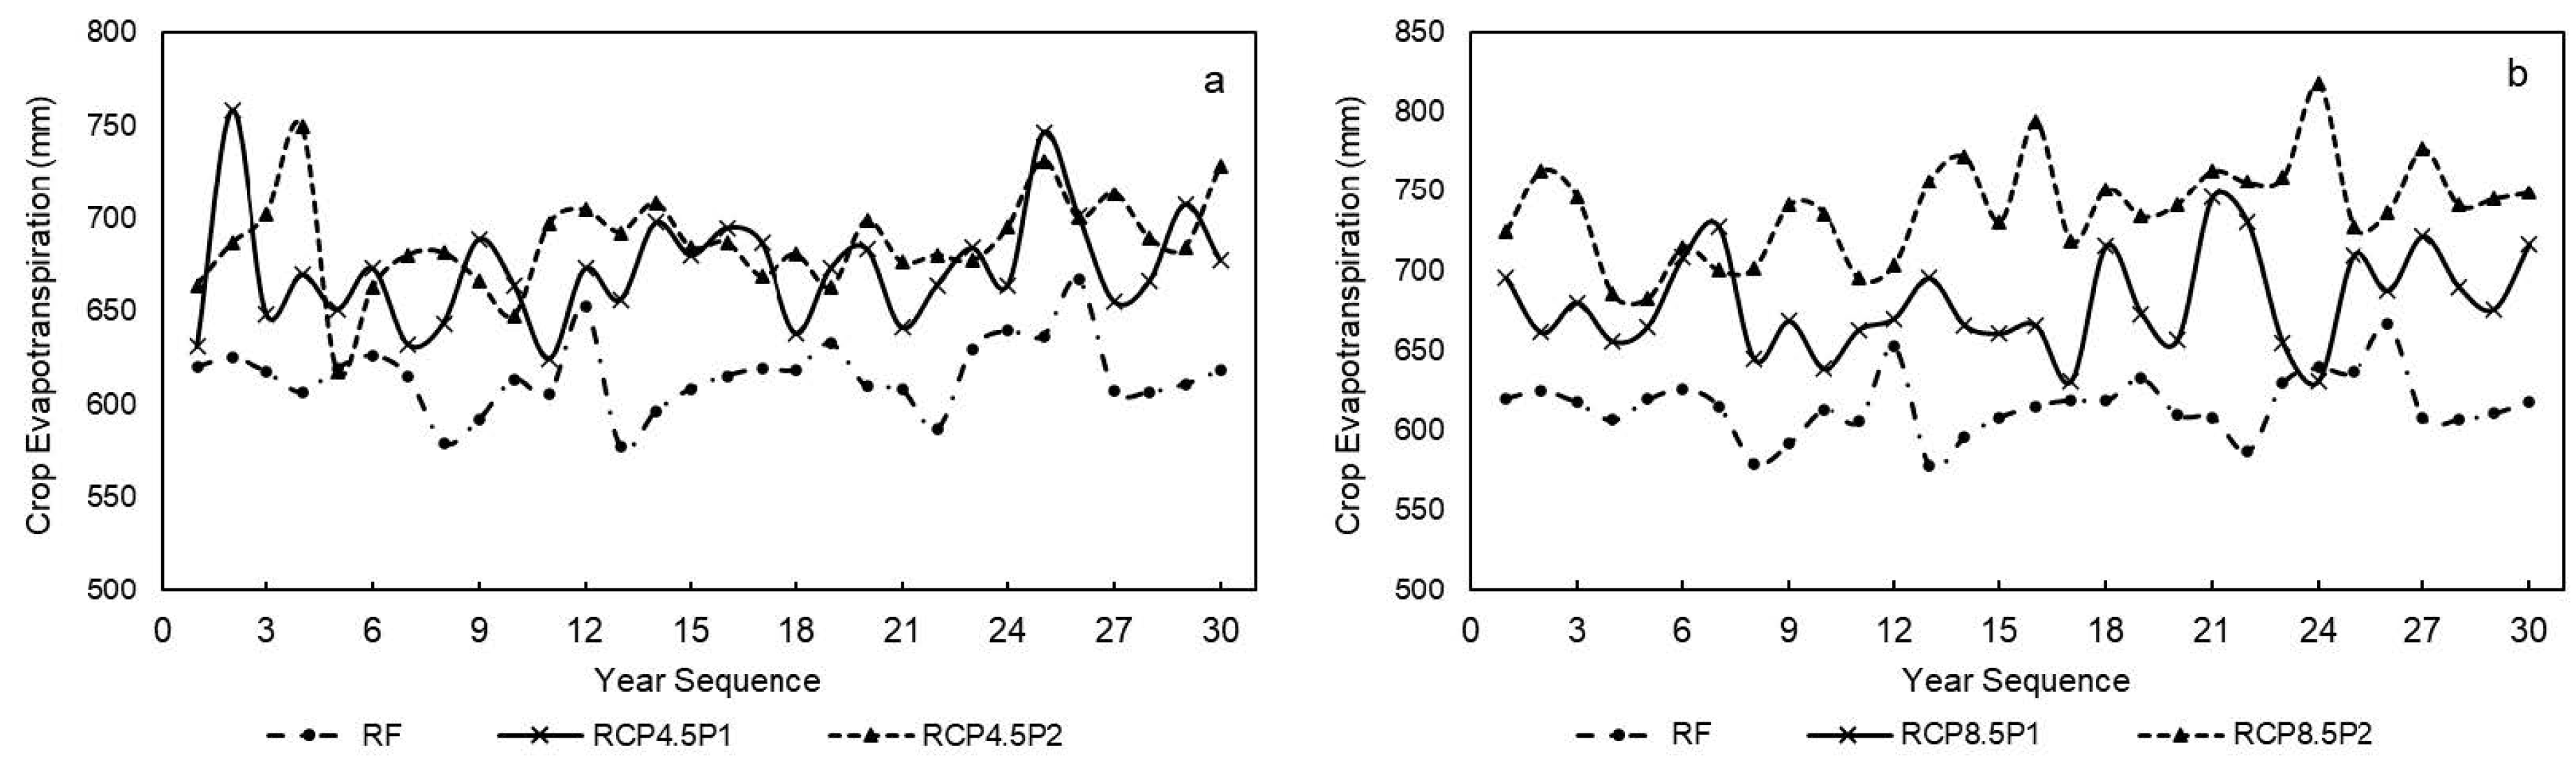
3. Results and Discussion

The mean temperature values for the working periods in Adana province are presented in Figure 1 under scenarios RCP4.5 and RCP8.5. The highest calculated average temperature value during the 1971–2000 (RF) period was determined as 26.3 °C. Under the RCP4.5 scenario conditions, this value is projected to be 29.2 °C for the period 2025–2054 (P1) and 30.7 °C for the period 2069–2098 (P2). It has been identified that in the RCP4.5 scenario, temperature values in the study area will experience an increase of 11.0% for the P1 period and 16.7% for the P2 period (Figure 1). Analyzing the temperature changes in the RCP8.5 scenario, the highest average temperature reaches 29.4 °C for the P1 period and 32.8 °C for the P2 period, with corresponding increase rates of 11.8% and 24.8%, respectively (Figure 1). In both scenario conditions, the months with the highest increases are the summers, while the lowest increase rates occur during the winters. The observed rises in monthly average temperatures align cohesively with the temperature escalation projections documented by the IPCC [80]. Todaro et al. [81] have presented findings indicating a projected increase in the annual mean temperature by the close of the century for the Mediterranean region. The study reveals an estimated elevation of approximately 2.7 °C when considering the RCP4.5 scenario, in comparison to the reference period. Moreover, under the RCP8.5 scenario, this temperature rise is anticipated to exceed 5 °C. Seker and Gumus [82] have documented a noteworthy temperature projection escalation within the ranges of +1.0 to +2.2 °C for the RCP4.5 scenario, and +1.8 to +3.1 °C for the RCP8.5 scenario. This observation underscores the potential variability in temperature changes that could be experienced under different emissions pathways, further underscoring the complexity of future climate dynamics. Cukurova region could potentially experience a temperature elevation of 3 °C [83].
Various methods are available for calculating reference evapotranspiration, such as the Blaney–Criddle, radiation, Penman–Monteith, and pan evaporation methods. ETo values for Adana province were computed using the Penman–Monteith method. The daily average ETo values for the months of the RF, P1, and P2 periods are depicted in Figure 2 for both scenario conditions (RCP4.5 and RCP8.5). During the RF period, the highest ETo value was determined in July at 6.5 mm/day, while the lowest value occurred in January at 1.50 mm/day. In the RCP4.5 scenario, the highest value for P1 was 7.1 mm/day, increasing to 7.4 mm/day in the P2 period. The daily average ETo differences for P1 and P2 periods were 0.6 mm/day (9.2%) and 0.9 mm/day (13.8%), respectively (Figure 2a). These differences were further pronounced under the RCP8.5 conditions, with a noticeable increase observed in July, where a 13.8% rise for P1 and a 20.3% increase for P2 were calculated (Figure 2b). In the RCP4.5 scenario, the differences between the P1 and P2 periods approached zero in certain months, particularly in June and November. This phenomenon was attributed to anticipated heavy rainfall events as projected by the climate model. Moreover, it is stated that within the sphere of climate change effects in the Mediterranean region, a notable shift is anticipated in precipitation patterns, leaning toward a reduction characterized by fewer occurrences but heightened intensity, particularly during the spring season [84]. Concurrently, rising temperatures amplify both plant transpiration and soil evaporation. The differences in calculated ETo values during the corn growing period (April-August) for the RF-P1-P2 periods under RCP4.5 and RCP8.5 scenario conditions are presented in Figure 3. In the RCP4.5 scenario, the difference between the average RF-P1 and RF-P2 values was determined to be 0.4 mm/day and 0.6 mm/day, respectively. The increase rates of the P1 and P2 periods compared to the RF period were 7.0% and 10.7%, respectively (Figure 3a). In the RCP8.5 scenario, the rate of increase in calculated ETo values during the growing period was higher compared to the RCP4.5 scenario, in particular reaching 19.1% during the P2 period (Figure 3b). The maximum average ETo value calculated for the years 2025–2054 was 6.4 mm/day, while it was 7.0 mm/day for the years 2069–2098 in the RCP8.5 scenario. The calculated ETo values for the growing period indicate that in the RCP4.5 scenario, the maximum increase was 23.2%, whereas under RCP8.5 scenario conditions it was 36.2%. Abdrabbo et al. [85] presented projections of forthcoming climatic alterations in Egypt, indicating potential increases in annual ETo ranging from 4.67% to 26.76%, contingent upon the specific geographic region. In their study, [86] documented an upward trajectory in ETo within the framework of RCP4.5 and RCP8.5 scenarios over three distinct temporal phases (2021–2040, 2041–2060, and 2061–2080). The documented elevation in ETo, ranging from 4.9% to 10%, was accompanied by corresponding findings of reduced annual precipitation within both the RCP4.5 and RCP8.5 trajectories. These observed precipitation decreases, reaching magnitudes of up to 17.5%, provide a comprehensive perspective on the intertwined dynamics of ETo and rainfall alterations in the context of future climate shifts. A distinct pattern was highlighted where the most significant rise in reference crop evapotranspiration occurs in July across all three scenarios, representing approximately 22% of the total annual increase [81]. Notably, extensive analysis demonstrates that a substantial majority, around 85%, of this overall increase transpires within a concentrated five-month period spanning from May to September. In contrast, the remaining seven months collectively contribute a mere 15% to the total annual increment in reference crop evapotranspiration. This trend underscores a pivotal observation: reference crop evapotranspiration remains relatively constant during colder months in various scenarios, while the substantial annual elevation primarily stems from a notable surge during warmer months.
The CROPWAT model was simulated for each year within the periods 1971–2000, 2025–2054, and 2069–2098 (under both RCP4.5 and RCP8.5 scenario conditions), and the irrigation water requirement values for maize cultivation were obtained as shown in Figure 4. The 30-year average of the RF period was determined to be 459.2 mm. In the RCP4.5 scenario, the average irrigation water requirement for the P1 period was calculated as 546.5 mm, and for the P2 period, it was 558.8 mm (Figure 4a). In the RCP8.5 scenario, the average irrigation water requirement values for the P1 and P2 periods were determined as 558.4 mm and 618.9 mm, respectively (Figure 4b). For both scenario conditions, an increase in the average irrigation water requirement was observed from the RF period to the P2 period. In the study conducted by Abdoulaye et al. [60], the change in the net irrigation water demand of maize was calculated, with CROPWAT, to be 6.88% and 5.93% according to the GFDL (RCP4.5 and 8.5) global climate model. The values varied between models: 14.81% and 16.65 in the MIROC 5 model, −41.99% and 8.55% in the NCAR model, 9.88% and 13.13% in the ECHAM model, and 11.07% and 8.33% in the CSIRO model for RCP4.5 and 8.5 emission scenarios.
Agricultural fields employing various irrigation systems may exhibit distinct irrigation demands. However, the adoption of subsurface drip irrigation systems with enhanced efficiency has the potential to facilitate effective irrigation practices for maize cultivation, not only within the study region but also in analogous climatic and management scenarios [87,88,89,90]. Across the Cukurova Region, the net irrigation water requirement displayed a range of 365 to 876 mm [91,92]. Notably, an enduring net irrigation demand range between 0 and 823 mm was reported for furrow irrigated maize in Adana [70]. It was stated that judicious administration of subsurface drip irrigation systems culminated in an approximate 25% reduction in the net irrigation needs of maize while upholding optimal yields [93]. A range of 430.0 to 497.4 mm is reported for the irrigation water requirement of maize plants in China [94]. In the context of a temperate climatic zone, a seasonal IWR range of 389 to 486 mm for maize is indicated [95]. Under Mediterranean climate conditions, variable net irrigation requirements for maize, spanning from 334 mm to 434 mm, have been reported [96]. Under the RCP4.5 scenario, the irrigation water requirement (IWR) for maize cultivation shows a 19.0% increase in the P1 period compared to the RF period, while this rate reaches 21.7% in the P2 period. In the context of RCP8.5 scenario conditions, the increase in IWR is 21.6% for the P1 period and 34.7% for the P2 period compared to the RF period. When considering the results of the irrigation water requirement, it is generally observed that the highest expected value for the irrigation water requirement in the future is projected to be 709.1 mm in the year 2092 under RCP8.5 scenario conditions. A study conducted on the influence of climate change on wheat water demand, revealed an envisaged increase in the IWR of wheat within the Mediterranean environment [97]. As articulated in a study, diverse irrigation quantities have been proposed as potential adaptive strategies to alleviate the anticipated yield declines [98]. Notably, it is underscored that the augmentation of water supply through irrigation is more pronounced under the RCP8.5 scenario compared to the RCP4.5, despite the concurrent lower water use efficiency. Similarly, distinct global trends within the IWR of maize crop under RCP4.5 have been reported, showcasing elevations ranging from 0.74% to 20.92% [60]. Furthermore, in the RCP8.5 scenario, projections indicate increases varying between 4.06% and exceeding 68%. This pattern of increasing irrigation water demand across agricultural production zones is consistent with previous studies and underscores the broader implications of climate change on water resource management in agricultural systems. As temperatures rise according to the predicted RCP scenarios, the amplified evapotranspiration rates and altered precipitation patterns can substantially influence water availability for crop irrigation.
The results of crop evapotranspiration (ETc) values from simulations for the reference period and both scenarios are presented in Figure 5. Under the RCP4.5 conditions, the simulations yielded an average of 672.6 mm for the P1 period and 687.4 mm for the P2 period. These values are, respectively, 9.2% and 11.7% higher than the RF period average of 615.5 mm (Figure 5a). In the RCP8.5 scenario, the values for the P1 and P2 periods reach 680.3 mm and 738.9 mm, indicating an increase of 20.0% (see Figure 5b). Upon considering all the data, the range of variation in ETc values for the maize crop during the study periods was found to be between 578 mm and 817.6 mm. The reported ranges of maize plant crop evapotranspiration (ETc) are as follows: 453 mm [99] and a range from 353 mm to 586 mm [100]. The discerned trends in ETc variations under distinct climate scenarios elucidate the intricate relationship between climate dynamics and crop water demand. The heightened water demands observed in the simulations, particularly under the RCP8.5 scenario, call for comprehensive strategies to optimize water allocation in agricultural systems. Understanding the nuances of these changes allows for the formulation of targeted policies and practices that can bolster agricultural resilience in the face of evolving climatic conditions. The evolving patterns of ETc under the RCP4.5 scenario across distinct temporal phases (2021–2040, 2041–2060, and 2061–2080), indicating values of 481.32 mm, 484.94 mm, and 489.12 mm, respectively, have been reported. Conversely, within the framework of RCP8.5, the minimal ETc value manifested during the 2021–2040 timeframe, while the subsequent periods witnessed a progression in ETc, which reached its peak during 2061–2080 [101]. However, as another perspective, it was stated that models present an intriguing contrast, suggesting that rising temperatures could potentially lead to a reduction in crop evapotranspiration over the course of a year [102]. This contrasting viewpoint can be attributed to the conceivable consequence of warming temperatures on the duration of the crop’s growth cycle, a notion previously highlighted [103]. This divergence from the conventional understanding introduces the intriguing premise that elevated temperatures might, paradoxically, contribute to a curtailment in the growth period, potentially resulting in diminished water requirements. While distinct from the prevailing consensus, this perspective invites a nuanced examination of the multifaceted interactions between temperature shifts, phenological changes, and overall crop water demand.

4. Conclusions

Maize holds a pivotal role within industrial agriculture due to its expansive cultivation potential. Therefore, it becomes imperative to meticulously examine how climate change influences maize and devise strategies for its adaptation. This study delves into the IWR and ETc values of maize, comparing the periods 1971–2000 (RF), 2025–2054 (P1), and 2069–2098 (P2) under the climate scenarios of RCP4.5 and RCP8.5. The analysis of mean temperature values in the Cukurova Region reveals significant increases, particularly during summers, in both scenarios. Moreover, daily average ETo values for the RF, P1, and P2 periods, respectively, under RCP4.5 and RCP8.5 conditions demonstrate notable increases, with the highest values observed in July for P2 under RCP4.5, signifying a 13.8% rise compared to the reference period, and a more pronounced 20.3% increase for P2 in July under RCP8.5. While the 30-year average irrigation water requirement during the RF period was 459.2 mm, in the RCP4.5 scenario, it increased to 546.5 mm for P1 and 558.8 mm for P2. In the RCP8.5 scenario, the average water requirement rose to 558.4 mm for P1 and 618.9 mm for P2, indicating an overall increase in irrigation demand from the RF period to the P2 period for both scenarios. Under RCP4.5 conditions, average simulated crop evapotranspiration (ETc) was 672.6 mm for P1 and 687.4 mm for P2, representing respective increases of 9.2% and 11.7%, compared to the RF period average of 615.5 mm. Under RCP8.5 conditions, the ETc values were 680.3 mm for P1 and 738.9 mm for P2, indicating a 20.0% increase for P1 and a range of variation between 578 mm and 817.6 mm across the study periods. In the face of escalating climate change, this study underscores the necessity of understanding and addressing its impact on maize cultivation. The findings illuminate a consistent rise in temperature and irrigation demands, emphasizing the necessity of adaptive strategies to ensure sustainable agricultural practices and food security in the future.

Funding

This research received no external funding.

Data Availability Statement

The data presented in this study are available on request from the author.

Acknowledgments

The author gratefully acknowledges the Turkish State Meteorological Service for sharing meteorological data used for this study. The useful comments received from the reviewers are acknowledged.

Conflicts of Interest

Author (Burak Şen) declares no conflict of interest.

References

  1. Rocha, J.; Carvalho-Santos, C.; Diogo, P.; Beça, P.; Keizer, J.J.; Nunes, J.P. Impacts of climate change on reservoir water availability, quality and irrigation needs in a water scarce Mediterranean region (southern Portugal). Sci. Total Environ. 2020, 736, 139477. [Google Scholar] [CrossRef] [PubMed]
  2. Ali, M.G.; Ahmed, M.; Ibrahim, M.M.; El Baroudy, A.A.; Ali, E.F.; Shokr, M.S.; Kheir, A.M. Optimizing sowing window, cultivar choice, and plant density to boost maize yield under RCP8. 5 climate scenario of CMIP5. Int. J. Biometeorol. 2022, 66, 971–985. [Google Scholar] [CrossRef] [PubMed]
  3. Adhikari, U.; Nejadhashemi, A.P.; Woznicki, S.A. Climate change and eastern Africa: A review of impact on major crops. Food Energy Secur. 2015, 4, 110–132. [Google Scholar] [CrossRef]
  4. Ali, S.; Liu, Y.; Ishaq, M.; Shah, T.; Ilyas, A.; Din, I.U. Climate change and its impact on the yield of major food crops: Evidence from Pakistan. Foods 2017, 6, 39. [Google Scholar] [CrossRef] [PubMed]
  5. Zhang, Y.; Niu, H.; Yu, Q. Impacts of climate change and increasing carbon dioxide levels on yield changes of major crops in suitable planting areas in China by the 2050s. Ecol. Indic. 2021, 125, 107588. [Google Scholar] [CrossRef]
  6. Wang, F.; Xie, R.; Ming, B.; Wang, K.; Hou, P.; Chen, J.; Liu, G.; Zhang, G.; Xue, J.; Li, S. Dry matter accumulation after silking and kernel weight are the key factors for increasing maize yield and water use efficiency. Agric. Water Manag. 2021, 254, 106938. [Google Scholar] [CrossRef]
  7. FAO. Food and Agriculture Organization of the United Nations Home Page. Available online: http://www.fao.org/faostat/en/ (accessed on 15 May 2023).
  8. TURKSTAT. Turkish Statistical Institute Home Page. Available online: https://tuikweb.tuik.gov.tr/PreTablo.do?alt_id=1001 (accessed on 3 May 2023).
  9. Nelson, G.C.; Rosegrant, M.W.; Koo, J.; Robertson, R.; Sulser, T.; Zhu, T.; Ringler, C.; Msangi, S.; Palazzo, A.; Batka, M.; et al. Climate Change: Impact on Agriculture and Costs of Adaptation No 21; Food policy reports; International Food Policy Research Institute (IFPRI): Washington, DC, USA, 2009; p. 57. [Google Scholar] [CrossRef]
  10. Lobell, D.B.; Burke, M.B. On the use of statistical models to predict crop yield responses to climate change. Agric. For. Meteorol. 2010, 150, 1443–1452. [Google Scholar] [CrossRef]
  11. Praveen, B.; Sharma, P. A review of literature on climate change and its impacts on agriculture productivity. J. Public. Aff. 2019, 19, e1960. [Google Scholar] [CrossRef]
  12. Abbas, S. Climate change and major crop production: Evidence from Pakistan. Environ. Sci. Pollut. Res. 2022, 29, 5406–5414. [Google Scholar] [CrossRef]
  13. Henao, J.; Baanante, C.A. Estimating the Rates of Nutrient Depletion in Soils of Agricultural Lands of Africa; IFDC Technical Bulletin T48; International Fertilizer Development Center: Muscle Shoals, AL, USA, 1999; p. 76. [Google Scholar]
  14. UN. World Population Prospects 2019: Highlights (ST/ESA/SER.A/423); United Nations, Department of Economic and Social Affairs, Population Division: New York, NY, USA, 2019; p. 46. Available online: https://population.un.org/wpp/publications/files/wpp2019_highlights.pdf (accessed on 15 March 2023).
  15. Frederick, K.D.; Major, D.C. Climate change and water resources. Clim. Chang. 1997, 37, 7–23. [Google Scholar] [CrossRef]
  16. Fischer, G.; Tubiello, F.N.; Van Velthuizen, H.; Wiberg, D.A. Climate change impacts on irrigation water requirements: Effects of mitigation, 1990–2080. Technol. Forecast. Soc. Chang. 2007, 74, 1083–1107. [Google Scholar] [CrossRef]
  17. Estrela, T.; Pérez-Martin, M.A.; Vargas, E. Impacts of climate change on water resources in Spain. Hydrol. Sci. J. 2012, 57, 1154–1167. [Google Scholar] [CrossRef]
  18. Ding, Y.; Wang, W.; Zhuang, Q.; Luo, Y. Adaptation of paddy rice in China to climate change: The effects of shifting sowing date on yield and irrigation water requirement. Agric. Water Manag. 2020, 228, 105890. [Google Scholar] [CrossRef]
  19. Konapala, G.; Mishra, A.K.; Wada, Y.; Mann, M.E. Climate change will affect global water availability through compounding changes in seasonal precipitation and evaporation. Nat. Commun. 2020, 11, 3044. [Google Scholar] [CrossRef]
  20. Rolbiecki, S.; Rolbiecki, R.; Kuśmierek-Tomaszewska, R.; Żarski, J.; Jagosz, B.; Kasperska-Wołowicz, W.; Sadan, H.; Łangowski, A. Influence of Forecast Climate Changes on Water Needs of Jerusalem Artichoke Grown in the Kuyavia Region in Poland. Energies 2023, 16, 533. [Google Scholar] [CrossRef]
  21. Jefferies, D.; Muñoz, I.; Hodges, J.; King, V.J.; Aldaya, M.M.; Ercin, A.E.; Milà i Canals, L.; Hoekstra, A.Y. Water footprint and life cycle assessment as approaches to assess potential impacts of products on water consumption. Key learning points from pilot studies on tea and margarine. J. Clean. Prod. 2012, 33, 155–166. [Google Scholar] [CrossRef]
  22. Grafton, R.Q.; Williams, J.; Perry, C.J.; Molle, F.; Ringler, C.; Steduto, P.; Udall, B.; Wheeler, S.A.; Wang, Y.; Garrick, D.; et al. The paradox of irrigation efficiency. Science 2018, 361, 748–750. [Google Scholar] [CrossRef]
  23. Costa, J.M.; Ortuño, M.F.; Chaves, M.M. Deficit irrigation as a strategy to save water: Physiology and potential application to horticulture. J. Integr. Plant Biol. 2007, 49, 1421–1434. [Google Scholar] [CrossRef]
  24. Yosef, B.A.; Asmamaw, D.K. Rainwater harvesting: An option for dry land agriculture in arid and semi-arid Ethiopia. Int. J. Water Resour. Environ. Eng. 2015, 7, 17–28. [Google Scholar] [CrossRef]
  25. Suna, T.; Kumari, A.; Paramaguru, P.K.; Kushwaha, N.L. Enhancing Agricultural Water Productivity Using Deficit Irrigation Practices in Water-Scarce Regions. In Enhancing Resilience of Dryland Agriculture Under Changing Climate: Interdisciplinary and Convergence Approaches; Springer Nature: Singapore, 2023; pp. 177–206. [Google Scholar] [CrossRef]
  26. Smith, M. The application of climatic data for planning and management of sustainable rainfed and irrigated crop production. Agric. For. Meteorol. 2000, 103, 99–108. [Google Scholar] [CrossRef]
  27. Yetik, A.K.; Candoğan, B.N. Chlorophyll Response to Water Stress and the Potential of Using Crop Water Stress Index in Sugar Beet Farming. Sugar Tech. 2023, 25, 57–68. [Google Scholar] [CrossRef] [PubMed]
  28. Huang, H.; Han, D.; Chen, N.; Huang, D.; Zhang, Z.; Zhang, K. Water consumption pattern of capsicum annuum under regulated deficit irrigation in desert oasis. J. Nat. Resour. 2012, 27, 747–756. [Google Scholar] [CrossRef]
  29. Wanniarachchi, S.; Sarukkalige, R. A Review on Evapotranspiration Estimation in Agricultural Water Management: Past, Present, and Future. Hydrology 2022, 9, 123. [Google Scholar] [CrossRef]
  30. Allen, R.G.; Pereira, L.S.; Raes, D.; Smith, M. Crop Evapotranspiration-Guidelines for computing crop water requirements—FAO Irrigation and drainage paper 56. FAO 1998, 300, D05109. [Google Scholar]
  31. Droogers, P.; Allen, R.G. Estimating reference evapotranspiration under inaccurate data conditions. Irrig. Drain. Syst. 2002, 16, 33–45. [Google Scholar] [CrossRef]
  32. Walter, I.A.; Allen, R.G.; Elliott, R.; Mecham, B.; Jensen, M.E.; Itenfisu, D.; Howell, T.A.; Snyder, R.; Brown, P.; Echings, S.; et al. ASCE Standardized Reference Evapotranspiration Equation. In Proceedings of the National Irrigation Symposium, Phoenix, AZ, USA, 14–16 November 2000; Evans, R.G., Benham, B.L., Trooien, T.P., Eds.; ASAE: Washington, DC, USA, 2000; pp. 209–215. [Google Scholar] [CrossRef]
  33. Howell, T.A.; Evett, S.R. The Penman-Monteith Method; USDA-Agricultural Research Service, Conservation & Production Research Laboratory: Washington, DC, USA, 2004; Volume 14. [Google Scholar]
  34. Allen, R.G.; Pruitt, O.W.; Wright, L.J.; Howell, A.T.; Ventura, F.; Snyder, R.; Itenfisu, D.; Steduto, P.; Berengena, J.; Yrisarry, B.J.; et al. A recommendation on standardized surfaceresistance for hourly calculation of reference ETo by FAO56 Penman-Monteith method. Agric. Water Manag. 2006, 81, 1–22. [Google Scholar] [CrossRef]
  35. Kimball, B.A.; Thorp, K.R.; Boote, K.J.; Stockle, C.; Suyker, A.E.; Evett, S.R.; Braue, D.K.; Coyle, G.G.; Copeland, K.S.; Marek, G.W.; et al. Simulation of evapotranspiration and yield of maize: An inter-comparison among 41 maize models. Agric. For. Meteorol. 2023, 333, 109396. [Google Scholar] [CrossRef]
  36. Madugundu, R.; Al-Gaadi, K.A.; Tola, E.; El-Hendawy, S.; Marey, S.A. Mapping of Evapotranspiration and Determination of the Water Footprint of a Potato Crop Grown in Hyper-Arid Regions in Saudi Arabia. Sustainability 2023, 15, 12201. [Google Scholar] [CrossRef]
  37. El-Rawy, M.; Fathi, H.; Zijl, W.; Alshehri, F.; Almadani, S.; Zaidi, F.K.; Aldawsri, M.; Gabr, M.E. Potential Effects of Climate Change on Agricultural Water Resources in Riyadh Region, Saudi Arabia. Sustainability 2023, 15, 9513. [Google Scholar] [CrossRef]
  38. Makar, R.S.; Shahin, S.A.; El-Nazer, M.; Wheida, A.; Abd El-Hady, M. Evaluating the Impacts of Climate Change on Irrigation Water Requirements. Sustainability 2022, 14, 14833. [Google Scholar] [CrossRef]
  39. Supriyasilp, T.; Suwanlertcharoen, T.; Pongput, N.; Pongput, K. Root Zone Soil Moisture Assessment at the Farm Scale Using Remote Sensing and Water Balance Models. Sustainability 2022, 14, 1123. [Google Scholar] [CrossRef]
  40. Nkomozepi, T.; Chung, S. Assessing the trends and uncertainty of maize net irrigation water requirement estimated from climate change projections for Zimbabwe. Agric. Water Manag. 2012, 111, 60–67. [Google Scholar] [CrossRef]
  41. Rajaona, A.M.; Sutterer, N.; Asch, F. Potential of Waste Water Use for Jatropha Cultivation in Arid Environments. Agriculture 2012, 2, 376–392. [Google Scholar] [CrossRef]
  42. Hussain, S.; Mubeen, M.; Nasim, W.; Fahad, S.; Ali, M.; Ehsan, M.A.; Raza, A. Investigation of Irrigation Water Requirement and Evapotranspiration for Water Resource Management in Southern Punjab, Pakistan. Sustainability 2023, 15, 1768. [Google Scholar] [CrossRef]
  43. Ucar, Y.; Kocięcka, J.; Liberacki, D.; Rolbiecki, R. Analysis of Crop Water Requirements for Apple Using Dependable Rainfall. Atmosphere 2023, 14, 99. [Google Scholar] [CrossRef]
  44. Goodarzi, M.R.; Mohtar, R.H.; Piryaei, R.; Fatehifar, A.; Niazkar, M. Urban WEF Nexus: An Approach for the Use of Internal Resources under Climate Change. Hydrology 2022, 9, 176. [Google Scholar] [CrossRef]
  45. Li, Z.; Wu, H.; Deng, X. Spatial Pattern of Water Footprints for Crop Production in Northeast China. Sustainability 2022, 14, 13649. [Google Scholar] [CrossRef]
  46. Saeed, F.H.; Al-Khafaji, M.S.; Al-Faraj, F.A.M. Sensitivity of Irrigation Water Requirement to Climate Change in Arid and Semi-Arid Regions towards Sustainable Management of Water Resources. Sustainability 2021, 13, 13608. [Google Scholar] [CrossRef]
  47. Ewaid, S.H.; Abed, S.A.; Al-Ansari, N. Crop Water Requirements and Irrigation Schedules for Some Major Crops in Southern Iraq. Water 2019, 11, 756. [Google Scholar] [CrossRef]
  48. Jiao, F.; Nie, L.; Shao, J.; Wang, Y.; Du, Y.; Guo, X.; Feng, H.; Liu, Z. Water Footprint Analysis of Sheep and Goat from Various Production Systems in Northern China. Sustainability 2023, 15, 10504. [Google Scholar] [CrossRef]
  49. Mohy, S.; El Aasar, K.; Sakr, Y. Decomposition Analysis of Virtual Water Outflows for Major Egyptian Exporting Crops to the European Union. Sustainability 2023, 15, 4943. [Google Scholar] [CrossRef]
  50. Al-Gaadi, K.A.; Madugundu, R.; Tola, E.; El-Hendawy, S.; Marey, S. Satellite-Based Determination of the Water Footprint of Carrots and Onions Grown in the Arid Climate of Saudi Arabia. Remote Sens. 2022, 14, 5962. [Google Scholar] [CrossRef]
  51. Fu, M.; Guo, B.; Wang, W.; Wang, J.; Zhao, L.; Wang, J. Comprehensive Assessment of Water Footprints and Water Scarcity Pressure for Main Crops in Shandong Province, China. Sustainability 2019, 11, 1856. [Google Scholar] [CrossRef]
  52. Dechmi, F.; Playan, E.; Faci, J.M.; Tejero, M.; Bercero, A. Analysis of an irrigation district in northeastern Spain: II. Irrigation evaluation, simulation and scheduling. Agric. Water Manag. 2023, 61, 93–109. [Google Scholar] [CrossRef]
  53. Surendran, U.; Sushanth, C.M.; Joseph, E.J.; Al-Ansari, N.; Yaseen, Z.M. FAO CROPWAT Model-Based Irrigation Requirements for Coconut to Improve Crop and Water Productivity in Kerala, India. Sustainability 2019, 11, 5132. [Google Scholar] [CrossRef]
  54. Awad, A.; Luo, W.; Al-Ansari, N.; Elbeltagi, A.; El-Rawy, M.; Farres, H.N.; Gabr, M.E.-S. Farmers’ Awareness in the Context of Climate Change: An Underutilized Way for Ensuring Sustainable Farmland Adaptation and Surface Water Quality. Sustainability 2021, 13, 11802. [Google Scholar] [CrossRef]
  55. Khan, Z.A.; Imran, M.; Umer, J.; Ahmed, S.; Diemuodeke, O.E.; Abdelatif, A.O. Assessing Crop Water Requirements and a Case for Renewable-Energy-Powered Pumping System for Wheat, Cotton, and Sorghum Crops in Sudan. Energies 2021, 14, 8133. [Google Scholar] [CrossRef]
  56. Li, N.; Nie, T.; Tang, Y.; Lu, D.; Wang, T.; Zhang, Z.; Chen, P.; Li, T.; Meng, L.; Jiao, Y.; et al. Responses of Soybean Water Supply and Requirement to Future Climate Conditions in Heilongjiang Province. Agriculture 2022, 12, 1035. [Google Scholar] [CrossRef]
  57. El-Shafei, A.A.; Mattar, M.A. Irrigation Scheduling and Production of Wheat with Different Water Quantities in Surface and Drip Irrigation: Field Experiments and Modelling Using CROPWAT and SALTMED. Agronomy 2022, 12, 1488. [Google Scholar] [CrossRef]
  58. Li, Q.; Huang, W.; Wang, J.; Zhang, Z.; Li, Y.; Han, Y.; Feng, L.; Li, X.; Yang, B.; Wang, G.; et al. Quantitative Evaluation of Variation and Driving Factors of the Regional Water Footprint for Cotton Production in China. Sustain. Prod. Consum. 2023, 35, 684–696. [Google Scholar] [CrossRef]
  59. Nie, T.; Gong, Z.; Zhang, Z.; Wang, T.; Sun, N.; Tang, Y.; Chen, P.; Li, T.; Yin, S.; Zhang, M.; et al. Irrigation Scheduling for Maize under Different Hydrological Years in Heilongjiang Province, China. Plants 2023, 12, 1676. [Google Scholar] [CrossRef]
  60. Oumarou Abdoulaye, A.; Lu, H.; Zhu, Y.; Alhaj Hamoud, Y.; Sheteiwy, M. The Global Trend of the Net. Irrigation Water Requirement of Maize from 1960 to 2050. Climate 2019, 7, 124. [Google Scholar] [CrossRef]
  61. Zhao, X.; Shi, J.; Liu, M.; Zafar, S.U.; Liu, Q.; Mian, I.A.; Khan, B.; Khan, S.; Zhuang, Y.; Dong, W.; et al. Spatial Characteristics and Driving Forces of the Water Footprint of Spring Maize Production in Northern China. Agriculture 2023, 13, 1808. [Google Scholar] [CrossRef]
  62. Welde, K.; Gebremariam, H.L. Effect of different furrow and plant spacing on yield and water use efficiency of maize. Agric. Water Manag. 2016, 177, 215–220. [Google Scholar] [CrossRef]
  63. Mishra, Y.; Babel, M.S.; Nakamura, T.; Mishra, B. Impacts of Climate Change on Irrigation Water Management in the Babai River Basin, Nepal. Hydrology 2021, 8, 85. [Google Scholar] [CrossRef]
  64. Dawit, M.; Olika, B.D.; Muluneh, F.B.; Leta, O.T.; Dinka, M.O. Assessment of Surface Irrigation Potential of the Dhidhessa River Basin, Ethiopia. Hydrology 2020, 7, 68. [Google Scholar] [CrossRef]
  65. Kanzari, S.; Daghari, I.; Šimůnek, J.; Younes, A.; Ilahy, R.; Ben Mariem, S.; Rezig, M.; Ben Nouna, B.; Bahrouni, H.; Ben Abdallah, M.A. Simulation of Water and Salt Dynamics in the Soil Profile in the Semi-Arid Region of Tunisia—Evaluation of the Irrigation Method for a Tomato Crop. Water 2020, 12, 1594. [Google Scholar] [CrossRef]
  66. Jayanti, M.; Sabar, A.; Dwi Ariesyady, H.; Marselina, M.; Qadafi, M. A comparison of three water discharge forecasting models for monsoon climate region: A case study in cimanuk-jatigede watershed Indonesia. Water Cycle 2023, 4, 17–25. [Google Scholar] [CrossRef]
  67. Demircan, M.; Demir, Ö.; Atay, H.; Eskioğlu, O.; Tüvan, A.; Akçakaya, A. Climate change projections for Turkey with new scenarios. In Proceedings of the Climate Change and Climate Dynamics Conference-2014–CCCD2014, Istanbul, Turkey, 8–10 September 2014; pp. 8–10. [Google Scholar]
  68. Akçakaya, A.; Sümer, U.M.; Demircan, M.; Demir, Ö.; Atay, H.; Eskioğlu, O.; Gürkan, H.; Yazıcı, B.; Kocatürk, A.; Şensoy, S.; et al. Yeni Senaryolarla Türkiye İklim Projeksiyonları ve İklim Değişikliği-TR2015-CC; Meteoroloji Genel Müdürlüğü yayını: Ankara, Türkiye, 2015; p. s149. [Google Scholar]
  69. Aibaidula, D.; Ates, N.; Dadaser-Celik, F. Modelling climate change impacts at a drinking water reservoir in Turkey and implications for reservoir management in semi-arid regions. Environ. Sci. Pollut. Res. 2023, 30, 13582–13604. [Google Scholar] [CrossRef]
  70. Gençoğlan, C.; Yazar, A. The effects of deficit irrigations on corn yield and water use efficiency. Turk. J. Agric. For. 1999, 23, 233–242. [Google Scholar]
  71. TAGEM. Türkiye’de sulanan bitkilerin bitki su tüketimi rehberi; T.C. Gıda, Tarım ve Hayvancılık Bakanlığı Tarımsal Araştırmalar ve Politikalar Genel Müdürlüğü (TAGEM) Yayınları: Ankara, Türkiye, 2017; p. s590. Available online: https://www.tarimorman.gov.tr/TAGEM/Belgeler/yayin/Tu%CC%88rkiyede%20Sulanan%20Bitkilerin%20Bitki%20Su%20Tu%CC%88ketimleri.pdf (accessed on 15 March 2023).
  72. Çetin, Ö.; Üzen, N. Yüzey ve yüzeyaltı damla sulamanın toprakta nem değişimi ve toprak su tansiyonuna etkisi. Harran Tarım Ve Gıda Bilim. Derg. 2018, 22, 461–470. [Google Scholar]
  73. Brouwer, C.; Heibloem, M. Irrigation Water Management: Irrigation Water Needs; Training manual no:3; Food and Agriculture Organization of the United Nations: Rome, Italy, 1986; Volume 3, p. 102. [Google Scholar]
  74. Gabr, M.E. Modelling net irrigation water requirements using FAO-CROPWAT 8.0 and CLIMWAT 2.0: A case study of Tina Plain and East South ElKantara regions, North Sinai, Egypt. Arch. Agron. Soil Sci. 2021, 68, 1322–1337. [Google Scholar] [CrossRef]
  75. Cavero, J.; Farre, I.; Debaeke, P.; Faci, J.M. Simulation of Maize Yield under Water Stress with the EPICphase and CROPWAT Models. Agron. J. 2000, 92, 679–690. [Google Scholar] [CrossRef]
  76. Vote, C.; Oeurng, C.; Sok, T.; Phongpacith, C.; Inthavong, T.; Seng, V.; Eberbach, P.; Hornbuckle, J.A. Comparison of Three Empirical Models for Assessing Cropping Options in a Data-Sparse Environment, with Reference to Laos and Cambodia; ACIAR Technical Reports No. 87; Australian Centre for International Agricultural Research: Canberra, Australia, 2015; p. 30. [Google Scholar]
  77. Raeth, P.G. Moving beyond manual software-supported precision irrigation to human-supervised adaptive automation. Afr. J. Agric. Res. 2020, 16, 1548–1553. [Google Scholar]
  78. Raeth, P.G. Transition of soil-moisture estimation theory to practical application. J. Eng. Comput. Innov. 2021, 6, 1–10. [Google Scholar] [CrossRef]
  79. Ramezani, H.; Nazari, B.; Tavakoli, A.R.; Parsinejad, M. Evaluation of CROPWAT model in deficit irrigation management of wheat and barley in Karaj. Water Soil 2009, 23, 119–129. [Google Scholar] [CrossRef]
  80. Intergovernmental Panel on Climate Change (IPCC). Summary for Policymakers. In Climate Change 2022—Impacts, Adaptation and Vulnerability: Working Group II Contribution to the Sixth Assessment Report of the Intergovernmental Panel on Climate Change; Cambridge University Press: Cambridge, UK, 2023; pp. 3–34. [Google Scholar] [CrossRef]
  81. Todaro, V.; D’Oria, M.; Secci, D.; Zanini, A.; Tanda, M.G. Climate Change over the Mediterranean Region: Local Temperature and Precipitation Variations at Five Pilot Sites. Water 2022, 14, 2499. [Google Scholar] [CrossRef]
  82. Seker, M.; Gumus, V. Projection of temperature and precipitation in the Mediterranean region through multi-model ensemble from CMIP6. Atmos. Res. 2022, 280, 106440. [Google Scholar] [CrossRef]
  83. Alkan, Ç.; Konukcu, F. Determination of the effect of climate change on wheat yield in the Porsuk creek watershed. ISPEC J. Agric. Sci. 2022, 6, 318–330. [Google Scholar] [CrossRef]
  84. Soares, D.; Paço, T.A.; Rolim, J. Assessing climate change impacts on irrigation water requirements under Mediterranean conditions—A review of the methodological approaches focusing on maize crop. Agronomy 2023, 13, 117. [Google Scholar] [CrossRef]
  85. Abdrabbo, M.A.; Farag, A.A.; El-Desokey, W.M.S. Implementing of RCPs scenarios for the prediction of evapotranspiration in Egypt. Int. J. Plant Soil. Sci. 2015, 6, 50–63. [Google Scholar] [CrossRef] [PubMed]
  86. Allani, M.; Mezzi, R.; Zouabi, A.; Béji, R.; Joumade-Mansouri, F.; Hamza, M.E.; Sahli, A. Impact of future climate change on water supply and irrigation demand in a small Mediterranean catchment. Case study: Nebhana dam system, Tunisia. J. Water Clim. Chang. 2020, 11, 1724–1747. [Google Scholar] [CrossRef]
  87. Talebmorad, H.; Abedi-Koupai, J.; Eslamian, S.; Mousavi, S.F.; Akhavan, S.; Ostad-Ali-Askari, K.; Singh, V.P. Evaluation of the impact of climate change on reference crop evapotranspiration in Hamedan-Bahar plain. Int. J. Hydrol. Sci. Technol. 2021, 11, 333–347. [Google Scholar] [CrossRef]
  88. Colaizzi, P.D.; Lamm, F.R.; Howell, T.A.; Evett, S.R. Crop production comparison under various irrigation systems. In Proceedings of the Central Plains Irrigation Conference, Colby, KS, USA, 21–22 February 2006; CPIA: Colby, KS, USA, 2006; pp. 189–207. [Google Scholar]
  89. Darouich, H.; Pedras, C.M.G.; Gonçalves, J.M.; Pereira, L.S. Drip vs. surface irrigation: A comparison focusing water saving and economic returns using multicriteria analysis applied to cotton. Biosyst. Eng. 2014, 122, 74–90. [Google Scholar] [CrossRef]
  90. Irmak, S.; Djaman, K.; Rudnick, D. Effect of full and limited irrigation amount and frequency on subsurface drip-irrigated maize evapotranspiration, yield, water use efficiency and yield response factors. Irrig. Sci. 2016, 3, 271–286. [Google Scholar] [CrossRef]
  91. Oktem, A.; Simsek, M.; Oktem, A.G. Deficit irrigation effects on sweet corn (Zea mays saccharata Sturt) with drip irrigation system in a semi-arid region: I. Water-yield relationship. Agric. Water Manag. 2003, 61, 63–74. [Google Scholar] [CrossRef]
  92. Bozkurt, S.; Yazar, A.; Mansuroglu, G.S. Effects of different drip irrigation levels on yield and some agronomic characteristics of raised bed planted corn. Afr. J. Agric. Res. 2011, 6, 5291–5300. [Google Scholar] [CrossRef]
  93. Lamm, F.R.; Trooien, T.P. Subsurface drip irrigation for corn production: A review of 10 years of research in Kansas. Irrig. Sci. 2003, 22, 195–200. [Google Scholar] [CrossRef]
  94. Zhang, Y.; Wang, J.; Gong, S.; Xu, D.; Sui, J.; Wu, Z.; Mo, Y. Effects of film mulching on evapotranspiration, yield and water use efficiency of a maize field with drip irrigation in Northeastern China. Agric. Water Manag. 2018, 205, 90–99. [Google Scholar] [CrossRef]
  95. Barbieri, P.; Echarte, L.; Della Maggiora, A.; Sadras, V.O.; Echeverria, H.; Andrade, F.H. Maize evapotranspiration and water-use efficiency in response to row spacing. Agron. J. 2012, 104, 939–944. [Google Scholar] [CrossRef]
  96. Toureiro, C.; Serralheiro, R.; Shahidian, S.; Sousa, A. Irrigation management with remote sensing: Evaluating irrigation requirement for maize under Mediterranean climate condition. Agric. Water Manag. 2017, 184, 211–220. [Google Scholar] [CrossRef]
  97. Yano, T.; Aydin, M.; Haraguchi, T. Impact of climate change on irrigation demand and crop growth in a Mediterranean environment of Turkey. Sensors 2007, 7, 2297–2315. [Google Scholar] [CrossRef]
  98. Yang, C.; Fraga, H.; Van Ieperen, W.; Santos, J.A. Assessment of irrigated maize yield response to climate change scenarios in Portugal. Agric. Water Manag. 2017, 184, 178–190. [Google Scholar] [CrossRef]
  99. Çamoğlu, G.; Genç, L.; Aşık, Ş. Tatlı mısırda (Zea mays saccharata Sturt) su stresinin fizyolojik ve morfolojik parametreler üzerine etkisi. Ege Üniversitesi Ziraat Fakültesi Derg. 2011, 48, 141–149. [Google Scholar]
  100. Istanbulluoglu, A.; Kocaman, I.; Konukcu, F. Water use–production relationship of maize under Tekirdag conditions in Turkey. Pak. J. Biol. Sci. 2002, 5, 287–291. [Google Scholar] [CrossRef]
  101. Nie, T.; Tang, Y.; Jiao, Y.; Li, N.; Wang, T.; Du, C.; Zhang, Z.; Chen, P.; Li, T.; Sun, Z.; et al. Effects of irrigation schedules on maize yield and water use efficiency under future climate scenarios in Heilongjiang Province based on the AquaCrop model. Agronomy 2022, 12, 810. [Google Scholar] [CrossRef]
  102. Xiang, K.; Li, Y.; Horton, R.; Feng, H. Similarity and difference of potential evapotranspiration and reference crop evapotranspiration—A review. Agric. Water Manag. 2020, 232, 106043. [Google Scholar] [CrossRef]
  103. Mo, X.; Liu, S.; Lin, Z.; Guo, R. Regional crop yield, water consumption and water use efficiency and their responses to climate change in the North China Plain. Agric. Ecosyst. Environ. 2009, 134, 67–78. [Google Scholar] [CrossRef]
Figure 1. Mean temperature, precipitation, mean humidity, mean wind speed values for working periods in the Adana province under the RCP4.5 and RCP8.5 scenarios.
Water 15 04215 g001
Figure 2. Daily average ETo values for the months of the RF, P1, and P2 periods under RCP4.5 (a) and RCP8.5 (b) scenario conditions.
Water 15 04215 g002
Figure 3. Variation in calculated ETo averages during the growing period for RF, P1 and P2 periods under RCP4.5 (a) and RCP8.5 (b) scenario conditions.
Water 15 04215 g003
Figure 4. Simulated irrigation water requirement (IWR) values for maize cultivation for the RF, P1 and P2 periods under RCP4.5 (a) and RCP8.5 (b) scenario conditions.
Water 15 04215 g004
Figure 5. Crop evapotranspiration (ETc) values from simulations for the RF, P1 and P2 periods under RCP4.5 (a) and RCP8.5 (b) scenario conditions.
Water 15 04215 g005
Table 1. Climate data with monthly averages over an extended period (1929–2022).
MonthsMaximum Temperature (°C)Minimum Temperature (°C)Mean Daily Sunshine (hour)Rainfall
(mm)
1.14.85.24.5113.6
2.16.26.05.389.0
3.19.48.35.965.5
4.23.811.97.151.0
5.28.315.89.148.1
6.31.719.810.522.1
7.33.923.010.610.2
8.34.723.410.29.3
9.33.120.29.019.3
10.29.115.87.342.8
11.22.710.85.871.5
12.16.87.04.3126.4
Avg./Total25.413.97.5668.8
Table 2. The maize attributes employed in the study.
ParametersValuesReferences
Planting date (days)26/04[70]
Harvest date (days)27/08
Kc valuesinitial0.33[71]
mid-season1.14
late-season0.31
Stage (days)initial9[70]
development35
mid-season45
late season35
Rooting depth (m)initial0.30[30]
late season1.20
Critical depletion (fraction)0.30[72]
Yield response factor1.23[70]
Disclaimer/Publisher’s Note: The statements, opinions and data contained in all publications are solely those of the individual author(s) and contributor(s) and not of MDPI and/or the editor(s). MDPI and/or the editor(s) disclaim responsibility for any injury to people or property resulting from any ideas, methods, instructions or products referred to in the content.

