Article

The Effect of Soluble Sugar Degradation on the Evaporation of Compacted Clay

1
Jiangsu Key Laboratory of Coal-Based Greenhouse Gas Control and Utilization, China University of Mining and Technology, Xuzhou 221008, China
2
Carbon Neutrality Institute, China University of Mining and Technology, Xuzhou 221008, China
3
School of Resources and Earth Science, China University of Mining and Technology, Xuzhou 221116, China
4
Department of Renewable Resources, University of Alberta, 751 Gen Serv Bldg, Edmonton, AB T6G 2H1, Canada
*
Authors to whom correspondence should be addressed.
Water 2023, 15(23), 4180; https://doi.org/10.3390/w15234180
Submission received: 1 November 2023 / Revised: 28 November 2023 / Accepted: 1 December 2023 / Published: 4 December 2023
(This article belongs to the Section Soil and Water)

Abstract

:
In arid climates, evaporation and water loss in surface soil can lead to the development of shrinkage cracks in the soil. The crack network in contaminated soil sites can become a rapid pathway for the infiltration and transport of contaminations, thereby increasing the range of soil contamination. Dense contaminated clay samples were prepared by using glucose as a representative soluble sugar of domestic source contaminations. Through indoor evaporation simulation tests, the effect of soluble sugar anaerobic degradation on the water loss, deformation, and crack growth of compacted clay was analyzed, and the mechanism of this effect was revealed. The results showed that glucose increased the water-holding capacity of clay, while the anaerobic degradation of glucose decreased the water-holding capacity of clay. Although glucose anaerobic degradation reduced the overall deformation of dense clay, it promoted the development of evaporative cracks on the surface of dense clay. Soluble sugar anaerobic degradation mainly affected the evaporative cracking of clay by “forming hydrogen bonds to reduce the rate of evaporative water loss in clay” and “generating CO2 to alter the structure of the clay”.

1. Introduction

Extreme weather such as drought and high temperatures have been frequent in recent years due to global warming. The problems of soil evaporation and cracking have gradually attracted the attention of scholars [1,2,3]. The surface soil of the crust evaporates, loses water, and shrinks to form cracks under the influence of external forces such as light, wind energy, temperature difference, humidity difference, and other environmental forces. This natural phenomenon is called soil desiccation cracking [4,5]. The cracks cause great damage to the soil structure and have an important impact on the properties of soil mechanics, such as mechanical strength, deformation, and permeability [6], resulting in widespread environmental engineering problems. For example, the production of cracks weakened the strength of the soil, increased the compressibility of the soil, and caused the surface building to tilt or even crack [7,8]; in addition, cracks also destroyed the overall structure of the soil, increased soil permeability by multiple counts, and caused damage to anti-seepage structures in water conservancy projects, waste landfill projects, and nuclear waste disposal projects, in addition to inducing disasters such as dam seepage, the leakage of polluted liquids, and nuclear pollution [9]. The occurrence of cracks, particularly in contaminated soil, increased the permeability of soil [10], encouraged the movement and transformation of pollutants within soil, and resulted in the ongoing expansion of the scope of pollution [11].
The research methods for soil evaporation and cracking mainly include indoor model tests, in situ observation tests, and numerical simulation [12,13,14]. However, most scholars use indoor experiments combined with image processing software to study the morphological characteristics of soil evaporative cracking [15,16,17,18]. Through extensive experimental research, it has been found that the initial state of the soil sample, the properties of the soil sample, the size of the soil sample, the thickness of the soil layer, the soil composition, environmental temperature, relative humidity, contact conditions between the sample and container, and the number of dry–wet cycles all have important effects on the evaporation and cracking of soils [19,20,21,22,23]. Although important research results have been obtained in the field of soil evaporation and cracking, it can be seen that previous studies have mainly focused on uncontaminated soils, and there have been relatively few studies on the evaporation and cracking of contaminated clay, especially on those contaminated by organic contaminations from domestic sources. Domestic source contaminated soil mostly refers to the soil that has had the leachate or sewage of domestic waste containing (or rich in) organic matter, such as sugars, organic acids, alcohols, and esters, absorbed into the soil, causing changes in the original properties of the soil. The composition and structure of the soil are obviously changed due to the high proportion of organic components, the multi-dimensional degradation process, and rapid migration and transformation in the contaminated soil [24,25]. This not only reduces the soil’s strength but also prompts the other geotechnical properties to gradually change along with the degradation of the domestic source pollution [26,27]. The major changes in soil structure directly affect the migration of water in the near-surface soil and the development characteristics of cracks during the water loss process, which in turn affects the following infiltration and migration of pollutants in the soil. Therefore, studies on the evaporation and cracking characteristics of contaminated soil during the degradation of organic contaminations from domestic sources are of great significance for revealing the formation and evolution mechanisms of contaminated soil sites by domestic sources.
The amount of sugars in organic pollution from domestic sources is relatively high [28]. In addition, sugars are the most fundamental and active energy sources for both plants and animals, and they move and change swiftly in the soil [29]. In this study, the most representative soluble sugar, glucose, was taken as the research object during the anaerobic degradation process of domestic source contaminations, and glucose-contaminated compacted clay was prepared. Indoor evaporation simulation tests were used to compare and analyze the effect of glucose anaerobic degradation on the evaporation, deformation, and crack development characteristics of dense clay. Then, the influence mechanism of soluble sugar anaerobic degradation on the evaporation, deformation, and cracking of clay was revealed.

2. Materials and Methods

2.1. Materials

(1)
The representative soluble sugar of domestic source contaminations
The anaerobic degradation of organic contaminations from domestic sources can be divided into three stages: hydrolysis and fermentation, acetic acid production and dehydrogenation, and methane production [30]. In the hydrolysis and fermentation stage, insoluble polysaccharides are hydrolyzed into soluble disaccharides and monosaccharides. Figure 1 shows the degradation and transformation of carbohydrates in organic contaminations from domestic sources. It can be seen that glucose is one of the most dominant and representative soluble sugars. Therefore, to conduct evaporation tests of contaminated dense clay, glucose was selected as the representative soluble sugar of domestic organic contaminations.
The test used glucose analytically pure (AR) reagent, purchased from Tianjin Kermel Chemical Reagent Co., Ltd., Tianjin, China. The concentration of iron, chloride, and heavy metals in the reagent was less than 0.005%, which was negligible; the cauterized residue (as sulfate) was less than 0.05%, and the percentage of dry weight loss ranged from 7.5% to 9.1% [31].
(2)
Clay
The clay used in the test was taken from the southern suburb of Xuzhou City, China. The basic physical properties, clay mineral content, and element content of the soil were tested and analyzed via indoor geotechnical experiments, X-ray diffraction analysis, and X-ray fluorescence spectrum analysis. The test results indicate that the plasticity index of the soil was 25.04%, indicating strong viscosity. Among the clay minerals, the highest content was illite (36%), followed by an illite and montmorillonite mixed layer (27%), and the lowest was chlorite (6%). Moreover, the soil contained a certain amount of alkaline oxides (K2O, Na2O, MgO, Fe2O3, and others.) [31].

2.2. Sample Preparation

The samples were made with soil which was air-dried, crushed, and sieved with 2 mm. Referring to the previous test results of simple landfill soil, the organic matter content was about 1% [32]. Dense ring knife soil samples (61.8 mm × 20 mm) with glucose concentrations (the percentage of glucose mass to dry soil) of 0%, 0.2%, 0.4%, 0.8%, and 1.0% were prepared. Due to the typical preparation method of remolded soil samples, it can be challenging to ensure the consistent distribution of water and glucose in the soil throughout the preparation process. In order to improve the uniformity of the soil samples, at the temperature of 25 °C, the dry soil was first compacted in the ring knife sample preparation mold by using the jack and the reaction frame (according to the principle of approaching the natural density of the soil as close as possible while taking the instrument’s limitations into account, the dry density of the soil samples was controlled to be 1.584 g/cm3), and then the corresponding concentration of glucose solution was pumped and saturated (According to Geotechnical Test Method Standard GB/T50123-2019). The detailed steps are shown in Figure 2a. To ensure that the soil samples were in an anaerobic environment, the saturated soil samples were wrapped with plastic film to isolate air and stored in a thermostat at 25 °C for maintenance.

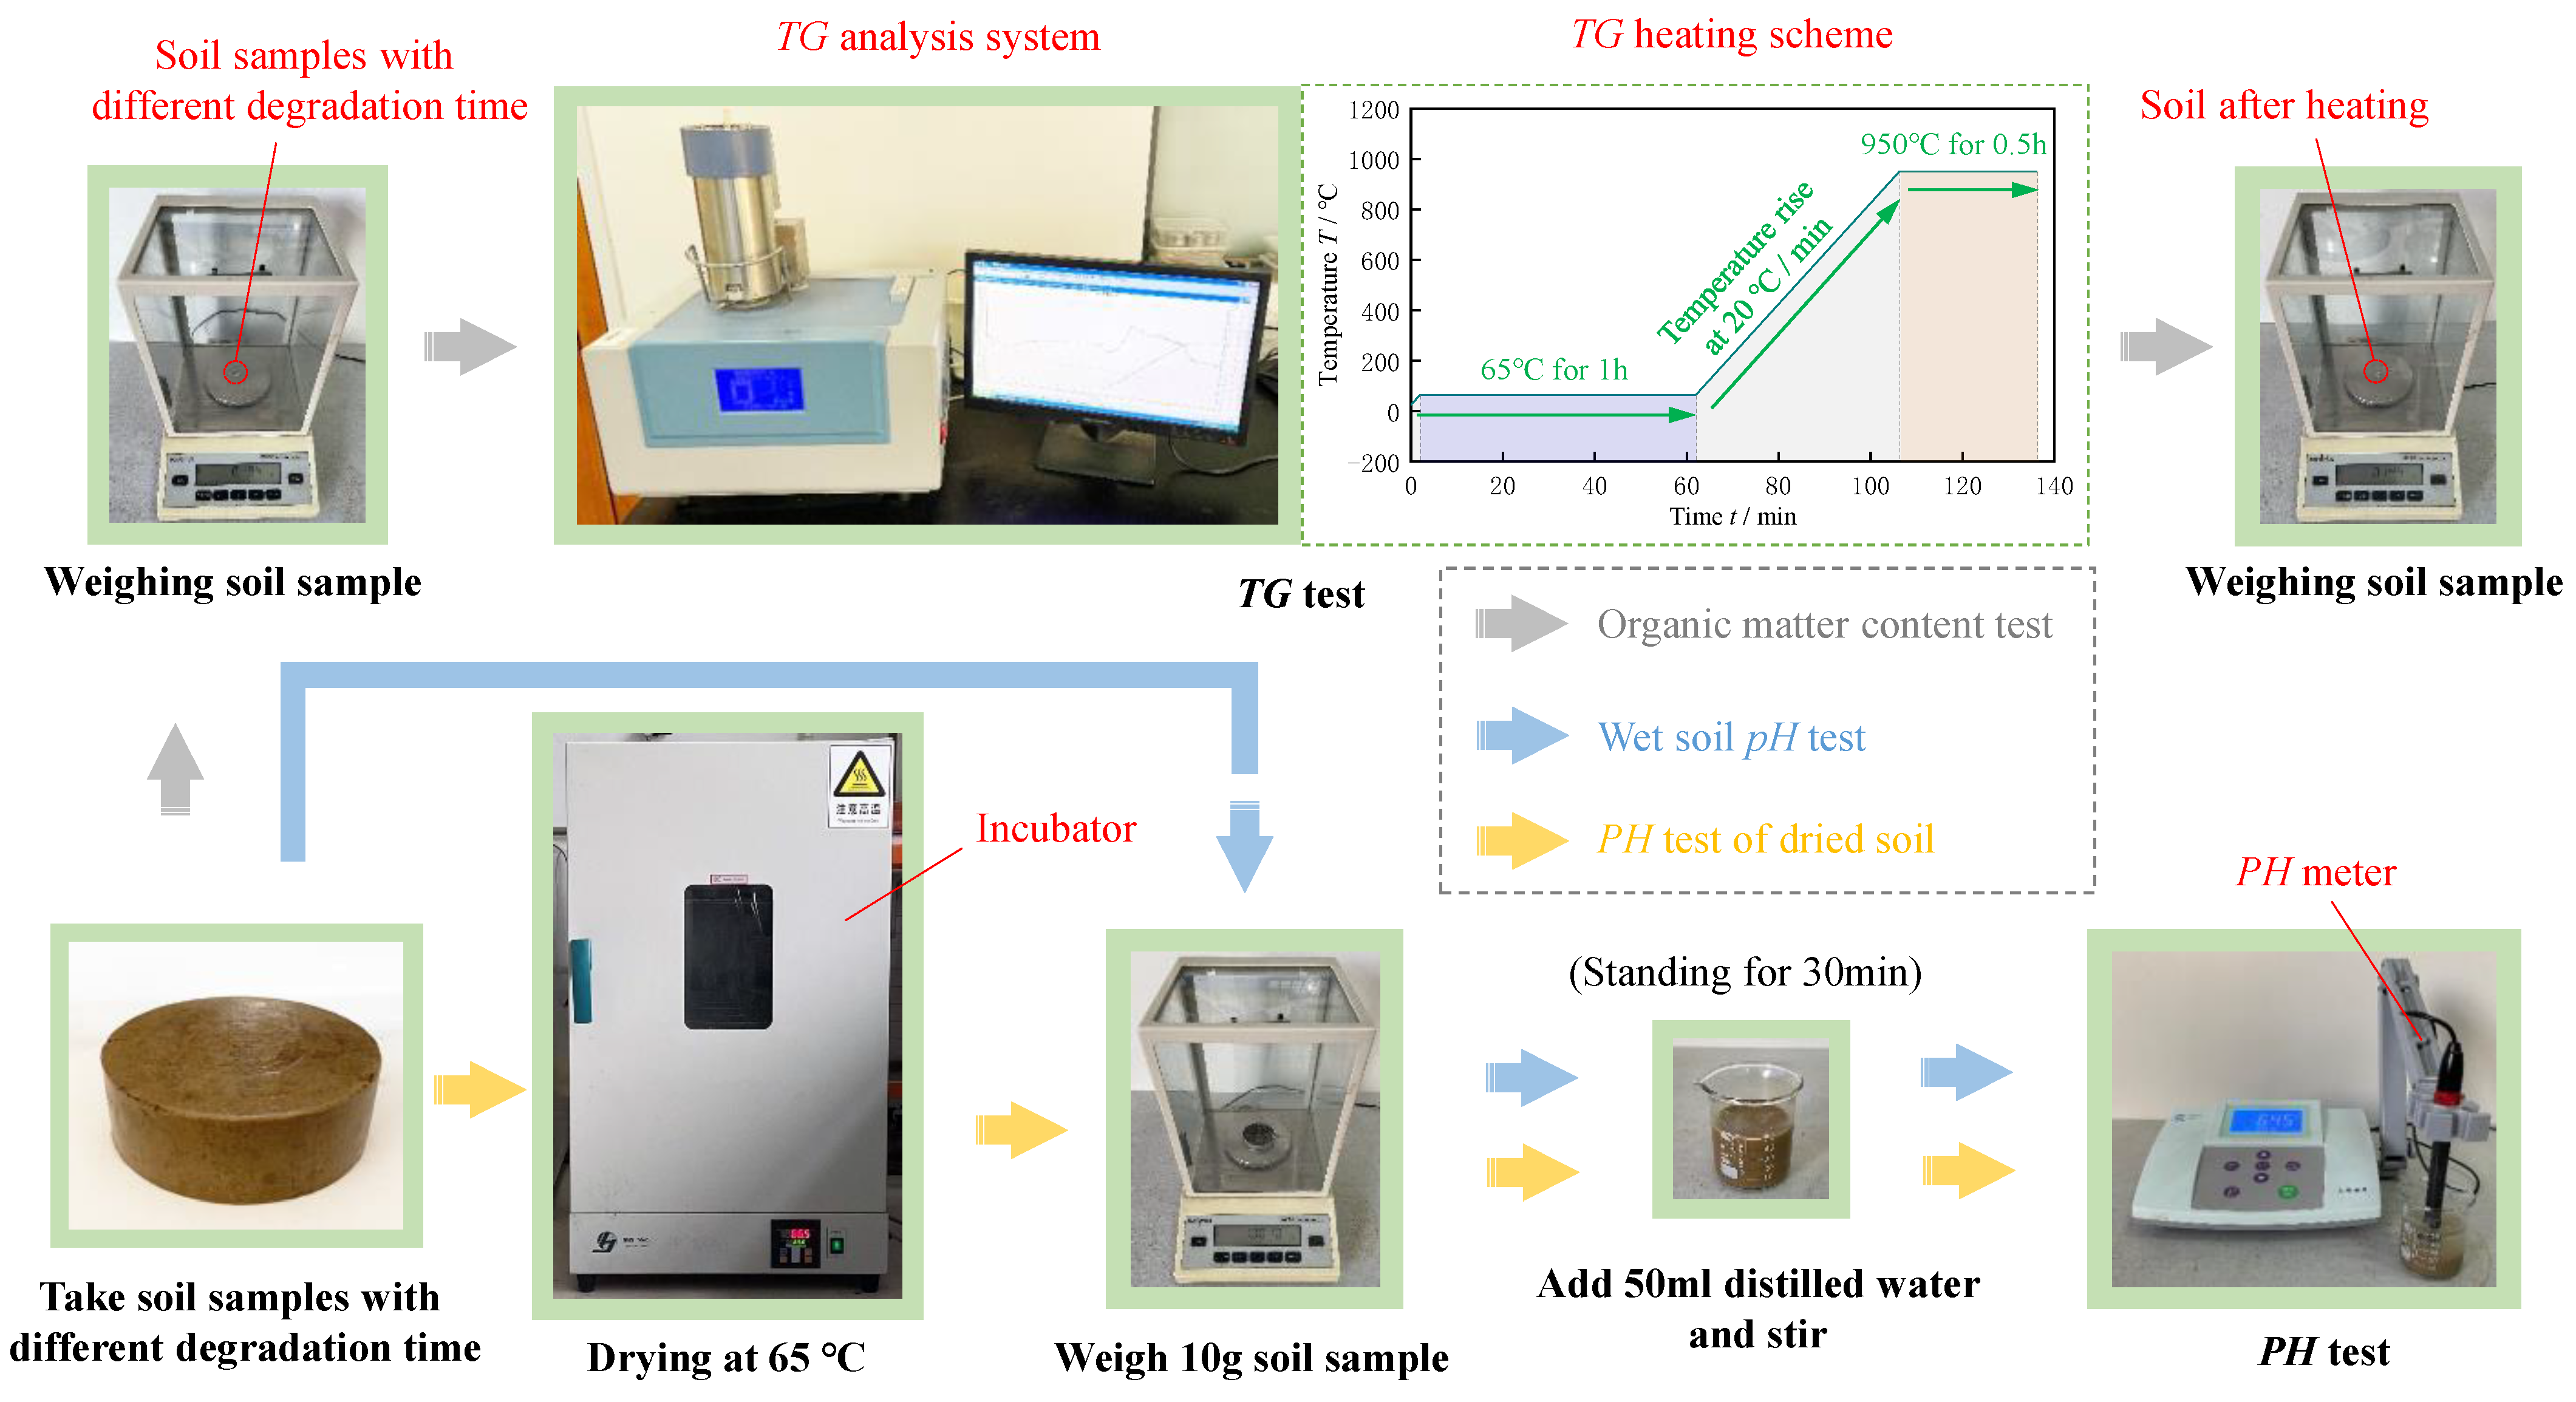
2.3. Experimental Methods

(1)
Evaporation test method
The experimental device is shown in Figure 2b.
The evaporation tests were conducted on dense soil samples for four anaerobic degradation times (0, 8, 16, and 24 days). To compare the evaporation characteristics of the soil samples at the four degradation times (i.e., to shorten the evaporation test time as much as possible and to prevent the evaporation test from lasting too long, which could result in glucose degradation and impact the interpretation of the experimental results), the constant temperature box was used to regulate the evaporation of the ambient temperature of 65 °C, according to the requirements for measuring the organic matter content of soil by drying method in the “Standard Test Methods for Soil Engineering” GB/T50123-2019 [33]. To reduce the impact of glucose degradation during the test, the evaporation test was completed in one day. During the evaporation process, the surfaces of the soil samples were continuously photographed using a digital camera, the interval time was 1 h, and the soil samples were continuously weighed using an electronic balance at an interval of 1 h. Finally, the height of the completely dried soil samples was measured with a vernier caliper. The experimental test time node is shown in Figure 3.
(2)
Image processing method for evaporation cracks
The Crack Image Analysis System (CIAS) V2.3 software was used to analyze the crack images. The grayscale, threshold selection, and denoising processing were performed in sequence, and the crack parameters such as soil crack rate, crack length, and average crack width were calculated. The specific operation process of the software was referred to in related literature [34]. The specific processing flow of the image is shown in Figure 4.
(3)
Experiment Design of the Glucose Anaerobic Degradation Process
The experimental design of the anaerobic degradation process of glucose mainly included the change in glucose in the anaerobic degradation process and the division of the anaerobic degradation stage of glucose. The test flow is shown in Figure 5.
a. The determination and classification of the glucose anaerobic degradation stage: pH value was used to indirectly react to the relative content of organic matter in degradation products, and then the glucose anaerobic degradation stage was described. The saturated glucose-contaminated soil with 1% concentration (mass ratio of glucose to dry soil) and saturated uncontaminated soil were prepared and sealed. The pH values of the soil degraded for 0, 3, 6, 9, 12, 15, 18, 21, and 24 days were separately tested with a pH meter.
Referring to the basic steps of “Geotechnical Test Method Standard GB/T50123-2019”, 10 g of clay was first put into a 100 mL beaker, and 50 mL of distilled water was added into the beaker according to the soil–water ratio of 1:5. After fully stirring and standing for 30 min, the supernatant was taken and measured with a pH meter, and the measurement was repeated 3 times. When the average error was less than 0.1 pH, the average value of three times was taken as the pH value of the soil.
b. The changes in glucose content in the process of anaerobic degradation: The saturated glucose-contaminated soil with 1% concentration (mass ratio of glucose to dry soil) and saturated uncontaminated soil were prepared and sealed. The organic matter content of soil was tested using a differential thermal analyzer at 0, 4, 8, 12, 16, 20, and 24 days of degradation.
According to the relevant provisions of “Highway Geotechnical Test Specification JTGE-40–2007” for the measurement of organic matter content in soil by a burning method, the heating scheme of the differential thermal analysis was determined. Firstly, the temperature was increased to 65 °C at the speed of 20 °C/min, and the temperature was maintained at 65 °C for 1 h to evaporate the free water in the soil. Then, the temperature was increased to 950 °C at the speed of 20 °C/min, and the temperature was maintained at 950 °C for 0.5 h.

3. Results

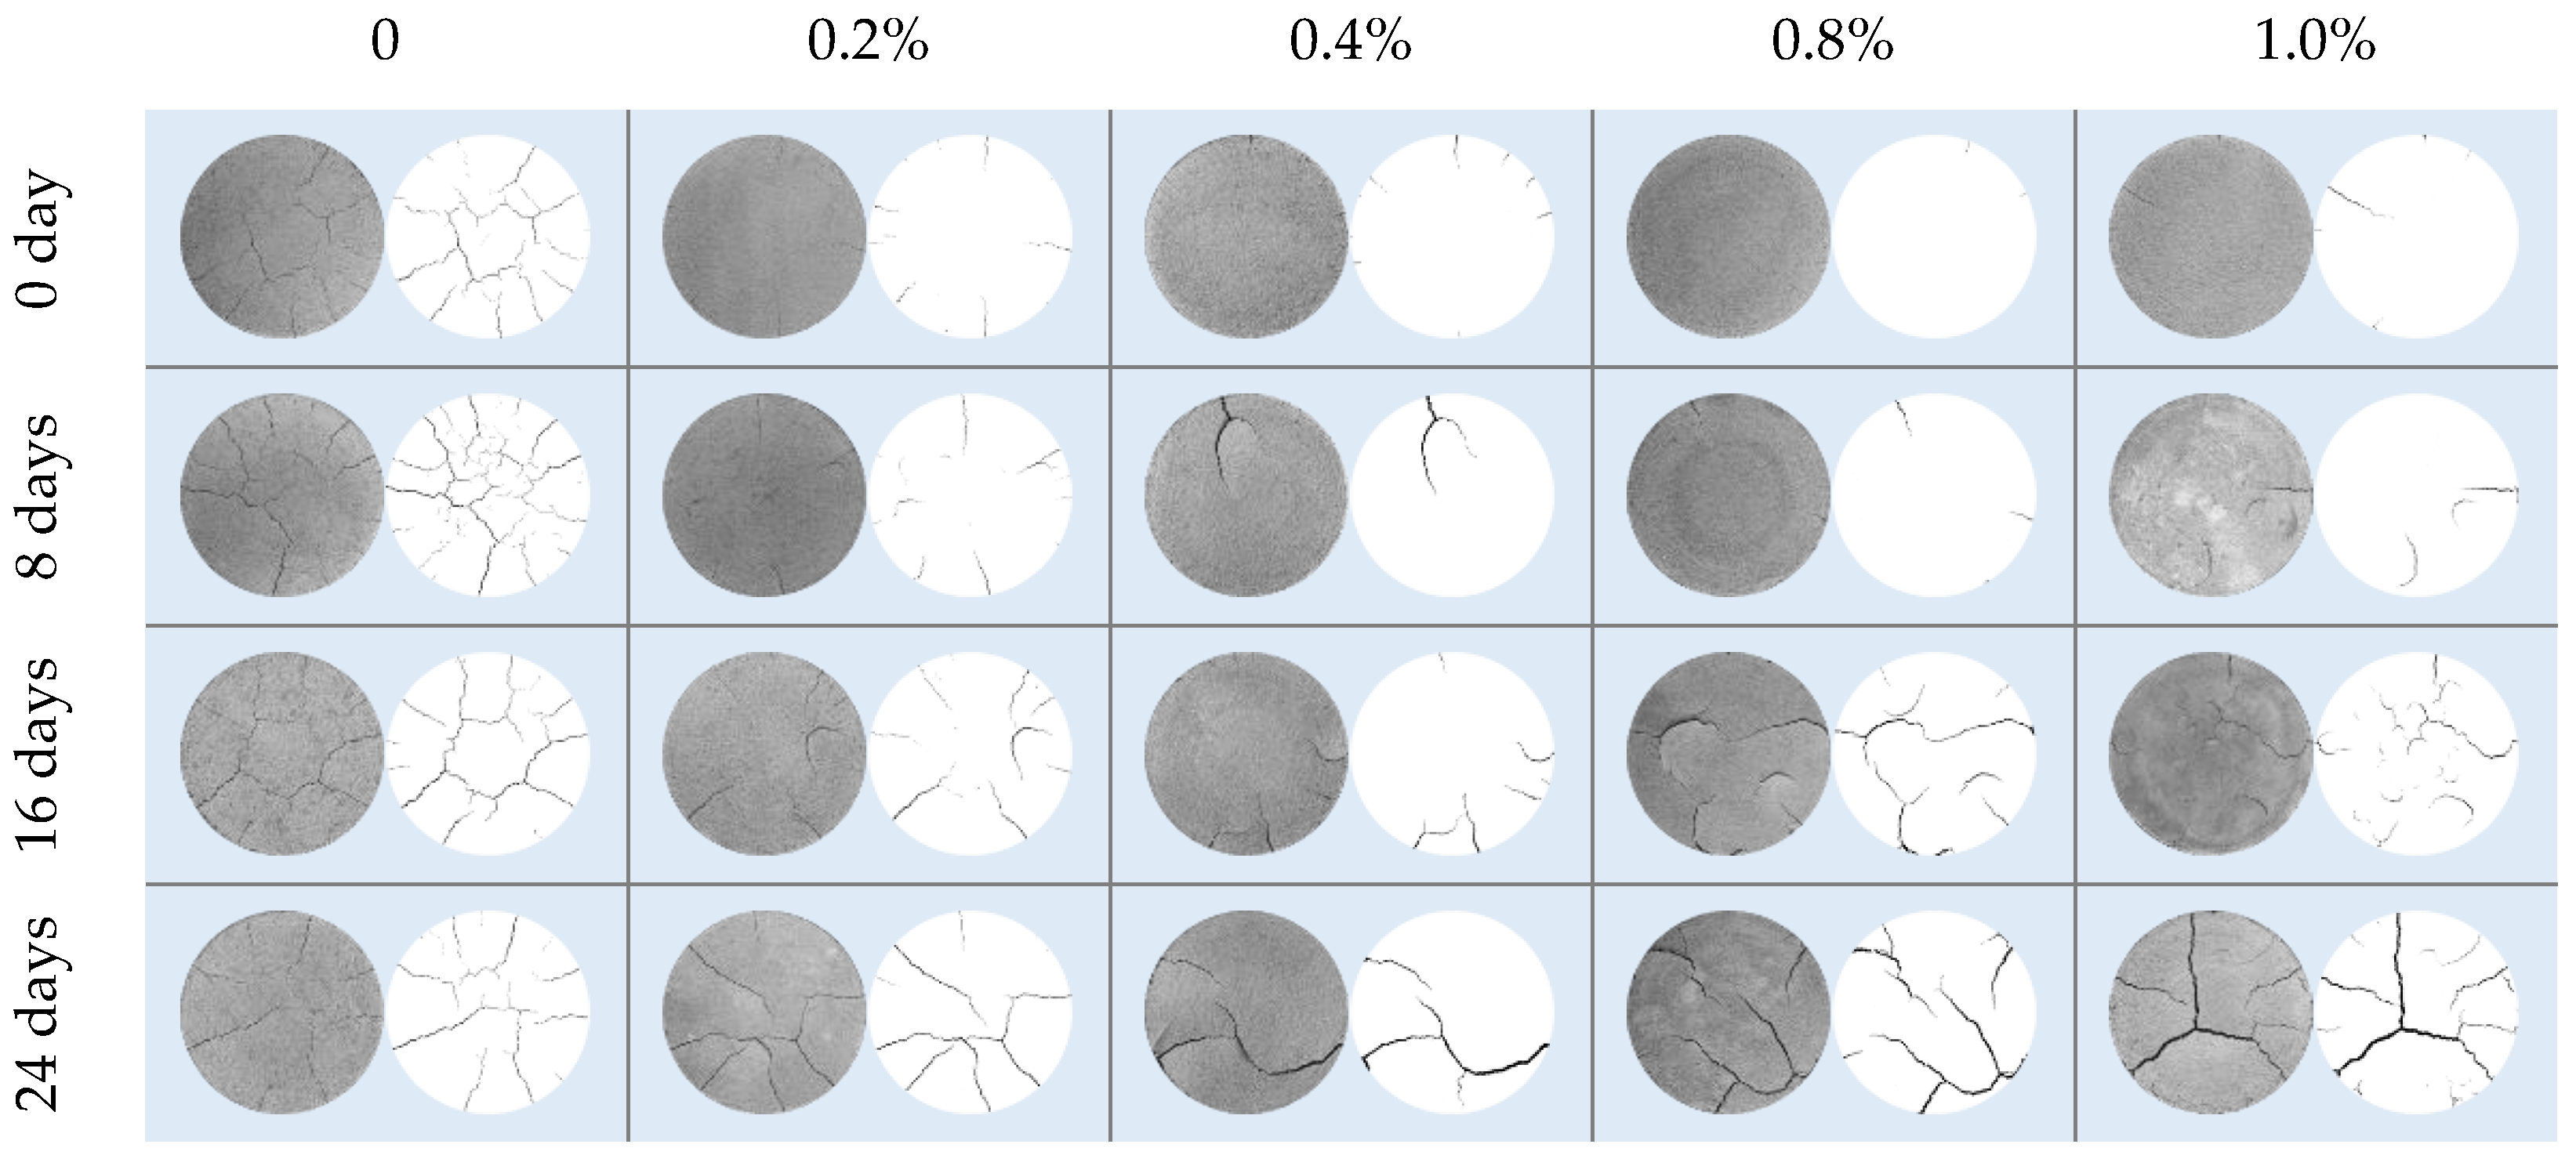
3.1. Characteristics of Evaporation in Compacted Clay during the Anaerobic Degradation of Glucose

Figure 6a shows the relationship between anaerobic degradation time and the reduction in water content in compacted clay during evaporation for 4 h and 8 h at different concentrations of glucose contamination concentrations. There could be some mistakes made throughout the experimental process because of the variability of the soil. As the anaerobic degradation time increases, the water content of unpolluted compact clay evaporatively drops over 4 and 8 h, with slight fluctuations but overall stability; while for contaminated dense clay, the reduction in water content during evaporation for 4 h and 8 h shows a linearly increasing trend.
Figure 6b shows the relationship between the concentration of glucose contamination concentrations and the reduction in water content during evaporation for 4 h and 8 h in dense clay. As the concentration of glucose in the clay increases, the reduction in water content in the compacted clay during evaporation for 4 h and 8 h gradually decreases.
Therefore, by analyzing the experimental results, it can be found that undegraded glucose can enhance the water retention capacity of clay and reduce its evaporation capacity. However, as the glucose undergoes anaerobic degradation, the evaporation rate of the clay increases, and its water retention capacity decreases.

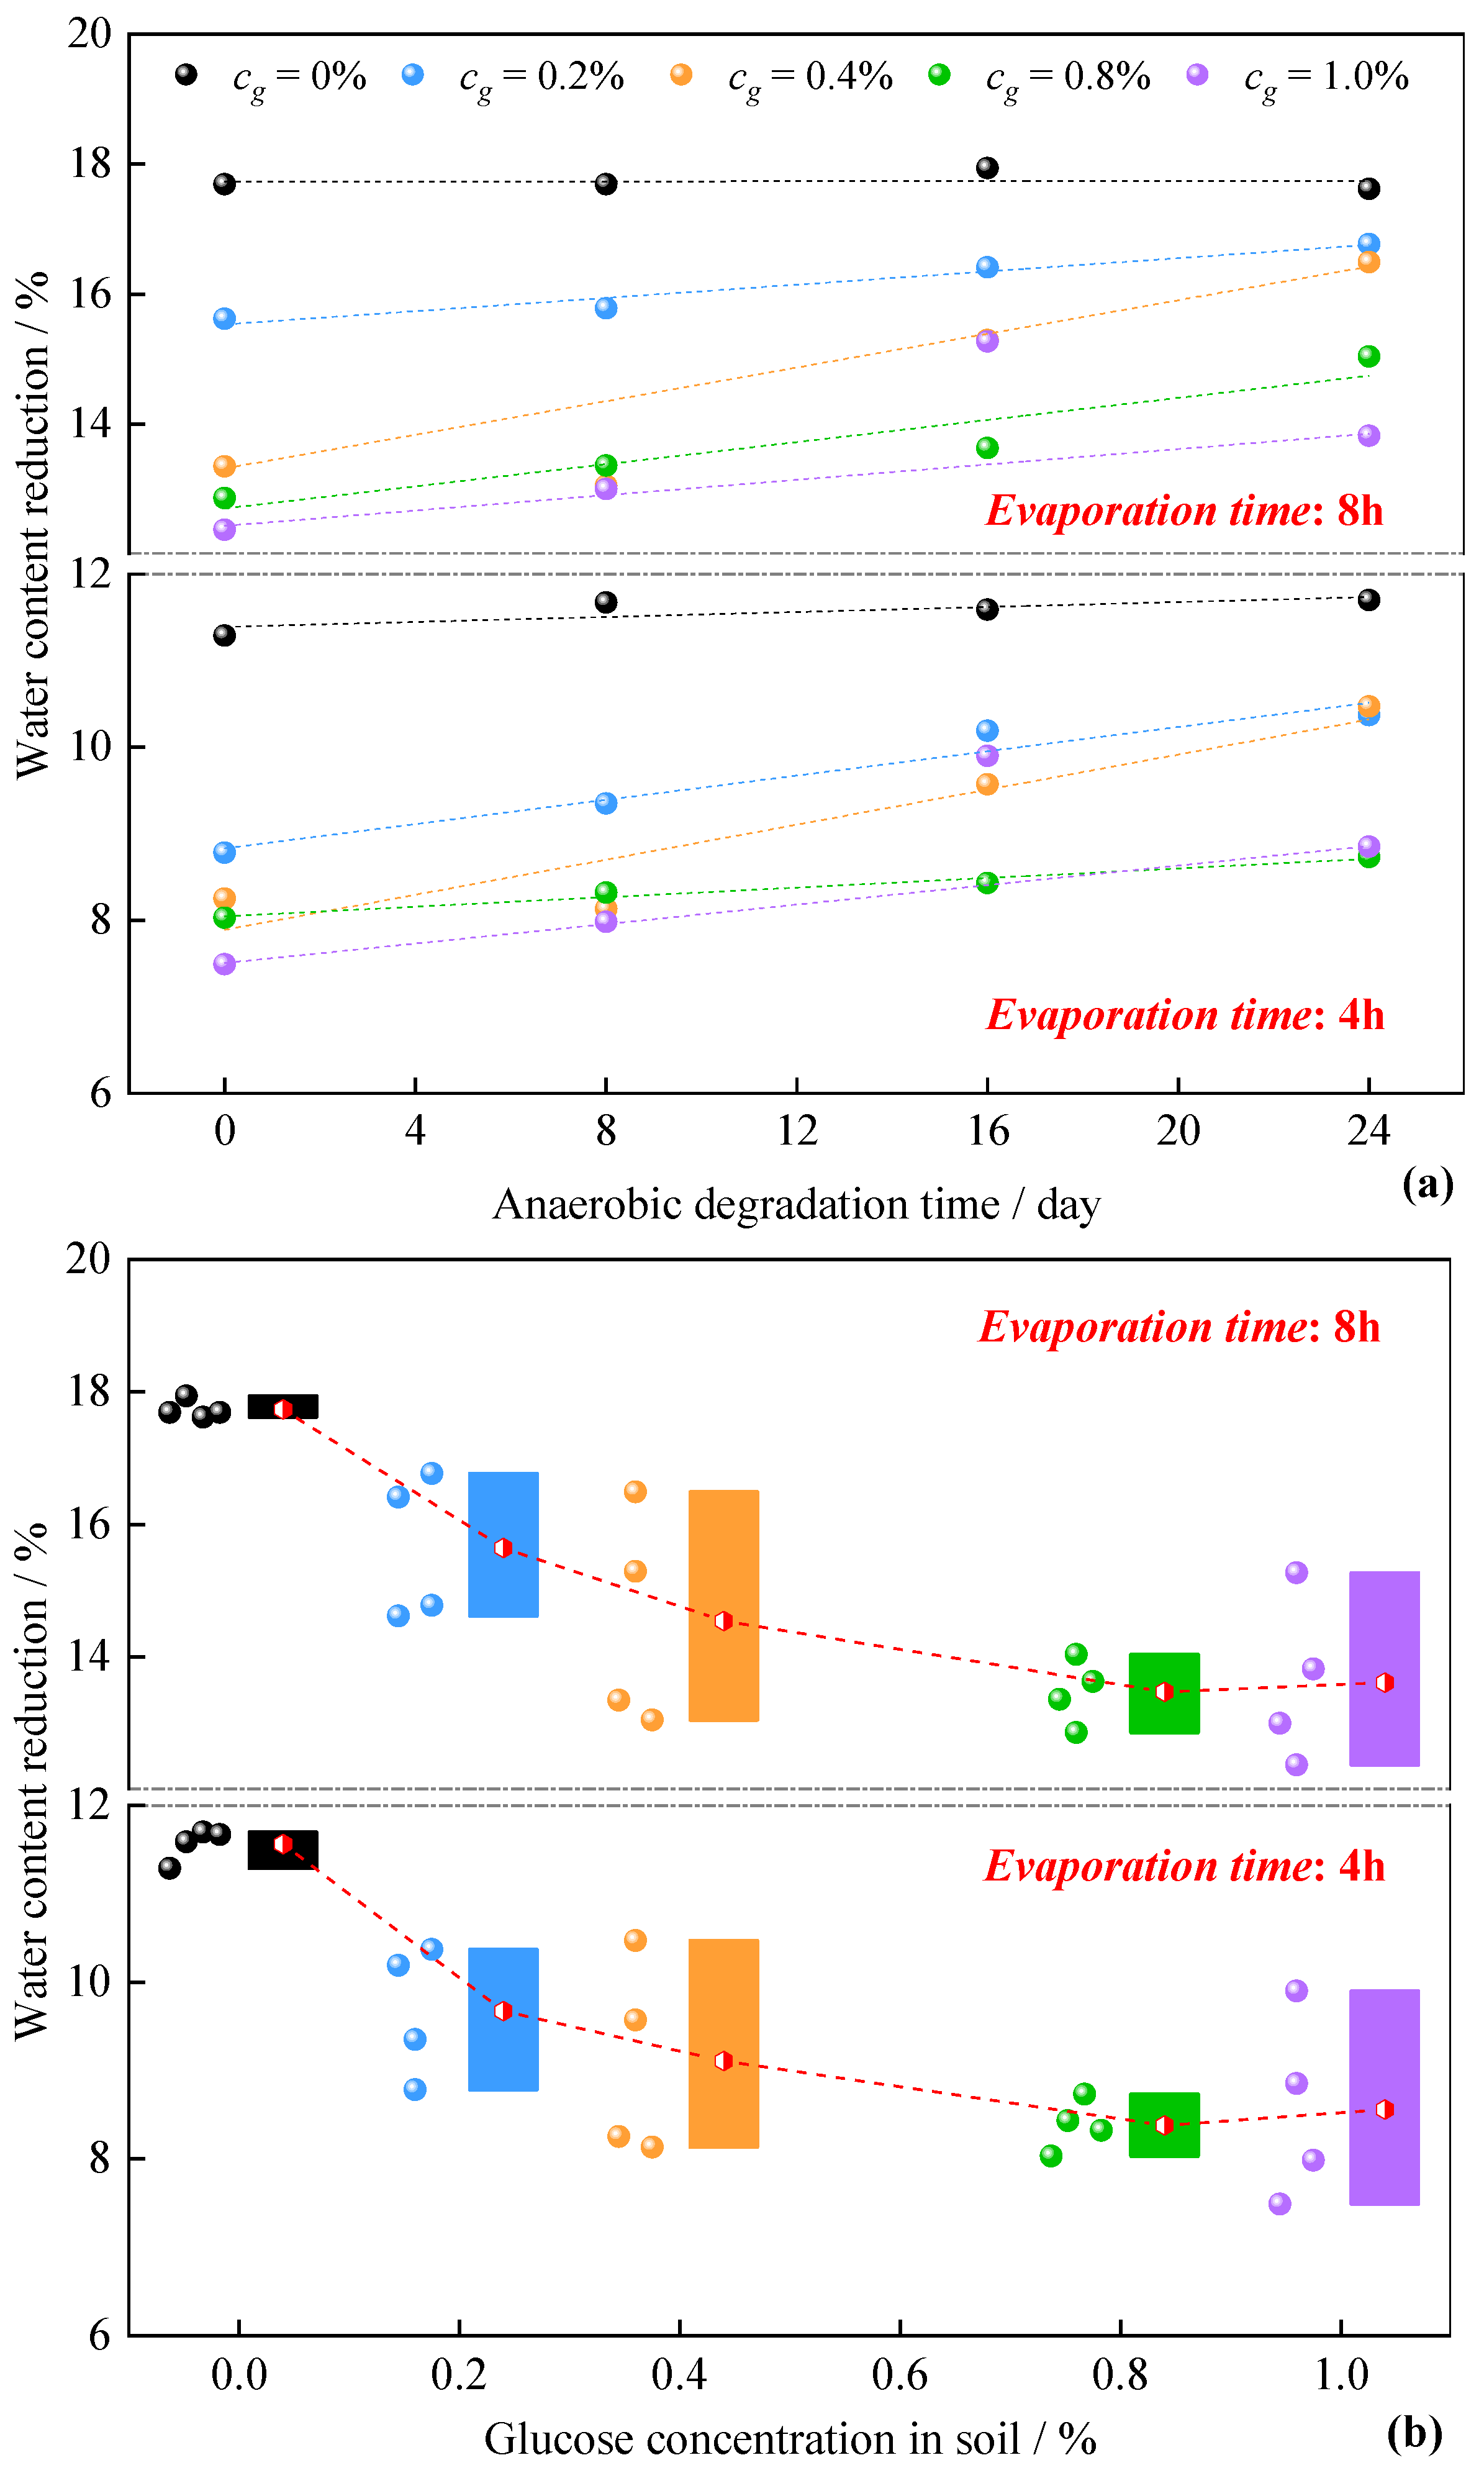
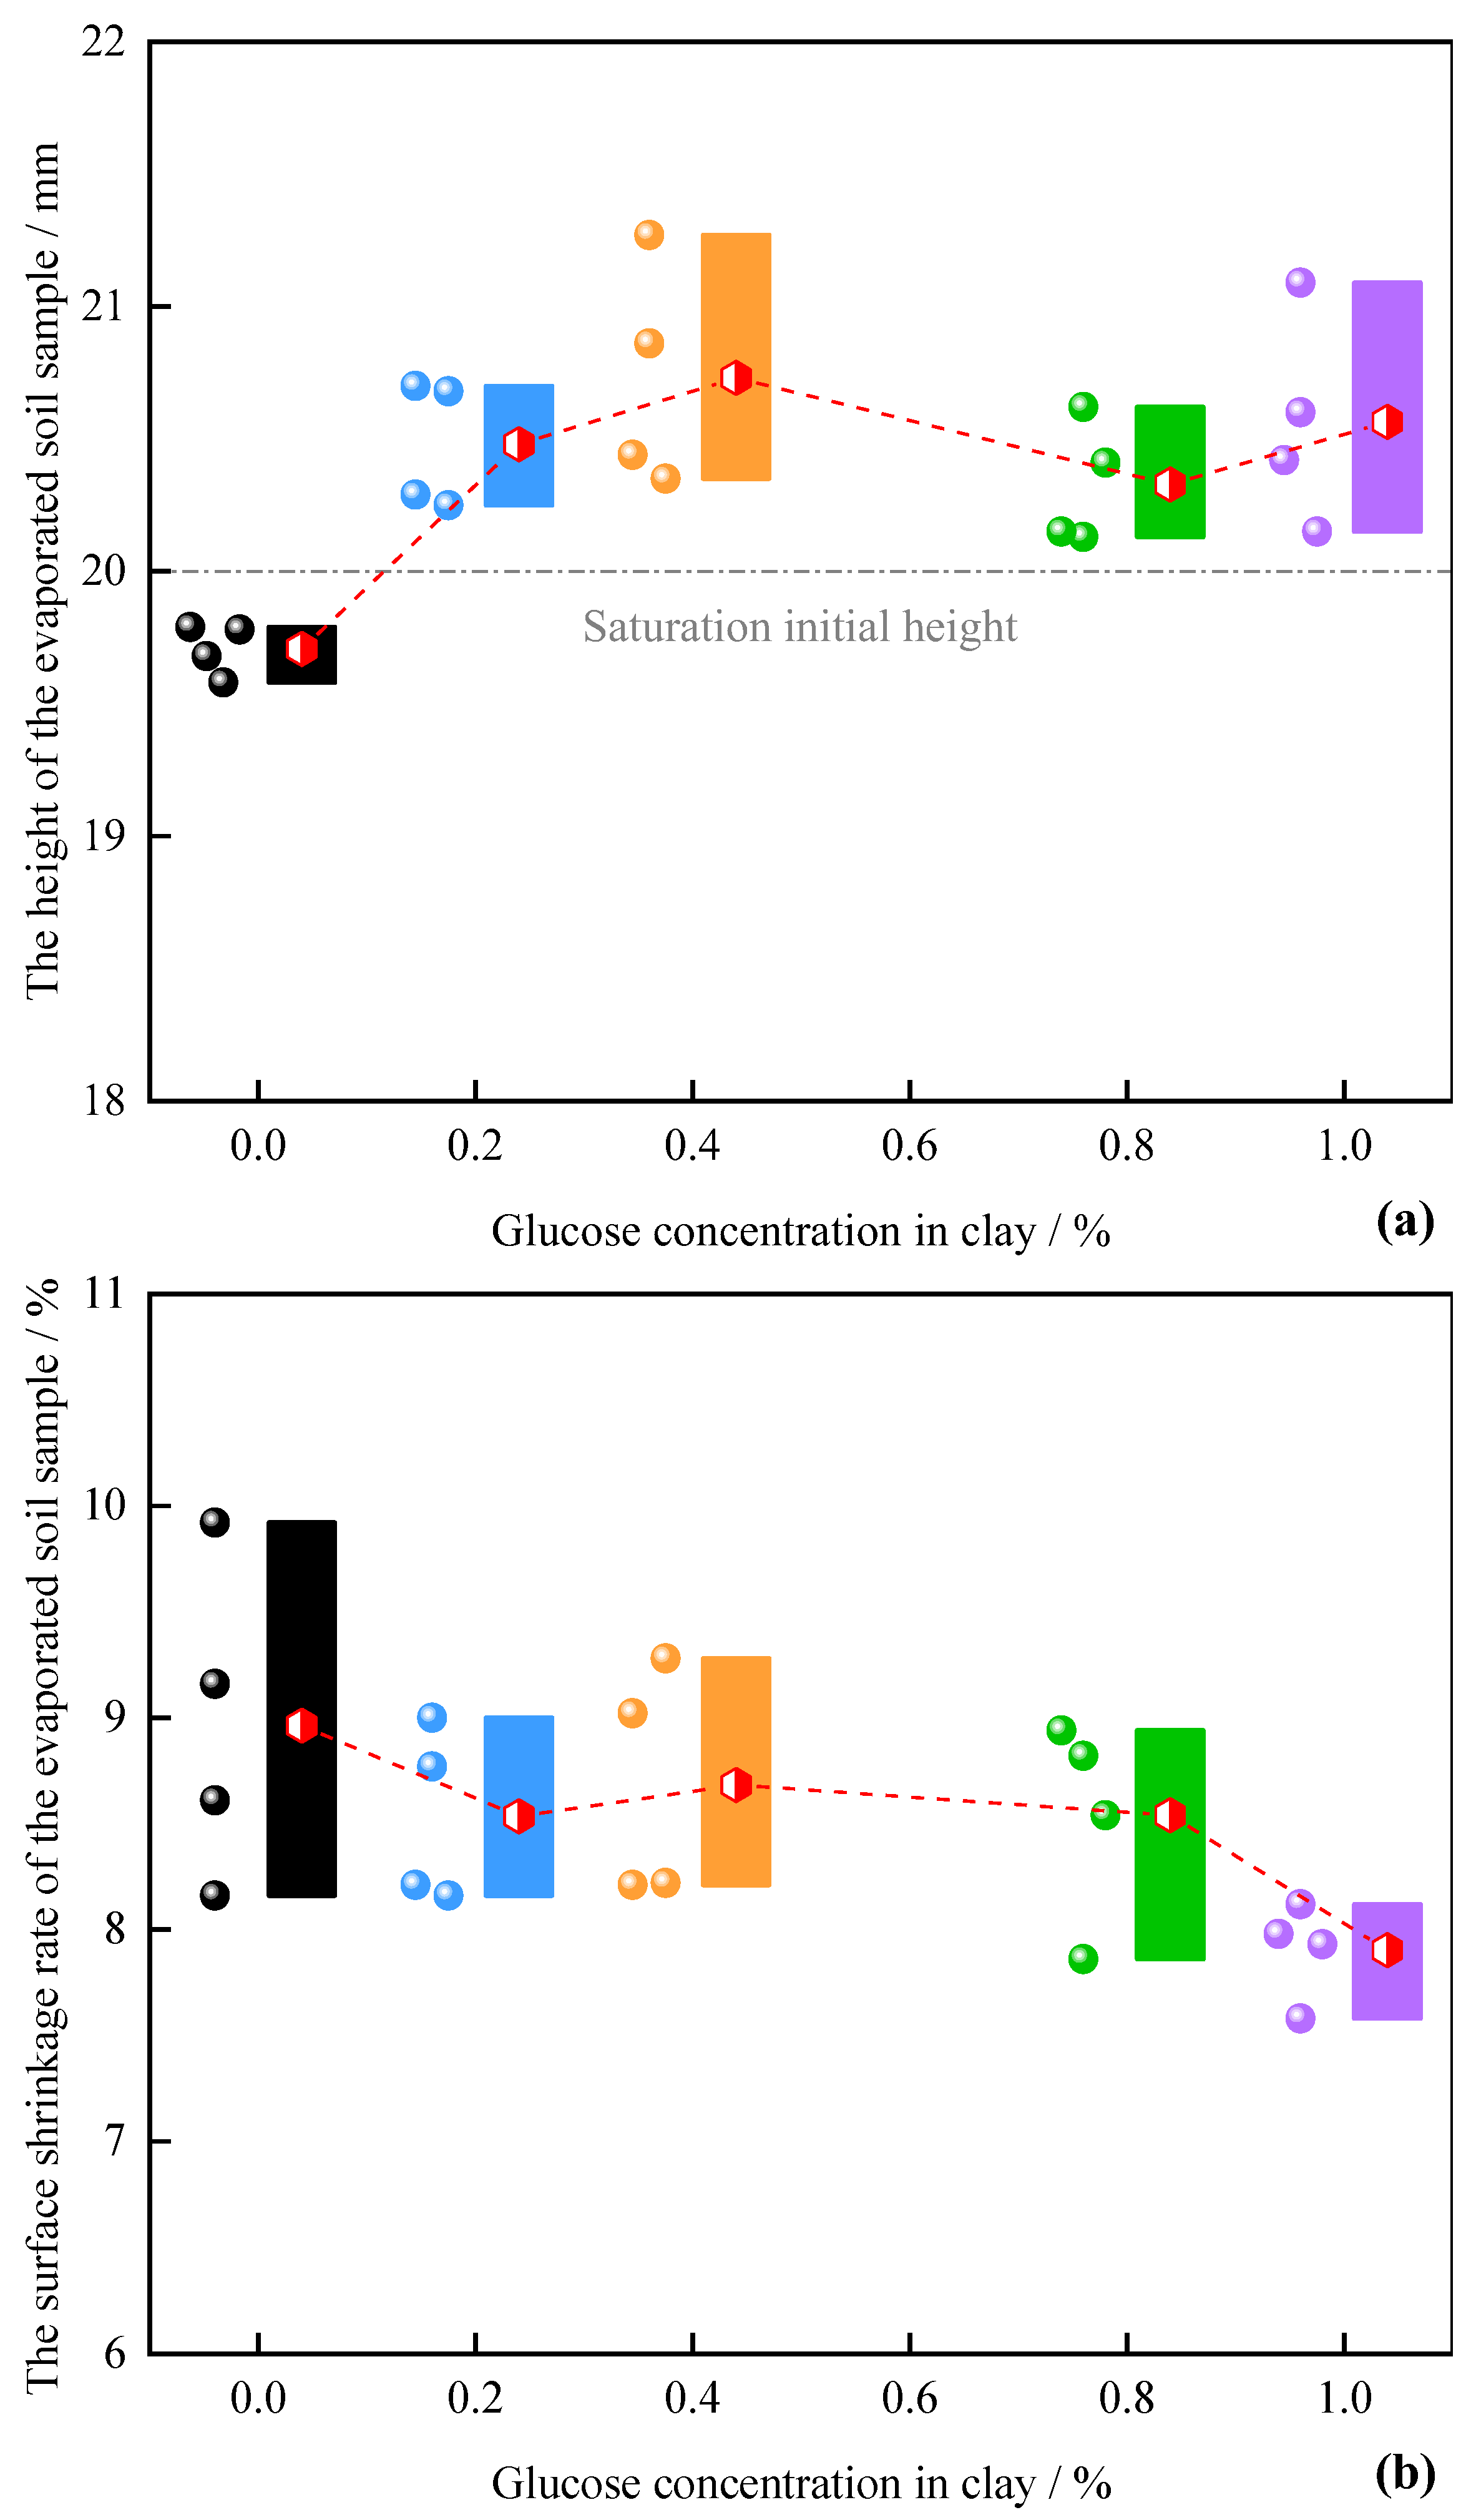
3.2. Characteristics of Evaporation Volume Change in Compacted Clay during the Anaerobic Degradation of Glucose

The relationship curves between the height and surface shrinkage rate of the dried soil samples as relates to the concentration of glucose in clay are shown in Figure 7a and Figure 7b, respectively. The height of the evaporated soil sample increases as the concentration of glucose in clay increases, and the height of the uncontaminated evaporated soil sample is smaller than the initial height at saturation (20 mm), while the maximum height of the glucose-contaminated evaporated soil sample is greater than the initial height at saturation of the dense clay. The surface shrinkage rate of the evaporated soil sample decreases as the concentration of glucose in clay increases. This indicates that glucose in the compacted clay can decrease the volume shrinkage caused by evaporation.

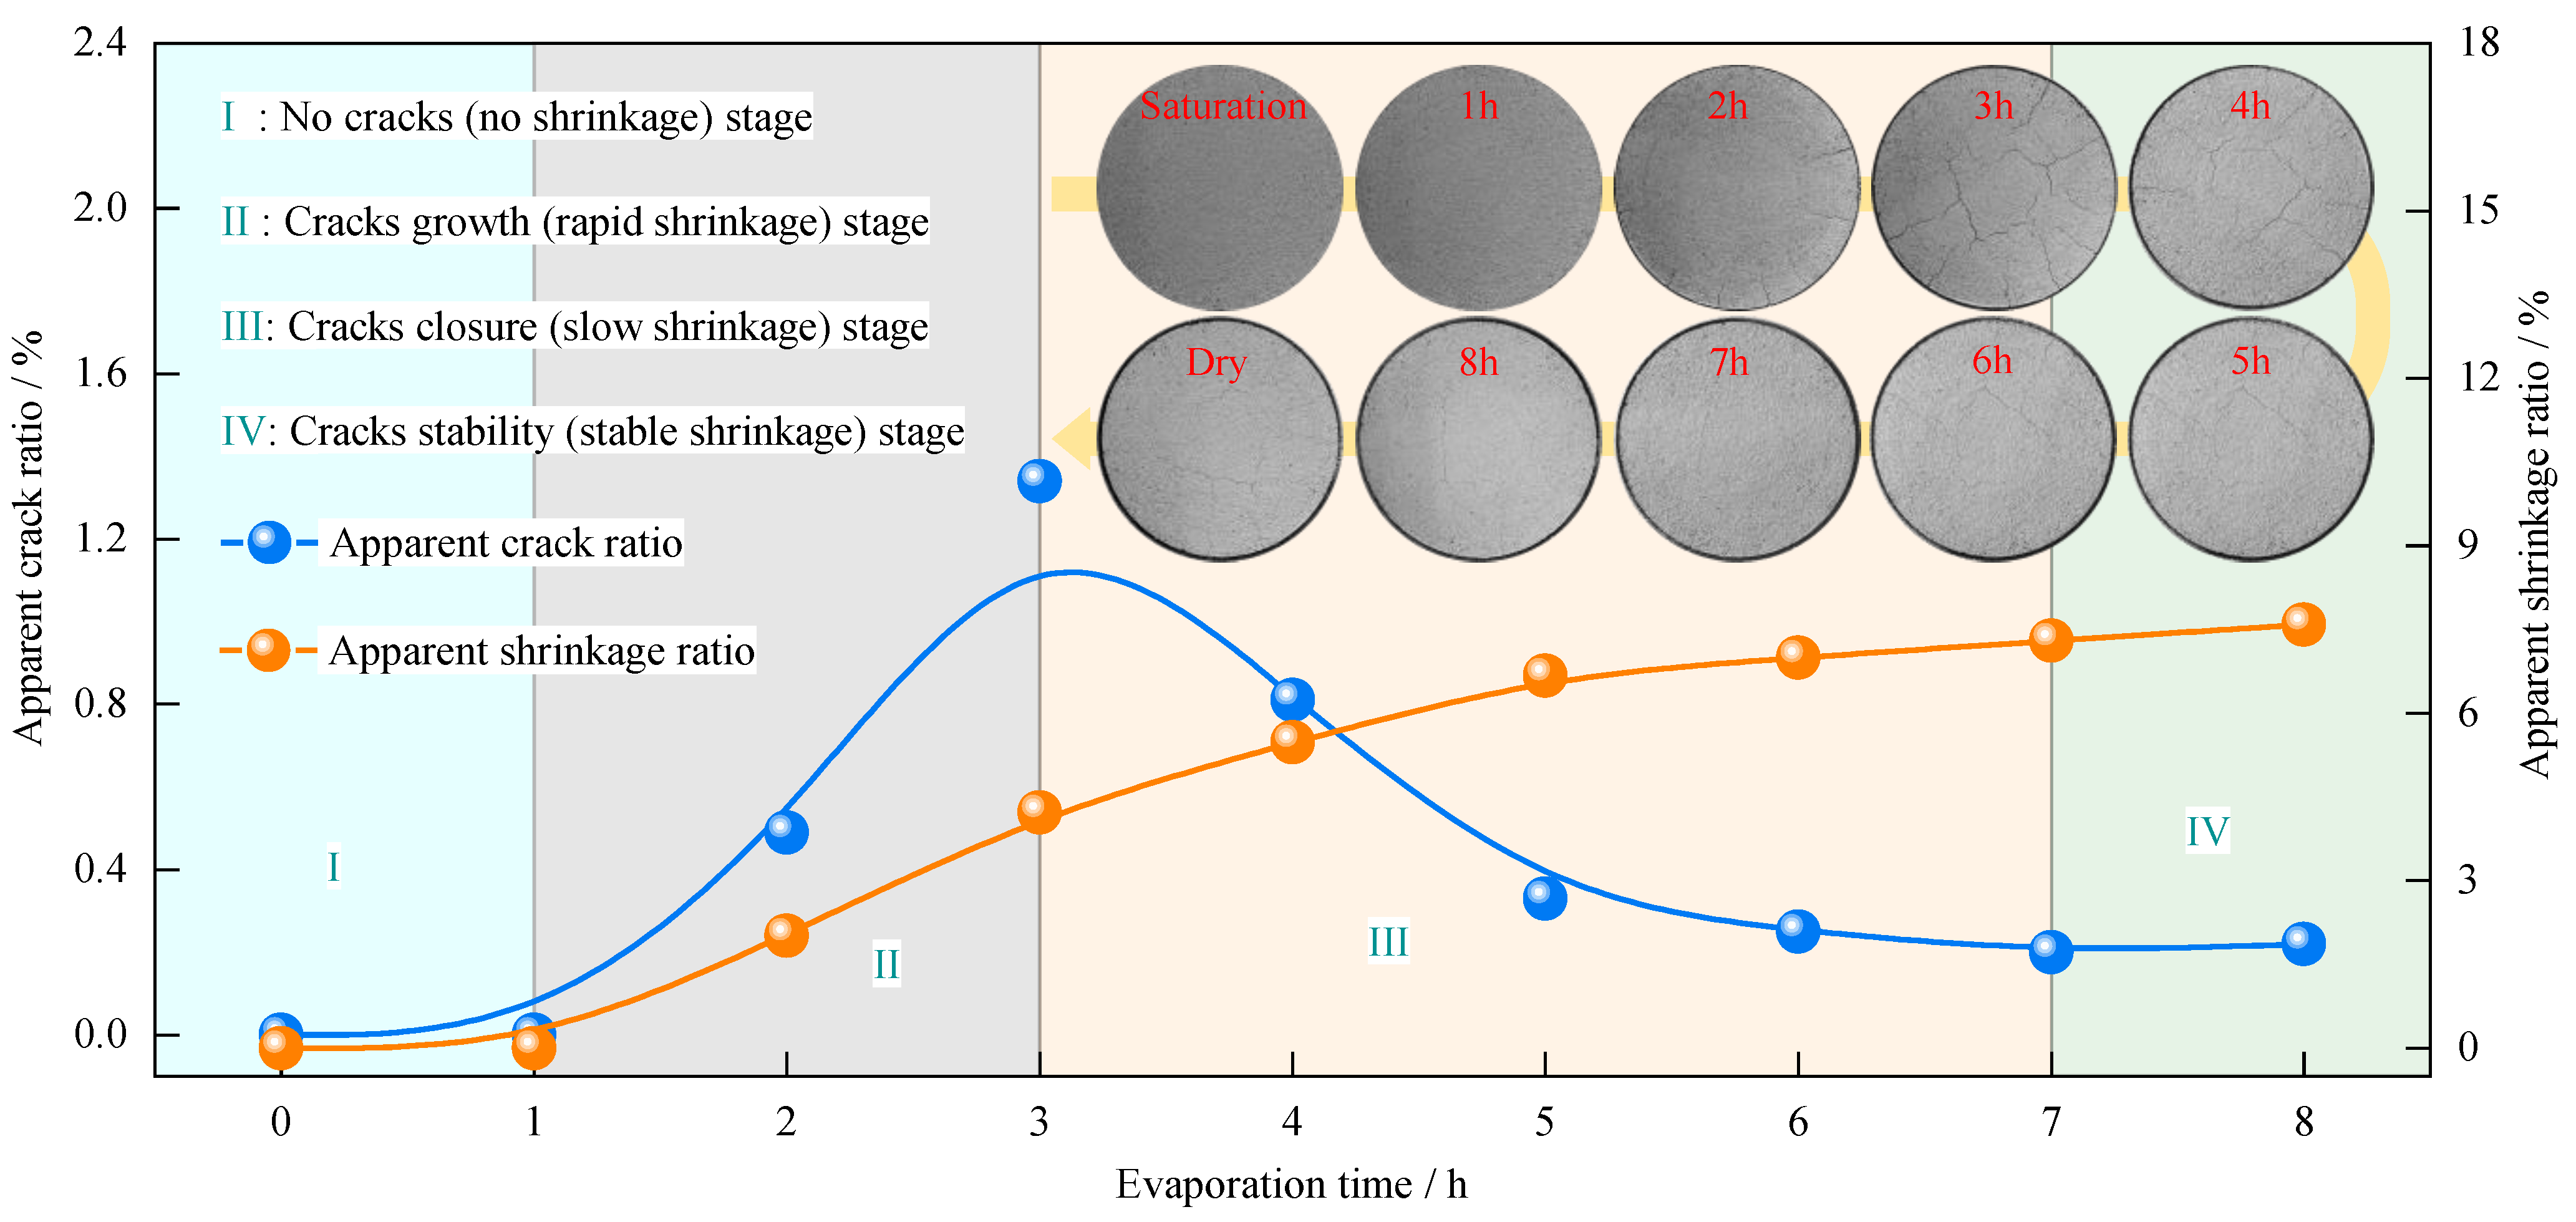
3.3. Characteristics of Evaporation Crack Development in Compacted Clay during the Anaerobic Degradation of Glucose
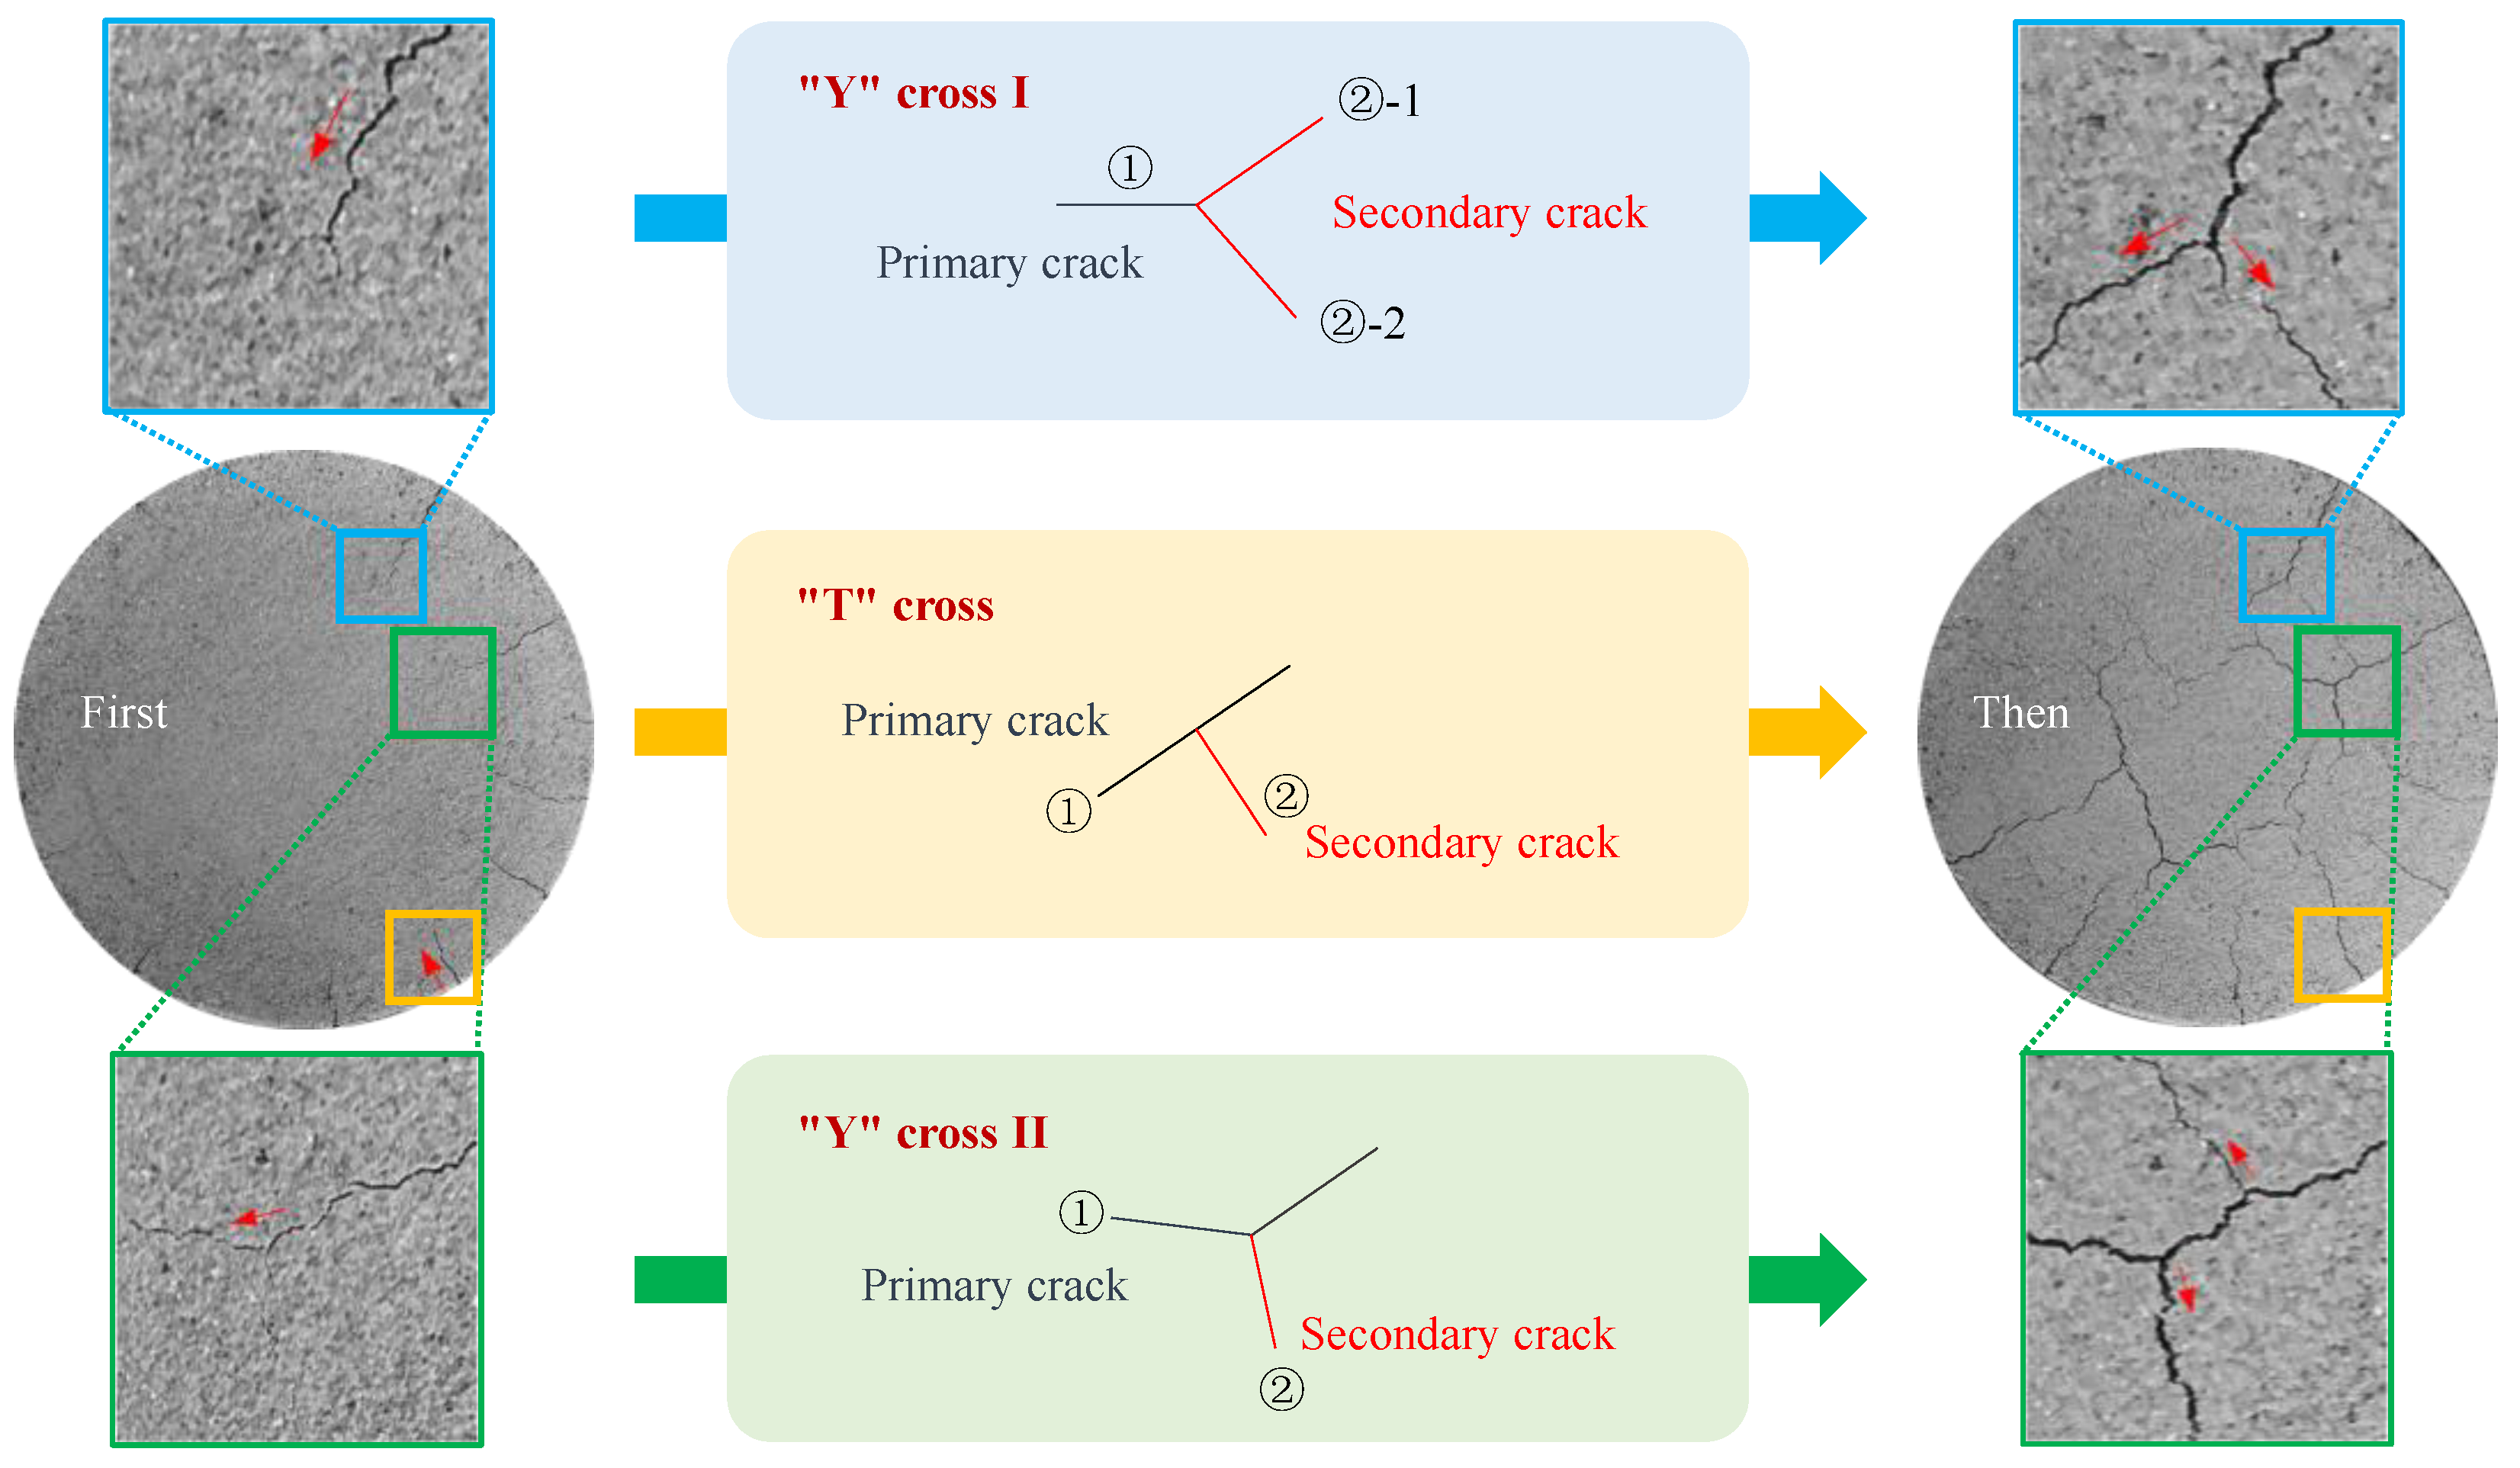
(1)
The growth and development laws of cracks
Figure 8 shows the relationship curves of the apparent crack ratio, apparent shrinkage ratio, and the evaporation time of the compacted clay during the process of evaporative water loss. As the evaporation time increases, the apparent crack ratio of the compacted clay first increases and then decreases, eventually stabilizing, while the apparent shrinkage ratio gradually increases and then stabilizes. Based on the evolution characteristics of the apparent crack ratio and the apparent shrinkage ratio of the soil during the evaporation process, the deformation of the upper surface and the development of cracks in the compacted clay during evaporation can be divided into four stages: no cracks (no shrinkage) (0–1 h), crack growth (rapid shrinkage) (1–3 h), crack closure (slow shrinkage) (3–7 h), and crack stability (stable shrinkage) (>7 h).
Figure 9 shows the development of evaporation crack intersections in dense clay. The cracks in the compacted clay gradually grow towards the center along the vertical direction of the tangent to the edge of the soil, and the cracks intersect with the edge of the clay in a “T” shape. Two types of evaporation crack intersections appear as “Y” shape cracks in clay. Type I “Y” intersections occur when primary cracks grow to the intersection point and then propagate into two secondary cracks in other directions. Type II “Y” intersections occur when the primary cracks show a change in direction, and the secondary cracks originate at the bending point.
(2)
The distribution law of cracks
Figure 10 shows the maximum development of evaporation cracks in compacted clay with different glucose concentrations and anaerobic degradation times.
It can be observed that the addition of glucose leads to a decrease in the number of evaporation cracks and an increase in width. Moreover, the number of evaporation cracks in glucose-contaminated clay before anaerobic degradation (0 day, 8 days) is less than that in the later stage of anaerobic degradation (16 days, 24 days), indicating that undegraded glucose can suppress the evaporation cracking of dense clay, while the anaerobic degradation of glucose can promote the evaporation cracking of compacted clay and increase the number of evaporation cracks.
Figure 11 shows the maximum crack ratio, total crack length, and average crack width of compacted clay during evaporation. In the early stage of anaerobic degradation (0 days, 8 days, 16 days), both the maximum crack ratio and total crack length of glucose-contaminated compacted clay are lower than those of uncontaminated clay, while the average crack width of contaminated compacted clay is comparable to that of uncontaminated clay. In the later stage of anaerobic degradation (24 days), both the maximum crack ratio and average crack width of glucose-contaminated compacted clay are higher than those of uncontaminated clay, while the total crack length of contaminated compacted clay is comparable to that of uncontaminated clay. Therefore, this indicates that glucose mainly affects the evaporation crack length of compacted clay in the early stage of degradation and mainly affects the evaporation crack width of compacted clay in the later stage of degradation.

4. Discussion

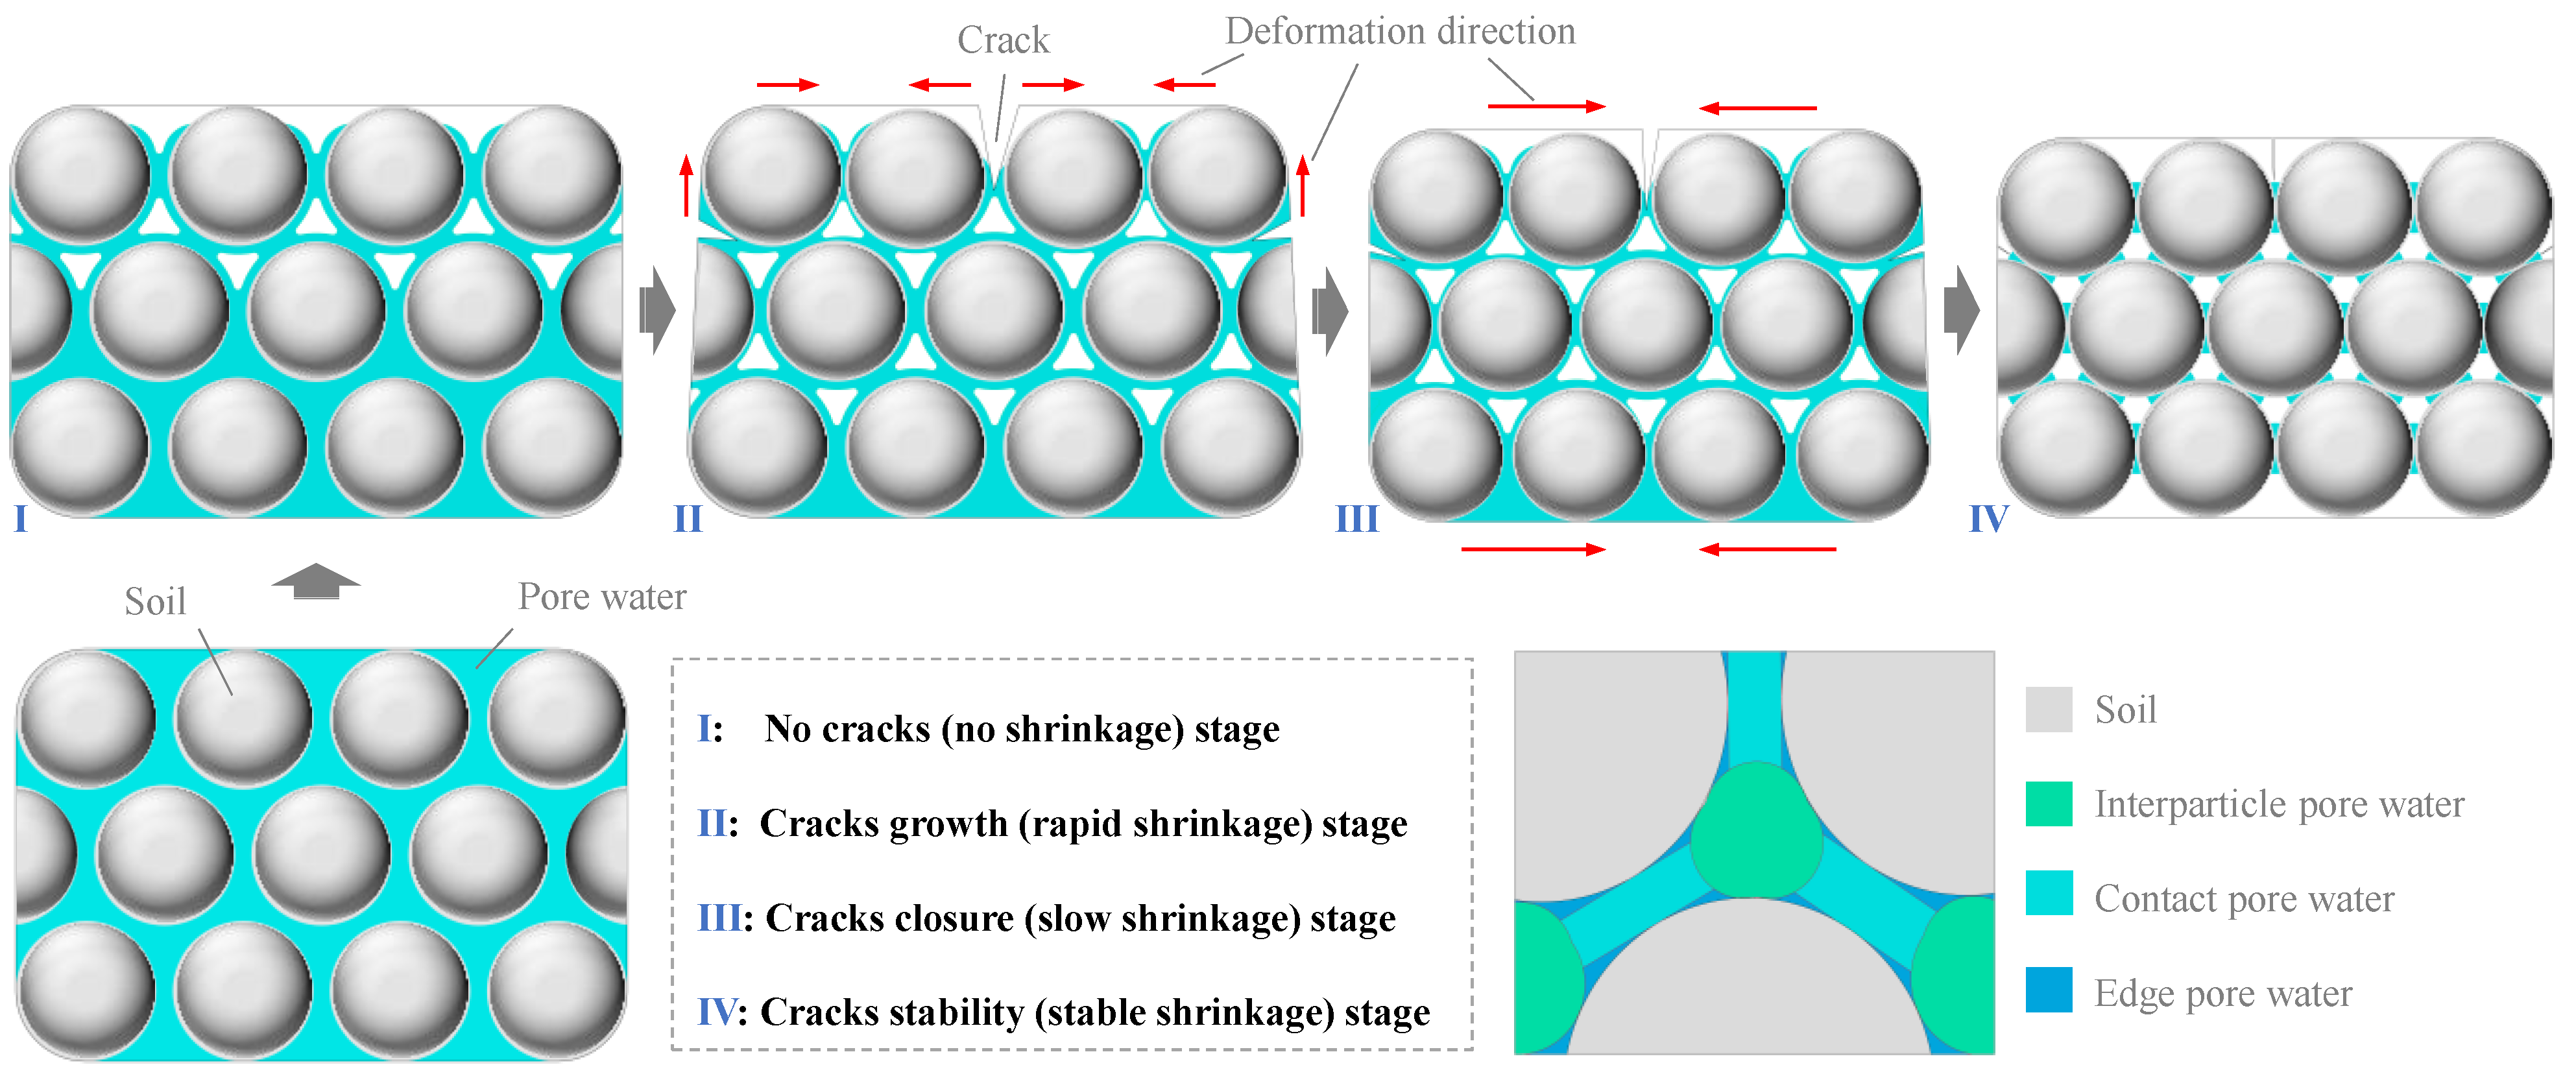
4.1. Evolution Mechanism of Evaporation and Water Loss Deformation in Dense Clay

In general, the evaporation of clay mainly dissipates free water [35], which can be classified into three types based on their distribution in the clay pore system: interparticle pore water, contact pore water, and edge pore water, as shown in Figure 12. Among these, contact pore water located in the middle of two soil particles has an impact on the deformation of the clay due to evaporation and water loss, while the loss of the other two types of pore water does not cause a deformation of the clay. The order of evaporation and loss of the three types of pore water first occurs with interparticle pore water, then contact pore water, and finally edge pore water. Therefore, the evolutions of the apparent crack ratio and apparent shrinkage ratio of compacted clay during evaporation and water loss can be analyzed based on the evolution mechanism of the clay pore system.
No cracks (no shrinkage) stage: When the upper part of the clay lost interparticle pore water due to evaporation, the position and structure of the soil particles remained unchanged, and the soil did not undergo any deformation or cracking.
Crack growth (rapid shrinkage) stage: When the upper part of the clay lost contact with pore water due to evaporation, and the lower part began to lose intergranular pore water, the soil particles in the upper part began to aggregate and quickly shrink and deform, while the lower part of the soil remained unchanged. Due to the difference in deformation between the upper and lower parts of the soil, shrinkage cracks would form on the surface and sides of the upper part.
Crack closure (slow shrinkage) stage: The upper part of the clay had a lower content of contact pore water, and the shrinkage rate slowed down. The lower part also began to lose contact with pore water due to evaporation, which drove the shrinkage of the upper part of the soil towards the center, resulting in the closure of cracks.
Crack stability (stable shrinkage) stage: The pore water in the clay was mainly edge pore water, and the soil particles were in point-to-point contact with each other. The soil particle skeleton was densely packed, and the framework reached a stable state. At this point, the evaporation of pore water would not cause a deformation of the soil.

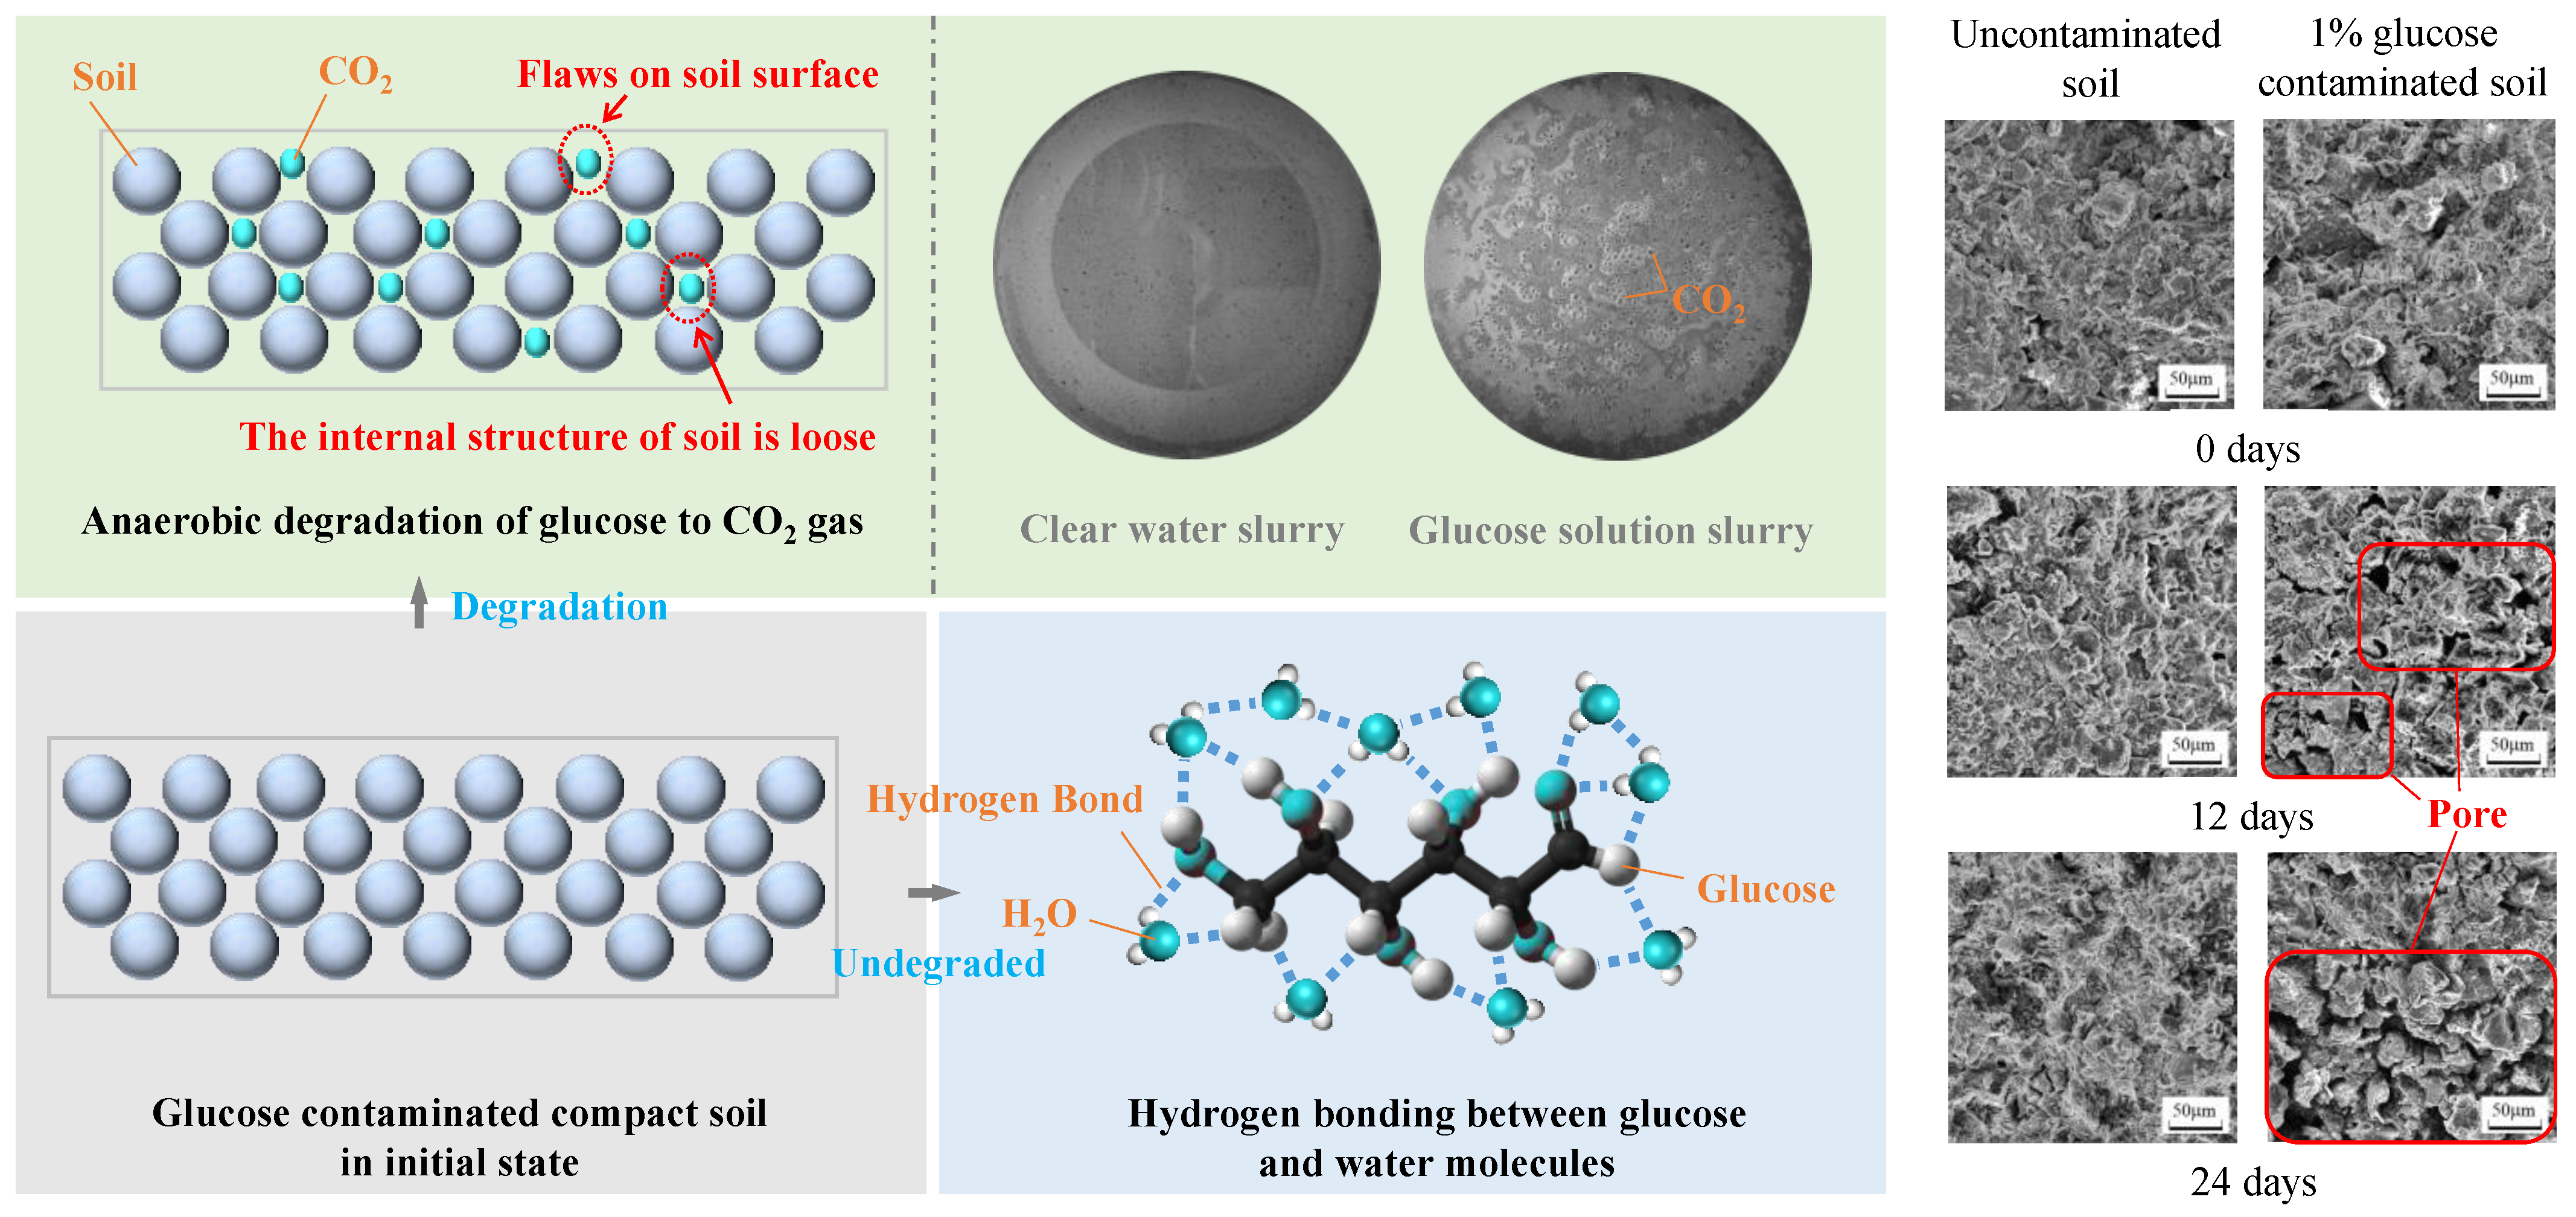
4.2. Anaerobic Degradation Process of Glucose in Soil

As is known to all, the degradation of glucose in an anaerobic environment mainly includes two aspects. On the one hand, glucose is converted to pyruvate, then ethanol and carbon dioxide are generated, and finally acetic acid is converted. On the other hand, glucose is converted to pyruvate to produce lactic acid and finally to acetic acid [36].
The glucose anaerobic degradation process involves glucose, pyruvate, ethanol, carbon dioxide, and lactic acid, and the properties of each substance are shown in Table 1. Because the aqueous solution of pyruvic, carbonic acid, and lactic acid in glucose and glucose anaerobic degradation products are acidic, and the aqueous solution of ethanol is neutral, the change in soil pH during anaerobic degradation can indirectly reflect the relative content of degradation products, and then the anaerobic degradation stage of glucose can be divided.
The variation curve of the pH value of clay with time is shown in Figure 13a. The pH of uncontaminated clay is about 6.15, and the soil is weakly acidic, and the pH basically does not change with time, further indicating that the organic matter in the clay is relatively stable under natural conditions, and there is no degradation reaction. The pH of 1% glucose-contaminated undried soil decreases gradually with the increase in anaerobic degradation time, and the change in pH with time shows a piecewise linear function. Due to the unstable nature of pyruvate and the short existence time, glucose, carbon dioxide, and lactic acid are the main factors affecting the pH of clay during the anaerobic degradation of glucose. Therefore, the anaerobic degradation of glucose in soil is divided into two main stages: a. in the first stage (less than 9 days), the pH of clay decreases relatively slowly, because the anaerobic degradation products in this stage are mainly carbon dioxide and ethanol; b. in the second stage (more than 9 days), the pH value of clay decreases relatively rapidly, because the products at this stage are mainly organic matter containing carboxyl groups such as lactic acid and acetic acid.
It can be found that the pH of 1.0% glucose-contaminated dried clay increases with the increase in anaerobic degradation time. In combination with the stability and boiling point of each substance in Table 1, it can be seen that the pyruvic acid, ethanol, carbonate, and lactic acid in glucose-contaminated clay are removed by drying at 65 °C, while only glucose is left. Therefore, it is reasonable to quantitatively test the glucose content in clay by differential thermal analysis.
Figure 13b shows the curves of organic matter content in the clay as a function of degradation time. The content of organic matter in uncontaminated clay accounts for about 3.2% of the total mass of dry soil, and the organic matter reaches a relatively stable state without changing over time.
According to the change in organic matter content in clay during anaerobic degradation, the anaerobic degradation percentage of glucose (the percentage of glucose degraded in clay to total glucose in clay) was found, and the relationship is shown in Formula (1).
η = 4.42 t
In the formula, η is the anaerobic degradation percentage of glucose, %; t is anaerobic degradation time/day.

4.3. Influence Mechanism of Glucose Anaerobic Degradation on Evaporative Cracks in Dense Clay

The influencing factors of the development of evaporative cracks in clay mainly include soil factors (clay content, mineral composition, density, etc.) [37,38], soil structural factors [39], and test factors (environmental temperature/evaporation rate, humidity, test soil sample size, dry–wet cycling conditions, boundary conditions, etc.) [40,41]. Since the basic principle of controlling variables was adopted in this experiment, the initial clay sample’s clay content, mineral composition, density, environmental temperature, humidity, test soil sample size, dry–wet cycling conditions, boundary conditions, etc. were all kept the same. Therefore, from the perspectives of soil structure and the rate of evaporative water loss and in combination with the previous analysis of the anaerobic degradation of glucose in soil, the mechanism of glucose anaerobic degradation on the development of cracks in compacted clay can be analyzed as shown in Figure 14.
The evaporative cracking of clay is mainly caused by differential deformation resulting from non-uniform shrinkage of the shallow and deep parts [42]. Therefore, the rate of evaporative water loss at different depths of the clay has an important influence on the growth of its evaporative cracks. Glucose molecules contain multiple hydroxyl groups, which can form hydrogen bonds with water molecules after being added to the clay, enhancing the internal connection structure of pore water [43]. Due to this, the clay requires more heat to break the hydrogen bonds during evaporative water loss, which reduces its capacity to evaporate water and increases its capacity for holding water. As a result, under the same external conditions, the rate of evaporative water loss becomes slower, and the development of evaporative cracks in the clay is weakened after glucose is added. However, as glucose is anaerobically degraded in the clay, organic matter molecules become shorter, leading to a decrease in the overall strength of hydrogen bonding connections [36]; the connection structure between pore water weakens, resulting in faster evaporative water loss and the greater development of evaporative cracks in the clay.
Regarding the influence of soil structure on its evaporative cracking characteristics, Tang et al. [44] proposed that the existence of “miscellaneous points” in clay can cause local areas of shrinkage deformation during drying, which is inconsistent with the deformation of the surrounding areas. This may lead to stress concentration and promote the development of evaporative cracks in clay. For dense glucose-contaminated clay, the longer the anaerobic degradation time, the greater the development of evaporative cracks in the dense clay [45]. This is mainly because glucose anaerobic degradation releases CO2, breaks down the soil’s structure, makes it more porous, increases its inhomogeneity, and creates many weak spots in the soil’s mechanical qualities [36]. And the macroscopic performances form “miscellaneous points” and encourage the expansion of evaporation cracks in the clay. In addition, the CO2 produced by the anaerobic degradation of glucose not only increases the pore size of the soil but also enhances the connectivity of the soil pores (Figure 13). On the one hand, it provides a flow channel for the evaporation of water, promoting the evaporation and water loss of the soil [46]; on the other hand, pore types with strong connectivity also become potential fracture development sites [47].
In summary, the influence mechanism of soluble sugar on the evaporation cracking of clay mainly includes two aspects: “forming hydrogen bonds to reduce the rate of evaporation and water loss in clay” and “generating CO2 to alter the structure of the clay”. The aspect “forming hydrogen bonds to reduce the rate of evaporative water loss in clay” has an inhibitory effect on the development of evaporative cracking, while “generating CO2 to alter the structure of the clay” has a promoting effect on the development of evaporative cracking. Combined with the results of the evaporation test, it was found that, in the early stage of anaerobic degradation, the development degree of evaporative cracks in glucose-contaminated clay was smaller than that in uncontaminated clay. However, in the later stage of anaerobic degradation, the development degree of evaporative cracks in glucose-contaminated clay was greater than that in uncontaminated clay. This indicates that, in the initial stage of degradation, “forming hydrogen bonds to reduce the rate of evaporative water loss in clay” has a stronger impact on the development of evaporative cracking in contaminated clay than “generating CO2 to alter the structure of the clay”. Conversely, in the later stage of degradation, “generating CO2 to alter the structure of the clay” has a stronger impact on the development of evaporative cracking in contaminated clay than “forming hydrogen bonds to reduce the rate of evaporative water loss in clay”.

5. Conclusions

In conclusion, although glucose anaerobic degradation reduces the overall deformation of dense clay, it can promote the growth of evaporative cracks on its surface. Due to the action of hydrogen bonds, glucose can increase the water-holding capacity of clay, but its water-holding capacity gradually decreases with the anaerobic degradation of glucose in the clay. The degree of development of evaporative cracks in glucose-contaminated compacted clay increases gradually with the increase in anaerobic degradation time. The influence mechanism of anaerobic degradation of soluble sugar on clay evaporative cracking mainly includes “forming hydrogen bonds to reduce the rate of evaporative water loss in clay” and “generating CO2 to alter the structure of the clay”. In the early stage of degradation, “forming hydrogen bonds to reduce the rate of evaporative water loss in clay” is the dominant factor, while in the later stage of degradation, “generating CO2 to alter the structure of the clay” is the dominant factor.
This paper mainly focuses on experimental research on the highest and most representative carbohydrate pollutant (glucose) in domestic source pollution. Nonetheless, plenty of other organic compounds included in domestic pollution could potentially exert a noteworthy influence on the processes of evaporation, dehydration, and soil cracking. Furthermore, there may be a reciprocal encouragement or inhibition of mutual feedback effects, and the effects of various organic contaminants on soil evaporation and water loss can vary. As a result, there are certain limitations to this study, and more thorough investigation is required.

Author Contributions

Y.G.: methodology, formal analysis, investigation, validation, writing—original draft. L.C.: conceptualization, methodology, writing—review and editing, supervision, project administration, funding acquisition. Z.S.: methodology, formal analysis, validation, writing—review and editing. R.Z.: methodology, resources, writing—review and editing. All authors have read and agreed to the published version of the manuscript.

Funding

This research was funded by the National Natural Science Foundation of China (No. 42372309, 41972281, 41372326, 41072236), Jiangsu Funding Program for Excellent Postdoctoral Talent (2023ZB693), and the Fundamental Research Funds for the Central Universities (2023QN070).

Data Availability Statement

No new data were created or analyzed in this study. Data sharing is not applicable to this article.

Conflicts of Interest

The authors declare no conflict of interest.

References

  1. Feng, D.; Gong, J.; Ni, X.; Ren, J. Experimental and numerical analysis of soil cracking characteristics under evaporation. Math. Probl. Eng. 2021, 2021, 3790345. [Google Scholar] [CrossRef]
  2. Izzo, M.Z.; Mileti, M. Sustainable improvement of the crack resistance of cohesive soils. Sustainability 2019, 11, 5806. [Google Scholar] [CrossRef]
  3. Cheng, W.Q.; Bian, H.B.; Gao, Q.F.; Hattab, M. Experimental and Numerical Study of the Drying Process of a Consolidated Clay Soil. Adv. Civ. Eng. 2022, 2022, 1607963. [Google Scholar] [CrossRef]
  4. Hillel, D. Introduction to Environmental Soil Physics; Elsevier Academic Press: Amsterdam, The Netherlands, 2004. [Google Scholar]
  5. Yan, J.P.; Chen, X.Y.; Cai, Y.; Cheng, F.K.; Fan, T.Y. A review of genetic classification and characteristics of soil cracks. Open Geosci. 2021, 13, 1509–1522. [Google Scholar] [CrossRef]
  6. Tang, C.S.; Zhu, C.; Cheng, Q.; Zeng, H.; Xu, J.J.; Tian, B.G.; Shi, B. Desiccation cracking of soils: A review of investigation approaches, underlying mechanisms, and influencing factors. Earth-Sci. Rev. 2021, 216, 103586. [Google Scholar] [CrossRef]
  7. Morris, P.H.; Graham, J.; Wiliams, D.J. Cracking in drying soils. Can. Geotech. J. 1992, 29, 263–267. [Google Scholar] [CrossRef]
  8. Yin, Z.Z.; Yuan, J.P.; Wei, J.; Cao, X.S.; Liu, H.Q.; Xu, B. Influence of fissures on slope stability of expansive soil. Chin. J. Geotech. Eng. 2012, 34, 2155–2161. Available online: http://www.cgejournal.com/cn/article/id/14958 (accessed on 1 October 2023). (In Chinese).
  9. Albrecht, B.A.; Benson, C.H. Effect of desiccation on compacted natural clays. J. Geotech. Geoenvironmental Eng. 2001, 127, 67–75. [Google Scholar] [CrossRef]
  10. Ye, W.; Ma, F.H.; Hu, J.; Li, Z.Y. Seepage Behavior of an Inclined Wall Earth Dam under Fluctuating Drought and Flood Conditions. Geofluids 2018, 2018, 4734138. [Google Scholar] [CrossRef]
  11. Keller, A.A.; Roberts, P.V.; Blunt, M.J. Effect of fracture aperture variations on the dispersion of contaminants. Water Resour. Res. 1999, 35, 55–63. [Google Scholar] [CrossRef]
  12. Konrad, J.M.; Ayad, R. A idealized framework for the analysis of cohesive soils undergoing desiccation. Can. Geotech. J. 1997, 34, 477–488. [Google Scholar] [CrossRef]
  13. Zhang, S.H.; Yue, J.W.; Huang, X.J.; Zhao, L.M.; Wang, Z.F. Study on Cracking Law of Earthen Soil under Dry Shrinkage Condition. Materials 2022, 15, 8281. [Google Scholar] [CrossRef] [PubMed]
  14. Stewart, R.D.; Najm, M.R.A. Field measurements of soil cracks. Soil Sci. Soc. Am. J. 2020, 84, 1462–1476. [Google Scholar] [CrossRef]
  15. Lin, Z.Y.; Tang, C.S.; Zeng, H.; Wang, Y.S.; Cheng, Q.; Shi, B. Laboratory characterization and discrete element modeling of desiccation cracking behavior of soils under different boundary conditions. Chin. J. Geotech. Eng. 2020, 42, 372–380. (In Chinese) [Google Scholar] [CrossRef]
  16. Luo, Y.; Zhang, J.M.; Zhou, Z.; Chikhotkin, V.; Mi, M.; Shen, J. Evolution law of critical moisture content of soil cracking under rainfall-evaporation conditions. Rock Soil Mech. 2020, 41, 2592–2600. [Google Scholar] [CrossRef]
  17. Zeng, H.; Tang, C.S.; Cheng, Q.; Inyang, H.I.; Rong, D.Z.; Lin, L.; Shi, B. Coupling effects of interfacial friction and layer thickness on soil desiccation cracking behavior. Eng. Geol. 2019, 260, 105220. [Google Scholar] [CrossRef]
  18. Cordero, J.A.; Useche, G.; Prat, P.C.; Ledesma, A.; Santamarina, J.C. Soil desiccation cracks as a suction–contraction process. Géotechnique Lett. 2017, 7, 272–278. [Google Scholar] [CrossRef]
  19. Yesiller, N.; Miller, C.J.; Inci, G.; Yaldo, K. Desiccation and cracking behavior of three compacted landfill liner soils. Eng. Geol. 2000, 57, 105–121. [Google Scholar] [CrossRef]
  20. Lakshmikantha, M.R.; Prat, P.C.; Ledesma, A. Experimental evidence of size effect in soil cracking. Can. Geotech. J. 2012, 49, 264–284. [Google Scholar] [CrossRef]
  21. An, N.; Tang, C.S.; Xu, S.K.; Gong, X.P.; Shi, B.; Inyang, H.I. Effects of soil characteristics on moisture evaporation. Eng. Geol. 2018, 239, 126–135. [Google Scholar] [CrossRef]
  22. Cheng, Q.; Tang, C.S.; Chen, Z.G.; EI-Maarry, M.R.; Zeng, H.; Shi, B. Tensile behavior of clayey soils during desiccation cracking process. Eng. Geol. 2020, 279, 105909. [Google Scholar] [CrossRef]
  23. Tang, C.S.; Cui, Y.J.; Tang, A.M.; Shi, B. Experiment evidence on the temperature dependence of desiccation cracking behavior of clayey soils. Eng. Geol. 2010, 114, 261–266. [Google Scholar] [CrossRef]
  24. Omar, H.; Rohani, S. Treatment of landfill waste, leachate and landfill gas: A review. Front. Chem. Sci. Eng. 2015, 9, 15–32. [Google Scholar] [CrossRef]
  25. Mojiri, A.; Zhou, J.L.; Ratnaweera, H.; Ohashi, A.; Ozaki, N.; Kindaichi, T.; Asakura, H. Treatment of landfill leachate with different techniques: An overview. Water Reuse 2021, 11, 66–96. [Google Scholar] [CrossRef]
  26. Gülser, C.; Minkina, T.; Sushkova, S.; Kızılkaya, R. Changes of soil hydraulic properties during the decomposition of organic waste in a coarse textured soil. J. Geochem. Explor. 2017, 174, 66–69. [Google Scholar] [CrossRef]
  27. Matthews, A.M.; Portwood, A.M.; Armstrong, A.C.; Leeds-Harrison, P.B.; Harris, G.L.; Catt, J.A.; Addiscott, T.M. CRACK-NP, development of a model for predicting pollutant transport in cracking clay soils. Soil Use Manag. 2006, 16, 279–284. [Google Scholar] [CrossRef]
  28. Hafid, H.S.; Rahman, N.A.A.; Mokhtar, M.N.; Talib, A.T.; Baharuddin, A.S.; Shah, U.K.M. Over production of fermentable sugar for bioethanol production from carbohydrate-rich Malaysian food waste via sequential acid-enzymatic hydrolysis pretreatment. Waste Manag. 2017, 67, 95–105. [Google Scholar] [CrossRef]
  29. Jeckelmann, J.M.; Erni, B. Transporters of glucose and other carbohydrates in bacteria. Pflügers Arch. Eur. J. Physiol. 2020, 472, 1129–1153. [Google Scholar] [CrossRef]
  30. Mclnerneg, M.J.; Bryant, M.P. Biomass Conversion Processes for Energy and Fuels; Plenum Press: New York, NY, USA, 1980. [Google Scholar]
  31. Guo, Y.L.; Cao, L.W.; Sang, S.X.; Zhang, R. An experimental investigation on the effect of soluble sugar degradation on the of domestic-source-contaminated soil sites formation and evolution. Environ. Pollut. 2023, 316, 120613. [Google Scholar] [CrossRef]
  32. Luo, Y.Z.; Zhang, W.W.; Li, Y.Y.; Wang, Y.J.; Yao, H.Y.; Han, J.G. Sanitary landfill improved CNPS microbial functional gene abundance compared to non-sanitary landfill. J. Soils Sediments 2020, 20, 99–108. [Google Scholar] [CrossRef]
  33. Xiao, G.Y.; Ye, Z.M.; Xu, G.L.; Zeng, J.; Zhang, L. Temperature Effect on Crack Evolution of Red Clay in Guilin. Water 2021, 13, 3025. [Google Scholar] [CrossRef]
  34. Tang, C.S.; Shi, B.; Liu, C.; Zhao, L.Z.; Wang, B.J. Influencing factors of geometrical structure of surface shrinkage cracks in clayey soils. Eng. Geol. 2008, 101, 204–217. [Google Scholar] [CrossRef]
  35. Warnaka, K.; Pochop, L. Analyses of equations for free water evaporation estimates. Water Resour. Res. 1988, 24, 979–984. [Google Scholar] [CrossRef]
  36. Appels, L.; Baeyens, J.; Degrève, J.; Dewil, R. Principles and potential of the anaerobic digestion of waste-activated sludge. Prog. Energy Combust. Sci. 2008, 34, 755–781. [Google Scholar] [CrossRef]
  37. Li, D.D.; Zhang, S.W. The Influences of Sand Content and Particle Size on the Desiccation Cracks of Compacted Expansive Soil. Adv. Mater. Sci. Eng. 2021, 2021, 7752352. [Google Scholar] [CrossRef]
  38. Mu, Q.Y.; Meng, L.L.; Shen, Y.Q.; Zhou, C.; Gu, Z.L. Effects of clay content on the desiccation cracking behavior of low-plasticity soils. Bull. Eng. Geol. Environ. 2023, 82, 317. [Google Scholar] [CrossRef]
  39. Li, D.D.; Yang, B.B.; Gao, Z.L.; Sun, L.X. The effects of biomass ash on soil evaporation and cracking. Arab. J. Geosci. 2021, 14, 837. [Google Scholar] [CrossRef]
  40. Song, W.K.; Cui, Y.J.; Tang, A.M.; Ding, W.Q.; Wang, Q. Experimental study on water evaporation from compacted clay using environmental chamber. Can. Geotech. J. 2016, 53, 1293–1304. [Google Scholar] [CrossRef]
  41. Qi, W.; Zhang, Z.Y.; Wang, C. Desiccation and cracking behaviour of clay loam subjected to different irrigation methods during wetting–drying cycles. Eur. J. Soil Sci. 2020, 72, 793–809. [Google Scholar] [CrossRef]
  42. Wu, J.H.; Yuan, J.P.; Ng, C.W.W. Theoretical and experimental study of initial cracking mechanism of an expansive soil due to moisture-change. J. Cent. South Univ. 2012, 19, 1437–1446. [Google Scholar] [CrossRef]
  43. Kim, M.; Cho, A.E. The role of water molecules in stereoselectivity of glucose/galactose-binding protein. Sci. Rep. 2016, 6, 36807. [Google Scholar] [CrossRef] [PubMed]
  44. Tang, C.S.; Shi, B.; Cui, Y.J. Behaviors and mechanisms of desiccation cracking of soils. Chin. J. Geotech. Eng. 2018, 40, 1415–1423. [Google Scholar] [CrossRef]
  45. Tang, C.S.; Zhu, C.; Leng, T.; Shi, B.; Cheng, Q.; Zeng, H. Three-dimensional characterization of desiccation cracking behavior of compacted clayey soil using X-ray computed tomography. Eng. Geol. 2019, 255, 1–10. [Google Scholar] [CrossRef]
  46. Xu, X.H.; Xin, P.; Zhou, T.Z.; Yu, X.Y. Effects of Large Macropores on Saline Water Evaporation from Marsh Soil. Water Resour. Res. 2023, 59, e2022WR033276. [Google Scholar] [CrossRef]
  47. Chertkov, V.V. Modeling the pore structure and shrinkage curve of soil clay matrix. Geoderma 2000, 95, 215–246. [Google Scholar] [CrossRef]
Figure 1. Schematic diagram of degradation and transformation of carbohydrates from domestic organic matter.
Water 15 04180 g001
Figure 2. (a) Steps for preparing contaminated soil samples; (b) diagram of the experimental device.
Water 15 04180 g002
Figure 3. The experimental test time node.
Water 15 04180 g003
Figure 4. The processing flow of the image.
Water 15 04180 g004
Figure 5. Test flow of the anaerobic degradation process of glucose in clay.
Water 15 04180 g005
Figure 6. The variation curve of evaporation water content reduction with time (concentration): (a) Water content reduction—Anaerobic degradation time; (b) water content reduction—glucose concentration in soil.
Water 15 04180 g006
Figure 7. Variation curve of height and radial shrinkage of compacted clay with concentration after evaporation drying: (a) The height of the evaporated soil sample—Glucose concentration in clay; (b) The surface shrinkage rate of the evaporated soil sample—Glucose concentration in clay.
Water 15 04180 g007
Figure 8. The relationship curves of evaporation: apparent crack ratio, apparent shrinkage ratio of dense clay, and evaporation time.
Water 15 04180 g008
Figure 9. Development mode of evaporation crack intersections in dense clay.
Water 15 04180 g009
Figure 10. The maximum crack images in the evaporation process of clay.
Water 15 04180 g010
Figure 11. The variation curves of the crack parameters of clay with time: (a) Average crack width and total crack length—anaerobic degradation time; (b) maximum crack ratio—anaerobic degradation time.
Water 15 04180 g011
Figure 12. A schematic diagram of crack growth and the development process of dense clay.
Water 15 04180 g012
Figure 13. Relationship curve of soil pH and organic matter content with time: (a) soil pH; (b) soil organic matter content.
Water 15 04180 g013
Figure 14. The schematic diagram of the mechanism of glucose anaerobic degradation in clay.
Water 15 04180 g014
Table 1. Properties of substances during the anaerobic degradation of glucose.
Type of Aqueous SolutionGlucosePyruvic AcidEthanolCarbonic AcidLactic Acid
Acidity and basicityAcidityAcidityNeutralAcidityAcidity
StabilityStableEasy to decomposeVolatileInstableIt can volatilize with superheated water vapor
Melting point/°C14611.8−114.116.8
Boiling point/°C527.116578.3122
Disclaimer/Publisher’s Note: The statements, opinions and data contained in all publications are solely those of the individual author(s) and contributor(s) and not of MDPI and/or the editor(s). MDPI and/or the editor(s) disclaim responsibility for any injury to people or property resulting from any ideas, methods, instructions or products referred to in the content.

