
Testing Zeolite and Palygorskite as a Potential Medium for Ammonium Recovery and Brewery Wastewater Treatment


Abstract
:1. Introduction
2. Materials and Methods
2.1. Artificial Wastewater and Brewery Wastewater
2.2. Adsorbents: Zeolite and Palygorskite Characterization
2.3. Batch Studies
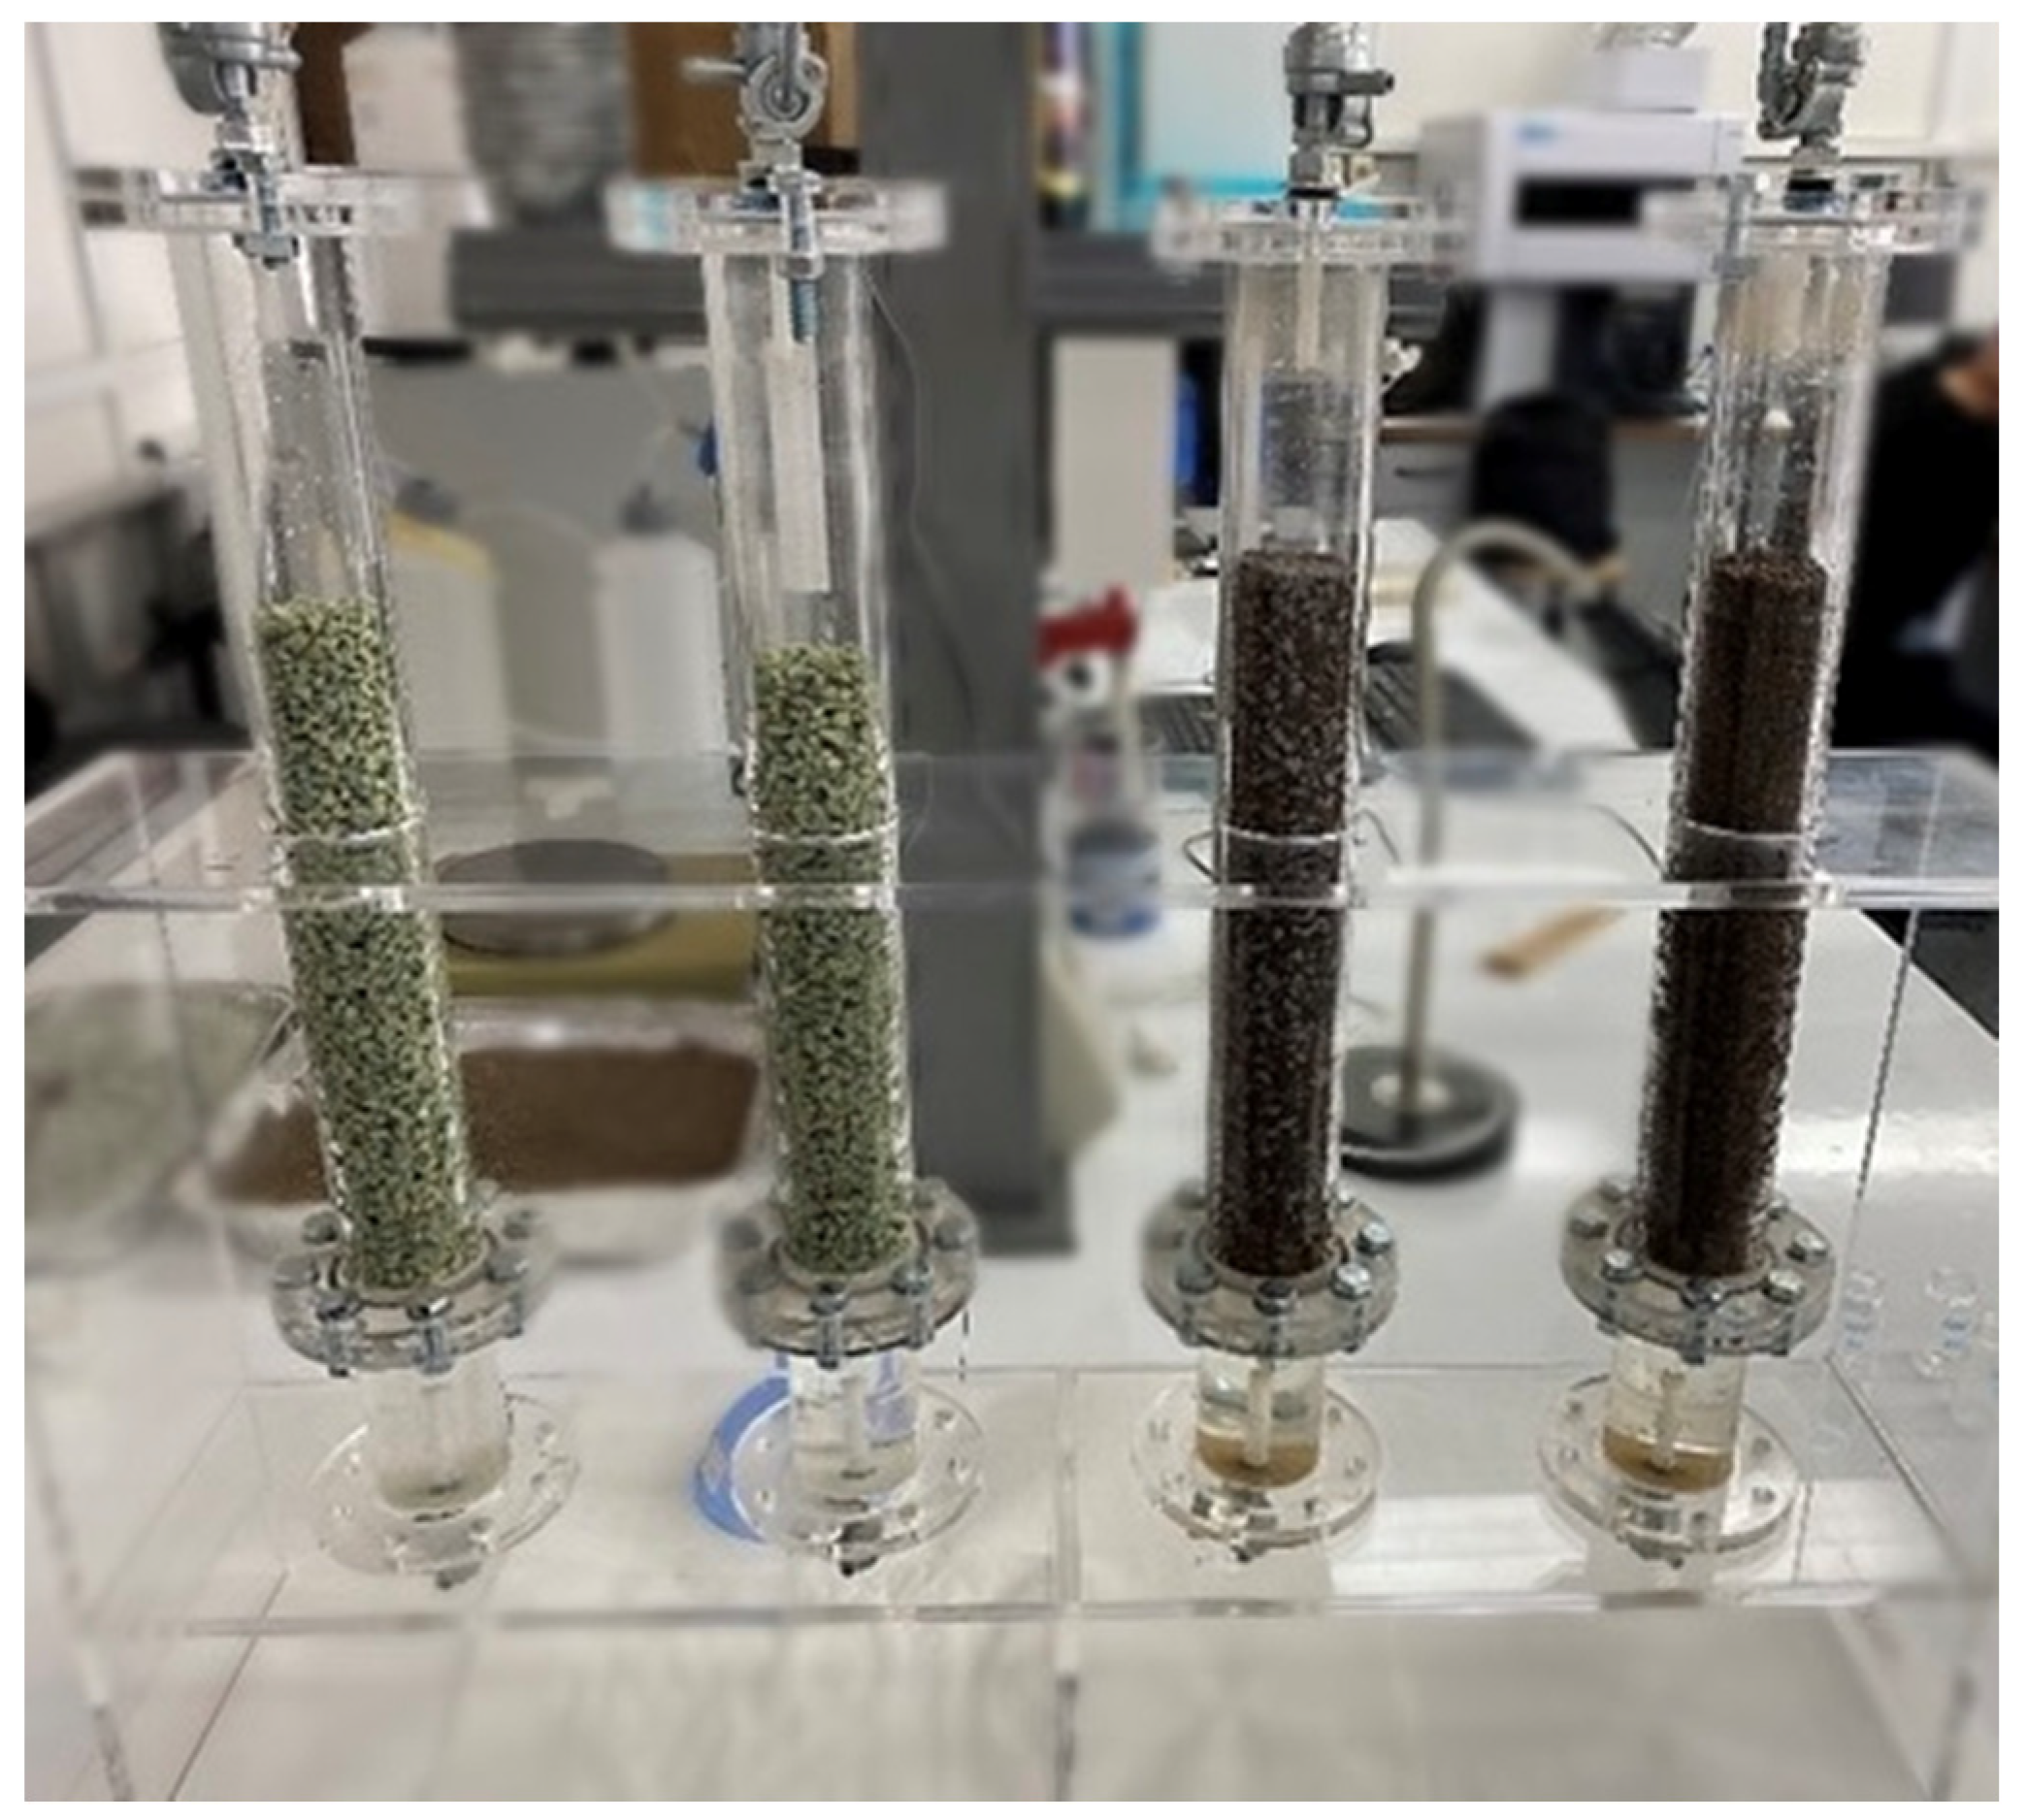
2.4. Column Studies
2.5. Adsorption Kinetics
2.6. Isothermal Adsorption
2.7. Desorption and Regeneration Experiments
3. Results & Discussion
3.1. Adsorption Batch Experiments
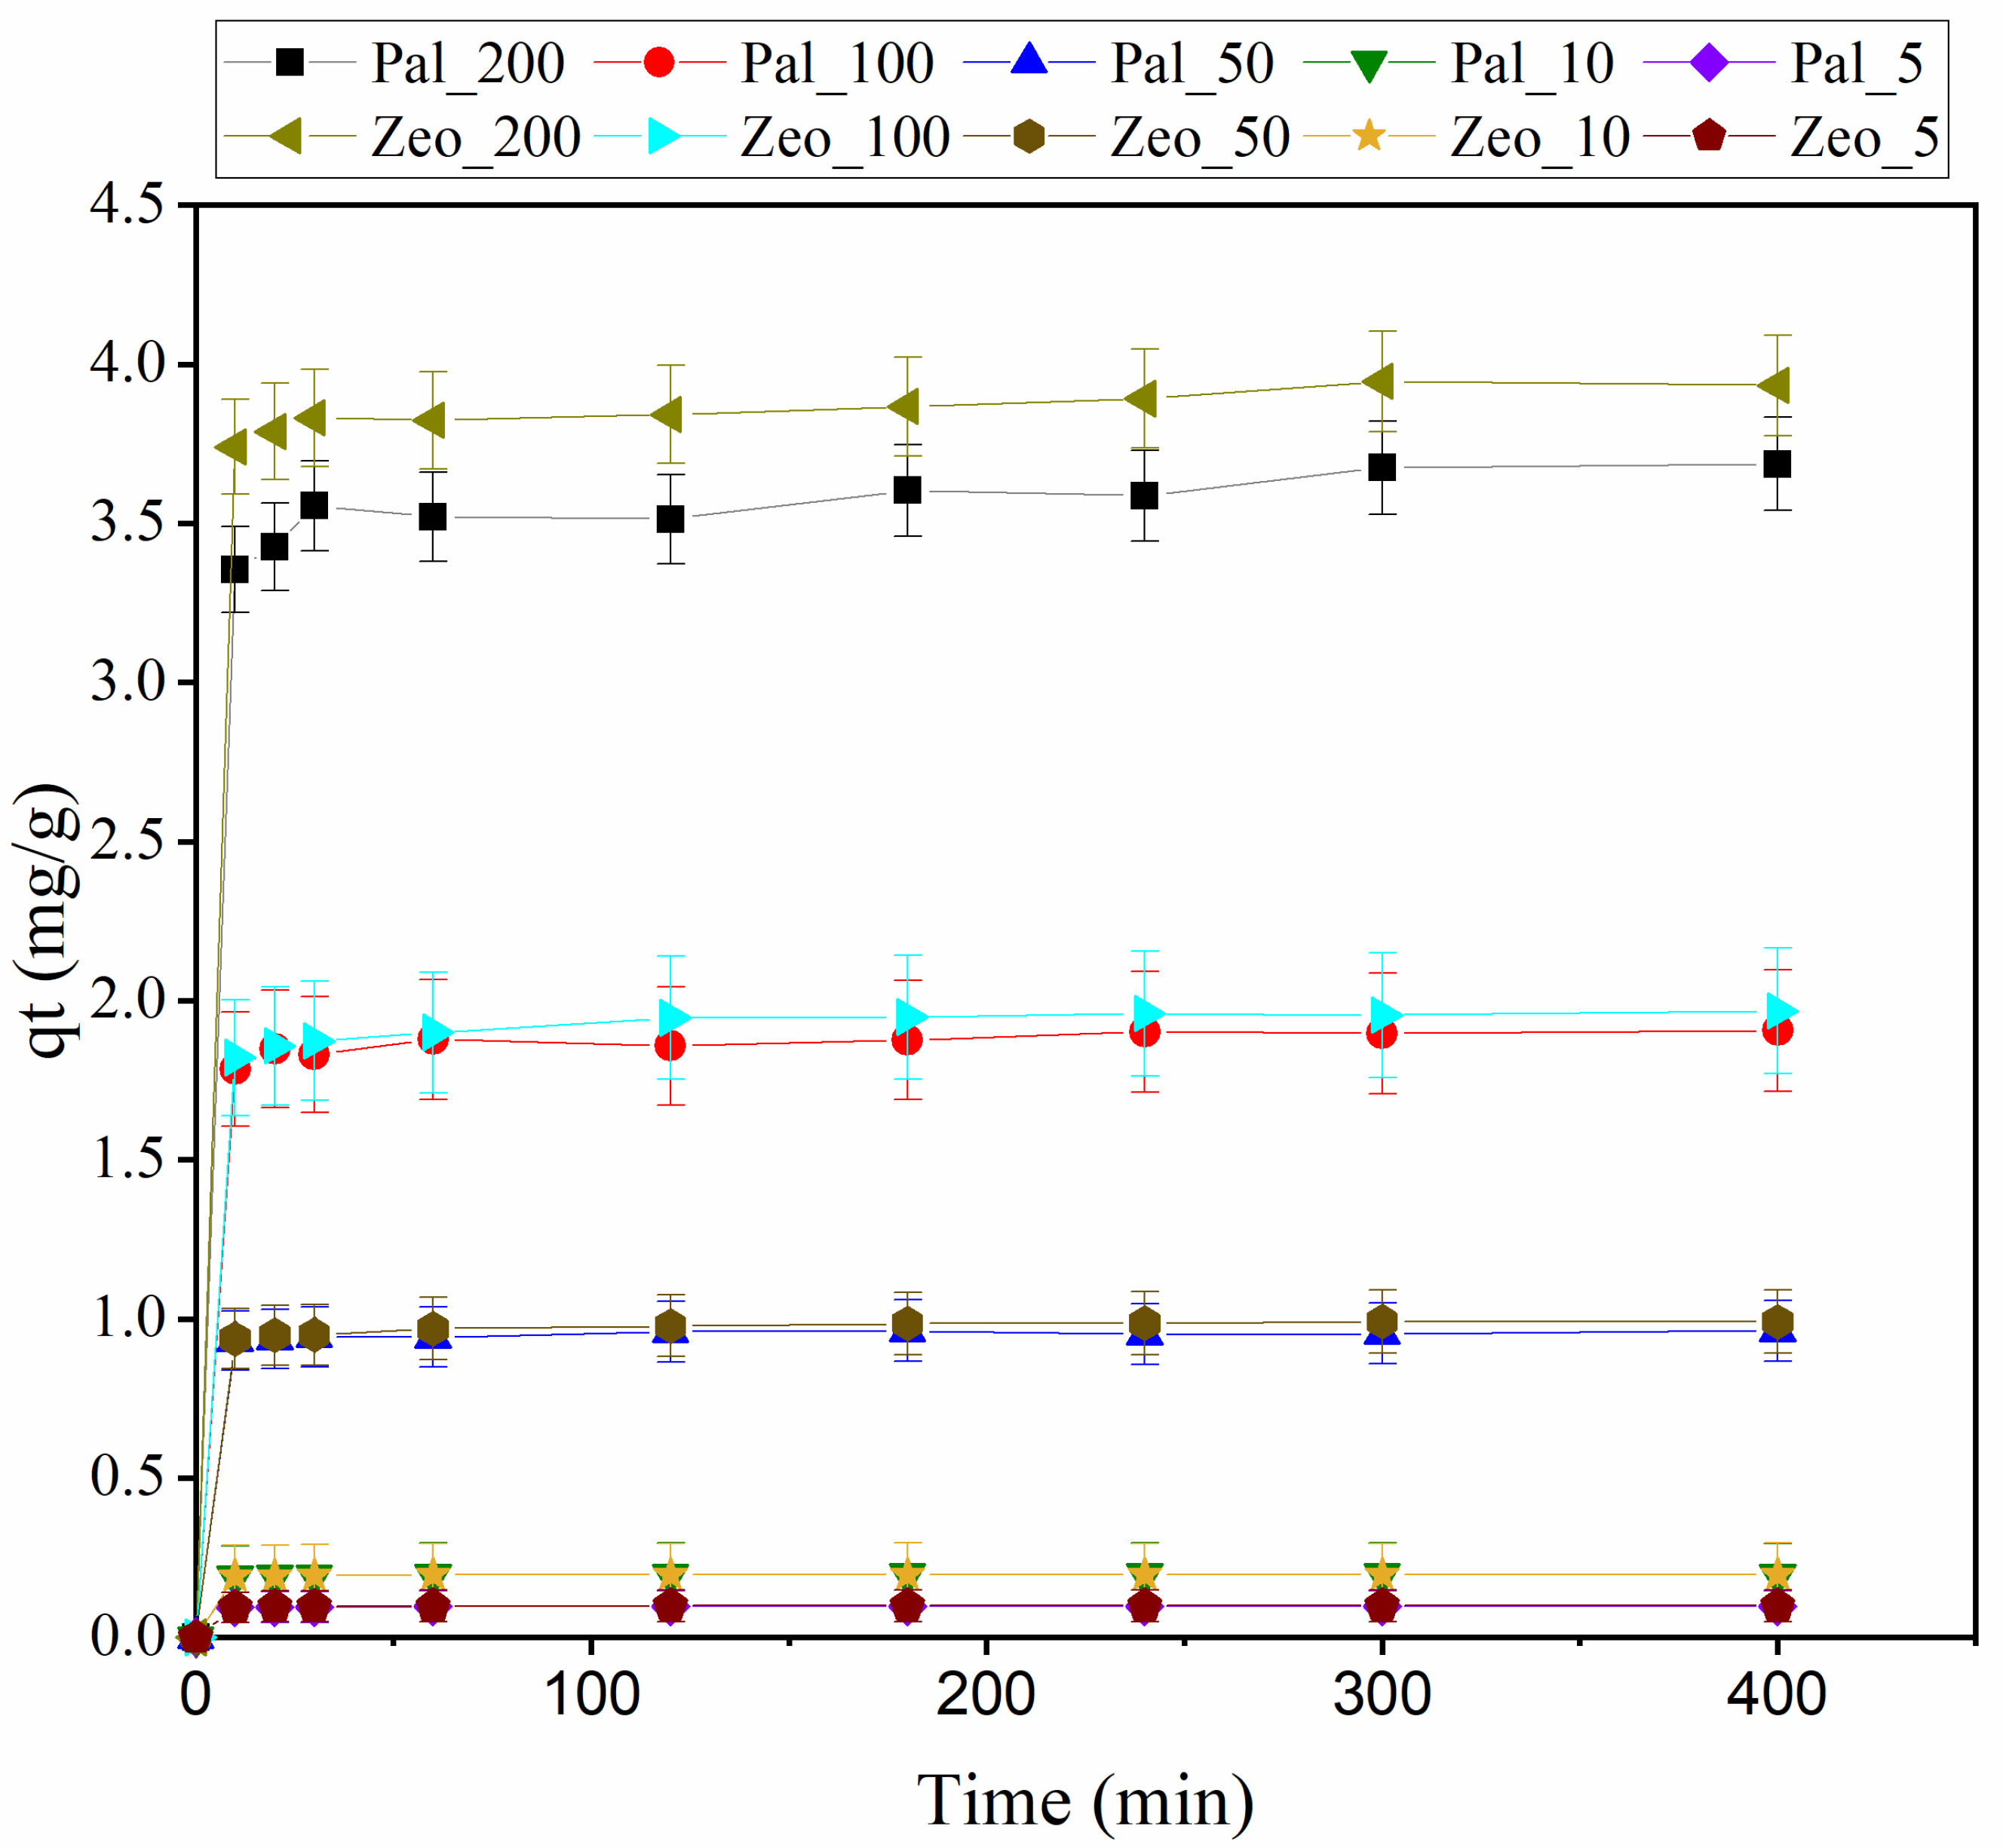
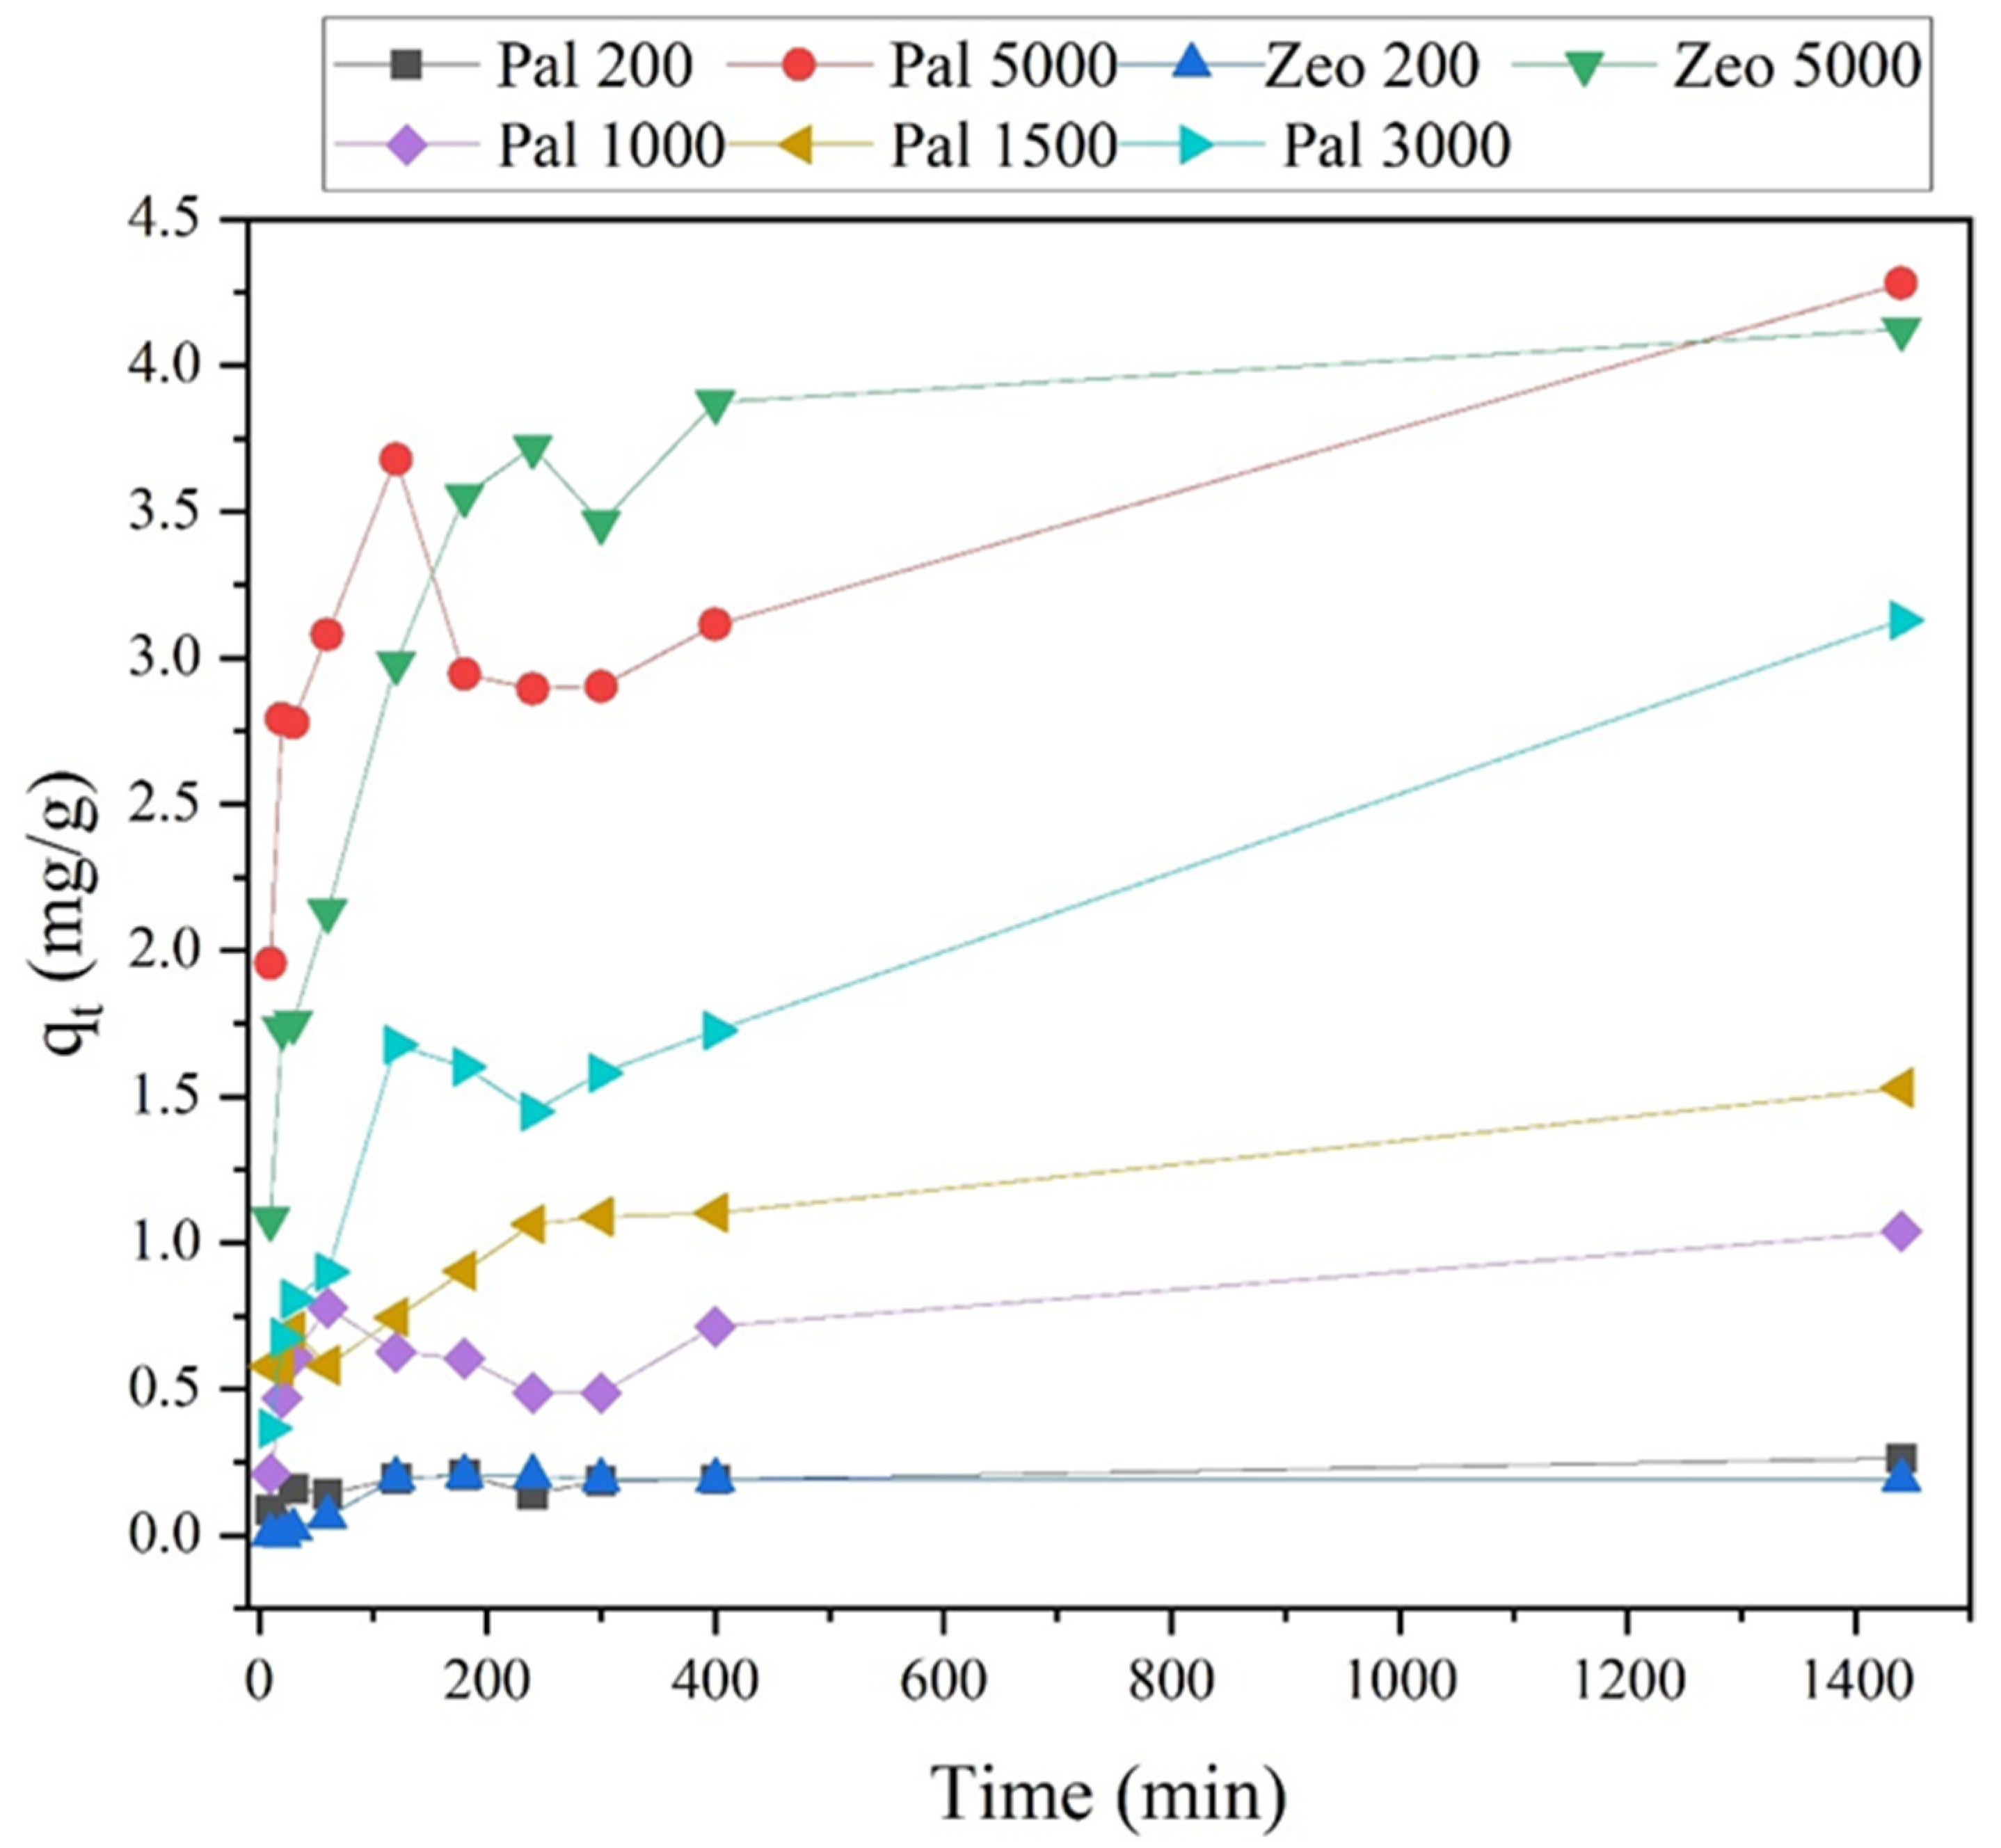
3.1.1. Effect of Particle Size and Initial Concentration
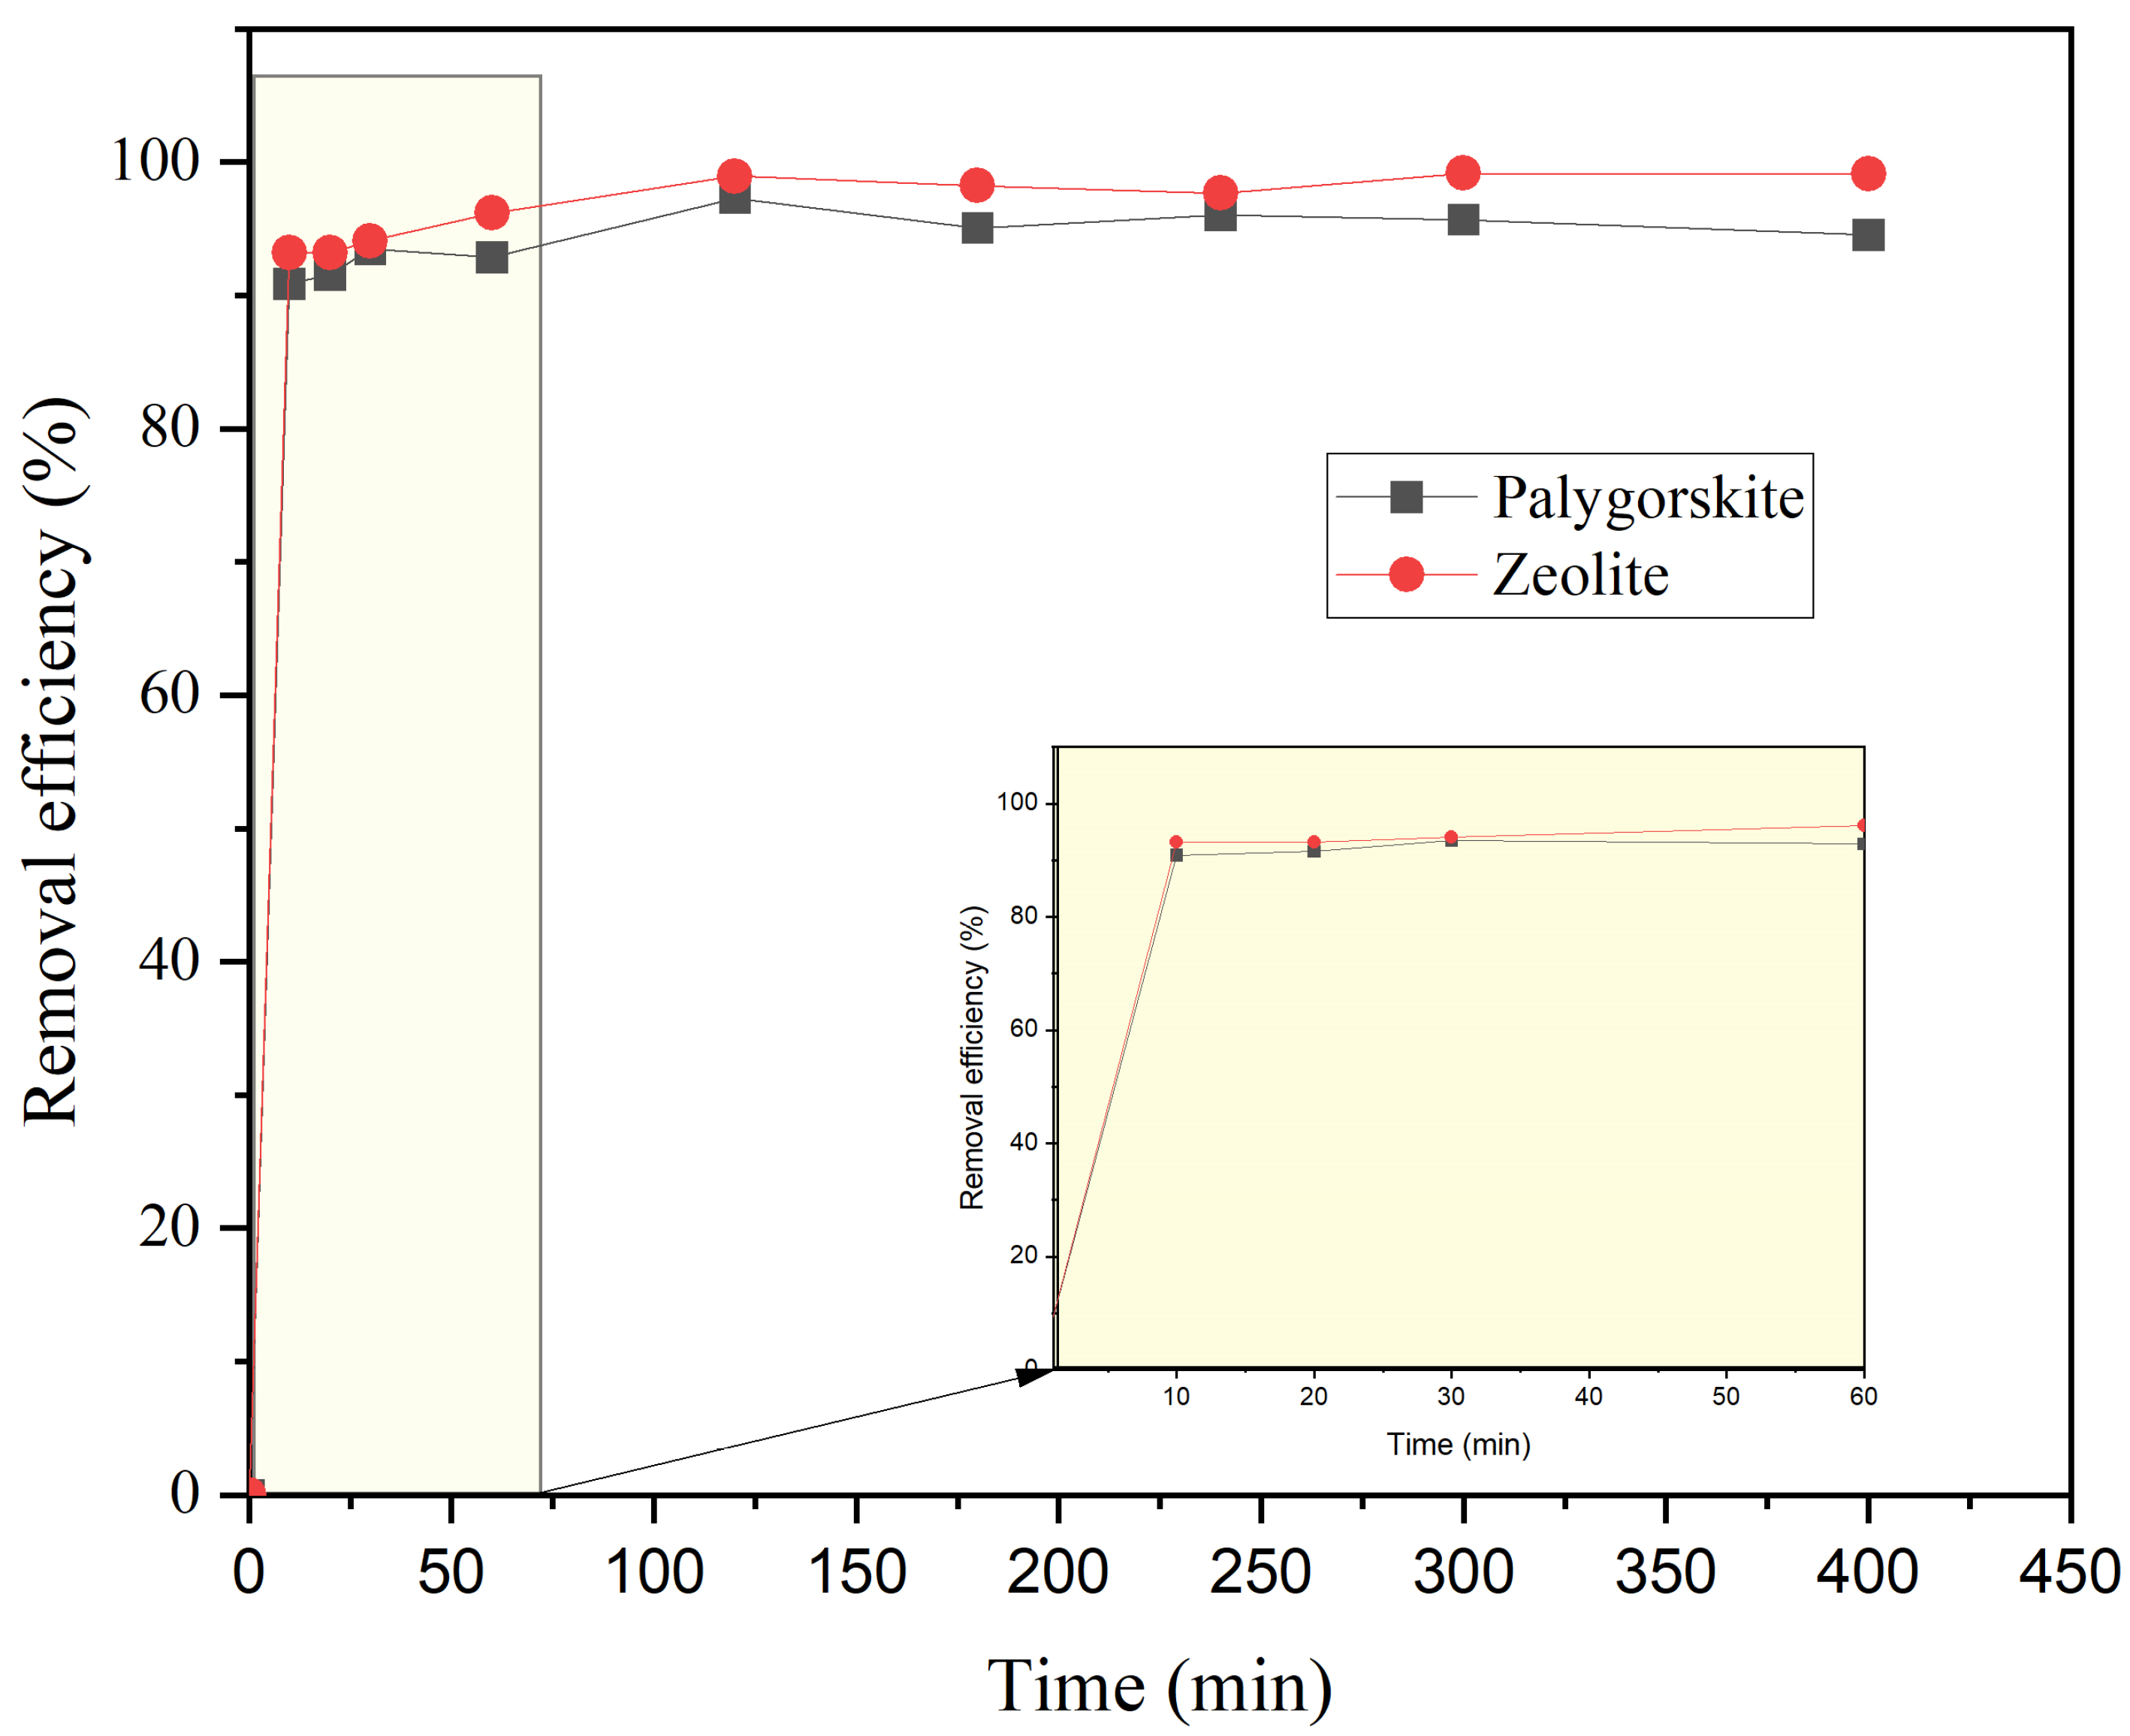
3.1.2. Equilibrium Time
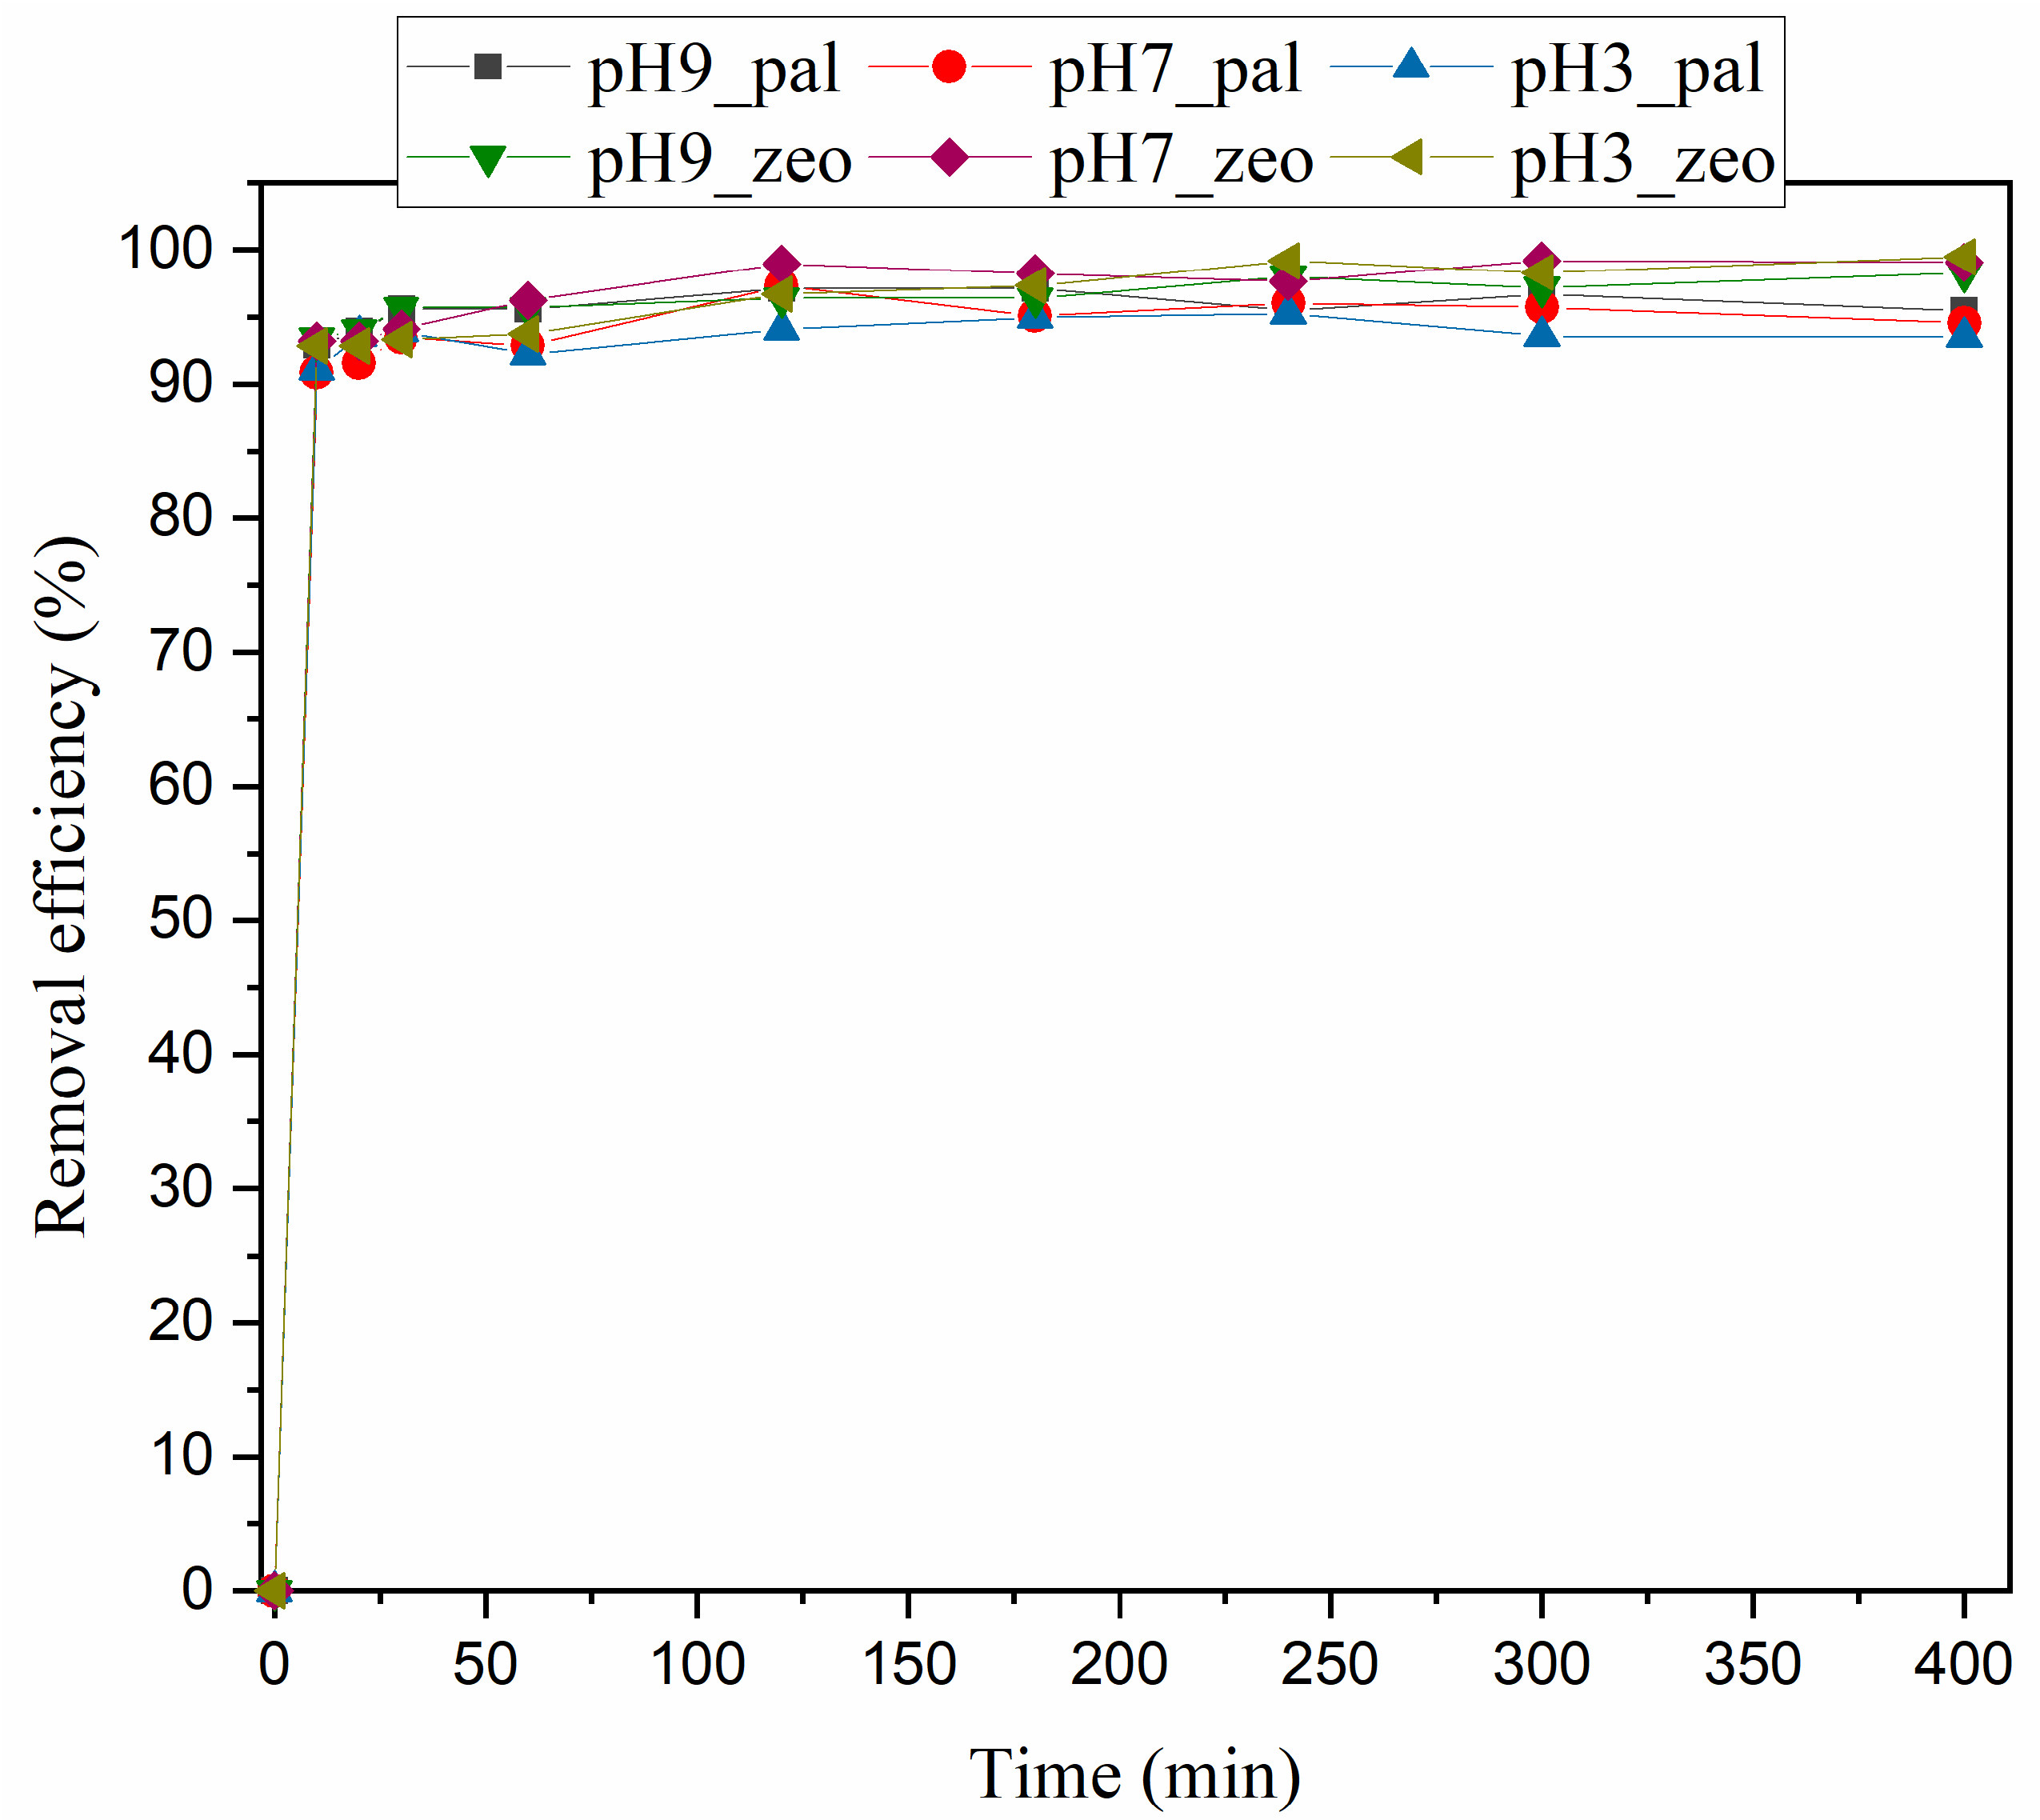
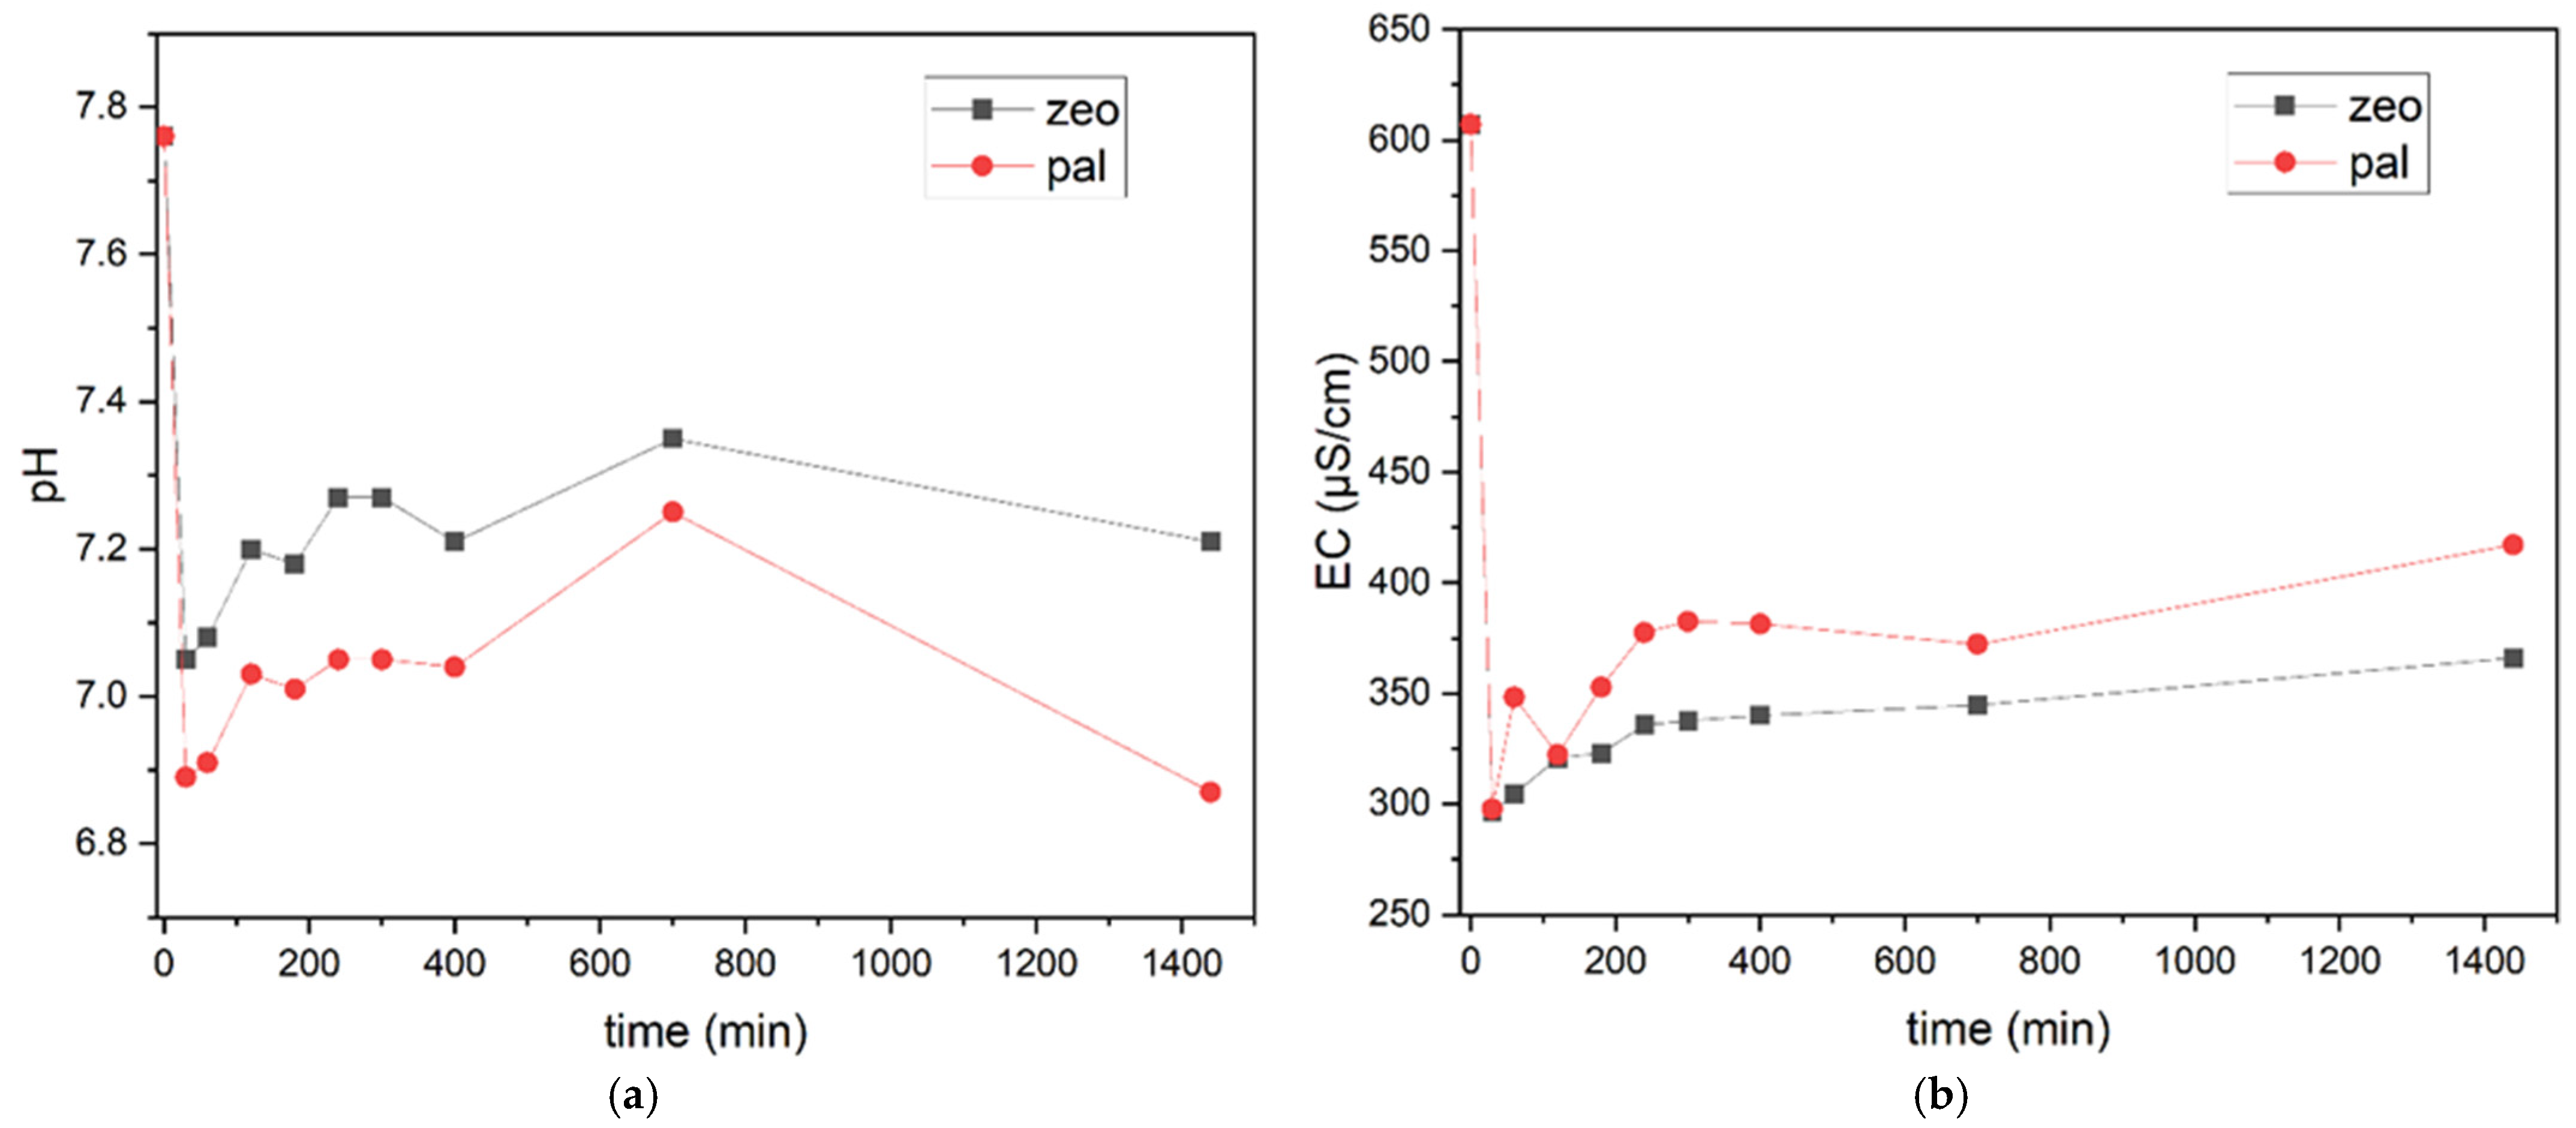
3.1.3. Effect of pH
3.1.4. Batch Kinetic Models
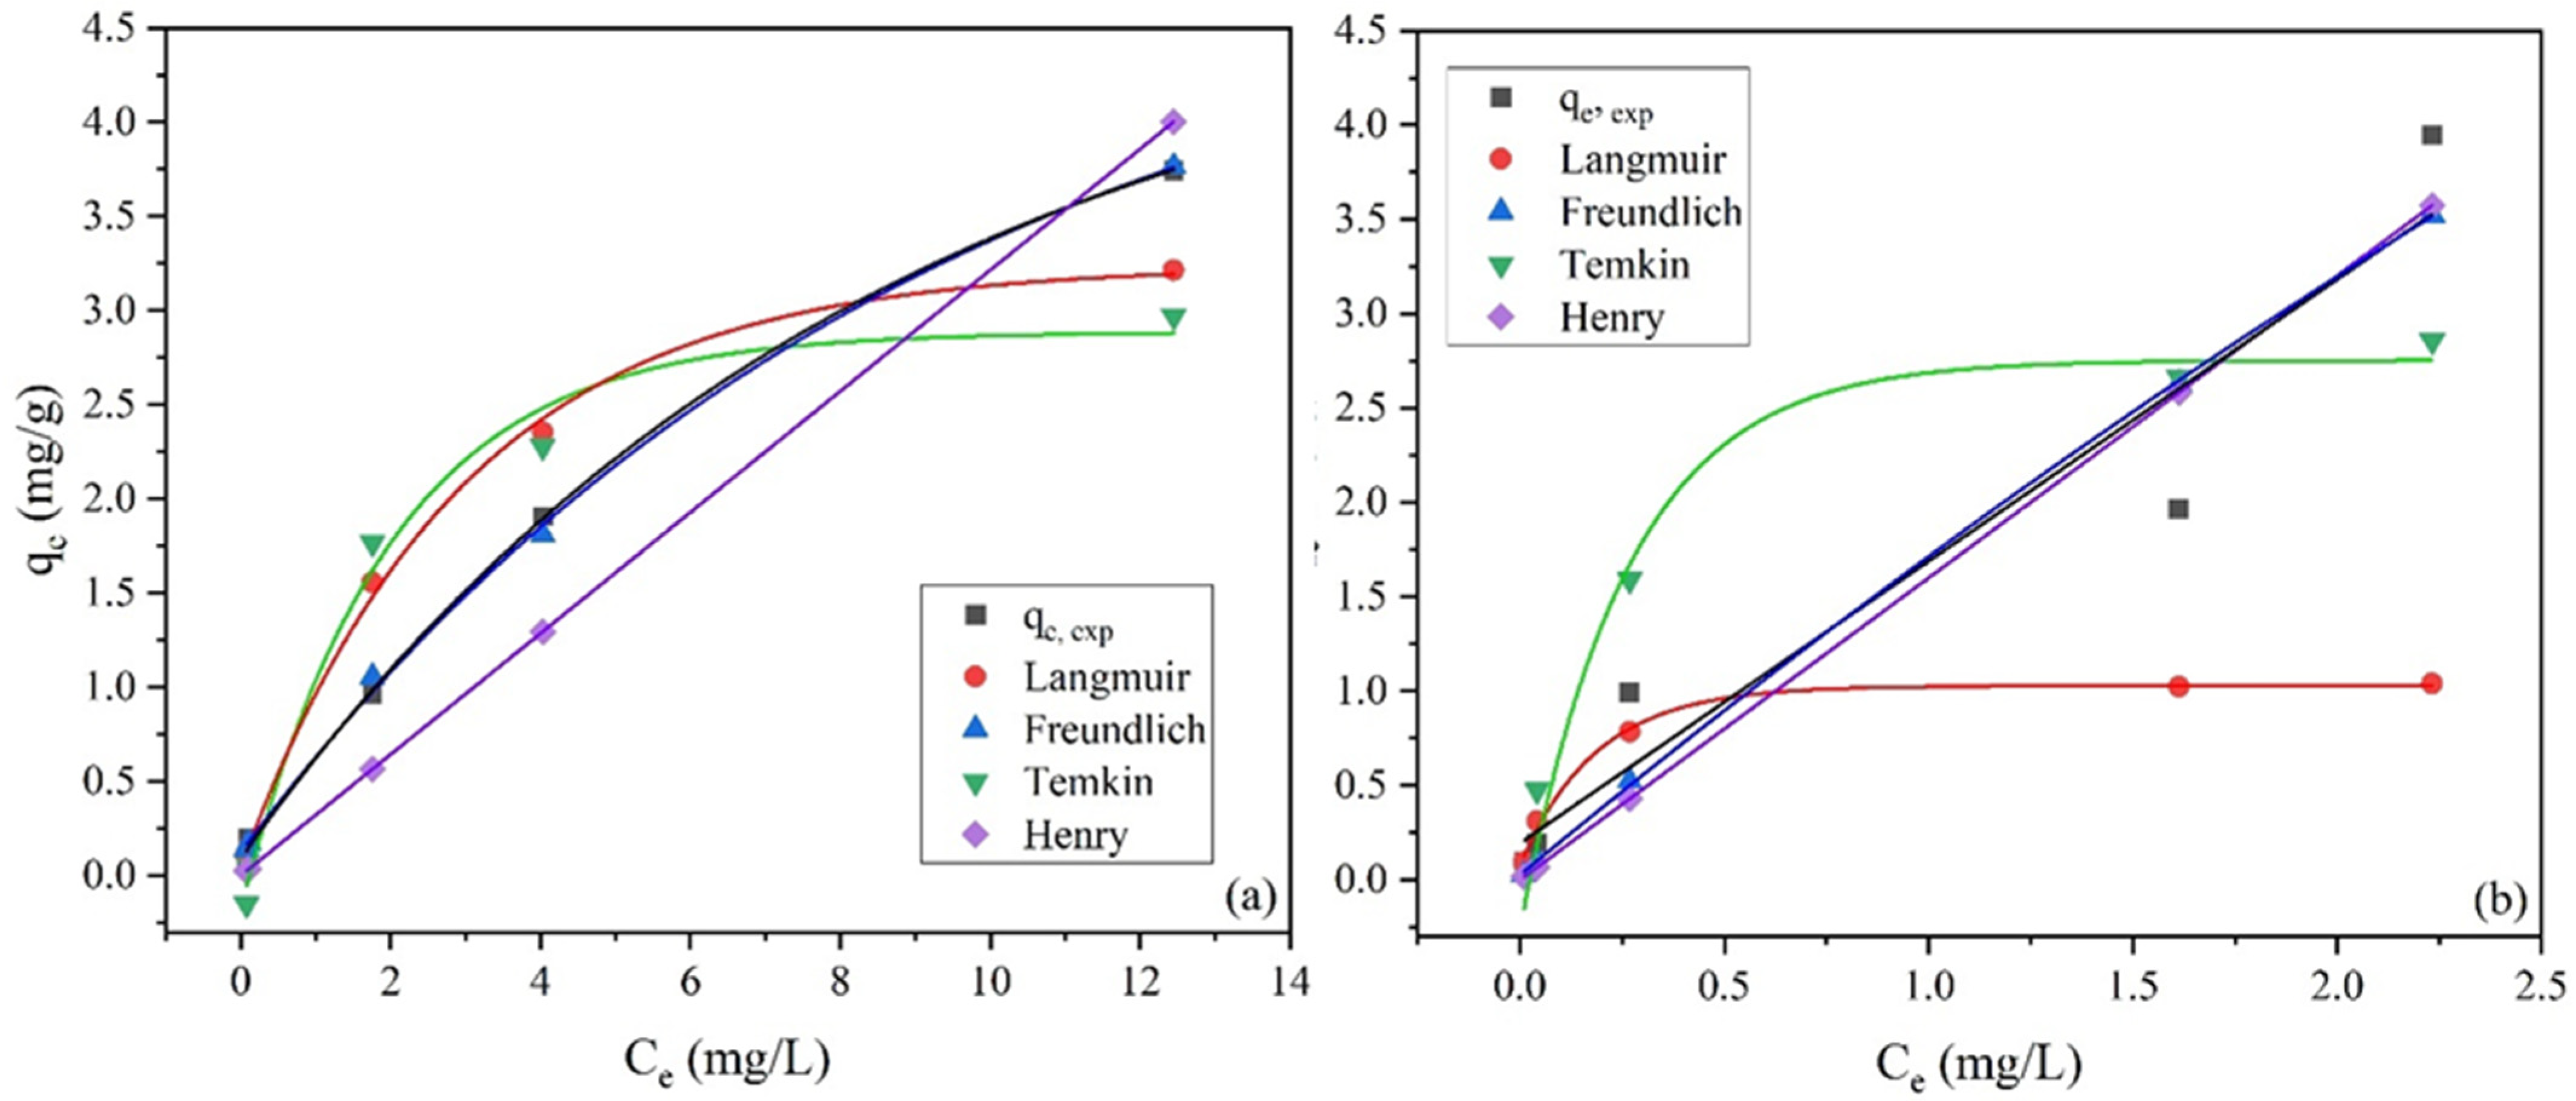
3.1.5. Batch Adsorption Isotherms
3.2. Column Studies
3.2.1. AWW Experiments
3.2.2. Column Kinetic Studies
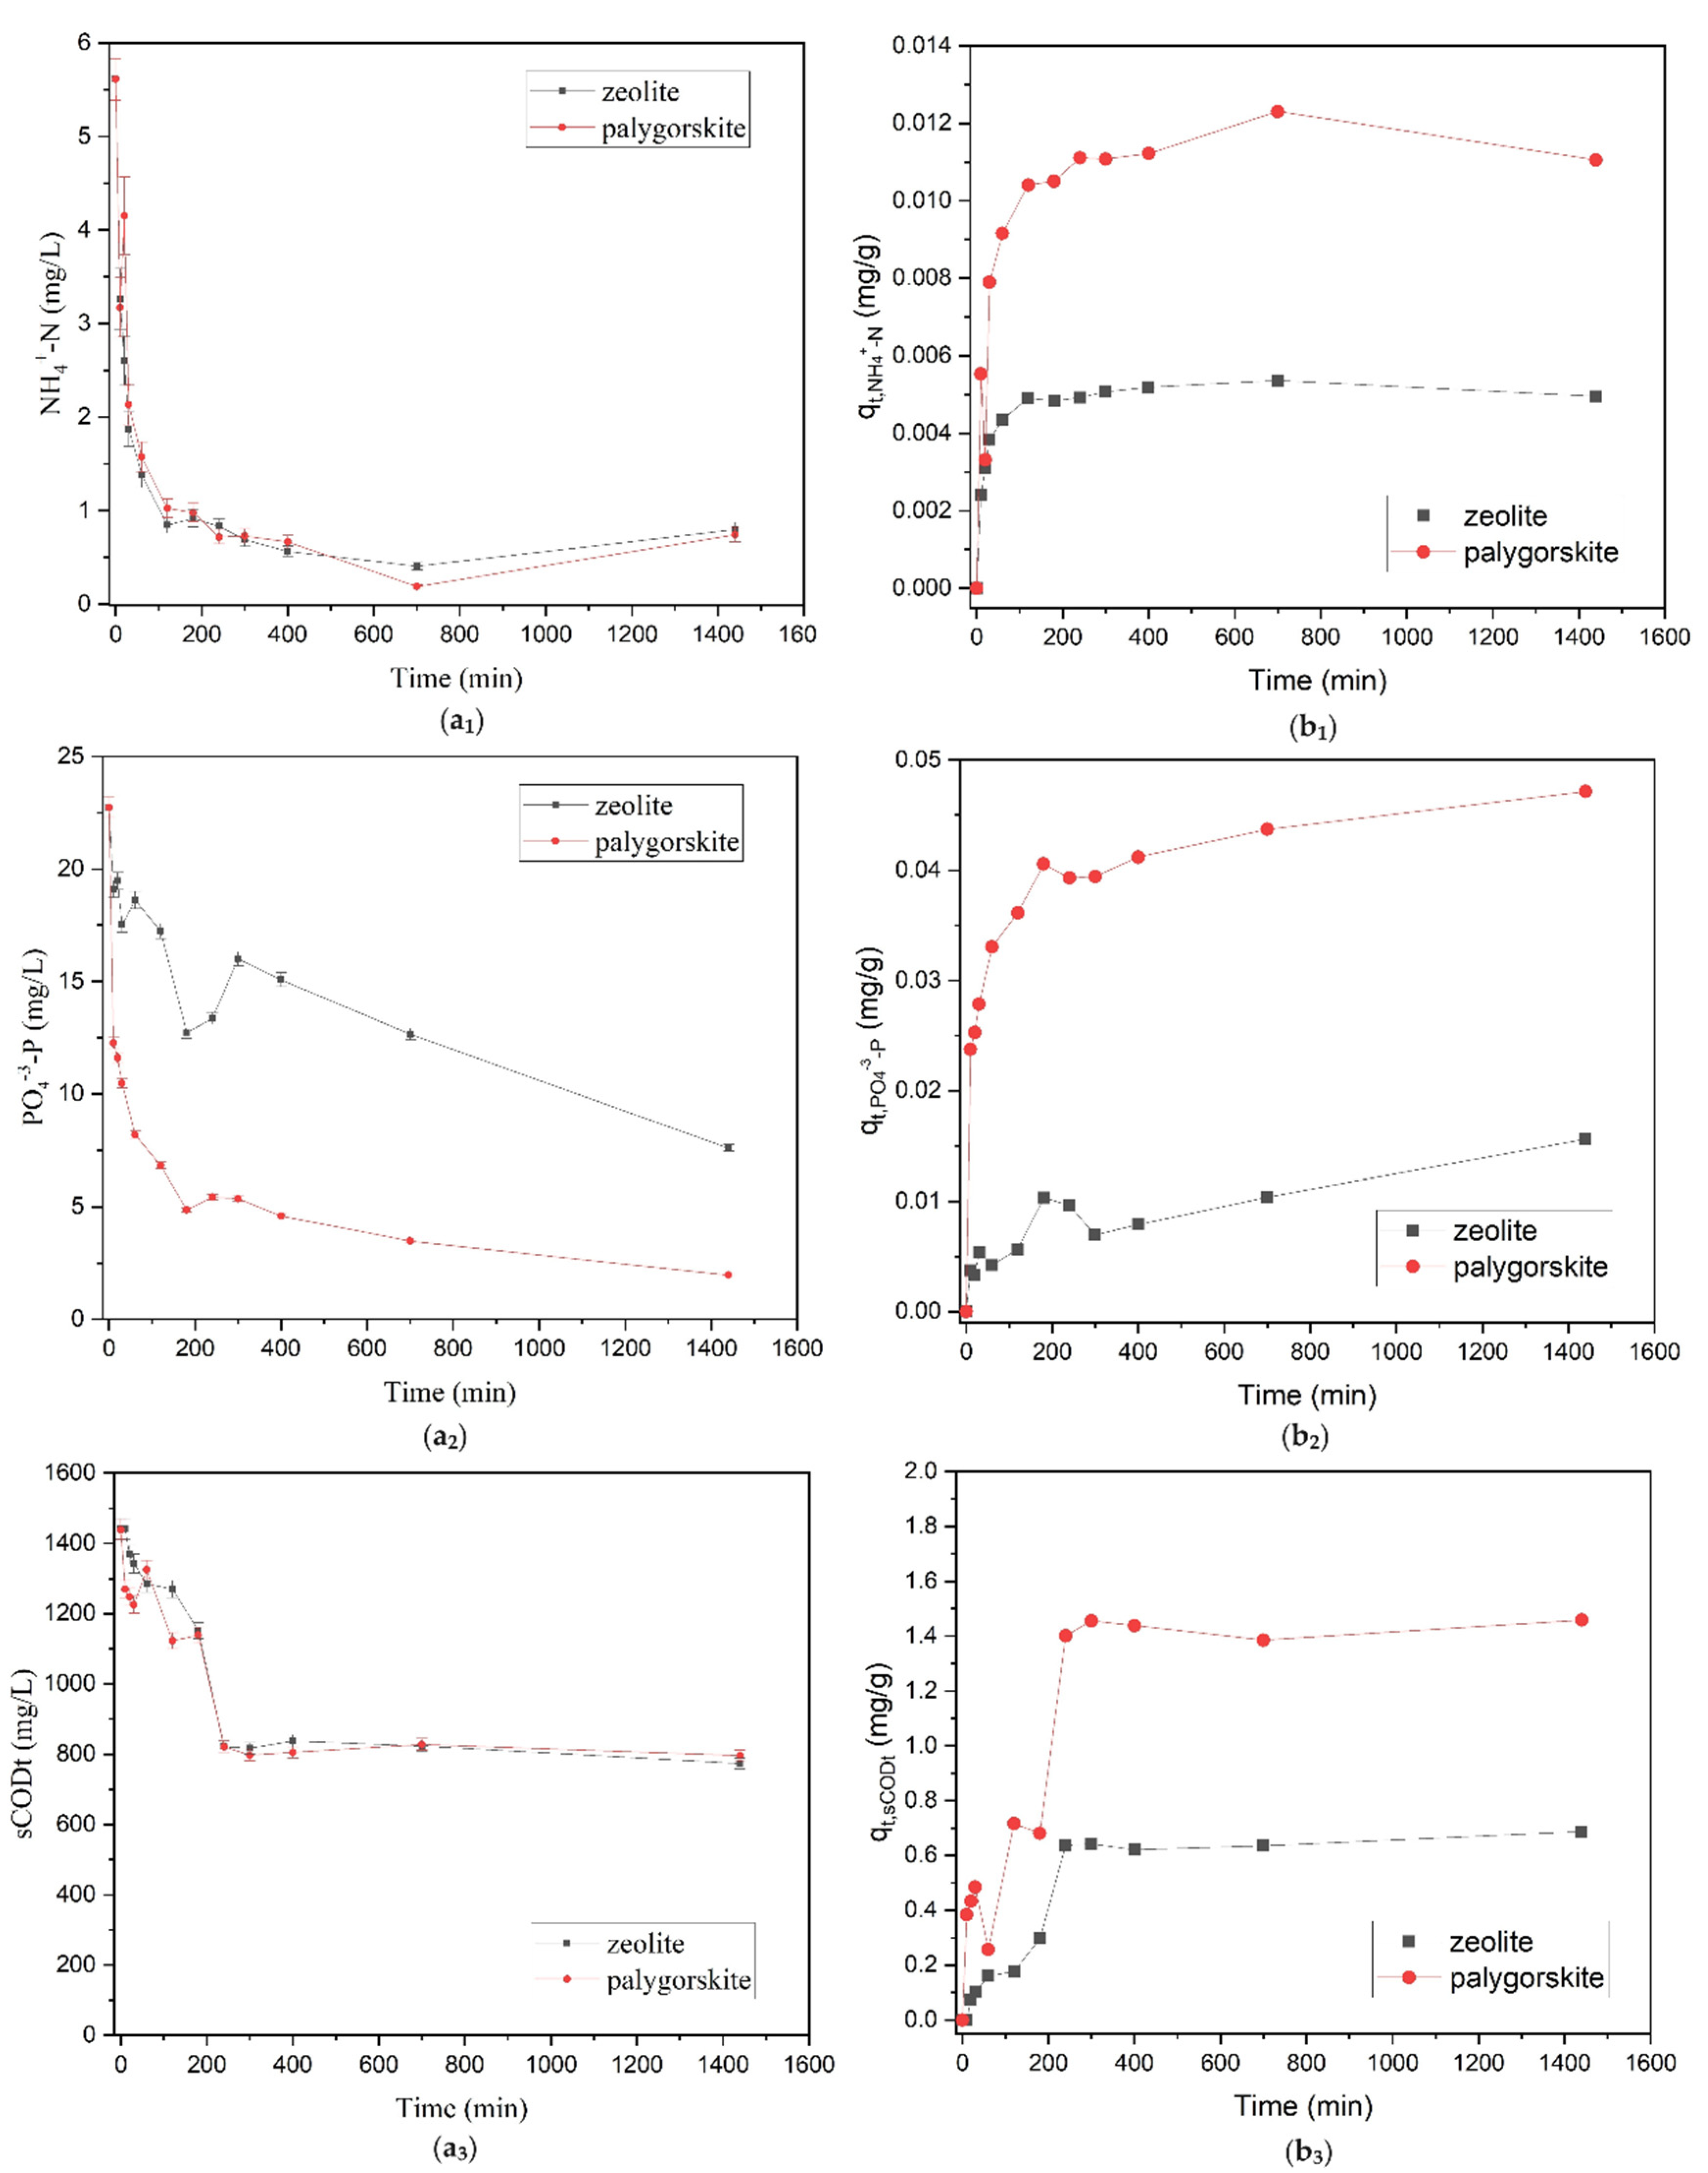
3.3. Brewery Wastewater Experiment
3.4. Desorption and Regeneration Experiments
4. Conclusions
Author Contributions
Funding
Data Availability Statement
Acknowledgments
Conflicts of Interest
Appendix A
Appendix A.1. Adsorption Kinetic Models
Appendix A.2. Isotherm Models
References
- Maria, M.P.; Torres, N.H.; Nascimento, V.R.S.; Chagas, T.S.A.; Saratale, G.D.; Mulla, S.I.; Bharagava, R.N.; Cavalcanti, E.B.; Romanholo Ferreira, L.F. Current Advances in the Brewery Wastewater Treatment from Anaerobic Digestion for Biogas Production: A Systematic Review. Environ. Adv. 2023, 13, 100394. [Google Scholar] [CrossRef]
- Othmani, A.; Magdouli, S.; Senthil Kumar, P.; Kapoor, A.; Chellam, P.V.; Gökkuş, Ö. Agricultural Waste Materials for Adsorptive Removal of Phenols, Chromium (VI) and Cadmium (II) from Wastewater: A Review. Environ. Res. 2022, 204, 111916. [Google Scholar] [CrossRef]
- Sillero, L.; Solera, R.; Perez, M. Effect of Temperature and Bagasse Addition on Anaerobic Co-Digestion of Brewery Waste by Biochemical Methane Potential Test. Fuel 2024, 357, 129737. [Google Scholar] [CrossRef]
- Organization for Economic Co-operation and Development (OECD). Health Data; Organization for Economic Co-Operation and Development (OECD): Paris, France, 2005.
- Braeken, L.; Van Der Bruggen, B.; Vandecasteele, C. Regeneration of Brewery Waste Water Using Nanofiltration. Water Res. 2004, 38, 3075–3082. [Google Scholar] [CrossRef] [PubMed]
- Fillaudeau, L.; Blanpain-Avet, P.; Daufin, G. Water, Wastewater and Waste Management in Brewing Industries. J. Clean. Prod. 2006, 14, 463–471. [Google Scholar] [CrossRef]
- Kanagachandran, K.; Jayaratne, R. Utilization Potential of Brewery Waste Water Sludge as an Organic Fertilizer. J. Inst. Brew. 2006, 112, 92–96. [Google Scholar] [CrossRef]
- Alayu, E.; Leta, S. Post Treatment of Anaerobically Treated Brewery Effluent Using Pilot Scale Horizontal Subsurface Flow Constructed Wetland System. Bioresour. Bioprocess. 2021, 8, 8. [Google Scholar] [CrossRef]
- Brewers of Europe European Beer Trends Statistics Report|2022 Edition. Available online: https://brewersofeurope.eu/european-beer-trends-2022-edition-and-previous-years/ (accessed on 20 September 2023).
- Simate, G.S.; Cluett, J.; Iyuke, S.E.; Musapatika, E.T.; Ndlovu, S.; Walubita, L.F.; Alvarez, A.E. The Treatment of Brewery Wastewater for Reuse: State of the Art. Desalination 2011, 273, 235–247. [Google Scholar] [CrossRef]
- Ashraf, A.; Ramamurthy, R.; Rene, E.R. Wastewater Treatment and Resource Recovery Technologies in the Brewery Industry: Current Trends and Emerging Practices. Sustain. Energy Technol. Assess. 2021, 47, 101432. [Google Scholar] [CrossRef]
- Zacharof, M.-P. Industrial Symbiosis: Beer Brewery Wastewater-Based Biorefinery. Circ. Econ. Sust. 2021, 1, 593–609. [Google Scholar] [CrossRef]
- Chen, J.; Ying, G.-G.; Wei, X.-D.; Liu, Y.-S.; Liu, S.-S.; Hu, L.-X.; He, L.-Y.; Chen, Z.-F.; Chen, F.-R.; Yang, Y.-Q. Removal of Antibiotics and Antibiotic Resistance Genes from Domestic Sewage by Constructed Wetlands: Effect of Flow Configuration and Plant Species. Sci. Total Environ. 2016, 571, 974–982. [Google Scholar] [CrossRef]
- Demeke, M.; Gabbiye, N. Organic Biofertilizer from Brewery Wastewater Sludges via Aerobic Composting Process. In Advances of Science and Technology; Habtu, N.G., Ayele, D.W., Fanta, S.W., Admasu, B.T., Bitew, M.A., Eds.; Lecture Notes of the Institute for Computer Sciences, Social Informatics and Telecommunications Engineering; Springer International Publishing: Cham, Switzerland, 2020; Volume 308, pp. 3–15. ISBN 978-3-030-43689-6. [Google Scholar]
- Alayu, E.; Leta, S. Evaluation of Irrigation Suitability Potential of Brewery Effluent Post Treated in a Pilot Horizontal Subsurface Flow Constructed Wetland System: Implications for Sustainable Urban Agriculture. Heliyon 2021, 7, e07129. [Google Scholar] [CrossRef] [PubMed]
- Rousseau, D.P.L.; Vanrolleghem, P.A.; De Pauw, N. Model-Based Design of Horizontal Subsurface Flow Constructed Treatment Wetlands: A Review. Water Res. 2004, 38, 1484–1493. [Google Scholar] [CrossRef] [PubMed]
- Ghosh, D.; Gopal, B. Effect of Hydraulic Retention Time on the Treatment of Secondary Effluent in a Subsurface Flow Constructed Wetland. Ecol. Eng. 2010, 36, 1044–1051. [Google Scholar] [CrossRef]
- Weerakoon, G.; Jinadasa, K.; Herath, G.; Mowjood, M.; Ng, W. Applicability of Constructed Wetlands for Water Quality Improvement in a Tea Estate Catchment: The Pussellawa Case Study. Water 2018, 10, 332. [Google Scholar] [CrossRef]
- Alayu, E.; Leta, S. Performance Efficiency and Water Quality Index of a Two-Stage Horizontal Subsurface Flow Constructed Wetland System Polishing Anaerobically Treated Brewery Effluent. J. Water Process Eng. 2021, 42, 102156. [Google Scholar] [CrossRef]
- Vymazal, J. Removal of Nutrients in Various Types of Constructed Wetlands. Sci. Total Environ. 2007, 380, 48–65. [Google Scholar] [CrossRef] [PubMed]
- Nan, X.; Lavrnić, S.; Toscano, A. Potential of Constructed Wetland Treatment Systems for Agricultural Wastewater Reuse under the EU Framework. J. Environ. Manag. 2020, 275, 111219. [Google Scholar] [CrossRef] [PubMed]
- Li, J.; Zheng, B.; Chen, X.; Li, Z.; Xia, Q.; Wang, H.; Yang, Y.; Zhou, Y.; Yang, H. The Use of Constructed Wetland for Mitigating Nitrogen and Phosphorus from Agricultural Runoff: A Review. Water 2021, 13, 476. [Google Scholar] [CrossRef]
- Dordio, A.V.; Carvalho, A.J.P. Organic Xenobiotics Removal in Constructed Wetlands, with Emphasis on the Importance of the Support Matrix. J. Hazard. Mater. 2013, 252–253, 272–292. [Google Scholar] [CrossRef]
- Zijun, Z.; Effeney, G.; Millar, G.J.; Stephen, M. Synthesis and Cation Exchange Capacity of Zeolite W from Ultra-Fine Natural Zeolite Waste. Environ. Technol. Innov. 2021, 23, 101595. [Google Scholar] [CrossRef]
- Wangi, G.M.; Olupot, P.W.; Byaruhanga, J.; Kulabako, R. Characterization of Natural Zeolite and Determination of Its Ion-Exchange Potential for Selected Metal Ions in Water. Environ. Process. 2023, 10, 53. [Google Scholar] [CrossRef]
- Sethia, G.; Somani, R.S.; Chand Bajaj, H. Adsorption of Carbon Monoxide, Methane and Nitrogen on Alkaline Earth Metal Ion Exchanged Zeolite-X: Structure, Cation Position and Adsorption Relationship. RSC Adv. 2015, 5, 12773–12781. [Google Scholar] [CrossRef]
- Stefanakis, A.I.; Akratos, C.S.; Gikas, G.D.; Tsihrintzis, V.A. Effluent Quality Improvement of Two Pilot-Scale, Horizontal Subsurface Flow Constructed Wetlands Using Natural Zeolite (Clinoptilolite). Microporous Mesoporous Mater. 2009, 124, 131–143. [Google Scholar] [CrossRef]
- Wang, S.; Gainey, L.; Wang, X.; Mackinnon, I.D.R.; Xi, Y. Influence of Palygorskite on In-Situ Thermal Behaviours of Clay Mixtures and Properties of Fired Bricks. Appl. Clay Sci. 2022, 216, 106384. [Google Scholar] [CrossRef]
- Murray, H.H. Traditional and New Applications for Kaolin, Smectite, and Palygorskite: A General Overview. Appl. Clay Sci. 2000, 17, 207–221. [Google Scholar] [CrossRef]
- Krekeler, M.P.S.; Kearns, L.E. A New Locality of Palygorskite-Rich Clay from the Southeastern Yucatán: A Potential Material Source for Environmental Applications. Environ. Geol. 2009, 58, 715–726. [Google Scholar] [CrossRef]
- Zeng, Y.; Xu, W.; Wang, H.; Zhao, D.; Ding, H. Nitrogen and Phosphorus Removal Efficiency and Denitrification Kinetics of Different Substrates in Constructed Wetland. Water 2022, 14, 1757. [Google Scholar] [CrossRef]
- Cyrus, J.S.; Reddy, G.B. Sorption and Desorption of Ammonium by Zeolite: Batch and Column Studies. J. Environ. Sci. Health Part A 2011, 46, 408–414. [Google Scholar] [CrossRef]
- Kong, L.; Tian, Y.; Li, N.; Liu, Y.; Zhang, J.; Zhang, J.; Zuo, W. Highly-Effective Phosphate Removal from Aqueous Solutions by Calcined Nano-Porous Palygorskite Matrix with Embedded Lanthanum Hydroxide. Appl. Clay Sci. 2018, 162, 507–517. [Google Scholar] [CrossRef]
- Baird, R.; Eaton, A.; Rice, E. Standard Methods for the Examination of Water and Wastewater, 23rd ed.; American Public Health Association: Washington, DC, USA, 2017. [Google Scholar]
- Kotoulas, A.; Agathou, D.; Triantaphyllidou, I.; Tatoulis, T.; Akratos, C.; Tekerlekopoulou, A.; Vayenas, D. Zeolite as a Potential Medium for Ammonium Recovery and Second Cheese Whey Treatment. Water 2019, 11, 136. [Google Scholar] [CrossRef]
- Rocha, L.C.C.; Zuquette, L.V. Evaluation of Zeolite as a Potential Reactive Medium in a Permeable Reactive Barrier (PRB): Batch and Column Studies. Geosciences 2020, 10, 59. [Google Scholar] [CrossRef]
- Patel, H. Review on Solvent Desorption Study from Exhausted Adsorbent. J. Saudi Chem. Soc. 2021, 25, 101302. [Google Scholar] [CrossRef]
- Muscarella, S.M.; Badalucco, L.; Cano, B.; Laudicina, V.A.; Mannina, G. Ammonium Adsorption, Desorption and Recovery by Acid and Alkaline Treated Zeolite. Bioresour. Technol. 2021, 341, 125812. [Google Scholar] [CrossRef] [PubMed]
- Genethliou, C.; Triantaphyllidou, I.E.; Giannakis, D.; Papayianni, M.; Sygellou, L.; Tekerlekopoulou, A.G.; Koutsoukos, P.; Vayenas, D.V. Simultaneous Removal of Ammonium Nitrogen, Dissolved Chemical Oxygen Demand and Color from Sanitary Landfill Leachate Using Natural Zeolite. J. Hazard. Mater. 2021, 406, 124679. [Google Scholar] [CrossRef] [PubMed]
- Malamis, S.; Katsou, E. A Review on Zinc and Nickel Adsorption on Natural and Modified Zeolite, Bentonite and Vermiculite: Examination of Process Parameters, Kinetics and Isotherms. J. Hazard. Mater. 2013, 252–253, 428–461. [Google Scholar] [CrossRef] [PubMed]
- Gianni, E.; Lazaratou, C.V.; Panagopoulos, G.; Sarantari, P.; Martsouka, F.; Papagiannopoulos, K.; Panagiotaras, D.; Papoulis, D. Raw and Modified Palygorskite in Water Treatment Applications for Low-concentration Ammonium Removal. Water Environ. Res. 2021, 93, 1979–1994. [Google Scholar] [CrossRef] [PubMed]
- Genethliou, C.; Lazaratou, C.V.; Triantaphyllidou, I.E.; Xanthaki, E.; Mourgkogiannis, N.; Sygellou, L.; Tekerlekopoulou, A.G.; Koutsoukos, P.; Vayenas, D.V. Adsorption Studies Using Natural Palygorskite for the Treatment of Real Sanitary Landfill Leachate. J. Environ. Chem. Eng. 2022, 10, 108545. [Google Scholar] [CrossRef]
- Widiastuti, N.; Wu, H.; Ang, H.M.; Zhang, D. Removal of Ammonium from Greywater Using Natural Zeolite. Desalination 2011, 277, 15–23. [Google Scholar] [CrossRef]
- Alshameri, A.; He, H.; Zhu, J.; Xi, Y.; Zhu, R.; Ma, L.; Tao, Q. Adsorption of Ammonium by Different Natural Clay Minerals: Characterization, Kinetics and Adsorption Isotherms. Appl. Clay Sci. 2018, 159, 83–93. [Google Scholar] [CrossRef]
- Martin, M.J.; Thottathil, S.E.; Newman, T.B. Antibiotics Overuse in Animal Agriculture: A Call to Action for Health Care Providers. Am. J. Public Health 2015, 105, 2409–2410. [Google Scholar] [CrossRef]
- Sundhararasu, E.; Runtti, H.; Kangas, T.; Pesonen, J.; Lassi, U.; Tuomikoski, S. Column Adsorption Studies for the Removal of Ammonium Using Na-Zeolite-Based Geopolymers. Resources 2022, 11, 119. [Google Scholar] [CrossRef]
- Rozic, M. Ammoniacal Nitrogen Removal from Water by Treatment with Clays and Zeolites. Water Res. 2000, 34, 3675–3681. [Google Scholar] [CrossRef]
- Leyva-Ramos, R.; Aguilar, G.; Gonzalez-Gutierrez, L.V. Ammonia Exchange on Clinoptilolite from Mineral Deposites Located in Mexico. J. Chem. Technol. Biotechnol. 2004, 79, 651–657. [Google Scholar] [CrossRef]
- Aydın Temel, F.; Kuleyin, A. Ammonium Removal from Landfill Leachate Using Natural Zeolite: Kinetic, Equilibrium, and Thermodynamic Studies. Desalin. Water Treat. 2016, 57, 23873–23892. [Google Scholar] [CrossRef]
- Saltalı, K.; Sarı, A.; Aydın, M. Removal of Ammonium Ion from Aqueous Solution by Natural Turkish (Yıldızeli) Zeolite for Environmental Quality. J. Hazard. Mater. 2007, 141, 258–263. [Google Scholar] [CrossRef] [PubMed]
- Xie, S.; Wen, Z.; Zhan, H.; Jin, M. An Experimental Study on the Adsorption and Desorption of Cu(II) in Silty Clay. Geofluids 2018, 2018, 3610921. [Google Scholar] [CrossRef]
- Tang, H.; Xu, X.; Wang, B.; Lv, C.; Shi, D. Removal of Ammonium from Swine Wastewater Using Synthesized Zeolite from Fly Ash. Sustainability 2020, 12, 3423. [Google Scholar] [CrossRef]
- Liao, P.; Yuan, S.; Xie, W.; Zhang, W.; Tong, M.; Wang, K. Adsorption of Nitrogen-Heterocyclic Compounds on Bamboo Charcoal: Kinetics, Thermodynamics, and Microwave Regeneration. J. Colloid Interface Sci. 2013, 390, 189–195. [Google Scholar] [CrossRef]
- Sheela, T.; Nayaka, Y.A.; Viswanatha, R.; Basavanna, S.; Venkatesha, T.G. Kinetics and Thermodynamics Studies on the Adsorption of Zn(II), Cd(II) and Hg(II) from Aqueous Solution Using Zinc Oxide Nanoparticles. Powder Technol. 2012, 217, 163–170. [Google Scholar] [CrossRef]
- Uğurlu, M.; Karaoğlu, M.H. Adsorption of Ammonium from an Aqueous Solution by Fly Ash and Sepiolite: Isotherm, Kinetic and Thermodynamic Analysis. Microporous Mesoporous Mater 2011, 139, 173–178. [Google Scholar] [CrossRef]
- Saleh, T.A. Chapter 3—Kinetic Models and Thermodynamics of Adsorption Processes: Classification. In Interface Science and Technology; Elsevier: Amsterdam, The Netherlands, 2022; pp. 65–97. [Google Scholar] [CrossRef]
- Sahoo, T.R.; Prelot, B. Chapter 7—Adsorption Processes for the Removal of Contaminants from Wastewater: The Perspective Role of Nanomaterials and Nanotechnology. In Micro and Nano Technologies, Nanomaterials for the Detection and Removal of Wastewater Pollutants; Elsevier: Amsterdam, The Netherlands, 2020; pp. 161–222. [Google Scholar] [CrossRef]
- Delkash, M.; Ebrazi Bakhshayesh, B.; Kazemian, H. Using Zeolitic Adsorbents to Cleanup Special Wastewater Streams: A Review. Microporous Mesoporous Mater. 2015, 214, 224–241. [Google Scholar] [CrossRef]
- Carazo, E.; Borrego-Sánchez, A.; García-Villén, F.; Sánchez-Espejo, R.; Viseras, C.; Cerezo, P.; Aguzzi, C. Adsorption and Characterization of Palygorskite-Isoniazid Nanohybrids. Appl. Clay Sci. 2018, 160, 180–185. [Google Scholar] [CrossRef]
- Yang, R.; Li, D.; Li, A.; Yang, H. Adsorption Properties and Mechanisms of Palygorskite for Removal of Various Ionic Dyes from Water. Appl. Clay Sci. 2018, 151, 20–28. [Google Scholar] [CrossRef]
- Moharami, S.; Jalali, M. Use of Modified Clays for Removal of Phosphorus from Aqueous Solutions. Environ. Monit. Assess. 2015, 187, 639. [Google Scholar] [CrossRef] [PubMed]
- Guo, H.; Zhang, X.Y.; Liu, J.L. Ion-Exchange Capability for Ammonium Removal Using Zeolite Modified by Potassium Permanganate. Chem. Eng. Trans. 2016, 55, 163–168. [Google Scholar] [CrossRef]
- You, X.; Valderrama, C.; Queroland, J.L.C.X. Recovery of Ammonium by Powder Synthetic Zeolites from Wastewater Effluents: Optimization of the Regeneration Step. Water Air Soil Pollut. 2017, 228, 396. [Google Scholar] [CrossRef]


| Parameter | Ashraf et al., 2021 1 | Zacharof et al., 2021 2 | Chen et al., 2016 3 | Simate et al., 2011 4 |
|---|---|---|---|---|
| pH | 6.5 ± 0.4 | 6.5 ± 0.2 | 5.2–6.2 | 3–12 |
| COD (mg/L) | 1250 ± 100 | 2250 ± 418 | 8000–14,000 | 2000–6000 |
| BOD (mg/L) | - | 1340 ± 335 | - | 1200–3600 |
| TP (mg/L) | - | 480 ± 70 | 20–90 | 10–50 |
| TN (mg/L) | 24 ± 3 | 50 ± 35 | 80–280 | 25–80 |
| NH3-N (mg/L) | 16 ± 5 | - | - | - |
| TS (mg/L) | - | - | 500–1300 | 2900–3000 |
| VS (mg/L) | - | - | 380–1100 | - |
| SS (mg/L) | 500 ± 50 | 480 ± 70 | - | - |
| Parameter | Concentration |
|---|---|
| pH | 5.42 |
| EC (μS/cm) | 1476 |
| COD (mg/L) | 7783.45 |
| OP (mg/L) | 46.52 |
| NH4-N (mg/L) | 9.24 |
| Components | Zeolite | Palygorskite |
|---|---|---|
| wt.% | wt.% | |
| SiO2 | 69.62 | 53.89 |
| Al2O3 | 13.62 | 15.32 |
| TiO2 | 0.11 | |
| Fe2O3 | 0.75 | 10.91 |
| CaO | 3.28 | 7.66 |
| MgO | 0.90 | 8.03 |
| Na2O | 0.55 | |
| K2O | 2.94 | 2.22 |
| Loss of ignition (at 1050 °C) | 8.23 | |
| Surface area (m2/gr) | 793 | 152 |
| Average pore size (nm) | 12.30 | 16.80 |
| Total pore volume (cm3/g) | 0.40 | 0.80 |
| NH4-N Initial Concentration (mg/L) | Palygorskite | Zeolite | ||||
|---|---|---|---|---|---|---|
| Granulometry | Granulometry | |||||
| 1–2 mm | 2–4 mm | >4 mm | 1–2 mm | 2–4 mm | >4 mm | |
| 5 | 96.47 | 98.19 | 97.93 | 99.91 | 100.00 | 100.00 |
| 10 | 99.10 | 98.67 | 98.19 | 99.86 | 99.73 | 99.58 |
| 50 | 95.89 | 96.00 | 96.41 | 99.75 | 99.67 | 99.33 |
| 100 | 95.65 | 96.30 | 95.97 | 99.35 | 98.93 | 98.39 |
| 200 | 92.67 | 91.76 | 91.59 | 99.29 | 98.44 | 98.57 |
| Kinetic Models | Parameters | |||||||
|---|---|---|---|---|---|---|---|---|
| Palygorskite | Zeolite | |||||||
| Elovich model | C0 | k0 | qe,est | R2 | C0 | k0 | qe,est | R2 |
| 0.878 | 0.013 | 0.957 | 0.667 | 0.876 | 0.018 | 0.986 | 0.901 | |
| Intraparticle Diffusion model (ID) | C1 | k1 | qe,est | R2 | C1 | k1 | qe,est | R2 |
| 0.909 | 0.003 | 0.960 | 0.519 | 0.917 | 0.004 | 0.992 | 0.821 | |
| Double Constant model (DC) | C2 | k2 | qe,est | R2 | C2 | k2 | qe,est | R2 |
| −0.129 | 0.014 | 0.957 | 0.673 | −0.129 | 0.019 | 0.987 | 0.902 | |
| Pseudo-first order (PFO) | qe,exp | k3 | qe,est | R2 | qe,exp | k3 | qe,est | R2 |
| 0.952 | 0.317 | 0.941 | 0.359 | 0.983 | 0.321 | 0.953 | 0.404 | |
| Pseudo-second order (PSO) | qe,exp | k4 | qe,est | R2 | qe,exp | k4 | qe,est | R2 |
| 0.952 | 1.739 | 0.950 | 0.686 | 0.983 | 1.383 | 0.975 | 0.740 | |
| Isotherm Models | Parameters | |||||
|---|---|---|---|---|---|---|
| Palygorskite | Zeolite | |||||
| Langmuir | qm | KL | R2 | qm | KL | R2 |
| 1–2 mm | 1.051 | 1.846 | 0.593 | 1.765 | 5.805 | 0.943 |
| 2–4 mm | 2.734 | 0.678 | 0.855 | 1.241 | 11.322 | 0.953 |
| >4 mm | 3.898 | 0.378 | 0.946 | 1.090 | 9.551 | 0.937 |
| Freundlich | 1/n | KF | R2 | 1/n | KF | R2 |
| 1–2 mm | 0.649 | 0.695 | 0.994 | 0.873 | 4.144 | 0.886 |
| 2–4 mm | 0.605 | 0.815 | 0.996 | 0.863 | 2.446 | 0.925 |
| >4 mm | 0.650 | 0.732 | 0.998 | 0.898 | 1.713 | 0.916 |
| Temkin | A | B | R2 | A | B | R2 |
| 1–2 mm | 10.562 | 0.591 | 0.822 | 63.420 | 0.764 | 0.797 |
| 2–4 mm | 12.439 | 0.594 | 0.845 | 74.293 | 0.614 | 0.786 |
| >4 mm | 10.112 | 0.614 | 0.838 | 52.858 | 0.599 | 0.769 |
| Henry | KP | R2 | KP | R2 | ||
| 1–2 mm | 0.297 | 0.964 | 4.321 | 0.943 | ||
| 2–4 mm | 0.319 | 0.953 | 2.348 | 0.962 | ||
| >4 mm | 0.321 | 0.966 | 1.601 | 0.958 | ||
| NH4+-N Initial Concentration | Palygorskite | Zeolite | Palygorskite | Zeolite |
|---|---|---|---|---|
| Removal Efficiency (%) | Equilibrium Concentration (Qe, mg/L) | |||
| 200 | 85.92 | 84.95 | 28.17 | 30.10 |
| 1000 | 63.98 | - | 360.17 | - |
| 1500 | 72.78 | - | 408.34 | - |
| 3000 | 74.98 | - | 750.54 | - |
| 5000 | 73.66 | 92.19 | 1317.07 | 294.11 |
| Kinetic Model | Parameter | |||||||
|---|---|---|---|---|---|---|---|---|
| Palygorskite | Zeolite | |||||||
| Elovich model | C0 | k0 | qe,est | R2 | C0 | k0 | qe,est | R2 |
| 200 | −0.026 | 0.039 | 0.260 | 0.726 | −0.125 | 0.053 | 0.275 | 0.774 |
| 1000 | 0.061 | 0.119 | 0.926 | 0.556 | - | - | - | - |
| 1500 | −0.030 | 0.195 | 1.390 | 0.882 | - | - | - | - |
| 3000 | −0.963 | 0.504 | 2.703 | 0.891 | - | - | - | - |
| 5000 | 1.456 | 0.345 | 3.966 | 0.639 | −0.387 | 0.683 | 4.584 | 0.937 |
| Intraparticle Diffusion model (ID) | C1 | k1 | qe,est | R2 | C1 | k1 | qe,est | R2 |
| 200 | 0.086 | 0.005 | 0.293 | 0.647 | 0.043 | 0.006 | 0.275 | 0.470 |
| 1000 | 0.375 | 0.018 | 1.062 | 0.595 | - | - | - | - |
| 1500 | 0.486 | 0.030 | 1.613 | 0.945 | - | - | - | - |
| 3000 | 0.379 | 0.076 | 3.260 | 0.934 | - | - | - | - |
| 5000 | 2.382 | 0.052 | 4.340 | 0.658 | 1.657 | 0.087 | 4.961 | 0.693 |
| Double Constant model (DC) | C2 | k2 | qe,est | R2 | C2 | k2 | qe,est | R2 |
| 200 | −3.696 | 0.353 | 0.323 | 0.470 | −9.096 | 1.273 | 1.178 | 0.717 |
| 1000 | −1.559 | 0.212 | 0.984 | 0.550 | - | - | - | - |
| 1500 | −1.174 | 0.213 | 1.455 | 0.903 | - | - | - | - |
| 3000 | −1.666 | 0.392 | 3.259 | 0.931 | - | - | - | - |
| 5000 | 0.573 | 0.113 | 4.029 | 0.651 | −0.364 | 0.281 | 5.364 | 0.901 |
| Pseudo-first order (PFO) | qe,exp | k3 | qe,est | R2 | qe,exp | k3 | qe,est | R2 |
| 200 | 0.263 | 0.024 | 0.207 | 0.623 | 0.205 | 0.010 | 0.208 | 0.895 |
| 1000 | 1.038 | 0.051 | 0.726 | 0.422 | - | - | - | - |
| 1500 | 1.529 | 0.023 | 1.124 | 0.446 | - | - | - | - |
| 3000 | 3.128 | 0.004 | 2.782 | 0.766 | - | - | - | - |
| 5000 | 4.280 | 0.080 | 3.372 | 0.466 | 4.123 | 0.019 | 3.711 | 0.899 |
| Pseudo-second order (PSO) | qe,exp | k4 | qe,est | R2 | qe,exp | k4 | qe,est | R2 |
| 200 | 0.263 | 0.112 | 0.228 | 0.684 | 0.205 | 0.046 | 0.230 | 0.834 |
| 1000 | 1.038 | 0.078 | 0.788 | 0.446 | - | - | - | - |
| 1500 | 1.529 | 0.022 | 1.267 | 0.665 | - | - | - | - |
| 3000 | 3.128 | 0.002 | 3.064 | 0.843 | - | - | - | - |
| 5000 | 4.280 | 0.037 | 3.514 | 0.523 | 4.123 | 0.006 | 4.038 | 0.958 |
| Initial Concentration (mg/L) | Concentrations (mg/L) | Removal Efficiencies (%) | Adsorbed Amount (mg/g) | ||||
|---|---|---|---|---|---|---|---|
| P | Z | P | Z | P | Z | ||
| NH4+-N | 5.611 | 0.74 | 0.80 | 86.77 | 85.81 | 0.01 | 0.01 |
| sCODt | 3441 | 796 | 774 | 45 | 46 | 1. | BDL |
| PO4−3-P | 22.74 | 1.96 | 7.59 | 91.38 | 66.61 | 0.05 | 0.02 |
| Kinetic Model | Parameter | |||||||
|---|---|---|---|---|---|---|---|---|
| Palygorskite | Zeolite | |||||||
| Elovich model | C0 | k0 | qe,est | R2 | C0 | k0 | qe,est | R2 |
| NH4+-N | 0.002 | 0.002 | 0.013 | 0.760 | 0.002 | 0.001 | 0.006 | 0.815 |
| sCODt | −0.470 | 0.284 | 1.594 | 0.756 | −0.438 | 0.165 | 0.759 | 0.849 |
| PO4−3-P | 0.012 | 0.005 | 0.048 | 0.975 | −0.003 | 0.002 | 0.013 | 0.756 |
| Intraparticle Diffusion model (ID) | C1 | k1 | qe,est | R2 | C1 | k1 | qe,est | R2 |
| NH4+-N | 0.007 | 0.000 | 0.014 | 0.498 | 0.004 | 0.000 | 0.006 | 0.495 |
| sCODt | 0.034 | 0.039 | 1.529 | 0.672 | 0.034 | 0.023 | 0.888 | 0.732 |
| PO4−3-P | 0.026 | 0.001 | 0.051 | 0.813 | 0.003 | 0.000 | 0.015 | 0.841 |
| Double Constant model (DC) | C2 | k2 | qe,est | R2 | C2 | k2 | qe,est | R2 |
| NH4+-N | −5.728 | 0.205 | 0.015 | 0.641 | −6.139 | 0.143 | 0.006 | 0.773 |
| sCODt | −1.991 | 0.355 | 1.804 | 0.724 | −4.245 | 0.594 | 1.080 | 0.873 |
| PO4−3-P | −4.053 | 0.145 | 0.050 | 0.959 | −6.387 | 0.285 | 0.013 | 0.828 |
| Pseudo-first order (PFO) | qe,exp | k3 | qe,est | R2 | qe,exp | k3 | qe,est | R2 |
| NH4+-N | 0.012 | 0.033 | 0.011 | 0.830 | 0.005 | 0.052 | 0.005 | 0.936 |
| sCODt | 1.459 | 0.006 | 1.492 | 0.816 | 0.687 | 0.005 | 0.707 | 0.910 |
| PO4−3-P | 0.047 | 0.052 | 0.040 | 0.698 | 0.016 | 0.010 | 0.011 | 0.539 |
| Pseudo-second order (PSO) | qe,exp | k4 | qe,est | R2 | qe,exp | k4 | qe,est | R2 |
| NH4+-N | 0.012 | 4.079 | 0.012 | 0.855 | 0.005 | 15.634 | 0.005 | 0.979 |
| sCODt | 1.459 | 0.005 | 1.704 | 0.798 | 0.687 | 0.006 | 0.859 | 0.883 |
| PO4−3-P | 0.047 | 1.840 | 0.042 | 0.879 | 0.016 | 0.869 | 0.013 | 0.656 |
| Solvents | Initial Concentration (mg/L) | Palygorskite | Zeolite | ||||
|---|---|---|---|---|---|---|---|
| NH4+-N Recovery (%) | NH4+-N Recovery (%) | ||||||
| Deionized water | mg/L | 1–2 mm | 2–4 mm | >4 mm | 1–2 mm | 2–4 mm | >4 mm |
| 5 | 2.25 | 1.44 | 1.42 | 5.49 | 4.57 | 4.31 | |
| 10 | 1.10 | 1.10 | 1.42 | 0.97 | 0.55 | 0.59 | |
| 50 | 0.83 | 0.91 | 0.81 | 0.29 | 0.12 | 0.11 | |
| 100 | 0.96 | 0.91 | 1.09 | 0.10 | 0.07 | 0.10 | |
| 200 | 0.73 | 0.57 | 0.75 | 0.39 | 0.11 | 0.09 | |
| 0.1 N HCl | 5 | 3.64 | 7.75 | 7.91 | 9.19 | 0.55 | 0.72 |
| 10 | 1.53 | 3.97 | 1.73 | 3.72 | 1.79 | 2.10 | |
| 50 | 2.14 | 2.08 | 2.63 | 0.78 | 0.32 | 0.31 | |
| 100 | 1.50 | 1.55 | 1.06 | 0.41 | 0.13 | 0.23 | |
| 200 | 1.18 | 1.18 | 1.24 | 1.87 | 1.57 | 1.95 | |
| Solvents | Initial Concentration (mg/L) | Palygorskite | Zeolite |
|---|---|---|---|
| NH4+-N Recovery (%) | NH4+-N Recovery (%) | ||
| Deionized water | 200 | 6.96 | 5.45 |
| 1000 | 14.94 | - | |
| 1500 | 16.79 | - | |
| 3000 | - | ||
| 5000 | 17.77 | 2.07 | |
| 0.1 N HCl | 200 | 18.92 | 4.35 |
| 1000 | 11.91 | - | |
| 1500 | 13.06 | - | |
| 3000 | 10.89 | - | |
| 5000 | 10.03 | 1.61 |
| Palygorskite | Zeolite | Initial Concentrations (mg/L) | |
|---|---|---|---|
| Solvents | Recovery (%) | Recovery (%) | |
| Deionized water | 5.36 | 5.72 | NH4+-N = 5.61 |
| 20.02 | 10.00 | sCODt = 1440.67 | |
| 7.94 | 12.73 | PO4−3-P = 22.70 | |
| 0.1 N HCl | 36.02 | 15.00 | NH4+-N = 5.61 |
| 21.13 | 19.99 | sCODt = 1438.40 | |
| 6.15 | 13.71 | PO4−3-P = 22.70 |
Disclaimer/Publisher’s Note: The statements, opinions and data contained in all publications are solely those of the individual author(s) and contributor(s) and not of MDPI and/or the editor(s). MDPI and/or the editor(s) disclaim responsibility for any injury to people or property resulting from any ideas, methods, instructions or products referred to in the content. |
© 2023 by the authors. Licensee MDPI, Basel, Switzerland. This article is an open access article distributed under the terms and conditions of the Creative Commons Attribution (CC BY) license (https://creativecommons.org/licenses/by/4.0/).
Share and Cite
Papaevangelou, V.; Bakalakou, K.A.; Tsilinikos, J.; Akratos, C.S. Testing Zeolite and Palygorskite as a Potential Medium for Ammonium Recovery and Brewery Wastewater Treatment. Water 2023, 15, 4069. https://doi.org/10.3390/w15234069
Papaevangelou V, Bakalakou KA, Tsilinikos J, Akratos CS. Testing Zeolite and Palygorskite as a Potential Medium for Ammonium Recovery and Brewery Wastewater Treatment. Water. 2023; 15(23):4069. https://doi.org/10.3390/w15234069
Chicago/Turabian StylePapaevangelou, Vassiliki, Katerina A. Bakalakou, John Tsilinikos, and Christos S. Akratos. 2023. "Testing Zeolite and Palygorskite as a Potential Medium for Ammonium Recovery and Brewery Wastewater Treatment" Water 15, no. 23: 4069. https://doi.org/10.3390/w15234069
APA StylePapaevangelou, V., Bakalakou, K. A., Tsilinikos, J., & Akratos, C. S. (2023). Testing Zeolite and Palygorskite as a Potential Medium for Ammonium Recovery and Brewery Wastewater Treatment. Water, 15(23), 4069. https://doi.org/10.3390/w15234069