Article

Spatial and Temporal Variations of the Precipitation Structure in Jiangsu Province from 1960 to 2020 and Its Potential Climate-Driving Factors

1
College of Environmental Science and Engineering, Guilin University of Technology, Guilin 541006, China
2
Collaborative Innovation Center for Water Pollution Control and Water Safety in Karst Area, Guilin University of Technology, Guilin 541006, China
*
Author to whom correspondence should be addressed.
Water 2023, 15(23), 4032; https://doi.org/10.3390/w15234032
Submission received: 23 October 2023 / Revised: 16 November 2023 / Accepted: 17 November 2023 / Published: 21 November 2023

Abstract

:
This study investigated the temporal and spatial variations of precipitation duration and intensity in Jiangsu Province from 1960 to 2020 using the IDW spatial interpolation method and Kendall’s tau trend test, based on daily precipitation data collected from 22 meteorological stations. Additionally, a Pearson correlation analysis was conducted to examine the correlations between the occurrence rate and contribution rate of precipitation with different durations and grades, as well as five large-scale climate indices. The results indicated the following trends: (1) An increase in the precipitation duration corresponded to a decrease in the occurrence rates, while the contribution rates initially increased and then decreased. The province was predominantly characterized by 1–3 days of light rainfall, with a higher probability of short-duration heavy rainfall in northern Jiangsu. (2) From 1960 to 2020, most stations experienced decreasing trends in the precipitation duration occurrence and contribution rates, but heavy rainfall increased, suggesting a shift to short-duration heavy precipitation. (3) The Arctic Oscillation (AO) notably negatively correlates with the 9-day occurrence rate of precipitation (9dOR), while it positively correlates significantly with the occurrence rate of moderate rainfall (MROR). The North Atlantic Oscillation (NAO) exhibits a significant positive correlation with the 2-day occurrence rate of precipitation (2dOR) and a notable negative correlation with the 9-day occurrence rate of precipitation (9dOR). The PDO (Pacific Decadal Oscillation) has shown significant positive correlations with the 2-day precipitation occurrence rate (2dOR) and contribution rate (2dCR), a negative correlation with the light rainfall occurrence rate (LROR), and significant positive correlations with both the moderate and heavy rainfall occurrence rates (MROR and HROR, respectively). The AO, NAO, and PDO are potential climate factors that influence changes in the precipitation structure in Jiangsu Province. These research findings offer valuable insights for regional water resource management, flood risk assessment, and predicting future precipitation trends under climate change scenarios.

1. Introduction

Global climate change has to some extent altered the hydrological cycle in some specific regions [1,2,3,4]. As a crucial link between humans and the other four spheres (lithosphere, hydrosphere, atmosphere, and biosphere), changes in the hydrological cycle can impact human activities and the Earth’s overall ecological environment [5]. Precipitation, the most prevalent weather event in the hydrological cycle and daily life, is essential for maintaining ecosystem balance, supporting agricultural production, and managing water resources [6,7,8,9]. The seasonality, intensity, and duration of precipitation can lead to a highly uneven distribution, and changes in this distribution may have more profound effects than the often-discussed global warming [10,11]. Moreover, spatial-temporal variations in precipitation significantly affect the utilization of water resources by humans and ecosystems, as well as early warning systems and protections against natural disasters [12,13,14,15]. Numerous factors contribute to these changes, with climate change being the primary driver. Prior research has demonstrated that greenhouse gas emissions can lead to extreme precipitation events in certain regions, while El Niño events can trigger severe droughts in others [16,17,18].
Nowadays, there is a notable interest in the climatic factors that potentially impact the spatial and temporal variability of precipitation. Whether it is storms, monolithic thunderstorms, temperate rain and snow storms, tropical cyclones, or an increased water vapor supply, they can lead to more intense precipitation events [19]. Numerous observational and modeling methods have been employed to investigate the impacts of climate change on precipitation. For instance, certain researchers have utilized forecast data from 134 Global Circulation Models (GCMs) obtained through the Coupled Model Intercomparison Project Phase 5 (CMIP5) and introduced a novel change factor to forecast future precipitation scenarios or validate existing ones [20,21,22]. Nonetheless, the factors and mechanisms that drive precipitation changes remain unclear, with latitude, longitude, elevation, and large-scale climate metrics all potentially playing a role [23].
In the context of global warming, there has been a rise in the frequency of unusual precipitation events in China, resulting in growing water scarcity and occurrences of natural disasters. For example, the “Zhengzhou-excessive rainstorm” event that occurred on 20 July 2021, led to a large number of casualties and severe flooding [24,25]. In the spring of 2021, an extreme drought event occurred in the southwestern region of China, which led to a large reduction in the yields of a variety of crops and caused great economic losses [26]. Jiangsu Province, one of the densely populated and economically prosperous regions in China, is a crucial part of the Yangtze River Delta region. However, the region frequently experiences excessive precipitation and flooding [27,28].
Currently, numerous studies have been conducted in Jiangsu Province on precipitation, encompassing investigations into the spatial and temporal variations of precipitation types, the estimation and correction of extreme precipitation frequencies, the impact of precipitation on crop yields, and drought monitoring utilizing satellite precipitation data [29,30,31,32,33]. However, the limited research by scholars on climatic factors crucial to precipitation in Jiangsu has prompted this study to address this gap by examining the changes in precipitation in Jiangsu Province over the past 60 years and exploring its potential climatic influences. Furthermore, the precipitation structure, which comprises indicators such as the precipitation duration, precipitation grades, precipitation intensity, and precipitation index, provides a means to investigate precipitation changes and visualize alterations in precipitation characteristic values within a specific region [19,34,35,36,37]. Therefore, this study aims to achieve the following objectives: (1) to investigate the spatial and temporal changes in the precipitation structure in Jiangsu Province from 1960 to 2020; (2) to illustrate the trends of the precipitation duration and precipitation grade at different stations through the two indicators of precipitation occurrence and contribution rate; and (3) to study the correlation of the precipitation duration and grade indicators with the large-scale climate indicators NINO3.4, the AO, NAO, PDO, and SOI and to reveal the potential driving factors.

2. Materials and Methods
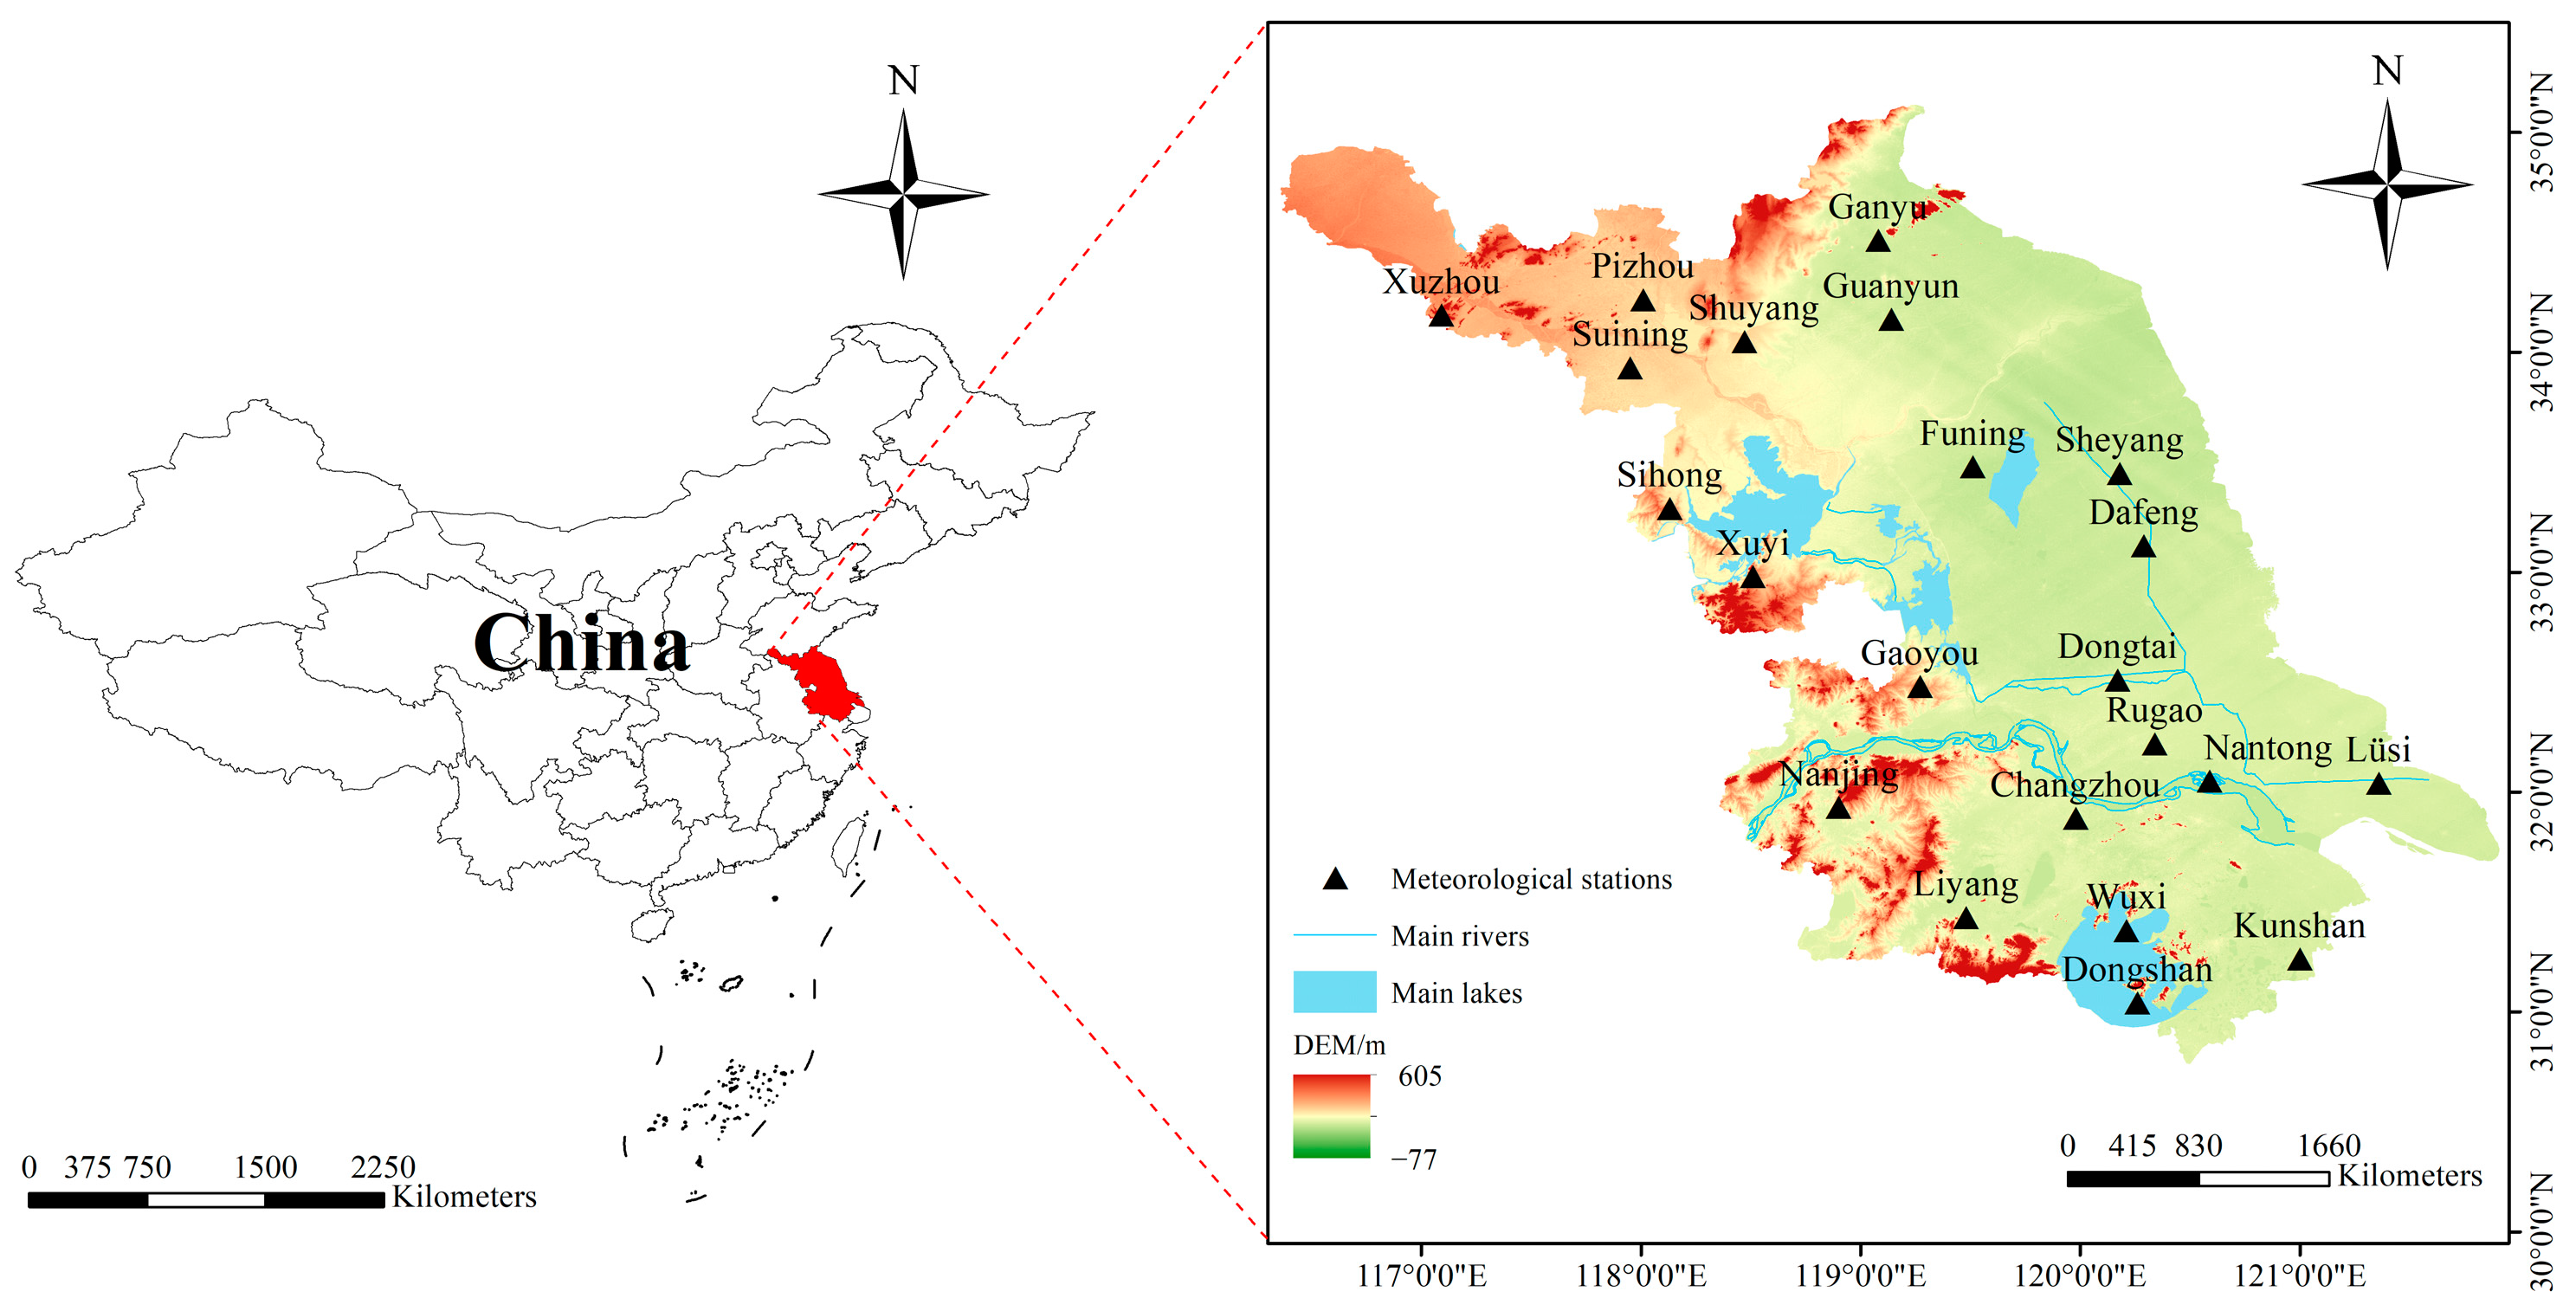
2.1. Study Area

Jiangsu Province is situated in the central part of China’s eastern coastal region, with its eastern border adjacent to the Yellow Sea and its southern border along the Yangtze River. It spans latitude 30°45′–35°08′ north and longitude 116°21′~121°56′ east—the flat slopes of 0° to 2° cover 93.89% of the province’s land area. Jiangsu is intersected by rivers and coastlines, dotted with numerous lakes, and possesses a dense network of water bodies. It is located adjacent to both the sea and land, with water areas accounting for 16.9% of its total area. Jiangsu falls within the East Asian monsoon climate zone, situated in the transition zone between subtropical and warm temperate climates. Generally, the northern boundary of the region is delineated by the Huaihe River and the North Jiangsu irrigation canal line. The northern part experiences a warm temperate humid and semi-moist monsoon climate, while the southern part encounters a subtropical humid monsoon climate. The region experiences four distinct seasons, with humid and hot summers, cold and dry winters, and an average annual precipitation ranging between 900–1200 mm. Figure 1 illustrates the distribution of elevation, major rivers, and lakes, as well as selected meteorological stations in the study area.

2.2. Data

The precipitation data were obtained from the China Meteorological Science Data Sharing Service Platform (http://data.cma.cn/ (accessed on 21 February 2021)). To ensure data continuity and completeness, the raw data needed to be pre-processed to eliminate stations with significant missing data. After screening, the day-to-day precipitation data from 22 meteorological stations in Jiangsu Province for the period 1960–2020 were selected. Table 1 provides information on station names, latitude and longitude coordinates, and the years of data. The climate indicator data NINO3.4, the AO, NAO, PDO, and SOI were obtained from the Earth System Research Laboratory (https://psl.noaa.gov/data/climateindices/list/ (accessed on 28 September 2023)). The selected data for the period 1960–2020 are complete without any missing values.

2.3. Methodology

2.3.1. Precipitation Structure

This study analyzed the temporal and spatial changes in the precipitation structure of Jiangsu Province, focusing on the precipitation durations and precipitation grades. Two indicators, namely, the precipitation occurrence rate and contribution rate, were introduced for analysis. Precipitation duration was defined as the period from the onset of effective precipitation (precipitation ≥ 0.1 mm) to its cessation [38,39]. The precipitation duration in Jiangsu Province was divided into 11 classes: 1 d, 2 d, 3 d, 4 d, 5 d, 6 d, 7 d, 8 d, 9 d, 10 d, and >10 d. According to China’s National Precipitation Scale [40], precipitation grades were defined as follows: light rain (LR) for daily precipitation ranging from 0.1–10 mm, middle rain (MR) for 10–25 mm, heavy rain (HR) for 25–50 mm, and torrential rain (TR) for values exceeding 50 mm. The precipitation occurrence rate is defined as the percentage of times a specific type of precipitation occurs among all types of precipitation. The precipitation contribution rate is defined as the percentage of precipitation from a specific type of total precipitation.

2.3.2. Spatial Interpolation Methods

This study employed the inverse distance weight (IDW) spatial interpolation method to analyze the spatial distribution of the precipitation occurrence and contribution rate in Jiangsu Province. The IDW interpolation method generates a raster grid, and the values of each cell are calculated by averaging the data values from neighboring stations [41]. This interpolation method is well-suited for analyzing spatial patterns in hydrologic and climatic datasets [42,43].

2.3.3. Trend Analysis

Kendall’s tau trend analysis method, which is obtained by conducting the M-K test, a nonparametric trend test, was employed to assess the trends of various precipitation parameters [44,45,46,47,48]. Therefore, this method was applied to calculate the trends of the precipitation occurrence and contribution rate at 22 meteorological stations in Jiangsu from 1960 to 2020. In this calculation, a positive value of τ represented an increasing trend in the data series, while a negative value indicated a decreasing trend. The calculation can be expressed as follows:
τ = N c N d n n 1 2 = 2 S n n 1
S = N C N d
where Nc is the number of homozygous pairs, Nd is the number of reverse pairs, S is the statistic of Kendall’s tau, and τ ranges from −1 to 1.

2.3.4. Correlation Analysis

The Pearson correlation analysis is a method commonly used to examine the strength and direction of the linear relationship between two sets of variables [47]. In this study, this method was used to investigate the linear correlations between the incidence and contribution of the precipitation duration and grade and climate indicators including NINO3.4, the AO, NAO, PDO, and SOI. Values closer to 1 indicate a stronger positive correlation between the variables, while values closer to −1 indicate a stronger negative correlation. The calculations were conducted using the “corr. test()” function from the built-in psych package in the R 4.2.3. In addition, heat maps demonstrating intergroup correlations were generated using the “ComplexHeatmap 2.14.0” package [49].

3. Results

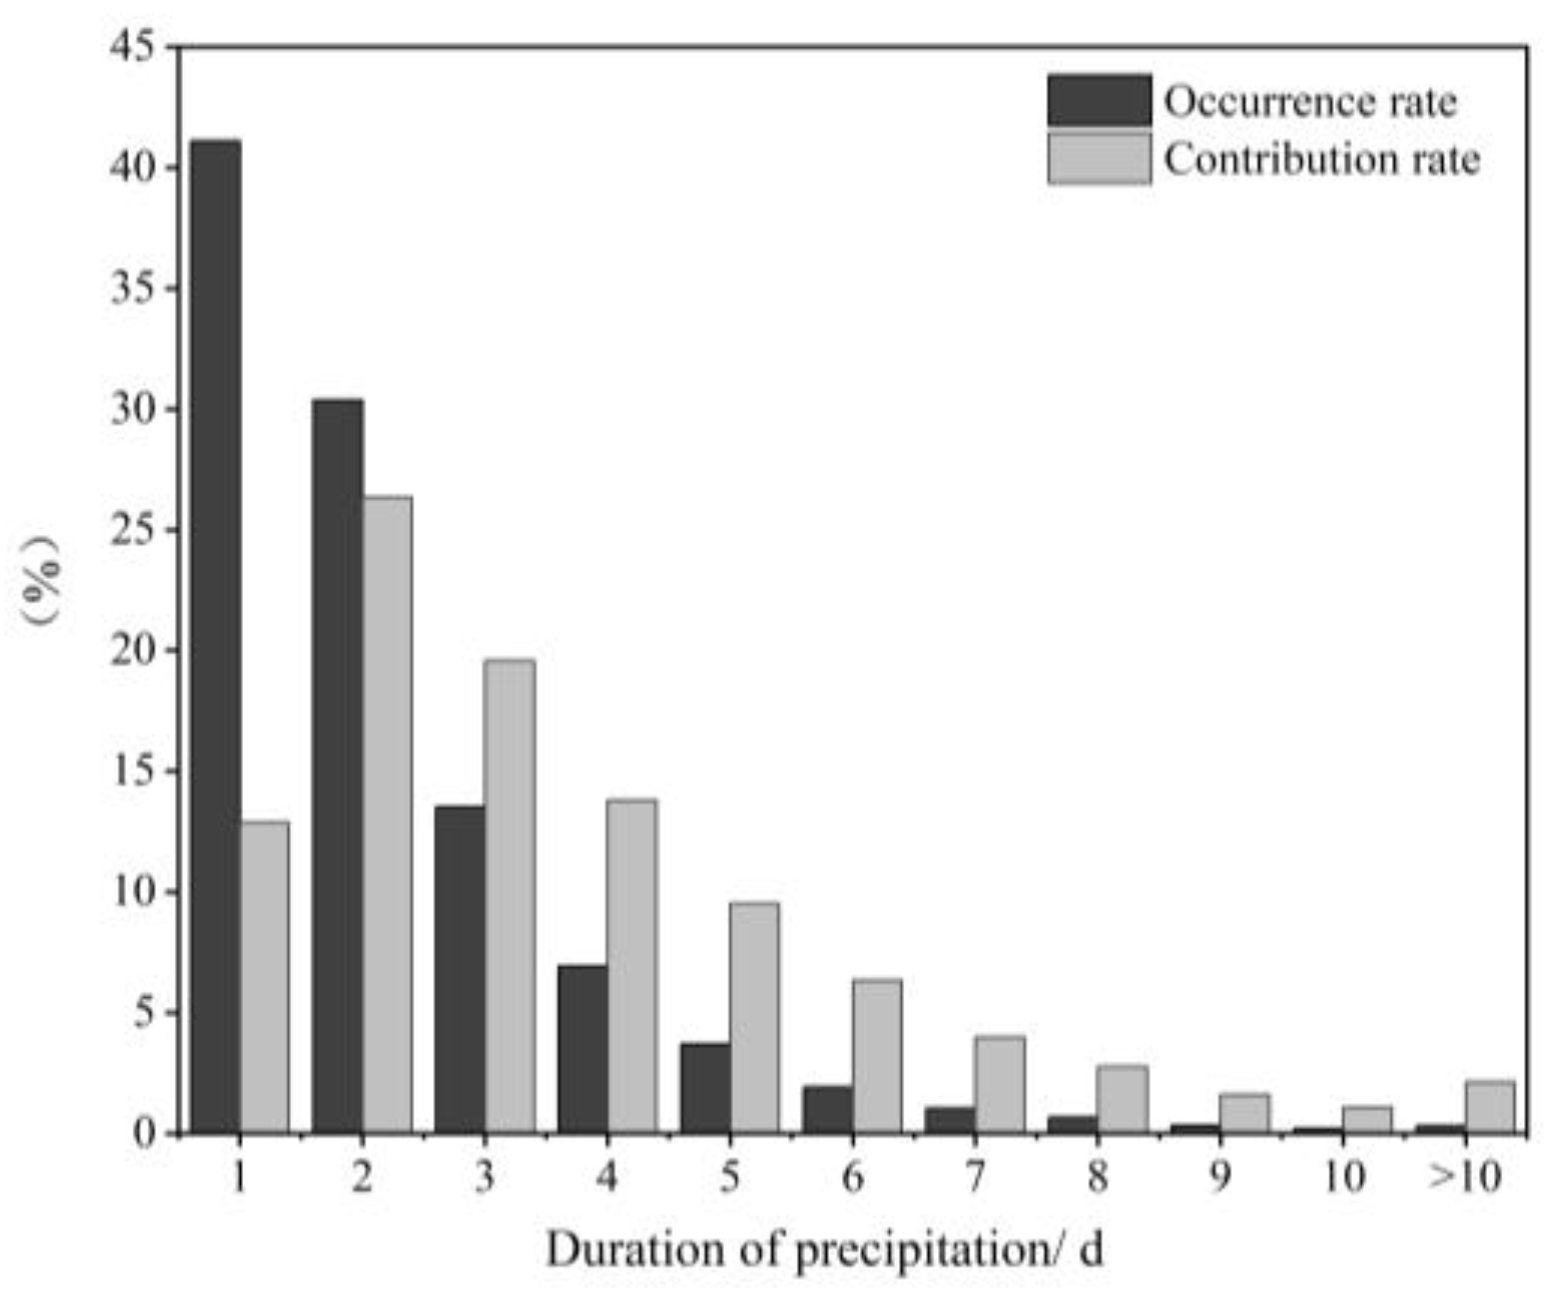
3.1. Statistical Characteristics of the Precipitation Occurrence and Contribution Rate for Various Durations

During 1960–2020, the magnitude of change of precipitation for the 1–10 d duration and >10 d duration were 0.89 mm/year, 1.53 mm/year, 1.45 mm/year, −0.14 mm/year, −0.72 mm/year, −0.45 mm/year, −0.44 mm/year, −0.38 mm/year, −0.17 mm/year, 0.12 mm/year, and −0.46 mm/year. The magnitude of change for each precipitation duration was −63.60 min/year, 10.01 min/year, −16.07 min/year, −40.50 min/year, −38.80 min/year, −21.94 min/year, −18.20 min/year, −11.22 min/year, −5.32 min/year, 0.95 min/year, and −6.14 min/year. Figure 2 shows the average values of precipitation occurrence and the contribution rate of 22 meteorological stations in Jiangsu Province from 1960 to 2020 for each duration. As observed in Figure 2, there is a decreasing trend in the overall precipitation occurrence rate with a longer precipitation duration, and this decrease is gradual. The precipitation occurrence rate varies across different durations: the 1 d duration has the highest rate at 41.09%, while the 10 d duration has the lowest rate at 0.19%. The precipitation occurrence rate for durations greater than 10 d is 0.29%. In contrast, the contribution of precipitation exhibits an overall increasing and then decreasing trend. The duration of 2 d has the highest precipitation contribution at 26.36%, while the 10 d duration has the smallest contribution at 1.08%. Durations greater than 10 d have a precipitation contribution of 2.13%. It is noteworthy that despite the low incidence of precipitation for durations greater than 10 d (0.29%), their contribution reaches 2.13%. Additionally, the occurrence rate of short-term precipitation lasting 1–3 days reached 84.96%, with a contribution rate of 58.8%. This indicates that Jiangsu Province is mainly dominated by 1–3 d short-term precipitation.

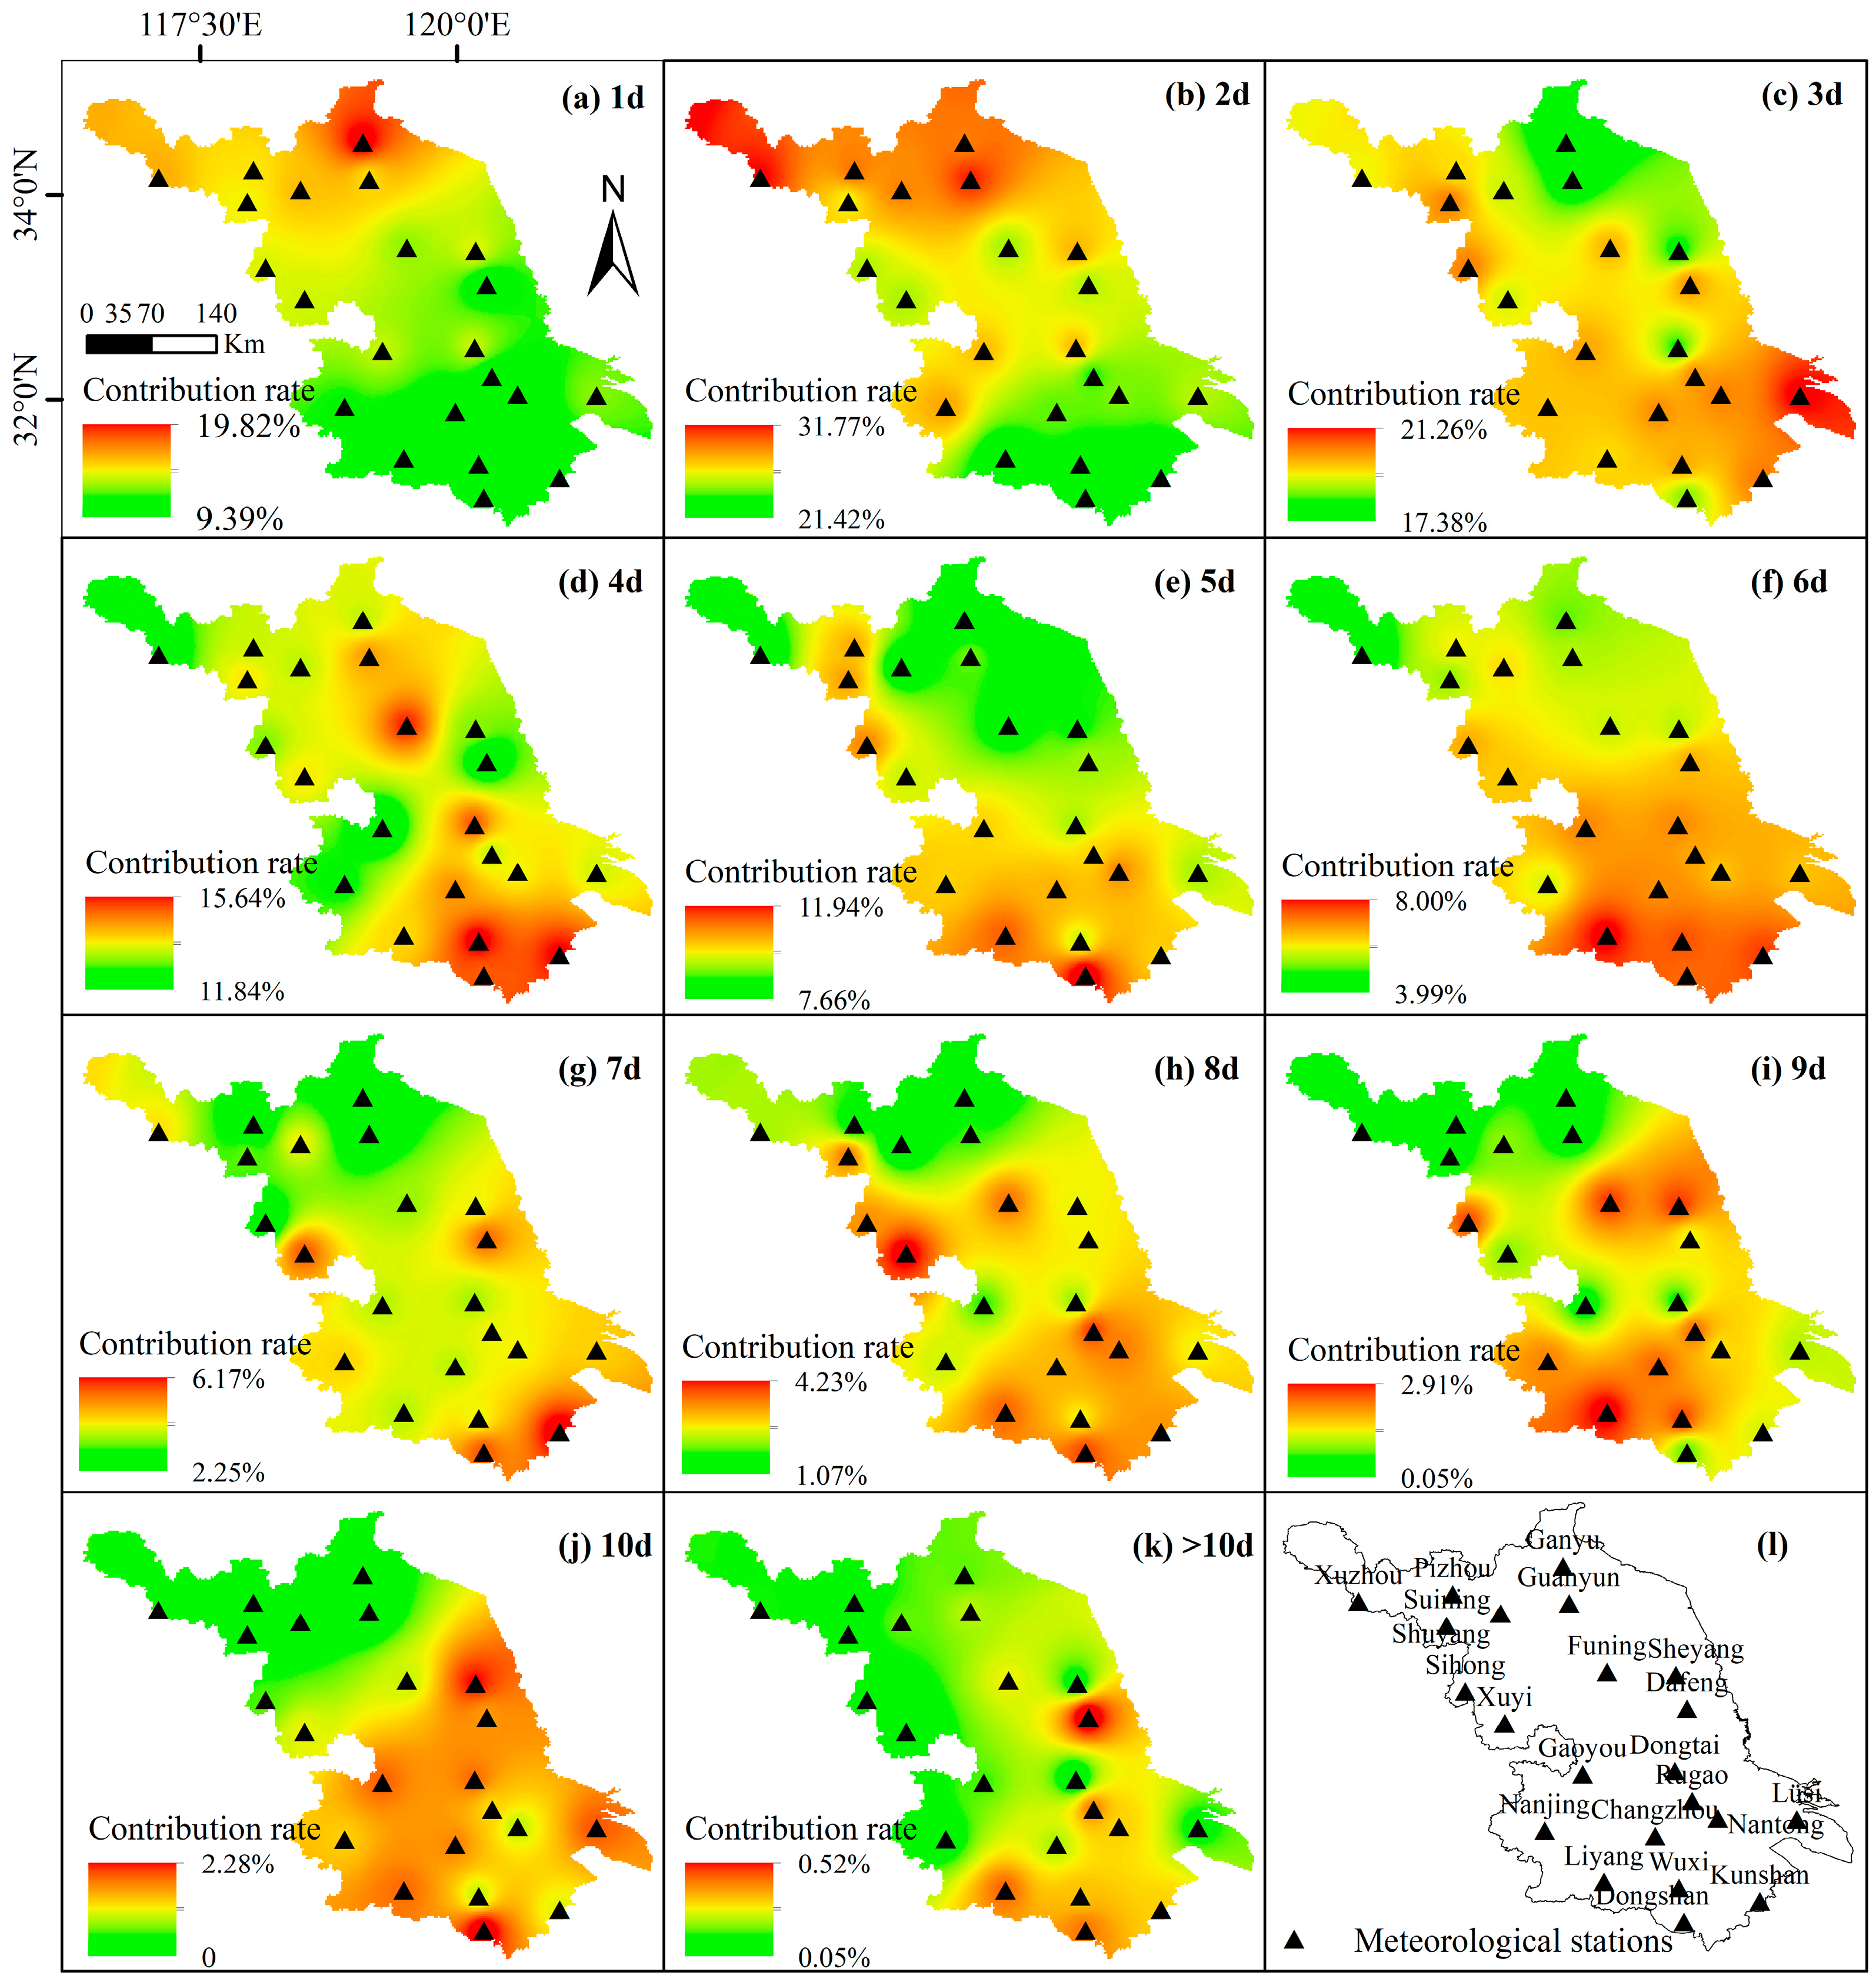
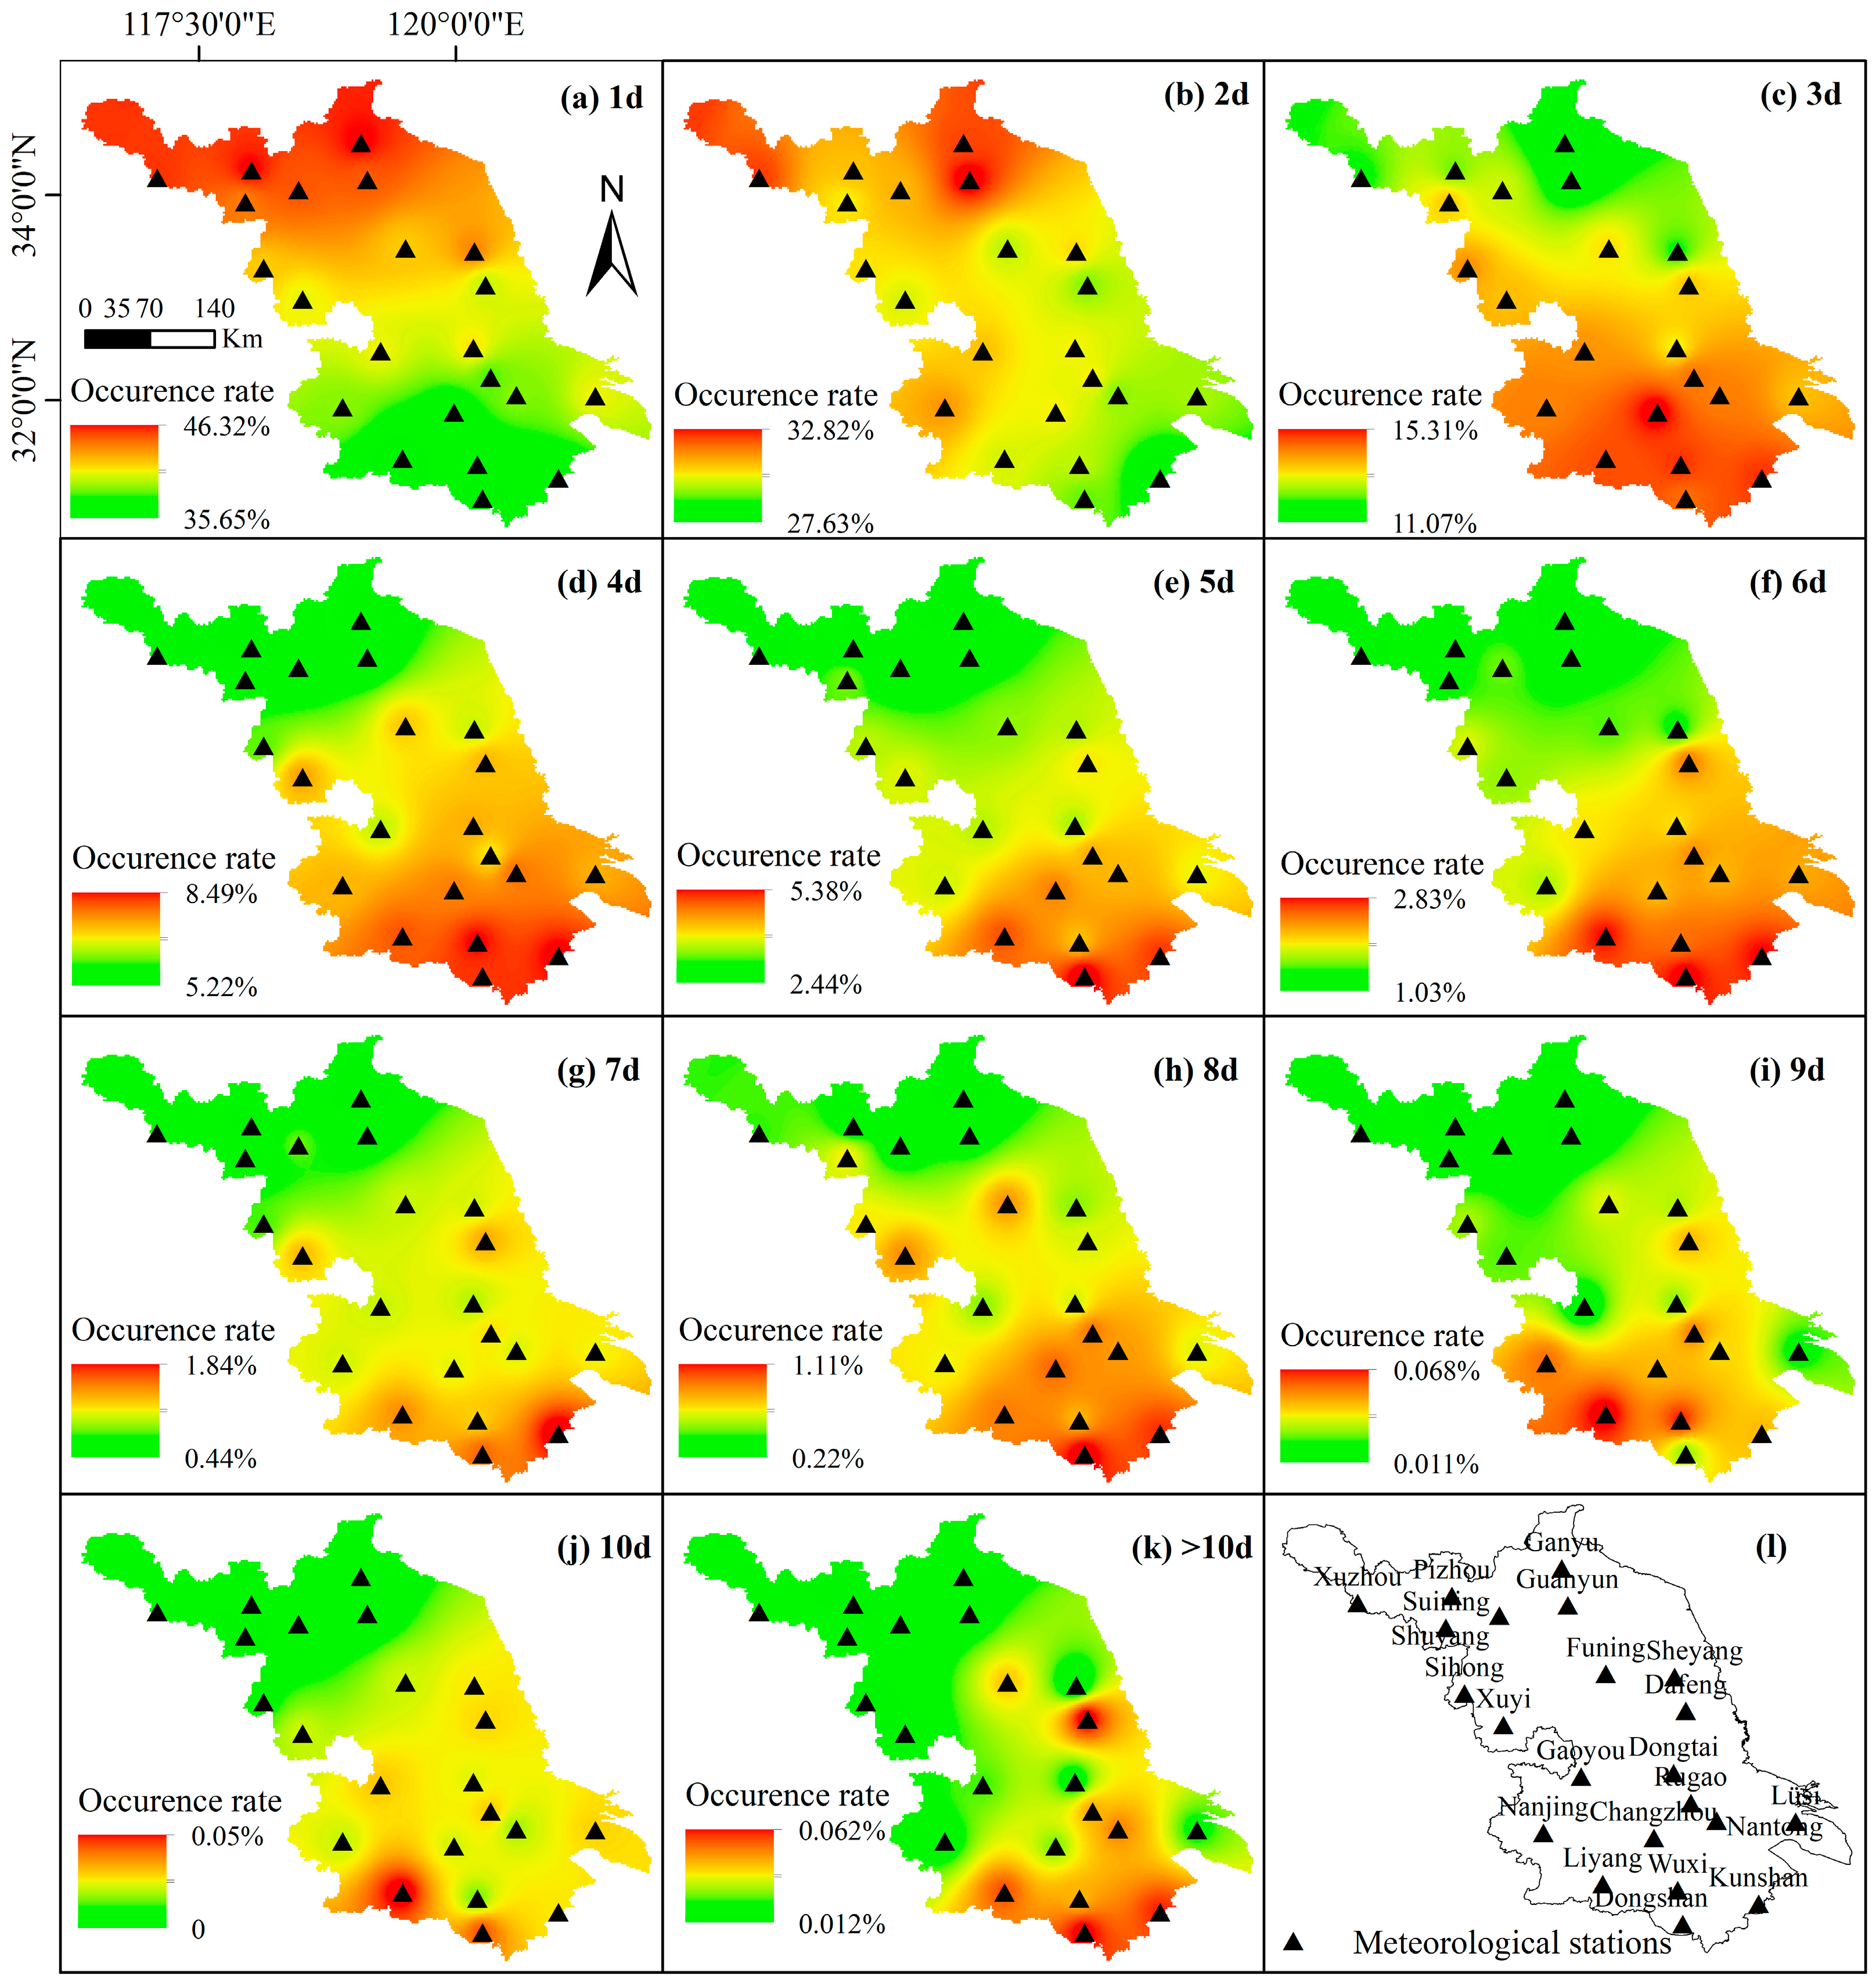
3.2. Spatial Characteristics of the Precipitation Occurrence and Contribution Rate for Various Durations

Figure 3 and Figure 4 present the spatial distribution of the precipitation occurrence rate and contribution rate for durations of 1–10 days and >10 days in Jiangsu Province, with the corresponding station information displayed in Figure 3l and Figure 4l. The precipitation occurrence rates exhibit distinct spatial distribution differences at all durations, as shown in Figure 3. Moreover, the precipitation occurrence rates at each meteorological station show a decreasing trend with an increase in the precipitation duration. Figure 3a displays a spatial trend of the precipitation occurrence rate at the 1-day duration, which decreases from north to south. The precipitation occurrence rate of the stations ranges from 35.65% to 46.32%, with a variation of more than 10%. Among these stations, Pizhou (46.32%) has the highest precipitation occurrence rate followed by Ganyu (46.29%), and Liyang (35.65%) has the lowest rate. Furthermore, all stations in the north of Suzhou have a precipitation occurrence exceeding 40%. Figure 3b illustrates that the precipitation occurrence rate of each station at the 2-day duration ranges from 27.63% to 32.82%, with Guanyun (32.82%) having the highest precipitation occurrence rate and Kunshan (27.63%) having the lowest. The spatial distribution differs from that of the 1-day duration, exhibiting an overall decreasing trend from the northwest to the southeast. The spatial distribution of precipitation occurrence exhibits a significant change for the 3-day duration, with an overall increasing trend from the north to the south and a significant reduction in the range of change. The highest precipitation occurrence is observed at Changzhou (15.31%) and the lowest at Ganyu (11.07%). Combining Figure 3a–k, we can observe that the probability of short-duration precipitation is higher in the northern region of Jiangsu compared to the southern region. In contrast, the probability of long-duration precipitation is higher in the southern region than in the northern part of Jiangsu.
As can be seen in Figure 4, the precipitation contribution rate of each station increases and then decreases with the increase of the precipitation duration, and the station with the largest precipitation contribution rate at the 1 d duration is Ganyu (19.82%) and the lowest one is Dongshan (9.39%). The spatial trend is decreasing from north to south, with the overall trend being higher in northeast Jiangsu and lower in central and southern Jiangsu. The 2 d duration precipitation contribution rate is the highest among all the stations, and it reaches 31.77% at Xuzhou station. The 1–10 d duration precipitation contribution rate varies widely, and all of them are more than 10%. The 2 d duration precipitation contribution rate is more variable than that of the 1 d duration, but it is different from the precipitation contribution rate of the 2 d duration. The spatial variation of precipitation contribution rate at the 2 d duration is different from that at the 1 d duration, but it is the same as its precipitation occurrence rate, and the overall trend is decreasing from northwest to southeast. The 3 d duration precipitation contribution rate is the highest at Lusi (21.26%) and the lowest at Ganyu (17.38%). The spatial distribution is significantly different from the 2 d duration, with an overall increasing trend from northwest to southeast. Among them, the northern and northeastern Jiangsu regions are lower overall. The spatial distribution of the precipitation contribution rate at each station after the 3 d duration is roughly similar, showing an increasing trend from northwest to southeast, and the change of the precipitation contribution rate decreases significantly. An analysis of Figure 4a–k reveals a spatial pattern where the precipitation contribution rate is higher in the north of Jiangsu Province for short durations and in the south for long durations. This spatial pattern is consistent with the regional distribution of the precipitation occurrence rates.

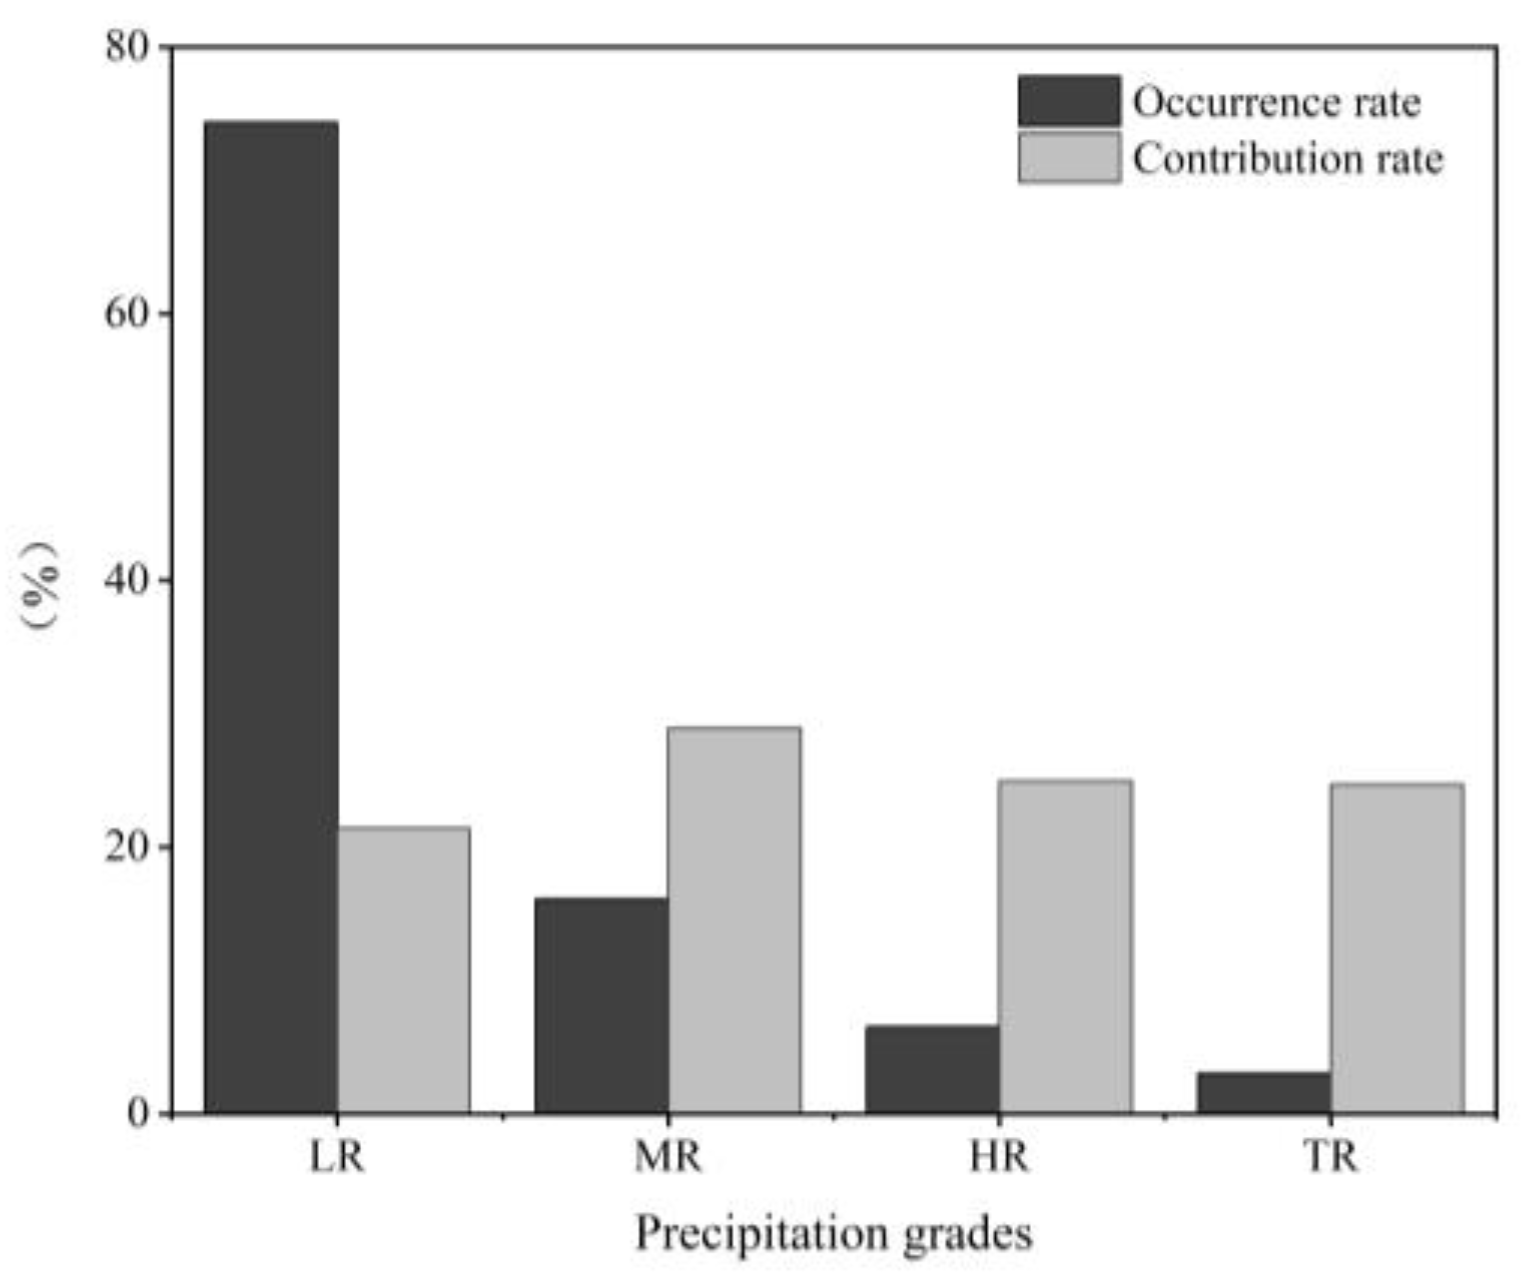
3.3. Statistical Characteristics of the Precipitation Occurrence Rate and Contribution Rate for Various Grades

The magnitude of change for light rain, middle rain, heavy rain, and torrential rain is −0.22 mm/year, 0.38 mm/year, 0.19 mm/year, and 0.34 mm/year, respectively, for the period 1960–2020. Figure 5 presents the mean values of the precipitation occurrence rate and contribution rate for each precipitation grade at 22 meteorological stations in Jiangsu Province from 1960 to 2020. The precipitation occurrence rate exhibits a decreasing trend as the precipitation grade increases, with a notable decrease between the occurrence rates of light rain and middle rain. In contrast, the precipitation contribution rate shows an initial increase followed by a decrease, with minimal changes across the four classes. The occurrence rate of light rain is the highest at 74.34%, indicating that light rain events dominate in Jiangsu Province. Despite the lower occurrence rates of middle rain (16.10%), heavy rain (6.52%), and torrential rain (3.03%), compared to light rain, their contribution rates exceed their occurrence rates. Notably, torrential rain contributes 24.71% despite having an occurrence rate of only 3.03%. The combined contribution rates of heavy rain and torrential rain reach 49.67%, indicating that nearly half of the rainfall in Jiangsu Province is attributed to these two grades.

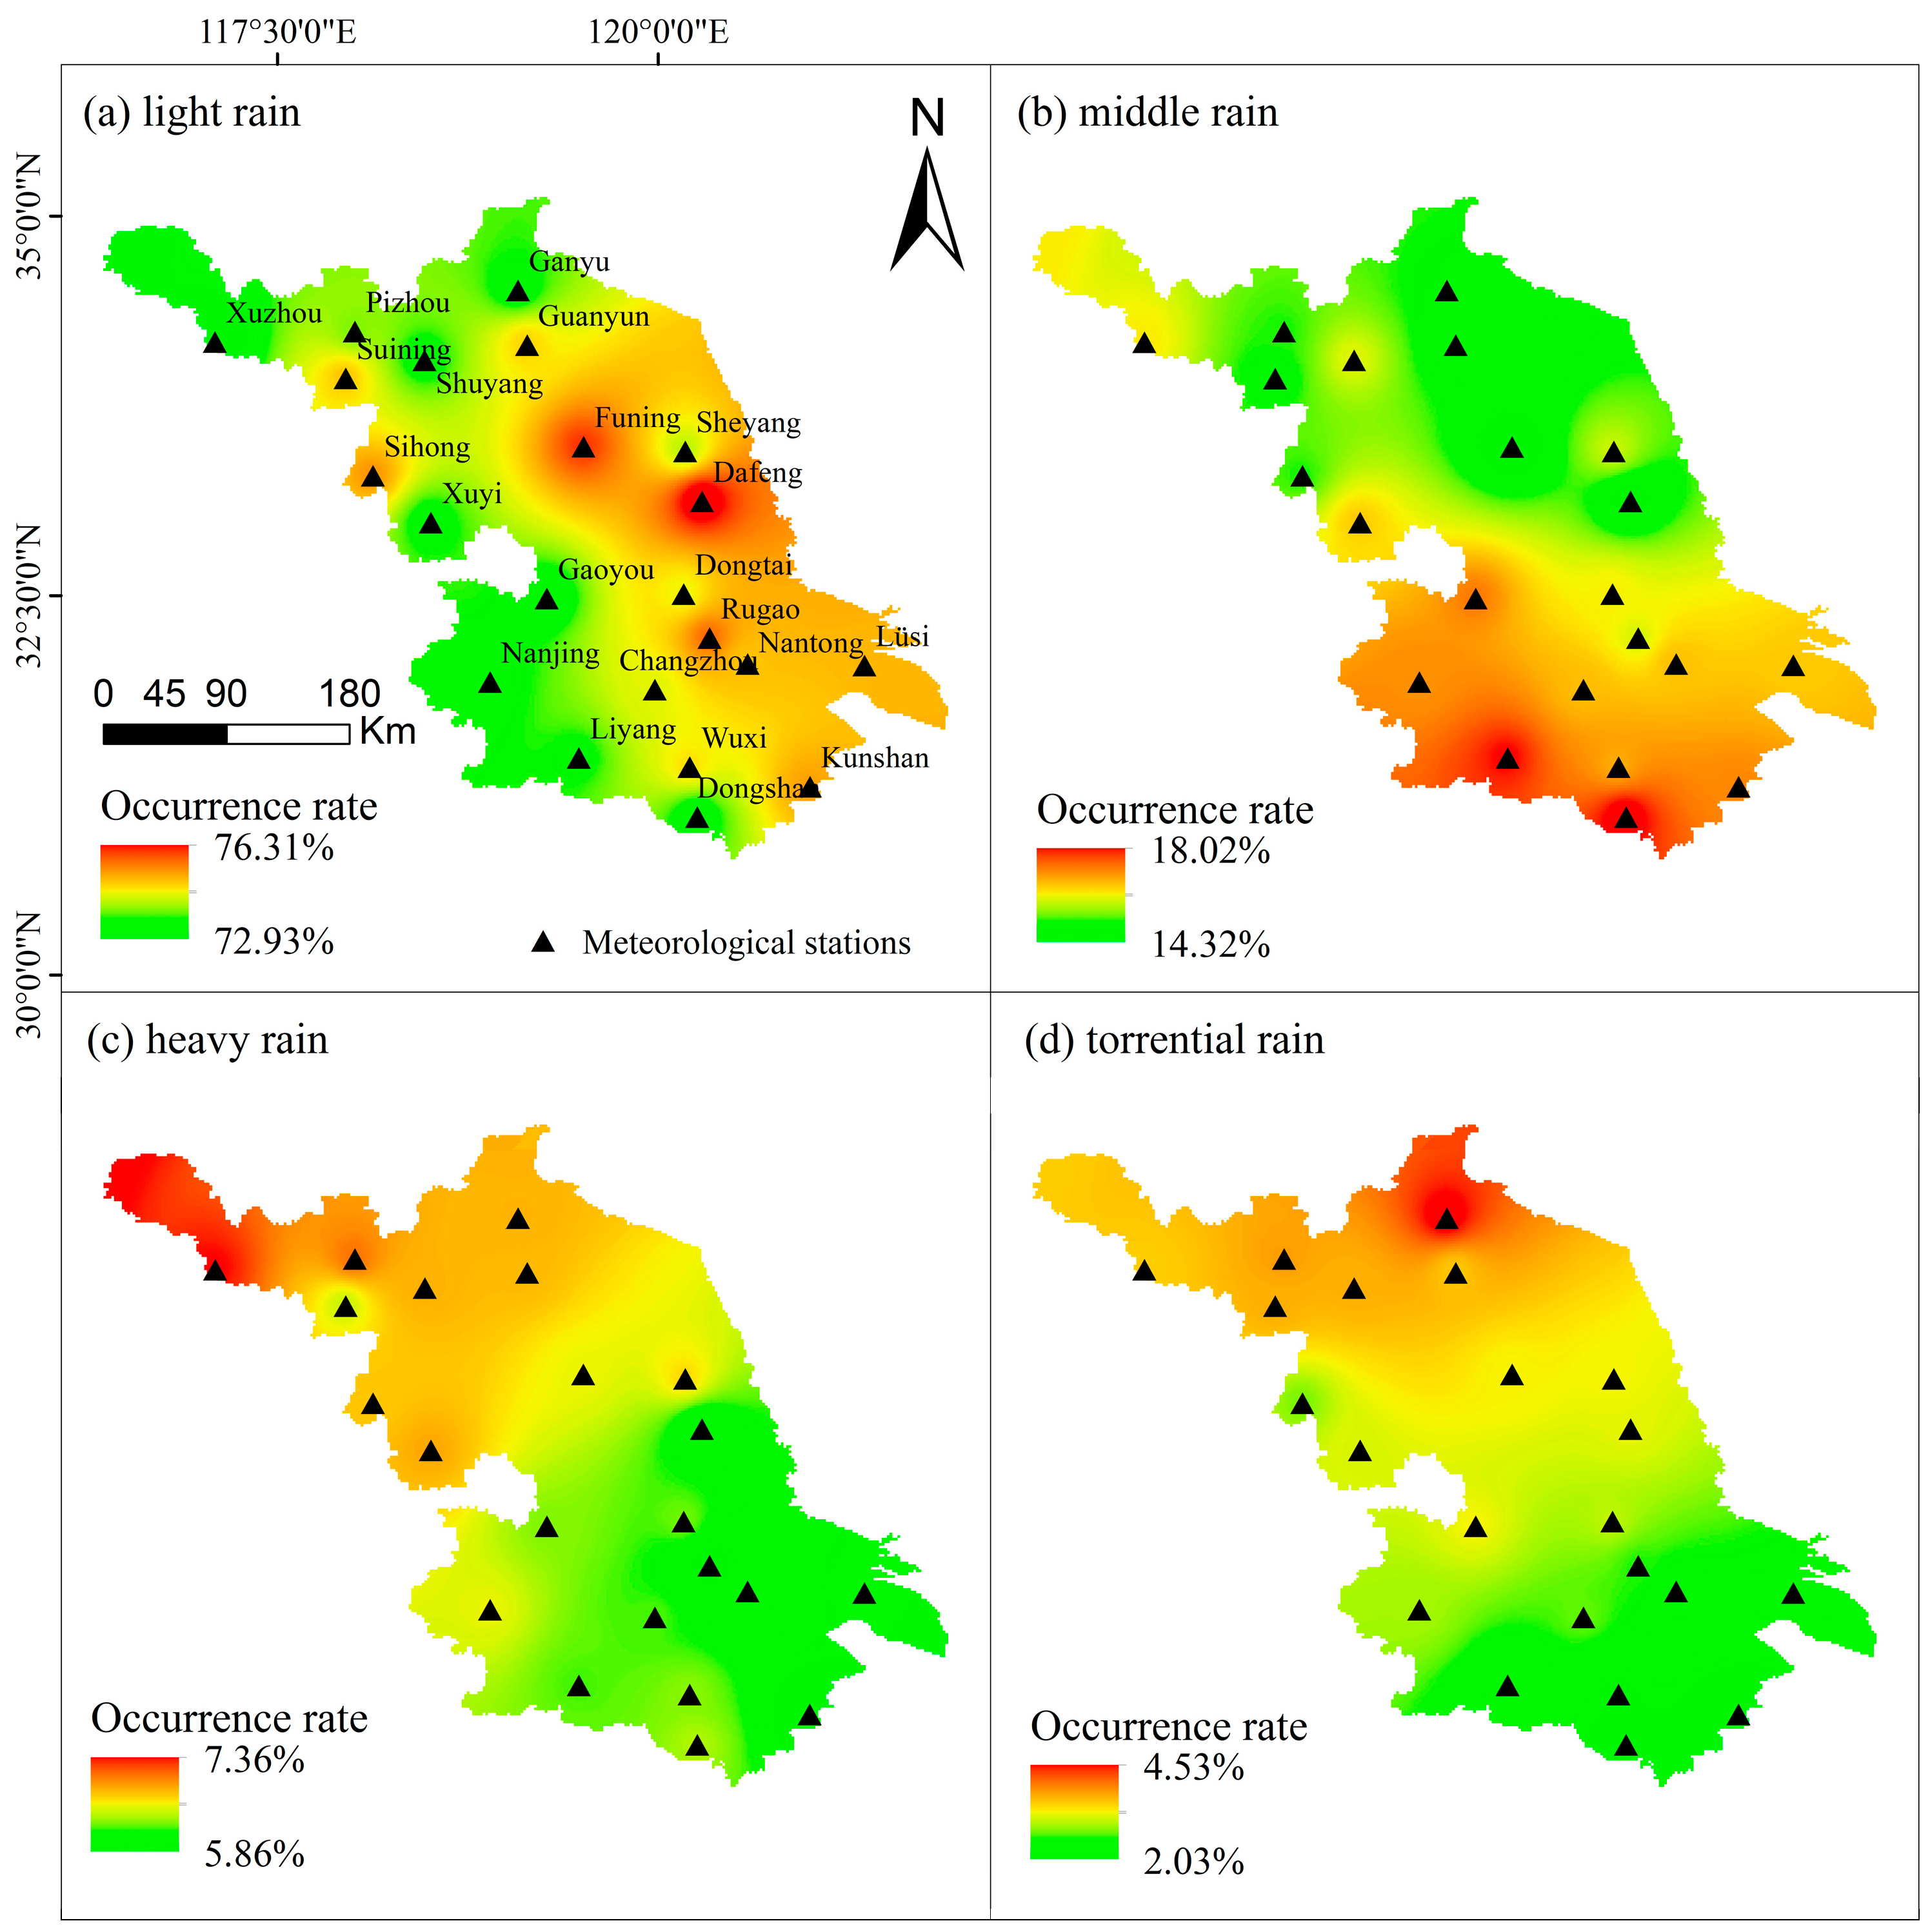
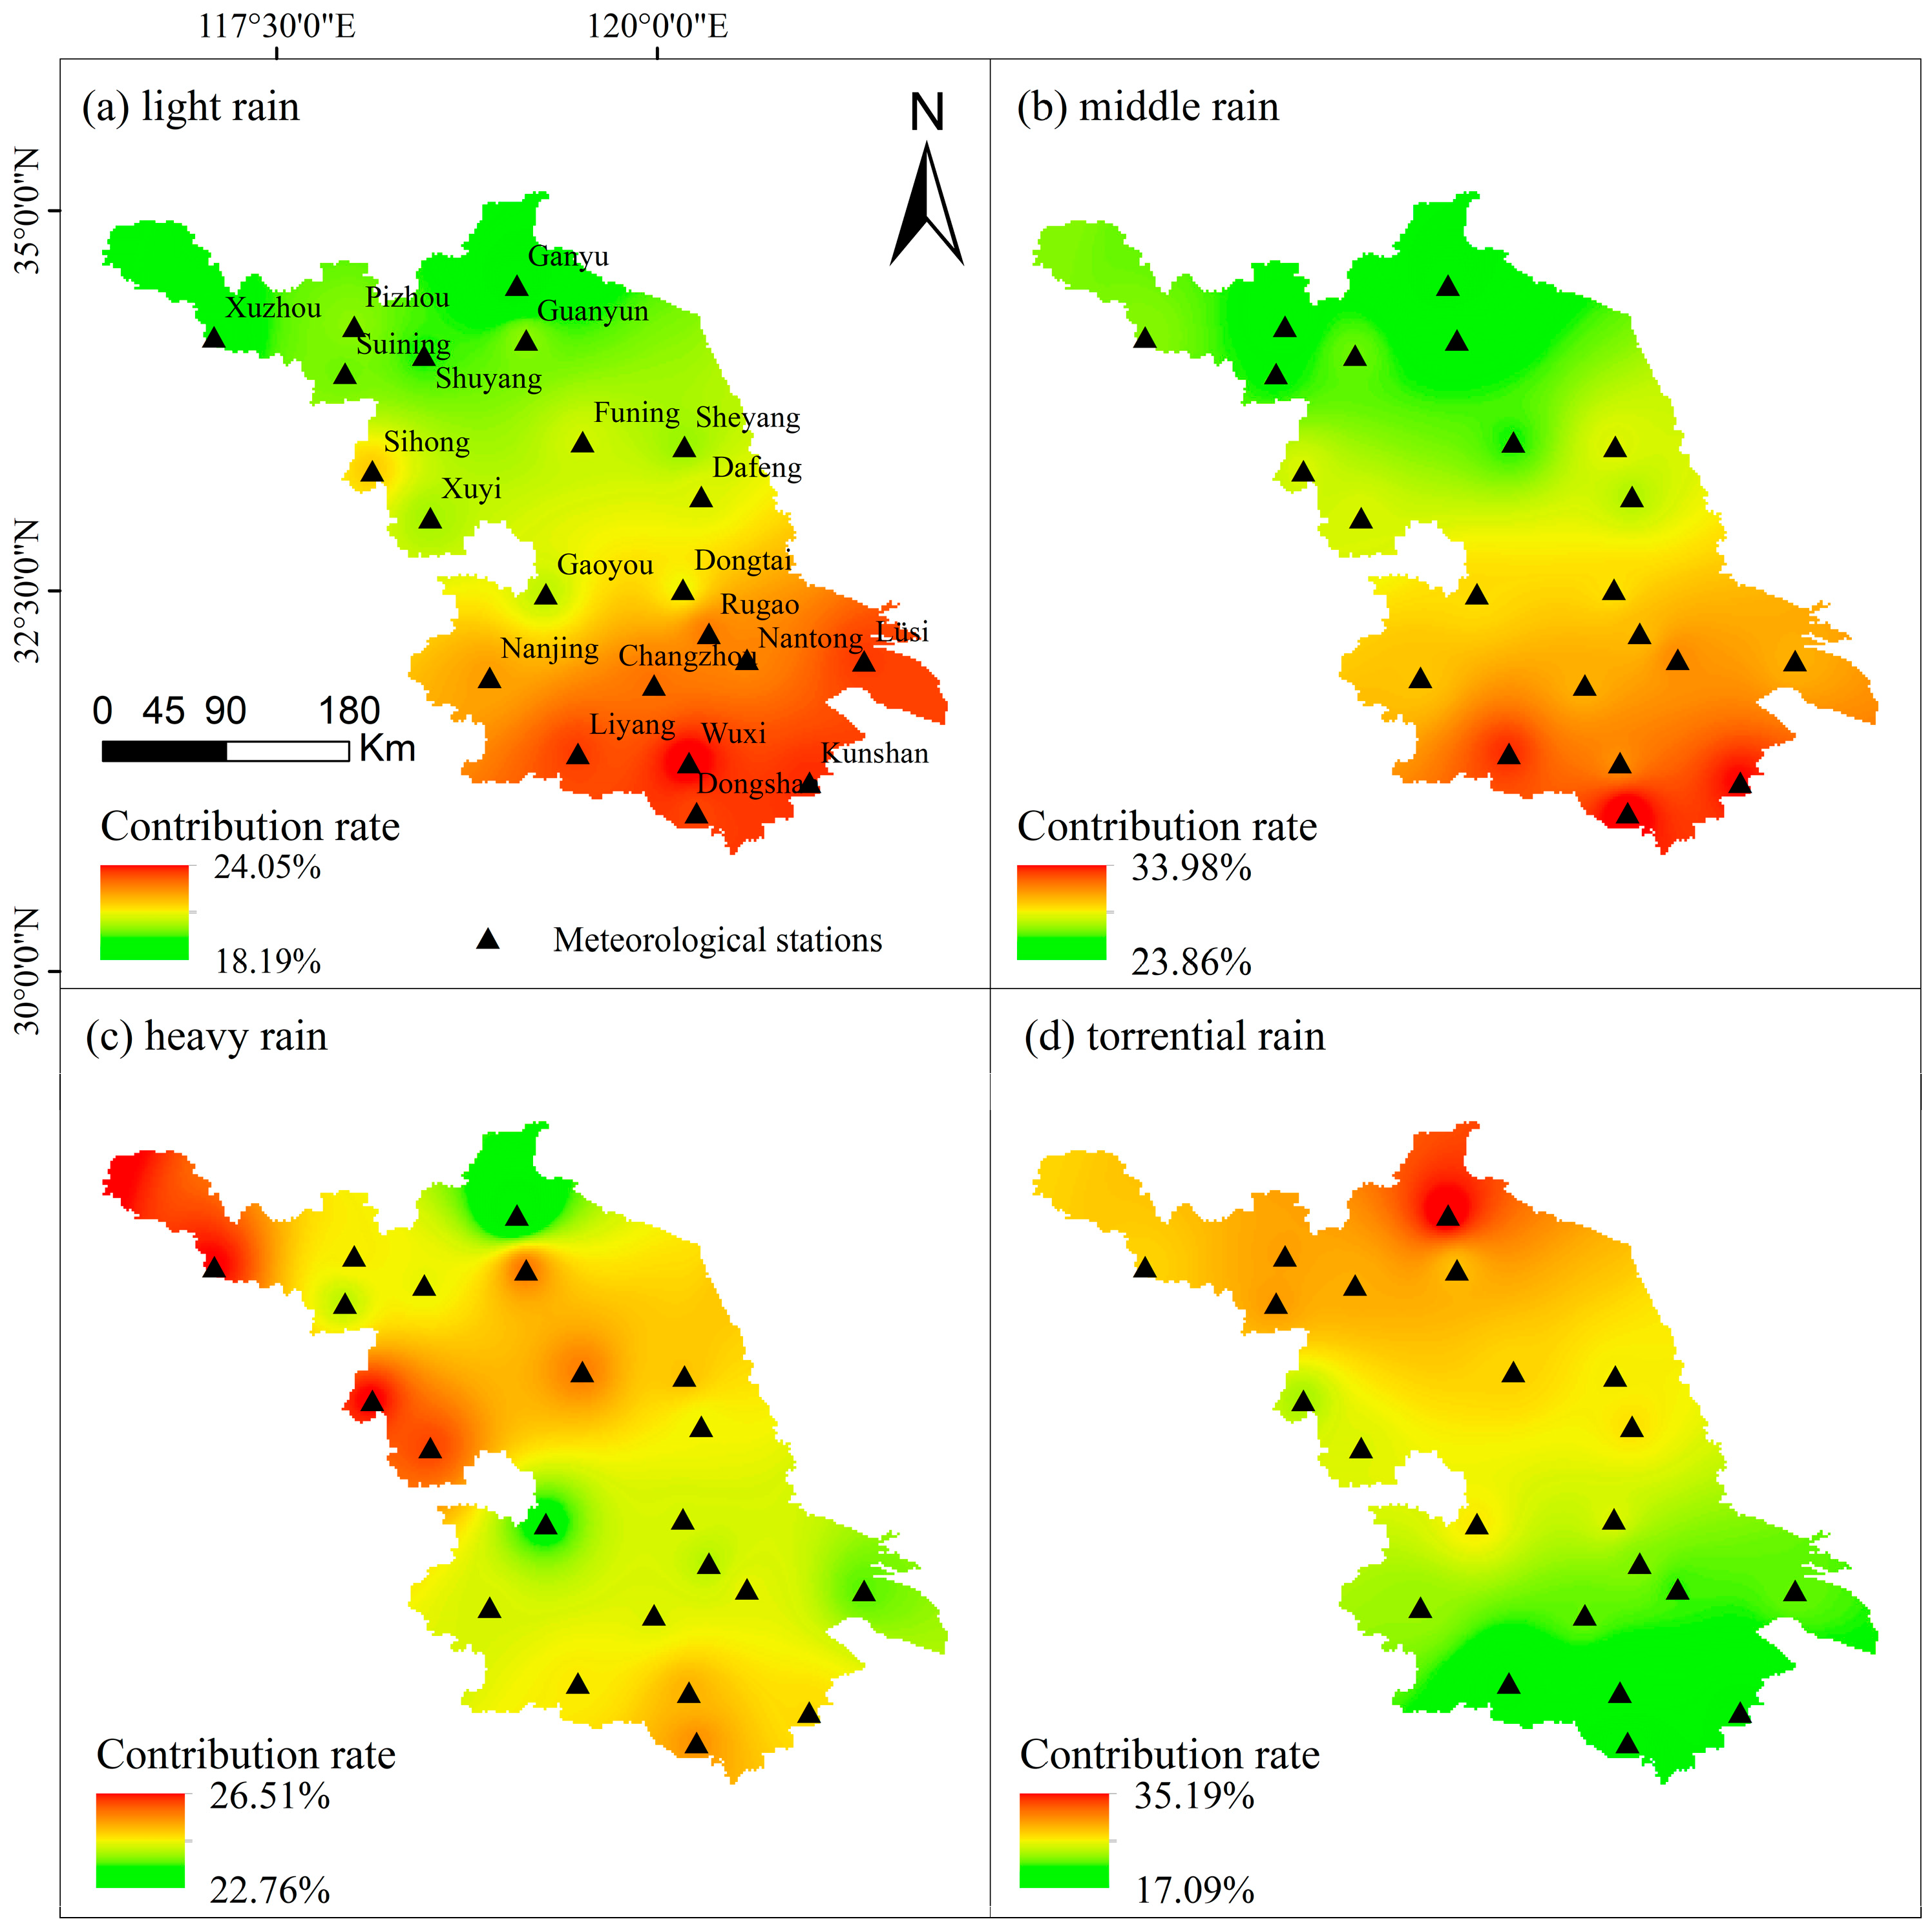
3.4. Spatial Characteristics of the Precipitation Occurrence Rate and Contribution Rate for Various Grades

Figure 6 and Figure 7 display the spatial distribution of the precipitation occurrence rate and contribution rate at various levels in Jiangsu Province. Figure 6a shows that the occurrence rate of light rain ranges from 72.93% to 76.31%, with a small range of variation. Spatially, it increases from west to east, indicating a generally high occurrence rate of light rain in Jiangsu Province. Dafeng (76.31%) has the highest precipitation occurrence rate followed by Funing (75.79%), and Xuzhou (72.93%) has the lowest rate. The occurrence rate of middle rain in Jiangsu Province ranges from 14.32% to 18.02%, exhibiting a significant decrease compared to light rain. Spatially, it increases from north to south. Dongshan (18.02%) has the highest precipitation occurrence rate while Funing (14.32%) has the lowest. The occurrence rate of heavy rain and torrential rain exhibit similarities in spatial distribution. The occurrence rate of heavy rain decreases from northwest to southeast, while the occurrence rate of torrential rain decreases from north to south. Xuzhou (7.36%) has the highest occurrence rate of heavy rain and Kunshan (5.86%) has the lowest. Ganyu (4.53%) has the highest occurrence rate of torrential rain while Kunshan (2.03%) has the lowest. Figure 6 illustrates that light rain is the predominant precipitation type in Jiangsu Province. The occurrence rate of middle rain is higher in southern Jiangsu than in northern Jiangsu, whereas the occurrence rate of heavy rain and torrential rain is higher in northern Jiangsu than in southern Jiangsu.
Figure 7a illustrates that the contribution rate of light rain in Jiangsu Province spans from 18.19% to 24.05%, with Wuxi exhibiting the highest contribution rate (24.05%) and Ganyu exhibiting the lowest (18.19%). Spatially, there is a north-to-south increasing trend, with the eastern part of Jiangsu generally experiencing higher rates compared to the western part. Similarly, the occurrence rate of middle rain exhibits a spatial distribution akin to that of light rain, with an increasing contribution rate observed at each station. Notably, Dongshan demonstrates the highest rate (33.98%) while Ganyu records the lowest (23.86%). Conversely, the occurrence rate of heavy rain displays a narrower range of variation and manifests a northwest-to-southeast decreasing trend in spatial distribution. Notably, northern and central Jiangsu generally exhibit lower rates compared to other areas. Furthermore, the occurrence rate of torrential rain demonstrates a north-to-south decreasing trend in spatial distribution. Ganyu records the highest contribution rate (35.19%) while Dongshan records the lowest (17.09%), which starkly contrasts with the contribution rate of moderate rain. By considering Figure 7 collectively, it becomes apparent that light and middle rain account for nearly half of the rainfall in southern Jiangsu, whereas heavy and torrential rain contributes nearly half of the rainfall in northern Jiangsu.

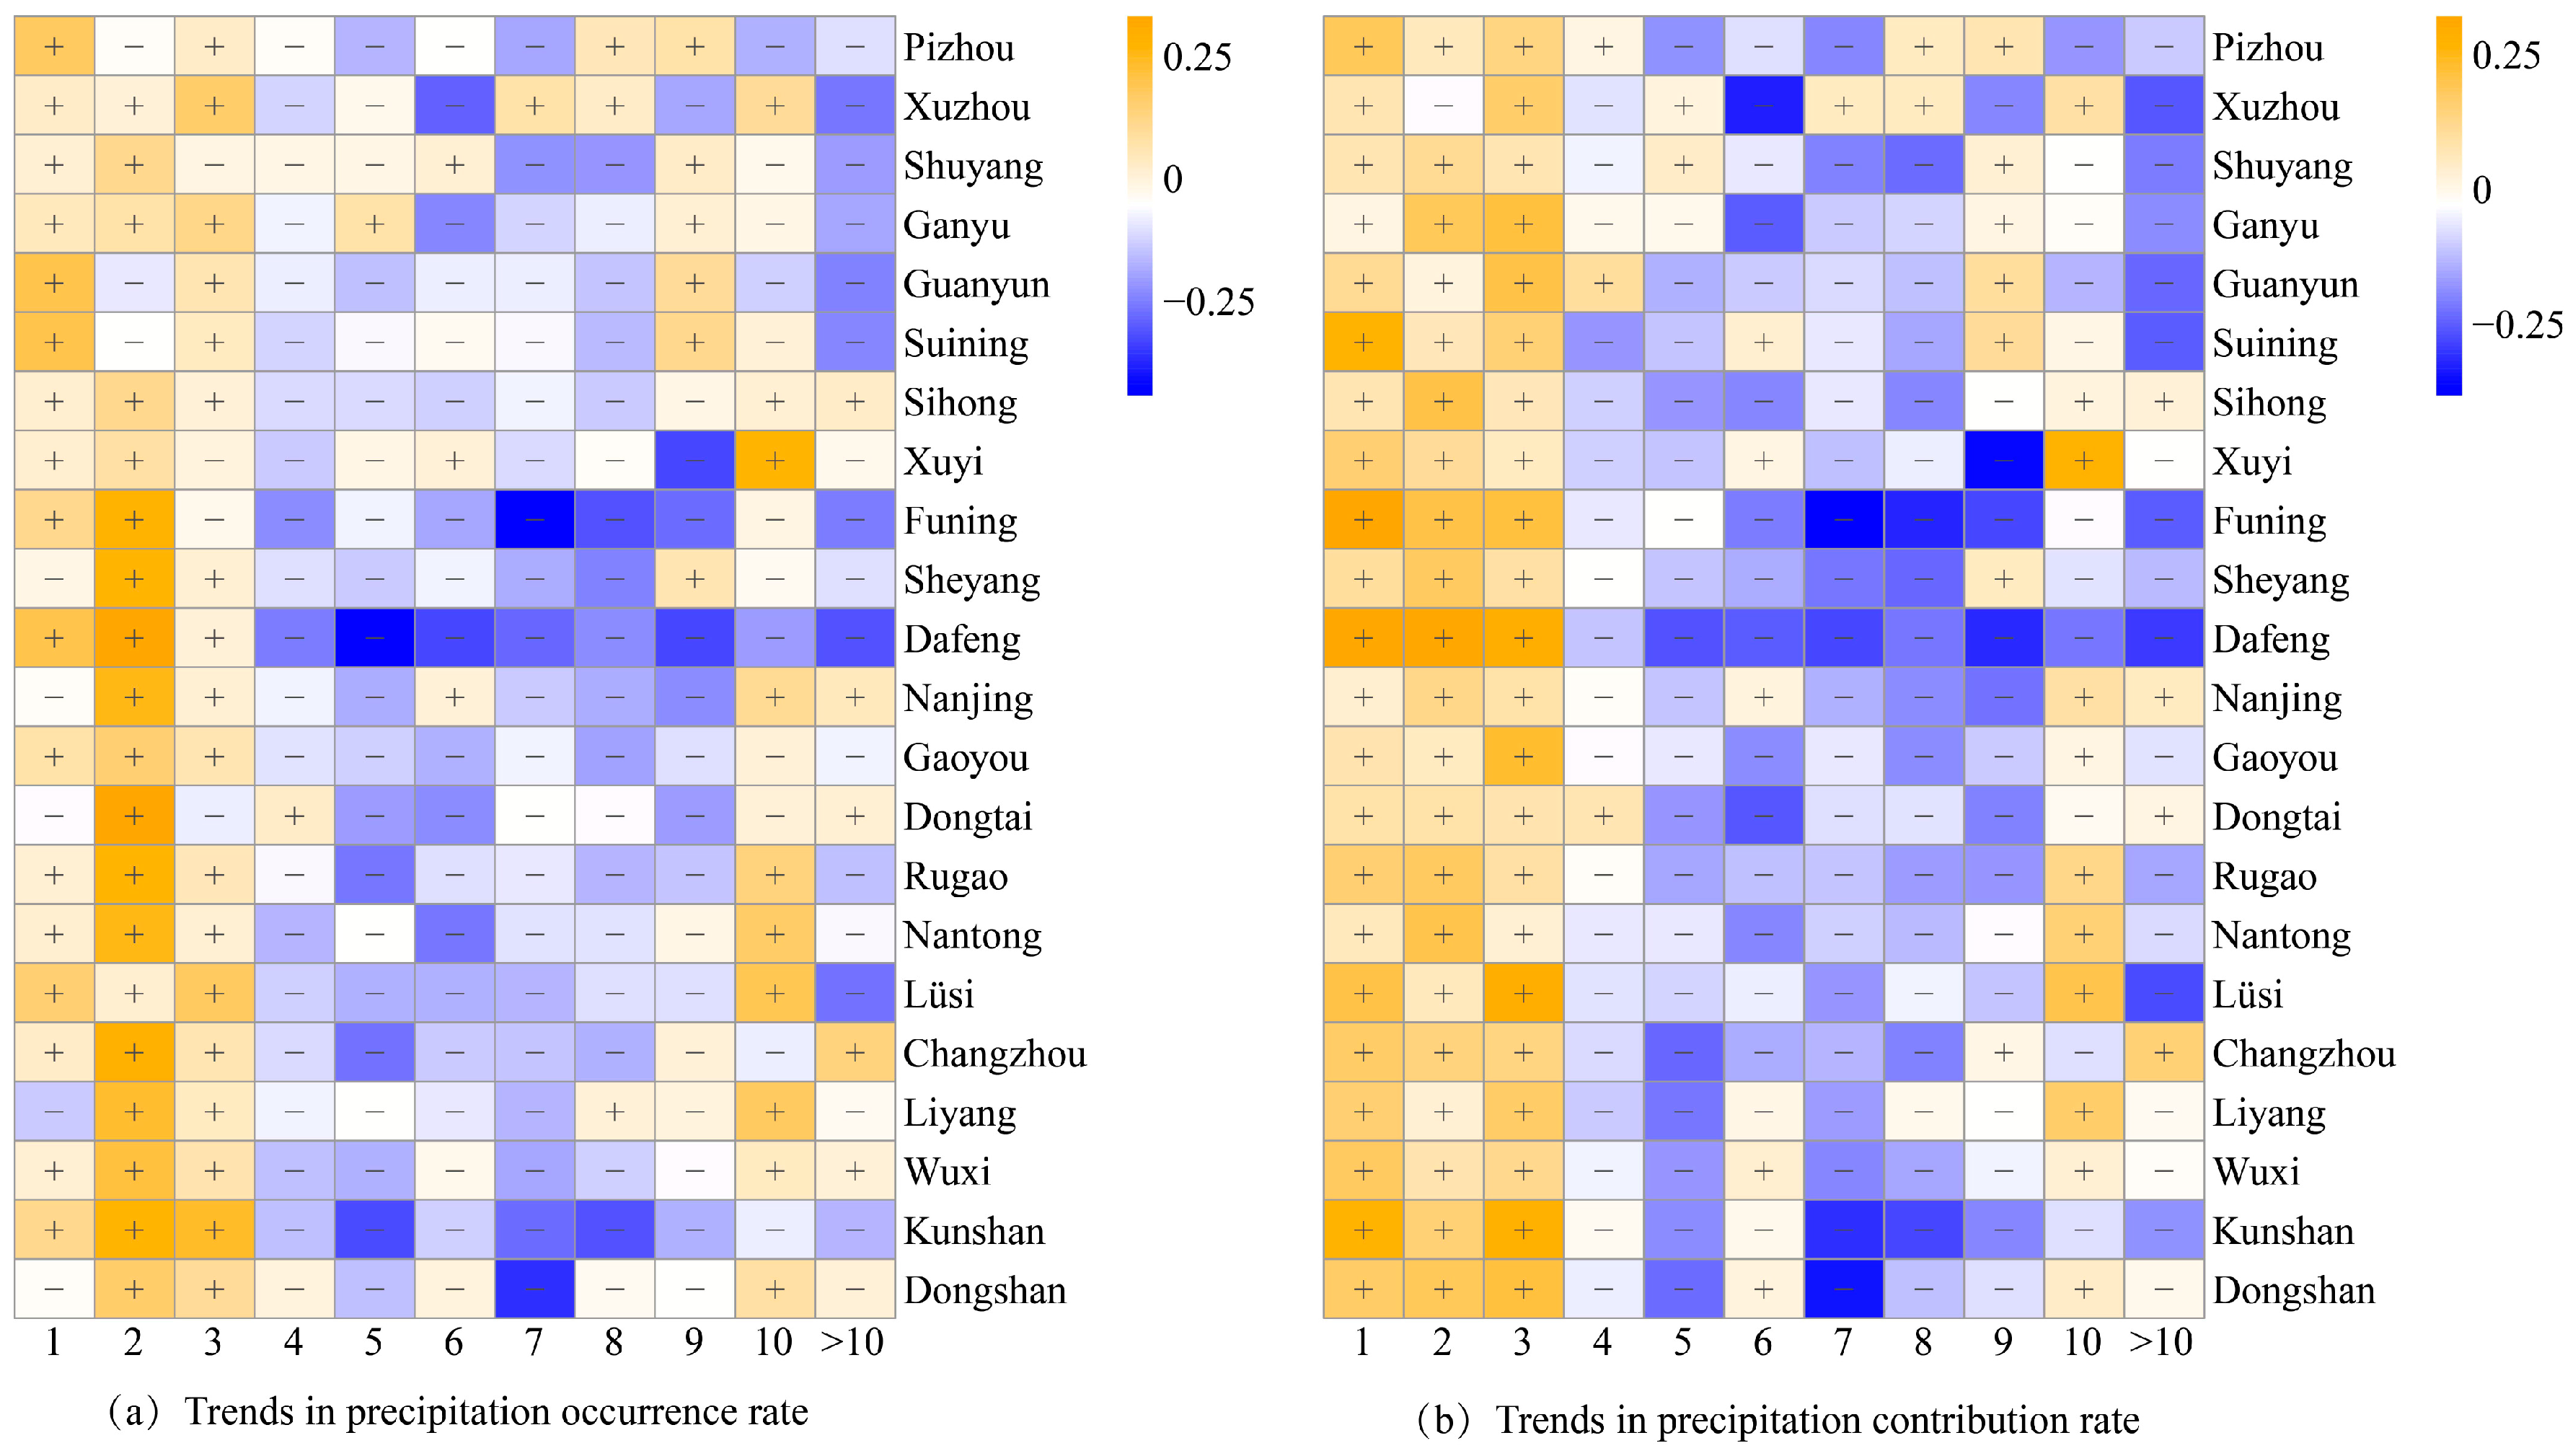
3.5. Kendall’s Tau Trend Analysis of the Precipitation Occurrence Rate and Contribution Rate for Each Duration

Figure 8a shows that the precipitation occurrence rate decreases at most stations as the precipitation duration increases. For the 1 d to 3 d duration, the majority of the stations show an increasing trend, and 10 stations show an increasing trend for three consecutive durations. The 4 d duration shows a decreasing trend for the majority of the stations. The 1 d to 3 d duration shows an increasing trend for 77.27%, 86.36%, and 81.81% of the stations, respectively. The 4 d duration shows a decreasing trend for all stations except for Dongtai station. The 5 d duration shows a decreasing trend for all stations except for Ganyu station. The 7 d duration shows a decreasing trend for all stations except for Xuzhou station. The number of stations with increasing precipitation occurrence rates increased to 10 stations in the 10 d calendar. In the total precipitation occurrence rate, Kunshan station and Gaoyou station show a decreasing trend after the 4 d duration, and Funing station shows a decreasing trend after the 2 d duration, while they show an increasing trend in the rest of the duration. Combined with the above explanation, the precipitation occurrence rate in Jiangsu for the 1–3 d duration shows an obvious increasing trend, the precipitation for the 4–9 d duration shows an obvious decreasing trend, and although there is a certain increasing trend for the 10 d and >10 d duration, more than half of the stations show a decreasing trend. Figure 8b shows that with the increase in the precipitation duration, the trend of the precipitation contribution rate is consistent with the occurrence rate. Except for Xuzhou station, which shows a decreasing trend in the precipitation contribution rate at the 2 d duration, all stations show an increasing trend from the 1 d to 3 d duration. The Kunshan, Dafeng, and Funing stations all show a decreasing trend in the precipitation contribution rate after the 4 d duration. Overall, the trends of the precipitation occurrence rate and contribution rate are consistent at all stations, except for some differences at individual stations.

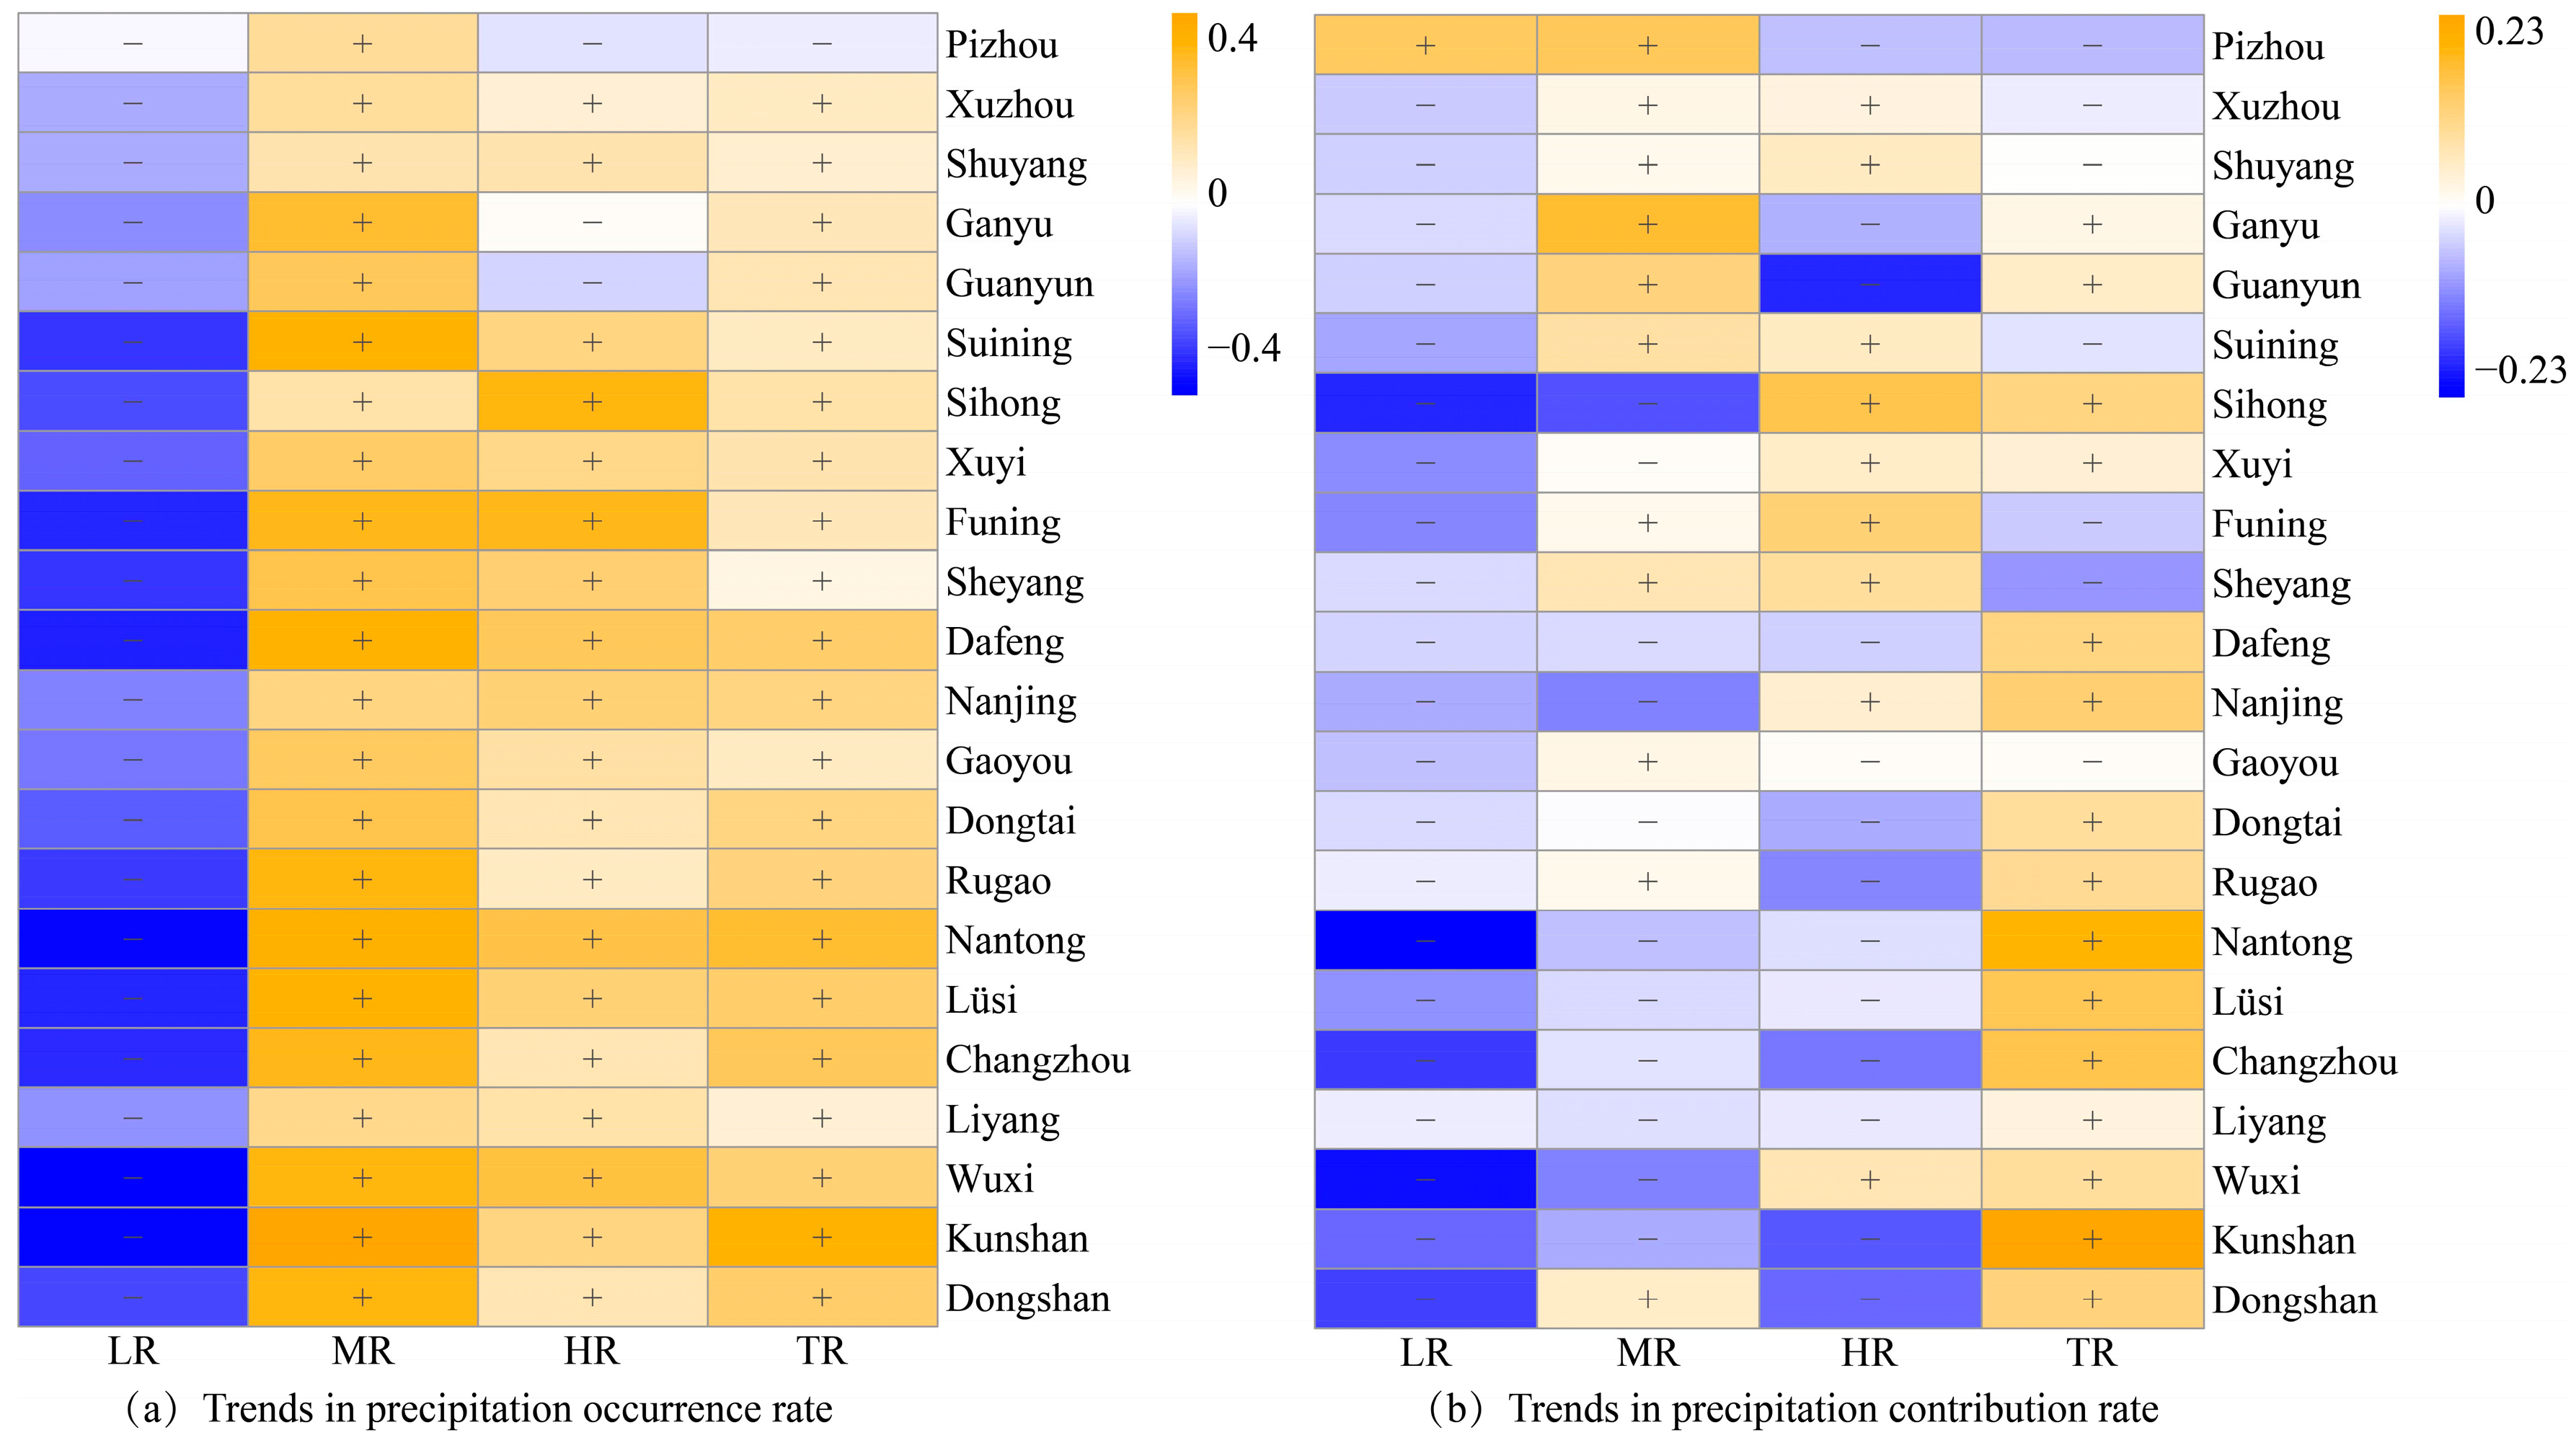
3.6. Kendall’s Tau Trend Analysis of the Precipitation Occurrence Rate and Contribution Rate for Each Grade

From Figure 9a, it can be seen that all 22 stations showed a decreasing trend in the incidence of light rain and an increasing trend in the incidence of middle rain. Except for Pizhou, Ganyu, and Guanyuan stations, all stations showed a decreasing trend in the occurrence of heavy rain. It is worth mentioning that only Pizhou station shows a decreasing trend in both heavy rain and torrential rain. The middle and heavy rain contribution rates of the stations in Figure 9b show trend changes that are quite different from the occurrence rates. The light rain contribution rates show a decreasing trend at all stations except for Pizhou station. Half of the stations with a middle-rain contribution show a decreasing trend, and more than half of the stations with a heavy-rain contribution showed a decreasing trend. The torrential-rain contribution, on the other hand, shows a decreasing trend at seven stations. Combined with the above, this shows that while the overall increase in the precipitation occurrence rate of middle rain and heavy rain is observed, their contribution rates are decreasing, and torrential rain may become the main type of precipitation contributing to the rainfall in Jiangsu Province.

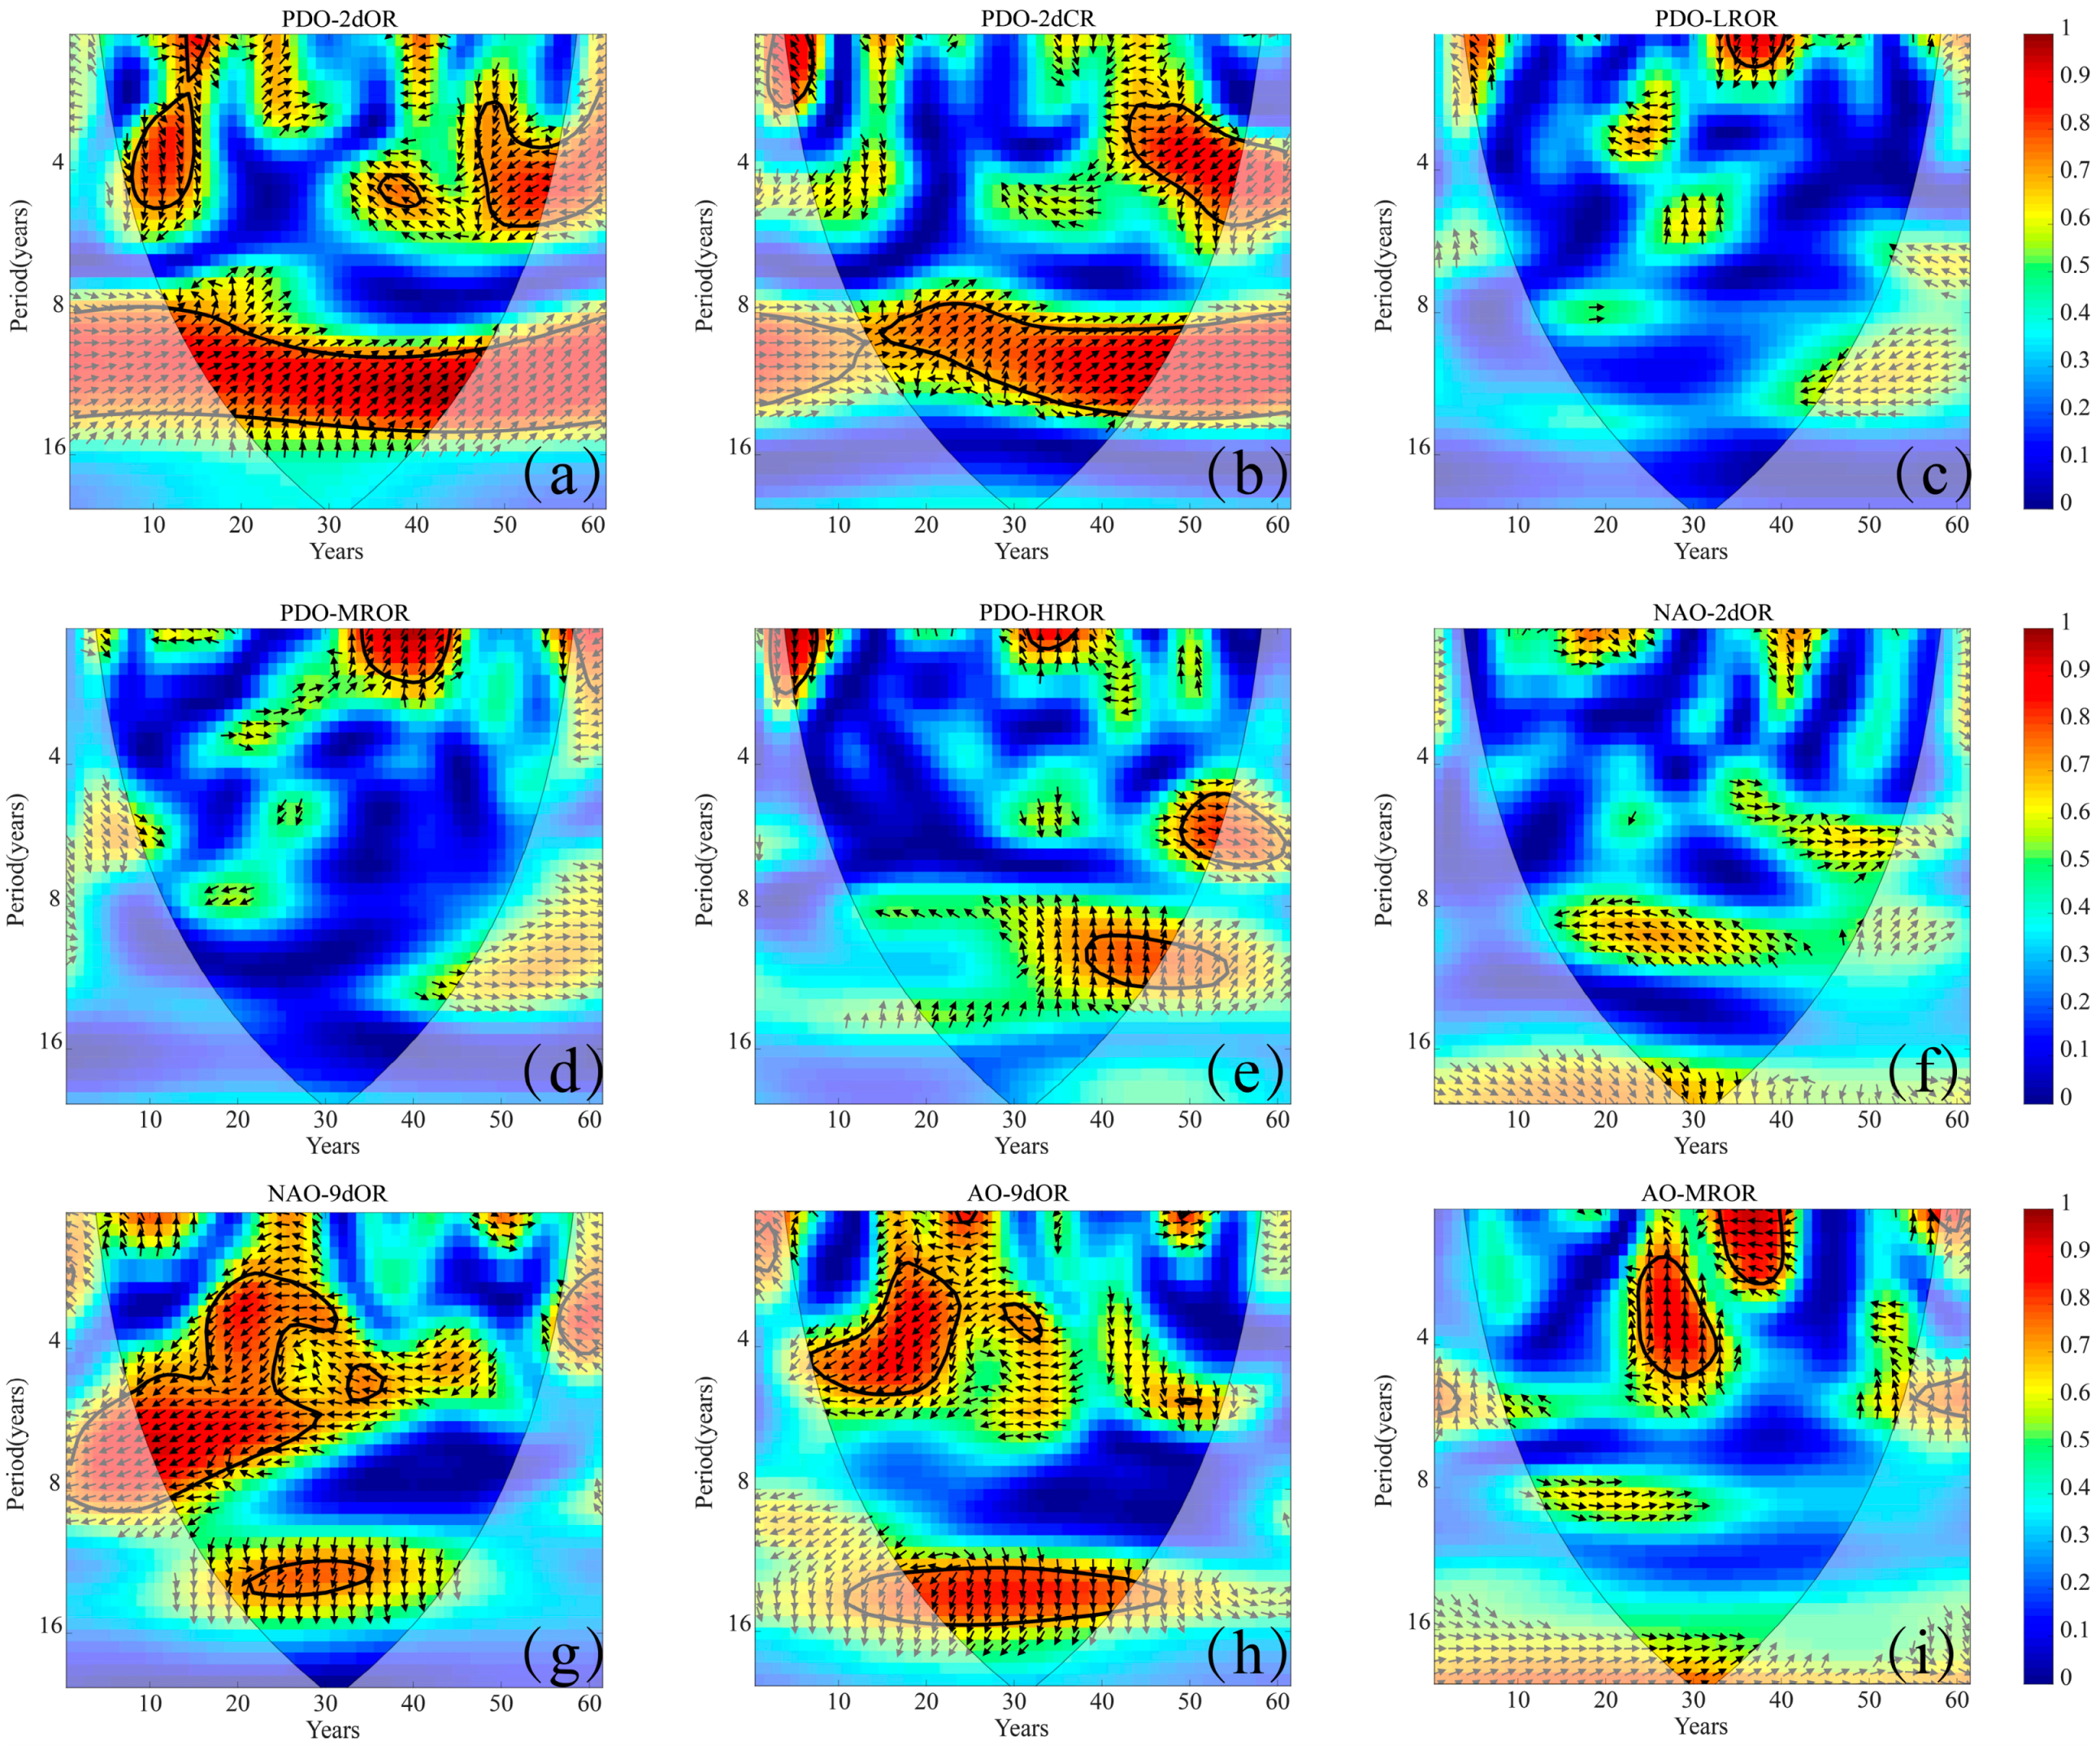
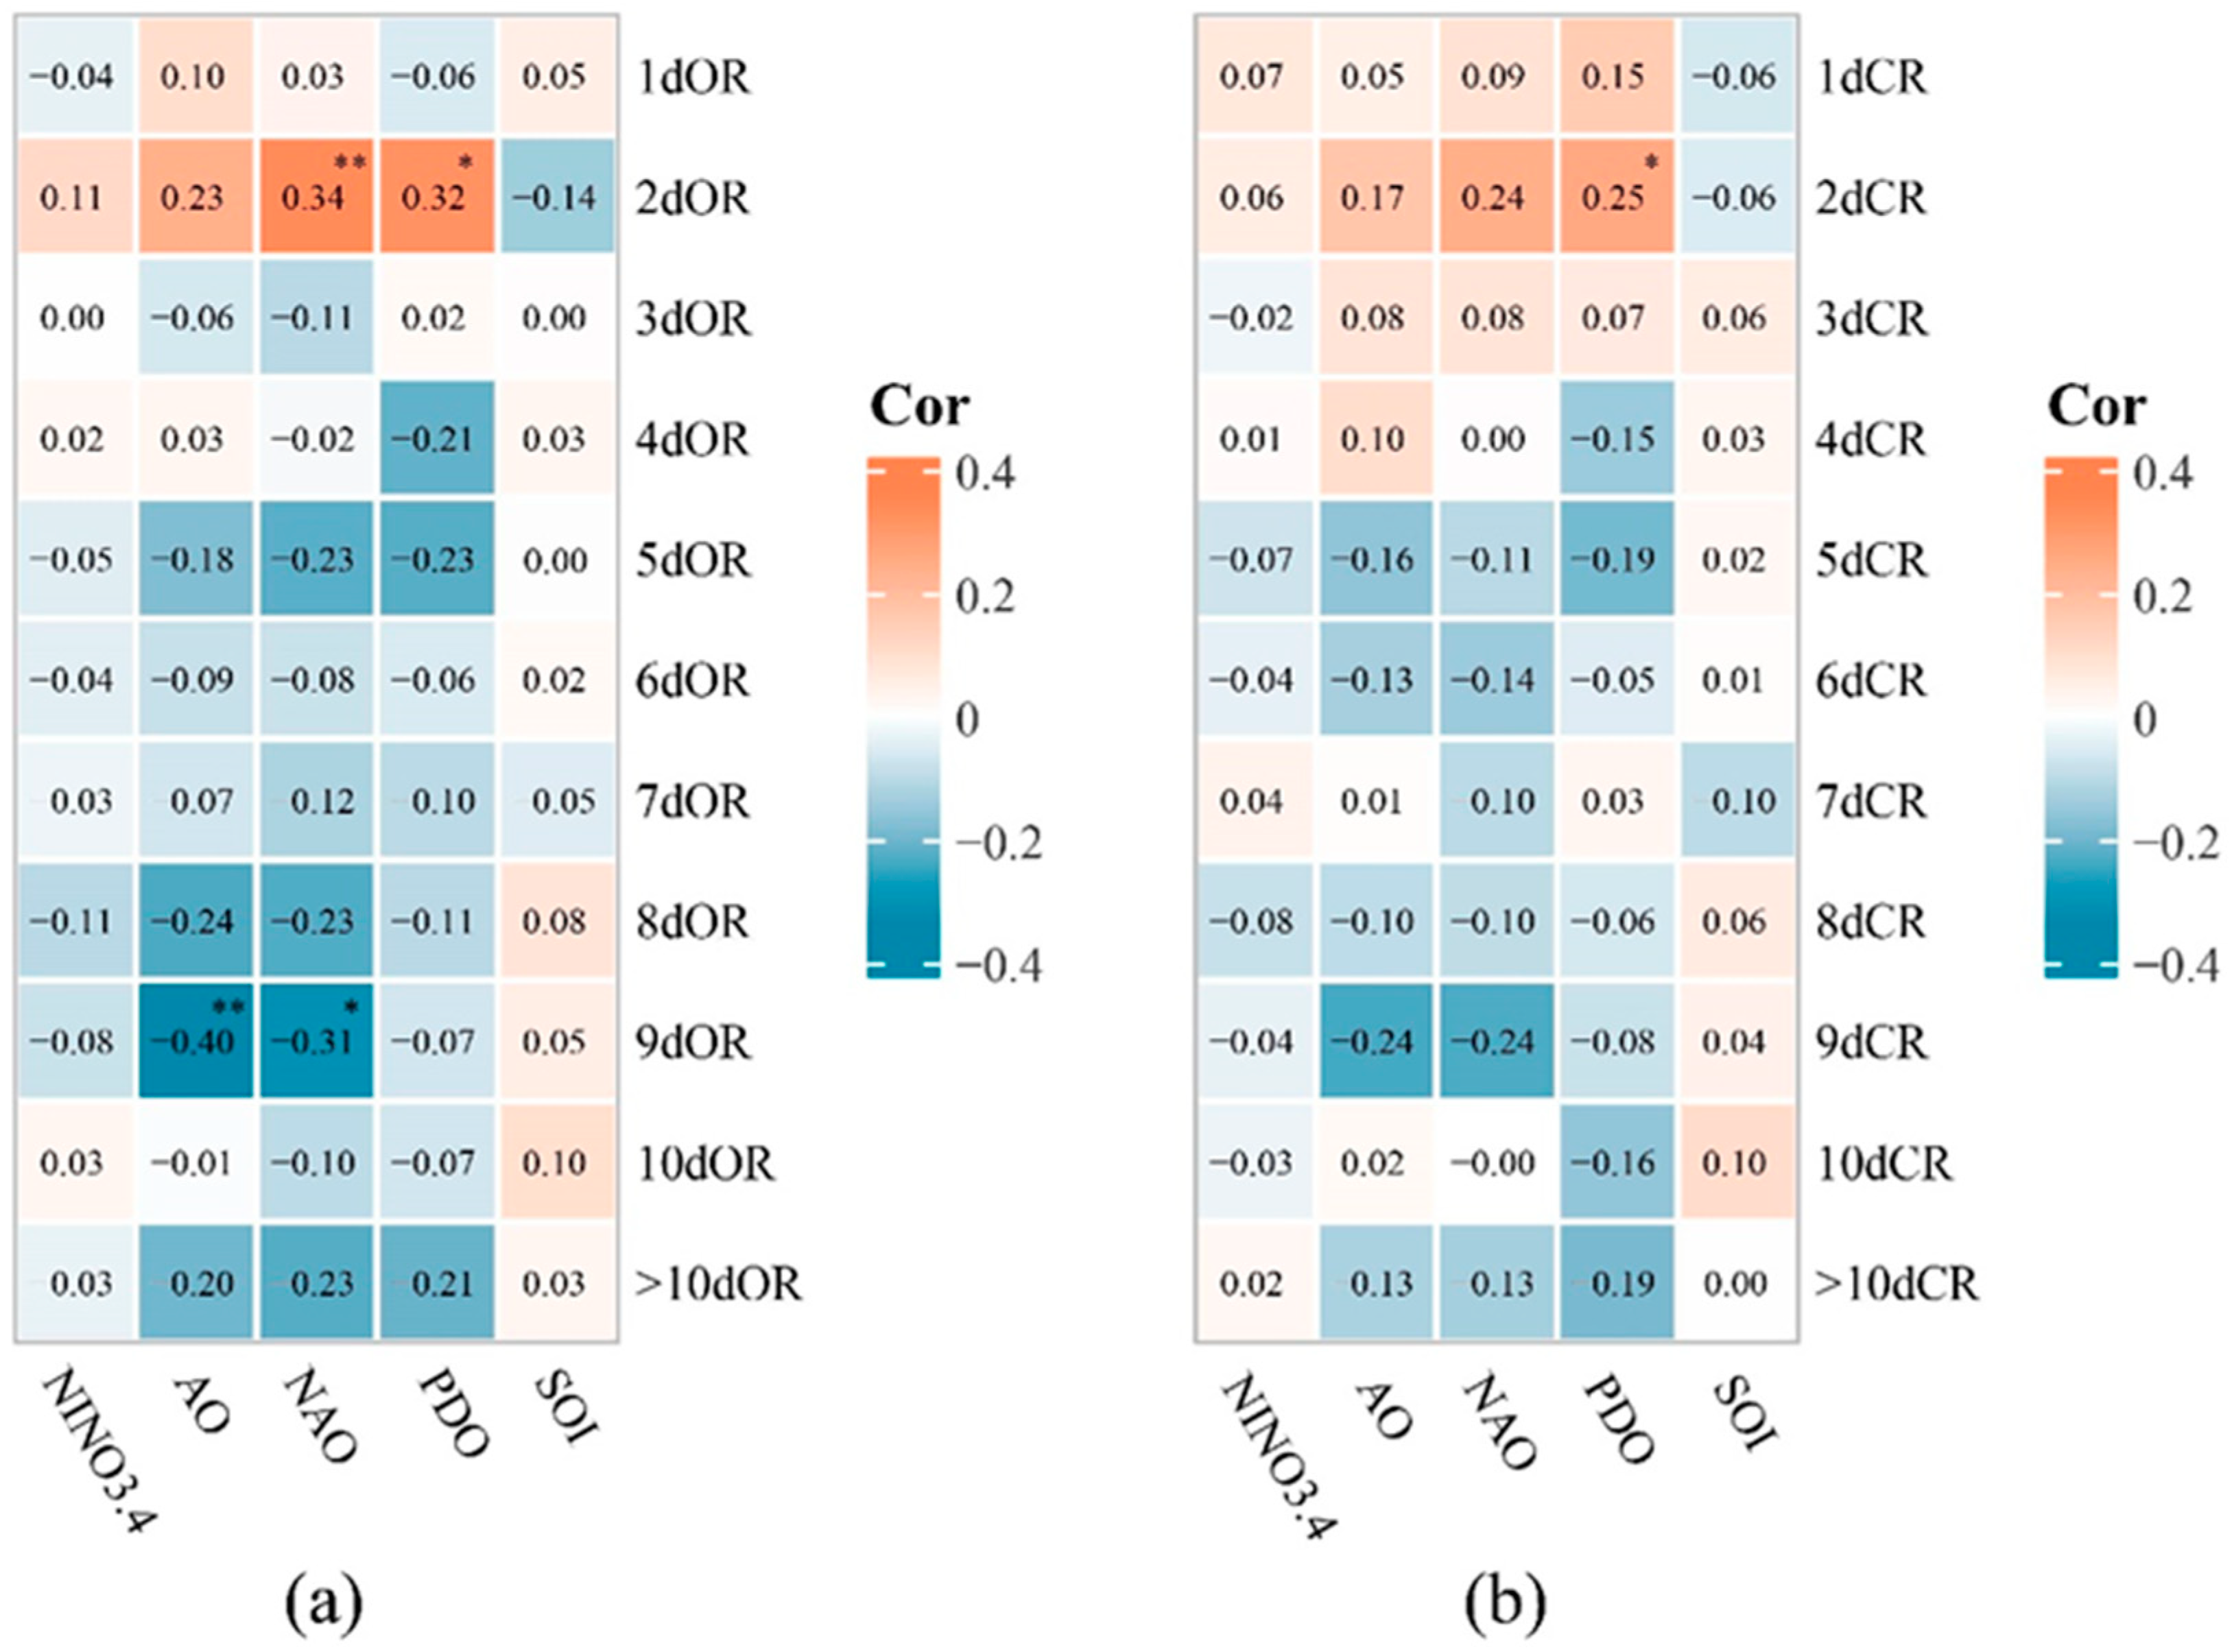
3.7. Correlation Analysis of the Precipitation Occurrence Rate and Contribution Rate with Climate Indicators for Each Duration

Five northern hemisphere climate circulation indicators were selected, which have a certain influence on northern hemisphere precipitation changes [50]. Figure 10 shows the Pearson correlation matrix between the precipitation occurrence rate and contribution rate and the atmospheric circulation indicators for each calendar time in Jiangsu Province from 1960 to 2020. In Figure 10a, the correlation between the AO and precipitation occurrence rate gradually changes from positive to negative with an increase in the precipitation duration, and there is a tendency for association enhancement. Among them, there is a significant negative correlation between the AO and the 9-day occurrence rate of precipitation (9dOR), with a significant level of p < 0.01. This means that, with an increase of the AO year by year, the 9dOR decreases in Jiangsu Province year by year. The NAO increases year by year, and the precipitation occurrence rate of the 2 d duration (2dOR) in Jiangsu Province also increases. In addition, there is a significant negative correlation between the NAO and 9dOR, with a significant level of p < 0.05. The PDO is negatively correlated with most of the precipitation occurrence rates but has a significant positive correlation with the 2dOR, with a significant level of p < 0.05. There is no significant correlation between NINO3.4 and SOI and the precipitation occurrence rates, which suggests that NINO3.4 and SOI have a weak effect on the precipitation occurrence rate in Jiangsu Province at all times.
In Figure 10b, the correlation between the precipitation contribution rate with an increasing precipitation duration and climate indices varies basically in the same way. Except for the more significant positive correlation between the PDO and the precipitation contribution rate of the 2 d duration (2dCR) (significant level p < 0.05), the other indices do not have significant correlations. This indicates that NINO3.4, the AO, NAO, and SOI also have a weak effect on the precipitation contribution rate in Jiangsu Province in duration.

3.8. Correlation Analysis of the Precipitation Occurrence Rate and Contribution Rate with Climate Indicators for Each Grade

Figure 11 presents the Pearson correlation matrix depicting the relationship between the occurrence rate and contribution rate of precipitation in each class, alongside atmospheric circulation indicators in Jiangsu Province from 1960 to 2020. A significant negative correlation is observed between the PDO and light rainfall occurrence rate (LROR) (p < 0.01), while a significant positive correlation exists between the PDO and middle rainfall occurrence rate (MROR) (p < 0.01). Furthermore, a more significant positive correlation is found between the PDO and heavy rainfall occurrence rate (HROR) (p < 0.05). Additionally, a significant positive correlation is observed between the AO and MROR (p < 0.05). These findings suggest that the PDO and AO exert a significant influence on the occurrence of light rain, middle rain, and heavy rain in Jiangsu Province. Additionally, NINO3.4 exhibits a positive correlation with the occurrence of other classes, except for a negative correlation with light rain. Conversely, the NAO and SOI show a negative correlation with light rain and heavy rain but a positive correlation with middle rain and torrential rain. However, these correlations are not statistically significant and have a relatively minor influence on the incidence rates of the respective classes in Jiangsu Province. Furthermore, no significant correlation is found between these climate indices and the precipitation contribution rates across the four grades in Jiangsu Province. This suggests that changes in climate indices have a minimal impact on the precipitation rates of these grades in Jiangsu Province.

4. Discussion

At present, the definition of precipitation structure-related studies remains ambiguous. However, several studies have delineated the spatial and temporal alterations in the precipitation structure within specific regions by defining the precipitation index. This approach aims to investigate the interrelated impacts between precipitation, water resource management, and human production activities [51,52,53,54]. Researchers have employed the Taylor diagram, Geo-Detector, M-K, and Sen’s slope methods for data analysis as well as the atmospheric moisture tracking model to contribute substantially to precipitation change-related research. However, this study aims to analyze the likelihood of different precipitation durations and grades, as well as the extent of their contribution to the total precipitation. It further seeks to more intuitively depict the key precipitation types, events, and their respective trends within Jiangsu Province.
The overall trend of the precipitation occurrence rate and contribution rate for each duration in Jiangsu Province is that the precipitation occurrence rate decreases as the precipitation duration increases, while the precipitation contribution rate initially increases and then decreases. However, this phenomenon is consistent with what we call the scaling hypothesis (also known as the Hurst phenomenon), which states that in areas such as hydrological cycle processes and climate change, uncertainty in the process (the presence of sharp fluctuations/variations in the time series) may be associated with long-term-dependent behavior [55]. A study of the scaling hypothesis can help to understand the stochastic similarities in hydrological cycle processes, which can provide valuable references for future meteorological forecasting, hydrological modeling, and so on.
The statistical features of both the precipitation occurrence and contribution rates for each calendar period in Jiangsu Province suggest a predominance of short-term, 1–3-day duration precipitation events. The spatial distribution reveals a higher probability of short-duration precipitation in northern Jiangsu, while long-duration precipitation is more likely to occur in the south. The distribution of the precipitation contribution rate aligns with these trends. Meanwhile, combining Figure 3a and Figure 4a shows that the variation of both the precipitation occurrence rate and contribution rate in the 1 d duration is more than 10%, and this difference may affect the agricultural cultivation pattern and flood control measures in Jiangsu Province. While the northern and southern regions of Jiangsu share similarities in terms of topography and geomorphology, both being predominantly plains, there are significant differences in the economic development and urbanization levels between the two. The southern part of Jiangsu is notably more developed. Jiangsu Province is mainly rice growing and is among the top five provinces in China in terms of rice production. The higher occurrence and contribution of the northern Jiangsu region may result in greater soil moisture and higher air humidity, which is favorable for rice cultivation. However, the southern part of Jiangsu has a more complete irrigation system, so the low occurrence and contribution rates will have less impact on its rice cultivation [56]. For flood control, the overall risk of flooding is higher in Jiangsu Province as a whole due to its lower elevation, and the problems faced by the northern part of the province may be more severe. The statistical analysis of the precipitation occurrence and contribution rates across different classes in Jiangsu Province reveals that light rain events, accounting for up to 74.34% of occurrences, are predominant. Additionally, despite the relatively low incidence rates of heavy rain (6.52%) and torrential rain (3.03%), these events contribute to nearly half of Jiangsu Province’s total rainfall. Spatially, the northern part of Jiangsu Province has a higher probability of experiencing heavy and torrential rain compared to the south. This pattern is mirrored in the distribution of the contribution rate. Synthesizing the above findings, despite the dominance of the 1–3-day light rain events in Jiangsu Province, the northern region has a higher probability of experiencing short-duration heavy and torrential rain events, contributing significantly to total rainfall. This indicates a higher risk of flooding in the northern part of Suzhou compared to its southern part. These findings align with previous studies on the precipitation concentration in Jiangsu Province, which identified the northern part of Suzhou as having a higher concentration of precipitation primarily driven by torrential rain events [57].
The precipitation occurrence rate and contribution rate of 22 meteorological stations in Jiangsu Province from 1960 to 2020 also have certain trend changes. Regarding the precipitation duration, the precipitation occurrence rate and contribution rate of the 1–3 d duration shows a continuous increasing trend and a decreasing trend after the 4 d duration. This indicates that the probability of short-duration precipitation in Jiangsu Province is still increasing, but the probability of long-duration precipitation will decrease. Regarding the precipitation occurrence rate, light rain shows a decreasing trend while middle rain, heavy rain, and torrential rain show an increasing trend in Jiangsu Province. Except for torrential rain, the contribution of light rain, middle rain, and heavy rain shows a decreasing trend. Combined with the above illustration, the probability of short-calendar-time torrential rain in Jiangsu Province will increase, and the percentage of rainfall contributed by torrential rain also shows an increasing trend. This means that the precipitation type in Jiangsu Province tends to change to short-duration heavy precipitation. Not only that, the frequency of extreme precipitation events in the whole Yangtze River Delta region is also increasing [58]. For trend testing, the Kendall’s tau trend test used in this paper will be affected by the phenomenon of the scaling hypothesis to some extent. However, some scholars have made improvements to the original M-K trend test based on the scaling hypothesis and have obtained more reliable trend results [59]. Therefore, in subsequent studies, there is a need to pay more attention to the impact of this phenomenon and to consider using the modified M-K method to obtain more reliable trend conclusions.
Global climate changes, such as global warming, land use, and human activities, increase the frequency and intensity of extreme precipitation occurrences [60,61]. Jiangsu Province, located in eastern China, is a pivotal region with significant economic developments and active human activities. The province’s climate system is intricately linked to global climate change. In addition, the diverse topography of Jiangsu Province, with both coastal and inland areas, is one of the reasons for its intricate and variable climate fluctuations. Therefore, an investigation into the precipitation structure of Jiangsu Province provides a nuanced understanding of how these global climate changes manifest at the local level. The correlation analysis between five large-scale climate indices and the precipitation structure in Jiangsu Province indicates that the AO, NAO, and PDO have a large impact on the precipitation occurrence rate in Jiangsu Province over time, and the PDO has a large impact on the precipitation contribution rate over time. In addition, the PDO and AO have a greater influence on the occurrence probability of light rain, middle rain, and heavy rain in Jiangsu Province. This shows that the AO, NAO, and PDO are potential drivers affecting the precipitation structure in Jiangsu Province.
However, the atmospheric circulation indices tend to have interannual periodic variations [62,63]. Here, we further discuss the effects of the AO, NAO, and PDO on precipitation using the Morlet wavelet transform. Among them, wavelet coherence (WTC) is suitable for testing the correlation of two long-time-series data at different time, frequency, and spatial scales [64]. According to Figure 12, from 1972 to 2008, a significant positive correlation between the PDO and 2dOR is observed with a periodicity of 8 to 14 years. Additionally, there is a significant negative correlation with a periodicity of 0 to 6 years during the period from 1966 to 1978. Moreover, a significant positive correlation with a periodicity of 4 to 5 years is observed from 1995 to 2000. Finally, from 2008 to 2010, a significant negative correlation with a periodicity of 2 to 6 years is observed. The PDO and 2dCR also exhibit significant correlations with long timescales and periodicities. For example, there is a significant positive correlation with a periodicity of 8 to 14 years during the period from 1975 to 2010 and a significant negative correlation with a periodicity of 2 to 6 years during the period from 2004 to 2015. The PDO shows localized significant correlations with the LROR and MROR and three distinct correlation signals with the HROR. On the other hand, although there is some localized correlation between the NAO and 2dOR, it is not significant. The NAO and 9dOR exhibit a significant negative correlation with periodicities of 2 to 9 years and 11 to 13 years during the period from 1969 to 1996. Furthermore, the AO and 9dOR show a significant negative correlation with periodicities of 2 to 5 years and 13 to 16 years during the period from 1967 to 2004. The AO also exhibits a significant positive correlation with the MROR with a periodicity of 2 to 5 years during the period from 1985 to 1993 and with a periodicity of 0 to 3 years during the period from 1994 to 2000. Combined with the Pearson correlation analysis, we learn that the AO, PDO, and NAO have significant linear and nonlinear correlations with the precipitation indices. Among them, the NAO has a significant Pearson’s linear correlation with the 2dOR but no significant wavelet coherence.
Indeed, the relationship between climate indices and precipitation indices is highly complex. Apart from direct correlations, the variations in the climate indices may also indirectly influence changes in the regional precipitation structure [14]. This suggests that there are multiple factors and mechanisms involved in the interaction between climate and precipitation and that changes in climate indices can have cascading effects on the structure of precipitation in a region. Therefore, further studies and analyses are needed to determine the specific degree of influence of these large-scale climate indices on precipitation structural changes in Jiangsu Province, which will help to improve the ability to predict future precipitation changes in Jiangsu Province and provide a scientific basis for related water resource management and climate adaptation measures.

5. Conclusions

We investigated the spatial and temporal variations of the precipitation structure in Jiangsu Province from 1960 to 2020 and explored its correlation relationship with five large-scale climate indices. The conclusions are as follows:
(1)
Precipitation duration: As the precipitation duration increases, the occurrence rate of precipitation shows a decreasing trend, while the contribution rate exhibits an initial increase followed by a decrease. Furthermore, the 1–3 d duration precipitation tends to increase over the years, and after the 3 d duration, it tends to decrease except for the 10 d duration. The range of variation is −0.72–1.53 mm/year. The precipitation durations show a decreasing trend, except for the 2 d duration and 10 d duration, which show an increasing trend. The range of variation is −63.60–10.01 min/year. Spatially, the occurrence rate of precipitation demonstrates a decreasing trend from north to south for the 1-day durations, while the opposite trend is observed for durations longer than 2 days. The spatial distribution of the precipitation contribution rate corresponds to that of the occurrence rate across different calendar times. Precipitation grade: As the precipitation grade increases, the occurrence rate tends to decrease, while the contribution rate shows a less pronounced change. Spatially, there is an increasing trend of light rain incidence from west to east and middle rain incidence from north to south and a reverse pattern for heavy rain and torrential rain. The contribution of light rain and middle rain exhibits an increasing trend from north to south, while heavy rain shows a decreasing trend from northwest to southeast, and torrential rain shows a decreasing trend from north to south. In Jiangsu Province, light rain lasting 1–3 days dominates, with a higher likelihood of short-duration torrential rain occurrences in the northern region compared to other areas.
(2)
With an increasing precipitation duration, the precipitation occurrence rate and contribution rate at most stations in Jiangsu Province from 1960 to 2020 exhibit a decreasing trend. For durations ranging from 1 to 3 days, the majority of stations show an increasing trend, while durations exceeding 4 days demonstrate a decreasing trend. Additionally, there is a decreasing trend in both the incidence and contribution of light rain. Most stations indicate an increasing trend in the incidence of middle rain and heavy rain; however, their contribution shows a decreasing trend. In contrast, the majority of stations exhibit an increasing trend in both the incidence and contribution of torrential rain. Moreover, except for light rain, which shows a decreasing trend in precipitation, middle rain, heavy rain, and torrential rain show an increasing trend, with an overall variation of −0.22–0.38 mm/year.
(3)
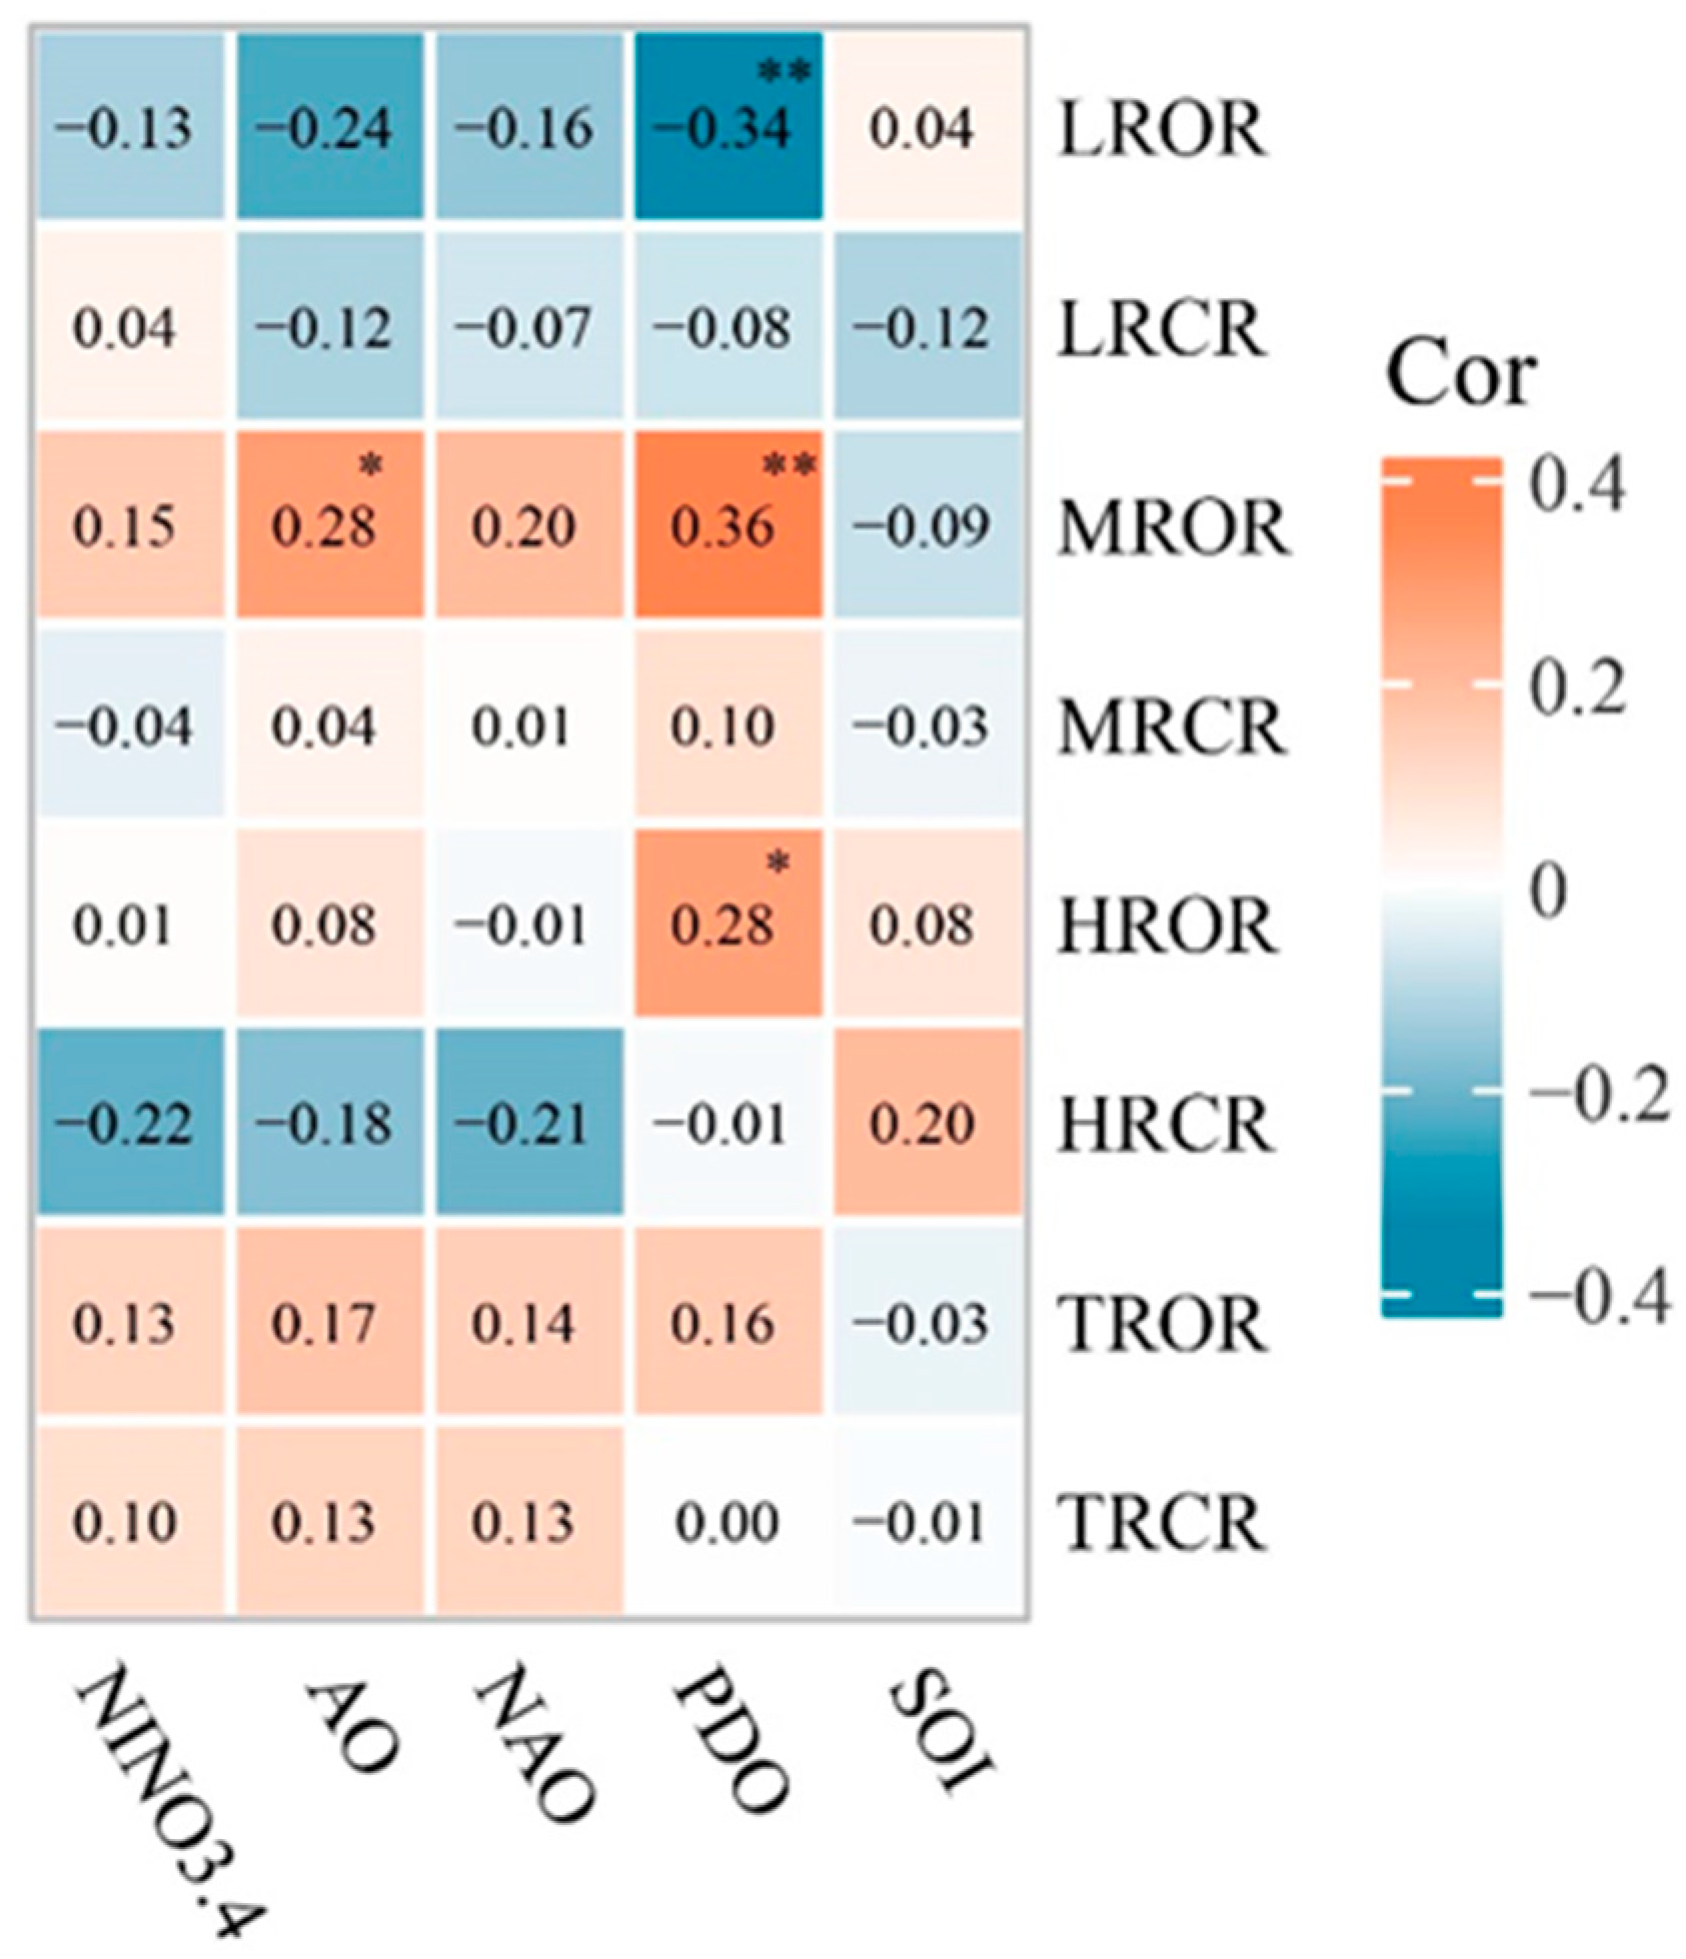
There is a significant negative correlation (r = −0.40, p < 0.01) between the AO and 9dOR, while the NAO exhibits a significant positive correlation (r = 0.34, p < 0.01) with the 2dOR. Furthermore, the NAO shows a more significant negative correlation (r = −0.31, p < 0.05) with the 9dOR, and the PDO exhibits a more significant positive correlation (r = 0.25, p < 0.05) with both the 2dOR and 2dCR. Additionally, the PDO displays a significant negative correlation (r = −0.34, p < 0.01) with the LROR, a significant positive correlation (r = 0.36, p < 0.01) with the MROR, and a significant positive correlation (r = 0.28, p < 0.05) with the HROR. Moreover, the AO shows a significant positive correlation (r = 0.28, p < 0.05) with the MROR. However, NINO3.4 and SOI do not show any significant correlation with the precipitation duration, occurrence rate, or contribution rate of the precipitation classes in Jiangsu Province. These findings suggest that the AO, NAO, and PDO are potential drivers influencing changes in the precipitation structure in Jiangsu Province. The outcomes of this research provide crucial insights for forecasting precipitation and managing water resources in Jiangsu Province. For instance, integrating the AO, NAO, and PDO into precipitation forecasting models can improve the accuracy to some extent in predicting precipitation events. Furthermore, studying the fluctuations in these climate indices offers targeted information for understanding the spatiotemporal evolution of precipitation patterns in Jiangsu Province in the future. Moreover, adaptive water resource management strategies can be formulated based on the identified correlations. For instance, during periods of a robust negative correlation between the AO and 9dOR, preparations for potential drought conditions can be intensified. Similarly, during periods of a strong positive correlation between the PDO and HROR, enhanced flood-prevention measures may be warranted.

Author Contributions

Writing—review and editing, conceptualization, Z.R.; project administration, data analysis, and review, H.Z.; methodology and investigation, K.S. and G.Y. All authors have read and agreed to the published version of the manuscript.

Funding

This work was funded by the Guangxi Key R&D Program (Guike-AB22080093, Guike-AB22035075, and Guike-AB21075007) and the Guilin Key R&D Program (20210212-2).

Data Availability Statement

The data presented in this study are available on request from the corresponding author.

Acknowledgments

The authors gratefully acknowledge the assistance of the Guangxi Science and Technology Department and the Guilin Science and Technology Bureau.

Conflicts of Interest

The authors declare no conflict of interest.

References

  1. Tabari, H. Climate Change Impact on Flood and Extreme Precipitation Increases with Water Availability. Sci. Rep. 2020, 10, 13768. [Google Scholar] [CrossRef] [PubMed]
  2. Thackeray, C.W.; Hall, A.; Norris, J.; Chen, D. Constraining the Increased Frequency of Global Precipitation Extremes under Warming. Nat. Clim. Change 2022, 12, 441–448. [Google Scholar] [CrossRef]
  3. Zhang, W.; Furtado, K.; Wu, P.; Zhou, T.; Chadwick, R.; Marzin, C.; Rostron, J.; Sexton, D. Increasing Precipitation Variability on Daily-to-Multiyear Time Scales in a Warmer World. Sci. Adv. 2021, 7, eabf8021. [Google Scholar] [CrossRef] [PubMed]
  4. Blöschl, G.; Hall, J.; Viglione, A.; Perdigão, R.A.P.; Parajka, J.; Merz, B.; Lun, D.; Arheimer, B.; Aronica, G.T.; Bilibashi, A.; et al. Changing Climate Both Increases and Decreases European River Floods. Nature 2019, 573, 108–111. [Google Scholar] [CrossRef] [PubMed]
  5. Yang, D.; Yang, Y.; Xia, J. Hydrological Cycle and Water Resources in a Changing World: A Review. Geogr. Sustain. 2021, 2, 115–122. [Google Scholar] [CrossRef]
  6. Zhang, Y.; Wang, K. Global Precipitation System Scale Increased from 2001 to 2020. J. Hydrol. 2023, 616, 128768. [Google Scholar] [CrossRef]
  7. Chen, J.; Shao, C.; Jiang, S.; Qu, L.; Zhao, F.; Dong, G. Effects of Changes in Precipitation on Energy and Water Balance in a Eurasian Meadow Steppe. Ecol. Process. 2019, 8, 17. [Google Scholar] [CrossRef]
  8. Pathak, P.; Kalra, A.; Ahmad, S. Temperature and Precipitation Changes in the Midwestern United States: Implications for Water Management. Int. J. Water Resour. Dev. 2017, 33, 1003–1019. [Google Scholar] [CrossRef]
  9. Serrat-Capdevila, A.; Valdes, J.B.; Stakhiv, E.Z. Water Management Applications for Satellite Precipitation Products: Synthesis and Recommendations. JAWRA J. Am. Water Resour. Assoc. 2014, 50, 509–525. [Google Scholar] [CrossRef]
  10. Moustakis, Y.; Papalexiou, S.M.; Onof, C.J.; Paschalis, A. Seasonality, Intensity, and Duration of Rainfall Extremes Change in a Warmer Climate. Earths Future 2021, 9, e2020EF001824. [Google Scholar] [CrossRef]
  11. Allen, M.R.; Ingram, W.J. Constraints on Future Changes in Climate and the Hydrologic Cycle. Nature 2002, 419, 224–232. [Google Scholar] [CrossRef] [PubMed]
  12. Konapala, G.; Mishra, A.K.; Wada, Y.; Mann, M.E. Climate Change Will Affect Global Water Availability through Compounding Changes in Seasonal Precipitation and Evaporation. Nat. Commun. 2020, 11, 3044. [Google Scholar] [CrossRef] [PubMed]
  13. Zhang, Q.; Singh, V.P.; Peng, J.; Chen, Y.D.; Li, J. Spatial–Temporal Changes of Precipitation Structure across the Pearl River Basin, China. J. Hydrol. 2012, 440–441, 113–122. [Google Scholar] [CrossRef]
  14. Wang, L.; Chen, S.; Zhu, W.; Ren, H.; Zhang, L.; Zhu, L. Spatiotemporal Variations of Extreme Precipitation and Its Potential Driving Factors in China’s North-South Transition Zone during 1960–2017. Atmos. Res. 2021, 252, 105429. [Google Scholar] [CrossRef]
  15. Zhang, S.; Li, W.; An, W.; Hou, J.; Hou, X.; Tang, C.; Gan, Z. Temporal and Spatial Evolutionary Trends of Regional Extreme Precipitation under Different Emission Scenarios: Case Study of the Jialing River Basin, China. J. Hydrol. 2023, 617, 129156. [Google Scholar] [CrossRef]
  16. Paik, S.; Min, S.; Zhang, X.; Donat, M.G.; King, A.D.; Sun, Q. Determining the Anthropogenic Greenhouse Gas Contribution to the Observed Intensification of Extreme Precipitation. Geophys. Res. Lett. 2020, 47, e2019GL086875. [Google Scholar] [CrossRef]
  17. Bennett, A.C.; Rodrigues De Sousa, T.; Monteagudo-Mendoza, A.; Esquivel-Muelbert, A.; Morandi, P.S.; Coelho De Souza, F.; Castro, W.; Duque, L.F.; Flores Llampazo, G.; Manoel Dos Santos, R.; et al. Sensitivity of South American Tropical Forests to an Extreme Climate Anomaly. Nat. Clim. Change 2023, 13, 967–974. [Google Scholar] [CrossRef]
  18. Zhang, X.; Liu, Z.; Liu, Y.; Jiang, L.; Wang, R.; Jiang, H.; Li, J.; Tang, Q.; Yao, Z. Examining Moisture Contribution for Precipitation in Response to Climate Change and Anthropogenic Factors in Hengduan Mountain Region, China. J. Hydrol. 2023, 620, 129562. [Google Scholar] [CrossRef]
  19. Trenberth, K.E. Changes in Precipitation with Climate Change. Clim. Res. 2011, 47, 123–138. [Google Scholar] [CrossRef]
  20. Zahmatkesh, Z.; Karamouz, M.; Goharian, E.; Burian, S.J. Analysis of the Effects of Climate Change on Urban Storm Water Runoff Using Statistically Downscaled Precipitation Data and a Change Factor Approach. J. Hydrol. Eng. 2015, 20, 05014022. [Google Scholar] [CrossRef]
  21. Singh, V.; Jain, S.K.; Singh, P.K. Inter-Comparisons and Applicability of CMIP5 GCMs, RCMs and Statistically Downscaled NEX-GDDP Based Precipitation in India. Sci. Total Environ. 2019, 697, 134163. [Google Scholar] [CrossRef] [PubMed]
  22. Miró, J.J.; Estrela, M.J.; Olcina-Cantos, J.; Martin-Vide, J. Future Projection of Precipitation Changes in the Júcar and Segura River Basins (Iberian Peninsula) by CMIP5 GCMs Local Downscaling. Atmosphere 2021, 12, 879. [Google Scholar] [CrossRef]
  23. Yin, Y.; Chen, H.; Wang, G.; Xu, W.; Wang, S.; Yu, W. Characteristics of the Precipitation Concentration and Their Relationship with the Precipitation Structure: A Case Study in the Huai River Basin, China. Atmos. Res. 2021, 253, 105484. [Google Scholar] [CrossRef]
  24. Huang, X.; Wang, D.; Li, L.Z.X.; Li, Q.; Zeng, Z. Modeling Urban Impact on Zhengzhou Storm on July 20, 2021. J. Geophys. Res. Atmos. 2022, 127, e2022JD037387. [Google Scholar] [CrossRef]
  25. Yin, J.; Gu, H.; Liang, X.; Yu, M.; Sun, J.; Xie, Y.; Li, F.; Wu, C. A Possible Dynamic Mechanism for Rapid Production of the Extreme Hourly Rainfall in Zhengzhou City on 20 July 2021. J. Meteorol. Res. 2022, 36, 6–25. [Google Scholar] [CrossRef]
  26. Liu, Y.; Hu, Z.-Z.; Wu, R.; Yuan, X. Causes and Predictability of the 2021 Spring Southwestern China Severe Drought. Adv. Atmos. Sci. 2022, 39, 1766–1776. [Google Scholar] [CrossRef]
  27. Bing-Rui, H.; Pan-Mao, Z. Changes in Persistent and Non-Persistent Extreme Precipitation in China from 1961 to 2016. Adv. Clim. Change Res. 2018, 9, 177–184. [Google Scholar] [CrossRef]
  28. Pei, F.; Wu, C.; Liu, X.; Hu, Z.; Xia, Y.; Liu, L.-A.; Wang, K.; Zhou, Y.; Xu, L. Detection and Attribution of Extreme Precipitation Changes from 1961 to 2012 in the Yangtze River Delta in China. CATENA 2018, 169, 183–194. [Google Scholar] [CrossRef]
  29. Huang, J.; Islam, A.R.M.T.; Zhang, F.; Hu, Z. Spatiotemporal Analysis the Precipitation Extremes Affecting Rice Yield in Jiangsu Province, Southeast China. Int. J. Biometeorol. 2017, 61, 1863–1872. [Google Scholar] [CrossRef]
  30. Shao, Y.; Zhao, J.; Xu, J.; Fu, A.; Wu, J. Revision of Frequency Estimates of Extreme Precipitation Based on the Annual Maximum Series in the Jiangsu Province in China. Water 2021, 13, 1832. [Google Scholar] [CrossRef]
  31. Zhang, G.; Liu, D.; He, X.; Yu, D.; Pu, M. Acid Rain in Jiangsu Province, Eastern China: Tempo-Spatial Variations Features and Analysis. Atmos. Pollut. Res. 2017, 8, 1031–1043. [Google Scholar] [CrossRef]
  32. Tao, H.; Fischer, T.; Zeng, Y.; Fraedrich, K. Evaluation of TRMM 3B43 Precipitation Data for Drought Monitoring in Jiangsu Province, China. Water 2016, 8, 221. [Google Scholar] [CrossRef]
  33. Song, Y.; Linderholm, H.W.; Wang, C.; Tian, J.; Huo, Z.; Gao, P.; Song, Y.; Guo, A. The Influence of Excess Precipitation on Winter Wheat under Climate Change in China from 1961 to 2017. Sci. Total Environ. 2019, 690, 189–196. [Google Scholar] [CrossRef] [PubMed]
  34. Liu, B.; Li, Y.; Chen, J.; Chen, X. Long-Term Change in Precipitation Structure over the Karst Area of Southwest China. Int. J. Climatol. 2016, 36, 2417–2434. [Google Scholar] [CrossRef]
  35. Wasko, C.; Sharma, A.; Johnson, F. Does Storm Duration Modulate the Extreme Precipitation-Temperature Scaling Relationship?: Effect of Storm Duration on Scaling. Geophys. Res. Lett. 2015, 42, 8783–8790. [Google Scholar] [CrossRef]
  36. Fu, C.; Dan, L. Trends in the Different Grades of Precipitation over South China during 1960–2010 and the Possible Link with Anthropogenic Aerosols. Adv. Atmos. Sci. 2014, 31, 480–491. [Google Scholar] [CrossRef]
  37. Bhatti, A.S.; Wang, G.; Ullah, W.; Ullah, S.; Fiifi Tawia Hagan, D.; Kwesi Nooni, I.; Lou, D.; Ullah, I. Trend in Extreme Precipitation Indices Based on Long Term In Situ Precipitation Records over Pakistan. Water 2020, 12, 797. [Google Scholar] [CrossRef]
  38. Song, X.; Zhang, J.; Liu, J.; Yang, M. Spatial-temporal variation characteristics of precipitation pattern in Beijing. J. Hydraul. Eng. 2015, 46, 525–535. (In Chinese) [Google Scholar] [CrossRef]
  39. Sikorska, A.E.; Viviroli, D.; Seibert, J. Effective Precipitation Duration for Runoff Peaks Based on Catchment Modelling. J. Hydrol. 2018, 556, 510–522. [Google Scholar] [CrossRef]
  40. Zhang, Z.; Zhang, K.; Cai, M.; Yin, J.; Liu, Q.; Liu, H. Spatiotemporal Variation Characteristics of Precipitation Structure in Henan Province During 1960–2019. Res. Soil Water Conserv. 2022, 29, 159–166. (In Chinese) [Google Scholar] [CrossRef]
  41. Gemmer, M.; Becker, S.; Jiang, T. Observed Monthly Precipitation Trends in China 1951–2002. Theor. Appl. Climatol. 2004, 77, 39–45. [Google Scholar] [CrossRef]
  42. Shahfahad; Talukdar, S.; Islam, A.R.M.T.; Das, T.; Naikoo, M.W.; Mallick, J.; Rahman, A. Application of Advanced Trend Analysis Techniques with Clustering Approach for Analysing Rainfall Trend and Identification of Homogenous Rainfall Regions in Delhi Metropolitan City. Environ. Sci. Pollut. Res. 2022, 30, 106898–106916. [Google Scholar] [CrossRef] [PubMed]
  43. Shahid, M.; Cong, Z.; Zhang, D. Understanding the Impacts of Climate Change and Human Activities on Streamflow: A Case Study of the Soan River Basin, Pakistan. Theor. Appl. Climatol. 2018, 134, 205–219. [Google Scholar] [CrossRef]
  44. Zhai, P.; Zhang, X.; Wan, H.; Pan, X. Trends in Total Precipitation and Frequency of Daily Precipitation Extremes over China. J. Clim. 2005, 18, 1096–1108. [Google Scholar] [CrossRef]
  45. Huntington, T.G.; Hodgkins, G.A.; Keim, B.D.; Dudley, R.W. Changes in the Proportion of Precipitation Occurring as Snow in New England (1949–2000). J. Clim. 2004, 17, 2626–2636. [Google Scholar] [CrossRef]
  46. Hussain, M.S.; Lee, S. Long-Term Variability and Changes of the Precipitation Regime in Pakistan. Asia-Pac. J. Atmos. Sci. 2014, 50, 271–282. [Google Scholar] [CrossRef]
  47. Du, L.; Wong, J.S.; Li, Z.; Chen, L.; Zhang, B.; Lei, B.; Peng, Z. Hydroclimatic Change in Turpan Basin under Climate Change. Water 2023, 15, 3422. [Google Scholar] [CrossRef]
  48. Shahid, M.; Rahman, K.U. Identifying the Annual and Seasonal Trends of Hydrological and Climatic Variables in the Indus Basin Pakistan. Asia-Pac. J. Atmos. Sci. 2021, 57, 191–205. [Google Scholar] [CrossRef]
  49. Gu, Z.; Eils, R.; Schlesner, M. Complex Heatmaps Reveal Patterns and Correlations in Multidimensional Genomic Data. Bioinformatics 2016, 32, 2847–2849. [Google Scholar] [CrossRef]
  50. Rahman, M.S.; Islam, A.R.M.T. Are Precipitation Concentration and Intensity Changing in Bangladesh Overtimes? Analysis of the Possible Causes of Changes in Precipitation Systems. Sci. Total Environ. 2019, 690, 370–387. [Google Scholar] [CrossRef]
  51. Li, W.; Chen, Y. Detectability of the Trend in Precipitation Characteristics over China from 1961 to 2017. Int. J. Climatol. 2021, 41, E1980–E1991. [Google Scholar] [CrossRef]
  52. Li, Y.; Wang, C.; Peng, H.; Xiao, S.; Yan, D. Contribution of Moisture Sources to Precipitation Changes in the Three Gorges Reservoir Region. Hydrol. Earth Syst. Sci. 2021, 25, 4759–4772. [Google Scholar] [CrossRef]
  53. Wei, W.; Zou, S.; Duan, W.; Chen, Y.; Li, S.; Zhou, Y. Spatiotemporal Variability in Extreme Precipitation and Associated Large-Scale Climate Mechanisms in Central Asia from 1950 to 2019. J. Hydrol. 2023, 620, 129417. [Google Scholar] [CrossRef]
  54. Tian, J.; Liu, J.; Wang, J.; Li, C.; Nie, H.; Yu, F. Trend Analysis of Temperature and Precipitation Extremes in Major Grain Producing Area of China. Int. J. Climatol. 2017, 37, 672–687. [Google Scholar] [CrossRef]
  55. Dimitriadis, P.; Koutsoyiannis, D.; Iliopoulou, T.; Papanicolaou, P. A Global-Scale Investigation of Stochastic Similarities in Marginal Distribution and Dependence Structure of Key Hydrological-Cycle Processes. Hydrology 2021, 8, 59. [Google Scholar] [CrossRef]
  56. Huang, J.; Zhang, F.; Zhou, L.; Hu, Z.; Li, Y. Regional Changes of Climate Extremes and Its Effect on Rice Yield in Jiangsu Province, Southeast China. Environ. Earth Sci. 2018, 77, 106. [Google Scholar] [CrossRef]
  57. Huang, J.; Zhou, L.; Zhang, F.; Hu, Z. Precipitation Concentration in Jiangsu Province, Southeast China and Its Indicating Function on the Fluctuation of Rice Yield. Meteorol. Atmos. Phys. 2019, 131, 1249–1258. [Google Scholar] [CrossRef]
  58. Shen, L.; Wen, J.; Zhang, Y.; Ullah, S.; Cheng, J.; Meng, X. Changes in Population Exposure to Extreme Precipitation in the Yangtze River Delta, China. Clim. Serv. 2022, 27, 100317. [Google Scholar] [CrossRef]
  59. Hu, Z.; Liu, S.; Zhong, G.; Lin, H.; Zhou, Z. Modified Mann-Kendall Trend Test for Hydrological Time Series under the Scaling Hypothesis and Its Application. Hydrol. Sci. J. 2020, 65, 2419–2438. [Google Scholar] [CrossRef]
  60. Zhang, K.; De Almeida Castanho, A.D.; Galbraith, D.R.; Moghim, S.; Levine, N.M.; Bras, R.L.; Coe, M.T.; Costa, M.H.; Malhi, Y.; Longo, M.; et al. The Fate of Amazonian Ecosystems over the Coming Century Arising from Changes in Climate, Atmospheric CO2, and Land Use. Glob. Change Biol. 2015, 21, 2569–2587. [Google Scholar] [CrossRef]
  61. Li, X.; Zhang, K.; Gu, P.; Feng, H.; Yin, Y.; Chen, W.; Cheng, B. Changes in Precipitation Extremes in the Yangtze River Basin during 1960–2019 and the Association with Global Warming, ENSO, and Local Effects. Sci. Total Environ. 2021, 760, 144244. [Google Scholar] [CrossRef]
  62. Liu, S.; Huang, S.; Xie, Y.; Leng, G.; Huang, Q.; Wang, L.; Xue, Q. Spatial-Temporal Changes of Rainfall Erosivity in the Loess Plateau, China: Changing Patterns, Causes and Implications. CATENA 2018, 166, 279–289. [Google Scholar] [CrossRef]
  63. Wang, Y. Observed Trends in Extreme Precipitation Events in China during 1961–2001 and the Associated Changes in Large-Scale Circulation. Geophys. Res. Lett. 2005, 32, L09707. [Google Scholar] [CrossRef]
  64. Wu, S.; Zhao, W.; Yao, J.; Jin, J.; Zhang, M.; Jiang, G. Precipitation Variations in the Tai Lake Basin from 1971 to 2018 Based on Innovative Trend Analysis. Ecol. Indic. 2022, 139, 108868. [Google Scholar] [CrossRef]
Figure 1. Overview of the study area and distribution map of meteorological stations.
Water 15 04032 g001
Figure 2. Precipitation occurrence rate and contribution rate at different durations in Jiangsu province.
Water 15 04032 g002
Figure 3. Spatial distribution of precipitation occurrence rate at different durations in Jiangsu province. (l) the spatial distribution of 22 meteorological stations in Jiangsu Province.
Water 15 04032 g003
Figure 4. Spatial distribution of precipitation contribution rate at different durations in Jiangsu province. (l) the spatial distribution of 22 meteorological stations in Jiangsu Province.
Water 15 04032 g004
Figure 5. Precipitation occurrence rate and contribution rate at different grades in Jiangsu province.
Water 15 04032 g005
Figure 6. Spatial distribution of precipitation occurrence rate at different grades in Jiangsu province.
Water 15 04032 g006
Figure 7. Spatial distribution of precipitation contribution rate at different grades in Jiangsu province.
Water 15 04032 g007
Figure 8. Kendall’s tau rank heatmap for different precipitation durations at each station in Jiangsu Province from 1960 to 2022.
Water 15 04032 g008
Figure 9. Kendall’s tau rank heatmap for different precipitation grades at each station in Jiangsu Province from 1960 to 2022.
Water 15 04032 g009
Figure 10. Correlation between Precipitation Duration Occurrence Rate, Contribution Rate, and Climate Indices in Jiangsu Province from 1960 to 2020. (a) the correlation between precipitation durations and climate indices; (b) the correlation between the precipitation grades and climate indices (“**” means significant at the 0.01 level, and “*” means significant at the 0.05 level).
Water 15 04032 g010
Figure 11. Correlation between Precipitation Grade Occurrence Rate, Contribution Rate, and Climate Indices in Jiangsu Province from 1960 to 2020. (“**” means significant at the 0.01 level, and “*” means significant at the 0.05 level).
Water 15 04032 g011
Figure 12. Wavelet coherence analysis of large-scale climate indices and precipitation indices (ae) the wavelet coherence between PDO and 2dOR, 2dCR, LROR, MROR, and HROR, respectively; (f,g) the wavelet coherence between NAO and 2dOR and 9dOR, respectively; (h,i) the wavelet coherence between AO and 9dOR and MROR, respectively; the direction of the arrows indicates positive, negative, or no correlation; the thin black lines represent the wavelet analysis cone of influence, and the thick black line represents the 95% confidence interval.
Water 15 04032 g012
Table 1. Meteorological stations’ information for Jiangsu Province.
Station IDStation NameLon/ELat/NElevation/mDuration
58026Pizhou118.0134.2425.51960–2020
58027Xuzhou117.0934.1741.21960–2020
58038Shuyang118.4734.0510.41960–2020
58040Ganyu119.0834.515.31960–2020
58047Guanyun119.1434.154.81960–2020
58130Suining117.9533.9323.81960–2020
58135Sihong118.1333.2916.91960–2020
58138Xuyi118.5132.9840.81960–2020
58143Funing119.5133.484.81960–2020
58150Sheyang120.1833.4521960–2020
58158Dafeng120.2933.123.11960–2020
58238Nanjing118.931.9335.21960–2020
58241Gaoyou119.2732.485.41960–2020
58251Dongtai120.1732.513.31960–2020
58255Rugao120.3432.226.41960–2020
58259Nantong120.5932.054.81960–2020
58265Lüsi121.3632.043.61960–2020
58343Changzhou119.9831.884.41960–2017
58345Liyang119.4831.435.91960–2020
58354Wuxi120.2131.373.21960–2020
58356Kunshan12131.243.21960–2020
58358Dongshan120.2631.0416.71960–2020
Disclaimer/Publisher’s Note: The statements, opinions and data contained in all publications are solely those of the individual author(s) and contributor(s) and not of MDPI and/or the editor(s). MDPI and/or the editor(s) disclaim responsibility for any injury to people or property resulting from any ideas, methods, instructions or products referred to in the content.

