1. Introduction
The subject of this article is an analysis of the morphometry of drifting ice on the water surface. In the literature review, a significant research gap is noted, where researchers primarily focus on analyzing the processes of the appearance, disappearance, concentration, structure, and thickness of ice in studies utilizing remote measurement methods. However, an analysis of morphometrical parameters such as average size, area, perimeter, and circularity allows for the prediction of the direction of ice phenomena’s development and potential threats to existing infrastructure.
The primary objective of this study is to develop a comprehensive methodology for assessing the morphometrical characteristics of frazil ice floes in lowland river systems. The presented work is part of a broader project focused on designing a remote sensing system for the detection, evaluation, and prediction of ice-related phenomena in a central European lowland river [
1]. In this publication, we demonstrate the capabilities of determining the morphometrical traits of each observed ice element within the frame. Subsequently, our next step involves evaluating changes in morphometrical features based on the occurrence period of ice-related events. By employing UAV-based remote sensing techniques, we aim to advance our understanding of frazil ice dynamics and contribute to improved river management strategies. This research addresses the need for effective monitoring and predictive capabilities in mitigating the potential risks associated with ice-related incidents in river environments.
The study thoroughly examines the morphometrical characteristics of each drifting ice floe. This approach offers a fresh perspective in ice flow research. We posit that these described features may also play a crucial role in potential ice blockages. At present, data regarding the attributes of ice floes for predictive learning are not available. The study’s hypothesis proposes that a shift in the morphological traits of ice floes would occur in the event of a blockage, enabling the prediction of its timing. Therefore, the continuous observation of ice traits stands as a central objective for the research team.
Traditional observation methods do not capture the specific data presented in our publication. The only comparable parameter is the extent of shore ice. However, our primary interest lay in changes to ice cover rather than the presence of shore ice. As such, direct comparisons between data acquired via UAVs and traditional methods were not applicable to the objectives of this study. Ice phenomena measurements pose a challenge due to their inherent difficulty and the subjective nature of the results, which are often presented descriptively. These measurements primarily serve as operational monitoring for various services involved in flood protection, the mitigation of river blockage events, and the management of water structures. The main objective is to exercise control and perform necessary actions in these areas.
Inland water bodies experience the formation of ice covers when the water temperature cools down to near freezing point. In polish conditions, ice typically forms during the transition from autumn to winter due to the strong radiation heat loss from the water surface and subsequent cooling. The formation of ice can lead to blockages, causing disruptions to traffic flow and posing risks to structures such as dams. The occurrence and characteristics of ice phenomena are largely influenced by climatic conditions, including their intensity and frequency [
2]. The primary factor governing the formation of ice phenomena on rivers is the air temperature. The course of atmospheric circulation plays a crucial role in shaping the development of ice phenomena by affecting water thermal variability and, consequently, the various forms of ice formation on the river [
3]. Designing a water infrastructure in rivers and lakes in northern regions requires careful consideration of ice-related issues. These issues encompass various phenomena such as floating ice, anchor ice, ice jams in rivers, and frazil ice. Among these, the detrimental impact of frazil ice primarily manifests in the obstruction of water passages in engineering structures [
4].
The accumulation of frazil ice at water intakes poses significant challenges as it can obstruct the flow passages and potentially completely block the inflow. The consequences of such blockages range from minor temporary inconveniences to severe impacts, particularly in cases where industrial or nuclear plants are compelled to halt operations or when municipalities experience a depletion of their fire-fighting reserves [
5].
Documenting the progression and causes of frazil ice blockages is a complex task due to several factors. Firstly, these blockages occur underwater, often during dark and cold winter nights, making direct observation challenging. Additionally, each intake design possesses unique characteristics that influence the behavior of frazil ice accumulation. Moreover, the hydraulic, hydrological, and cryological processes associated with each river vary, further complicating the understanding of frazil ice blockages. Furthermore, frazil ice can manifest in diverse forms, as described by Daly [
6], and its occurrence is highly dependent on localized flow patterns and weather conditions.
The intricate nature of frazil ice blockages necessitates comprehensive research and analysis to better comprehend their development and mitigative measures. This understanding is crucial for the effective design and operation of water intake systems, particularly in regions prone to frazil ice formation. By investigating the underlying processes and considering site-specific factors, strategies can be devised to minimize the impacts of frazil ice blockages on critical infrastructure and ensure the uninterrupted functioning of vital facilities [
4,
7].
Various factors contribute to the formation and characteristics of frazil ice. (1) Turbulent conditions in the water, such as those caused by tides, currents, and the passage of ships, can significantly influence the production and movement of frazil ice. The presence of turbulence promotes the mixing and dispersion of ice crystals within the water column. (2) The presence of impurities or suspended particles in the water can affect the formation and growth of frazil ice. Contaminants can serve as nucleation sites for ice crystals, influencing their size and distribution. (3) The depth of the water body plays a role in frazil ice formation. Shallow waters allow for a greater interaction between the water surface and the atmosphere, leading to faster cooling and an increased likelihood of frazil ice formation. (4) The presence of existing ice cover on the water surface can influence the development of frazil ice. Ice cover can provide a surface for frazil ice crystals to adhere to, leading to the formation of thicker ice layers or ice jams. (5) Wind speed and direction can impact the movement and dispersion of frazil ice. Strong winds can cause ice crystals to accumulate in certain areas or be transported downstream, affecting the spatial distribution and concentration of frazil ice. (6) The ambient air and water temperatures play a fundamental role in frazil ice formation. Cold temperatures below the freezing point of water are necessary for the nucleation and growth of ice crystals. Temperature fluctuations and variations in thermal conditions influence the rate and extent of frazil ice production. These factors interact with each other in complex ways, and their combined effects determine the extent and characteristics of frazil ice floe phenomena in natural water bodies. Understanding these factors is crucial for accurately predicting and managing the risks associated with frazil ice in various environmental and engineering contexts.
2. Materials and Methods
2.1. Formation of Frazil Ice
The formation of frazil ice involves the development of small crystalline particles resulting from the supercooling of water and the presence of turbulence. This natural phenomenon is commonly observed in both river and ocean environments [
8] In the context of freshwater systems, such as northern rivers, individual frazil ice particles are transported by turbulent flow and undergo collision events. Through these collisions and the cohesive properties of the ice, the particles agglomerate, forming clusters known as frazil flocs. This process is referred to as flocculation [
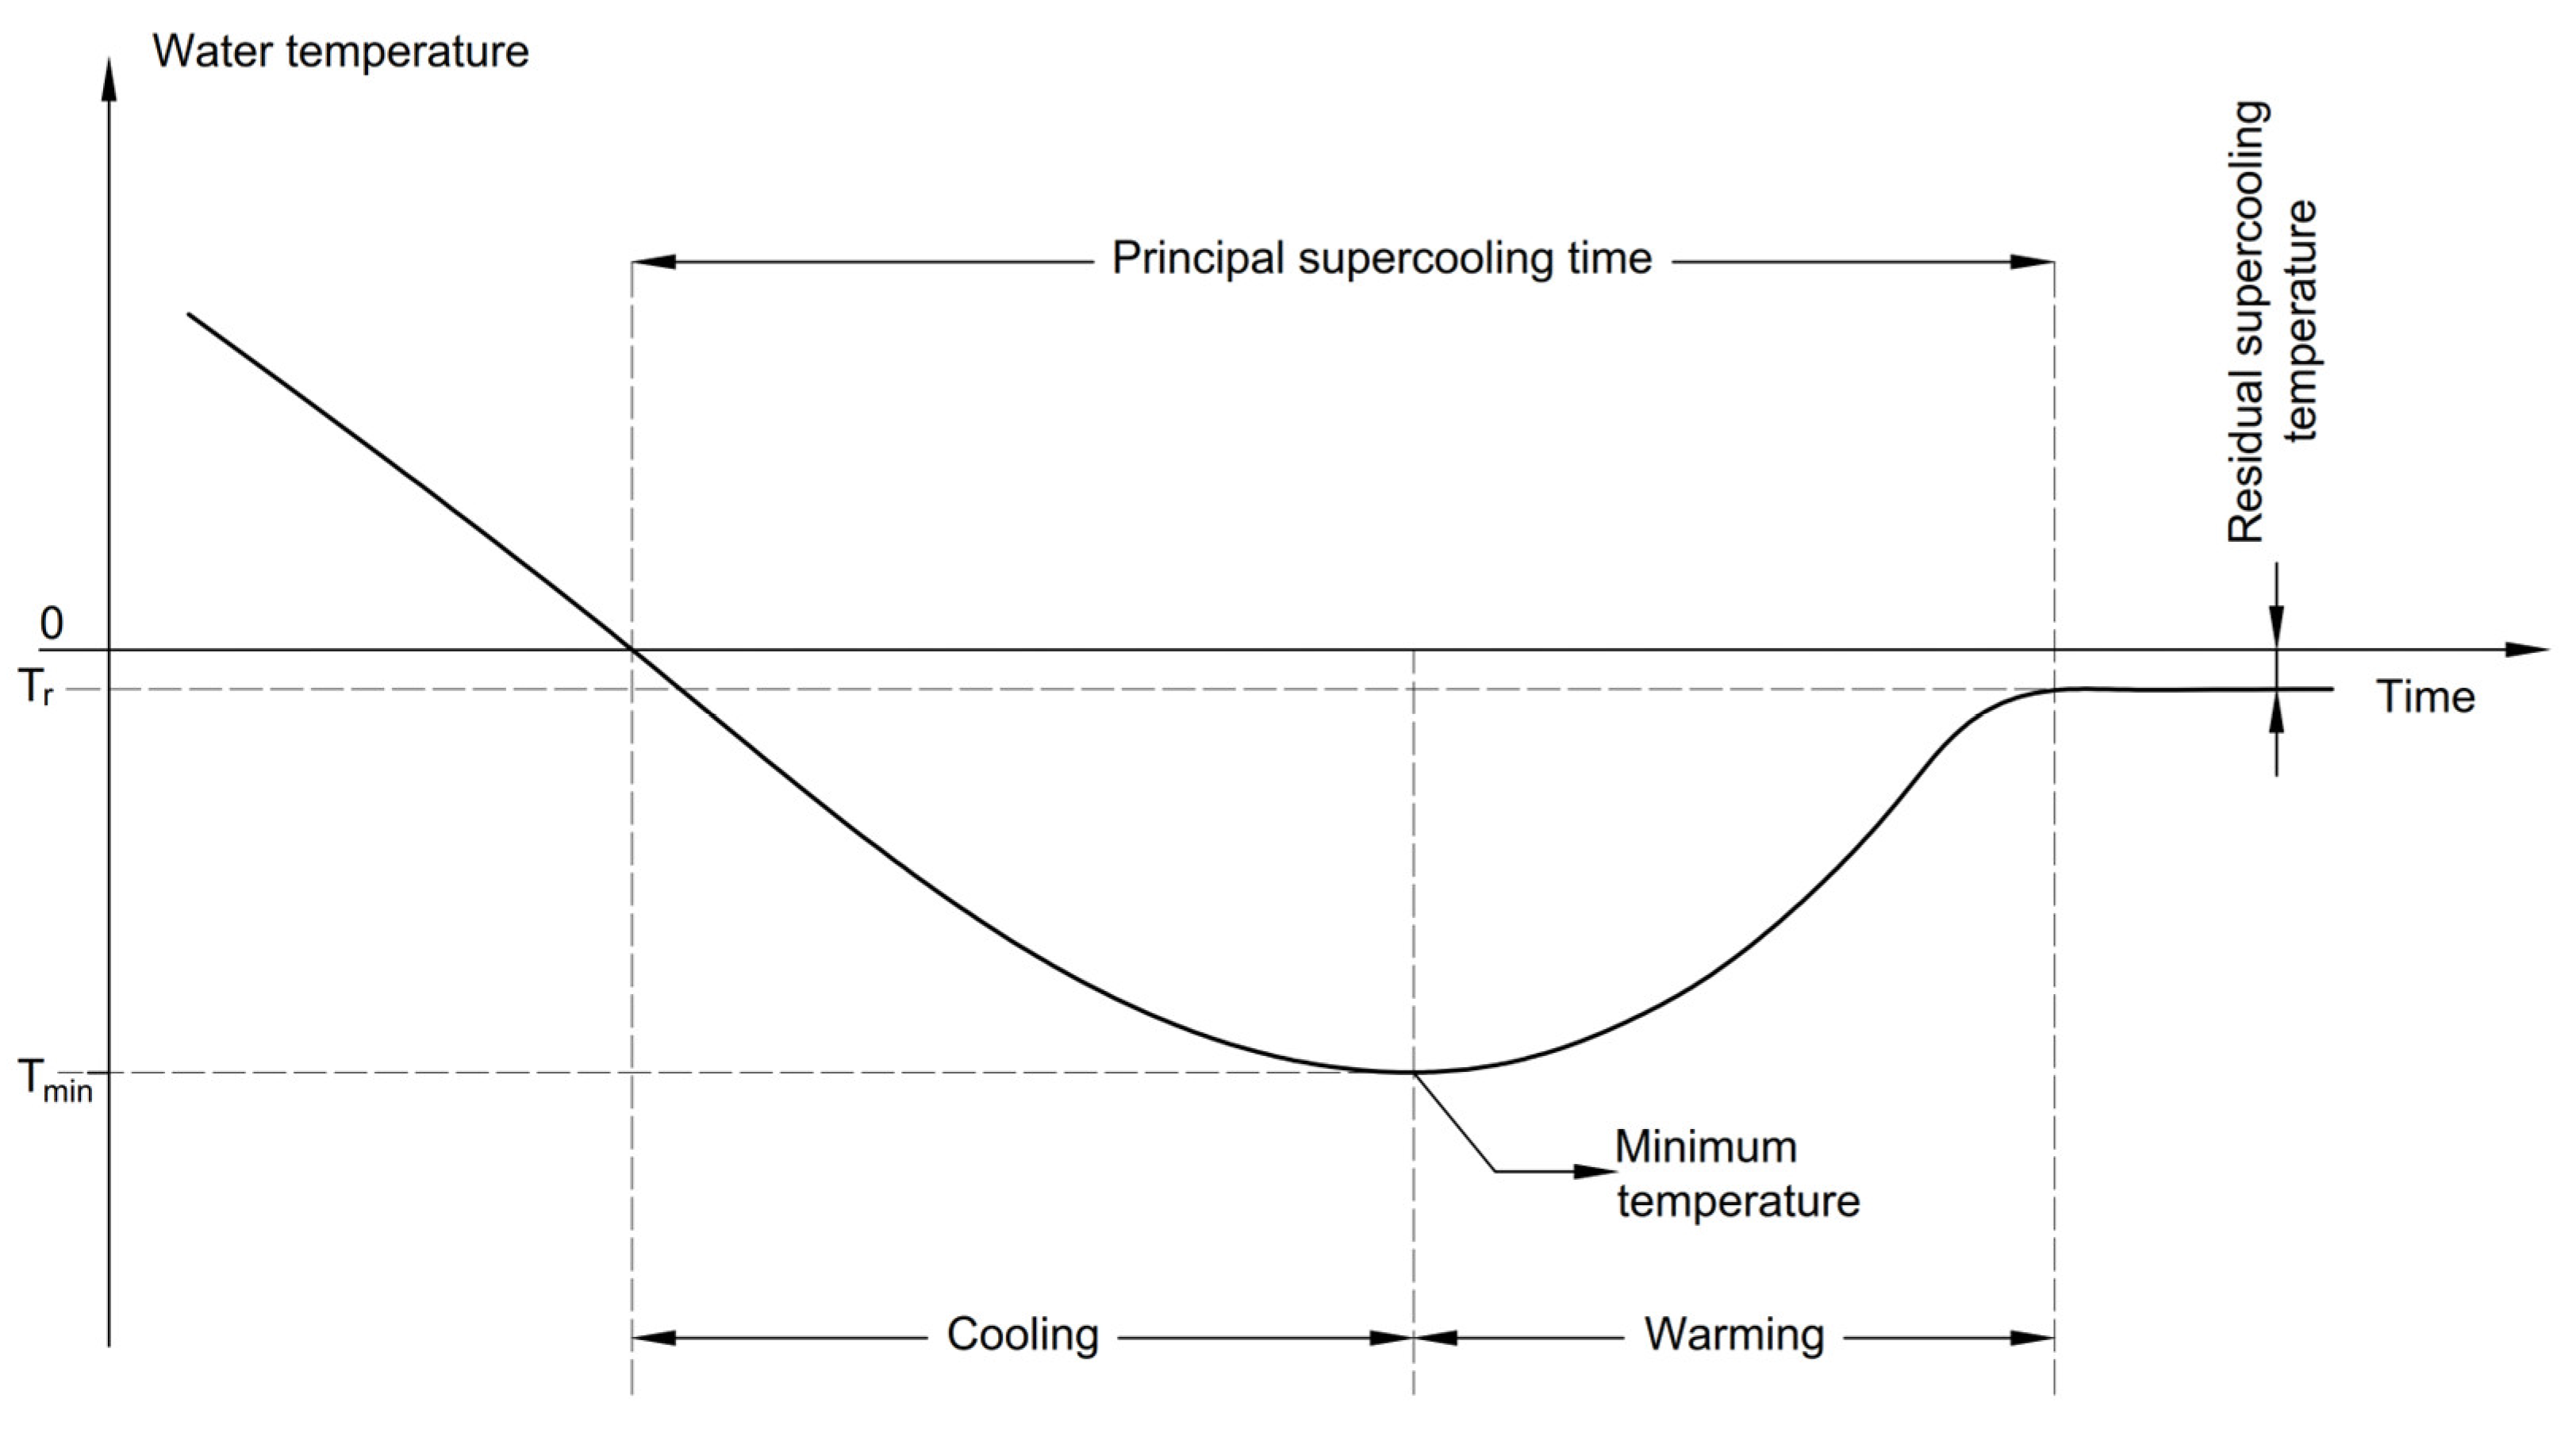
9]. The production mechanism of frazil ice follows a consistent pattern, which can be illustrated by a typical test curve depicted in
Figure 1 (e.g., [
4,
10,
11,
12,
13]). Furthermore, a vital notion is worth considering—it is important to note that this relationship holds true only in the absence of snowfall.
In the first stage, the water temperature, initially above zero degrees Celsius, gradually decreases at a rate determined by external atmospheric conditions. Over a short time period, during which atmospheric conditions remain constant, the cooling rate remains relatively stable. As the temperature approaches 0 degrees Celsius, it continues to drop slightly below zero degrees at the same rate. Subsequently, the rate of cooling begins to rapidly decrease until it reaches zero.
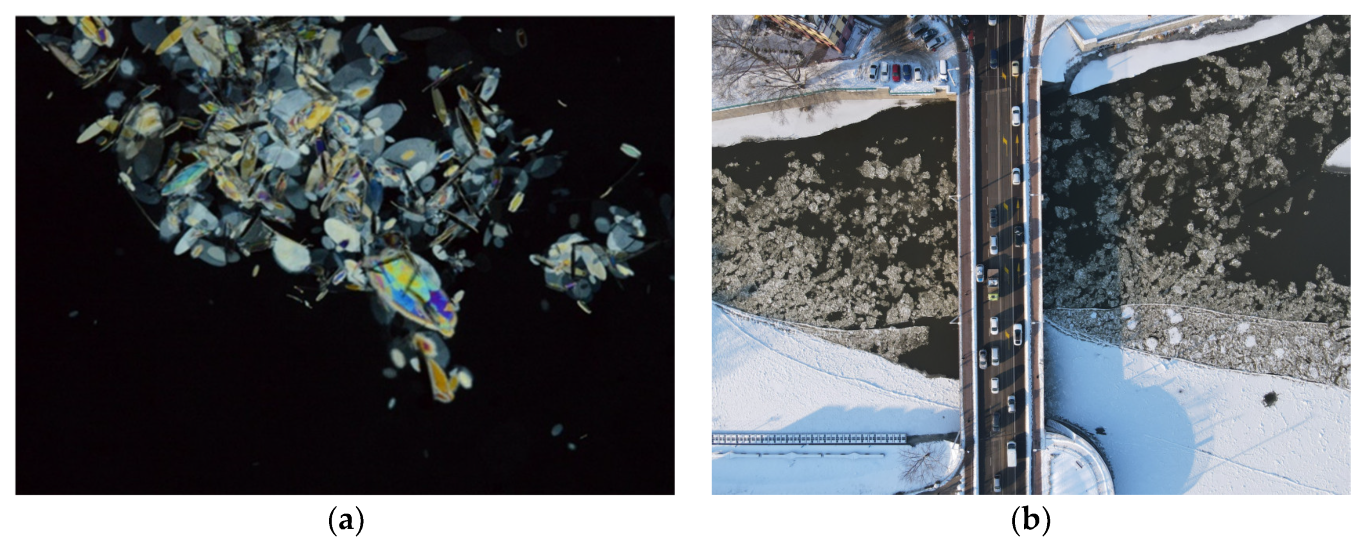
At this point, very small particles suddenly emerge and disperse uniformly throughout the water mass. These particles are too minuscule to be discerned with the naked eye but can be observed during nighttime due to the reflection they generate when illuminated (
Figure 2a). One of the subsequent stages involves the transformation of frazil ice into frazil ice floes, which are visible in
Figure 2b. The photograph was taken at the same time, below the surveyed river cross-section.
Active frazil ice poses a significant hazard due to its inherent properties and behavior. In the process of frazil ice formation, molecules of supercooled water with temperatures ranging from approximately −0.00 °C to −0.030 °C actively seek nucleation sites to initiate crystallization. These sites can include contaminants present in the water or even on the surface, such as pieces of steel. As the supercooled water molecules come into contact with these nucleation sites, they rapidly freeze and form a slushy and adhesive ice known as active frazil. The freezing process can also extend to the surrounding water molecules, leading to the further development of ice. The presence of seed crystals or solid surfaces facilitates the nucleation and growth of frazil ice, enhancing the potential for ice formation and accumulation. This phenomenon highlights the dangerous nature of active frazil ice, as its stickiness and ability to adhere to objects can contribute to the formation of ice jams, blockages, and other flow obstructions, posing risks to navigation, infrastructure, and overall river dynamics (
Figure 2b).
In the presence of an ice cover, freshwater systems experience an interaction between frazil ice and the existing ice layer. The ice cover serves as thermal insulation, reducing the rate of heat exchange between the water and the atmosphere. As a result, the formation of frazil ice is suppressed, leading to a decreased presence of passive frazil ice in the water.
However, it is important to note that the occurrence of active frazil ice is still possible, albeit to a lesser extent, even in the presence of an ice cover. Various contributing factors, such as turbulent flow patterns, tidal influences, and other hydrodynamic processes, can still generate conditions conducive to the formation of active frazil ice. These factors create the potential for supercooled water molecules to find nucleation sites, initiate crystallization, and form sticky and slushy ice.
The concentration of ice in the water column plays a significant role in determining the extent of frazil ice formation. The exact concentration of ice present in the water is an unknown factor that can vary depending on the specific conditions, including temperature, flow velocity, and the history of ice formation and breakup. This uncertainty highlights the complexity of predicting and quantifying the occurrence of active frazil ice in freshwater systems with an existing ice cover.
Understanding the interplay between ice cover, passive frazil ice, and the possibility of active frazil ice formation is crucial for assessing the overall dynamics and hazards associated with frazil ice in freshwater environments. Further research and monitoring efforts are necessary to improve our understanding of these complex interactions and their implications for freshwater systems with ice cover.
2.2. Interaction of Ice with Infrastructure
The majority of instances involving interactions between ice and structures can be categorized into four distinct classes [
14]. The first class dynamic ice forces, which originate from floating ice sheets and floes propelled by streamflow, currents or wind. This mode of action is typically crucial for structures situated in riverine environments and may hold significance in specific lacustrine scenarios. When the structure’s surface facing the ice impact is vertical, the ice generally undergoes failure through crushing and splitting, resulting in predominantly horizontal forces. In instances where the structure’s surface is adequately inclined, the ice experiences failure through bending and shear, giving rise to the development of both horizontal and vertical force components. The second class is static ice forces, which arise from a relatively intact ice sheet experiencing thermal expansion and contraction, or enduring steady pressure from wind or currents. Typically, the ice does not fail but rather undergoes plastic deformation around the structure. The third class comprises forces from broken pack or “rubble” ice, which result from a mass of broken pack or “rubble” ice being driven against a structure, which commonly occurs in situations like a river ice jam or along lake shores. The behavior of the ice pack is somewhat analogous to granular soil. Pile-ups on the shore and forces exerted on ice booms, bridges, and other structures fall within this category. The fourth class is uplift and drawdown forces, which are linked to the adherence of floating ice to piles, among other elements. Forces are generated when static water pressures undergo changes due to factors like tides, reservoir operation, and fluctuations in lake levels.
Accurately predicting ice forces on river piers is of paramount significance. Overestimation can lead to substantial construction expenses, while underestimation poses a risk of structural failure, entailing both financial and safety concerns. Nonetheless, achieving precise estimates of ice forces is a formidable challenge due to the fluctuating nature of ice characteristics and hydraulic conditions [
15].
Water-control structures, encompassing dams and barrages, are susceptible to various ice-related challenges. These encompass static ice loads on the dam and associated structures, complications in operating gates or stoplogs due to freezing, impacts from ice floes, the expansion of ice within closed structures like gates, and potential damage to the reservoir shoreline’s armour stones. Bridges also face distinct ice-related issues, including ice loads on bridge piers or the structure itself, arising from factors like ice floe impacts, static ice loads, ice jamming, and fluctuations in water levels. Additionally, there may be ice-induced rises in water levels leading to flooding, as well as hydraulic scour caused by ice. Ferry crossings are affected by high accumulations of drifting ice that may exceed the capacity of ice-breaking ferries. Ice jams and runs can cause damage to the ferry landing infrastructure. Furthermore, managing ice in the channel and shoreline access points through measures like bubblers is crucial to ensure navigability. Navigation infrastructure may suffer damage due to the presence of artificial islands around piers in shipping channels. These islands are intended to protect against ship impacts and regulate the formation of ice cover. Water intakes are susceptible to blockage by frazil, both active and inactive. Shallow intakes may experience ice buildup and pileup from the surface downwards. Severe ice runs and jams can lead to significant damage [
16]. Infrastructure situated across and along rivers with winter ice cover may encounter significant loads from the ice. Specifically, ice runs have the potential to induce critical ice interactions [
15]. Bank protection works face challenges such as ice “bulldozing” along the shoreline, ice-induced hydraulic scour, and potential harm to armour stones. Flood protection works, including levees, may experience reduced ice and flow conveyance capacity, which could potentially lead to overtopping. Additionally, the armour stones used in these structures may be subject to damage [
16].
While dams or weirs are not typically designed exclusively for ice control, they stand out as the most efficient type of ice management structure. These constructions, by elevating water levels and moderating water velocity, facilitate the formation of a thermal ice sheet and the aggregation of frazil floes originating from the swifter upstream river sections. The reservoir formed by a dam or weir acts as a reservoir for frazil ice that has been transported from the more open stretches upstream, preventing its accumulation at downstream sites that are prone to freeze-up jams. By averting these freeze-up jams, the subsequent breakup run can navigate through conventional problematic areas without hindrance [
17].
Furthermore, there is a notable lack of understanding regarding the impact of in-stream structures on the river ice regime, and there is a scarcity of design guidelines that are accessible for both designers and regulatory bodies [
18].
In a river channel, the mere presence of stationary ice leads to elevated water levels for a given discharge in comparison to open-water conditions. This is attributed to the ice occupying a section of the channel’s cross-section and introducing a roughness factor that retards the average flow velocity and modifies the velocity profile [
16].
2.3. Utilized Research Methods and Instruments
The observation and study of frazil ice floe and ice phenomena in natural watercourses and reservoirs are challenging due to the random nature of these processes and the diversity of natural conditions. Therefore, to gain a better understanding of phenomena related to frazil ice, laboratory studies are conducted, allowing for the precise control of operating devices (such as pumps and turbines) by regulating flow conditions and temperature [
13]. Additionally, these studies enable the more effective observation of occurring processes, utilizing a variety of measurement tools and methods, such as shadow photography [
19], Laser Doppler Velocimeter optical system [
20], a self-constructed electro-resistant instrument [
21], filters [
6], optical instruments [
22], shallow water ice profile sonar (SWIPS) (e.g., [
23,
24,
25]), acoustic instruments like ADCP (e.g., [
26,
27,
28,
29,
30]), and machine learning models [
31].
Table 1 presents selected scientific articles conducted in both field and laboratory settings, characterizing the research problem, instruments that were utilized, and the location of measurements.
2.4. Research Site
The investigation was conducted on 12 February 2021 at the Opatowice weir, situated at km 245 + 035 along the course of the Odra River in Wrocław, Poland (
Figure 3). This weir is part of the Bartoszowice-Opatowice barrage, which comprises two weirs and two locks. The Bartoszowice-Opatowice barrage plays a significant role in the canalized Odra River, serving three primary functions: (1) maintaining controlled water levels for navigation purposes, (2) stabilizing soil and water conditions for agricultural and forestry activities, and (3) regulating the riverbed. Within this barrage, the Bartoszowice weir and the Opatowice weir enable the division of water flow into the City Odra River and the Flood Canal, while also supplying water to the Bartoszowice-Zacisze Navigation Canal.
The Odra River in the vicinity of Wrocław represents a prototypical example of a medium-sized, lowland river in Central Europe. The hydrotechnical infrastructure, including the weir, exemplifies a conventional water management system with all the associated components. The choice of this specific location was deliberate, as we believe it can be regarded as representative, and consequently, the findings can be extrapolated to other lowland rivers of similar characteristics. This selection facilitates the identification of fundamental patterns and processes applicable to broader contexts within this category of river systems.
2.5. UAV Setup
In order to obtain optimal results of aerial photography, the DJI Mavic Air 2 UAV equipped with a 12-megapixel camera and a 1/2” CMOS sensor flight was conducted at an altitude of 69 m above ground level (AGL), which falls within the upper limit of allowable flight elevation according to the Polish Civil Aviation Authority. When this altitude was reached, orthorectification was performed, ensuring that the camera matrix was parallel to the imaging plane. The frame was meticulously adjusted to encompass the entire study area, containing the river, its banks and reference points. Then, the flight was stabilized, and the images were captured during a period of minimal wind movement.
The aerial photographs were taken on 12 February 2021 at approximately 15:30 (UTC +2), at a temperature of −7.4 degrees Celsius. The research was conducted using the UAV DJI Mavic Air 2, which is equipped with an RGB camera.
Table 2 provides precise specifications of the quadcopter and camera.
2.6. The Applied Research Methodology
The presented work is an extension of the methodology presented in previous work [
1], where we utilized the open-source Fiji (version 1.53t) in conjunction with the TrackMare plugin [
43] to assess the flow velocity of frazil ice floes. This approach enabled us to generate moving trajectories, calculate distances covered and determine preference indices in two-choice assays. The analysis was extended to include ice morphometry, i.e., shape detection and identification, surface area, perimeter, circularity. In the study, the open-source Fiji version 1.53t [
44] was employed which is costless, multiplatform and under an open license. It is widely used in image analysis. It has options for importing ready-made scripts. To determine the selected morphometrical parameters of the ice, a stabilized UAV video recording was used. To extract frames from the recording, images from 0.5 s, 1.5 s, 2 s, 2.5 s, 3 s, 3.5 s, 4 s, 4.5 s, 5 s, 5.5 s, 6 s, 6.4 s were recorded for a total of 12 images. The files were then saved in the lossless tiff format. The 12 images prepared in this way were transformed to an 8-bit gray-scale. The batch files that were prepared in this way were subjected to a thresholding process that allows for the selection of bright fragments—in this case, a flowing floe against the background of dark, unfrozen water. This process can be performed manually for each frame. To avoid an arbitrary selection being made by the operator, the Renya Entropa [
45] algorithm was used. Thanks to this, the same thresholding conditions were achieved for all batch files. The results of the Renya Entropa algorithm are binary files (black and white). In order to eliminate minor errors, the close option was used—adding one pixel (dilation) from the perimeter of the floe and then subtracting (erosion) one pixel [
46]. The files were converted to grayscale and then to 8 bits. The closure function smoothes objects and fills small holes (less than 26.83 cm
2), which may be the result of noise generated by camera matrices. The watershed function was used to automatically separate or cut apart particles in contact (e.g., aggregated ice fields). This is a fast and flexible algorithm for computing watersheds in digital gray-scale images. The algorithm is based on an immersion process analogy, in which the flooding of the water in the picture is efficiently simulated using a queue of pixels. This is commonly used in applications like medical image analysis, geospatial image processing, and object recognition, where the precise segmentation of objects in images is crucial [
47]. All measurements were performed automatically. Subsequently, the processed images were analyzed using the ‘Analyse Particles’ function, which computed the ice area, perimeter, and circularity using the formula 4𝜋 (area/perimeter
2). A circularity value of 1.0 indicates a perfect circle, while a value approaching 0.0 signifies an increasingly elongated polygon. Images that extended beyond the defined reading area were excluded from the analysis. The workflow diagram applied in this study is depicted in
Figure 4.
3. Results
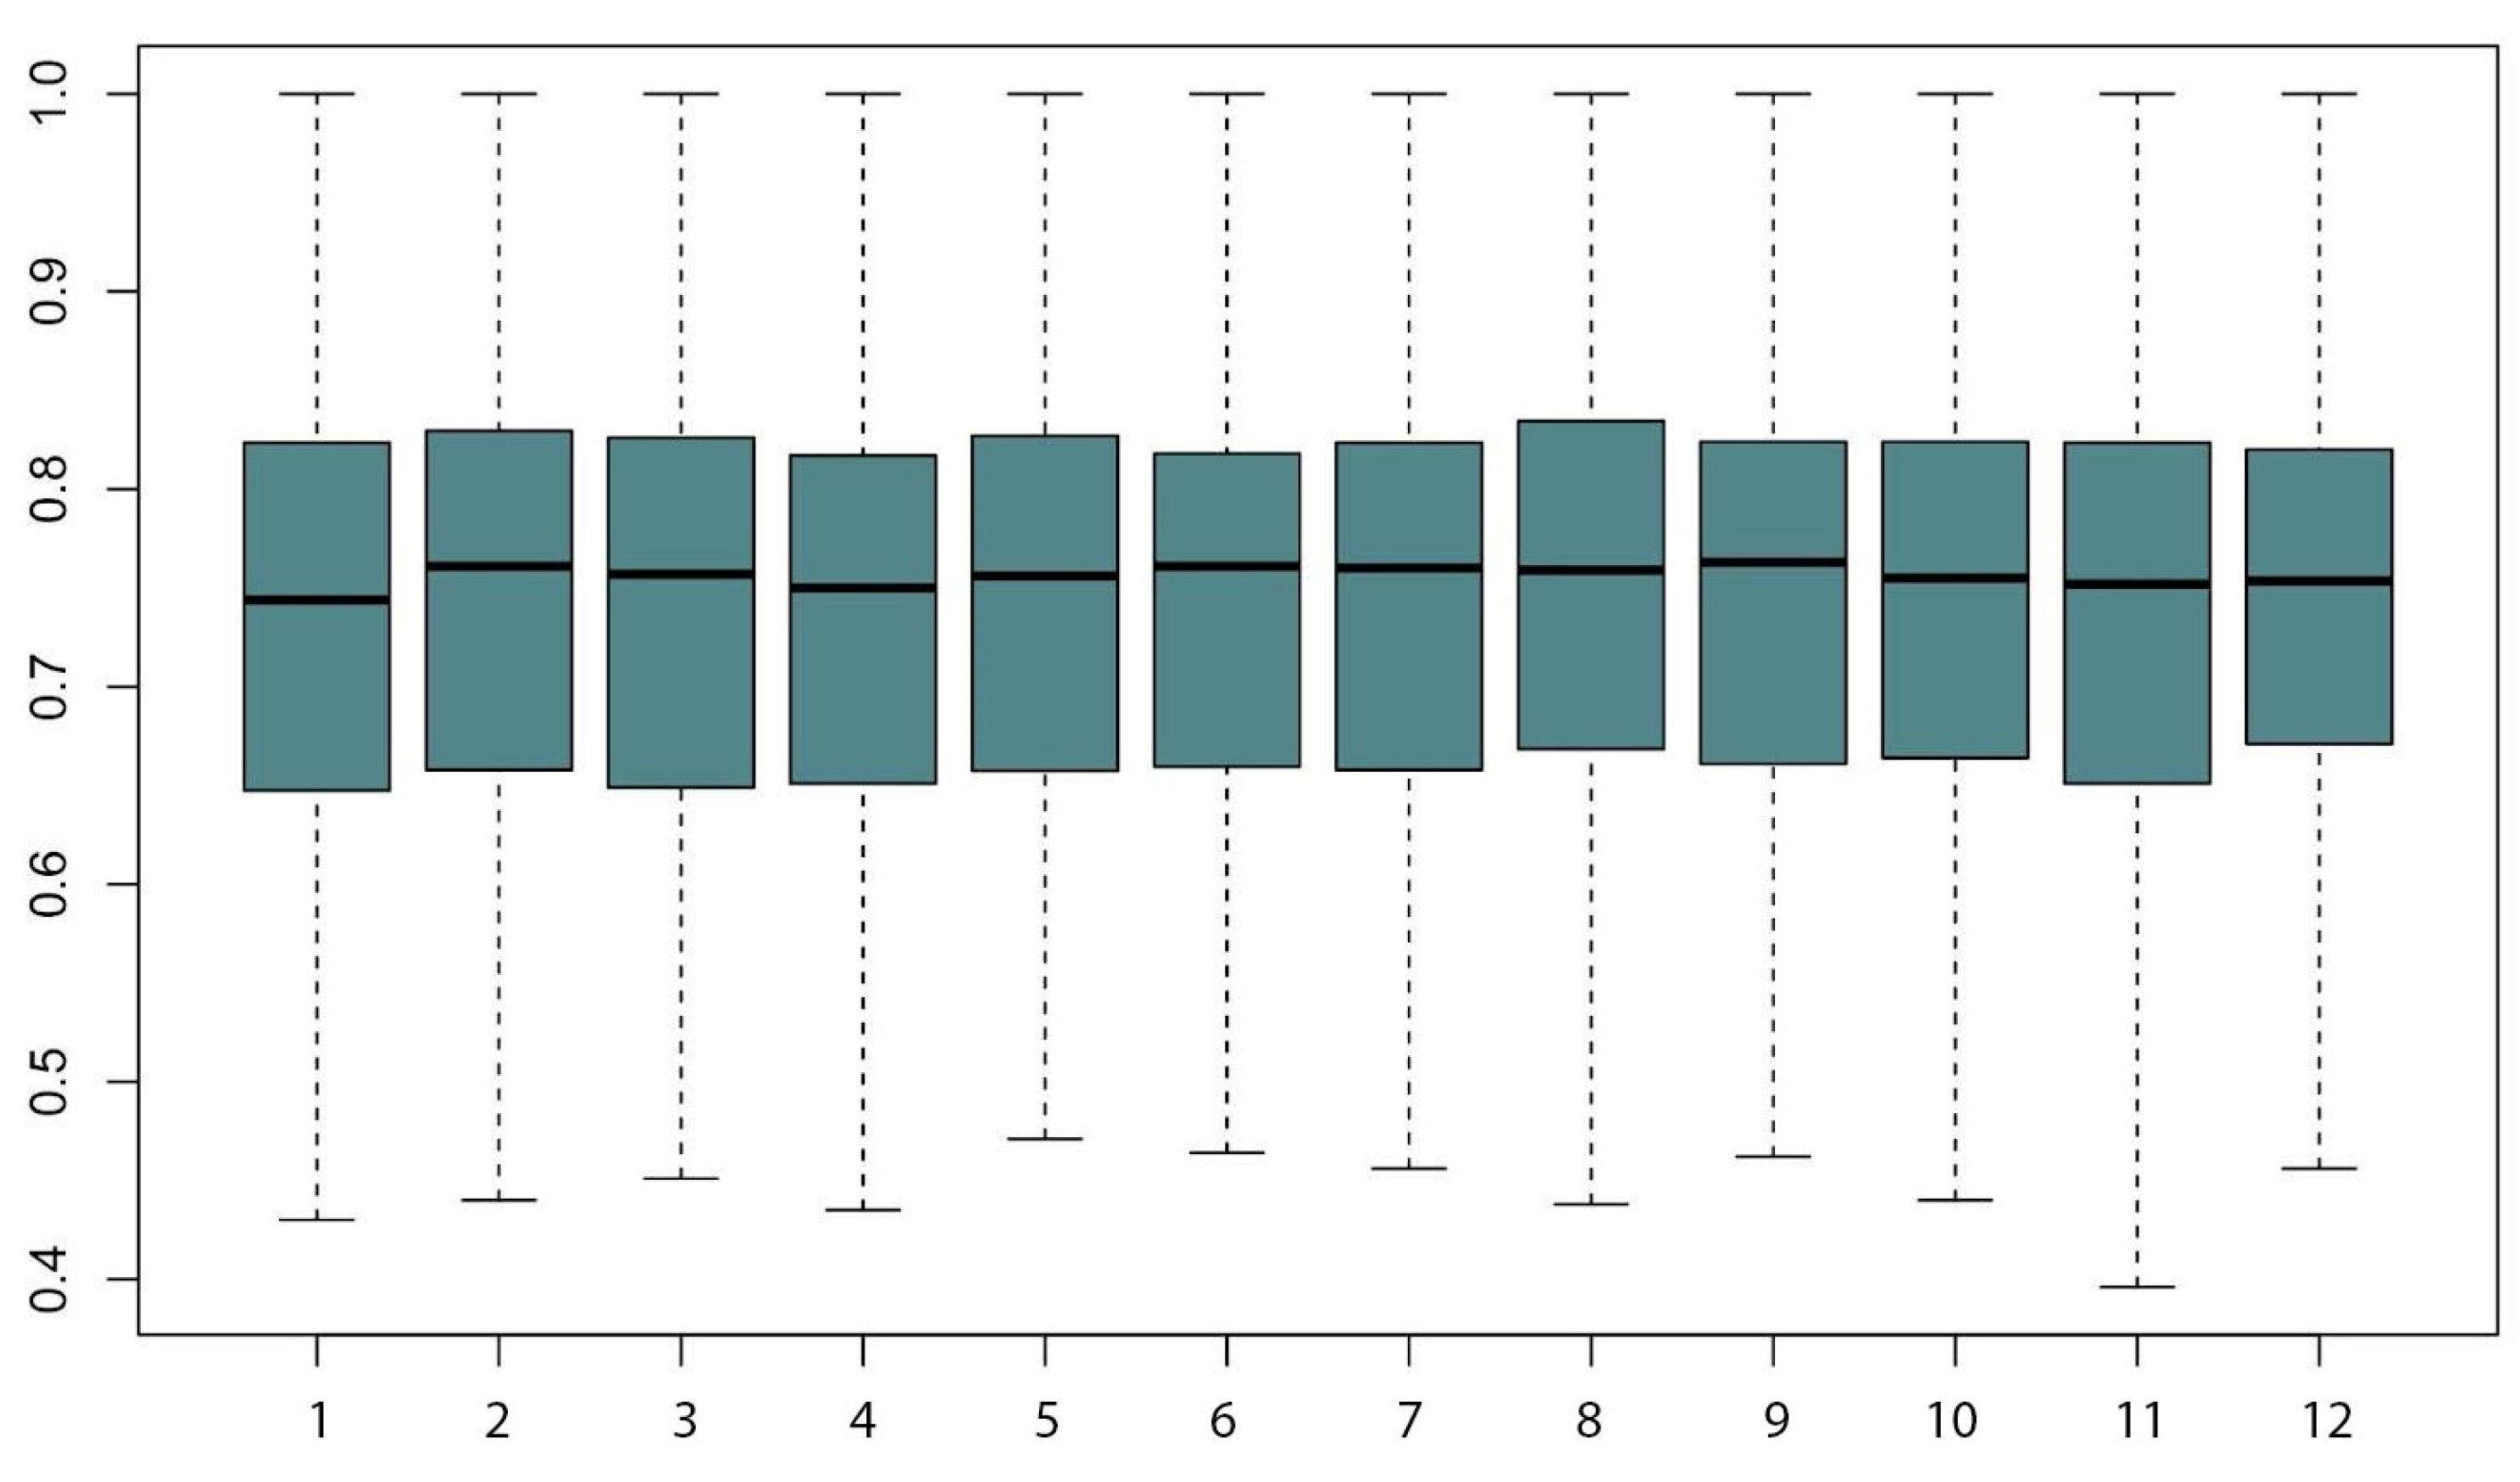
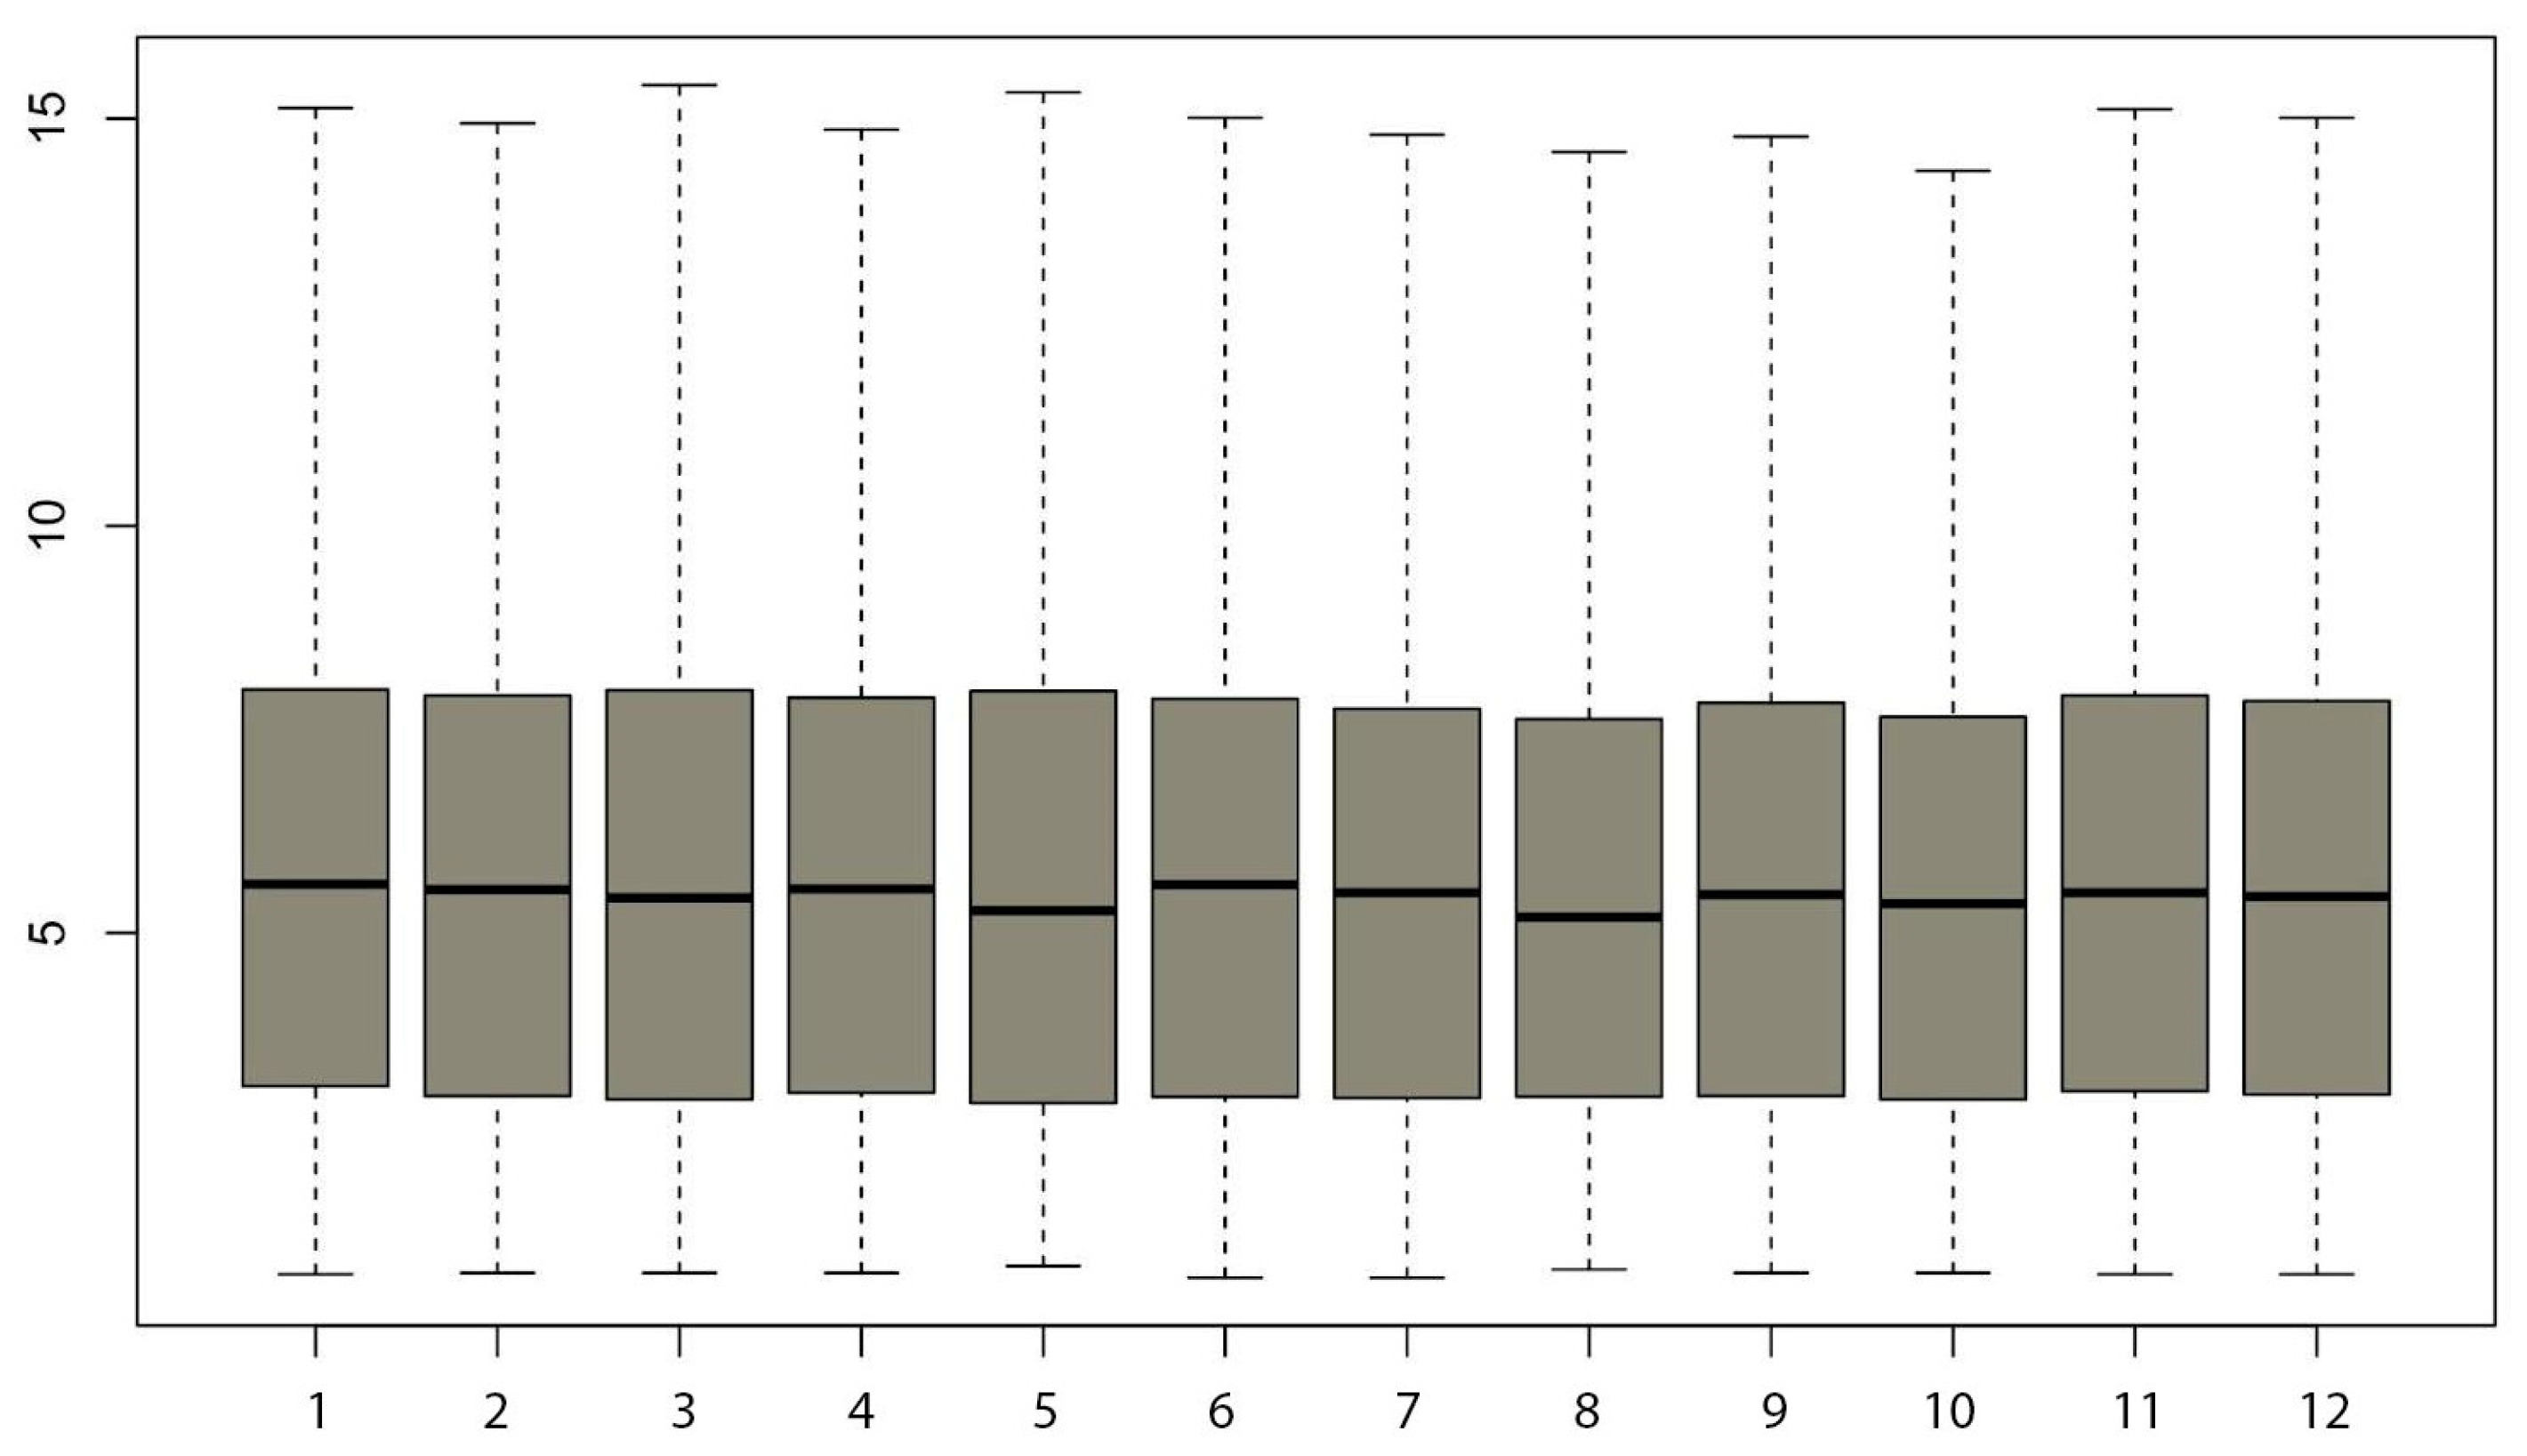
By processing a total of 12 images, we successfully identified 3444 pieces of drifting ice. It is important to note that any fragments of frazil ice floes that extended partially beyond the designated selection area were excluded from the analysis. On average, each image contained 287 pieces of ice. The calculated average size of the drifting ice was 3.379 square meters, with a perimeter of 6.369 m and a circularity of 0.743. The aim of the work was to develop a new methodology to determine the basic morphometrical parameters of the ice floes. Therefore, it was decided to use basic statistics such as mean, media, modal, and standard deviation to check the homogeneity of readings from individual frames of the film.
Table 3 provides a comprehensive presentation of the analytical results that were obtained.
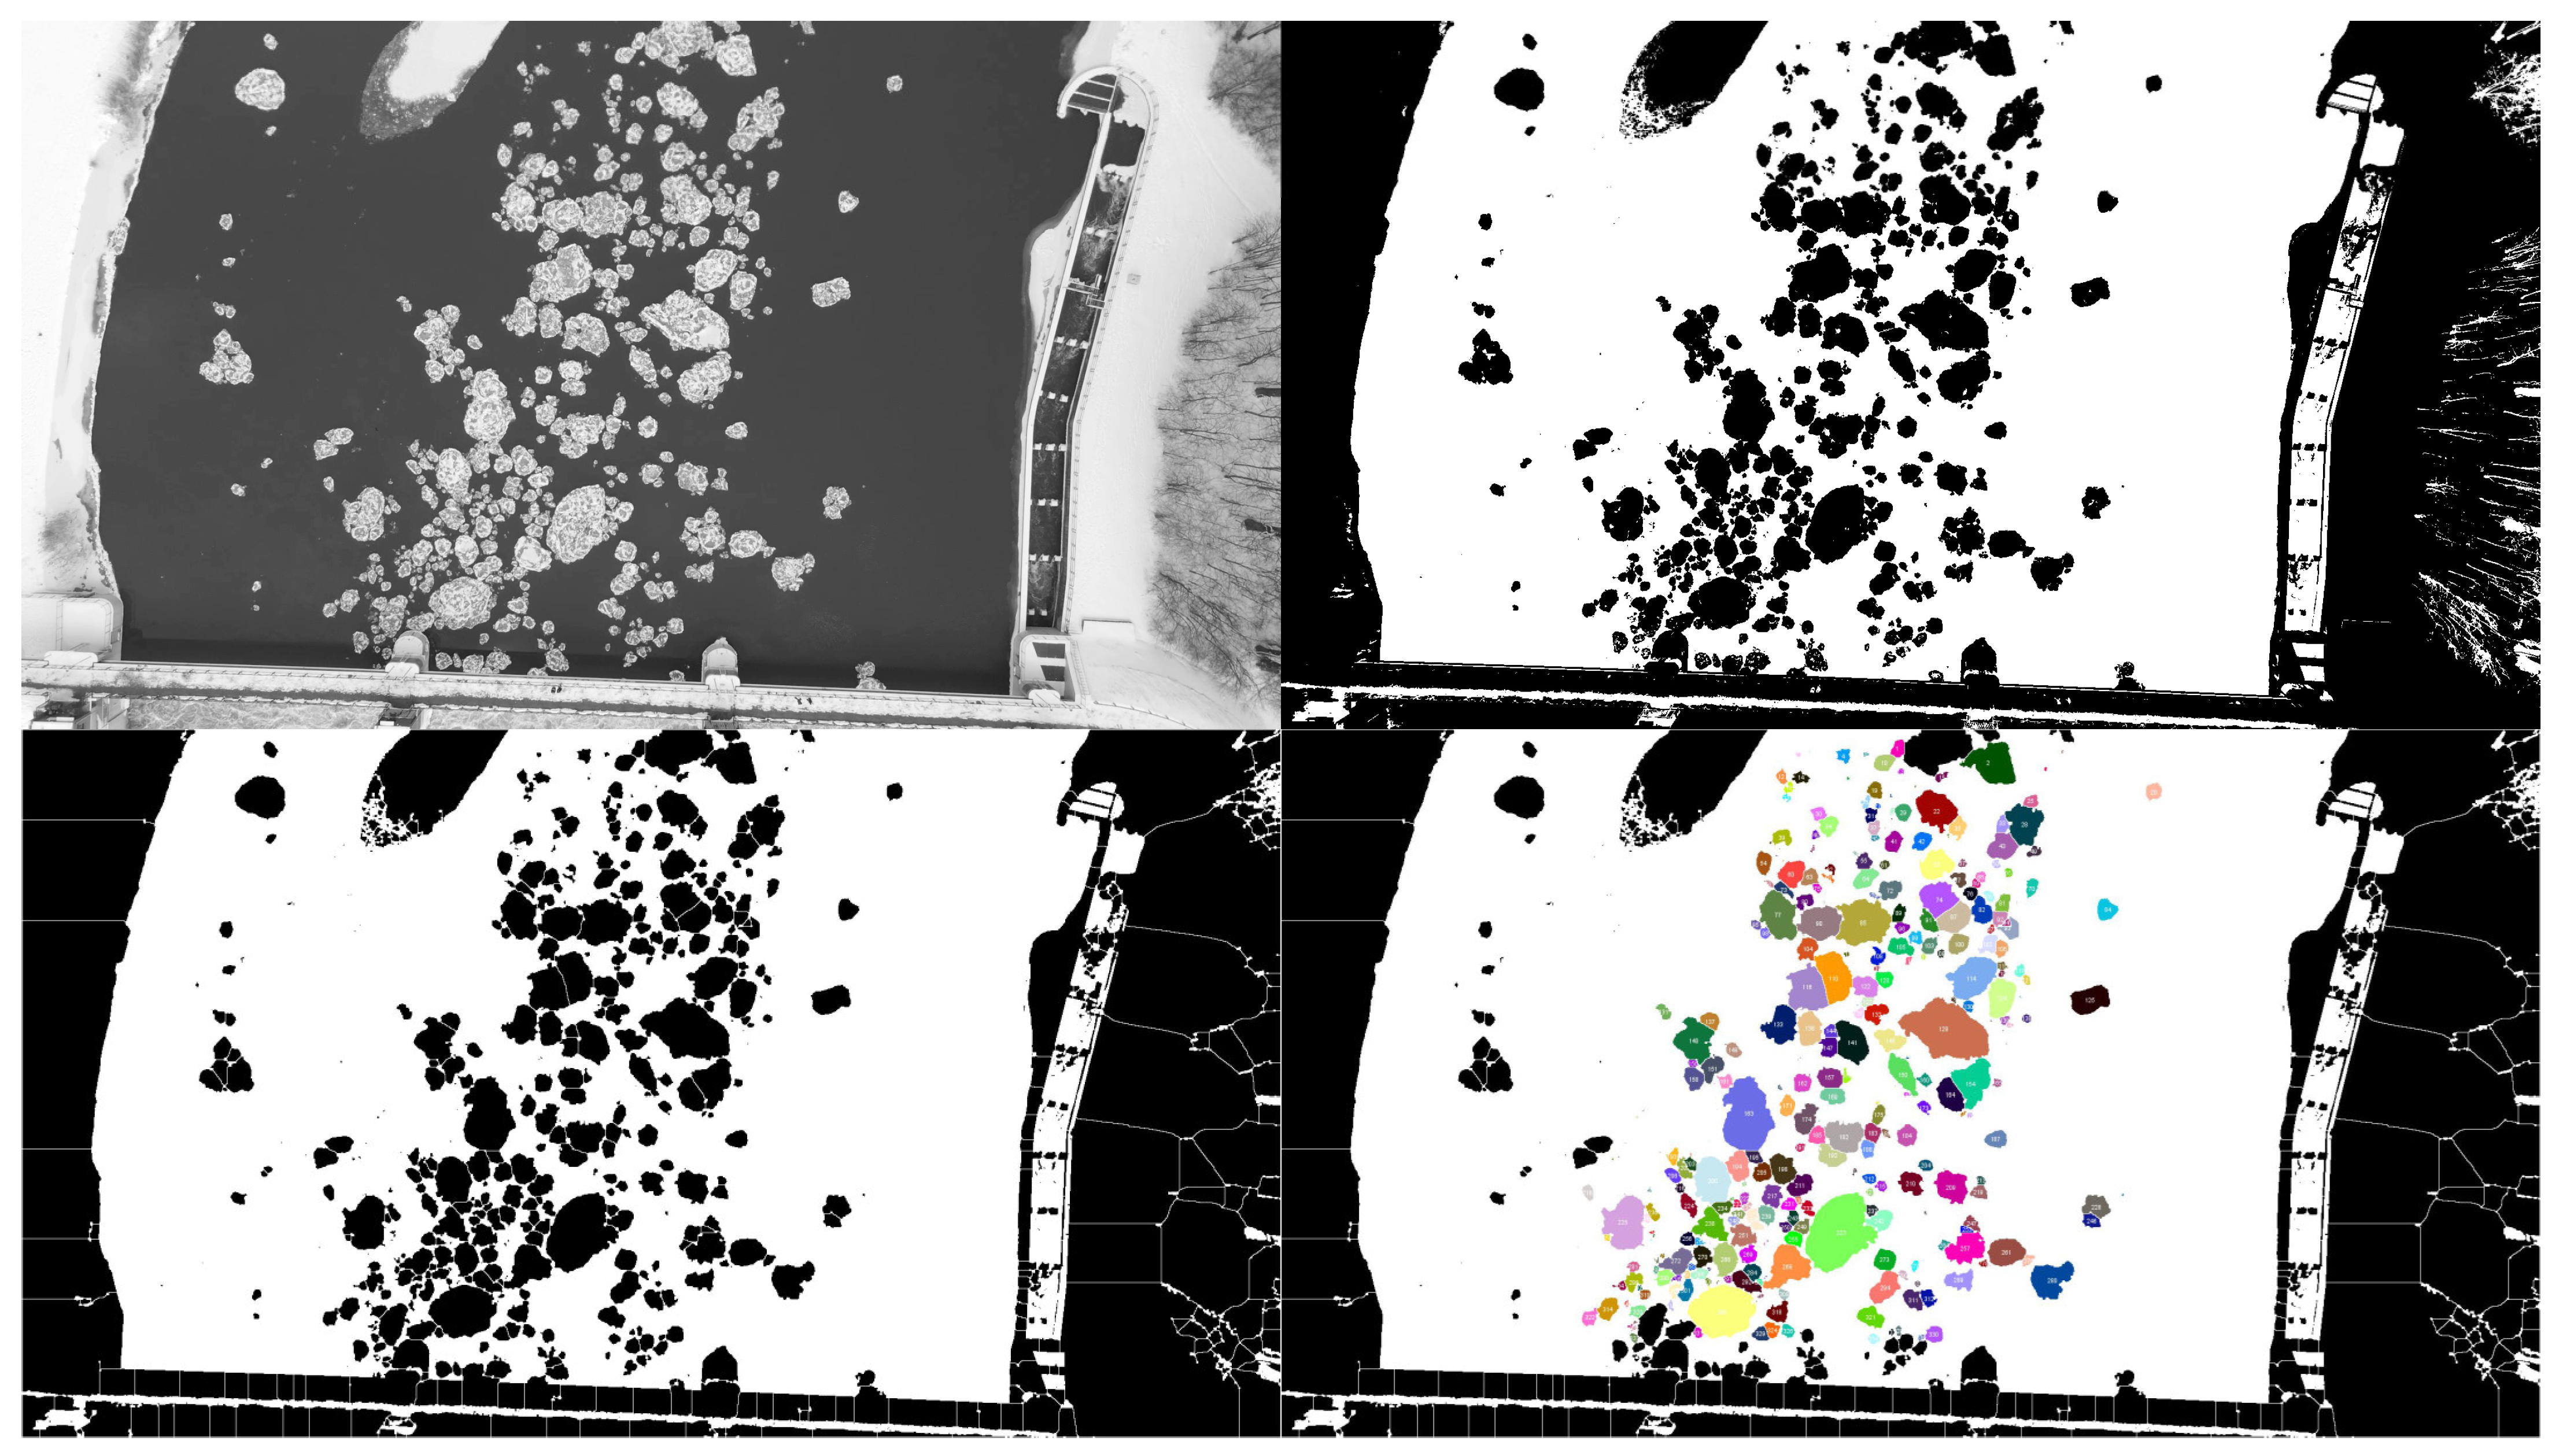
In
Figure 5, the image analysis process is outlined. It begins with a grayscale image in the upper left corner, followed by a thresholded image in the upper right corner. The catchment feature is displayed in the lower left corner, and the count mask image is shown in the lower right corner. This comprehensive illustration provides a clear visual representation of the analytical steps involved in image processing. The colors were randomly assigned by the program for better data visualization.
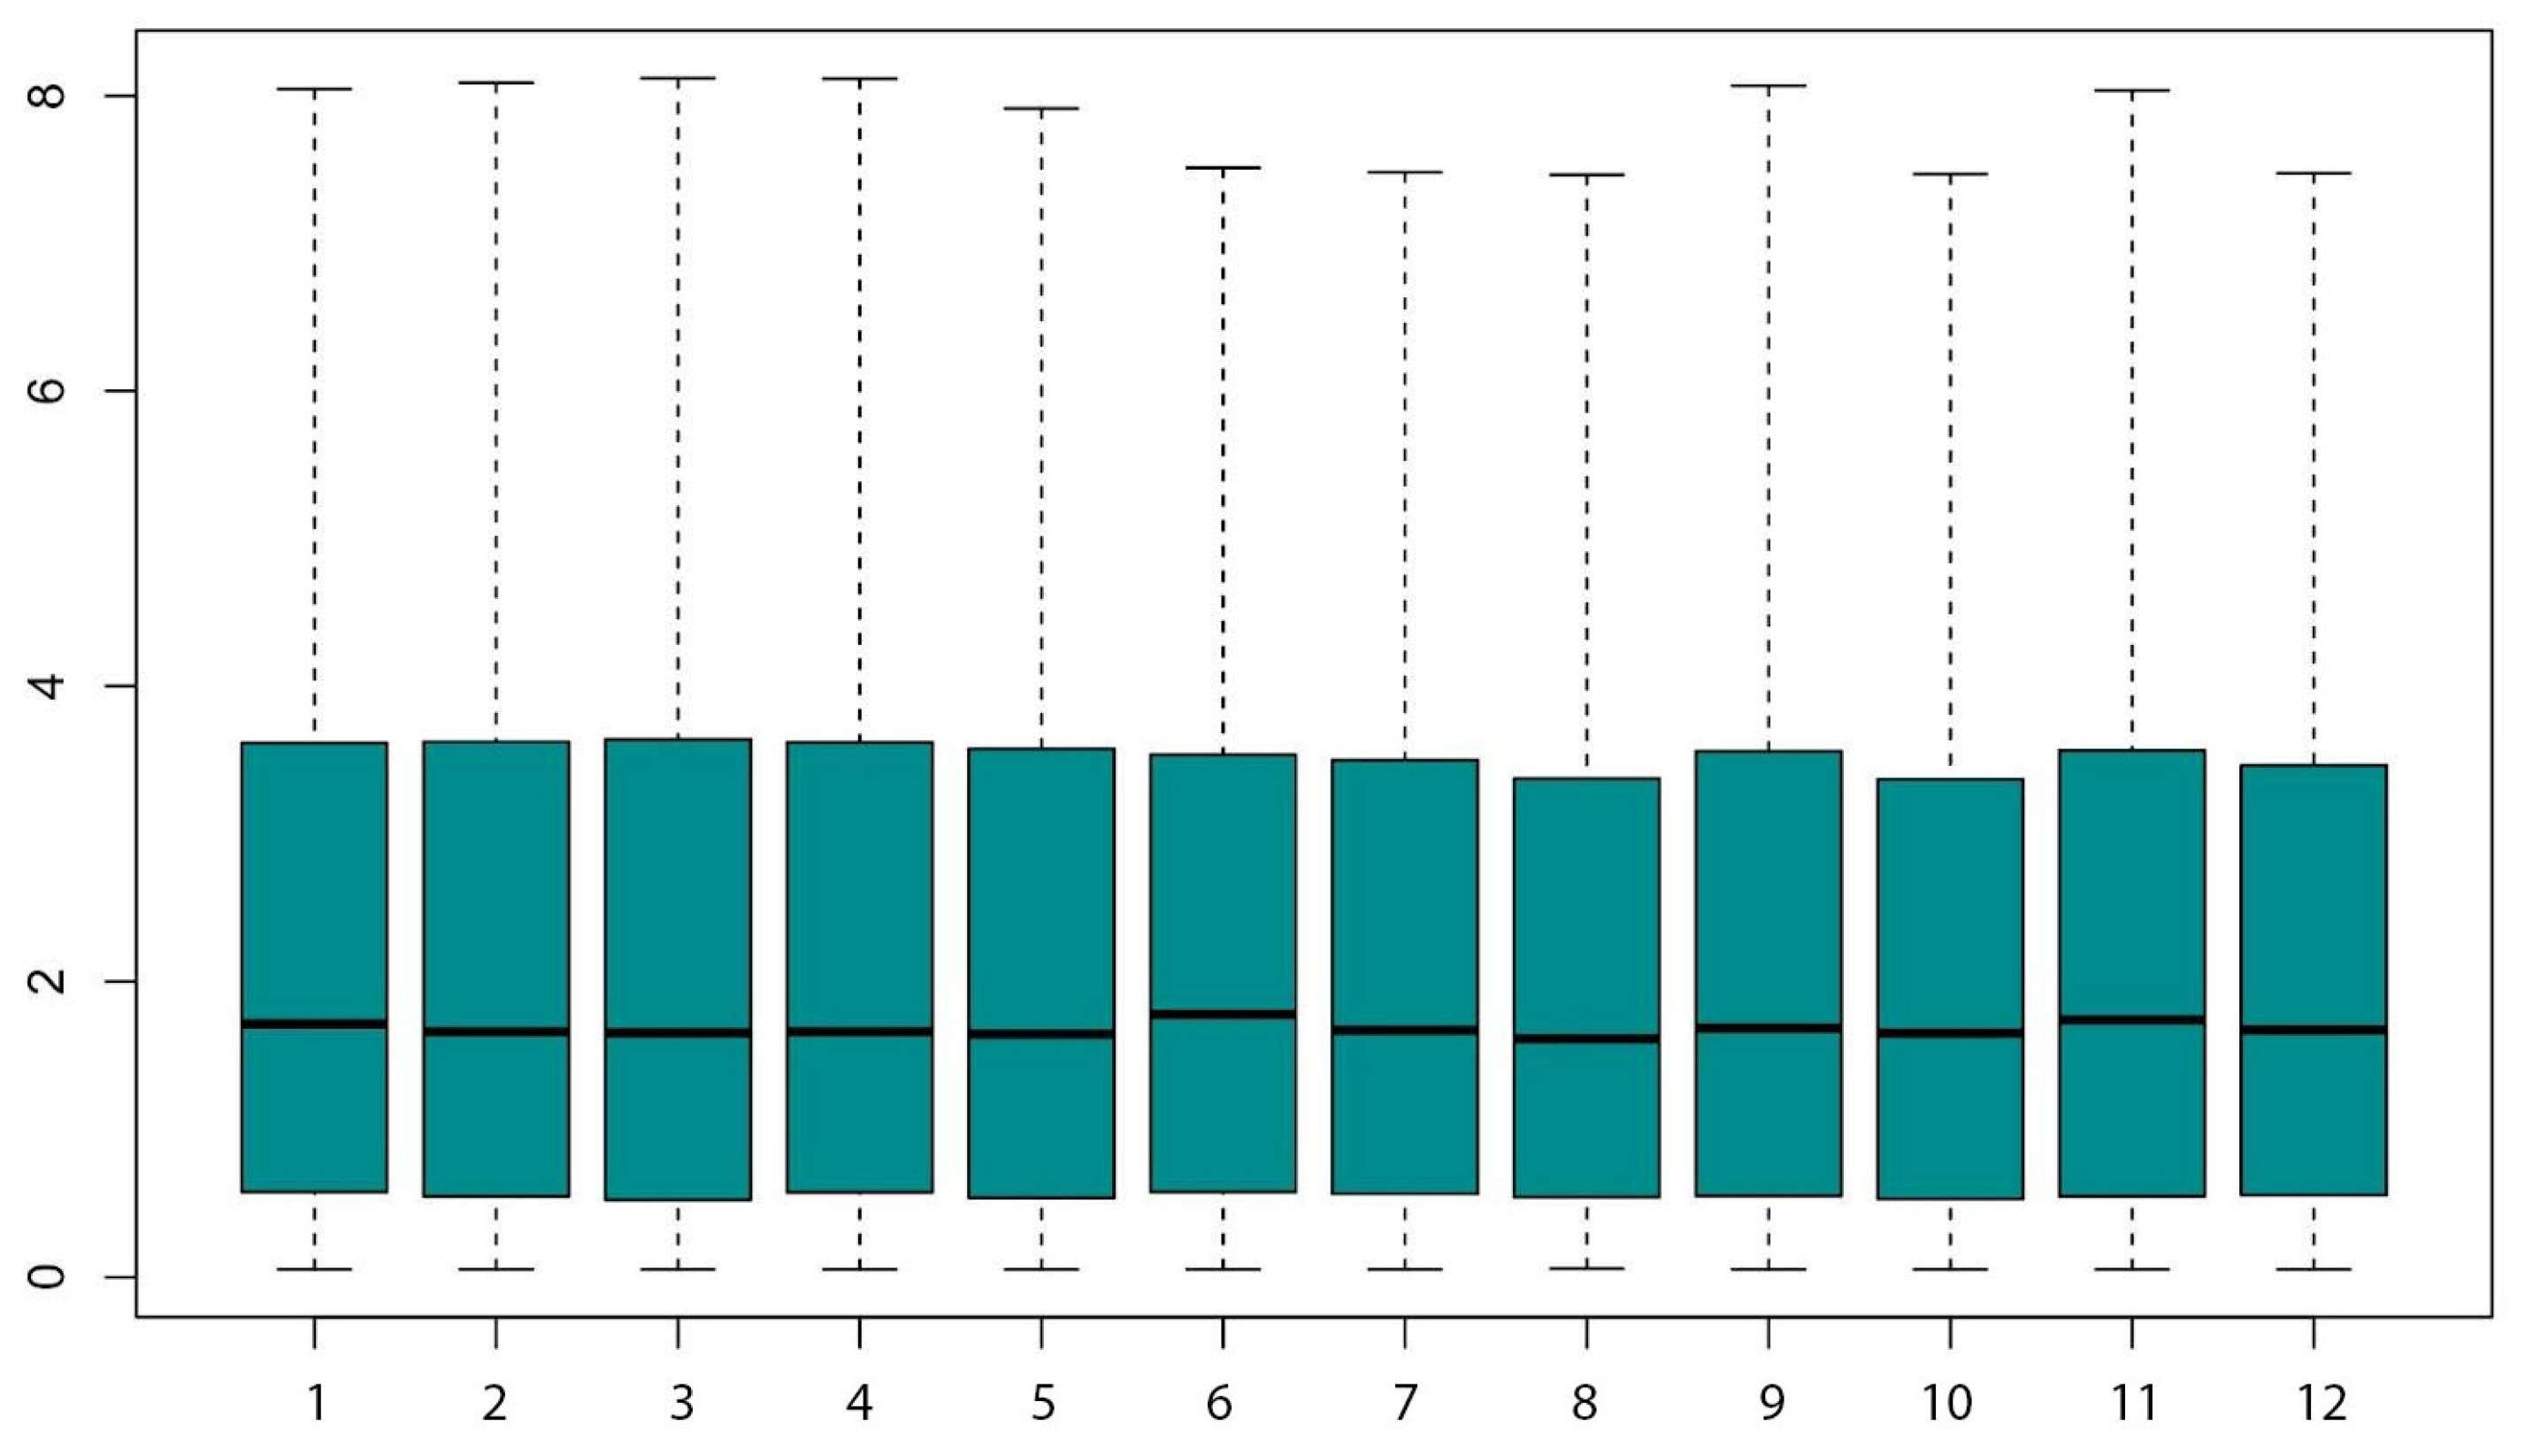
The fundamental morphometrical parameters were described using standard statistical measures, including minimum, maximum, first and third quartiles, median, and mean. The examination of individual frames within the recording demonstrated the method’s high efficacy, with results exhibiting only minor deviations from the average.
Figure 6,
Figure 7 and
Figure 8 illustrate boxplots depicting the morphometrical characteristics of frazil ice floes, specifically surface area, perimeter, and circularity. These visuals affirm the method’s robustness and consistency in parameter readings.
Furthermore,
Figure 6,
Figure 7 and
Figure 8 offer a statistical insight into the stability of the solution, emphasizing the limited variability among readings across individual frames. This striking uniformity suggests a high level of consistency in the acquired data, with minimal fluctuations discernible from one moment to the next. While this finding is noteworthy, additional analysis is warranted to elucidate the underlying factors contributing to this observed low variability and to evaluate its implications for our study.
4. Discussion
A systematic approach to the observation of ice phenomena is implemented across all regions where ice phenomena occur, due to the significant impact of ice on human activities and the utilization of waterways. Conventional observation methods have been associated with considerable time and labor demands, coupled with limited quantitative and qualitative data acquisition pertaining to ice phenomena within the observed area. An alternative or substantial complement to traditional observation techniques lies in the application of remote sensing for image analysis. The potential of employing remote sensing for ice phenomena observation has been recognized in several academic institutions, as summarized in
Table 1. Considering a thorough review of the literature and drawing from our own experiences, as presented in the publication [
1], investigations were conducted to ascertain the morphological parameters of frazil ice floes.
The research has demonstrated the feasibility of determining morphometrical parameters of floes through UAV observations. Through an analysis of the potential and capabilities of UAVs and remote sensing to assess the occurrence of ice phenomena and, consequently, in determining hazards to hydrotechnical infrastructure and adjacent riverine structures, it can be affirmed that this constitutes a promising and innovative tool, representing a valuable avenue for future research.
The very process of image processing, as well as the binarization, segmentation and analysis of components, depends on the computer’s computing power; however, with standard desktop PC hardware, it should not take more than 5 s using macro due to the larger dataset, making it possible to investigate how morphometrical parameters can be utilized in predicting ice blockages. The usage of a drone along with image processing software under an open license potentially provides an excellent tool for monitoring ice flow and the early detection of threats stemming from blockages in inland waterways.
When utilizing UAVs to capture images of frazil ice floes in motion, several challenges and limitations were encountered. One of the challenges is maintaining flight stability while recording video. Keeping the camera steady is very difficult, even with the use of advanced stabilizers. During post-production stabilization using automatic algorithms (in Davinci Resolve Studio 18.1 software), we encountered a problem with stabilizing relative to moving objects, meaning that the algorithm took the moving ice floes as reference points. As a result, the ‘stabilized image’ moved along with the floes. We had to use a different approach by defining points for stabilization.
The images acquired during the flight were of high quality, captured under favorable lighting conditions and in good weather conditions (no rain or snow, absence of shadows, and no wind). This is in line with our objective of observing natural, pre-existing conditions in the field, rather than using a controlled laboratory setting. Adverse atmospheric conditions pose a potential threat to the possibility of obtaining reliable data. It is worth noting that even human observers would face challenges under adverse atmospheric conditions, which can impede research endeavors.
This presents another possible direction for future research, involving an assessment of the influence of photographic material quality on the obtained results. This entails examining how the resolution of the captured image, noise originating from the sensor, exposure time, and the occurrence of atmospheric precipitation can affect the quality of results. The acquired image was taken in an orthogonal view, which is optimal for minimizing distortions caused by the perspective effect. However, studies (e.g., [
33,
34,
48,
49,
50]) indicate that this is not a necessary condition, and it is possible to obtain reliable results without orthorectification. Utilizing cameras permanently installed in the technical infrastructure of a facility is possible. However, it is highly unlikely that they will be positioned at the same altitude as a drone’s flight, which, in our study, was at 69 m. In such a scenario, it would be necessary to employ a lens with a shorter focal length, thereby increasing the field of view. However, this adjustment would also lead to optical distortions and could decrease the resolving power. As a consequence, it may impact the quality of the obtained results, necessitating distortion correction.
It is important to underscore that this study serves as an initial foray into exploring the potential of remote sensing for monitoring ice conditions. The acknowledgment of potential inaccuracies stemming from alterations in survey height is meant to flag an avenue for future refinements and advancement of the methodology.
The advantages of our remote sensing technique include wide coverage, enabling the analysis of large areas that may be difficult or inaccessible for field observers. Additionally, the reproducibility of measurements allows for changes to be monitored over time, which is extremely useful for analyzing dynamic processes such as ice phenomena. Modern technologies also provide a high spatial resolution, enabling the capture of very detailed images. Moreover, remote sensing enhances safety and time efficiency by allowing for the remote analysis of areas, eliminating the need to send individuals to the field or perform risky operations. The collection of multispectral data is facilitated, enabling the analysis of different aspects of the study area, including features related to frazil ice floe. Furthermore, remote data can be easily integrated with other spatial data through Geographic Information Systems (GIS), enabling a more comprehensive analysis and interpretation. Remote sensing proves particularly effective in studying large-scale ice phenomena, allowing for the analysis of regional or even global patterns and trends. The availability of UAV technology further enhances the technique’s flexibility and allows for high-resolution measurements in areas that may be challenging for traditional methods. Finally, remote sensing ensures environmental safety by enabling the monitoring and analysis of ice phenomena in a way that minimizes impact on the environment and natural ecosystems. The significance of field measurements for method validation is acknowledged. However, given the expanse of our study area and the complexities posed by the proximity to the dam, conducting extensive field studies comparable to the scope of our remote sensing approach was not feasible. Safety concerns and logistical challenges were particularly pronounced in this large river environment.
The intricate hydrodynamics and potential hazards in our study area, situated on a major river near a dam, presented substantial obstacles to manual floe measurements. As a result, direct field measurements were precluded. Consequently, the utilization of remote sensing technology emerged as the most viable approach.
5. Conclusions
Our method, as described in this paper, for calculating frazil ice floe from digital images is not only user-friendly, but also efficient, fast and consistent. Both beginners and expert ImageJ users are able to process and analyze images without difficulty.
Obtaining data is essential for developing an effective ice jam reporting program. With access to relevant information such as river flow rates, and ice thickness, it becomes straightforward to create a comprehensive system for monitoring and reporting ice jams. This data-driven approach enables accurate predictions and timely responses to mitigate the risks associated with ice blockages in waterways. There are active plans to broaden and fine-tune this methodology into a comprehensive monitoring system. Collaborative efforts with river management authorities are underway to implement a prototype at select sites.
The research team from the Wrocław University of Environmental and Life Science and the Silesian University of Technology initiated a study in 2021 utilizing UAVs and image analysis software to identify morphometry that can be utilized to predict ice-related hazards. We focused investigations primarily in our home region (Wrocław), enabling a swift response and the collection of reliable data, as ice phenomena in the middle Europe climatic zone, particularly in the context of ongoing climate change, occur infrequently and dissipate rapidly. The employed technique proved effective, motivating the research team to attempt a more detailed characterization of the ice properties at an individual fragment level. While manual description of frazil caps based on aerial photographs is feasible, the authors of the publication focused on automating this process to facilitate the commercial application of image analysis for winter river risk management. The utilization of statistical parameters during the analysis of research results demonstrated that the method is of high quality and exhibits high repeatability and result stability across successive frames of the examined sample. According to the authors’ assessment, the research findings indicate the potential implementation of the developed methodology as an automated monitoring system for ice phenomena on lowland rivers. This is particularly crucial considering the hazards associated with the formation of frazil ice in rivers, which can have significant consequences. Hazards described in the introduction emphasize the need for the monitoring and management of frazil ice on rivers, particularly in areas where the risk of blockages is high. The regular monitoring of ice conditions, implementation of appropriate warning systems, and proactive measures can help mitigate the risks associated with frazil ice and ensure the safety of both human activities and the natural environment. By employing a drone under suitable atmospheric and lighting conditions, coupled with the utilization of open-source software analysis, it becomes possible to accurately determine the morphological parameters of frazil ice floes, particularly in the context of their breakup into distinct clusters.
We opted for the use of drones for several compelling reasons. Firstly, drones allow for us to obtain high-quality photographic data in a highly interpretable format, particularly when captured orthogonally. Drones provide us with the flexibility to conduct observations in any selected hydrotechnic structure without the need for prior infrastructure setup for stationary observation systems. This not only saves time but also offers a broader scope of potential observation sites. Furthermore, employing UAVs significantly enhances safety for researchers. It eliminates the necessity for researchers to physically interact with potentially hazardous environments, such as wide rivers, weirs, and areas with significant turbulence, where conducting similar studies would be perilous and logistically challenging.
The need for further research and refinement is imperative to optimize the methodology for varying environmental conditions and scenarios. In the future, more extensive studies will be conducted, incorporating diverse heights and conditions in order to validate and enhance the accuracy of the approach. This study lays the groundwork for future investigations in this domain, with a commitment to remedying this limitation in ongoing research. In the publication, we present only a portion of the analyzed parameters of ice phenomena collected using UAVs and remote sensing. In our opinion, it is too early to assess the impact of the research on waterway management. Our efforts aim to predict the emergence, development, decay, and negative effects of ice phenomena.


