
Diagnostic Assessment in the Wet and Dry Seasons of Simple Weirs Constructed by Small-Scale Farmers in the Northern Region Provinces of Zambia

Abstract
:1. Introduction
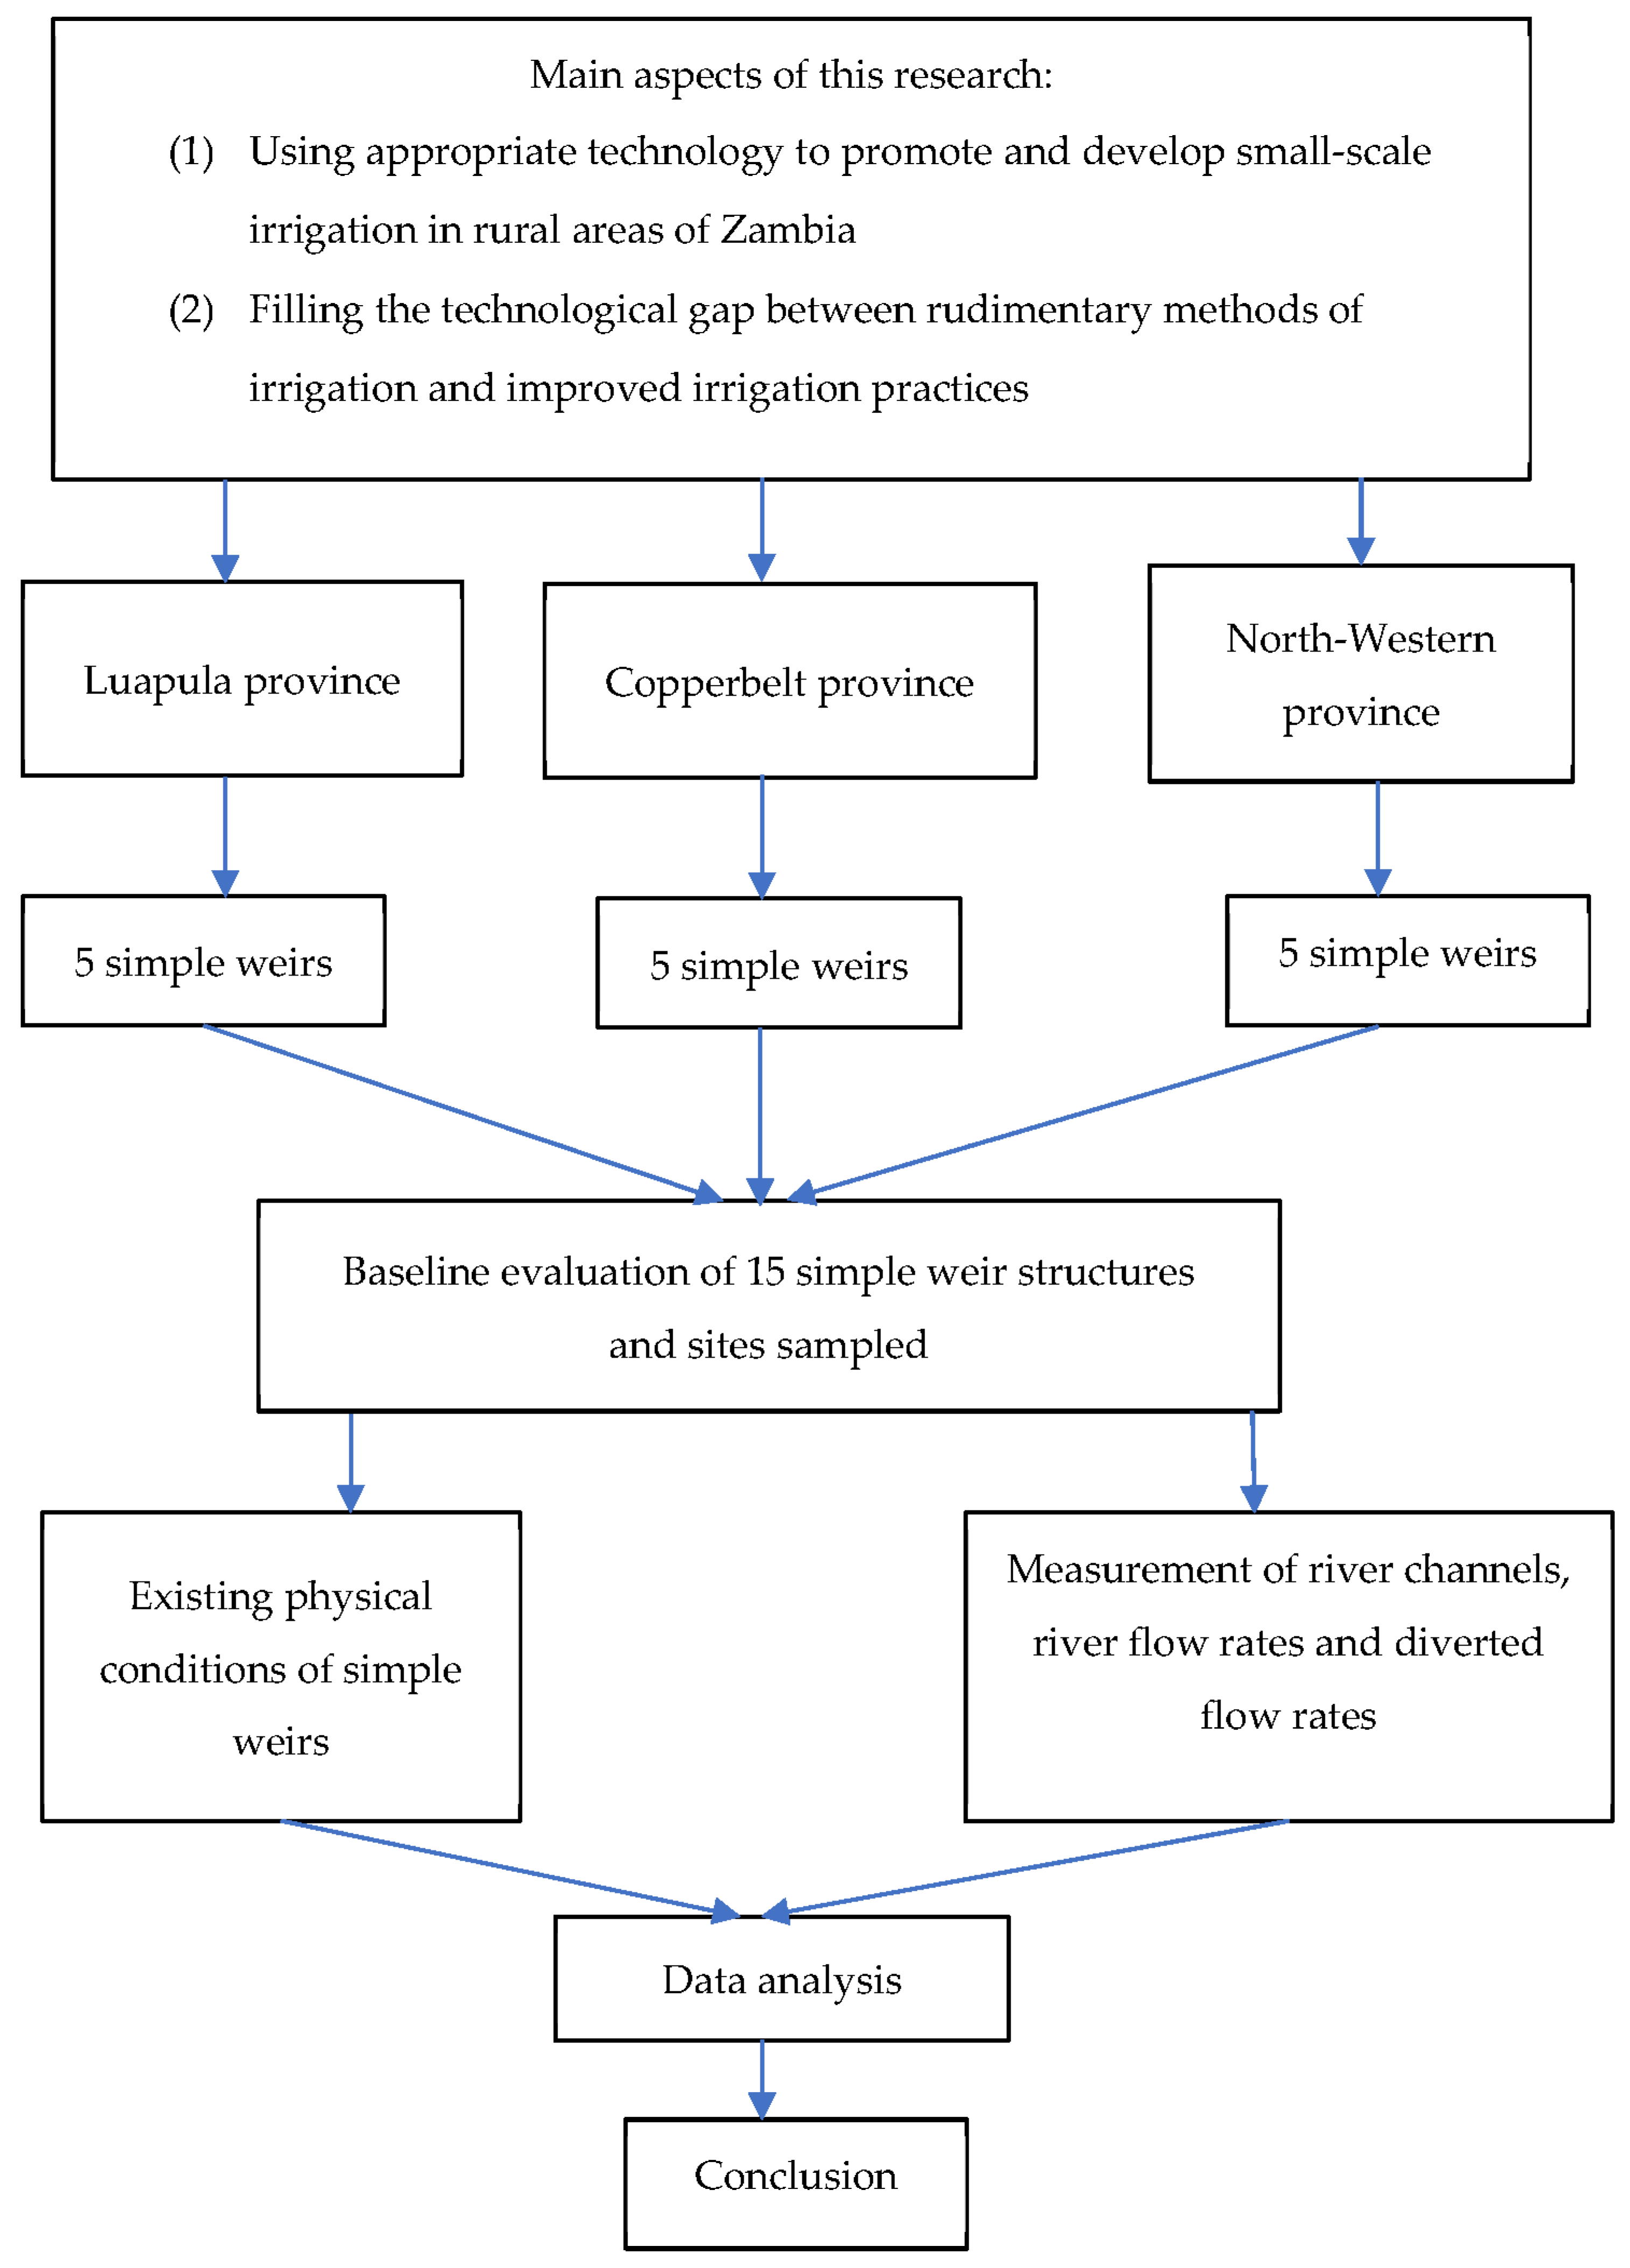
2. Methodology
2.1. Study Areas
2.2. Rainfall
2.3. Research Framework
2.4. River Profile Data
2.5. Discharge Measuring Procedure Using the Floating Method
2.5.1. Calculation of the Cross-Sectional Area of the River
2.5.2. Measuring River Velocity Using the Floating Method
2.6. Questionaire Format for Raw Data Collection
3. Results
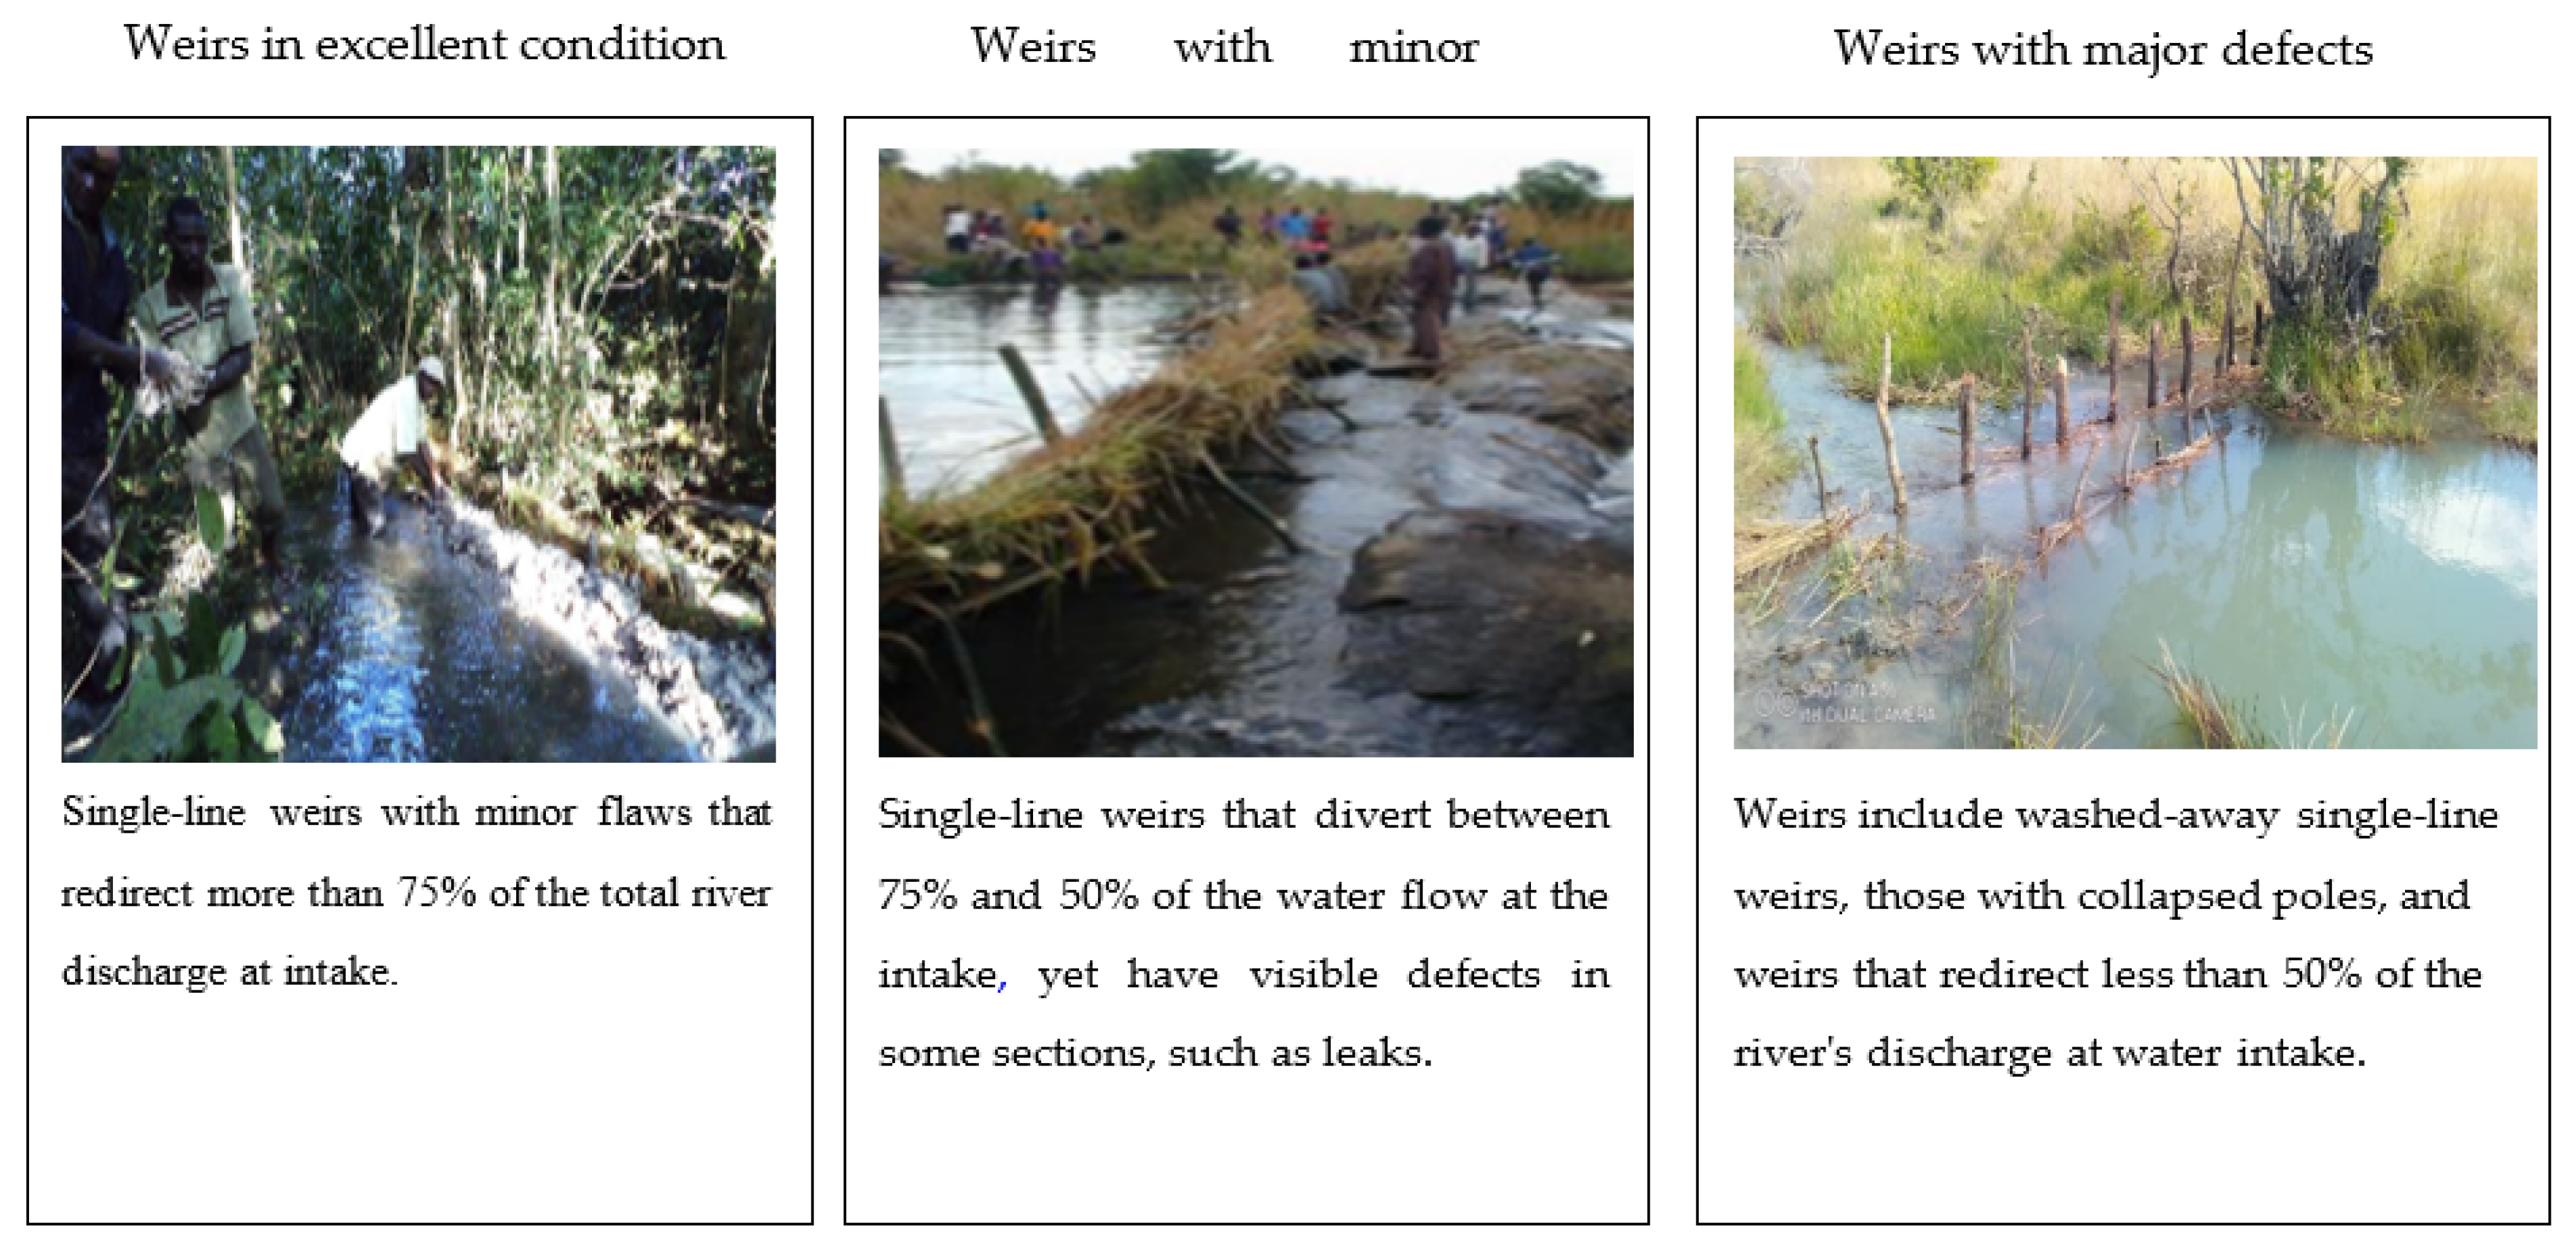
3.1. Types of Simple Weirs Constructed by Farmers
3.2. Prevailing Physical Condition Based on Rating Criteria
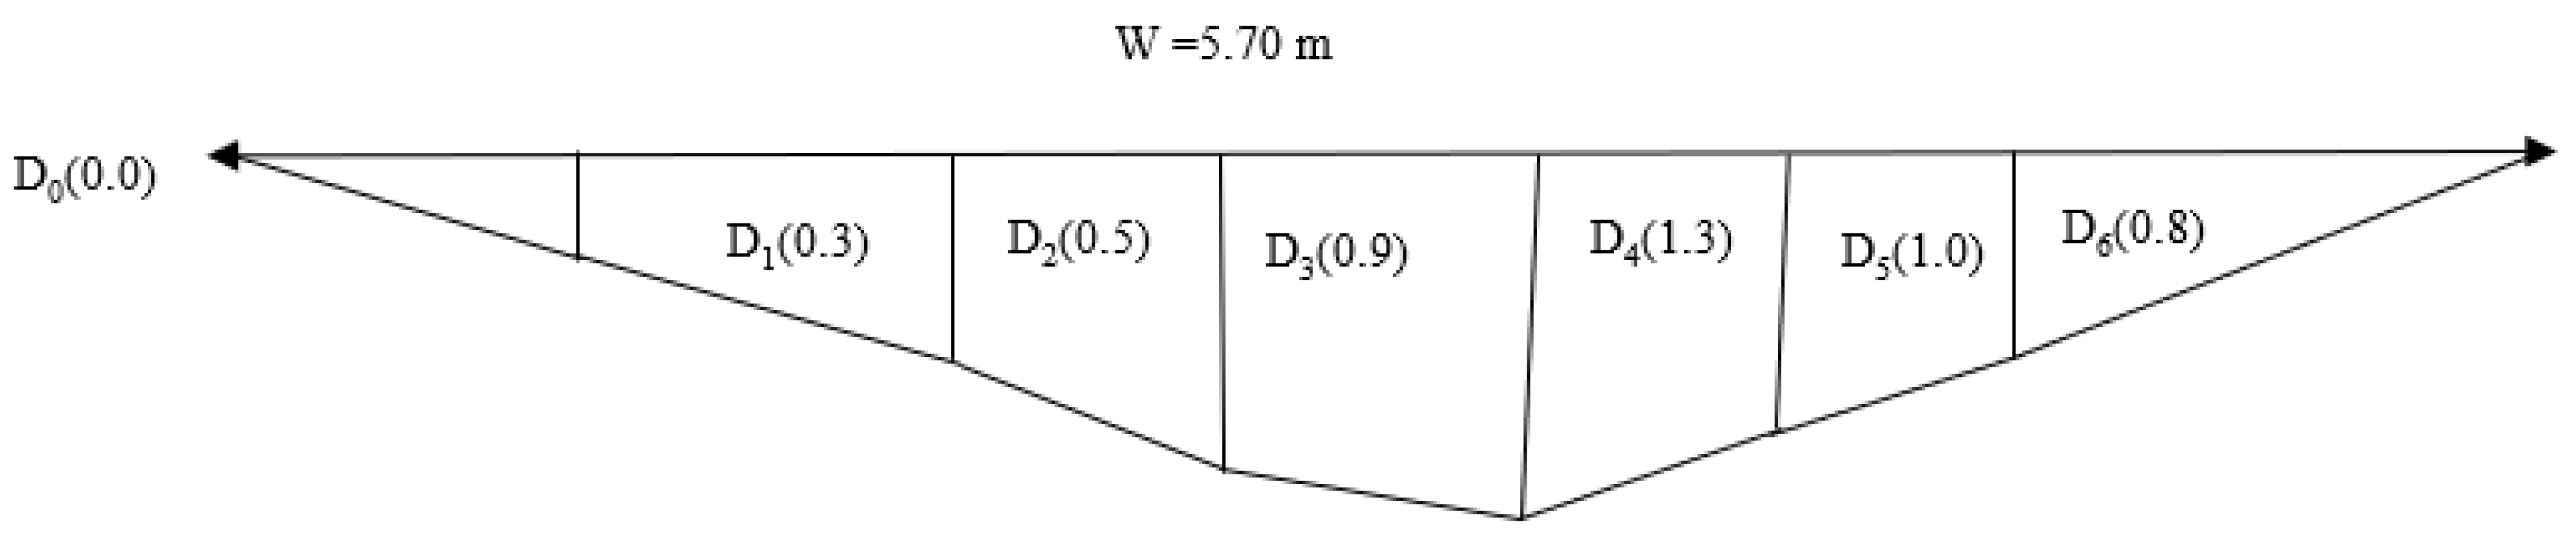
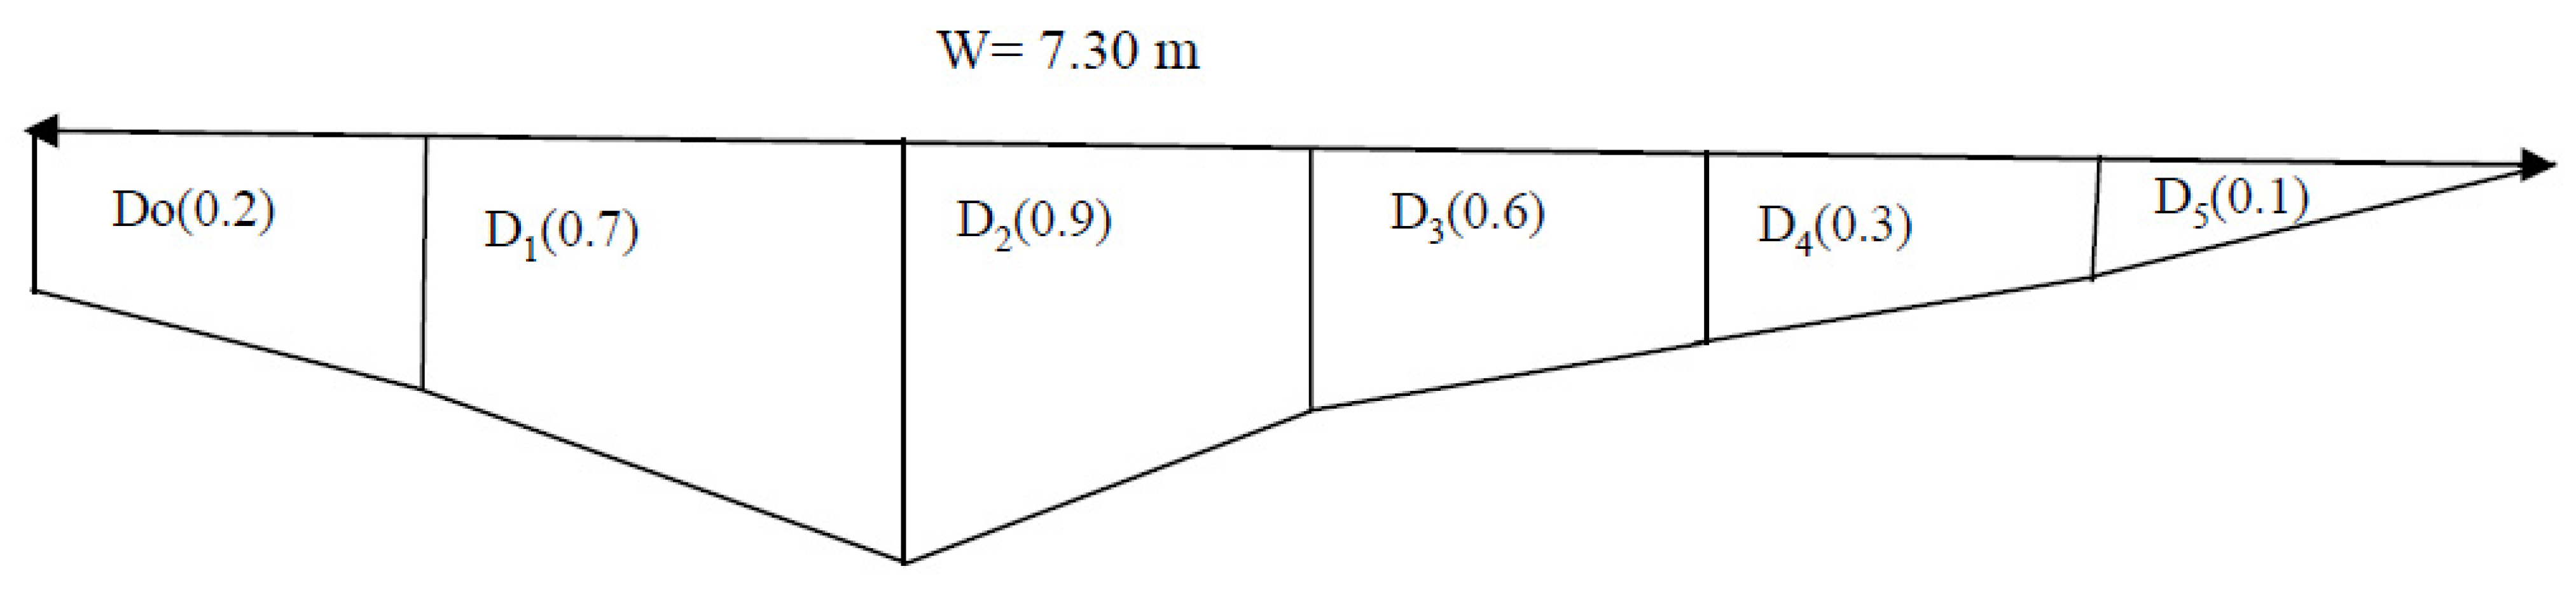
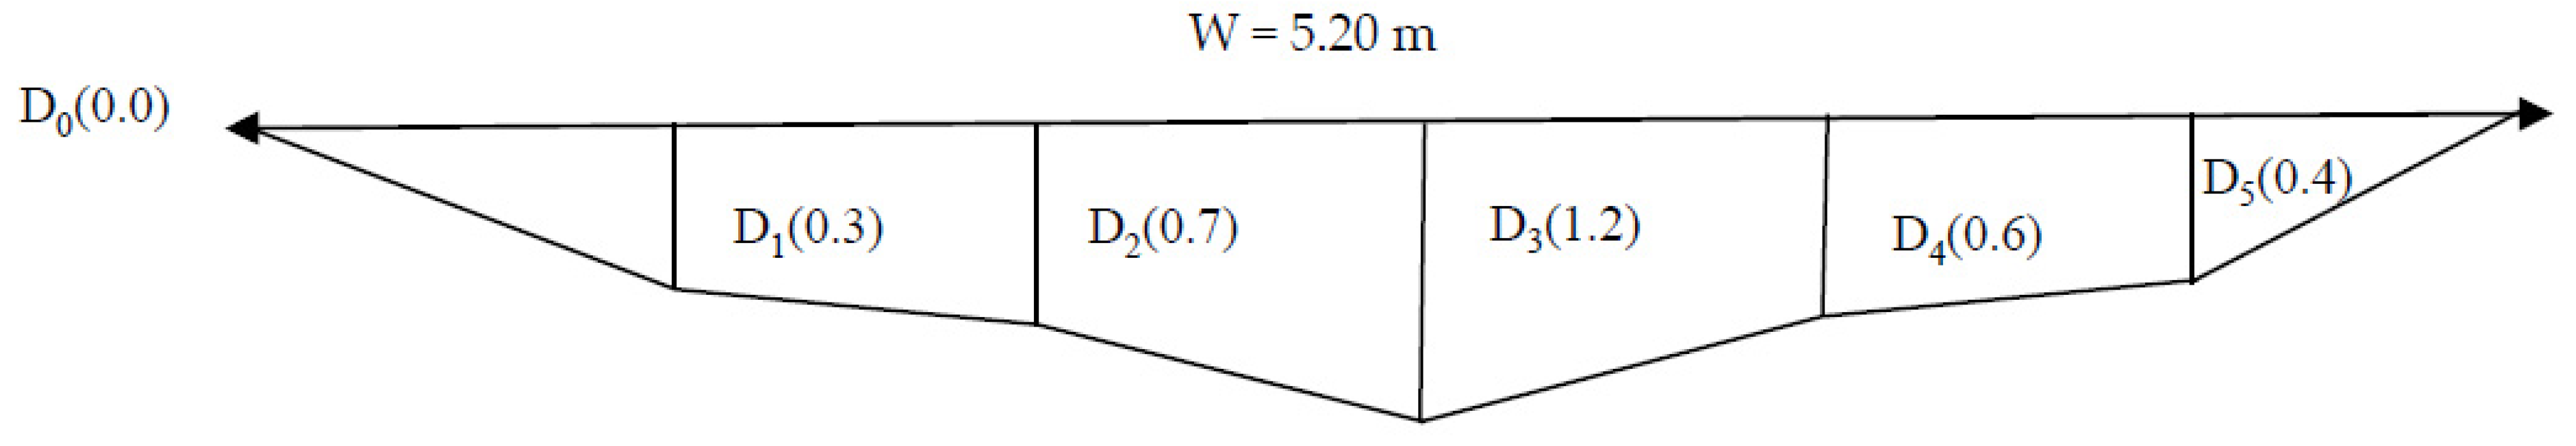
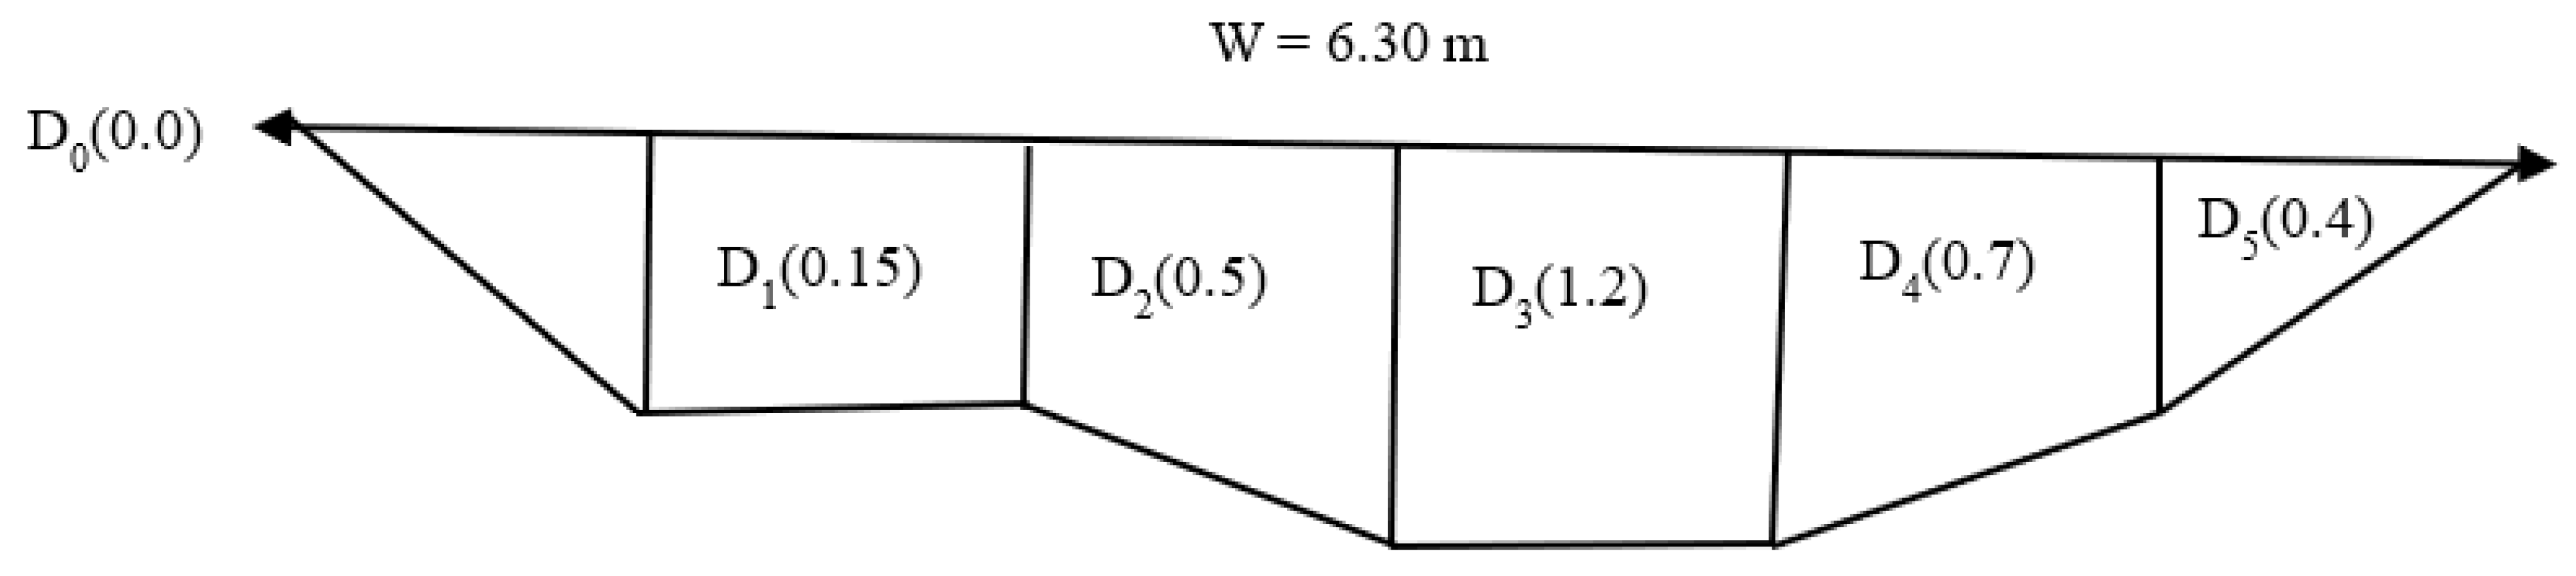
3.3. The Inherent Characteristics of River Geometric Structures in Luapula, Copperbelt, and North-Western Provinces
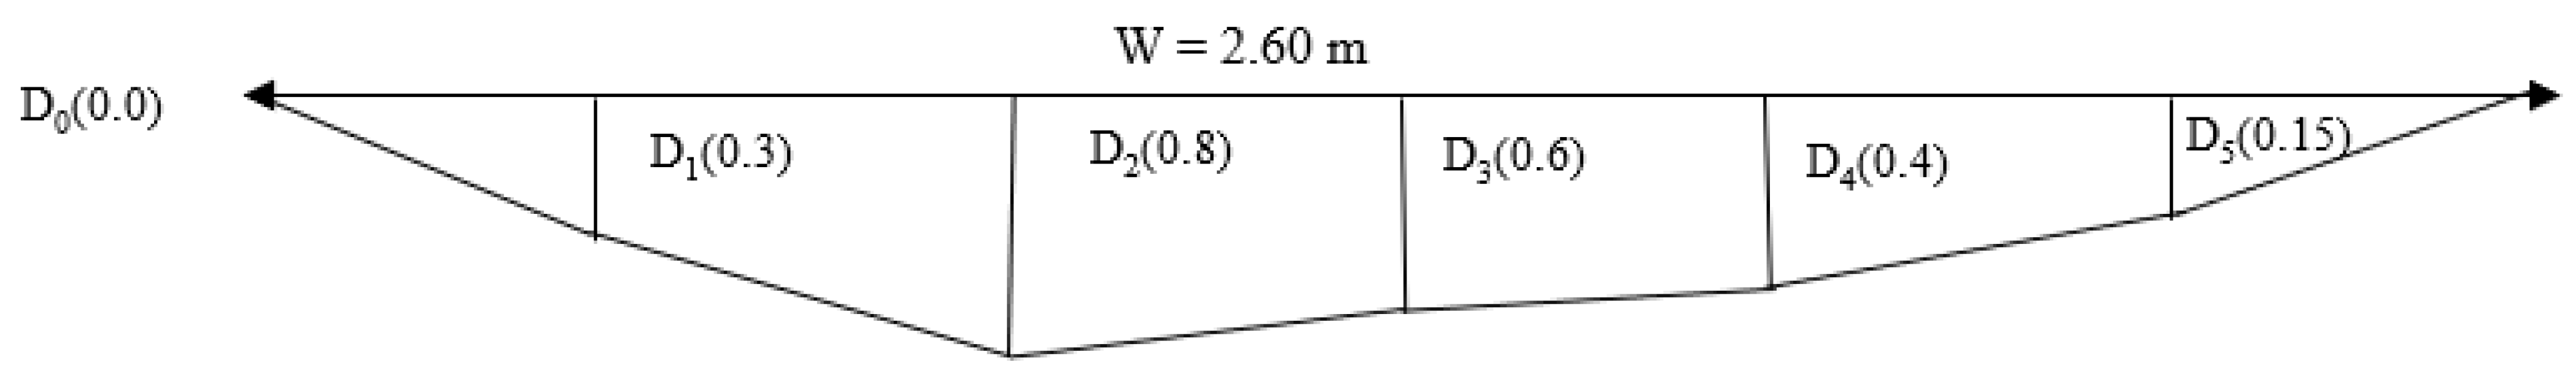
3.3.1. Geometric Profiles for rivers in Luapula Province
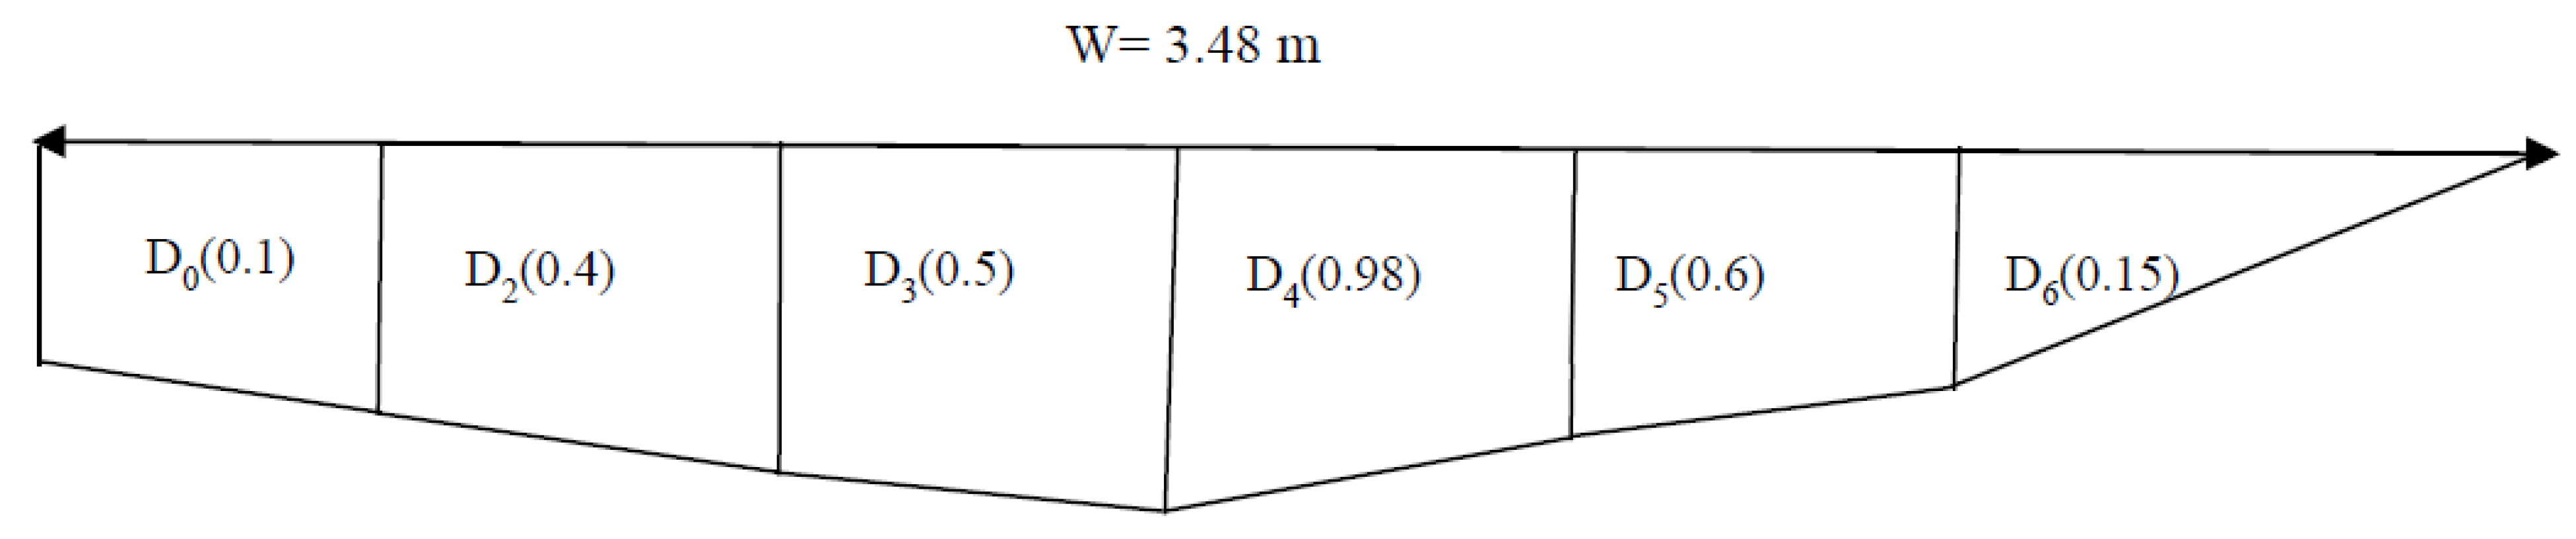
3.3.2. Geometric profiles for rivers in Copperbelt province
3.3.3. Geometric Profiles for Rivers in North-Western Province
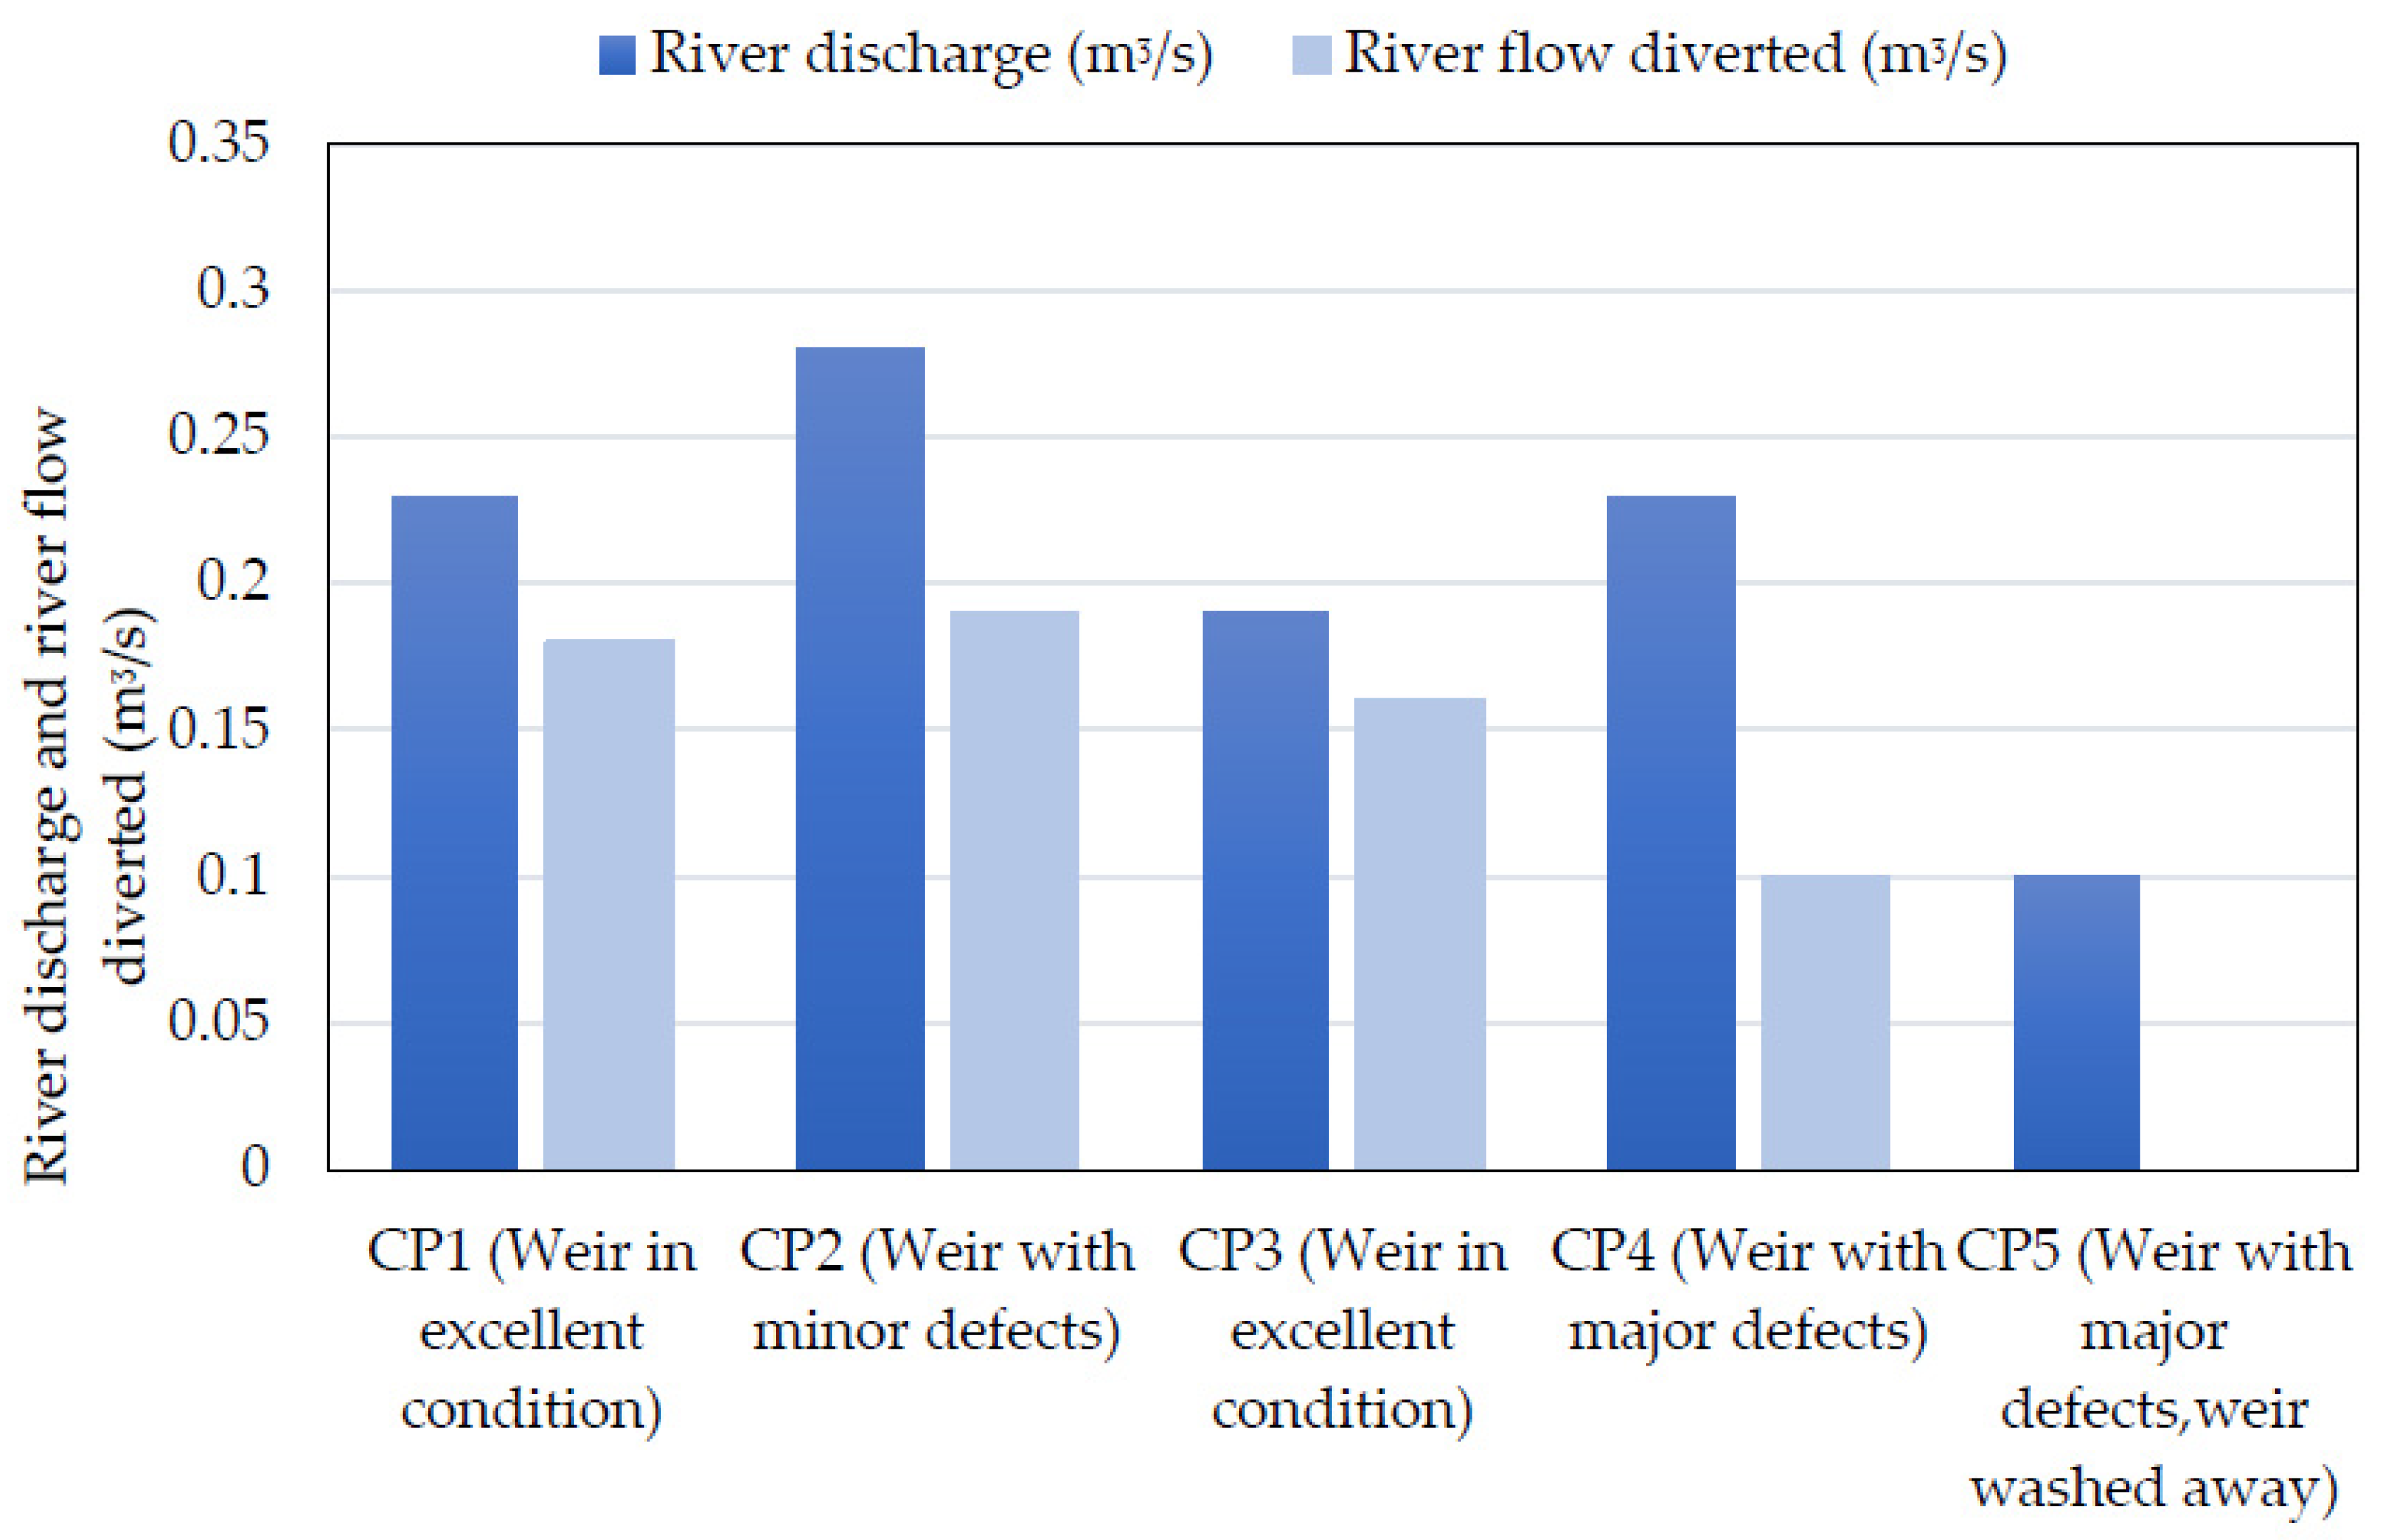
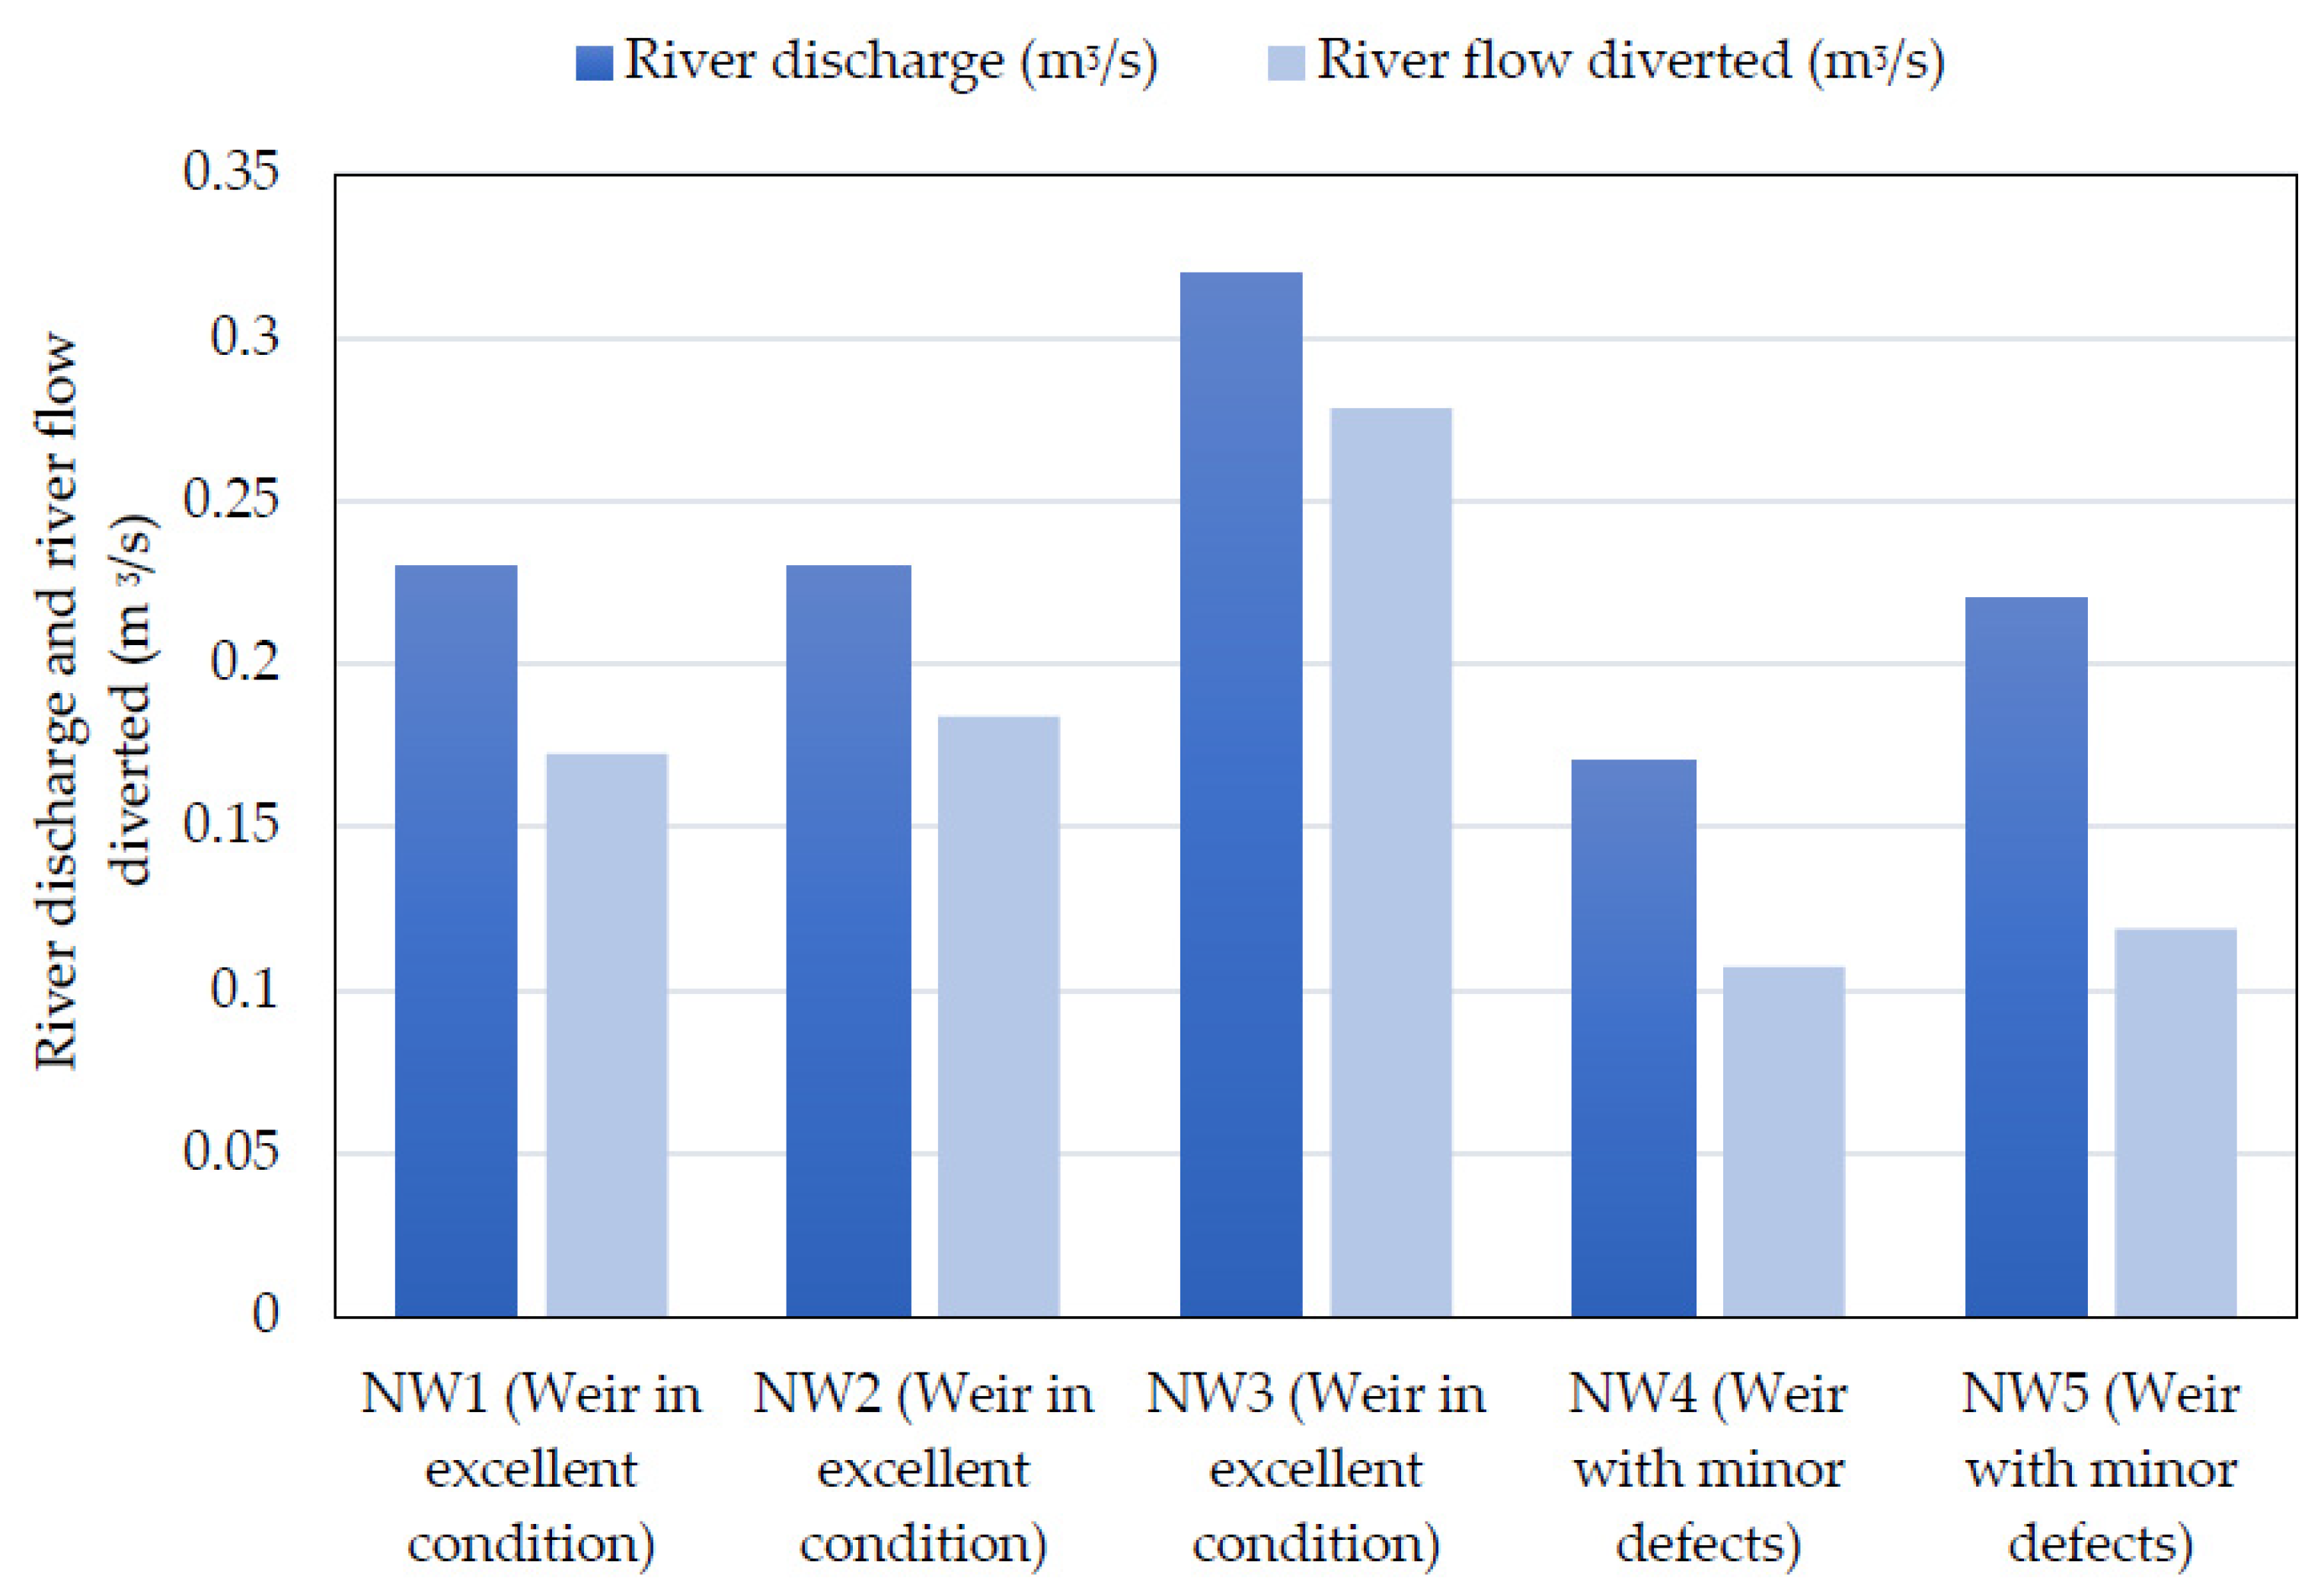
3.4. River Inflow and Amount of Water Diversion
4. Discussion
5. Conclusions
Author Contributions
Funding
Data Availability Statement
Acknowledgments
Conflicts of Interest
References
- Burney, J.A.; Naylor, R.L. Smallholder Irrigation as a Poverty Alleviation Tool in Sub-Saharan Africa. World Dev. 2012, 40, 110–123. [Google Scholar] [CrossRef]
- Mulenga, B.; Takao, N.; Haruhiko, H.; Yoshihiko, O. Participatory Irrigation Management Model and Proposal for Adoption in Zambia. Rural. Environ. Eng. 2003, 2003, 68–79. [Google Scholar]
- You, L.; Ringler, C.; Wood-Sichra, U.; Robertson, R.; Wood, S.; Zhu, T.; Nelson, G.; Guo, Z.; Sun, Y. What Is the Irrigation Potential for Africa? A Combined Biophysical and Socioeconomic Approach. Food Policy 2011, 36, 770–782. [Google Scholar] [CrossRef]
- Ngango, J.; Hong, S. Adoption of Small-Scale Irrigation Technologies and Its Impact on Land Productivity: Evidence from Rwanda. J. Integr. Agric. 2021, 20, 2302–2312. [Google Scholar] [CrossRef]
- Kamwamba-Mtethiwa, J.; Weatherhead, K.; Knox, J. Assessing Performance of Small-Scale Pumped Irrigation Systems in sub-Saharan Africa: Evidence from a Systematic Review. Irrig. Drain. 2016, 65, 308–318. [Google Scholar] [CrossRef]
- Fanadzo, M.; Ncube, B. Review: Challenges and Opportunities for Revitalising Smallholder Irrigation Schemes in South Africa. WSA 2018, 44, 436–447. [Google Scholar] [CrossRef]
- Djagba, J.F.; Rodenburg, J.; Zwart, S.J.; Houndagba, C.J.; Kiepe, P. Failure and Success Factors of Irrigation System Developments: A Case Study from the Ouémé and Zou Valleys in Benin: Comparing Irrigation System Developments in Benin. Irrig. Drain. 2014, 63, 328–339. [Google Scholar] [CrossRef]
- Chazovachii, B. The Impact of Small-Scale Irrigation Schemes on Rural Livelihoods: The Case of Paganai Irrigation Schemes Bikita District Zambambwe. J. Sustain. Dev. Afr. 2012, 14, 217–231. [Google Scholar]
- Sinyolo, S.; Mudhara, M.; Wale, E. The Impact of Smallholder Irrigation on Household Welfare: The Case of Tugela Ferry Irrigation Scheme in KwaZulu-Natal, South Africa. WSA 2014, 40, 145. [Google Scholar] [CrossRef]
- Mhembwe, S.; Chiunya, N.; Dube, E. The Contribution of Small-Scale Rural Irrigation Schemes towards Food Security of Smallholder Farmers in Zimbabwe. Jàmbá 2019, 11, 1–11. [Google Scholar] [CrossRef]
- Xie, H.; You, L.; Wielgosz, B.; Ringler, C. Estimating the Potential for Expanding Smallholder Irrigation in Sub-Saharan Africa. Agric. Water Manag. 2014, 131, 183–193. [Google Scholar] [CrossRef]
- Giordano, M.; De Fraiture, C.; Weight, E.; Van Der Bliek, J. Water for Wealth, and Food Security: Supporting Farmer-Driven Investments in Agricultural Water Management. Synthesis Report of the AgWater Solutions Project; International Water Management Institute: Colombo, Sri Lanka, 2012. [Google Scholar] [CrossRef]
- FAO. Irrigation Techniques for Small-Scale Farmers: Key Practices for Drr Implementers; FAO: Rome, Italy, 2014; pp. 1–52. [Google Scholar]
- Colenbrander, W.; Kabwe, A.; van Koppen, B. Agricultural Water Management Technology Adoption in Zambia: An Inventory Report AgWater Solutions Project Case Study; International Water Management Institute: Lusaka, Zambia, 2012. [Google Scholar]
- De Fraiture, C.; Giordano, M. Small Private Irrigation: A Thriving but Overlooked Sector. Agric. Water Manag. 2014, 131, 167–174. [Google Scholar] [CrossRef]
- Nilsson, E. Socio-Economical Feasibility Study for a Proposed Weir on the Magoye River, Zambia; Lund University: Lund, Sweden, 2012. [Google Scholar]
- Atlas, W.I.; Housty, W.G.; Béliveau, A.; DeRoy, B.; Callegari, G.; Reid, M.; Moore, J.W. Ancient Fish Weir Technology for Modern Stewardship: Lessons from Community-Based Salmon Monitoring. Ecosyst. Health Sustain. 2017, 3, 1341284. [Google Scholar] [CrossRef]
- Musuka, C.G.; Musonda, F.F. Contribution of Small Water Bodies and Small-Holder Aquaculture towards Poverty Alleviation and Enhancing Household Food Security in Zambia. Int. J. Fish. Aquac. 2013, 5, 295–302. [Google Scholar]
- Singh, A.M. Modernization Farmers’ Managed Irrigation Systems in Nepal. Hydro Nepal 2010, 6, 55–60. [Google Scholar] [CrossRef]
- Richter, B.D.; Brown, J.D.; DiBenedetto, R.; Gorsky, A.; Keenan, E.; Madray, C.; Morris, M.; Rowell, D.; Ryu, S. Opportunities for Saving and Reallocating Agricultural Water to Alleviate Water Scarcity. Water Policy 2017, 19, 886–907. [Google Scholar] [CrossRef]
- Rickard, C.; Day, R.; Purseglove, J. River Weirs-Good Practice Guide; Environmental Agency, Rio House, Water Drive, Aztec West: Bristol, UK, 2023. [Google Scholar]
- Ngoma, H.; Hamududu, B.H. Impacts of Climate Change on Water Availability in Zambia: Implications for Irrigation Development; Michigan State University: East Lansing, MI, USA, 2019. [Google Scholar]
- Jensen, M.E. Beyond Irrigation Efficiency. Irrig Sci. 2007, 25, 233–245. [Google Scholar] [CrossRef]
- Hamududu, B.H.; Ngoma, H. Impacts of Climate Change on Water Resources Availability in Zambia: Implications for Irrigation Development. Environ. Dev. Sustain. 2020, 22, 2817–2838. [Google Scholar] [CrossRef]
- FAO. Aquastat Country Profile-Zambia; Food and Agriculture Organization of the United Nations (FAO): Rome, Italy, 2005. [Google Scholar]
- Akayombokwa, I.M.; van Koppen, B.; Matete, M. Trends and Outlook: Agricultural Water Management in Southern Africa; International Water Management Institute: Colombo, Sri Lanka, 2015. [Google Scholar]
- Acharya, A.S.; Prakash, A.; Saxena, P.; Nigam, A. Sampling: Why and How of It? Indian J. Med. Spec. 2013, 4, 330–333. [Google Scholar] [CrossRef]
- Taherdoost, H. Sampling Methods in Research Methodology; How to Choose a Sampling Technique for Research. International Journal of Academic Research in Management 2016, 5, 18–27. [Google Scholar] [CrossRef]
- Bagheri, S.; Kabiri-Samani, A. Simulation of Free Surface Flow over the Streamlined Weirs. Flow Meas. Instrum. 2020, 71, 101680. [Google Scholar] [CrossRef]
- Shariq, A.; Hussain, A.; Ansari, M.A. Lateral Flow through the Sharp Crested Side Rectangular Weirs in Open Channels. Flow Meas. Instrum. 2018, 59, 8–17. [Google Scholar] [CrossRef]
- Ministry of Agriculture and Livestock. Technical Cooperation Project on Community Bases Small-Holder Irrigation in The Republic of Zambia; Ministry of Agriculture and Livestock: Lusaka, Zambia, 2017.
- FAO. Small Dams and Weirs in Earth and Gabion Materials; Food and Agriculture Organization of the United Nations (FAO): Rome, Italy, 2001. [Google Scholar]
- Ertiro, F.; Pingale, S.M.; Wagesho, N. Evaluation of Failures and Design Practices of River Diversion Structures for Irrigation: A Revisit of Two SSI Schemes in Ethiopia. Int. J. Earth Sci. Eng. 2017, 10, 495–505. [Google Scholar]
- Sethaputra, S.; Kuntiyawichai, K.; Plermkamon, V.; Sawaengphet, J. Sizing of a Small Irrigation Weir. Eng. Appl. Sci. Res. 2017, 44, 3. [Google Scholar] [CrossRef]
- Masseroni, D.; Castagna, A.; Gandolfi, C. Evaluating the Performances of a Flexible Mechanism of Water Diversion: Application on a Northern Italy Gravity-Driven Irrigation Channel. Irrig Sci. 2021, 39, 363–373. [Google Scholar] [CrossRef]
- Government of the Republic of Zambia. Agricultural Water Management National Situation in Zambia. Analysis Report of the AgWater Solutions Project; Government of the Republic of Zambia: Lusaka, Zambia, 2009.


| Month | Reporting Date | |||||||
| Name of Province | Name of District | Name of Simple Weir site | ||||||
| Climatic Information | ||||||||
| Annual rainfall (mm) | ||||||||
| Main source of water | Perennial river | Seasonal stream | Spring | |||||
| Irrigation method | ||||||||
| Irrigable command area (ha) | ||||||||
| Main crops | ||||||||
| Type of simple weir | Single-line | Double-line | Trigonal | Inclined | ||||
| Width of simple weir (m) | ||||||||
| Riverbed foundation characteristics | Rocky foundation | Sandy | Gravel | |||||
| Highest river discharge (m3/s) | ||||||||
| Lowest river discharge (m3/s) | ||||||||
| Water intake slope (%) | ||||||||
| Average amount of water diverted for irrigation (from May to October) | ||||||||
| Source of construction material | ||||||||
| Type of construction materials | ||||||||
| Type of labour | ||||||||
| Province | Excellent Condition | Partially Damaged | Flushed-Off Weirs |
|---|---|---|---|
| Luapula | 4 | 1 | 0 |
| Copperbelt | 3 | 1 | 1 |
| North-Western | 3 | 2 | 0 |
| Profile Parameters | L1 | L2 | L3 | L4 | L5 |
|---|---|---|---|---|---|
| Observation time (s) | 55.70 | 56.00 | 66.00 | 58.30 | 62.30 |
| Length of river section (m) | 2.00 | 2.40 | 1.50 | 1.80 | 2.00 |
| Average river velocity (m/s) | 0.04 | 0.04 | 0.02 | 0.03 | 0.03 |
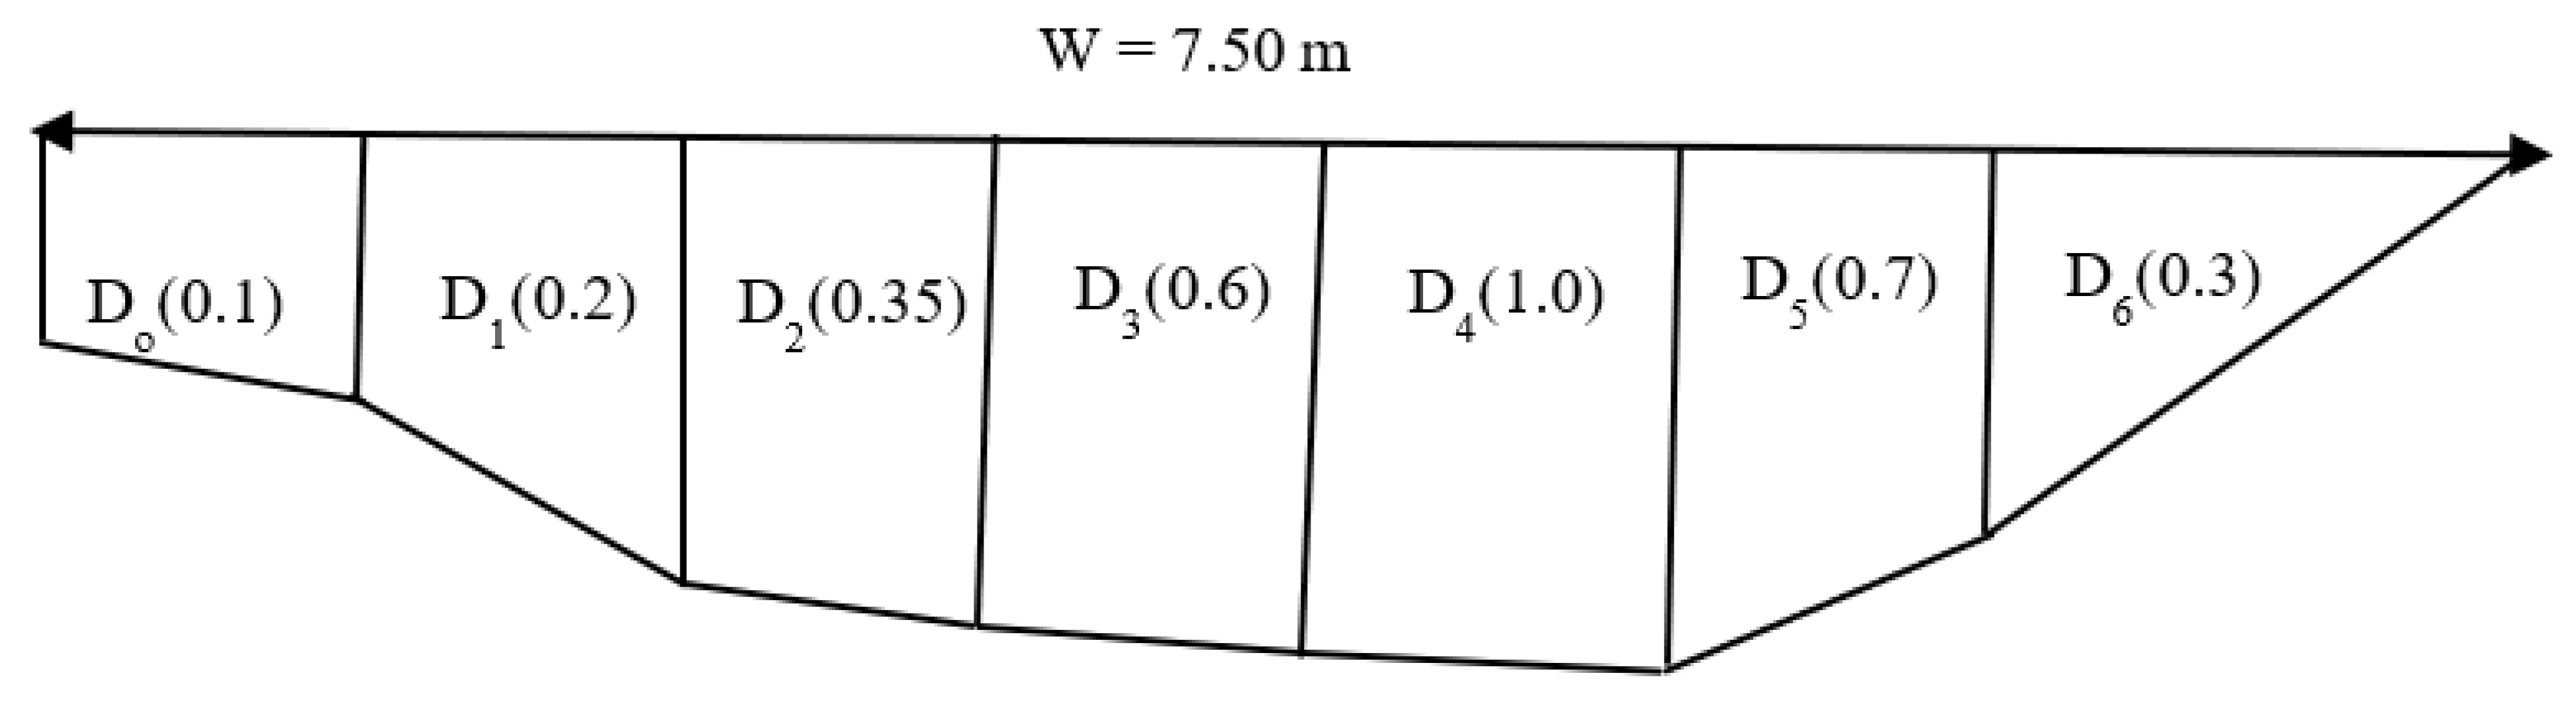
| River width (m) | 2.90 | 2.67 | 5.73 | 7.30 | 5.23 |
| River depth (m) | 0.98 | 1.50 | 1.50 | 1.20 | 1.40 |
| Cross-sectional area (m2) | 2.84 | 4.00 | 8.60 | 8.76 | 7.32 |
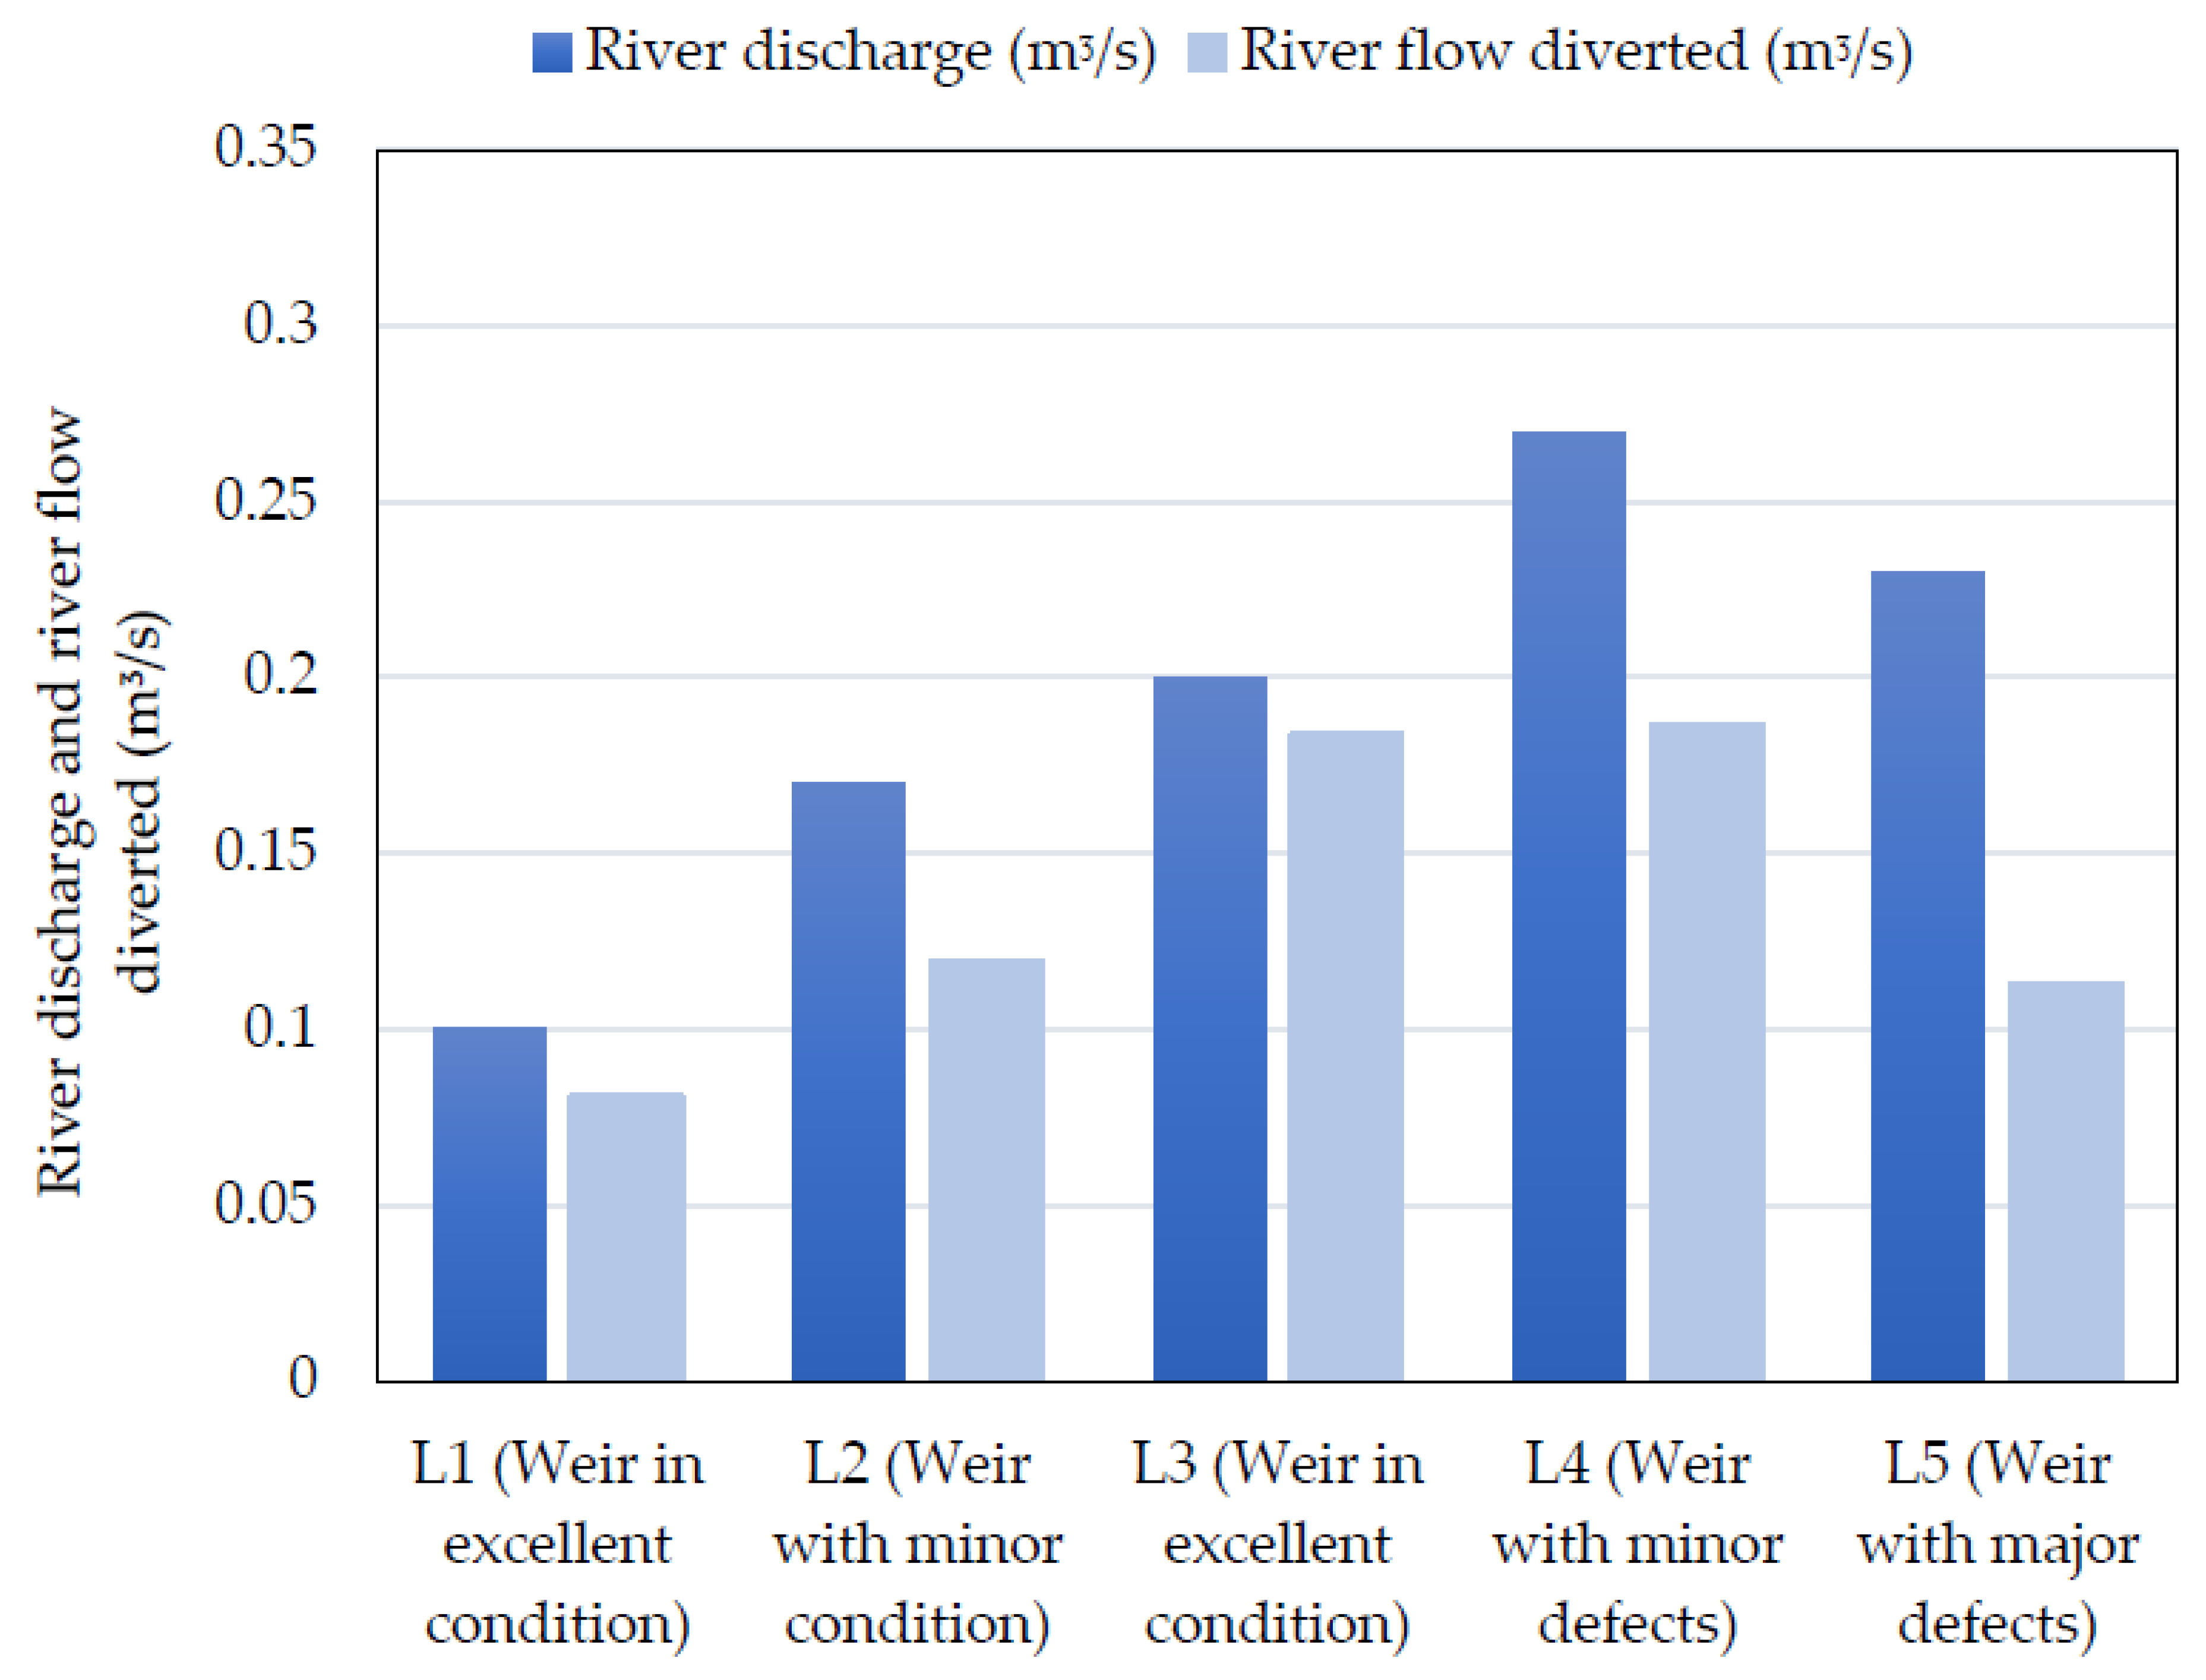
| River discharge (m3/s) | 0.10 | 0.17 | 0.20 | 0.27 | 0.23 |
| Single-line weir height (m) | 1.00 | 1.60 | 1.50 | 1.30 | 1.50 |
| Single-line weir length (m) | 3.00 | 2.50 | 6.00 | 7.20 | 5.00 |
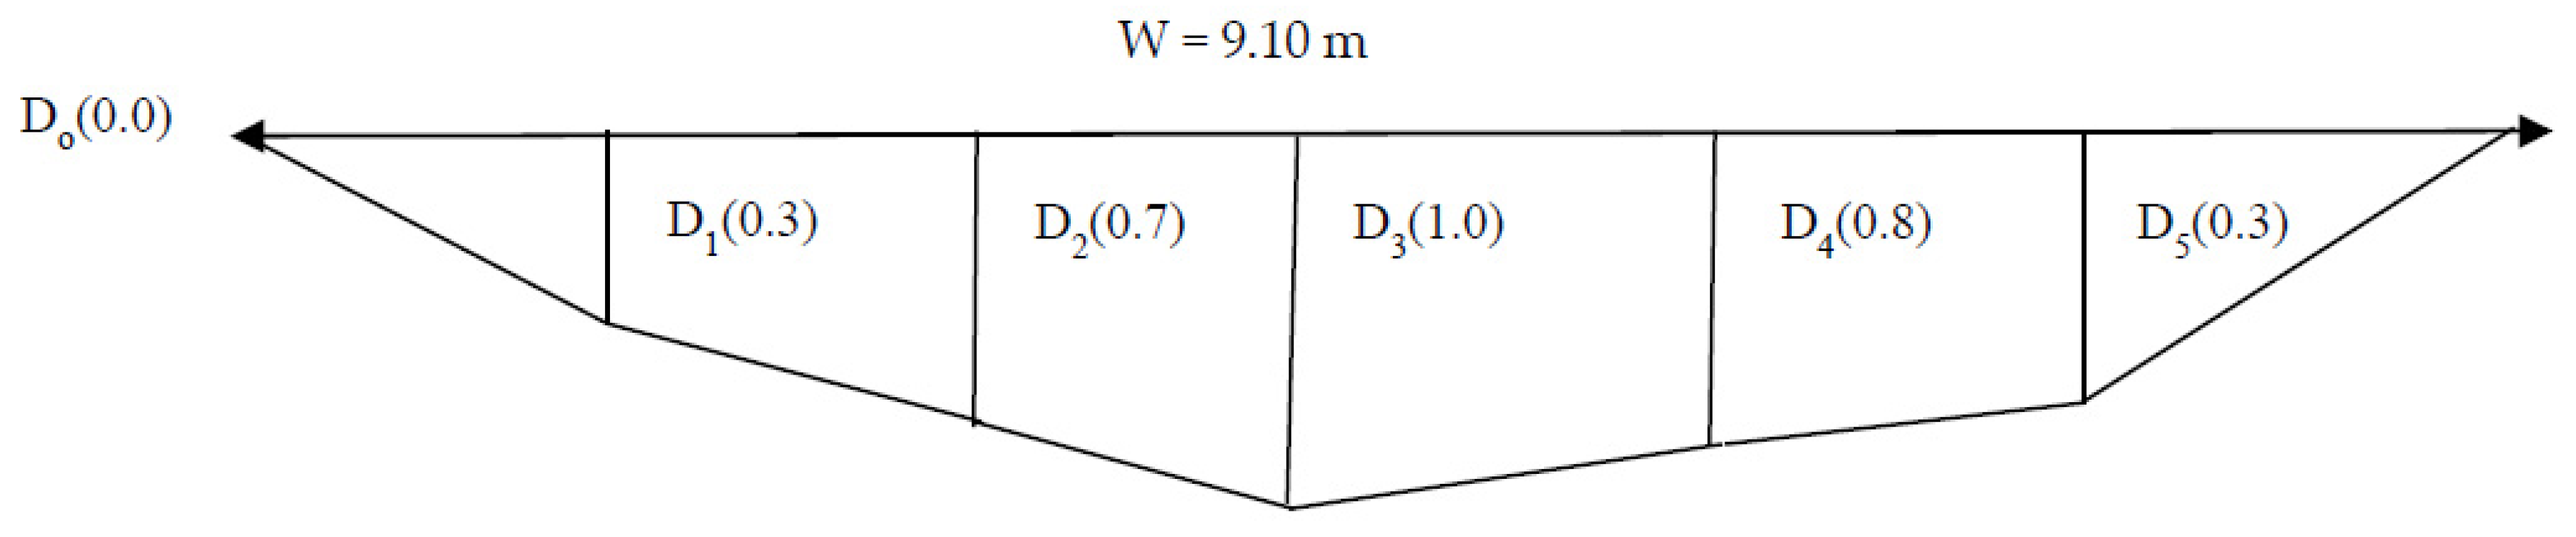
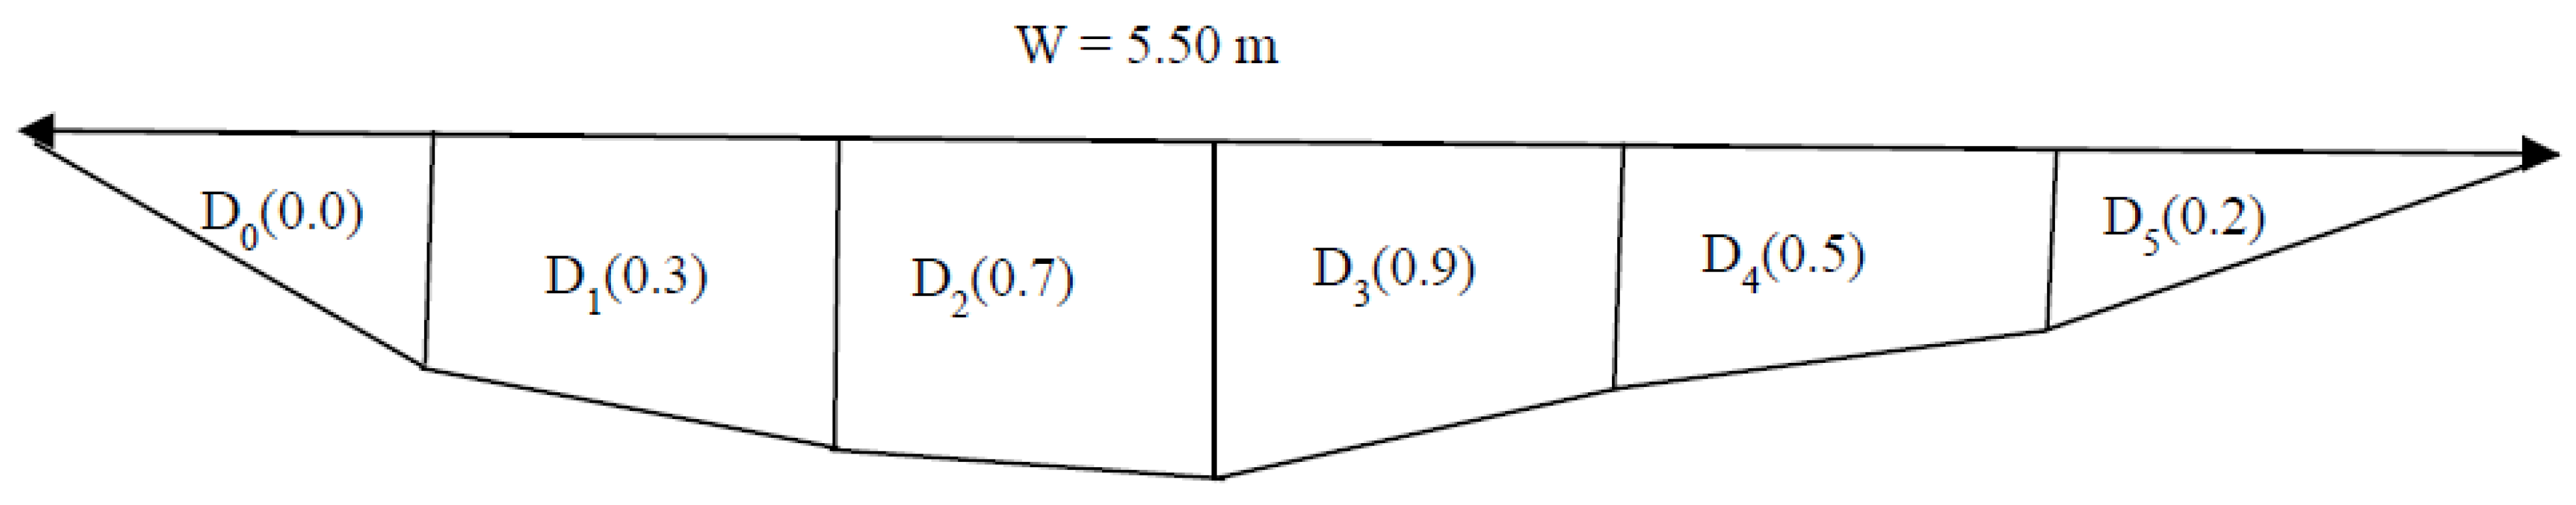
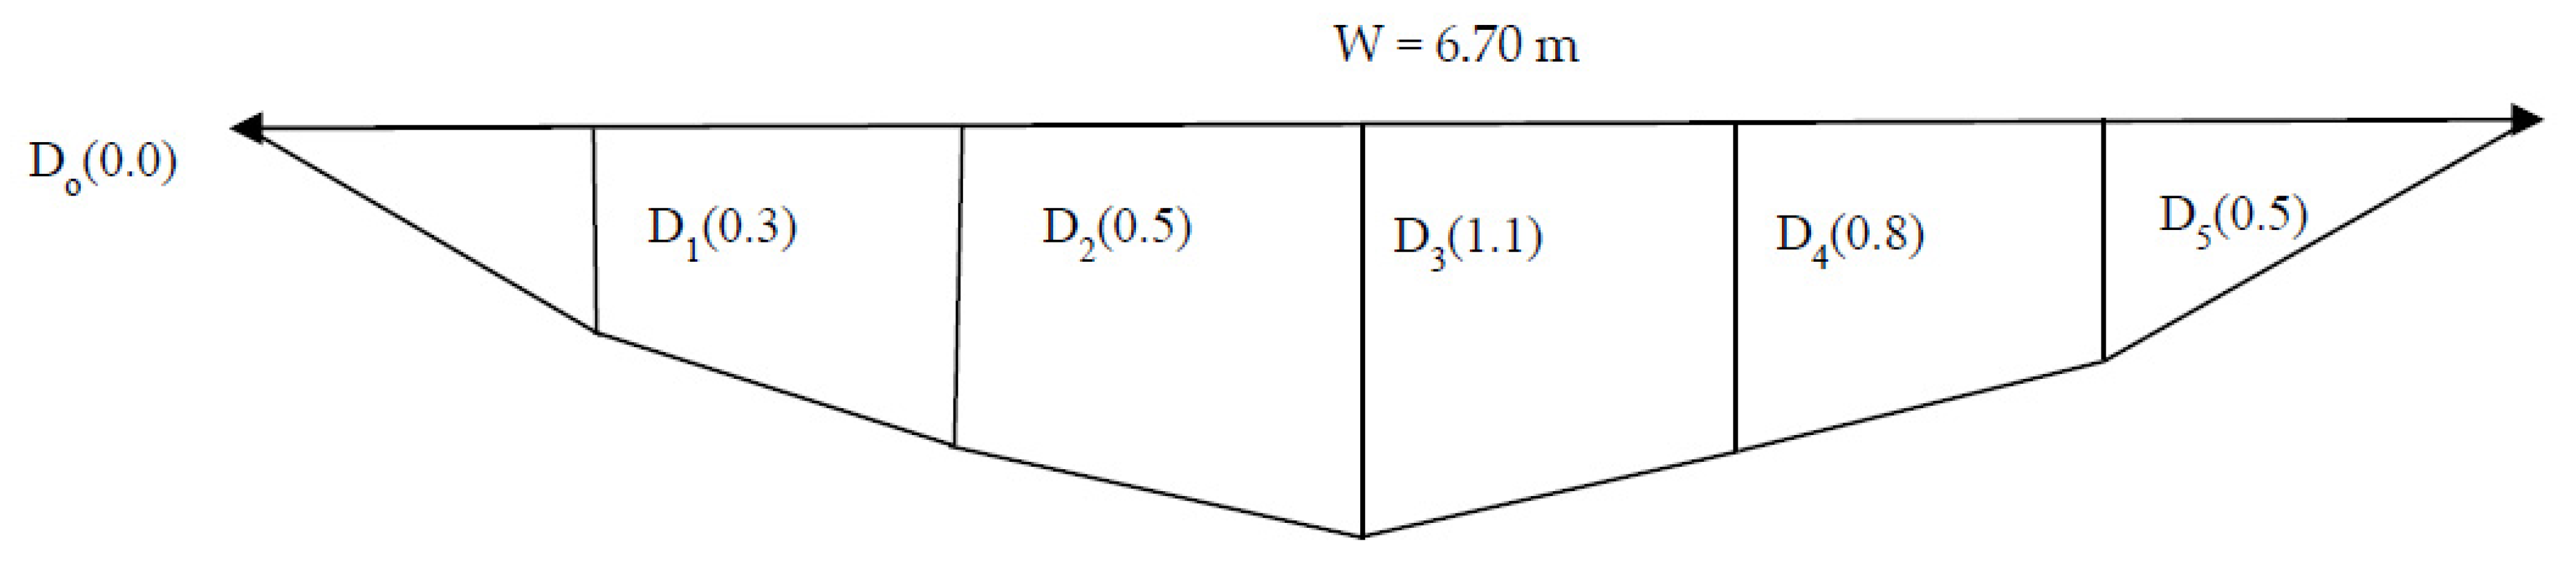
| Profile Parameters | C1 | C2 | C3 | C4 | C5 |
|---|---|---|---|---|---|
| Observation time (s) | 41.80 | 60.00 | 63.70 | 60.00 | 61.67 |
| Length of river section (m) | 1.20 | 1.40 | 1.50 | 1.60 | 1.40 |
| Average river velocity (m/s) | 0.03 | 0.02 | 0.02 | 0.03 | 0.02 |
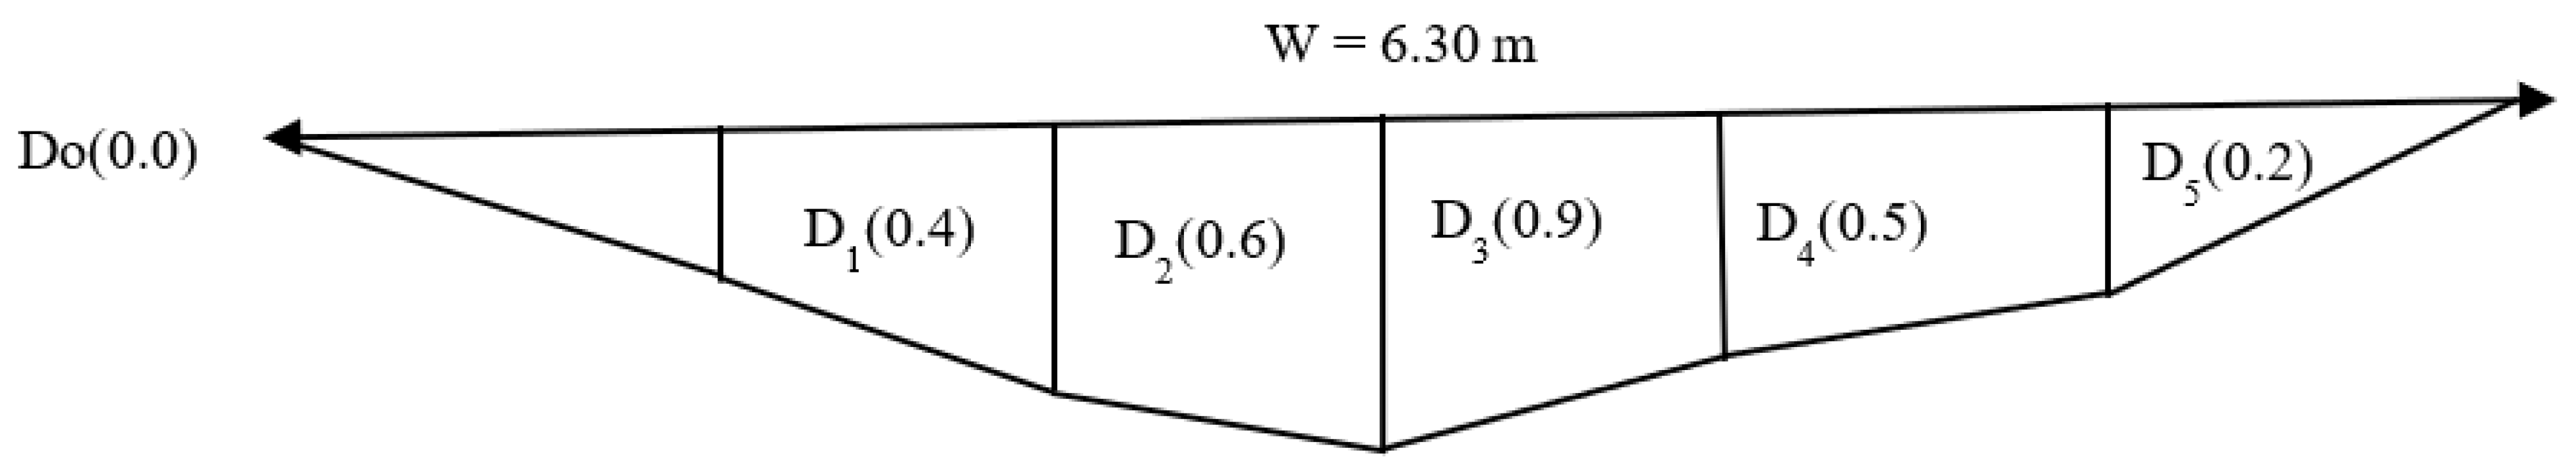
| River width (m) | 6.30 | 9.10 | 7.40 | 5.50 | 6.70 |
| River depth (m) | 1.30 | 1.30 | 1.10 | 1.56 | 1.10 |
| Cross-sectional area (m2) | 8.19 | 11.83 | 8.14 | 8.58 | 7.37 |
| River discharge (m3/s) | 0.23 | 0.28 | 0.19 | 0.23 | 0.17 |
| Single-line weir height (m) | 1.00 | 1.50 | 0.90 | 1.30 | 1.20 |
| Single-line weir length (m) | 6.50 | 10.00 | 7.50 | 6.00 | 7.00 |
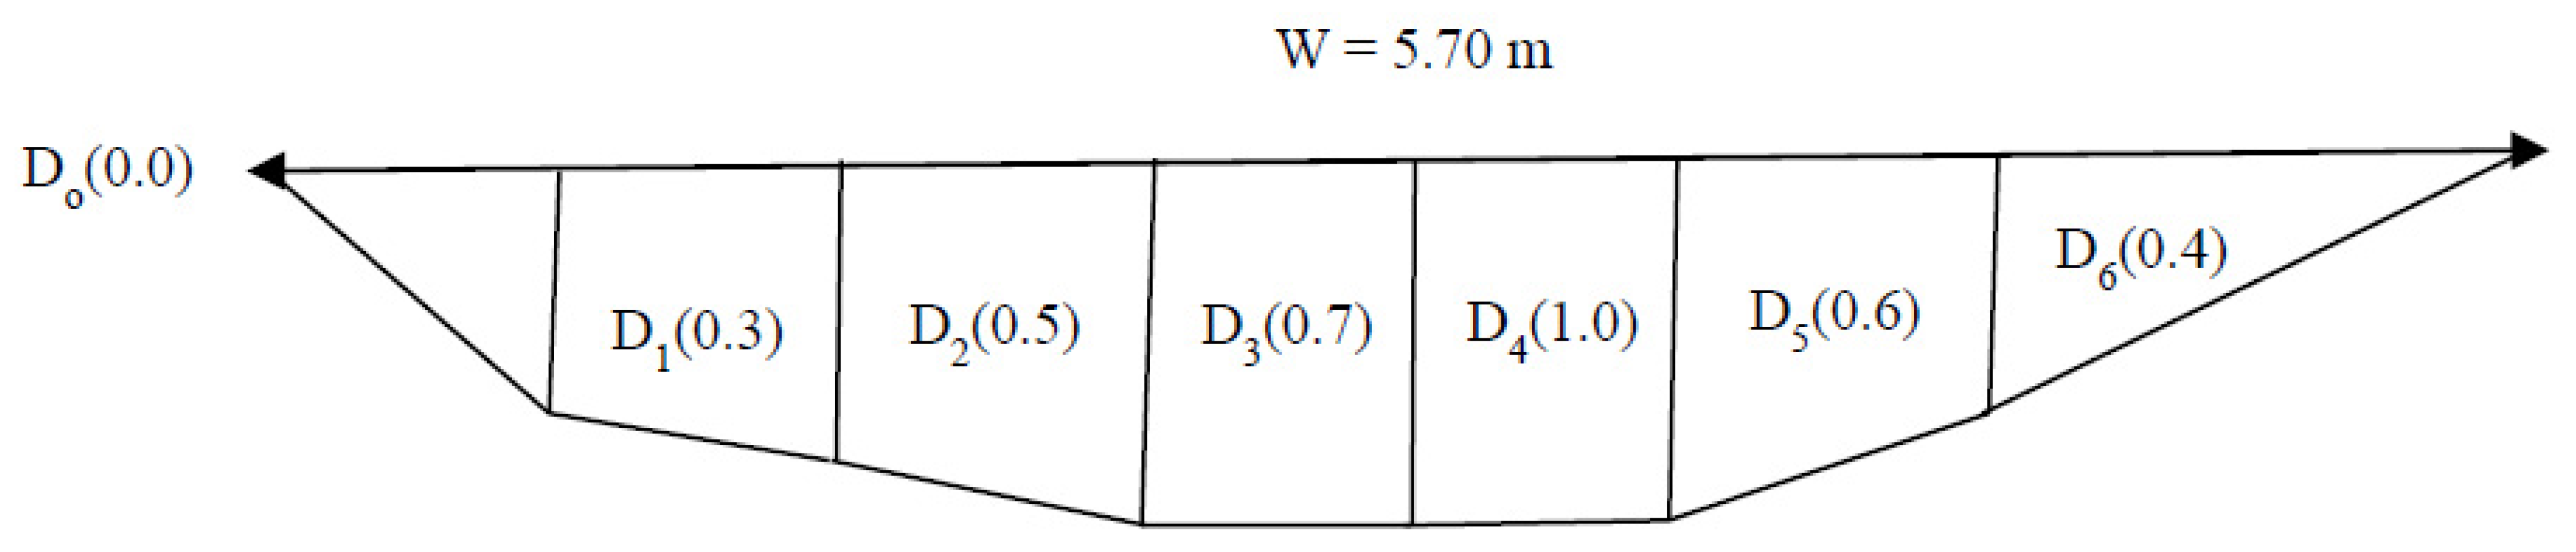
| Profile Parameters | NW1 | NW2 | NW3 | NW4 | NW5 |
|---|---|---|---|---|---|
| Observation time (s) | 57.30 | 60.00 | 61.67 | 56.67 | 61.67 |
| Length of river section (m) | 2.20 | 2.00 | 2.50 | 1.20 | 1.60 |
| Average river velocity (m/s) | 0.04 | 0.03 | 0.04 | 0.02 | 0.03 |
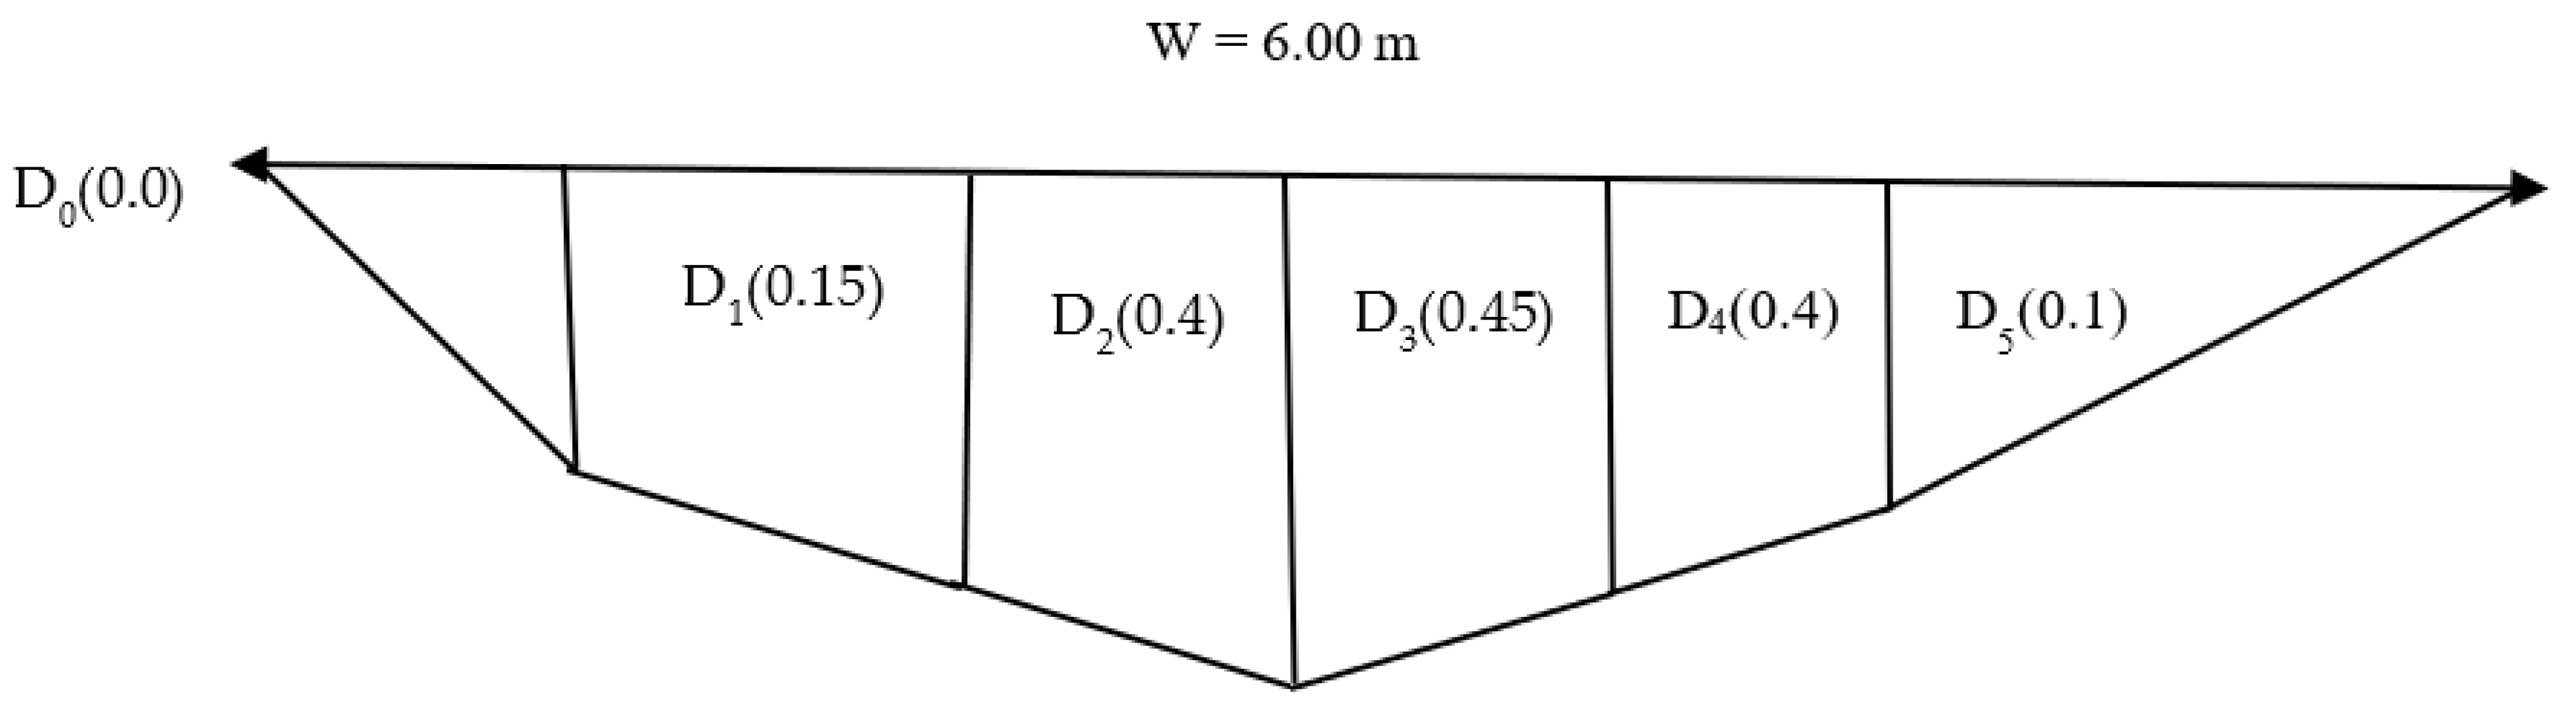
| River width (m) | 4.90 | 5.70 | 7.10 | 6.30 | 6.00 |
| River depth (m) | 1.30 | 1.50 | 1.10 | 1.30 | 1.40 |
| Cross-sectional area (m2) | 6.37 | 8.55 | 7.81 | 8.19 | 8.40 |
| River discharge (m3/s) | 0.24 | 0.29 | 0.32 | 0.17 | 0.22 |
| Single-line weir height (m) | 1.20 | 1.40 | 1.00 | 1.50 | 1.30 |
| Single-line weir length (m) | 5.00 | 6.00 | 7.00 | 6.50 | 6.00 |
| Date | Average Depth (D) (m) | River Width (m) | Cross- Sectional Area (m2) | Average Water Velocity (V) (m/s) | Calculated Discharge (Q) (m3/s) | Actual River Discharge (Multiplied by a Factor of 0.8) |
|---|---|---|---|---|---|---|
| 12–15 November 2022 | 0.40 | 3.48 | 1.40 | 0.04 | 0.06 | 0.04 |
| Date | Average Depth (D) (m) | River Width (m) | Cross- Sectional Area (m2) | Average Water Velocity (V) (m/s) | Calculated Discharge (Q) (m3/s) | Actual River Discharge (Multiplied by a Factor of 0.8) |
|---|---|---|---|---|---|---|
| 16–19 November 2022 | 0.30 | 2.60 | 0.78 | 0.02 | 0.02 | 0.01 |
| Date | Average Depth (D) (m) | River Width (m) | Cross-Sectional Area (m2) | Average Water Velocity (V) (m/s) | Calculated Discharge (Q) (m3/s) | Actual River Discharge (Multiplied by a Factor of 0.8) |
|---|---|---|---|---|---|---|
| 20–23 November 2022 | 0.70 | 5.70 | 3.99 | 0.03 | 0.12 | 0.10 |
| Date | Average Depth (D) (m) | River Width (m) | Cross-Sectional Area (m2) | Average Water Velocity (V) (m/s) | Calculated Discharge (Q) (m3/s) | Actual River Discharge (Multiplied by a Factor of 0.8) |
|---|---|---|---|---|---|---|
| 24–27 November 2022 | 0.40 | 7.30 | 2.92 | 0.03 | 0.09 | 0.07 |
| Date | Average Depth (D) (m) | River Width (m) | Cross-Sectional Area (m2) | Average Water Velocity (V) (m/s) | Calculated Discharge (Q) (m3/s) | Actual River Discharge (Multiplied by a Factor of 0.8) |
|---|---|---|---|---|---|---|
| 28–30 November 2022 | 0.50 | 5.20 | 2.60 | 0.03 | 0.08 | 0.06 |
| Date | Average Depth (D) (m) | River Width (m) | Cross-Sectional Area (m2) | Average Water Velocity (V) (m/s) | Calculated Discharge (Q) (m3/s) | Actual River Discharge (Multiplied by a Factor of 0.8) |
|---|---|---|---|---|---|---|
| 3–4 December 2022 | 0.40 | 6.30 | 2.52 | 0.03 | 0.08 | 0.06 |
| Date | Average Depth (D) (m) | River Width (m) | Cross-Sectional Area (m2) | Average Water Velocity (V) (m/s) | Calculated Discharge (Q) (m3/s) | Actual River Discharge (Multiplied by a Factor of 0.8) |
|---|---|---|---|---|---|---|
| 5–6 December 2022 | 0.40 | 9.10 | 3.64 | 0.02 | 0.07 | 0.06 |
| Date | Average Depth (D) (m) | River Width (m) | Cross-Sectional Area (m2) | Average Water Velocity (V) (m/s) | Calculated Discharge (Q) (m3/s) | Actual River Discharge (Multiplied by a Factor of 0.8) |
|---|---|---|---|---|---|---|
| 7–8 December 2022 | 0.30 | 7.40 | 2.22 | 0.02 | 0.04 | 0.04 |
| Date | Average Depth (D) (m) | River Width (m) | Cross-Sectional Area (m2) | Average Water Velocity (V) (m/s) | Calculated Discharge (Q) (m3/s) | Actual River Discharge (Multiplied by a Factor of 0.8) |
|---|---|---|---|---|---|---|
| 8–9 December 2022 | 0.40 | 5.50 | 2.20 | 0.03 | 0.07 | 0.05 |
| Date | Average Depth (D) (m) | River Width (m) | Cross-Sectional Area (m2) | Average Water Velocity (V) (m/s) | Calculated Discharge (Q) (m3/s) | Actual River Discharge (Multiplied by a Factor of 0.8) |
|---|---|---|---|---|---|---|
| 13-14 December 2022 | 0.50 | 6.70 | 3.35 | 0.02 | 0.07 | 0.05 |
| Date | Average Depth (D) (m) | River Width (m) | Cross-Sectional Area (m2) | Average Water Velocity (V) (m/s) | Calculated Discharge (Q) (m3/s) | Actual River Discharge (Multiplied by a Factor of 0.8) |
|---|---|---|---|---|---|---|
| 15–12 December 2022 | 0.40 | 4.90 | 1.96 | 0.04 | 0.07 | 0.06 |
| Date | Average Depth (D) (m) | River Width (m) | Cross-Sectional Area (m2) | Average Water Velocity (V) (m/s) | Calculated Discharge (Q) (m3/s) | Actual River Discharge (Multiplied by a Factor of 0.8) |
|---|---|---|---|---|---|---|
| 18–20 December 2022 | 0.40 | 5.70 | 2.28 | 0.03 | 0.07 | 0.05 |
| Date | Average Depth (D) (m) | River Width (m) | Cross-Sectional Area (m2) | Average Water Velocity (V) (m/s) | Calculated Discharge (Q) (m3/s) | Actual River Discharge (Multiplied by a Factor of 0.8) |
|---|---|---|---|---|---|---|
| 21–22 December 2022 | 0.40 | 7.50 | 3.00 | 0.04 | 0.12 | 0.10 |
| Date | Average Depth (D) (m) | River Width (m) | Cross-Sectional Area (m2) | Average Water Velocity (V) (m/s) | Calculated Discharge (Q) (m3/s) | Actual River Discharge (Multiplied by a Factor of 0.8) |
|---|---|---|---|---|---|---|
| 23–26 December 2022 | 0.30 | 6.30 | 1.89 | 0.02 | 0.04 | 0.03 |
| Date | Average Depth (D) (m) | River Width (m) | Cross-Sectional Area (m2) | Average Water Velocity (V) (m/s) | Calculated Discharge (Q) (m3/s) | Actual River Discharge (Multiplied by a Factor of 0.8) |
|---|---|---|---|---|---|---|
| 27–30 December 2022 | 0.20 | 6.00 | 1.20 | 0.03 | 0.04 | 0.03 |
Disclaimer/Publisher’s Note: The statements, opinions and data contained in all publications are solely those of the individual author(s) and contributor(s) and not of MDPI and/or the editor(s). MDPI and/or the editor(s) disclaim responsibility for any injury to people or property resulting from any ideas, methods, instructions or products referred to in the content. |
© 2023 by the authors. Licensee MDPI, Basel, Switzerland. This article is an open access article distributed under the terms and conditions of the Creative Commons Attribution (CC BY) license (https://creativecommons.org/licenses/by/4.0/).
Share and Cite
Kabwe, A.L.; Hyodo, M.; Ogata, H.; Sagawa, Y.; Adachi, Y.; Ishii, M. Diagnostic Assessment in the Wet and Dry Seasons of Simple Weirs Constructed by Small-Scale Farmers in the Northern Region Provinces of Zambia. Water 2023, 15, 3935. https://doi.org/10.3390/w15223935
Kabwe AL, Hyodo M, Ogata H, Sagawa Y, Adachi Y, Ishii M. Diagnostic Assessment in the Wet and Dry Seasons of Simple Weirs Constructed by Small-Scale Farmers in the Northern Region Provinces of Zambia. Water. 2023; 15(22):3935. https://doi.org/10.3390/w15223935
Chicago/Turabian StyleKabwe, Alex Lushikanda, Masahiro Hyodo, Hidehiko Ogata, Yoshihiro Sagawa, Yoshinao Adachi, and Masayuki Ishii. 2023. "Diagnostic Assessment in the Wet and Dry Seasons of Simple Weirs Constructed by Small-Scale Farmers in the Northern Region Provinces of Zambia" Water 15, no. 22: 3935. https://doi.org/10.3390/w15223935
APA StyleKabwe, A. L., Hyodo, M., Ogata, H., Sagawa, Y., Adachi, Y., & Ishii, M. (2023). Diagnostic Assessment in the Wet and Dry Seasons of Simple Weirs Constructed by Small-Scale Farmers in the Northern Region Provinces of Zambia. Water, 15(22), 3935. https://doi.org/10.3390/w15223935