Article

Interaction between Groundwater and Surface Water in the Qujiang River Basin in China: Evidence from Chemical Isotope Measurements

1
School of Ecological Environment, Institute of Disaster Prevention, Sanhe 065201, China
2
Chinese Academy of Natural Resources Economics, Beijing 100035, China
3
No.1 Geological Exploration Institute, General Administration of Metallurgical Geology of China, Sanhe 065201, China
4
Zhejiang Geological Exploration Institute, General Administration of Metallurgical Geology of China, Quzhou 324000, China
*
Authors to whom correspondence should be addressed.
Water 2023, 15(22), 3932; https://doi.org/10.3390/w15223932
Submission received: 24 August 2023 / Revised: 3 November 2023 / Accepted: 6 November 2023 / Published: 10 November 2023
(This article belongs to the Special Issue Hydrochemistry and Isotopes in Groundwater Investigations)

Abstract

:
The Qujiang River Basin is a significant water system located in Zhejiang Province, China, that serves as a primary water source for Quzhou City. For this research, we collected and examined water samples from the Qujiang River Basin. In this study, we collected and analyzed water samples from the Qujiang River Basin and employed a combination of methods, including water balance analysis; Piper trilinear diagram; Gibbs diagram; and environmental tracer techniques, such as hydrochemical and isotopic analysis. These techniques helped us to analyze the spatial distribution patterns and evolutionary trends of surface water and groundwater hydrochemistry, along with the stable isotopes of hydrogen and oxygen, as well as to determine the sources of surface water and groundwater by calculating the conversion ratio between surface water and groundwater. (1) The findings of our study indicate that the primary hydrochemical types in the study area are Ca-HCO3 and Ca-HCO3·Cl, with the ion composition of water primarily influenced by rock weathering and precipitation. (2) Similar spatial variations in hydrochemical indicators were observed between surface water and groundwater in the study area, with frequent transitions between the two. (3) The hydrogen and oxygen isotope content increases downstream, signifying that both groundwater and surface water in the study area are replenished by atmospheric precipitation, as supported by the relationship between hydrogen and oxygen isotopes and the meteoric water line. (4) We determined that groundwater predominantly replenishes surface water in the upstream area. The average contribution rate of groundwater to surface water is 19.67%, with an annual average recharge volume of 1.23 × 10⁶ m3. Midstream and downstream, surface water mainly recharges groundwater, with an average contribution rate of 22.77% and an annual average recharge volume of 1.59 × 10⁶ m3.

1. Introduction

Amidst the global decline in runoff and the reduction in surface water catchment areas due to urbanization driven by socio-economic development, the exacerbation of water scarcity and environmental degradation presents significant impediments to the development of human society. The increasing scarcity of water resources has increased its economic importance and societal advantages, emphasizing its pivotal role in socio-economic advancement. Simultaneously, human activities have exerted a notable influence on water quality. Research into the hydrochemical attributes of surface and groundwater under the collective influence of natural and anthropogenic activities establishes a foundation for the conservation and rational utilization of water resources [1,2,3,4,5].
At the watershed scale, both domestic and international scholars frequently employ isotopic methods in conjunction with hydrochemical techniques to scrutinize hydrochemical attributes [6]. These approaches include the use of hydrochemical typology to appraise groundwater quality, unveiling the spatiotemporal distribution patterns of groundwater’s hydrochemistry and comprehending regional hydrochemical traits. The analysis of ion ratio coefficients aids in discerning the origins of variations in groundwater’s chemical composition. In the realm of hydrogeology, isotope techniques are primarily used for dating, determining material sources, and process inversion. Hydrogen and oxygen isotope compositions exhibit significant variations among distinct water sources, rendering them indispensable for identifying water sources and their genesis [7,8,9,10,11,12]. For instance, Chengpeng Lu [13] and colleagues conducted a quantitative analysis of the relationship between surface water in the Qinhuai River and adjacent groundwater. Dong Zhang and his team investigated the impact of the Sanmenxia Dam on the interactions between surface and groundwater in the downstream Yellow and Wei Rivers. Milad Masoud employed environmental isotopes and hydrochemistry to identify groundwater recharge in the Wadi Qanunah basin of Saudi Arabia [14]. Xiaoyu Tang [15] conducted a study on the conversion relationship between groundwater and surface water in the Liu River basin. Wang et al. [16] employed isotope techniques to investigate the transformation relationship between river water and groundwater in the lower reaches of the Tarim River. Sun [17] explored the transformation relationship between groundwater and surface water in different seasons in the Haihe River source area.
As one of the pioneering sites of the “Green Waters and Green Mountains are Gold and Silver Mountains” initiative, the water quality of the Qujiang River Basin has garnered national attention. Consequently, more stringent standards have been proposed for water resource exploitation, management, environmental protection, and ecological preservation. The Qujiang River serves as a substantial surface water resource for Quzhou City, characterized by its abundant total volume but low per capita availability. Its spatial distribution does not align with cultivated land, population, or economic development. Additionally, the geological strata of the Qujiang basin are diverse, including various formations spanning different geological eras, from the early Paleozoic to the Cenozoic.
Research findings regarding the hydrochemical characteristics of the Qujiang basin are scarce, and investigations into the conversion relationship between surface water and groundwater in the Qujiang basin remain unaddressed. This paper focuses on the groundwater and surface water of the Qujiang River Basin. Through an analysis of the spatial evolution patterns of hydrochemistry and stable isotopes of hydrogen and oxygen in various water bodies in the basin, this study aims to explore the conversion characteristics between groundwater and surface water in the region. The objective is to provide a scientific reference for the protection and rational utilization of water resources in the Qujiang River Basin.

2. Case Study Area

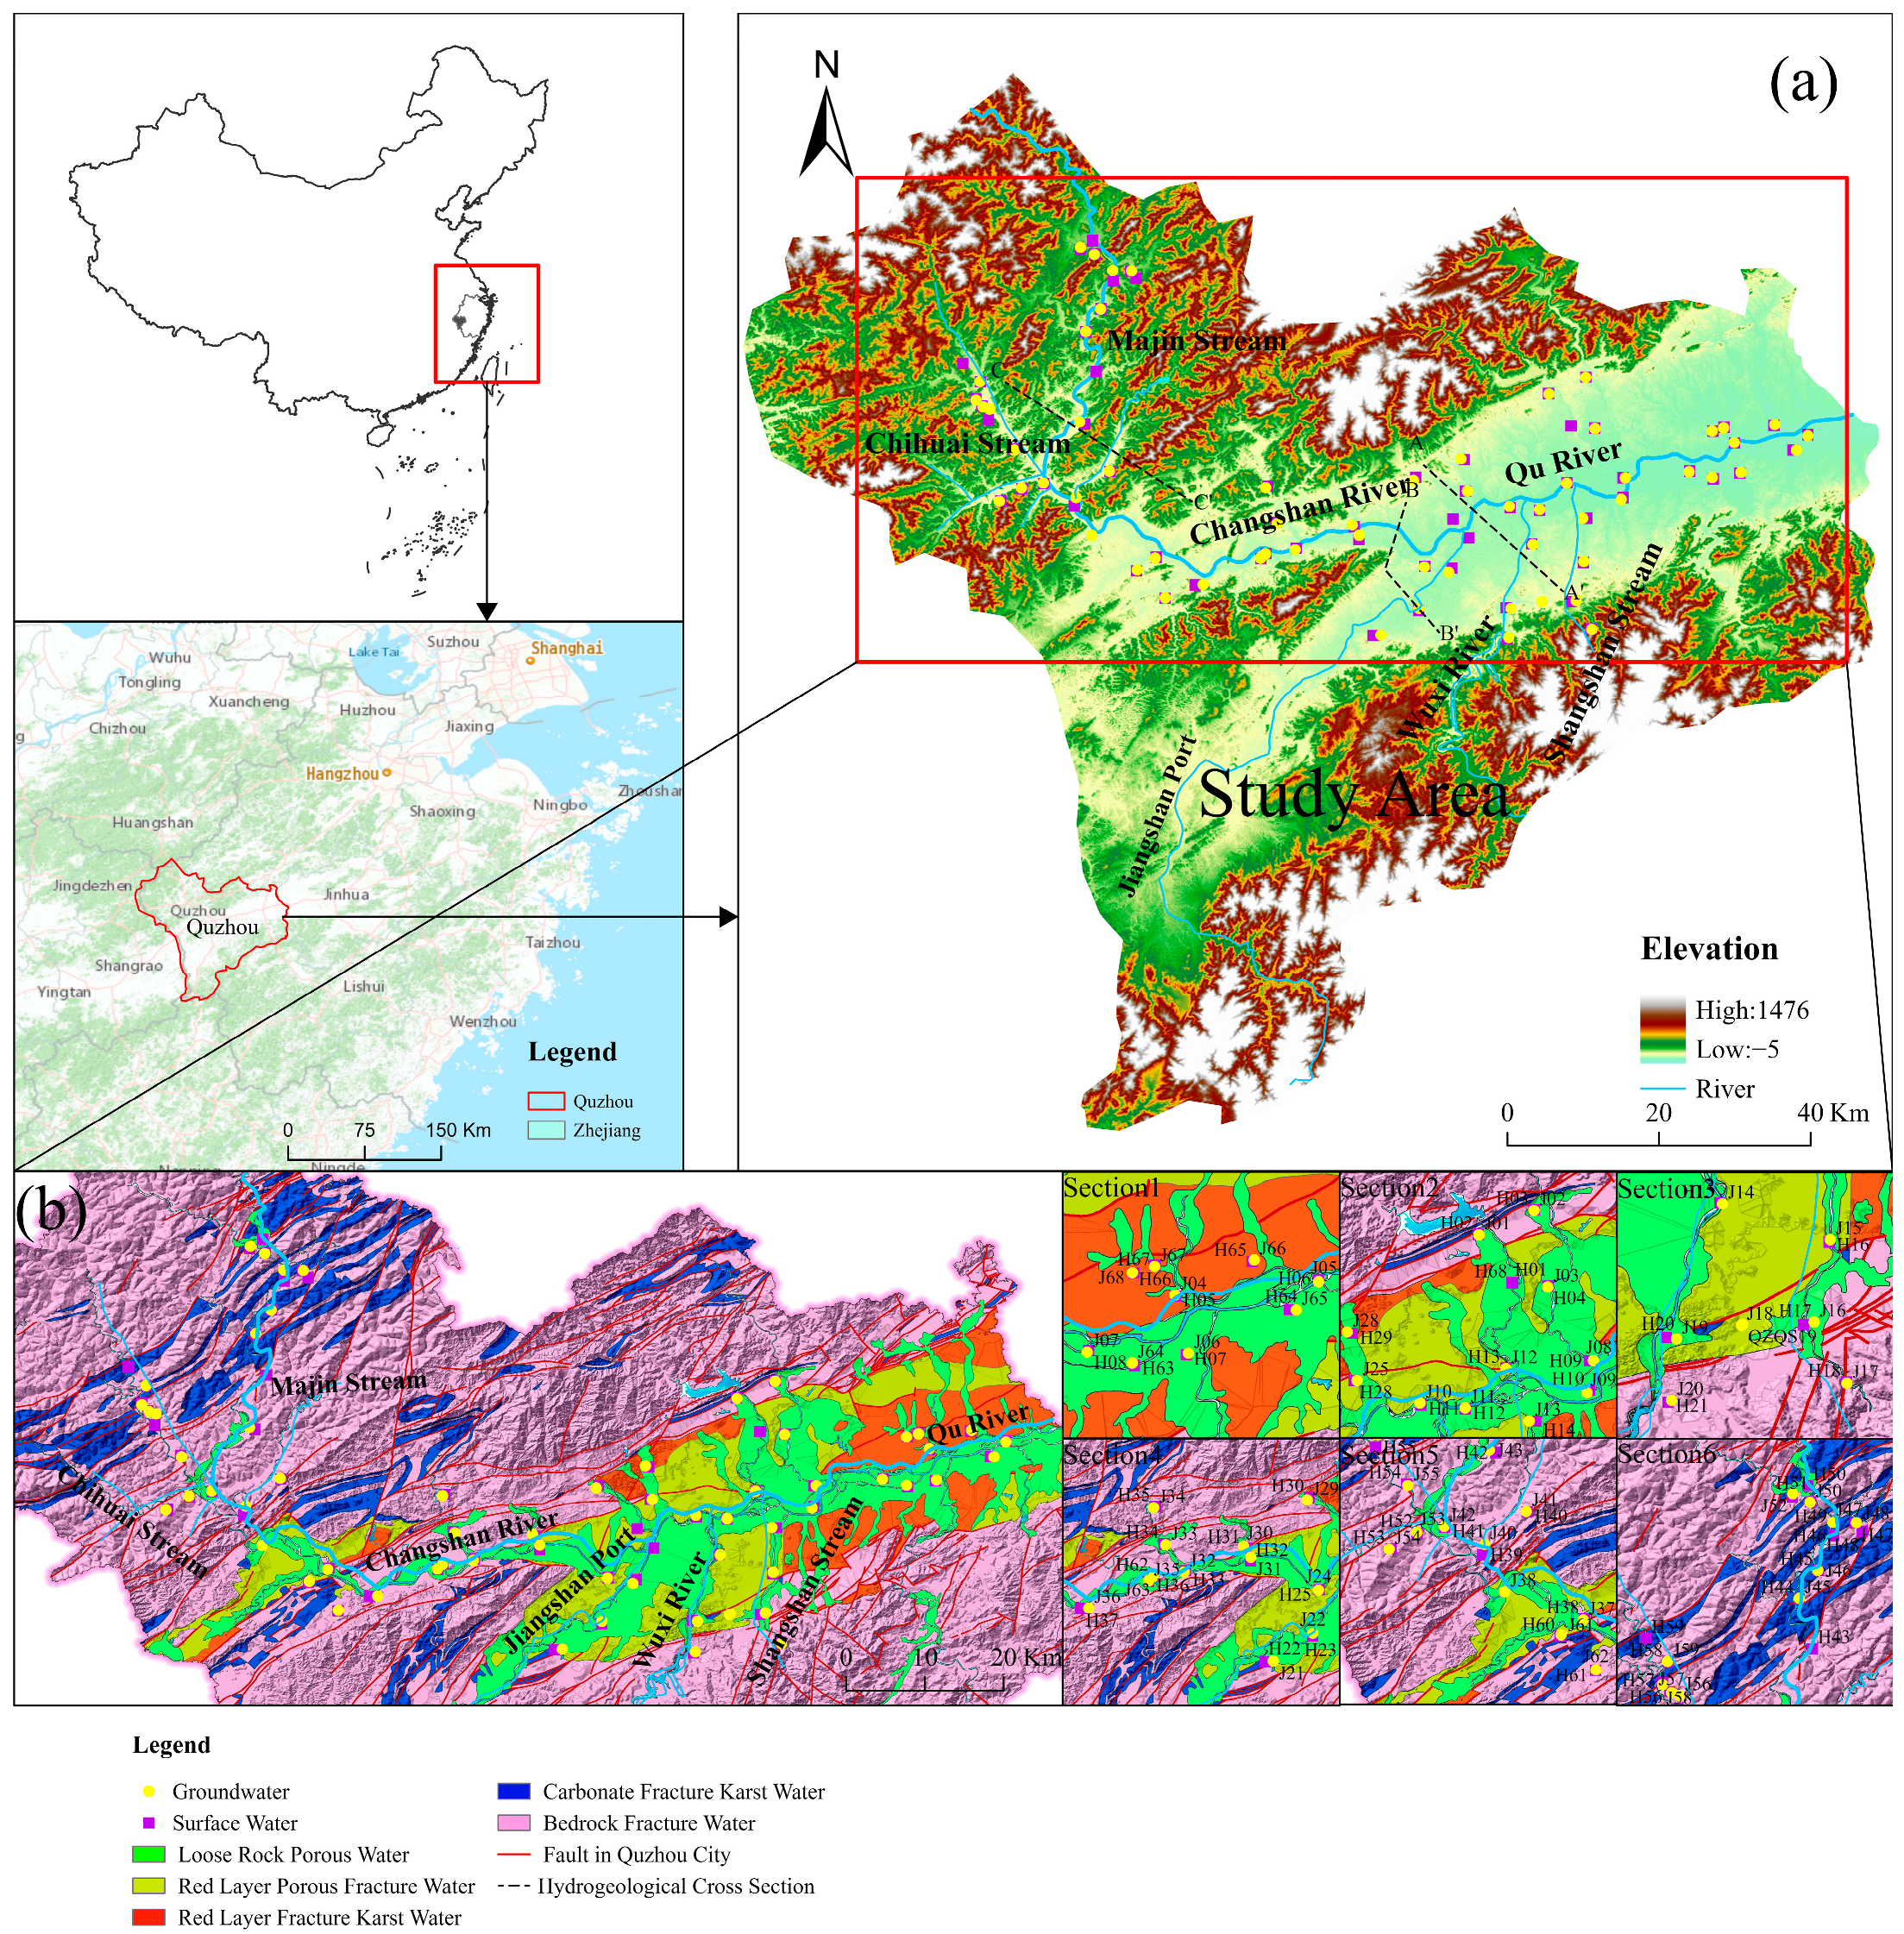
2.1. Natural Geographical Location

The Qujiang River Basin, located at coordinates 118.5° to 120.5° E and 28.6° to 30.2° N, occupies a strategic position at the confluence of the Zhejiang and Anhui provinces in China. It serves as a significant tributary of the Yangtze River, and its importance is underscored by its course through municipalities like Quzhou and Jiangshan in Zhejiang Province before it converges with the Yangtze River. The Qujiang River Basin offers a well-developed water system, including major rivers such as the Qujiang River, Wenjiang River, and Yujiang River. These rivers play vital roles in the local water resources, agricultural irrigation, and industrial water supply. Our study area is centered in the Qujiang section of this basin, which includes Kaihua County, Changshan County, Qujiang District, Kecheng District, Longyou County, and adjacent areas. The upstream region of our study area is situated on the periphery of the Jinqu Basin, characterized by low mountains, high hills, and ridges. In contrast, the middle and lower reaches of the study area are situated within the Jinqu Basin, primarily comprising red hills, basins, residual hills, and alluvial plains. The elevation typically ranges from 50 m to 300 m above sea level. The geographical and geomorphic features of the study area, as well as its location within the region, are depicted in Figure 1.

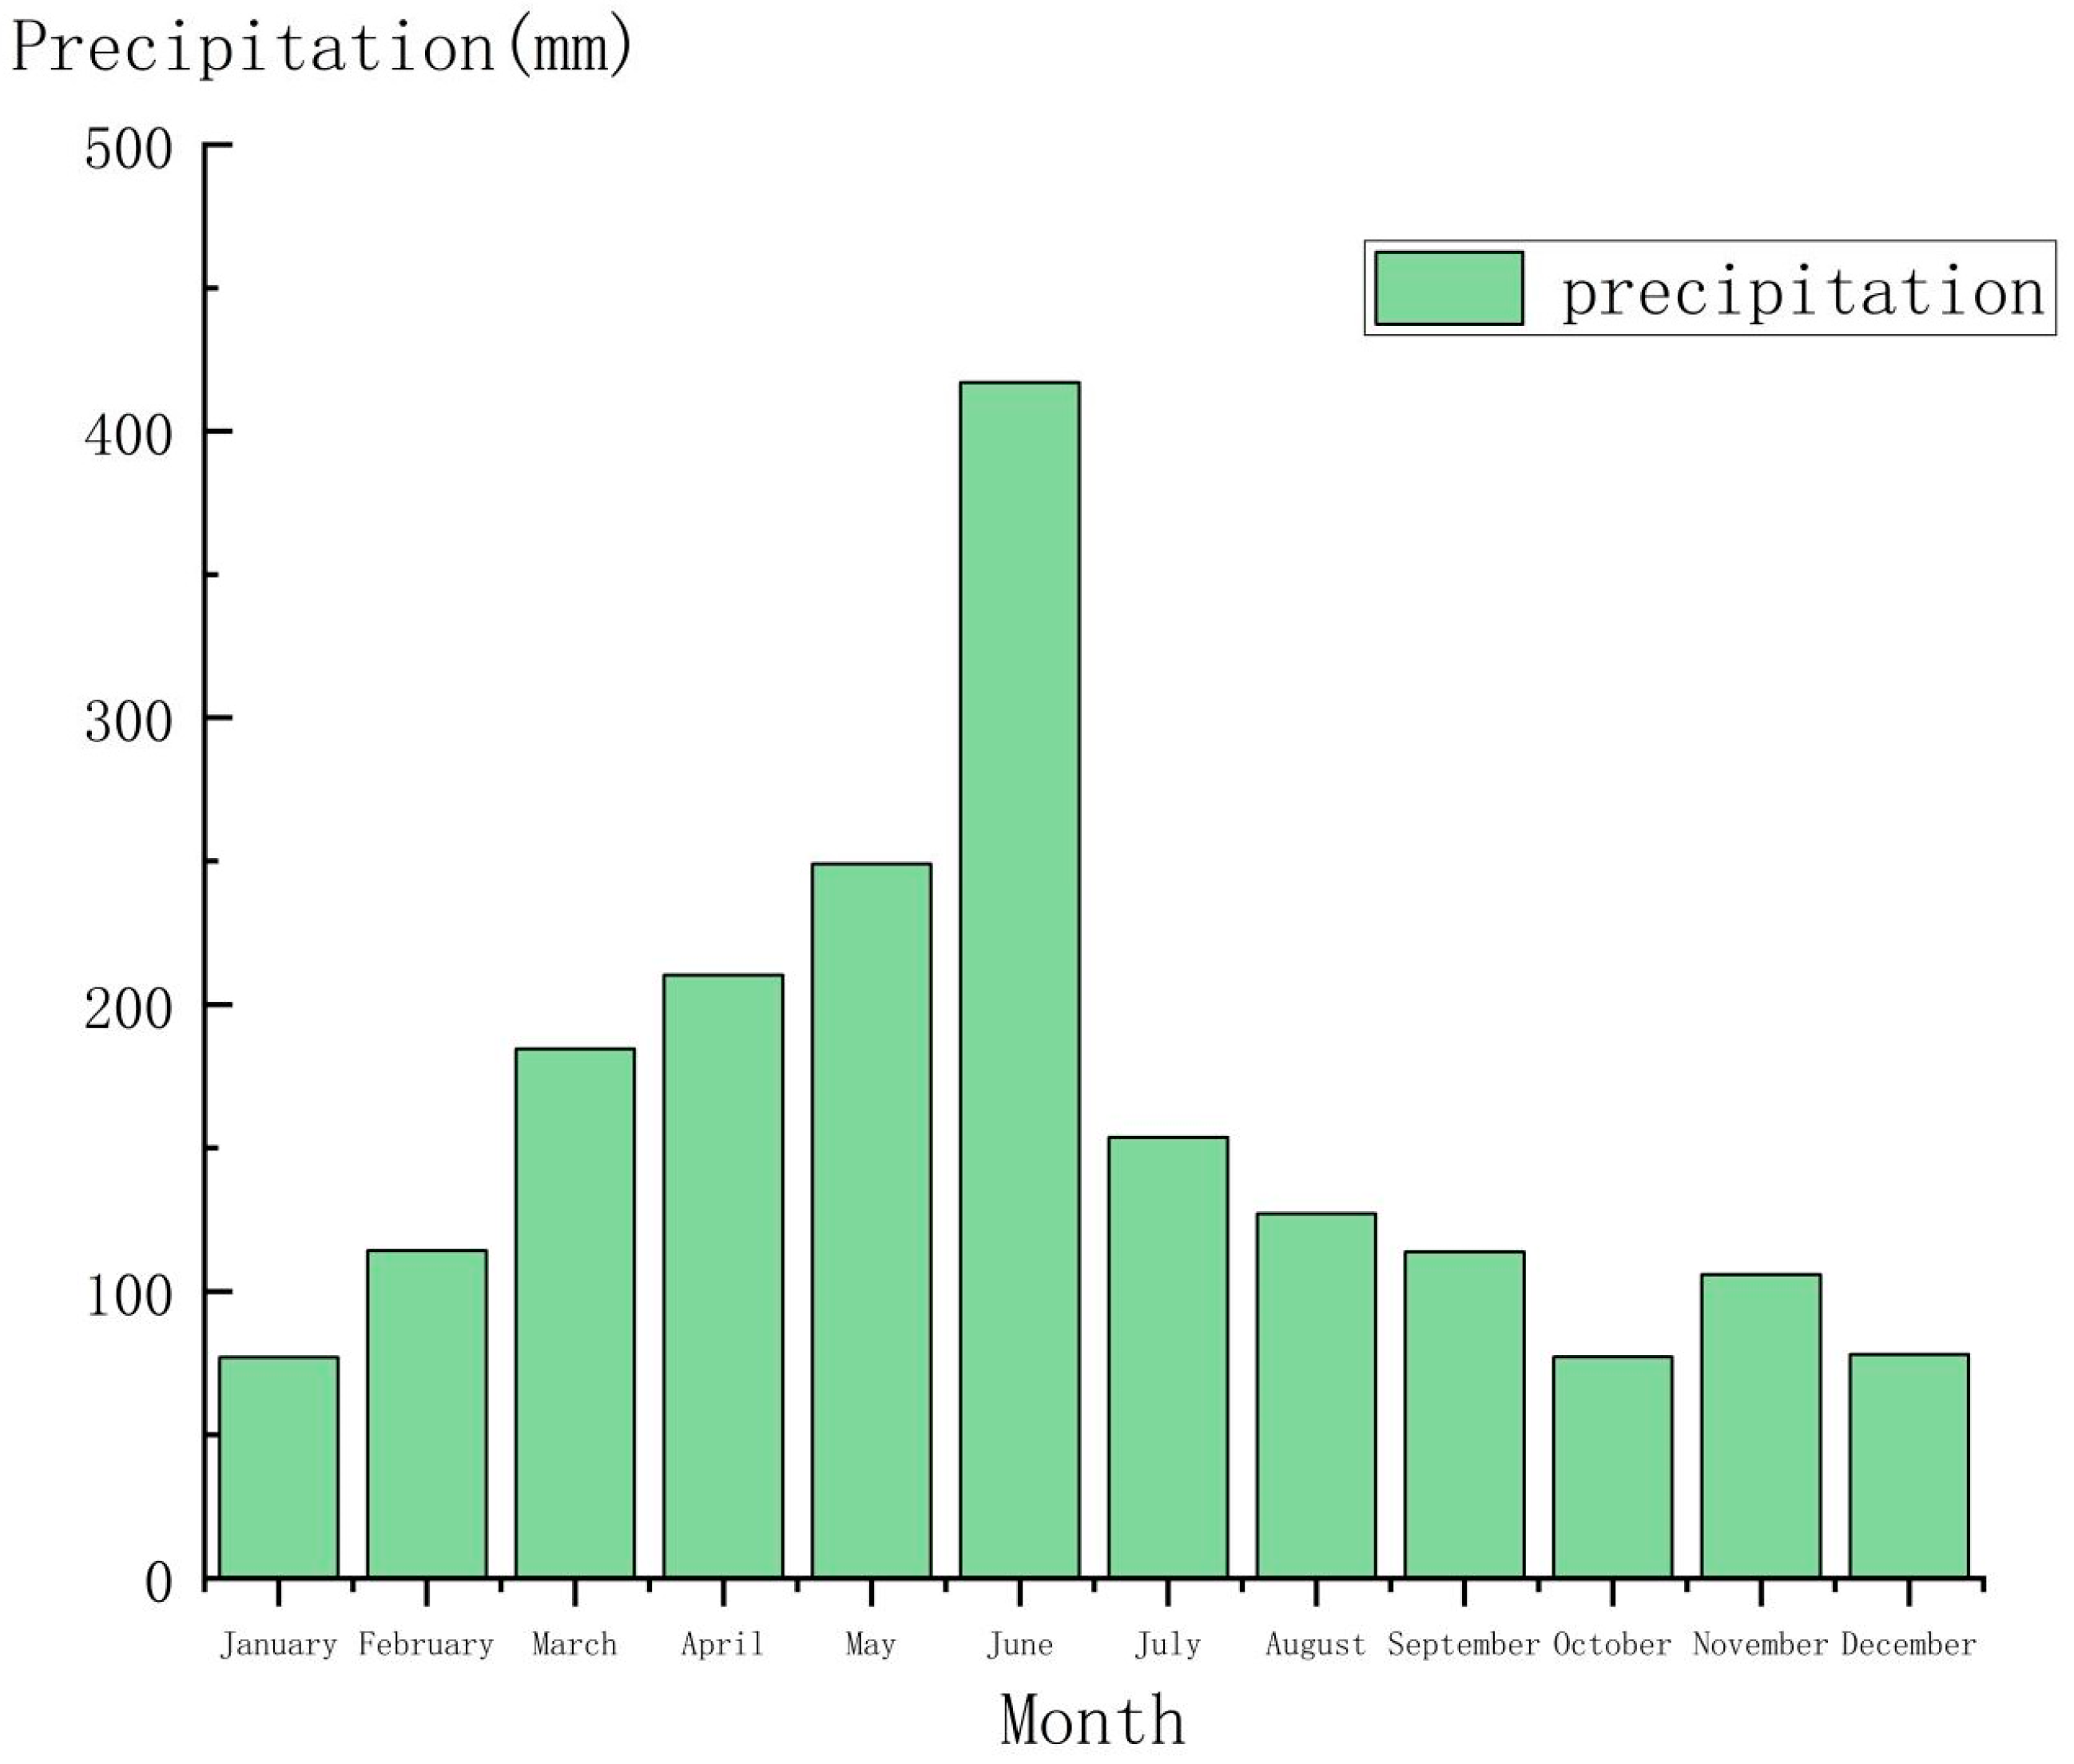
2.2. Climatic Conditions

The study area experiences a subtropical monsoon climate, characterized by pronounced seasonal variations, including extended summers and winters, short-lived springs and autumns, abundant sunshine, and unevenly distributed precipitation throughout the seasons. The average annual temperature in the region hovers around 17.5 °C, with recorded extremes ranging from a high of 41.2 °C to a low of −10.4 °C. Based on data from seven hydrological rainfall stations situated in and around the study area, coupled with information from eleven meteorological stations in Kecheng District spanning the past decade, the multi-year average precipitation amounts to 1908.04 mm. The highest annual recorded precipitation occurred in 2015, reaching 2890.2 mm at the Qilipai Station, while the lowest was observed in 1979, with 1109.3 mm at the Quzhou Station. Detailed rainfall data are presented in Figure 2.

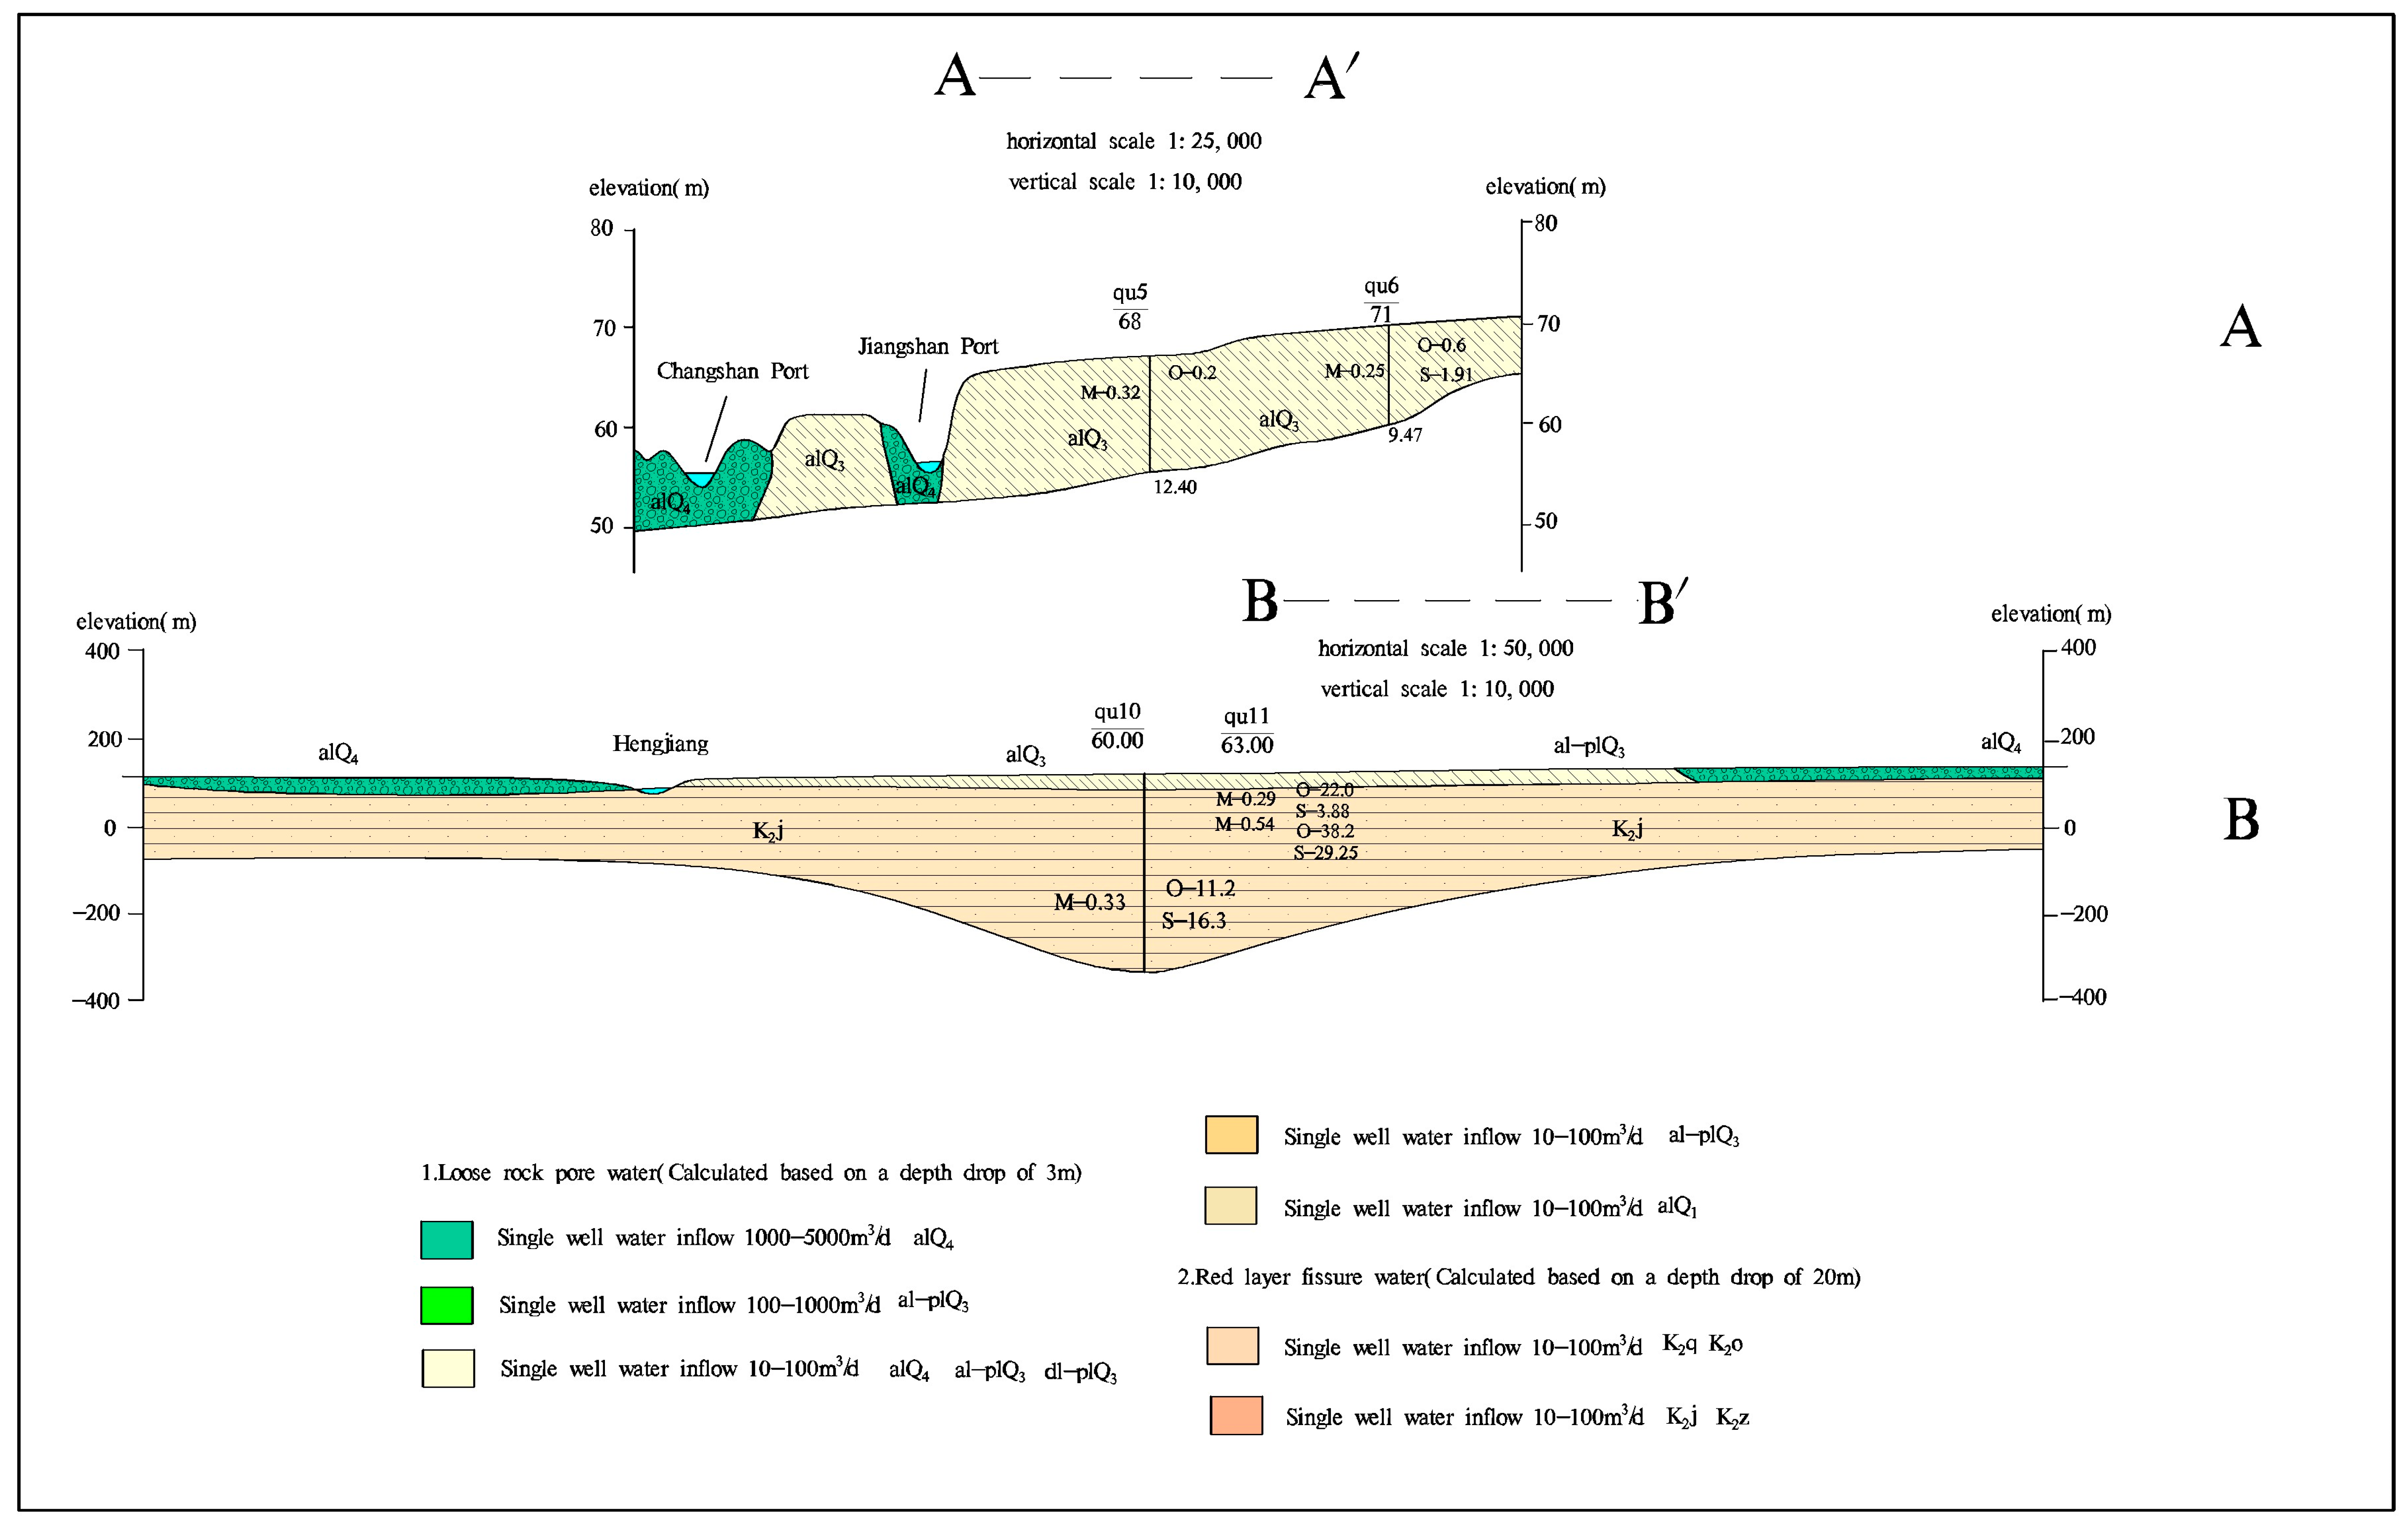
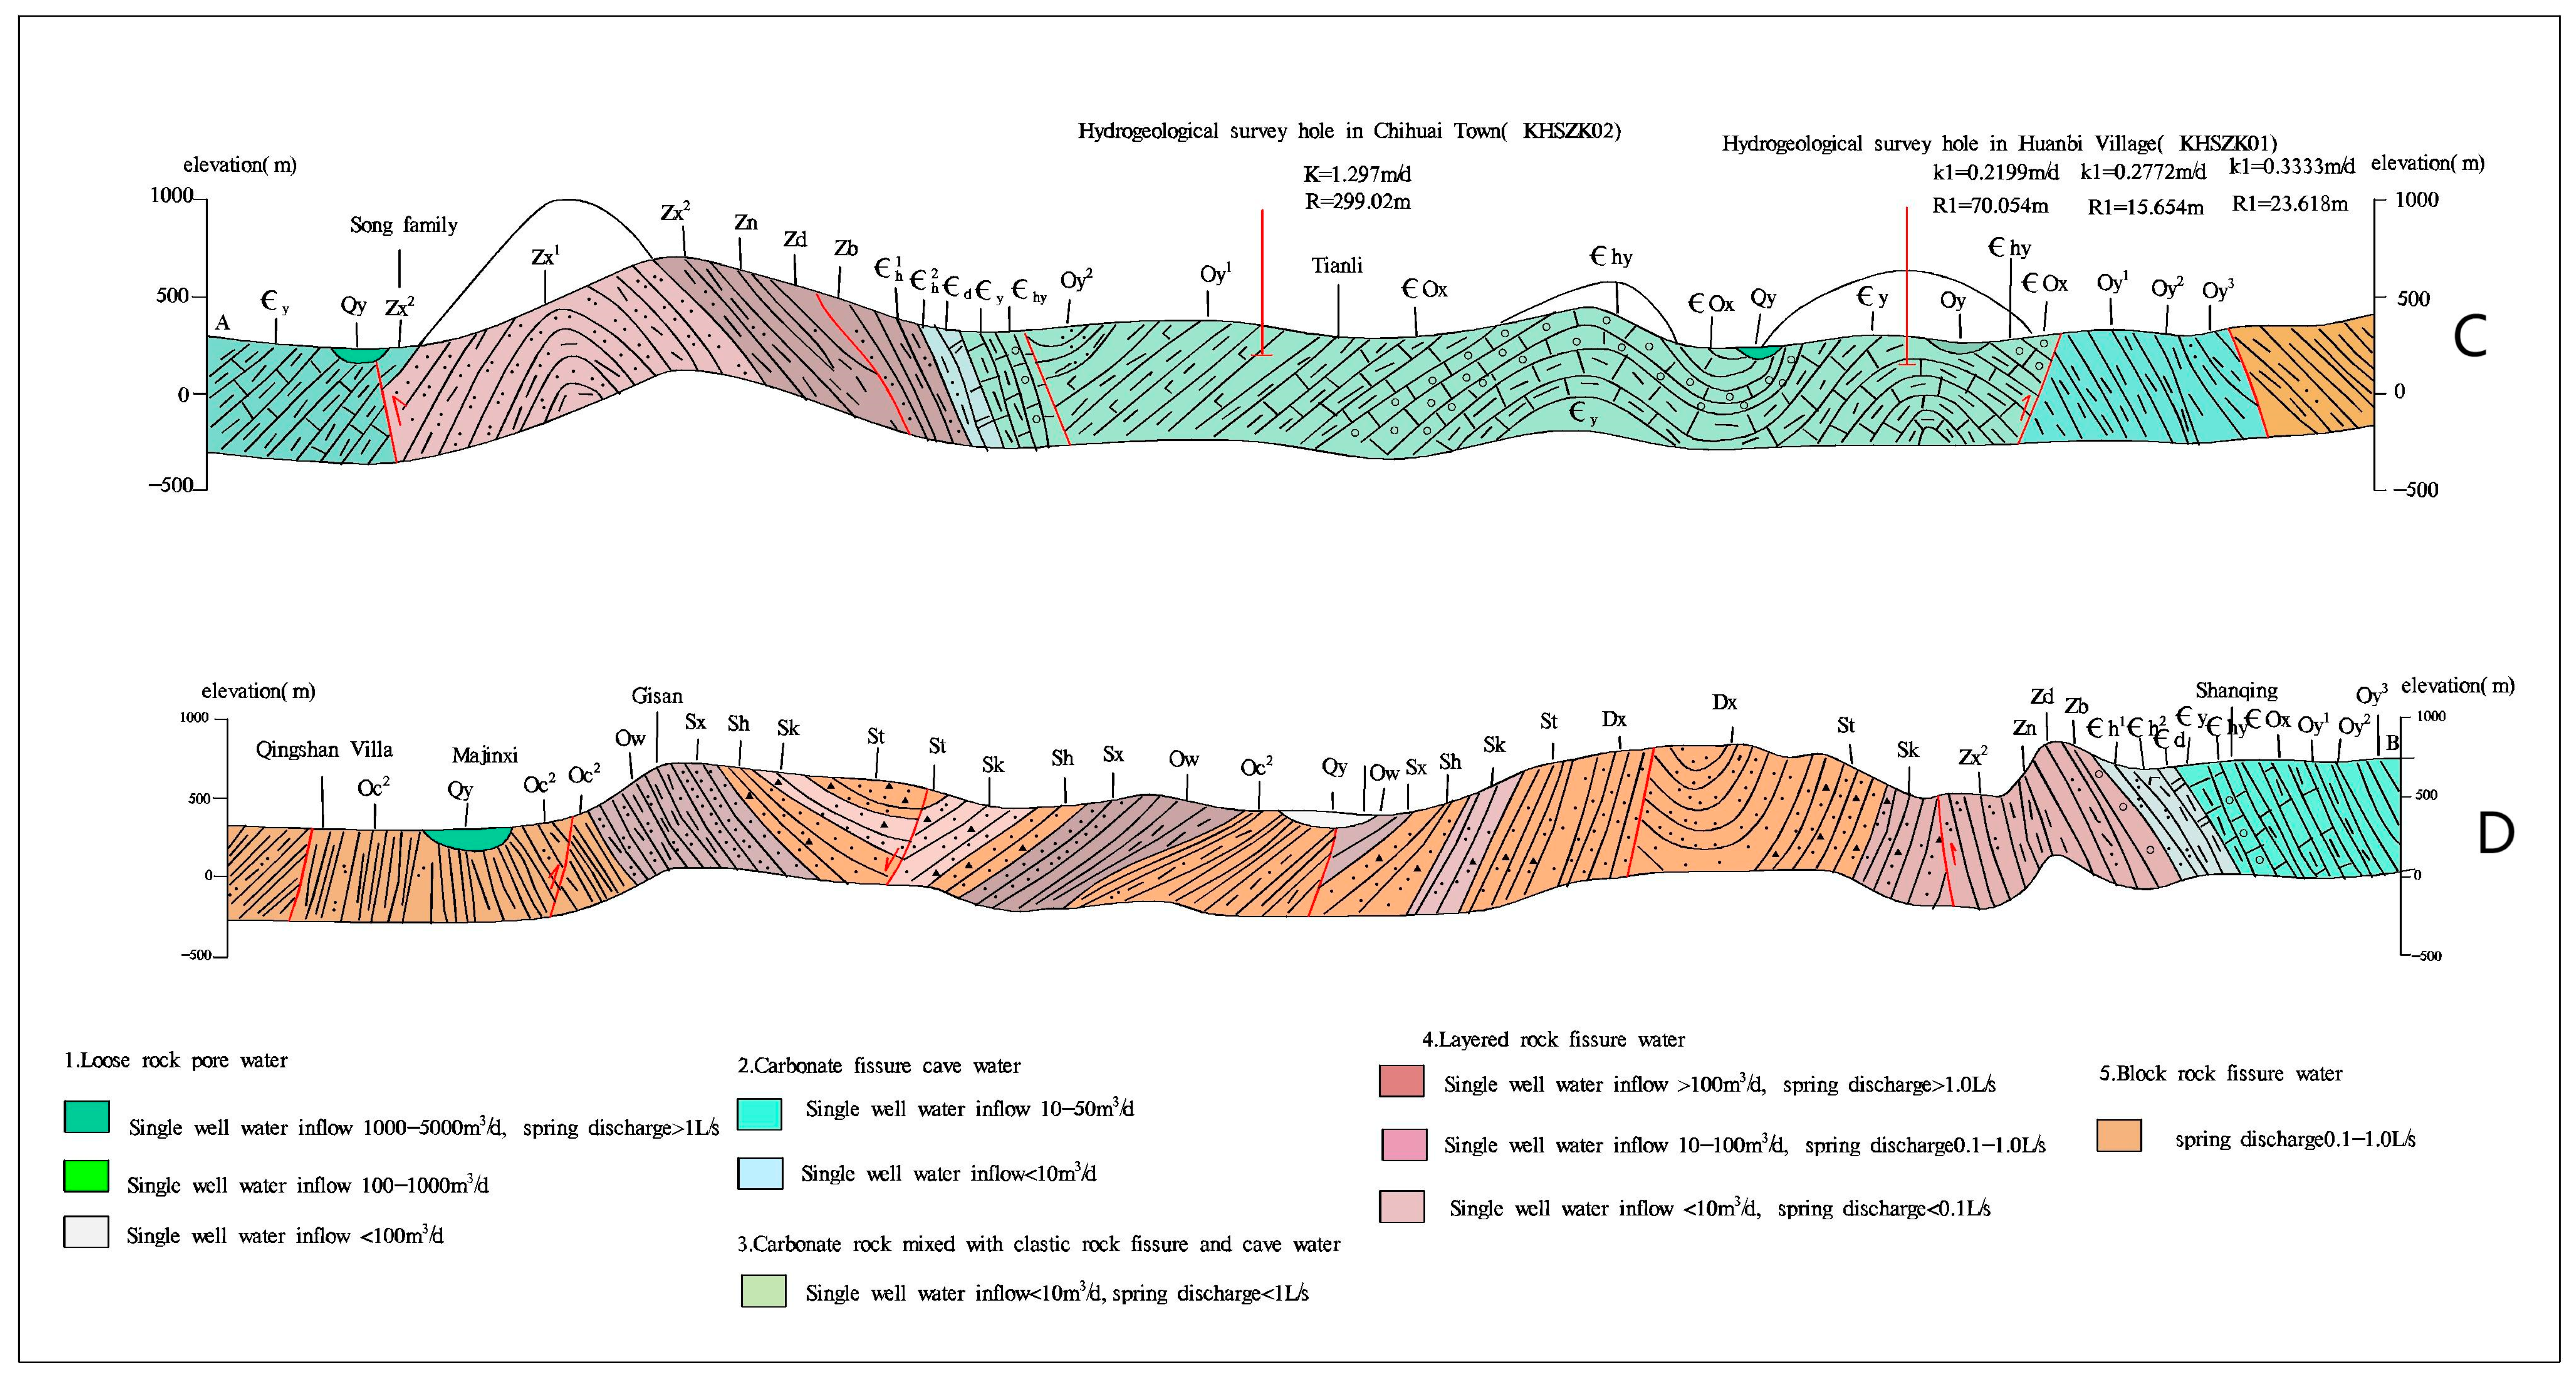
2.3. Geological and Hydrogeological Conditions

In the upstream portion of the study area, the exposed geological formations predominantly belong to the Early Paleozoic Ordovician and Cambrian periods. These formations are primarily composed of fine sandstones, siltstones, and mudstones, giving rise to rhythmic cyclothems, along with interbedded mudstones and siltstones. On the other hand, in the middle and downstream regions, the geological formations correspond to the Upper Cretaceous period and are chiefly composed of conglomerates, medium-to-coarse sandstones, and fine-to-silt-sized sandstones. The Quaternary geological formations include Middle to Upper Pleistocene alluvial deposits, fluvial deposits, and the Holocene alluvial layer.
Concerning the aquifer medium and storage conditions, the dominant groundwater types in the study area comprise unconsolidated rock pore groundwater and clastic rock of the red bed type, which includes both pore and fracture water, along with bedrock fracture water. The upper sections of the red bed clastic rock frequently display the presence of unconsolidated rock pore groundwater. Specific hydrogeological features can be seen in Figure 3.

3. Materials and Methods

In this study, a total of 136 samples were collected, including 67 surface water samples, 61 groundwater samples, and 8 spring water samples. The precise sampling locations are illustrated in Figure 1. The sampling process adhered to the requirements specified in the “Technical Specifications for Groundwater Environmental Monitoring.” A sampling volume of 4 times 250 mL was maintained, and the sampling instruments and containers were thoroughly rinsed with sample water (2–3 times) prior to sampling. The sampling wells underwent meticulous cleaning before sampling, with clean water selected from depths exceeding 0.5 m. Portable water quality meters (HQ40d, HACH, Hash, Shanghai, China) were employed at the sampling sites to measure crucial parameters, including the pH, oxidation–reduction potential (Eh), total dissolved solids (TDS), dissolved oxygen (DO), and electrical conductivity (Ec) of the water samples. The analysis of anions and cations within the water samples was entrusted to Zhejiang Zhongyi Testing Institute Co., Ltd. (Ningbo, China) The δD and δ18O values of the water samples were determined using an isotope analyzer (DLT-100, Los Gatos Research, Mountain View, CA, USA) with accuracy levels of 0.3‰ and 0.1‰, respectively. These results were calibrated using VSMOW, and the subsequent data analysis was conducted using the accompanying software (LWIA Post Analysis v3.1.0.9 Installer).
To assess the hydrochemical characteristics, we primarily relied on the inverse distance weighting interpolation method available in ArcGIS 10.6 software. We also employed a map along the route analysis to examine the spatial distribution of crucial parameters, such as total dissolved solids (TDS), pH, δ18O, and δD, in both surface river water and groundwater throughout the study area. To gain a better understanding of the spatial attributes of hydrochemistry, we used Origin2021 to generate Piper trilinear diagrams and compare the hydrochemical characteristics in the study area [18]. Additionally, the Gibbs method was instrumental in discerning which processes, including rock weathering, precipitation, and evaporative enrichment, exerted control over the hydrochemical traits of the water bodies [19].
In the assessment of oxygen isotopes, our focus was on the 18O/16O ratio, commonly denoted as δ18O, owing to its substantial difference in mass compared to 16O. The formula employed for this measurement was as follows [20]:
δ18O (‰) = [(18O/16O)m − (18O/16O)s]/(18O/16O)s × 1000
where “m” represents the sample and “s” indicates the standard sample.
We utilized the principle of mass conservation and the stable isotopes of hydrogen and oxygen to create a mass balance model for the purpose of estimating the extent of transformation between surface water and groundwater [21].
The equation for the conservation of mass in the transformation of δ18O in water was as follows:
CsQs = CgQg + Cb(Qs − Qg)
where Cs represents the δ18O value of the sampled river water, Cg signifies the δ18O value of the sampled groundwater, Cb stands for the δ18O value of the upstream inflow water, Qs denotes the river water flow at the sampling point, and Qg represents the discharge into the groundwater. Formula (2) can be further employed to calculate the percentage of river water discharge into groundwater relative to the river water flow:
f = (Qg/Qs) × 100% = (Cs − Cb)/(Cg − Cb) × 100%
In situations where determining the proportion of a single mixing source requires the use of multiple tracers, such as another isotope or hydrochemical ion in the water, we utilized deuterium isotopes (δD) to calculate the three-phase mixture using Formula (4). This equation serves as an extension of the mass balance equation for three-phase mixtures.
CsQs = CgQg + CcQa + Cm (Qs − Qg − Qa)
where Cc denotes the δD value in the upstream mainstream water sample, and Cm represents the δD value in the upstream tributary water sample.

4. Results

4.1. Hydrochemistry

The hydrogeochemical data of all groundwater samples collected in the Qujiang River Basin are summarized in Table 1, and the statistical results of those data are presented in Table 1 as well. The pH of the loose pore phreatic water varied from 5.05 to 6.95, and those of the red layer pore fissure water and bedrock fissure water varied from 5.12 to 6.89 and 5.05 to 6.01, respectively. Therefore, the groundwater in the study area is generally acidic. Table 1 also shows that the TDS of the loose pore phreatic water varied from 70–426 mg/L, and those of the red layer pore fissure water and bedrock fissure water ranges from 98 to 273 mg/L and 43 to 102 mg/L, respectively.
Based on Table 1, in the midstream and downstream groundwater, the major cation concentration sequence was Ca2+ > Na+ > K+ > Mg2+, with Ca2+ being the predominant cation. The anion concentration sequence was HCO3 > SO42− > Cl, with HCO3 and SO42− as the primary anions. According to the different ionic concentrations, the Piper plot was created (Figure 4) in order to highlight the different groundwater types. To understand the spatial distribution characteristics of water chemistry in the Qujiang Basin, we focused our discussions on the primary course of the Qujiang River. This illustrated that the predominant water types in the upstream area of the Qujiang River, including Chihuai Creek and Majin Creek, were primarily characterized by Ca-HCO3 and Ca-HCO3·Cl. In the midstream and downstream areas, the prevailing water type was Ca-HCO3. This distribution pattern is mainly a result of the complex topographical, geological, and hydrogeological conditions in the upper reaches. Here, ions in both surface and groundwater undergo changes during transportation. When they reach the midstream and downstream sections, the terrain becomes flatter, and the hydraulic gradient of the groundwater decreases. Consequently, ions have longer retention times, resulting in a more uniform water chemistry type. Groundwater types in this region are largely similar, and the sources of ions in surface and groundwater appear to be analogous, emphasizing the close interchange between surface and groundwater in this area. These water types exhibit low mineralization levels, and the hydrochemical composition of groundwater resembles that of surface water. Notably, the TDS concentration in surface water ranged from 32 to 329 mg/L across the study area, while groundwater displayed a wider TDS range of 16 to 368 mg/L (Figure 4).

4.2. Hydrogen and Oxygen Stable Isotopes

In the study area, the stable isotope δD values for surface water ranged from −75.45‰ to −37.36‰, with a mean value of −46.52‰. The deuterium excess (D-excess) values ranged from 0.41‰ to 25.79‰, with a mean value of 12.47‰. Additionally, the stable isotope δ18O values for surface water ranged from −10.89‰ to −5.89‰, with a mean value of −7.37‰ (Table 2). The stable isotope δD values of groundwater ranged from −57.08‰ to −28.99‰, with a mean value of −39.45‰ (Table 2). The stable isotope δ18O values for groundwater ranged from −8.94‰ to −4.25‰, with a mean value of −6.51‰ (Table 2). It is noteworthy that the surface water and groundwater in the region generally exhibited consistent flow patterns.

5. Discussion

5.1. The Main Control Factors of Hydrochemistry

We conducted a comprehensive analysis of the surface water and groundwater in the research area using the Gibbs diagram depicted in Figure 5. The results revealed a concentration of water sample distribution. Specifically, the ratios of Na+/(Na+ + Ca2+) and Cl/(Cl + HCO3) primarily fell within the range of 0 to 0.4, mainly localized in the central-left region of the graph. This concentration pattern signifies that a significant portion of the water samples was influenced by rock weathering, with the ions mainly originating from the weathering processes affecting the surrounding rocks. The Na+/(Na+ + Ca2+) values of the groundwater sampling points in the upstream, middle, and downstream reaches of Quzhou were distributed between 0.4 and 0.9. These sampling points were scattered in the middle area of the Gibbs map, which may have increased the Na+/(Na+ + Ca2+) values of the sampling sites, and drifted to the middle area of the Gibbs map. The groundwater sampling points were distributed to the left or right of the Gibbs map, mainly depending on the properties of the soil and aquifer media. Generally speaking, the aqueous medium was carbonate mineral, and the Na+/(Na+ + Ca2+) value of the groundwater hydrochemical components was low, while the Na+/(Na+ + Ca2+) value where the aqueous media mainly contained silicate may have been high [22]. The ion sources of surface water and groundwater were basically similar, which further indicates that there was a certain conversion relationship between them.

5.2. Indicative Significance of Stable Isotopes

In the course of the water cycle, a linear relationship is established between δD and δ18O in atmospheric precipitation, a result of the simultaneous fractionation of hydrogen and oxygen isotopes. This study was conducted in September, which aligns with the dry season in the research area and does not have available rainfall data. As a result, this paper relied on atmospheric precipitation isotope data from Lei et al. [23]. The equation for the precipitation line is provided below:
δD = 8.31δ18O + 15.96 (R2 = 0.989, p < 0.005)
Analyzing the atmospheric precipitation line in the Qujiang River Basin revealed that the local meteoric water line (LMWL) displayed a slope of 8.31, surpassing the global meteoric water line (GMWL) with a slope of 8. Furthermore, the deuterium excess in atmospheric precipitation measured 15.96‰, exceeding the 10‰ threshold. The slope and intercept value of the local meteoric water line were larger than the value of the global meteoric water line, which can be attributed to the geographical location of the study area. Situated in the western part of Zhejiang Province, the study area is located approximately 200 km inland from the sea. It experiences a warm and humid climate significantly influenced by the low western Pacific, the South China Sea-Bay of Bengal and the northern water vapor of the south of Eurasia [24,25,26,27,28,29,30].
Based on the δD-δ18O values of the water samples within the research area (as depicted in Figure 6), it is evident that the isotopic data of both groundwater and surface water tend to cluster below the local meteoric water line. This observation suggests that their primary source of replenishment is atmospheric precipitation, and that they have undergone some level of evaporation. Moreover, variations in terrain and topography contribute to differing degrees of evaporation. In specific upstream regions, certain surface water samples lie above the local meteoric water line. This divergence can be attributed to water vapor condensation processes occurring in the mountainous upstream areas, resulting in reduced isotopic values of atmospheric precipitation. The majority of hydrogen and oxygen isotopes are relatively tightly grouped, but significant differences in isotopic composition emerge at select sampling locations. This variation in the isotopic composition of surface water and groundwater is tied to their spatial positions within the watershed, reflecting the interplay and exchange between surface water and groundwater to a certain extent.
The slopes of both the isotopic surface water line (SWL) and the isotopic groundwater line (GWL) are essentially identical. Nevertheless, these slopes are lower than that of the local meteoric water line (LMWL), signifying that the replenishment of surface water and groundwater by atmospheric precipitation has undergone evaporation, thus resulting in alterations in the isotopic composition.

5.3. Interaction between Groundwater and Surface Water

5.3.1. Analysis of TDS Change Rule along the Way

Figure 7 presents a longitudinal examination of the total dissolved solids (TDS) for both surface and groundwater. In the upper reaches, the TDS of groundwater was typically lower than that of the corresponding surface water, suggesting that groundwater primarily contributes to the replenishment of surface water within this region. Conversely, in the midstream to downstream sections, the TDS of the surface water was slightly lower than the TDS of groundwater, indicating that surface water predominantly replenishes groundwater in these areas. TDS, to some extent, mirrors the paths of water runoff and the duration of water retention in the basin’s hydrological cycle. It rises as water dissolves more soluble salts from the surrounding rocks and soil while undergoing ion exchange, assuming that there is no combination with low-conductivity water bodies, the release of gases, or the precipitation of soluble solids. Consequently, by analyzing the spatial distribution pattern of TDS in diverse water bodies, it becomes possible to deduce the flow trajectories of water and infer the dynamics of the recharge and discharge relationships between surface and groundwater within the basin.
A more in-depth examination of the findings revealed that TDS progressively increases in the upper stretches of Chihuai Creek and Majin Creek. This phenomenon can be attributed to the intricate geological structures within the upper regions and the exposure of bedrock across most segments of the river. Consequently, this condition results in an ongoing process of dissolution and ion exchange. As the river approaches the midstream and downstream areas, there is a substantial and swift elevation in TDS. This can be ascribed to the relatively flat riverbed, the proximity to the central sectors of Quzhou city, and the considerable human intervention, all of which culminate in a regional augmentation of TDS. The conspicuous upsurge in groundwater TDS in the midstream and downstream regions, especially in the vicinity of Jiangshan Port and Wuxi River, can primarily be attributed to the presence of red-layered, porous, fractured aquifers. Given the high population density in this area and the significant rates of groundwater extraction, the shift from surface water to groundwater becomes more pronounced. The soluble ions within the red-layered soil easily undergo dissolution, which results in a notable increase in groundwater TDS in this particular region [31,32,33,34,35,36,37].

5.3.2. Analysis of Stable Isotopes Change Rule along the Way

Based on the spatial distribution data of hydrogen and oxygen isotopes within the research area, we observed a notable trend in the δ18O values of surface water in the upstream portion, specifically from the Chi-huai River to the Majin River. These values tended to increase in the direction of the river flow. This rise can be attributed to the ongoing evaporation that occurs during the water’s transportation, resulting in isotopic enrichment. In the middle reaches of the watershed, particularly in the Changshan River section, numerous tributaries converge, contributing surface water with a relatively lower δ18O content. This infusion causes a sudden decline in δ18O values. Nevertheless, the overarching pattern still indicates an enrichment of δ18O values along the course of the river (Figure 8).
The spatial distribution patterns of hydrogen and oxygen isotopes in both the upstream and middle-lower reaches of groundwater within the Qujiang River Basin, as depicted in Figure 8 and Figure 9, indicate a significant interplay between surface water and groundwater in the study area. However, during the exchange process, they are affected by evaporation, resulting in isotopic fluctuations that correspond to the alterations observed in the surface water. This observation suggests that the primary origin of groundwater in this region is recharge from surface water, and there exists a strong hydraulic connection between the two.

5.3.3. Transformational Relationships between Surface Water and Groundwater

Several conspicuous features were observed in the hydrochemical and isotopic compositions of various bodies of water:
(1)
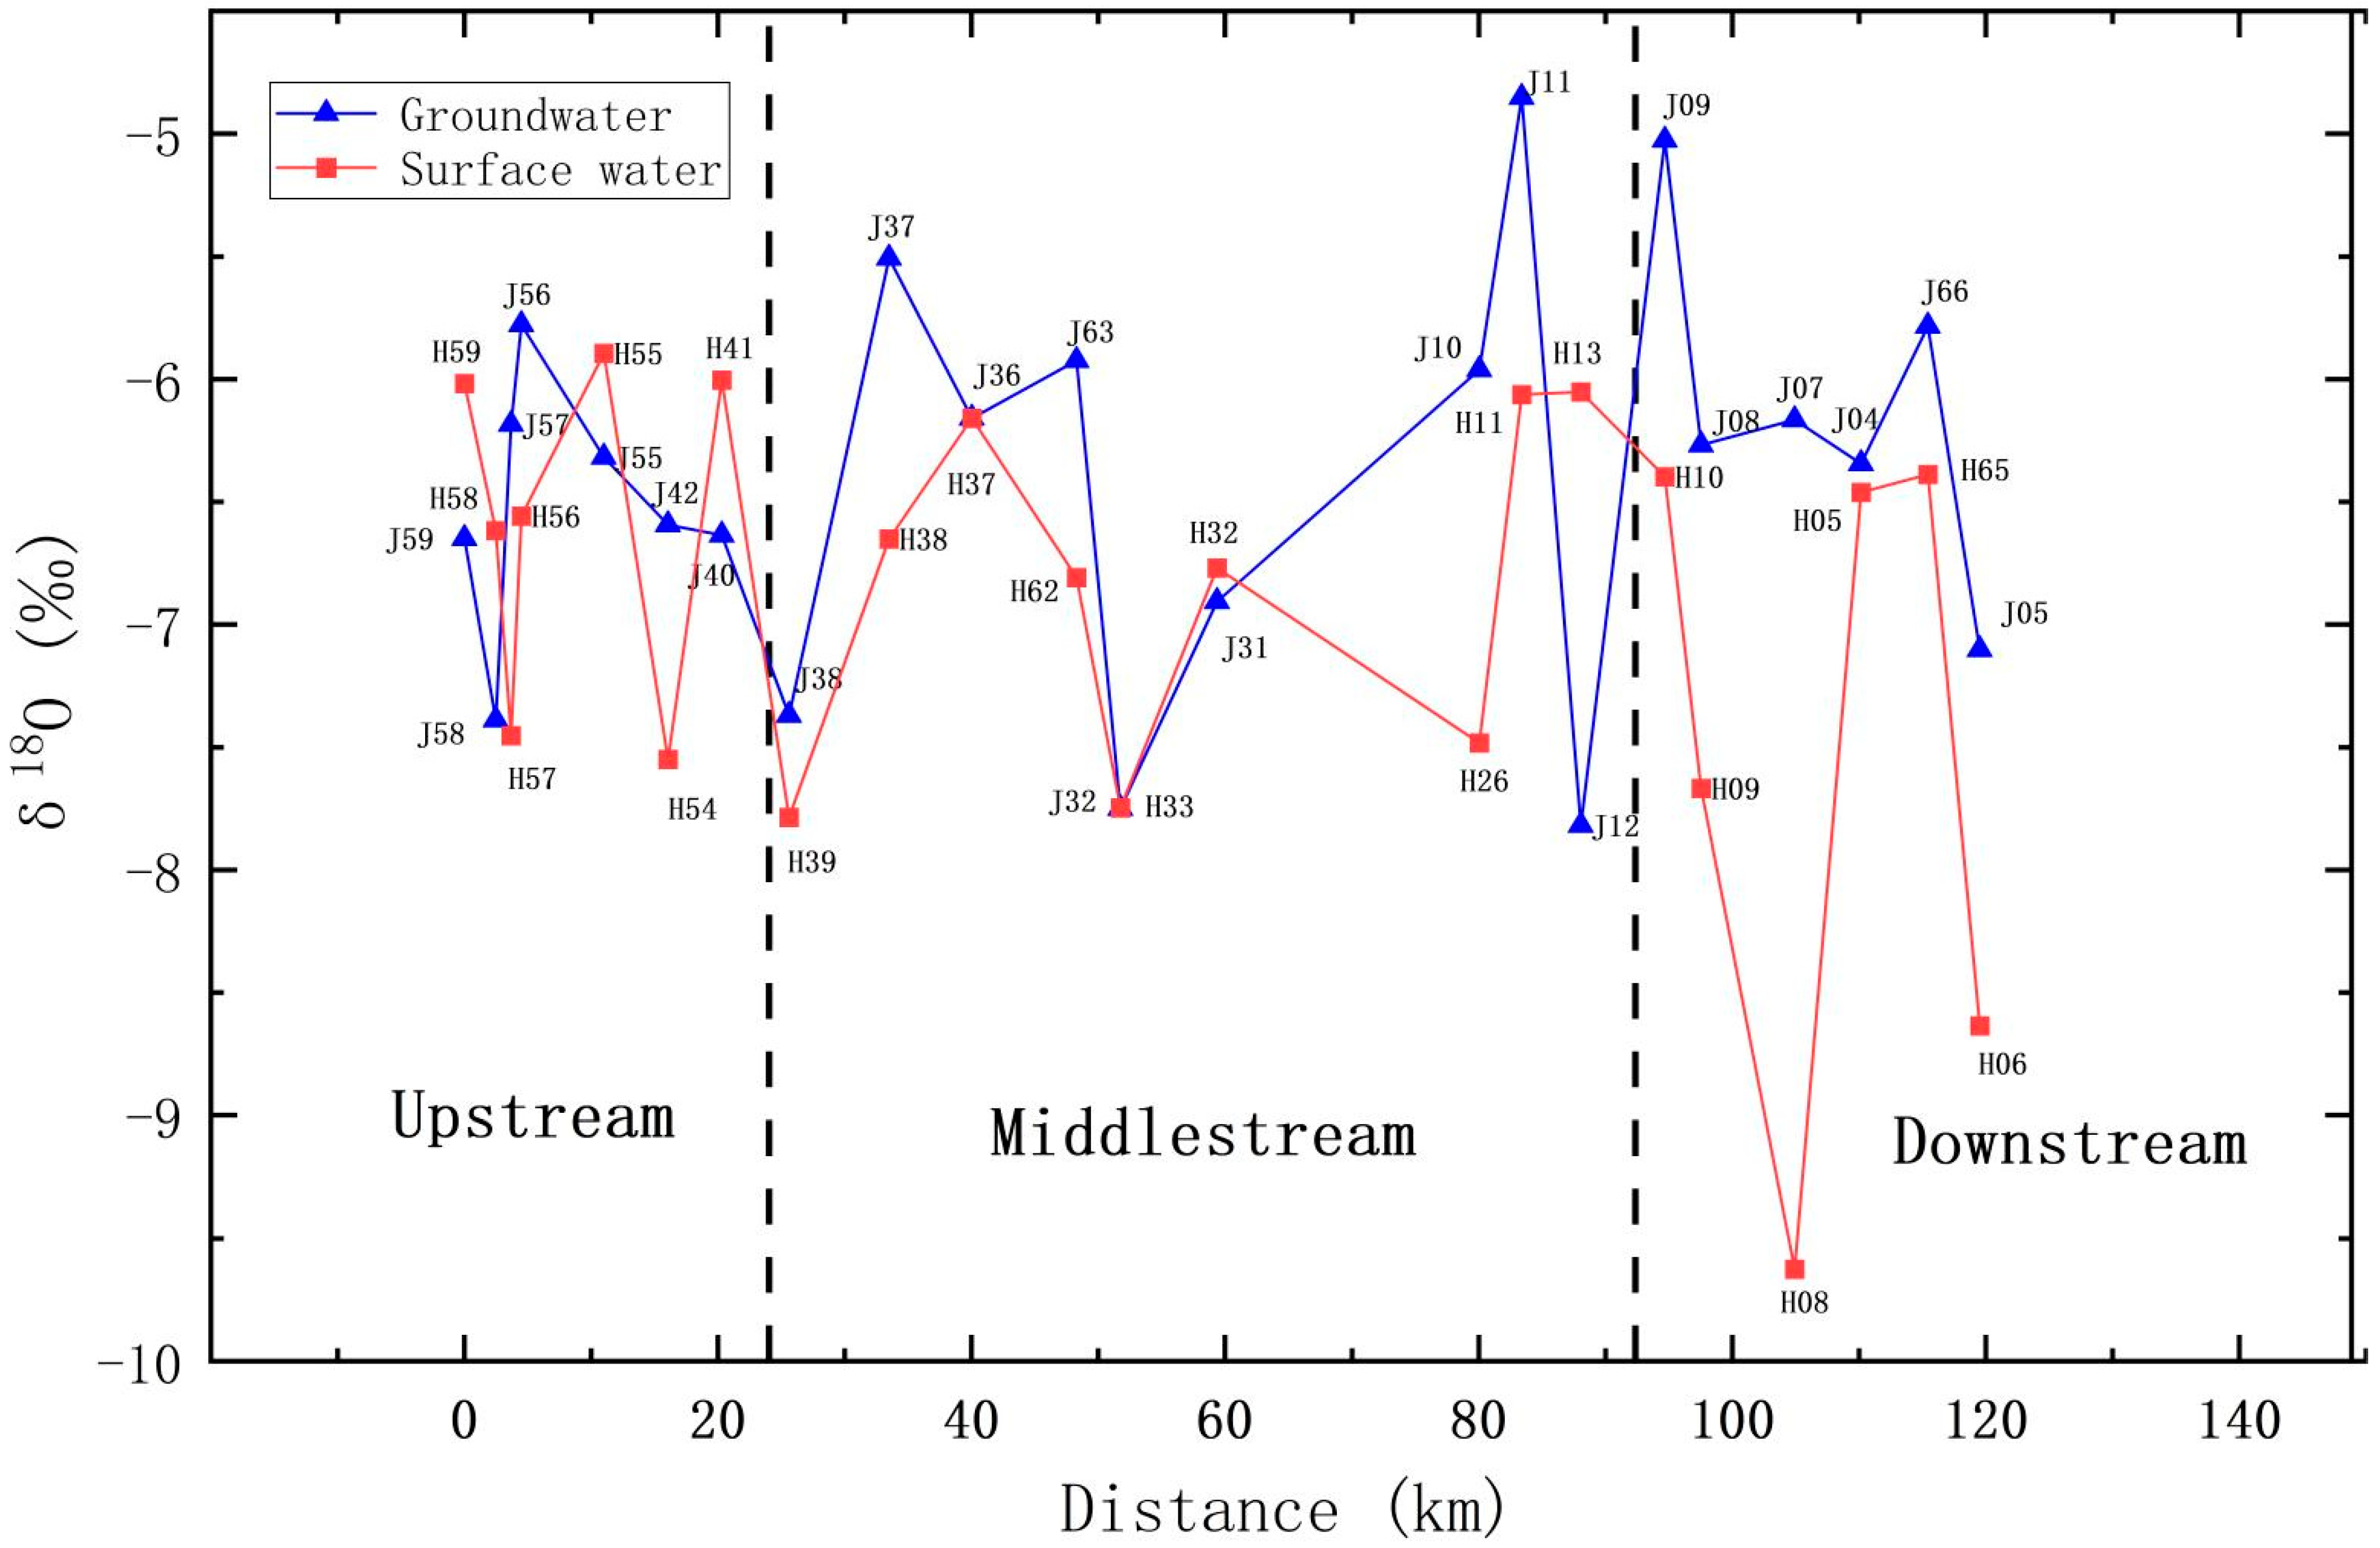
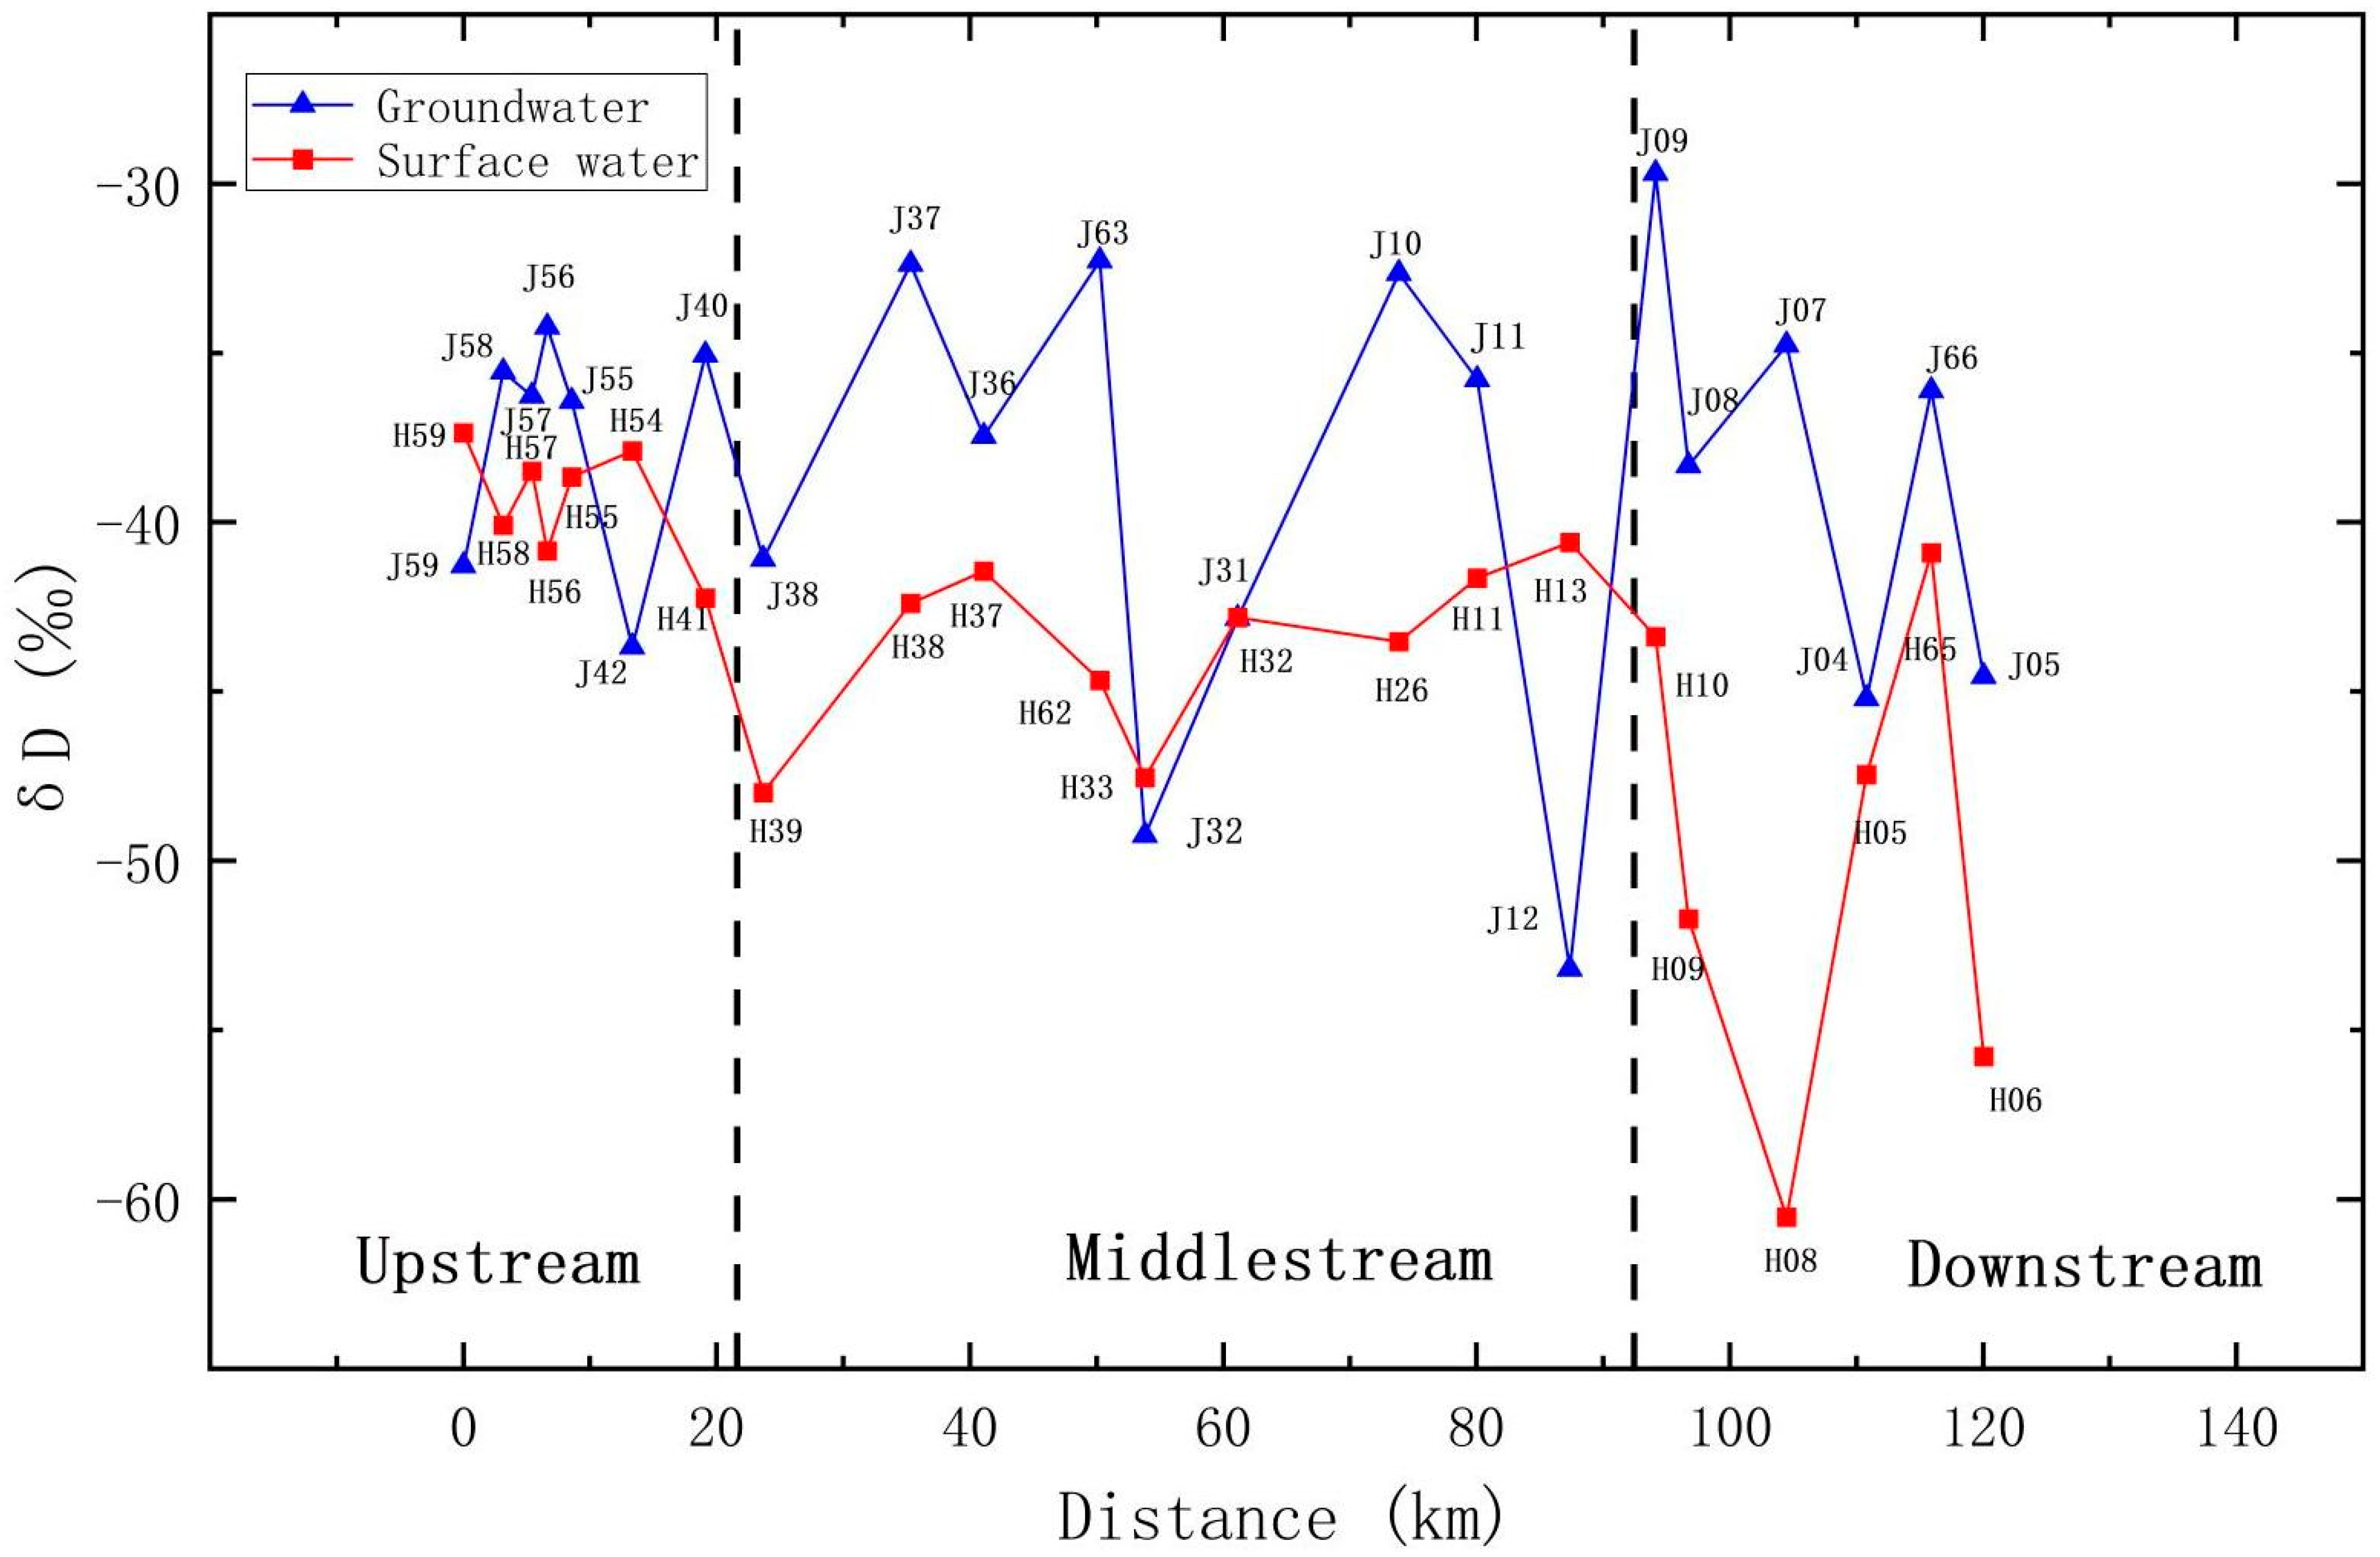
Spatial distribution: The deuterium (D) and oxygen-18 (18O) compositions within groundwater and river water exhibited fluctuations across distinct geographical locations. As one moved from the upstream to the downstream sections of the Qujiang River, the D and 18O values within river water displayed an oscillating pattern. In the middle and lower reaches, which are characterized by flat terrain, the δD and δ18O values were generally lower than in the upstream areas, which are mountainous. Nonetheless, the plain regions exhibited more pronounced variations. In general, the δD and δ18O values of the groundwater and surface water gradually decreased along the river from the upper reaches to the middle and lower reaches. This suggests frequent water exchanges between groundwater in the middle and lower reaches and river water, implying a close hydrological connection and favorable conditions for groundwater recharge and runoff.
(2)
Water body comparison: While both river water and groundwater manifested fluctuating trends in D and 18O along their flow paths, the δD and δ18O values, along with their averages, in groundwater were typically higher than those in river water in most areas. This indicates that the primary source of groundwater is the infiltration of atmospheric precipitation.
Upon analyzing the hydrochemical and isotopic characteristics of surface water and groundwater in the study area, notable spatial variations in their attributes from the upstream to downstream of the Qujiang River were observed. By employing total dissolved solids (TDS) and stable hydrogen and oxygen isotopes (δD and δ18O) as tracers, as well as referencing specific figures (TDS and D-18O charts), we were able to deduce the transformational relationship between river water and groundwater from upstream to downstream:
(1)
Upstream of Qujiang: In the upstream region, the TDS, δD, and δ18O values in groundwater exhibited fluctuations, indicating diverse recharge sources and circulation processes in different regions. For instance, at the J56 sampling point, groundwater’s TDS value diminished rapidly, while river water’s TDS exhibited a declining trend. Groundwater’s δD and δ18O values were enriched and higher than those of river water, implying that groundwater in this area primarily receives recharge from atmospheric precipitation and river infiltration. Conversely, at the J42 sampling point, groundwater’s TDS value rose rapidly, while river water’s TDS remained relatively stable. Groundwater’s δD and δ18O values depicted a swift depletion trend, suggesting that groundwater in this area primarily receives lateral flow recharge from depleted groundwater, with a weak hydrological connection to the river.
(2)
Midstream of Qujiang: In the midstream area, groundwater’s TDS, δD, and δ18O values fluctuated, exhibiting more significant variations compared to the upstream. This indicates diverse recharge sources in different midstream regions, along with a more complex hydrological connection to other water bodies and potential human interference. For example, at the J37 sampling point, groundwater’s TDS value varied slightly, and the δD and δ18O values were enriched and higher than those of river water, indicating a transformational relationship between groundwater and river water. Groundwater in this area might be influenced by groundwater extraction and human activities. In contrast, at the J32 sampling point, groundwater’s TDS value continually rose, while river water’s TDS decreased. Groundwater’s δD and δ18O values depicted a rapid depletion trend closely resembling those of river water, implying that the groundwater in this area receives recharge from the river.
Other sampling points: Various sampling points displayed distinct patterns. For instance, at the J11 sampling point, groundwater’s TDS value surpassed that of river water, and the δ18O value became rapidly enriched, with δD and δ18O values significantly higher than those of river water. This suggests that the groundwater in this area receives recharge from atmospheric precipitation and river water. At the J12 sampling point, groundwater’s TDS value steadily decreased and the δD and δ18O values exhibited rapid depletion trends, implying that groundwater discharges into the river and might receive recharge from more depleted lateral flow. At the J9 sampling point, groundwater’s TDS value marginally increased and the δD and δ18O values became rapidly enriched, indicating that the groundwater in this area primarily receives recharge from atmospheric precipitation and river water. Finally, at the J4 sampling point, groundwater’s TDS value exceeded that of the river water, while the δD and δ18O values showed a depletion trend, implying that the groundwater in this area receives lateral flow recharge.

5.3.4. Calculation of Conversion Rate between Groundwater and Surface Water

We calculated the contribution percentage of river water to groundwater at each measurement point (Table 3).
The contribution percentages of the Huai River and Majin River in the upstream study area exceeded 100%, indicating that these areas primarily receive groundwater supply for surface water. On the contrary, when contemplating their inverses, the proportions of groundwater’s contributions to surface water in the Huai River and Majin River segments totaled 19.97% and 19.36%, correspondingly. In contrast, in other segments, the surface water predominantly supplied the groundwater. Among these, the Jiangshangang River section displayed the lowest surface water contribution to groundwater. This circumstance arose from the considerable presence of extensive factories in this locale, causing diminished flow velocities within this river section and a protracted exchange between surface water and groundwater.
Table 3 reveals that the surface water contribution rate to groundwater in the Changshan River section reached a notable 40.96%. This primarily occurred because the Changshan River originates from the confluence of the Huai River and the Majin River in the upstream region. However, it is important to note that Formula (3) only considers the Huai River section, and determining the percentage from a mixed source necessitates additional tracers, such as the analysis of another isotope or the hydrochemical ions in the water. In this study, Formula (4) was employed for calculation based on the hydrogen isotope (δD) using a three-phase mixing approach. In this context, Cc denotes the hydrogen isotope value in the water sample from the upstream of the Changshan River in the Huai River, whereas Cm represents the hydrogen isotope value in the water sample from upstream of the Changshan River, in the Majin River. By substituting the hydrogen isotope values into Formula (4), the actual conversion rate of the surface water to the groundwater in the Changshan River was determined to be 25.18%, significantly lower than the initially calculated 40.96% based on the two-phase mixing approach.
Through utilization of the conversion rate of surface water to groundwater, in conjunction with the measured cross-sectional flow rates of each river section (as denoted by Qs in Table 1) and Formulas (3) and (4) [28,29,35,36,37],we further calculated the conversion volume between the Qu River Basin and the surrounding groundwater. The computed outcomes reveal that the mean contribution rate of groundwater from the upstream to surface water in the Qu River Basin is 19.7%, along with a daily replenishment volume of 2.73 × 10⁶ m3/d. Additionally, the average contribution rate of the surface water to the groundwater in the middle and lower reached 22.77%, with a daily replenishment volume of 3.49 × 10⁶ m3/d.

6. Conclusions

(1)
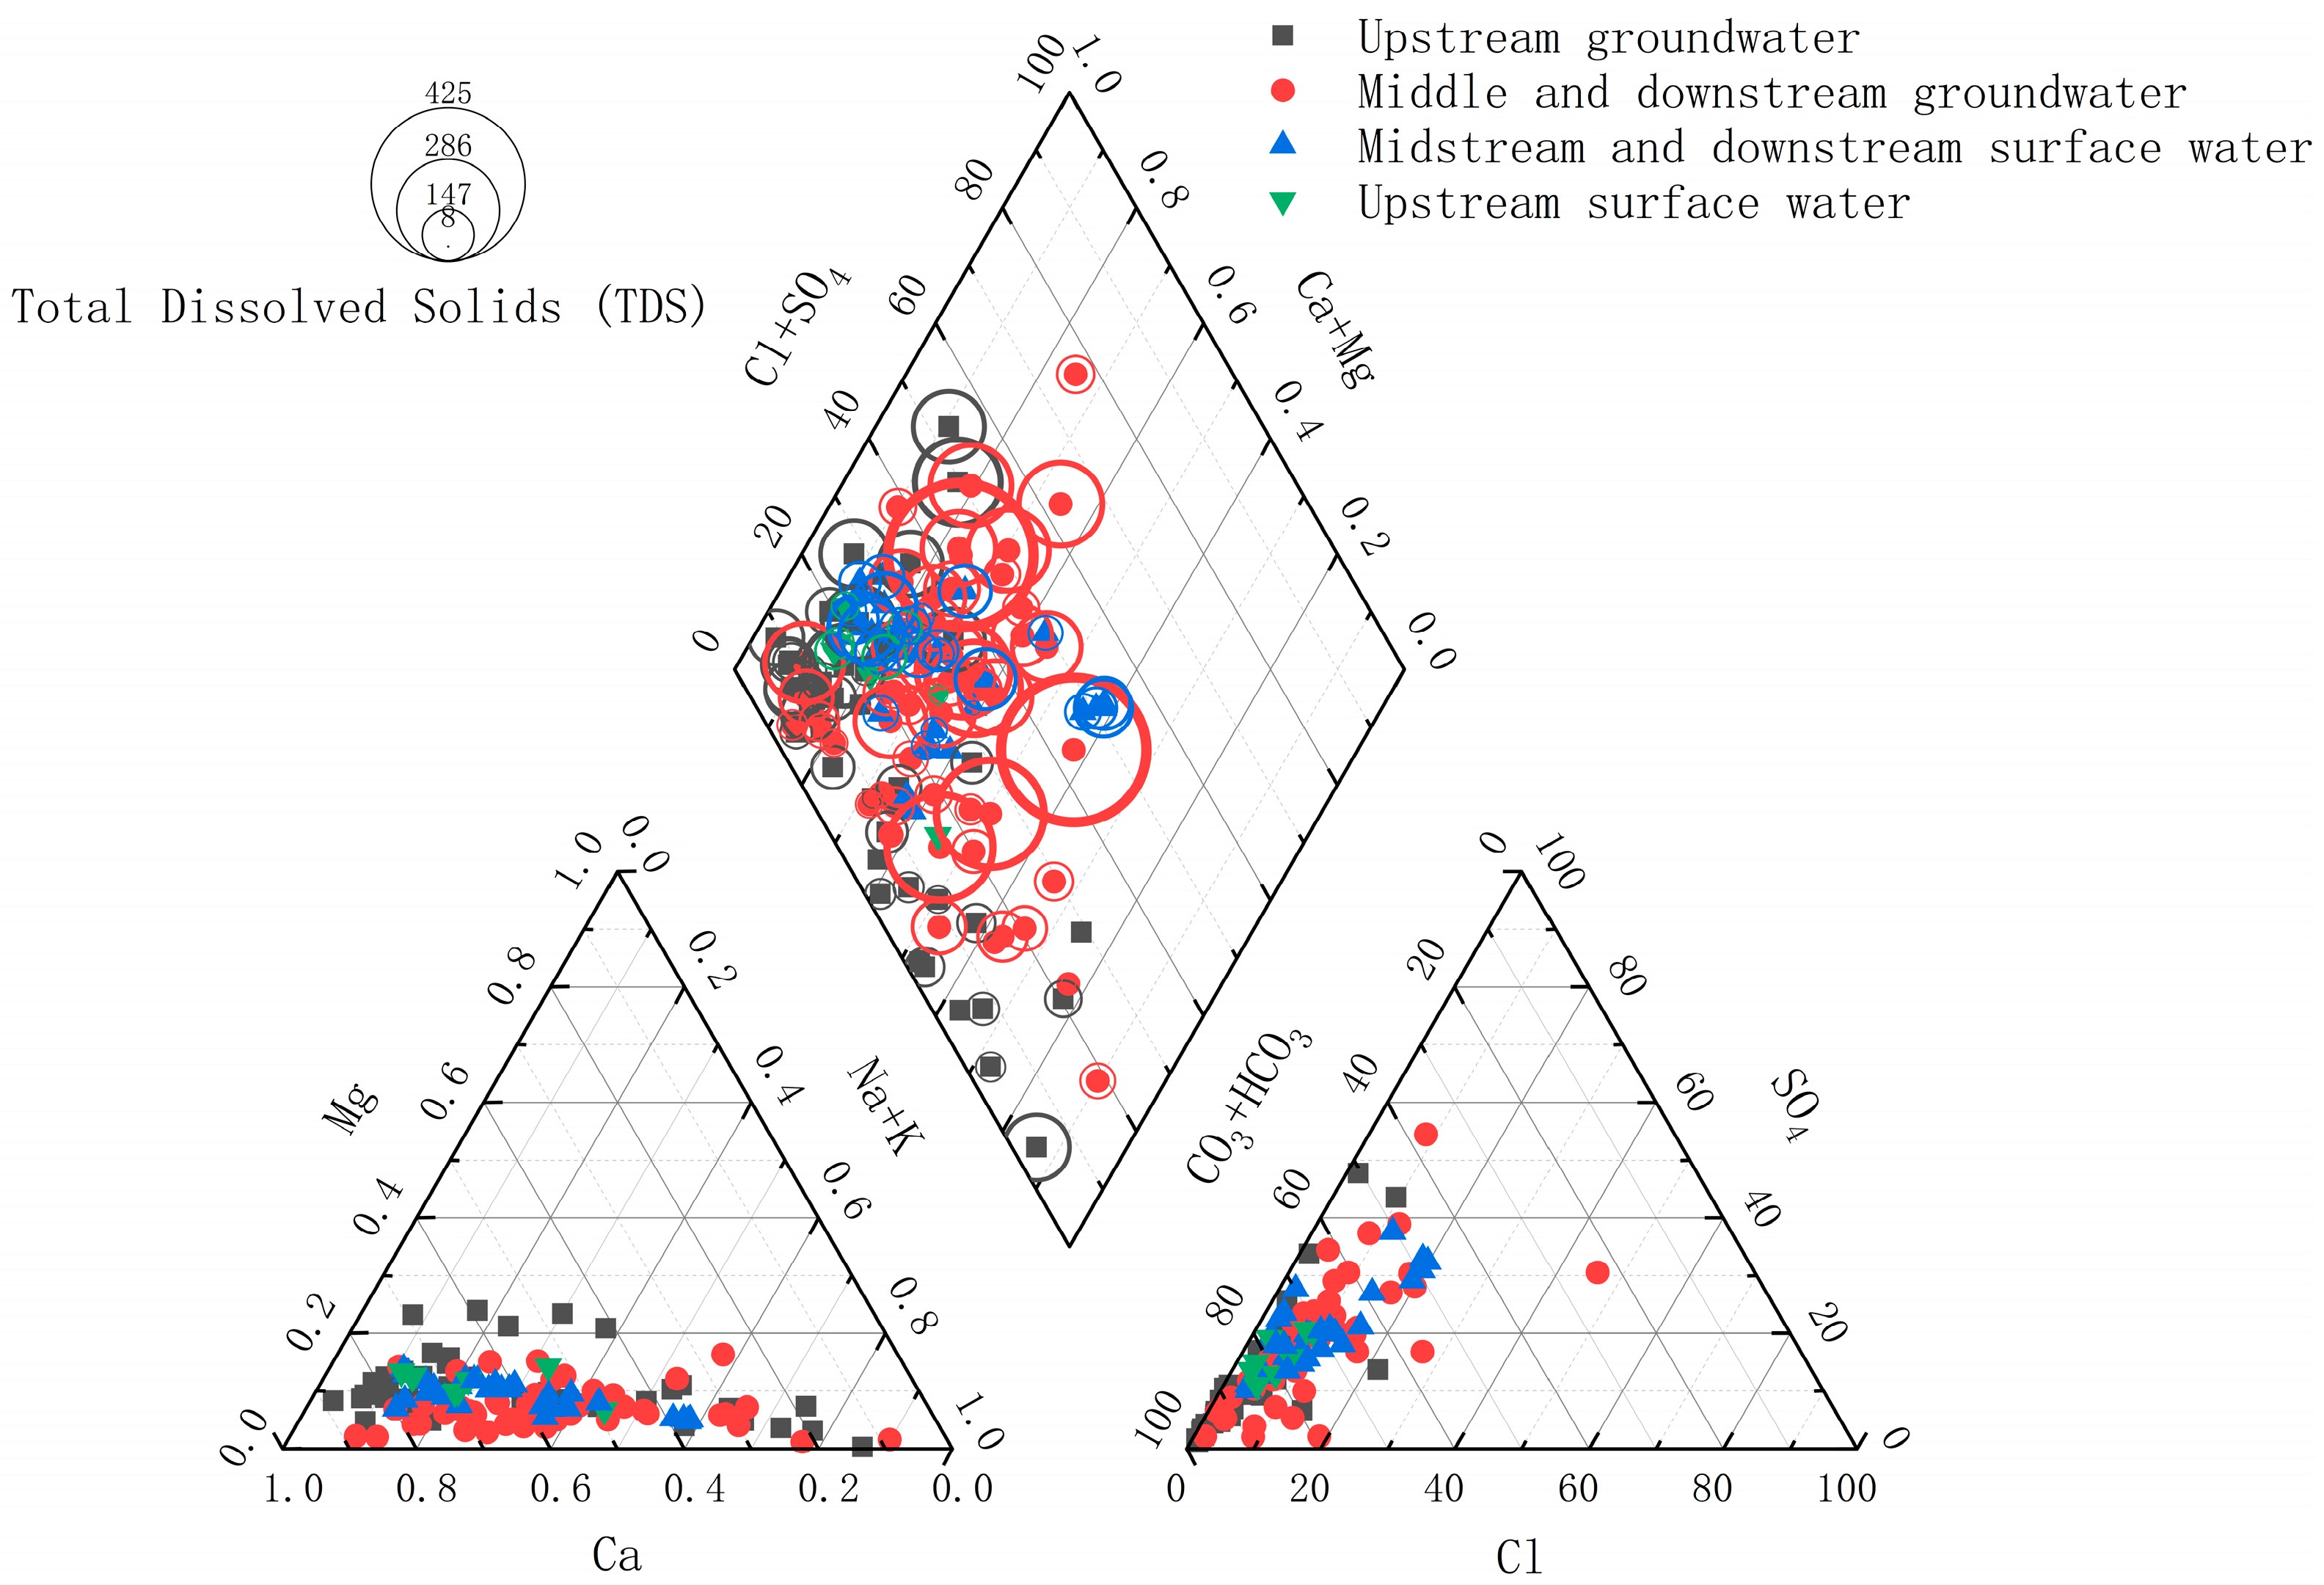
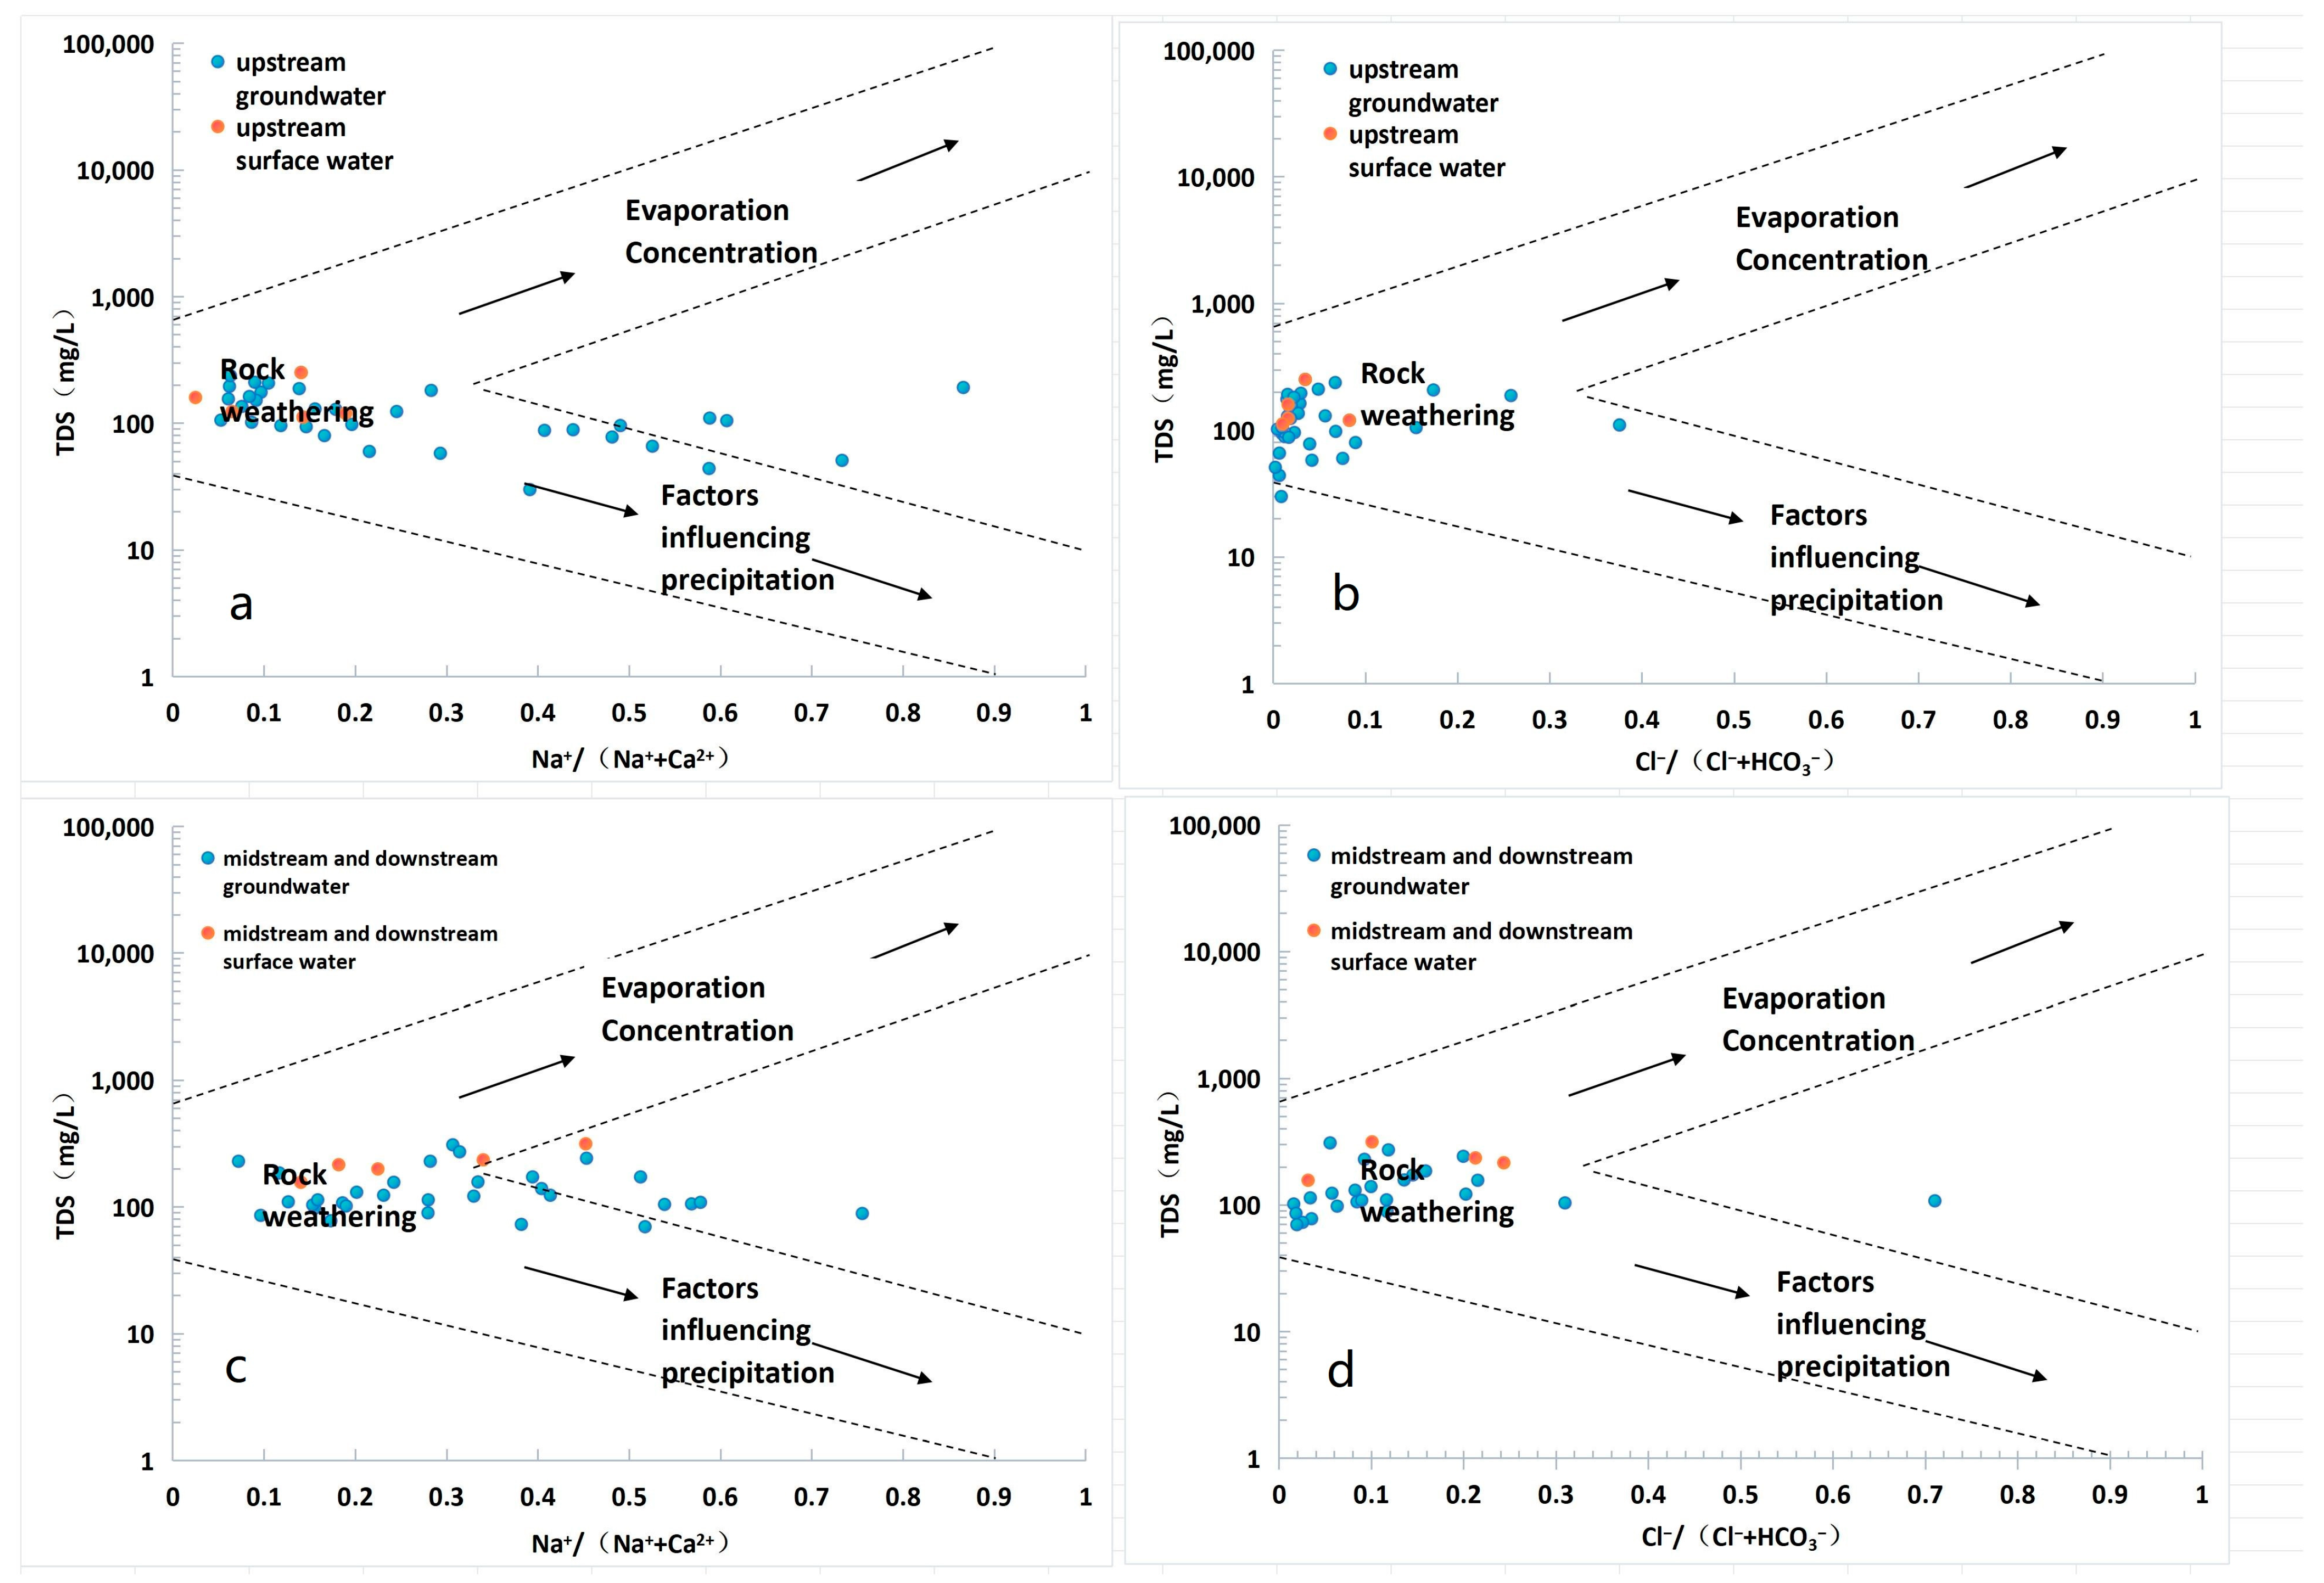
Hydrochemical characteristics: The examination of spatial distribution patterns and hydrochemical attributes demonstrated that the water quality within the research area is predominantly slightly alkaline. The principal hydrochemical categories which were identified were Ca-HCO3 and Ca-HCO3·Cl. These waters manifest low mineralization levels, signifying that atmospheric precipitation serves as the principal source of water in the basin. The resemblance in hydrochemical types between the surface water and groundwater implies a certain hydraulic connection between these two components. The Gibbs diagram suggests that ion concentrations are primarily influenced by rock weathering, with the additional influence of precipitation factors in the upstream river sections. The spatial distribution patterns of TDS and pH indicators demonstrated similar variations in both surface water and groundwater, indicating frequent exchange between them. In particular, groundwater mainly recharged surface water in the upstream area, whereas surface water primarily replenished groundwater in the middle and downstream areas.
(2)
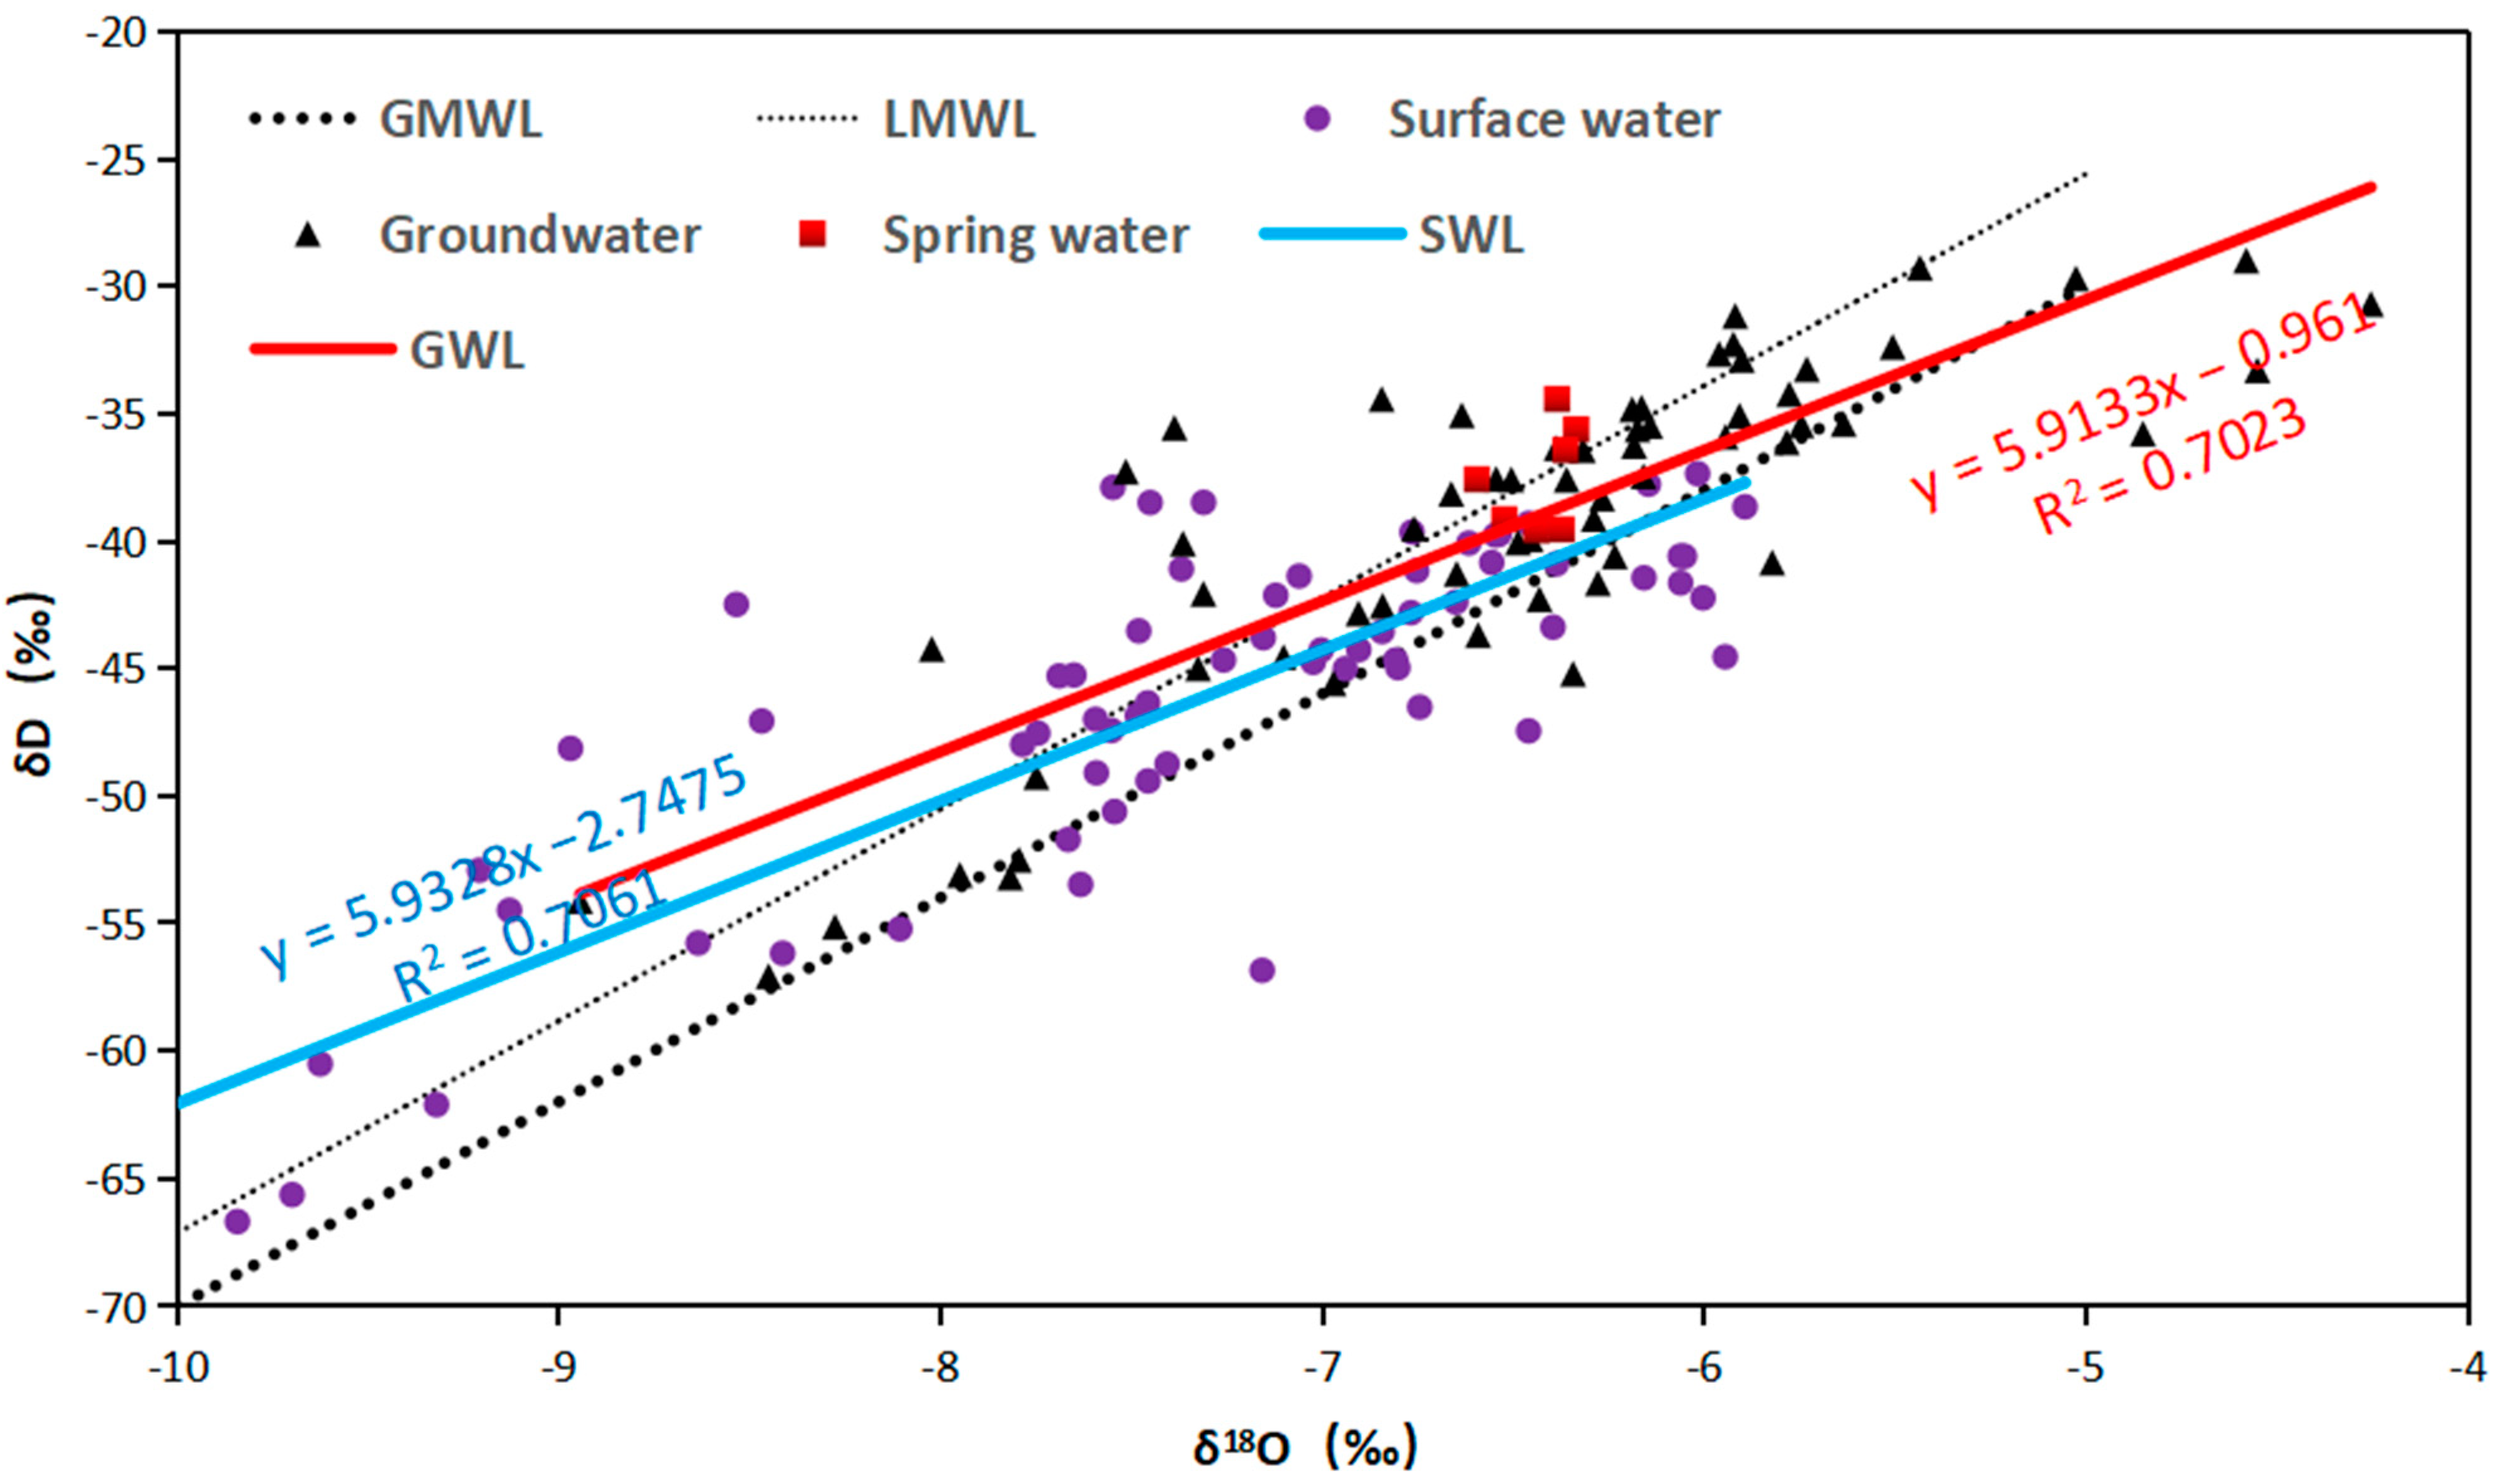
Isotopic characteristics: Spatial distribution patterns and characteristics of stable hydrogen and oxygen isotopes show that the isotopic content increases along the flow direction in the upper reaches, particularly in areas with fewer tributaries. Furthermore, an elevation effect of −0.15‰/100 m for oxygen isotopes was established through the correlation between the elevation of upstream springs and δ18O values. The connection between hydrogen and oxygen isotopes and the atmospheric water line further corroborates that both groundwater and surface water in the study area are recharged by atmospheric precipitation and influenced by evaporation during the mutual replenishment process.
(3)
Contribution of surface water to groundwater: By utilizing the mass conservation equation for δ18O in water transformation, the quantitative calculation of the contribution rate of surface water to groundwater offered insights into the transformation dynamics between these two elements. The results indicate that in the upstream region of the study area, groundwater primarily recharges surface water, with an average contribution rate of 19.67% and a daily replenishment volume of 2.73 × 10⁶ m3/d. Conversely, in the middle and downstream regions, surface water predominantly recharges groundwater, with an average contribution rate of 22.77% and a daily replenishment volume of 3.49 × 10⁶ m3/d.

Author Contributions

Y.L. drafted the manuscript and created figures and visualizations. C.Z. formulated and selected appropriate research methods. J.J. managed the project. Y.Z. processed the data and conducted result analysis. G.W. contributed to the writing of the initial draft and investigation. L.X. participated in data collection and investigation. Z.Q. revised the manuscript. All authors have read and agreed to the published version of the manuscript.

Funding

This study was supported by Central Universities’ Basic Research and Operation Fund for Young Teachers’ Support Program (ZY20160209) and Geological Survey Project (DD20190216).

Data Availability Statement

Data are contained within the article.

Conflicts of Interest

The authors declare no conflict of interest.

References

  1. Zhang, B.; Song, X.; Zhang, Y.; Han, D.; Tang, C.; Yu, Y.; Ma, Y. Hydrochemical characteristics and water quality assessment of surface water and groundwater in Songnen plain, Northeast China. Water Res. 2012, 46, 2737–2748. [Google Scholar] [CrossRef] [PubMed]
  2. Lasagna, M.; De Luca, D.A.; Franchino, E. Nitrate contamination of groundwater in the western Po Plain (Italy): The effects of groundwater and surface water interactions. Environ. Earth Sci. 2016, 75. [Google Scholar] [CrossRef]
  3. Kanduc, T.; Grassa, F.; McIntosh, J.; Stibilj, V.; Ulrich-Supovec, M.; Supovec, I.; Jamnikar, S. A geochemical and stable isotope investigation of groundwater/surface-water interactions in the Velenje Basin, Slovenia. Hydrogeol. J. 2014, 22, 971. [Google Scholar] [CrossRef]
  4. Tsuchihara, T.; Yoshimoto, S.; Shirahata, K.; Ishida, S. 17O-excess and stable isotope compositions of rainwater, surface water and groundwater in paddy areas in Ibaraki, Japan. IDRE J. 2016, 84, 185–194. [Google Scholar]
  5. Han, Z.; Zhang, Y.; Wang, H.; Jiao, R.; Liang, W.; Ji, G. Characteristics of stable isotopes in precipitation, surface water and groundwater in the arid and semi-arid desertification steppe: A case study in the Darhan Maomingan Joint Banner. Sci. Technol. Eng. 2020, 20, 11463–11471. [Google Scholar]
  6. Zheng, J. Research on identification and quantification methods of groundwater and surface water interaction. J. Anhui Agric. Sci. 2015, 43, 203–205. [Google Scholar] [CrossRef]
  7. Jin, S.; Jiang, J.; Chi, B.; Li, Y.; Han, Q. Analyses of groundwater circulation patterns based on environmental isotopes and hydrochemistry in the Huocheng Plain. Hydrogeol. Eng. Geol. 2016, 43, 43–51. [Google Scholar] [CrossRef]
  8. Wang, H.; Gu, H.; Jiang, J.; Chi, B.; Kong, H. Isotopes, hydrochemical characteristics and genesis of river water in the Yili river basin, Xinjiang. Quat. Sci. 2016, 36, 1383–1392. [Google Scholar] [CrossRef]
  9. Zhang, R. Application of Isotope Method in Hydrogeology; Geology Press: Beijing, China, 1983. [Google Scholar]
  10. Salesse, K.; Dufour, É.; Wurster, C.; Bruzek, J.; Giuliani, R.; Castex, D. Contributions of phenetic relationship and stable isotope analysis (δ13C, δ15N, δ18O) to the study of a mortality crisis in the catacomb of Saints Peter and Marcellinus in Rome (1st–3rd century AD). Am. J. Phys. Anthropol. 2012, 147, 80–311. [Google Scholar] [CrossRef]
  11. Gázquez, F.; Calaforra, J.M.; Evans, N.P.; Hodell, D.A. Using stable isotopes (δ^{18}O and δ$D) of gypsum hydration water to unravel the mode of gypsum speleothem formation in semi-arid caves. In Proceedings of the EGU General Assembly Conference Abstracts, Vienna, Austria, 17–22 April 2016; p. EPSC2016-8911. [Google Scholar]
  12. Midhun, M.; Lekshmy, P.R.; Ramesh, R. Hydrogen and oxygen isotopic compositions of water vapor over the Bay of Bengal during monsoon. Geophys. Res. Lett. 2013, 40, 6324–6328. [Google Scholar] [CrossRef]
  13. Lu, C.; Chen, S.; Jiang, Y.; Shi, J.; Yao, C.; Su, X. Quantitative analysis of riverbank groundwater flow for the Qinhuai River, China, and its influence factors. Hydrol. Process. 2018, 32, 2734–2747. [Google Scholar] [CrossRef]
  14. Niyazi, B.; Khan, A.A.; Masoud, M.; Elfeki, A.; Basahi, J. Variability of the geomorphometric characteristics of Makkah Al-Mukaramah basins in Saudi Arabia and the impact on the hydrologic response. J. Afr. Earth Sci. 2020, 168, 103842. [Google Scholar] [CrossRef]
  15. Tang, X. Transformation of Surface Water and Groundwater in the Plain Area of Liuhe Basin, Liaoning Province. Master’s Thesis, Jilin University, Changchun, China, 2022. [Google Scholar]
  16. Wang, X.; Xu, H.; Yan, J.; Ling, H.; Zhao, X. Study on the transformation of lower Tarim River Water into groundwater based on oxygen isotope (δ18 O). J. Water Resour. Water Eng. 2018, 29, 84–89. [Google Scholar] [CrossRef]
  17. Sun, C. Characteristics of Runoff Components and Water Vapor Sources in Typical Mountainous Areas of Tarim River Basin; University of Chinese Academy of Sciences: Beijing, China, 2015. [Google Scholar]
  18. Shen, Z.; Zhu, W.; Zhong, Z. Foundation of Hydro-Geochemistry; Geological Publishing House: Beijing, China, 1993. [Google Scholar]
  19. Sun, C.; Chen, Y.; Li, W.; Li, X.; Yang, Y. Isotopic time series partitioning of streamflow components under regional climate change in the Urumqi River, northwest China. Hydrol. Sci. J. 2016, 61, 1443–1459. [Google Scholar]
  20. Gu, W. Isotopic Hydrology; Science Press: Beijing, China, 2011. [Google Scholar]
  21. Zhang, Y.; Su, X.; Wang, Q.; Yang, F.; Ren, W.; Zhao, Z. Research on the relationship between surface water and groundwater transformation in the western Plain of Yili River Valley. J. Beijing Normal Univ. Nat. Sci. Ed. 2020, 56, 664–674. [Google Scholar] [CrossRef]
  22. Marandim, A.; Shand, P. Groundwater chemistry and the Gibbs Diagram. Appl. Geochem. 2018, 97, 209–212. [Google Scholar]
  23. Lei, M.; Liu, Y.; Ma, Q.; Zhu, Z.; Zhang, S. Research on water cycle in Jinqu Basin based on isotope technique. Yellow River 2020, 42, 88–92,99. [Google Scholar] [CrossRef]
  24. Bailey, A.; Aemisegger, F.; Villiger, L.; Los, S.A.; Reverdin, G.; Quiñones Meléndez, E.; Acquistapace, C.; Baranowski, D.B.; Böck, T.; Bony, S. Isotopic measurements in water vapor, precipitation, and seawater during EUREC 4 A. Earth Syst. Sci. Data 2023, 15, 465–495. [Google Scholar] [CrossRef]
  25. Tharammal, T.; Bala, G.; Nusbaumer, J.M. Sources of water vapor and their effects on water isotopes in precipitation in the Indian monsoon region: A model-based assessment. Sci. Rep. 2023, 13, 708. [Google Scholar] [CrossRef]
  26. Fang, L.; Gao, R.; Wang, X.; Liu, T. Isotopes-based characterization of precipitation compositions and atmospheric water vapor sources over typical Eurasian steppes in south mongolian Plateau. J. Hydrol. 2022, 615, 128724. [Google Scholar] [CrossRef]
  27. Liu, Y.; Man, W.; Zhou, T.; Peng, D. A tracing study on influence factors of East Asian stable isotopes in atmospheric water vapor. Chin. J. Atmos. Sci. 2023, 47, 616–630. [Google Scholar] [CrossRef]
  28. Sun, J.; Wang, Y.; Yang, L.; Duan, L.; Chu, S.; Zhang, G.; Zhang, B.; Liu, T. Study on the transformation relationship between precipitation, river water, and groundwater in the upper reaches of the Xilin River during the rainy season. Environ. Sci. 2023, 1–16. [Google Scholar] [CrossRef]
  29. Liu, Z.; Yoshimura, K.; Kennedy, C.D.; Wang, X.; Pang, S. Water vapor δD dynamics over China derived from SCIAMACHY satellite measurements. Sci. China Earth Sci. 2014, 57, 813–823. [Google Scholar] [CrossRef]
  30. Zhang, H.; Zhang, X.; Cai, Y.; Sinha, A.; Spötl, C.; Baker, J.; Kathayat, G.; Liu, Z.; Ye, T.; Lu, J.; et al. A data-model comparison pinpoints Holocene spatiotemporal pattern of East Asian summer monsoon. Quat. Sci. Rev. 2021, 261, 106911. [Google Scholar] [CrossRef]
  31. Abd-Elaty, I.; Sallam, G.A.H.; Pugliese, L.; Negm, A.M.; Straface, S.; Scozzari, A.; Ahmed, A. Managing coastal aquifer salinity under sea level rise using rice cultivation recharge for sustainable land cover. J. Hydrol. Reg. Stud. 2023, 48, 101466. [Google Scholar] [CrossRef]
  32. Adjovu, G.E.; Stephen, H.; James, D.; Ahmad, S. Measurement of Total Dissolved Solids and Total Suspended Solids in Water Systems: A Review of the Issues, Conventional, and Remote Sensing Techniques. Remote Sens. 2023, 15, 3534. [Google Scholar] [CrossRef]
  33. Wang, H. Study on the Formation and Evolution of Groundwater in the Changbai Mountain Area under Seasonal Freeze-Thaw Action. Ph.D. Thesis, Jilin University, Changchun, China, 2023. [Google Scholar]
  34. Smail, R.Q.S.; Dişli, E. Assessment and validation of groundwater vulnerability to nitrate and TDS using based on a modified DRASTIC model: A case study in the Erbil Central Sub-Basin, Iraq. Environ. Monit. Assess. 2023, 195, 567. [Google Scholar] [CrossRef]
  35. Zou, J. Study on the Hydrochemical Variation Characteristics and Influencing Factors of Groundwater in a Typical Water Pressure Mining Area in Heilonggang; Hebei University of Engineering: Handan, China, 2022. [Google Scholar]
  36. Han, C.; Wang, Z.; Tian, H.; Niu, Q.; Liu, L.; Zhu, Y.; Ding, L.; Zhao, L.; Zhao, H.; Zhao, C.; et al. Study on the hydrochemical characteristics and genesis of groundwater in Hanzhong Basin. Northwest. Geol. 2023, 56, 263–273. [Google Scholar] [CrossRef]
  37. Yu, J.; Song, X.; Liu, X.; Cong, Y.; Tang, C.; Li, F.; Yasuo, S.; Akihiko, K. A Study of Groundwater Cycle in Yongding River Basin by Using δD, δ18O and Hydrochemical Data. J. Nat. Resour. 2007, 22, 415–423. [Google Scholar] [CrossRef]
Figure 1. The location, topography, landforms, sampling points, and hydrogeological zoning maps of the study area. Figure (a) is the location map of sampling points based on elevation, and Figure (b) is the location map of sampling points based on the distribution of hydrogeological characteristics).
Water 15 03932 g001
Figure 2. Monthly average precipitation over multiple years in the study area.
Water 15 03932 g002
Figure 3. Hydrogeological cross-section of the study area, with (A,B) representing the upper reaches and (C,D) representing the middle and lower reaches.
Water 15 03932 g003aWater 15 03932 g003b
Figure 4. Piper trilinear diagram representing groundwater and surface water in the Qujiang River Basin.
Water 15 03932 g004
Figure 5. The Gibbs diagram illustrates the hydrochemistry of the Qu River basin. In this context, (a,b) correspond to the Gibbs diagrams depicting the hydrochemistry of the groundwater and surface water in the upper reaches of the Qu River basin, while (c,d) represent the Gibbs diagrams of the hydrochemistry of the groundwater and surface water in the middle and lower reaches of the Qu River basin.
Water 15 03932 g005
Figure 6. Hydrogen and oxygen isotope composition.
Water 15 03932 g006
Figure 7. Distribution of TDS in surface water and groundwater in the study area (the number on the map is the point number of the sampling point, and the number gradually decreases from upstream to downstream of the study area; “J” represents groundwater and “H” represents surface water).
Water 15 03932 g007
Figure 8. Variation of δ18O in surface water and groundwater along the course in the study area (the number on the map is the point number of the sampling point, and the number gradually decreases from upstream to downstream of the study area; “J” represents groundwater and “H” represents surface water).
Water 15 03932 g008
Figure 9. Variation of δD in surface water and groundwater along the course in the study area (the number on the map is the point number of the sampling point, and the number gradually decreases from upstream to downstream of the study area; “J” represents groundwater and “H” represents surface water).
Water 15 03932 g009
Table 1. Partial results of water chemical parameters for sampling points.
Hydrochemical IndicatorsLoose Pore Phreatic WaterRed Layer Pore Fissure WaterBedrock Fissure Water
AVGMinMaxSDCovAVGMinMaxSDCovAVGMinMaxSDCov
pH6.335.056.950.460.076.365.126.890.480.085.45.056.010.430.1
F−0.20.050.550.130.640.20.050.550.170.90.530.051.430.641.49
COD1.240.184.631.040.851.350.253.831.040.80.580.181.180.430.9
TDS179.3670426102.010.58148.429827356.380.474.334310224.230.4
NH4+0.230.022.170.52.220.250.021.870.52.120.030.020.040.010.43
N03-N4.280.218.64.791.145.090.213.24.460.911.520.852.760.880.71
N02-N0.0500.440.122.410.07<0.0010.40.131.97<0.001<0.001<0.001<0.001<0.001
total hardness112.944319151.860.47104.2366.619544.030.4438.6715.857.217.180.54
SO42−27.61.9910023.360.8620.383.784513.250.683.552.824.620.770.27
Cl14.861.4567.116.551.1415.171.484912.320.854.582.736.951.760.47
CO32−555<5<5555<5<5555<5<5
HCO3−91.443124343.280.4885.922022250.860.6244.33207522.90.63
Ca34.413.754.412.120.3637.4814.170.116.50.467.41.5818.27.651.27
Mg5.061.1915.33.950.83.021.066.051.730.60.650.131.530.631.18
Zn0.070.020.20.050.640.050.020.080.020.470.020.010.030.010.82
Fe0.070.011.170.233.470.070.010.620.172.70.050.010.120.051.22
Mn0.220.013.140.663.070.020.010.150.041.870.010.010.01<0.01<0.01
K8.041.3335.28.461.076.720.6618.45.160.82.722.153.850.80.36
Na14.042.3249.810.880.798.492.1614.74.190.527.43.1512.73.970.66
Al0.110.041.20.262.320.160.041.490.42.60.210.110.30.070.44
acidity18.018.7127.85.870.3320.058.9143.690.4713.248.1116.73.70.34
alkalinity87.1425.620032.550.3882.4316.818340.720.5242.8316.680.727.430.78
CO216.257.8126.35.530.3517.797.9939.28.060.4711.797.2714.73.240.34
PO43−0.180.011.30.311.780.160.010.450.181.190.030.010.070.031.35
Table 2. Isotopic characteristics of sampling points in the study area.
Type of Water BodyLocationδDδO18
Max.Min.AverageSD.Max.Min.AverageSD.
Surface waterUpstream−37.36−53.48−42.263.99−5.89−7.69−6.920.54
mid and downstream−37.36−75.45−45.517.99−5.95−10.89−7.731.21
GroundwaterUpstream−28.99−53.11−38.395.37−4.58−7.95−6.420.72
mid and downstream−28.99−57.08−39.867.31−4.25−8.95−6.621.02
Table 3. Conversion rate of surface water to groundwater in each reach of the study area.
River SectionQs/m3·s−1Cs/‰Cg/‰Cb/‰f/%
Chihuixi River23.5−6.85−6.31−6.58500.80%
Majin River39.8−7.12−6.57−6.84516.52%
Changshan River56.8−7.24−6.38−7.8340.96%
Jiangshangang River26.3−7.15−6.16−7.248.23%
Wuxi River35.4−7.52−6.74−7.7925.80%
Shangshanxi River18.4−7.72−6.72−8.1328.95%
Qujiang River65.2−7.71−6.57−8.1025.69%
Disclaimer/Publisher’s Note: The statements, opinions and data contained in all publications are solely those of the individual author(s) and contributor(s) and not of MDPI and/or the editor(s). MDPI and/or the editor(s) disclaim responsibility for any injury to people or property resulting from any ideas, methods, instructions or products referred to in the content.

