Article

Enhancing Tank Leaching Efficiency through Electrokinetic Remediation: A Laboratory and Numerical Modeling Study

by
Farnoush Eftekhari
1,2,
Faramarz Doulati Ardejani
1,2,*,
Mehdi Amini
1,
Reza Taherdangkoo
3,* and
Christoph Butscher
3
1
School of Mining Engineering, College of Engineering, University of Tehran, Tehran 1439957131, Iran
2
Mine Environment and Hydrogeology Research Laboratory (MEHR Lab), University of Tehran, Tehran 1439957131, Iran
3
Institute of Geotechnics, TU Bergakademie Freiberg, Gustav-Zeuner-Str. 1, 09599 Freiberg, Germany
*
Authors to whom correspondence should be addressed.
Water 2023, 15(22), 3923; https://doi.org/10.3390/w15223923
Submission received: 22 September 2023 / Revised: 5 November 2023 / Accepted: 9 November 2023 / Published: 10 November 2023

Abstract

:
Electrokinetic remediation is a cost-effective and efficient method that utilizes electrical current to transport ions within the subsurface. This process aims to remediate soil contamination caused by industrial activities, which poses threats to wildlife, water quality, and air quality. To assess the impact of the electrokinetic process on tank leaching efficiency, two electrode configurations were tested: vertical and horizontal arrays. These tests considered variable electrode spacing and different voltages in the soil residue. Additionally, the movement of copper cations from the anode to the cathode under this process was investigated. Results show that the horizontal electrode array is more effective in transporting soil moisture because of its broader contact with the soil. After 20 days of using the electrokinetic method with vertical electrodes, the soil moisture content decreased by 12.28%; with horizontal electrodes, it dropped by 38.4%. Also, the concentration of copper in the soil near the cathode electrode increased from 0.54 to 0.77% after 20 days. The estimated copper ion content in the cathode area after 20 days was between 150 and 350 mol/m3, aligning closely with the measured value of 192.5 mol/m3. These results indicate that the electrokinetic process can significantly enhance copper recovery efficiency in tank leaching processes and curtail environmental side effects. Overall, this study provides valuable insights into the benefits of using the electrokinetic process to remediate leaching residue and improve the efficiency of industrial processes.

1. Introduction

Nasim Mine is a copper mine located in Bardeskan city in the northeastern province of Khorasan-e-Razavi, Iran. The mine features a factory that produces cathode copper and cement copper using tank leaching to extract the copper [1]. However, this process results in a high percentage of moisture retained in the soil, posing environmental concerns and necessitating moisture removal. Metallurgical processes typically involve various techniques to extract valuable materials from ores, with tank leaching being a commonly used method. Tank leaching is a hydrometallurgical technique in which crushed ores are placed in open tanks and stirred by agitators under atmospheric pressure to extract precious metals from the ore at an accelerated rate. This process, also known as a “semi-closed system”, requires tailings impoundments for storing processed materials. If a heap leaching facility is present, the dewatered tailings might be sent to the leach pad for a second round of leaching or return to tank leaching after pressure oxidation or roasting to capture any residual metal [
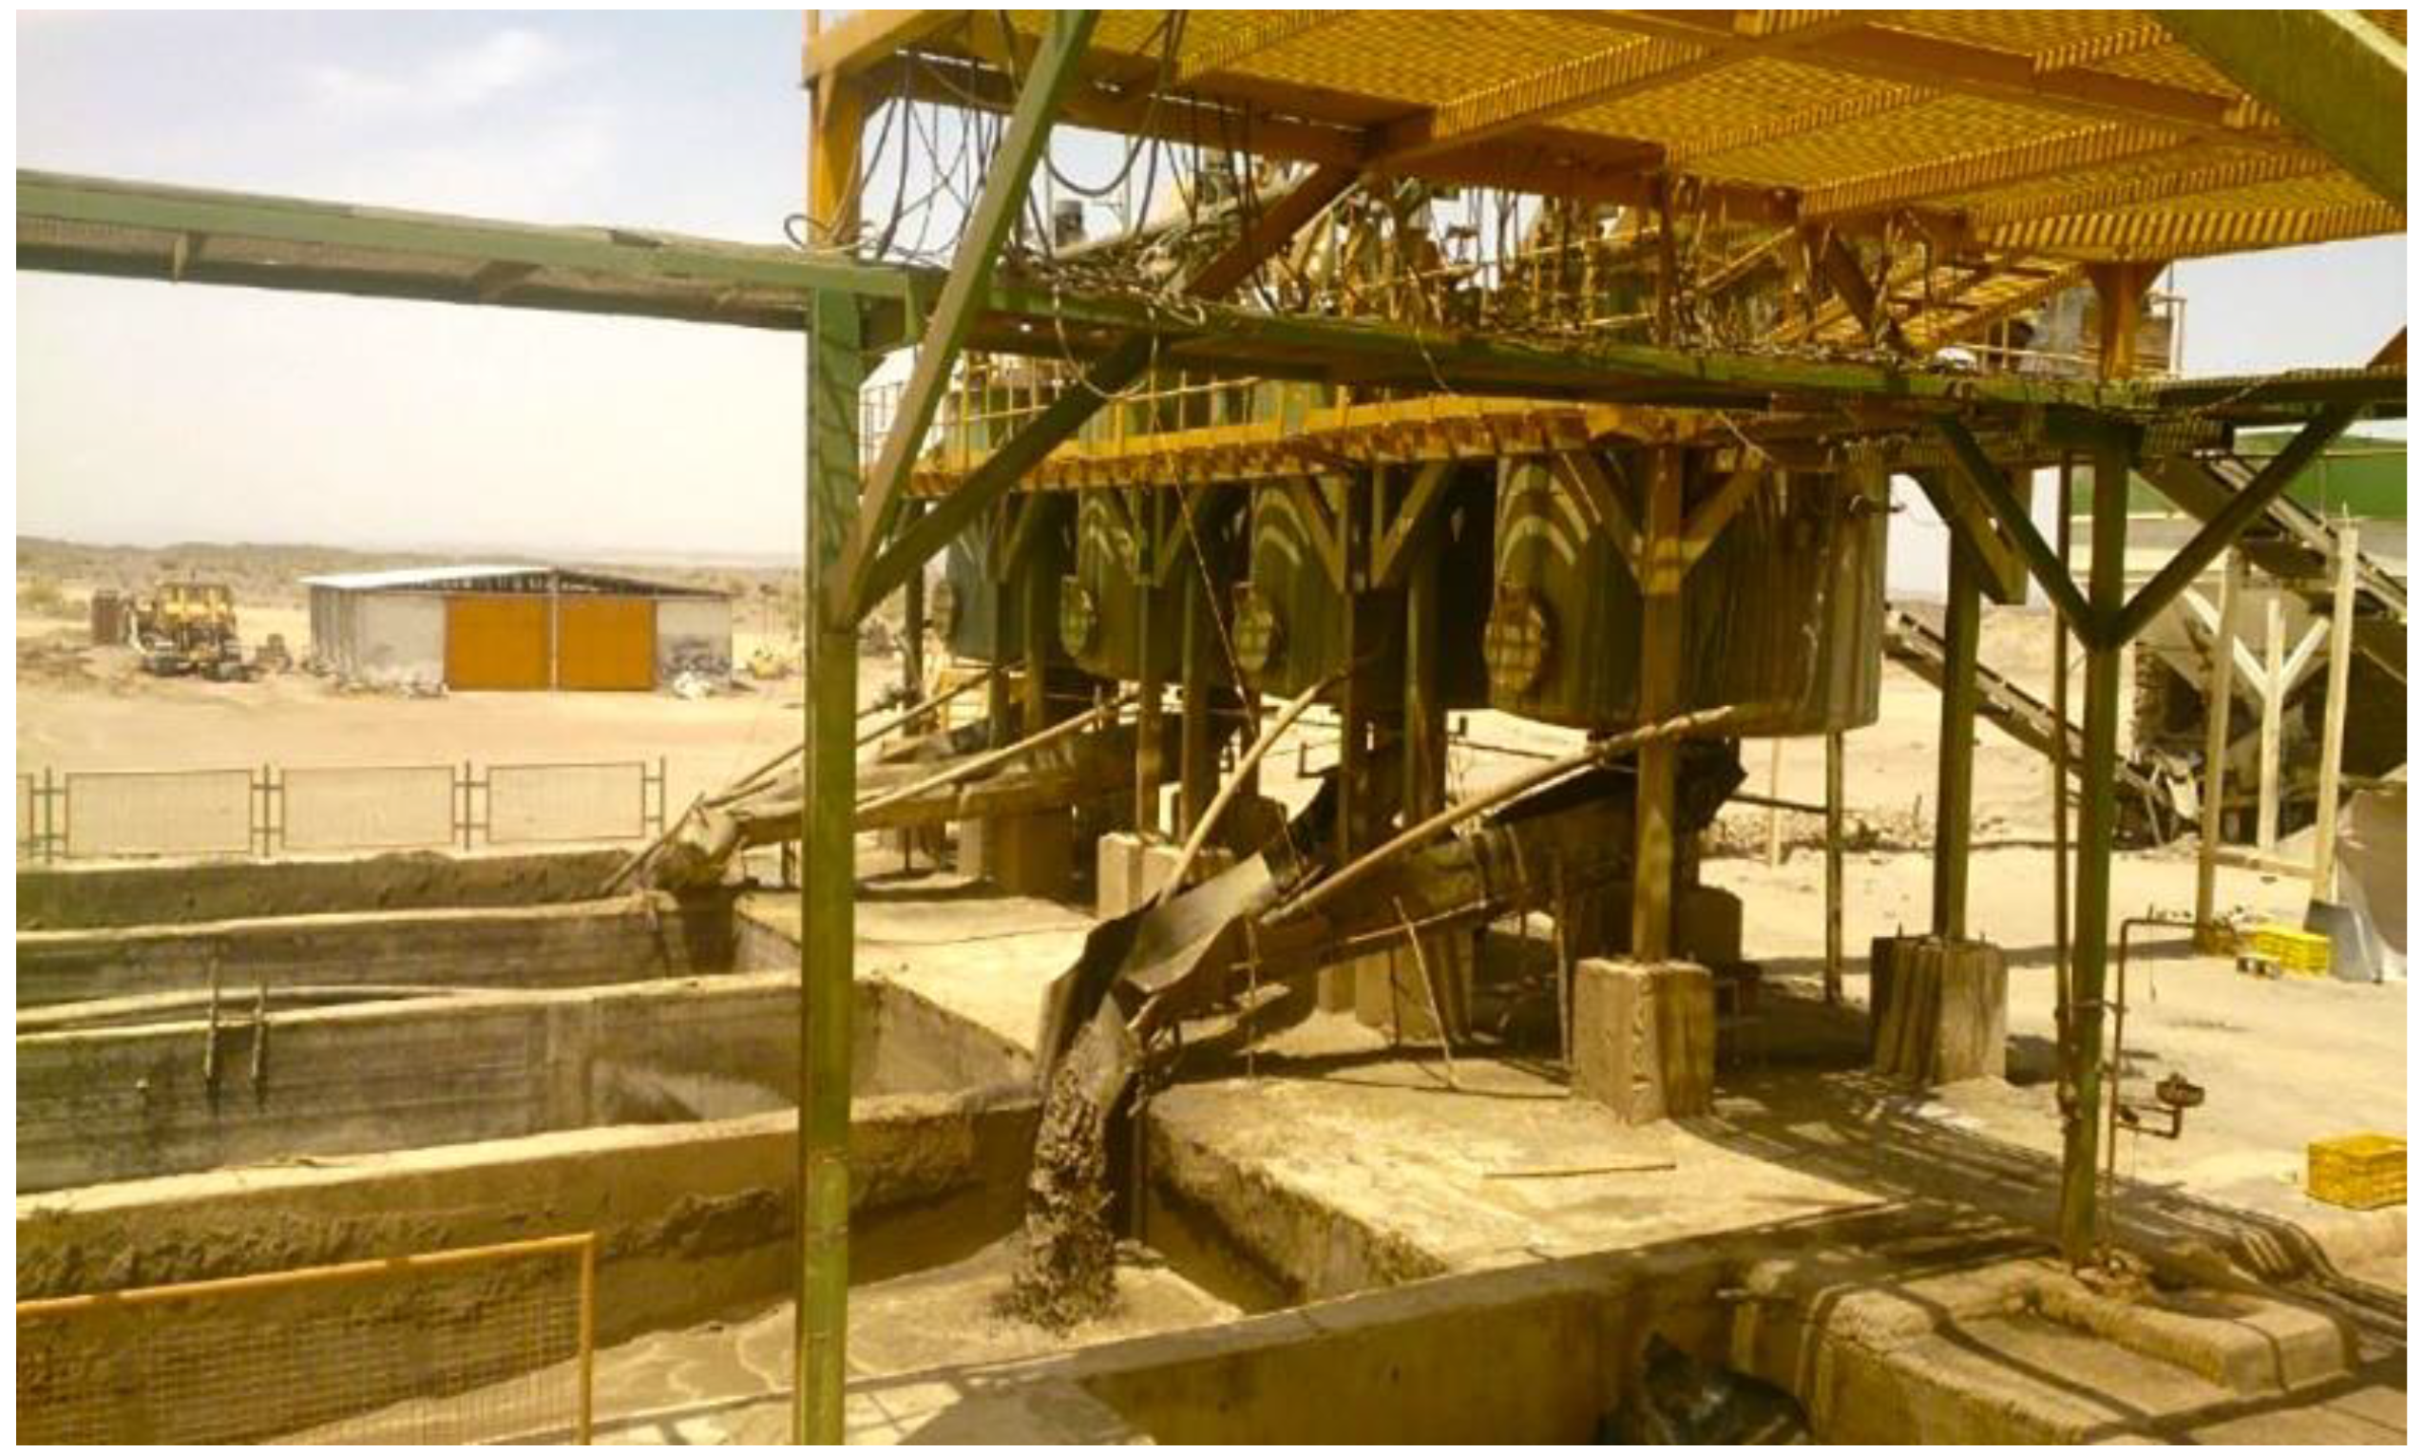
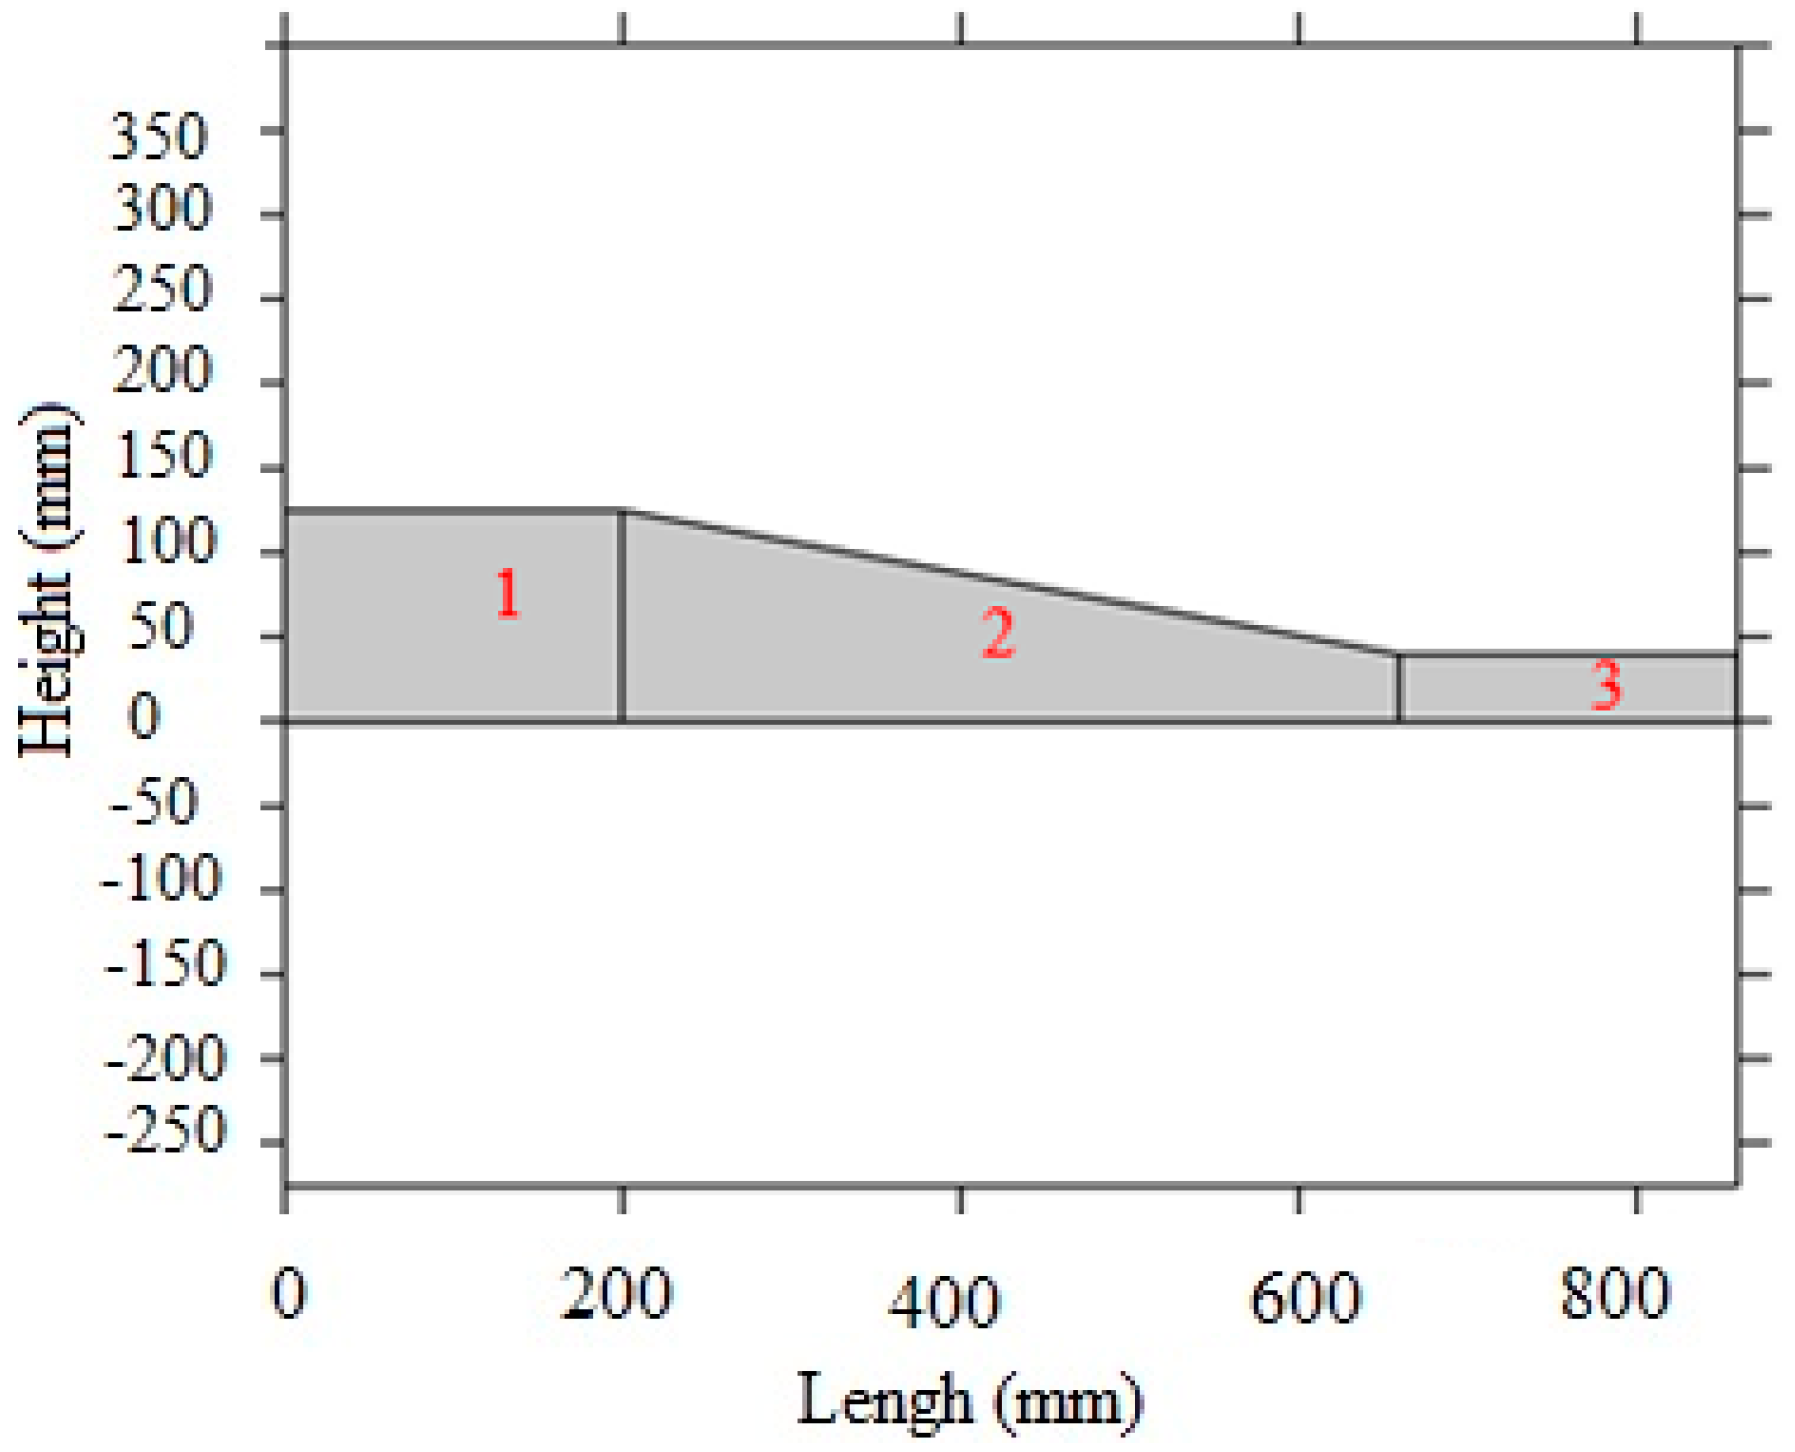
2]. In the tank leaching process, water and sulfuric acid are mixed with soil in tanks according to a specific ratio. The mixture is then drained into ponds with a designated gradient (as shown in Figure 1) to extract the desired metal.
Tank leaching and vat leaching differ in several aspects, including the size of the materials used, the equipment employed, system continuity, and retention time. Vat leaching uses coarser materials than does tank leaching, making size reduction more cost-effective. Tank leaching systems typically involve tanks with agitators and baffles, while vat leaching systems have only agitators. Tank leaching is usually a continuous process, whereas vat leaching can operate either continuously or in batches. However, vat leaching requires a longer retention time to achieve comparable recovery rates of valuable materials [3].
During the leaching process, a significant amount of waste is generated, which includes leaching residue with a high concentration of pore water. This pore water exhibits different behavior compared to ordinary water and can be categorized into free water, interstitial or capillary water, vicinal water, and chemically bound or water of hydration [4,5,6,7,8,9,10]. Dold and Fontboté [11] studied the mineralogy, geochemistry, and microbiology of three mine tailings impoundments and found that all flotation tailings have the potential to produce acid, posing risks to both the environment and groundwater. Consequently, removing excess moisture from these materials is crucial to mitigate environmental hazards. Valenzuela et al. [12] addressed this issue by employing electroosmotic drainage and compared its efficacy to gravity drainage. Through their tests of various electrode configurations, voltage levels, and electrode distances, they found that introducing an electric potential to the solid residue from copper leaching speeds up the drainage process.
Alshawabkeh et al. [13] proposed a method to evaluate the performance of 1-D and 2-D electrokinetic remediation using different electrode configurations. They compared these configurations based on time, energy consumption, and optimal spacings. The electrokinetic phenomena encompass various processes, such as electrophoresis, electroosmosis, diffusiophoresis, capillary osmosis, sedimentation potential, streaming potential/current, colloid vibration current, and electric sonic amplitude [14]. Electroosmotic flow, defined as the flow of a fluid in a porous medium under the influence of an electric field, was explained by Eykholt and Daniel [15]. By applying electric currents and placing electrodes in the system, contaminants can be removed from the soil. Typically, this fluid flow aligns with the direction of the applied electric potential, moving from the anode to the cathode [15]. Zhou et al. [16] reported that by enhancing the electric field strength, water can be more efficiently removed from sludge. They suggested that electro-dewatering could extract both capillary water and free water, while vacuum filtration was only effective in removing free water from the sludge.
Despite the promising advancements in tank leaching, the adoption of electrokinetic techniques is not without its challenges. These include the substantial heterogeneity of the material [17], which can disrupt the uniformity of the electrical field, hindering the technique’s effectiveness. Power consumption due to the continuous electric field application is a significant operational cost, posing a barrier to its broad implementation. Scaling up from laboratory settings to larger, real-world scenarios is another pivotal issue. The degradation and corrosion of electrode materials over time not only reduce the process’s efficiency but also elevate maintenance costs [18]. Additionally, ion migration resulting from the electrical field can create acidic or alkaline conditions at the electrodes, which could affect the process or the electrodes’ structural integrity. The heat generated by electrokinetic methods might lead to evaporation [19], reducing the process’s efficiency and posing risks to equipment. The environmental impact cannot be overlooked, as while electrokinetics may boost leaching efficiency, they might also unintentionally spread contaminants. Hence, future studies on the application of electrokinetic techniques in tank leaching should tackle these challenges to optimize their effectiveness and relevance.
Valenzuela et al. [12] carried out a pilot study employing electroosmotic drainage to treat solid waste from copper leaching. They assessed the process using various electrode configurations, voltage levels, and distances between electrodes. Specifically, they tested three electrode configurations: hexagonal, linear, and alternate linear, alongside two voltage levels (12 V and 24 V). The best results were achieved using the alternate linear electrode configuration at 12 V. Their findings revealed that while electrokinetic processes can expedite the drainage in leaching systems, performance is sensitive to multiple conditions and parameters. Thus, conducting various tests can ascertain the ideal conditions for achieving optimal results.
Electrokinetics is a promising technology for the dewatering and remediation of fine-grained soil. Shafaei et al. [20] investigated the impact of the electrokinetic process on extracting trapped water from the tailings slurry of a copper mine and assessed the effect of the dewatering process on copper remediation. They utilized a one-dimensional cylindrical cell to measure the electroosmotic permeability, which ranged from 1.23 × 10⁻⁹ to 1.36 × 10⁻⁹ m2/V·s. The highest efficiency in water extraction was achieved by applying a voltage gradient of 1 V/cm over a period of 24 h.
Shafaei et al. [18] studied the potential of mechanical–electrical dewatering in recovering water from the tailings slurry of the Miduk copper mine. Their research examined the effects of both voltage levels and mechanical pressures on the dewatering process, with experiments conducted over 120 min. Results revealed that mechanical filtration at pressures of 3 and 6 bars extracted 63 and 71% of the process water, respectively. An increase in the applied voltage led to a higher water recovery rate, underscoring the efficiency of the combined mechanical–electrical dewatering approach. Additionally, the average moisture content of the filtered tailings dropped to between 3.7 and 12.7%, confirming successful dewatering.
Although many previous experimental and modeling studies investigated the transport of electrophobic water and the migration of copper ions in electrokinetic remediation processes from an environmental perspective, the use of electrokinetic systems in increasing metal recovery from ores in hydrometallurgical systems, including heap and tank leaching, has not been fully investigated. Therefore, there is a need to model and conduct experiments incorporating both economic aspects and environmental considerations in order to increase metal extraction and minimize water and soil pollution. In this study, the role of the electrokinetic process in increasing the efficiency of copper recovery in a tank leaching system is evaluated from an economic standpoint, in addition to considering the environmental aspect. Moreover, the model presented here takes into account both hydraulic and electroosmotic flow in the transport of copper ions from the anode to the cathode. This method can be effectively applied in the copper industry, especially in the tank leaching system, which mainly deals with high-grade ores compared to the heap leaching process. Furthermore, the leaching of very low-grade ores may be investigated using this method to increase copper recovery via the electrokinetic process, which is essential for maximizing profitability in mining.
We apply the electrokinetic process to solid waste from tank leaching at the Nasim mine to reduce the moisture content of the solid residue and transport inert copper cations. The high moisture content of these wastes poses an environmental hazard, as they can remain in place for extended periods, leading to acid mine drainage (AMD) with high concentrations of copper and other toxic metals. Furthermore, the residual copper in the waste is not economically viable. Therefore, we conducted three sets of experiments to evaluate drainage efficiency, comparing moisture reduction to natural drainage and modeling the transport of copper cations.

2. Materials and Methods

In the Nasim mine, tanks measuring 3 m in length and 3.5 m in diameter are used for tank leaching. The mixture of soil, water, and sulfuric acid is agitated at a shaking speed of 50 rpm for 45 min before the pulp is drained into the leaching ponds. However, a significant challenge is the high moisture content of the solid residues from copper leaching, which typically remains around 33% even after 30 days. Moreover, a substantial amount of copper cation (5 × 10⁻³ kg/L) remains trapped in the pregnant leach solution (PLS). Investigating the quantity and mechanism of copper transport from the anode to the cathode, as well as studying the extraction of soil pore water, are crucial for both environmental and economic analyses.

2.1. Physical Model Geometry

To accurately replicate the real conditions in the Nasim mine, a plexiglass box with dimensions of 0.25 × 0.40 × 1 m3 was considered as the pulp storage pond, which is open at the top (Figure 2).

2.2. Chemical Materials

The mixing method used was similar to that of the Nasim mine [1], albeit with reduced quantities due to space constraints. In accordance with the tank leaching principles at the Nasim mine, a mixture of 103 kg comprising 75% water and 25% soil is treated with 50 to 60 kg of sulfuric acid. To replicate this procedure, 9 L of sulfuric acid, 16 L of water, and 7.8 kg of sample soil from the mine were combined in a small tank and then transferred to a plexiglass box. As with the ponds at the Nasim mine, a 5% gradient was maintained to aid drainage. The moisture content of the soil was gauged in three sections after one week of natural drainage, as depicted in Figure 3 and Table 1.

2.3. Electrokinetic System

Electric fields applied to a saturated soil medium lead to electrolysis, species transport by ion migration, electroosmosis, and diffusion. During transport, some mass transfer processes, including adsorption, precipitation–dissolution, and other aqueous phase reactions, may occur in the pore fluid [21]. During the electrokinetic process, a number of physicochemical changes in a soil medium can be observed caused by electromigration, electroosmosis, and electrolysis of water molecules. Electro-filtration, as well as fluid flow towards the electrodes, are primarily results of the electroosmosis process [22]. The electroosmosis process reduces the limitations of hydraulic flow in fine-grained materials [23].
The electrokinetic system was applied to the residual solids from the leaching process. Experiments were conducted using two different electrode configurations, horizontal and vertical, with varying distances between the electrodes. Figure 4 displays the schematic of the experimental setup for the electrokinetic process, while the particle size distribution of the material used in all experiments is presented in Figure 5.
Based on the particle size distribution analysis depicted in Figure 5, the soil utilized in the tank leaching process was categorized into three sections: A, B, and C, each with distinct particle sizes. Sections A and B comprised coarse-grained materials, while section C contained fine-grained soil. Fine-grained materials (<200 µm) constituted 18% of section A, 22% of section B, and 95% of section C of the solid matrix. These fine-grained materials tend to retain water.
In the first experiment, electrodes were placed horizontally in the soil with dimensions of 22 × 3.5 cm and a thickness of 1 cm. A voltage of 24 volts was applied to the system with a distance of 60 cm between the electrodes (Figure 6). This resulted in a voltage gradient of 0.4 V/cm in the system, and the current under this voltage was 0.03 A. The electrodes used were made of G10 graphite, and the DC power source was a JPS-302D-II (2 × 0–30 V, 2 × 0–2 A). After 20 days of the electrokinetic process, the entire soil was dried to an acceptable level. The temperature remained constant at around 25 °C throughout the experiment. During the first 24 h of the electrokinetic process, 70 mL of PLS was depleted from the soil. However, there was no further depletion of PLS in the subsequent 7 days. It should be noted that during the initial 7 days of the experiment, electrokinetic treatment was not applied. The parameters measured in the PLS are listed in Table 2. After 48 h of the experiment, the pH was recorded at 4.31, and it increased to 4.74 after 72 h. This indicates a daily rise in pH, which can be attributed to the proximity of the reservoir to the cathode.
In the second test, the electrodes were arranged vertically in the soil (Figure 7). The anodes had a thickness of 1 cm, while the cathodes were 0.5 cm thick. The distance between the anodes and cathodes was 80 cm, and the voltage gradient applied to the system was consistent with the previous test. The soil dried to an acceptable level after 34 days. Subsequently, a test without the electrokinetic process was conducted for comparison with the previous tests (Table 3, Table 4 and Table 5). Figure 7 illustrates the anode and cathode electrodes used in the electrokinetic test with the vertical arrangement. To optimize the electrical conditions for the system, two anode electrodes were connected in series, and three cathode electrodes were also linked in series.

2.4. Copper Cation Transport

To examine the transport of copper cations from the anode to the cathode during the electrokinetic experiment using horizontal electrodes, soil samples were taken from various locations within the soil, including near the anode, cathode, and the middle section. These samples were then ground to a particle size of 75 µm or 200 mesh using a Planetary Ball Mill produced by FRITSCH in Germany. Following this, the copper from these samples was extracted to form a solution. This solution was subsequently analyzed for its copper content using atomic absorption at the geochemistry laboratory of the School of Mining, College of Engineering, University of Tehran. Table 6 and Table 7 present the weight percentage of copper in various soil sections before and after applying the electrokinetic process with horizontal electrodes.
The results indicate that the electrokinetic process can effectively enhance the transport of copper cations from the anode to the cathode in the Nasim mine soil. The movement of this specific ion is clearly visible, which allows for the concentration of the ion in a desired location for targeted use. The results show a decrease in copper concentration in the anode section from 0.56 to 0.35% and an increase in the cathode section from 0.54 to 0.77%, indicating the transfer of copper from the anode to the cathode.

2.5. Modeling

To address the challenge of trapped copper ions in the Nasim mine, a numerical model was developed to simulate the transport of copper cations from the anode to the cathode during the electrokinetic process. The finite element method (FEM) is a popular approach for modeling and simulating problems in solid mechanics, as well as for multi-physics modeling and simulation [24,25,26,27,28]. Previous research has also leveraged numerical modeling to simulate electrokinetic remediation processes [29,30]. In this research, we employed COMSOL Multiphysics, a widely used commercial CFD solver that integrates the finite element method. It is especially suited for tackling coupled phenomena and multi-physics applications [31], making it apt for solving the model’s partial differential equations.

2.5.1. Model Solution

The model presented assumes steady-state velocity and potential fields for a transient simulation of copper ion transport. We assume that the metal ions do not affect the conductivity of the porous medium. We also consider that (1) transport occurs in one dimension, (2) copper is the only metal species present in the pore fluid, which can be transported by both hydraulic and electroosmotic flow, and (3) mass transfer processes such as precipitation, complexation, cation exchange, adsorption, etc. are ignored. The mass transport equation can be written as follows:
c t + . N = 0
where N is the flux vector given by the Nernst–Planck equation [32]:
N = D c z u m F c V + c u
D denotes the tracer’s diffusivity (SI unit: m2/s), c is the concentration (SI unit: mol/m3), z represents the tracer’s charge number, F is the Faraday’s constant (SI unit: C/mol), and u denotes the average linear velocity (SI unit: m/s). The mobility, um (SI unit: mol·m2/(J·s)), is given by the Nernst–Einstein equation:
u m = D R T
where R = 8.314 J/(mol·K) is the gas constant and T (SI unit: °K) denotes the temperature. The boundary conditions for the current-density balance are insulating for all boundaries except the electrode surfaces, where the potential is fixed [31]:
i. n = 0 (all boundaries except the electrodes)
V = V1 (anode surface)
V = 0 (cathode surface)
where i represents the current-density vector (SI unit: A/m2), n is the normal velocity component, and V represents the potential (SI unit: V). The boundary conditions for Equation (1), as the final mass-transport equation, are insulating except at the inlet and the outlet boundaries where flux condition was specified to set the diffusion and advection terms to the flux through the boundaries to zero:
n .   ( D c + c u ) = 0 ( inlet   and   outlet )
n. N = 0 (all other boundaries)
The initial concentration is given by a distribution that is uniform in the y-direction and bell-shaped in the x-direction:
c   ( t = 0 ) = c top   exp   ( 0.5 ( x x m p w 2 )
where ctop denotes the peak concentration, xm represents the position of the peak along the x-axis, and pw equals the base width of the peak [32,33,34].

2.5.2. Simulation of Electrokinetic Process

A two-dimensional (2D) model was built to simulate the electrokinetic process of natural soil from the Nasim mine (Figure 8).
The experimental setup comprised three types of soil particles with different sizes. The dimensions of the electrokinetic reactor in the hypothetical model, depicted in Figure 8, are as follows: Part 1 measures 12.5 × 20 cm; Part 2 has a width of 48 cm and heights of 12.5 cm and 4 cm; Part 3 measures 12.5 × 20 cm. The study utilized andesite as the soil type, with a bulk density of 1.6 gr/cm3 and a water content of 17.73 × 10⁻³, representing realistic conditions. It was postulated that the soil’s deformability under these compaction conditions was negligible. Electrodes were positioned in Parts 1 and 3, with the anode in Part 1 and the cathode in Part 3. The electrodes’ thickness was assumed to be 1 cm, consistent with real-world conditions. Table 8 displays the soil’s hydraulic parameters, with Ø representing porosity, Ρ denoting bulk density, and EC signifying electrical conductivity. Table 9 lists diffusion coefficients and charges for cations such as Cu+2.
Another important parameter considered in the model is the rate of flow transfer. The velocity of the fluid is assumed to be equal in both the x and y axes and is calculated using the following equation [36]:
v = k × i
where v is Darcy’s velocity, k denotes the soil hydraulic conductivity, and i is the hydraulic gradient and is estimated using the following equation:
i = h 1 h 2 L
where h1 is the pressure head at point 1, h2 represents the pressure head at point 2, and L signifies the length of the system’s column. The hydraulic conductivity is calculated from the grain size using the following equation [37]:
k = E   ( C U )   ×   ( d 10 1000 ) 2
where d10 is the particle size for which 10% of the material is finer, and the uniformity coefficient C U is defined as the ratio between d60 and d10:
C U = d 60 d 10
The function E ( C U ) is expressed through the following connections [38]:
E = 0.8   ×   1 2 × l n C U 1 C U 2 1
g C U = 1.3 l o g 10 C U × C U 2 1 C U 1.8
E   ( C U ) = 10.2   ×   10 6   ×   E 3 1 + E × 1 g C U 2
Finally, the average linear velocity is calculated as:
u = v
where u is the average linear velocity, and Ø represents the porosity. Table 10 lists the calculated values. The comparison of model outcomes with experimental data was facilitated by employing the following relationship and calculating the maximum percentage error between the model’s results and the laboratory data.
E i = x i x i × 100 %
The maximum percentage error at each measurement point, at any given time, simplifies to:
E m a x = m a x E i
where E i represents the error (%), E m a x stands for the maximum error (%), x i refers to the measured concentration (mol/m3), and x i indicates the disparity between the measured and predicted concentrations.

3. Results and Discussion

3.1. Experiment

Table 3, Table 4 and Table 5 display the experimental results. Table 3 documents the outcomes from the anode section of the soil; Table 4 pertains to the middle section, while 
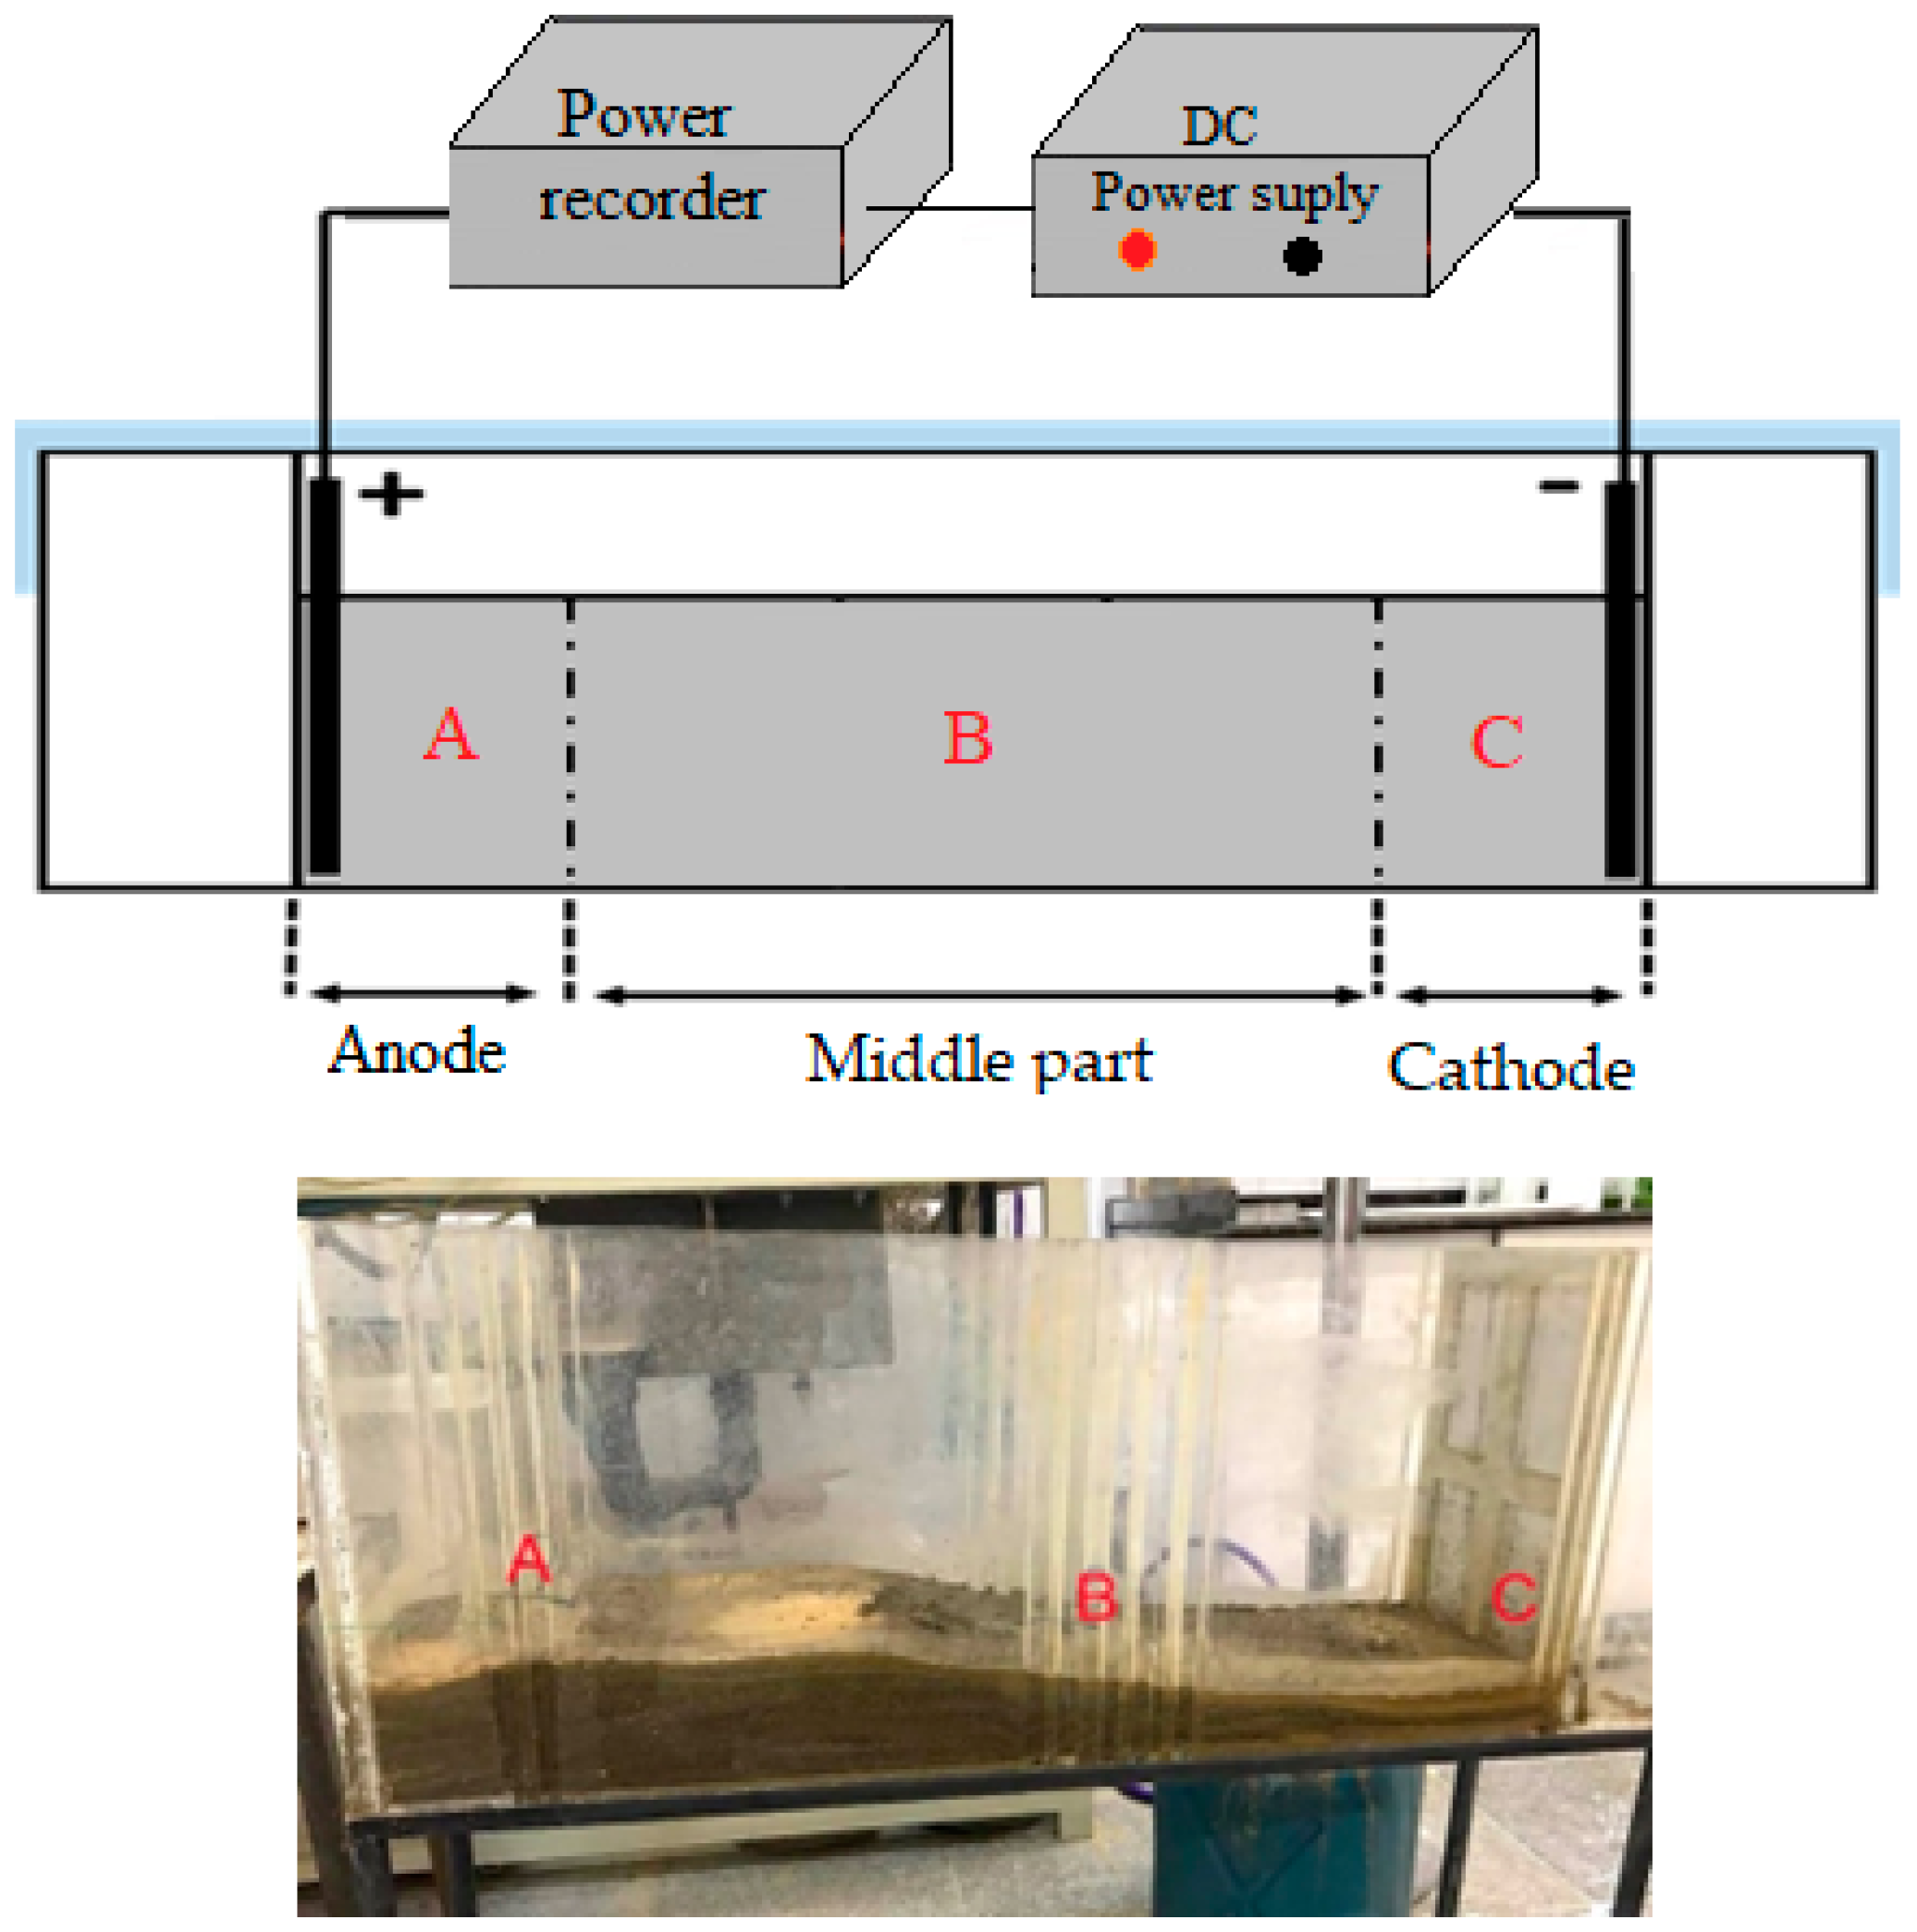
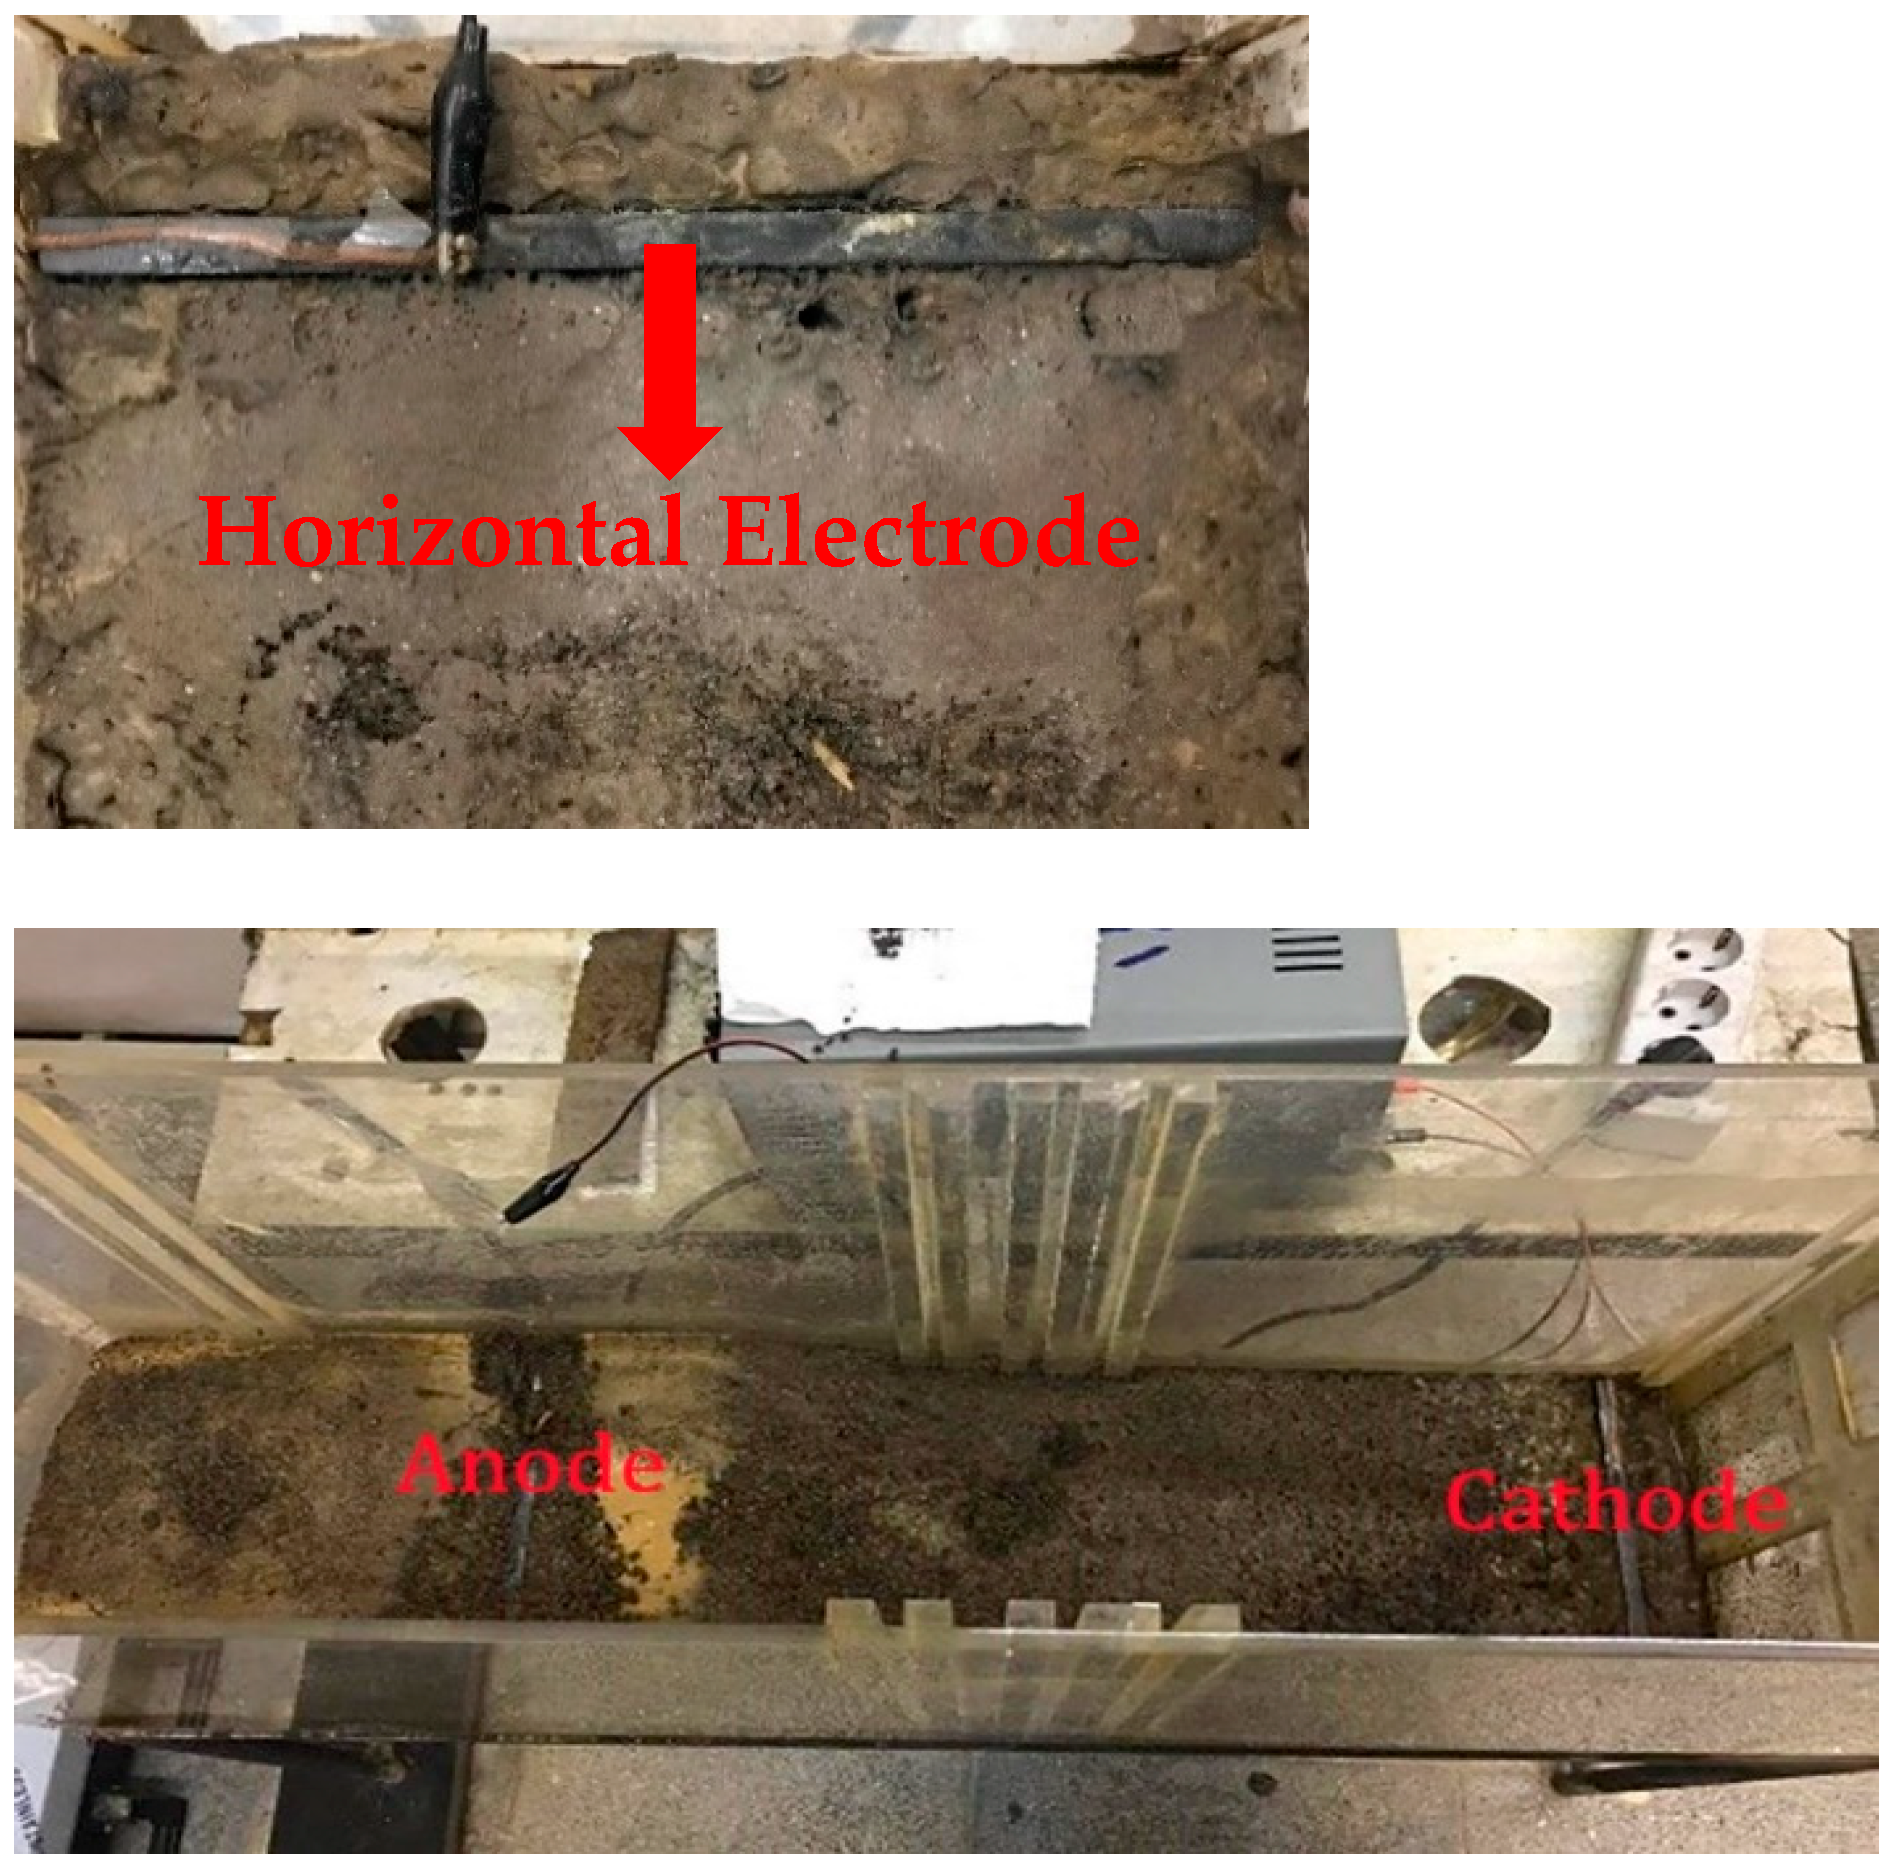
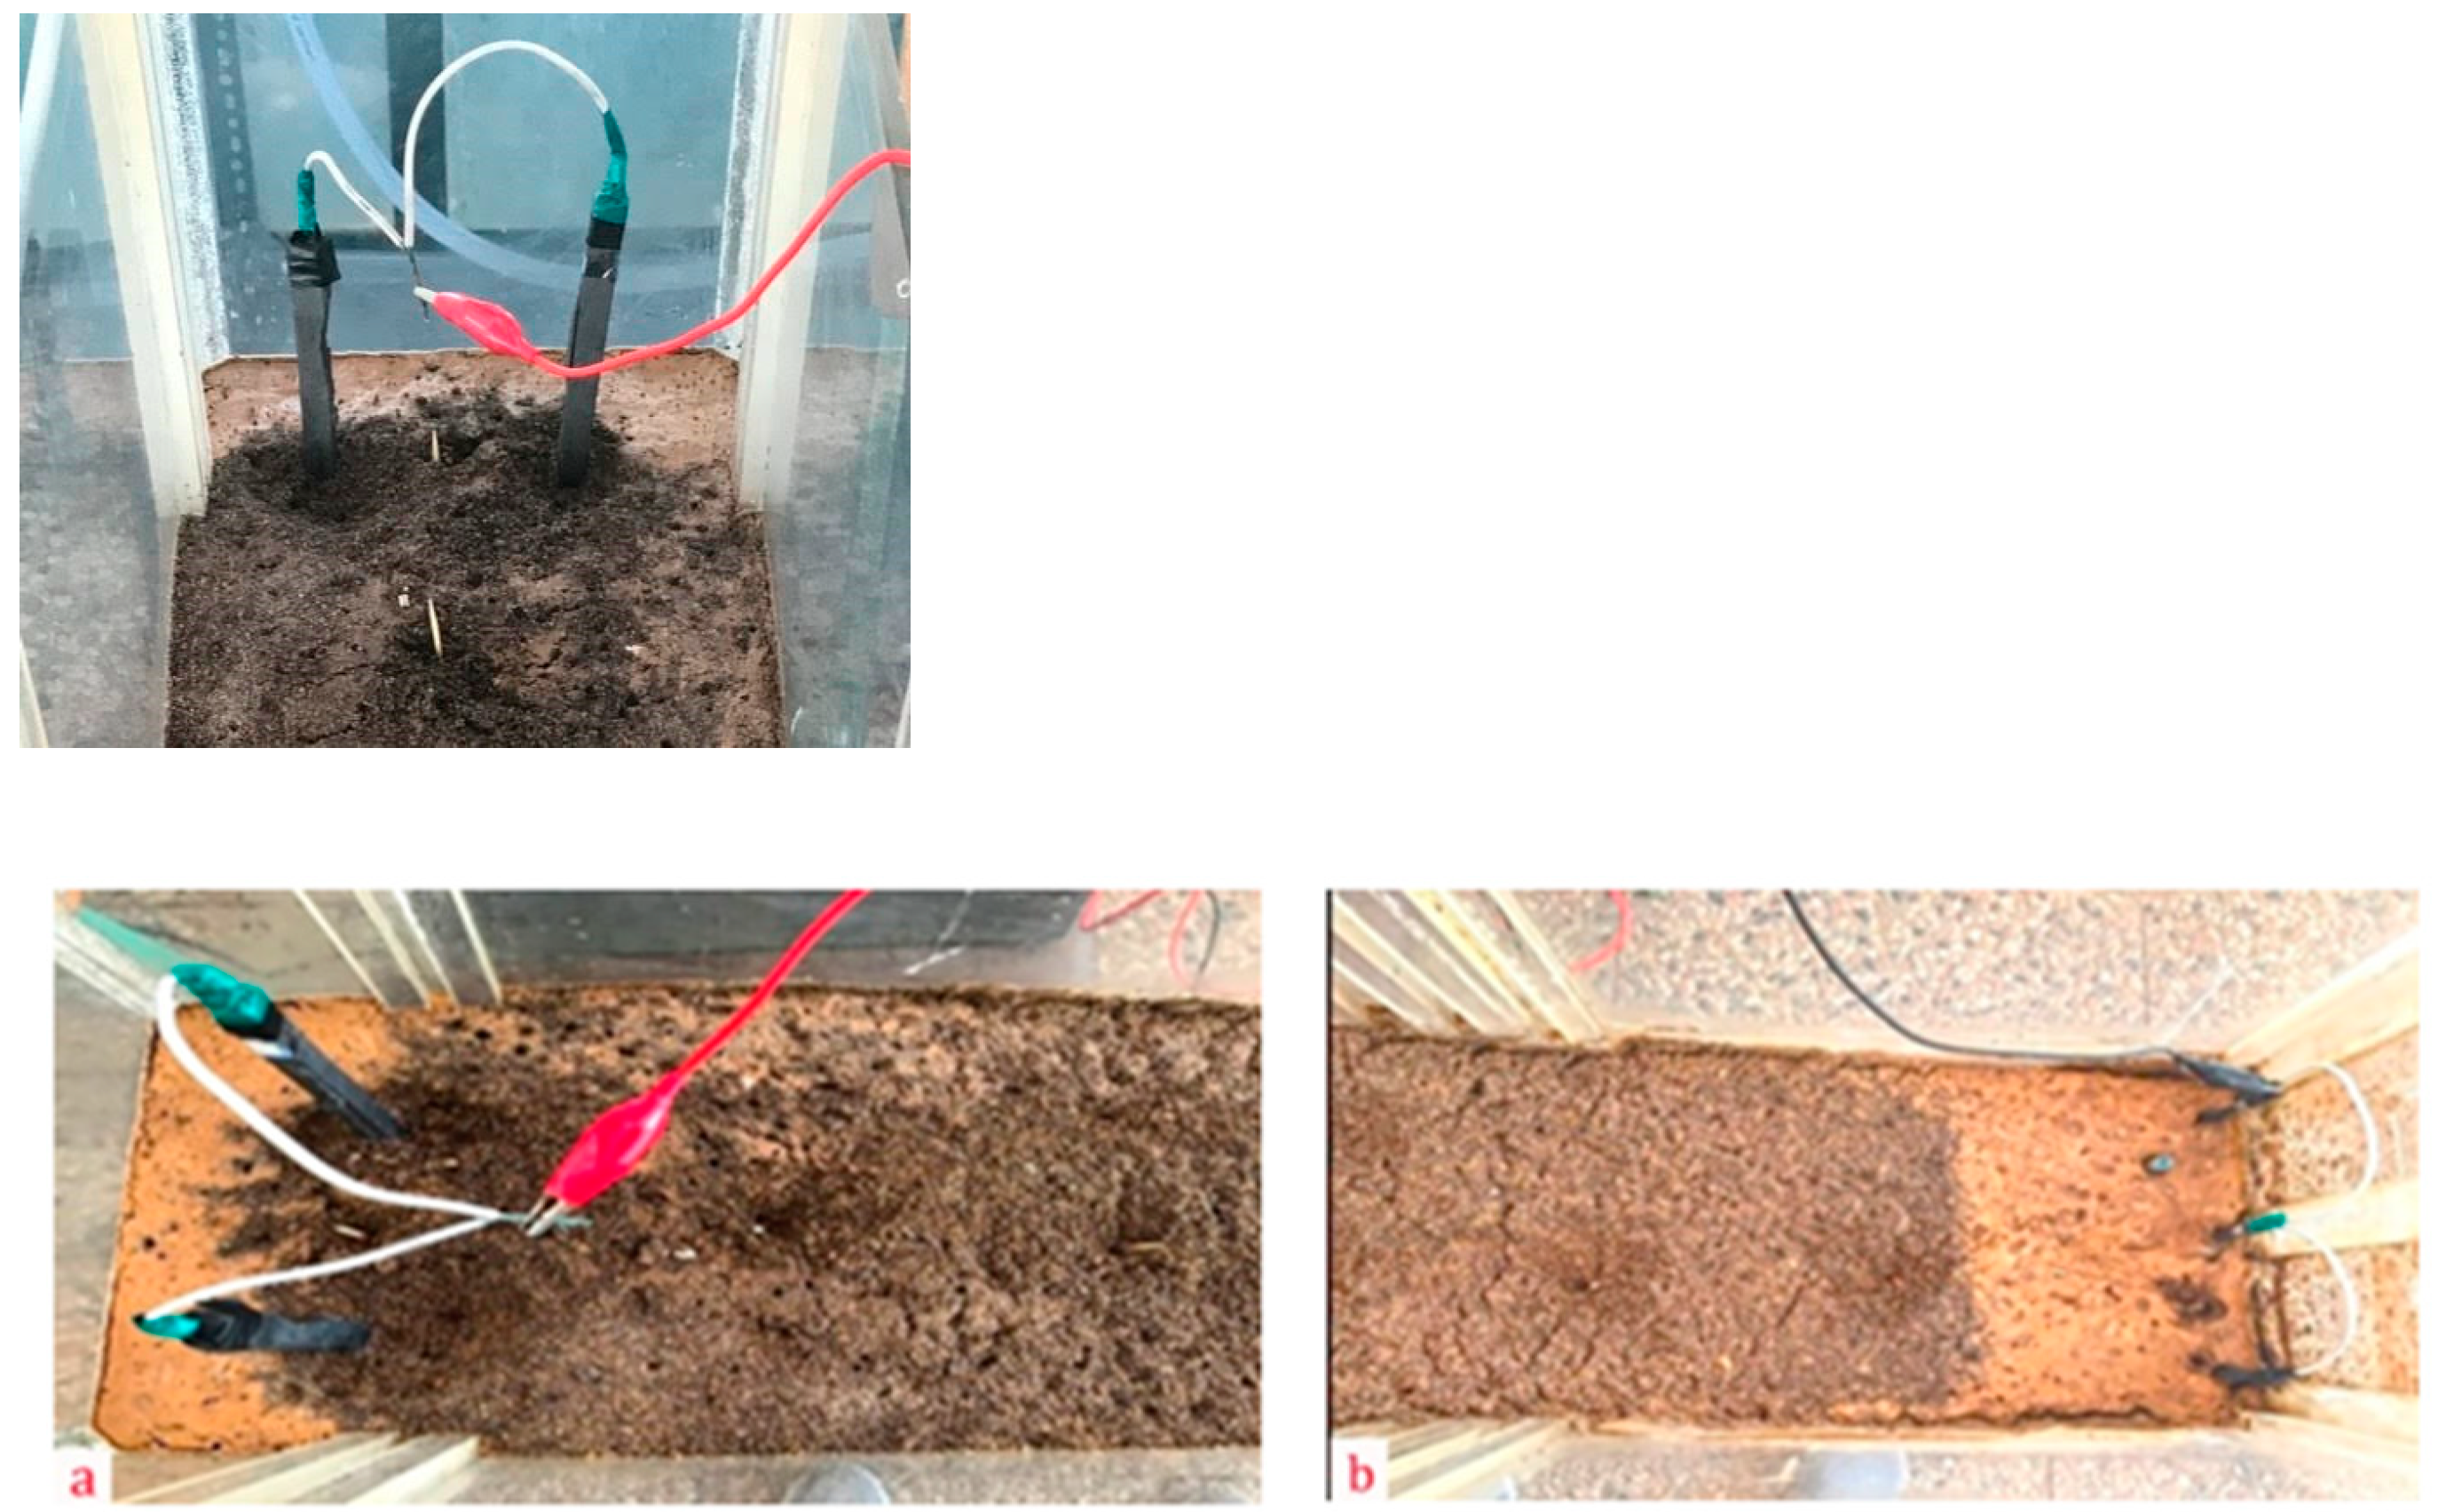
Table 5 presents the findings from the cathode section. These tables juxtapose the residual moisture content under three conditions: natural drainage of solid residue from tank leaching and drainage induced by the electrokinetic process, comparing two distinct electrode arrangements—one with horizontally placed electrodes in the soil and the other with vertically positioned electrodes within the soil.
At the beginning of the tests, the water content in all cases was almost the same. In the anode part, after 14 days of applying the electrokinetic process with vertical electrodes, the moisture content of the soil decreased by only 3.66%. However, with horizontal electrodes, it reduced by 8.8%, and naturally, it decreased by 1.73%. After 14 days of testing with horizontal electrodes, it was observed that the soil had nearly dried up, causing a decrease in current until it reached zero. Therefore, the application of the electrokinetic procedure in the system was terminated. On the other hand, this process took 34 days during the test with vertical electrodes. To compare these tests with natural drainage, a system without applying an electrokinetic process was used for a period of 34 days. Measurements were conducted in the middle part of the soil, where the electrokinetic process with horizontal electrodes took 16 days, and the moisture content of the soil decreased by 14.47%. In contrast, in the test with vertical electrodes, this value was reduced by 6.48% for the same time period. Additionally, the highest moisture reduction occurred in the cathode part: 38.4% with horizontal electrodes after 20 days of applying an electrokinetic process in the system, 12.28% with vertical electrodes after 20 days, and 31.48% after 34 days. It is evident from all the tests that the most significant reduction in moisture content occurred with horizontal electrodes because the electrodes have the most contact surface with the soil, making it easier for the current to penetrate the wet soil.

3.2. Modeling

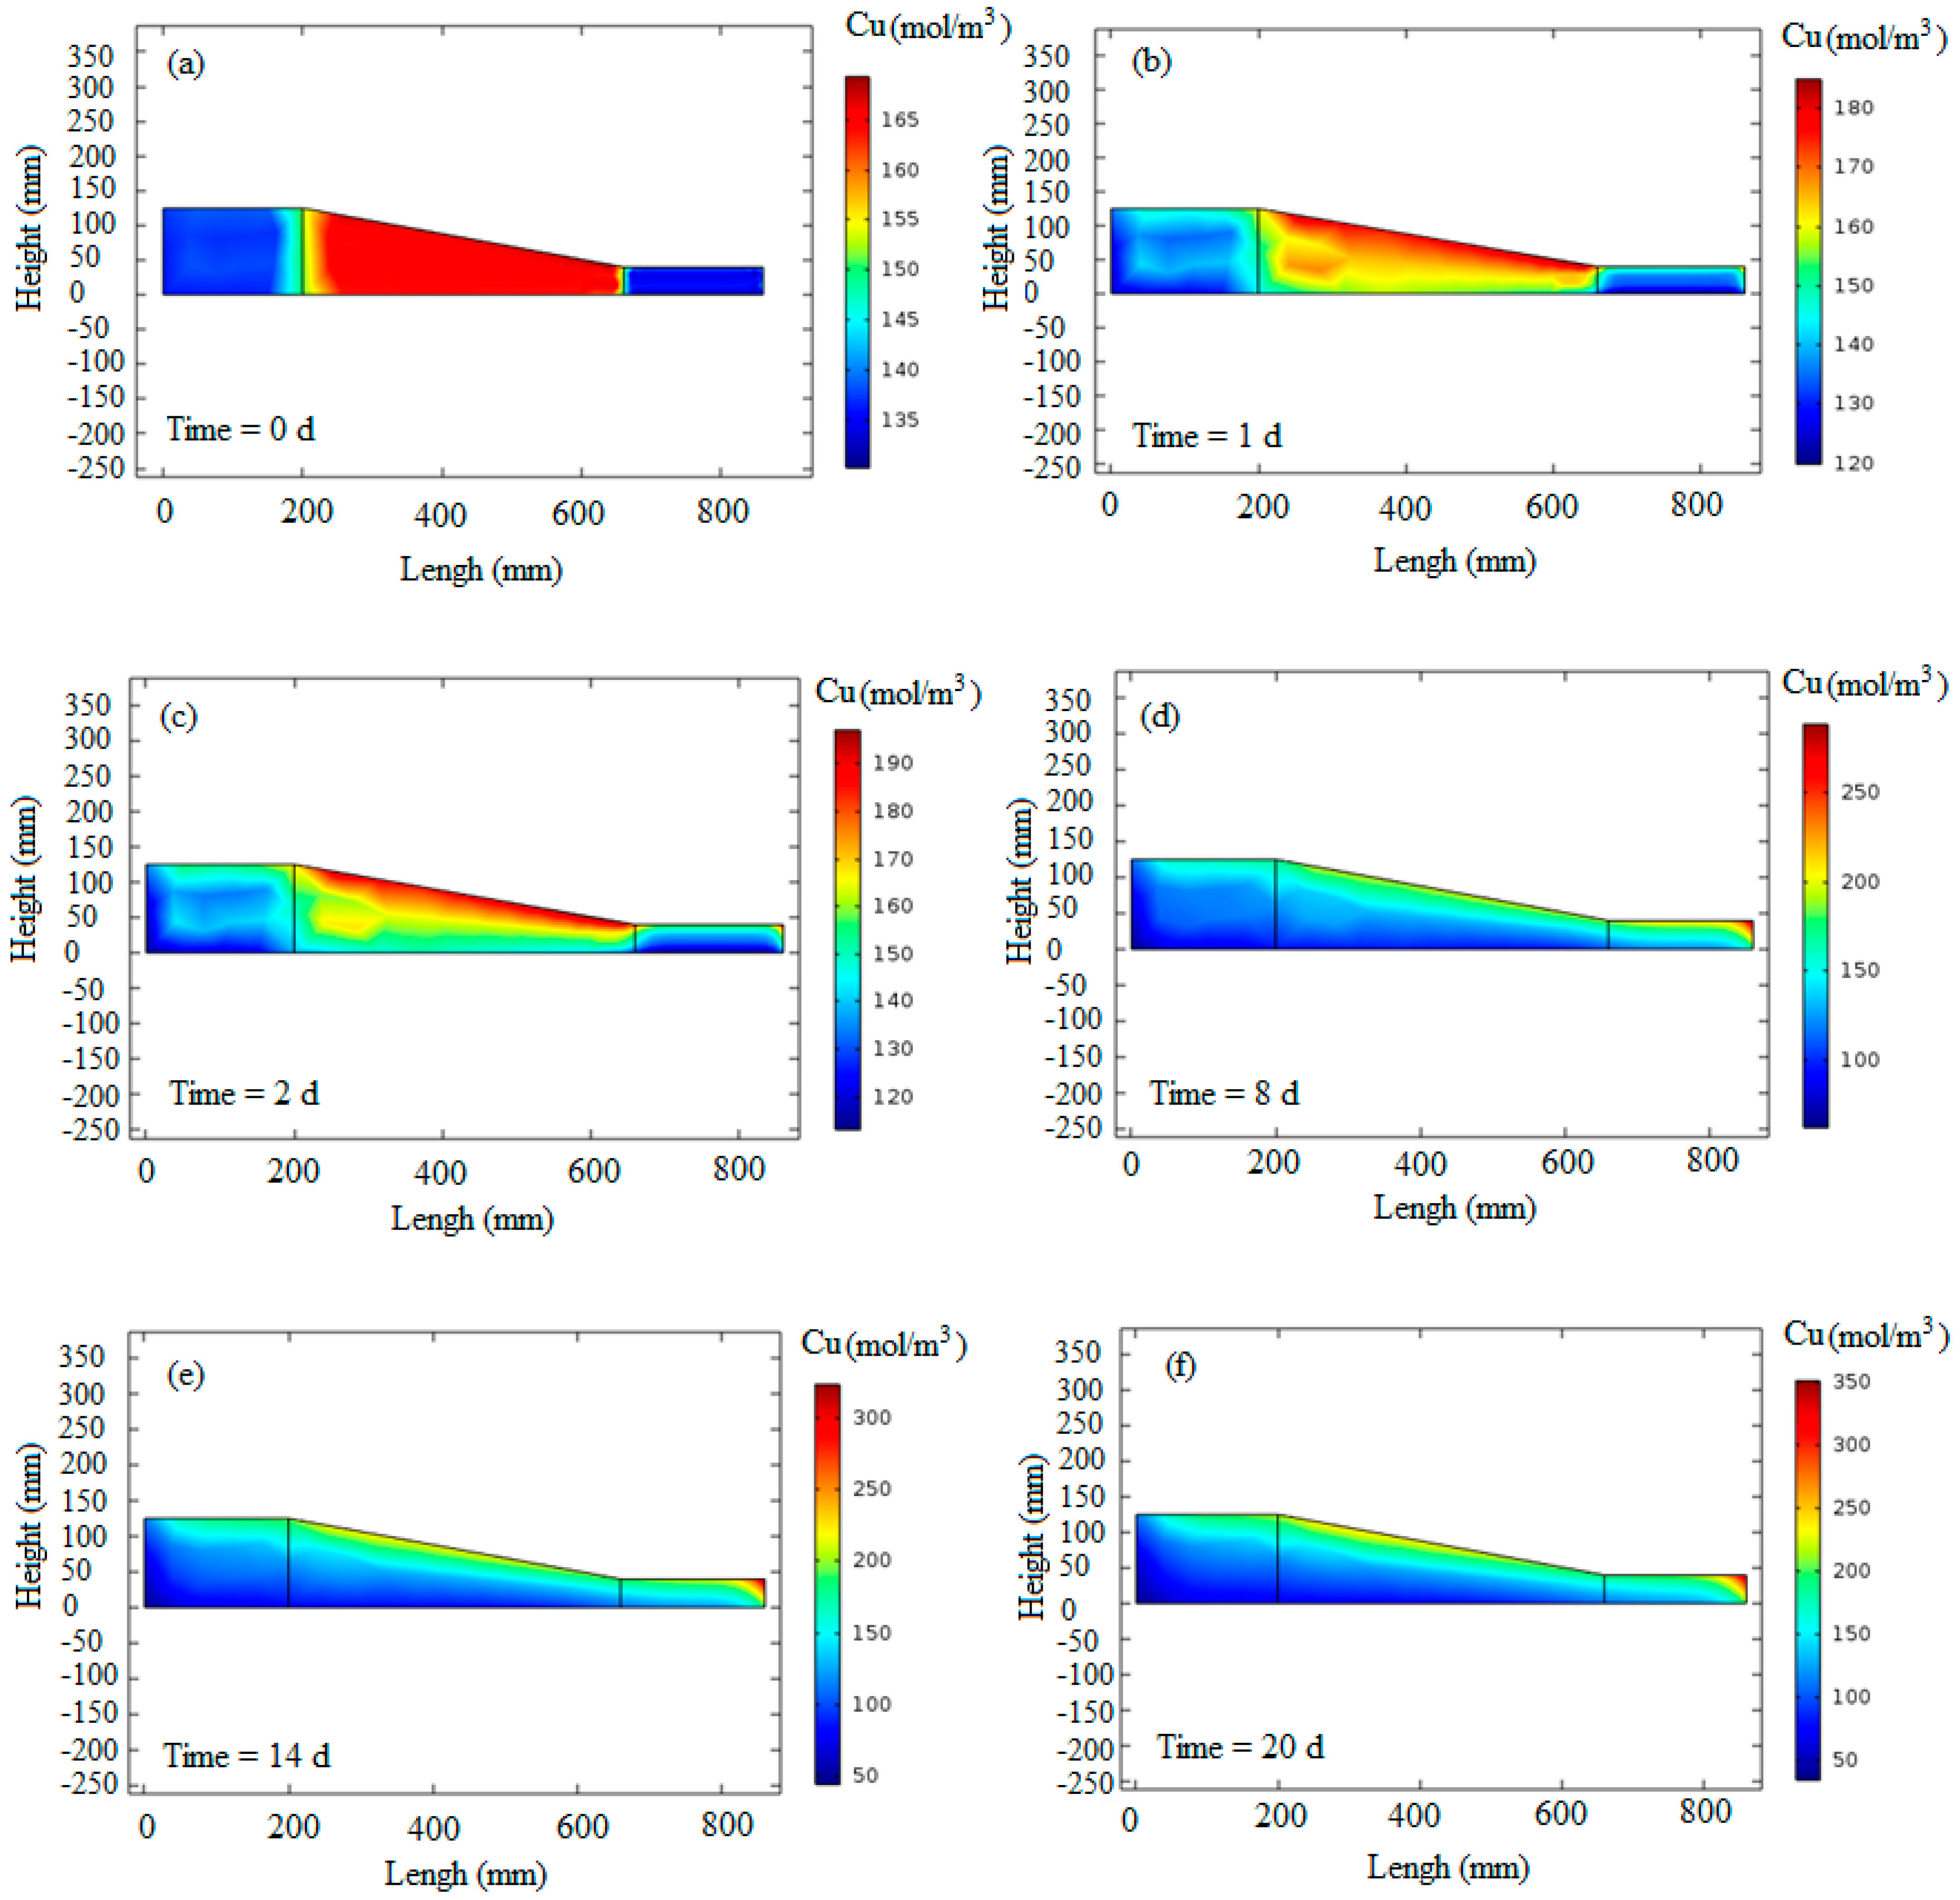
Figure 9 displays the results of copper transport during the electrokinetic process over six different days. At the beginning of the simulation, the copper concentration was set to match the laboratory measurements, which were 137.5 mol/m3 in the anode part, 165 mol/m3 in the middle part, and 135 mol/m3 in the cathode part (Figure 9a). Table 11 presents the maximum percentage error in predicting the copper concentration at various measurement points over time [39].
The highest percentage difference between the model prediction and the experimental data occurs in a period of 20 days, for which the model has overestimated so that the relative error is more than 10%. This relative error may be obtained at various stages of the laboratory experiment or modeling procedure. Both the model and the laboratory work show an increasing trend for Cu ion accumulation on the cathode side. This means that by increasing the processing time, it is possible to increase the concentration of copper in the cathode. In similar research, the effect of increasing the voltage and mechanical pressure of the soil in increasing the electrokinetic efficiency has been concluded [18].
In Figure 9b, the concentration of copper is observed to change from 120 to 180 mol/m3 on the first day of the test. This indicates the transportation of copper from the anode to the cathode side. The anode part exhibited the minimum copper concentration, while the maximum concentration was evident near the cathode across all segments. Figure 9c, representing the second day of the test, shows a decrease in copper concentration near the anode and an increase near the cathode, highlighting the continued movement of copper cations in the system. 
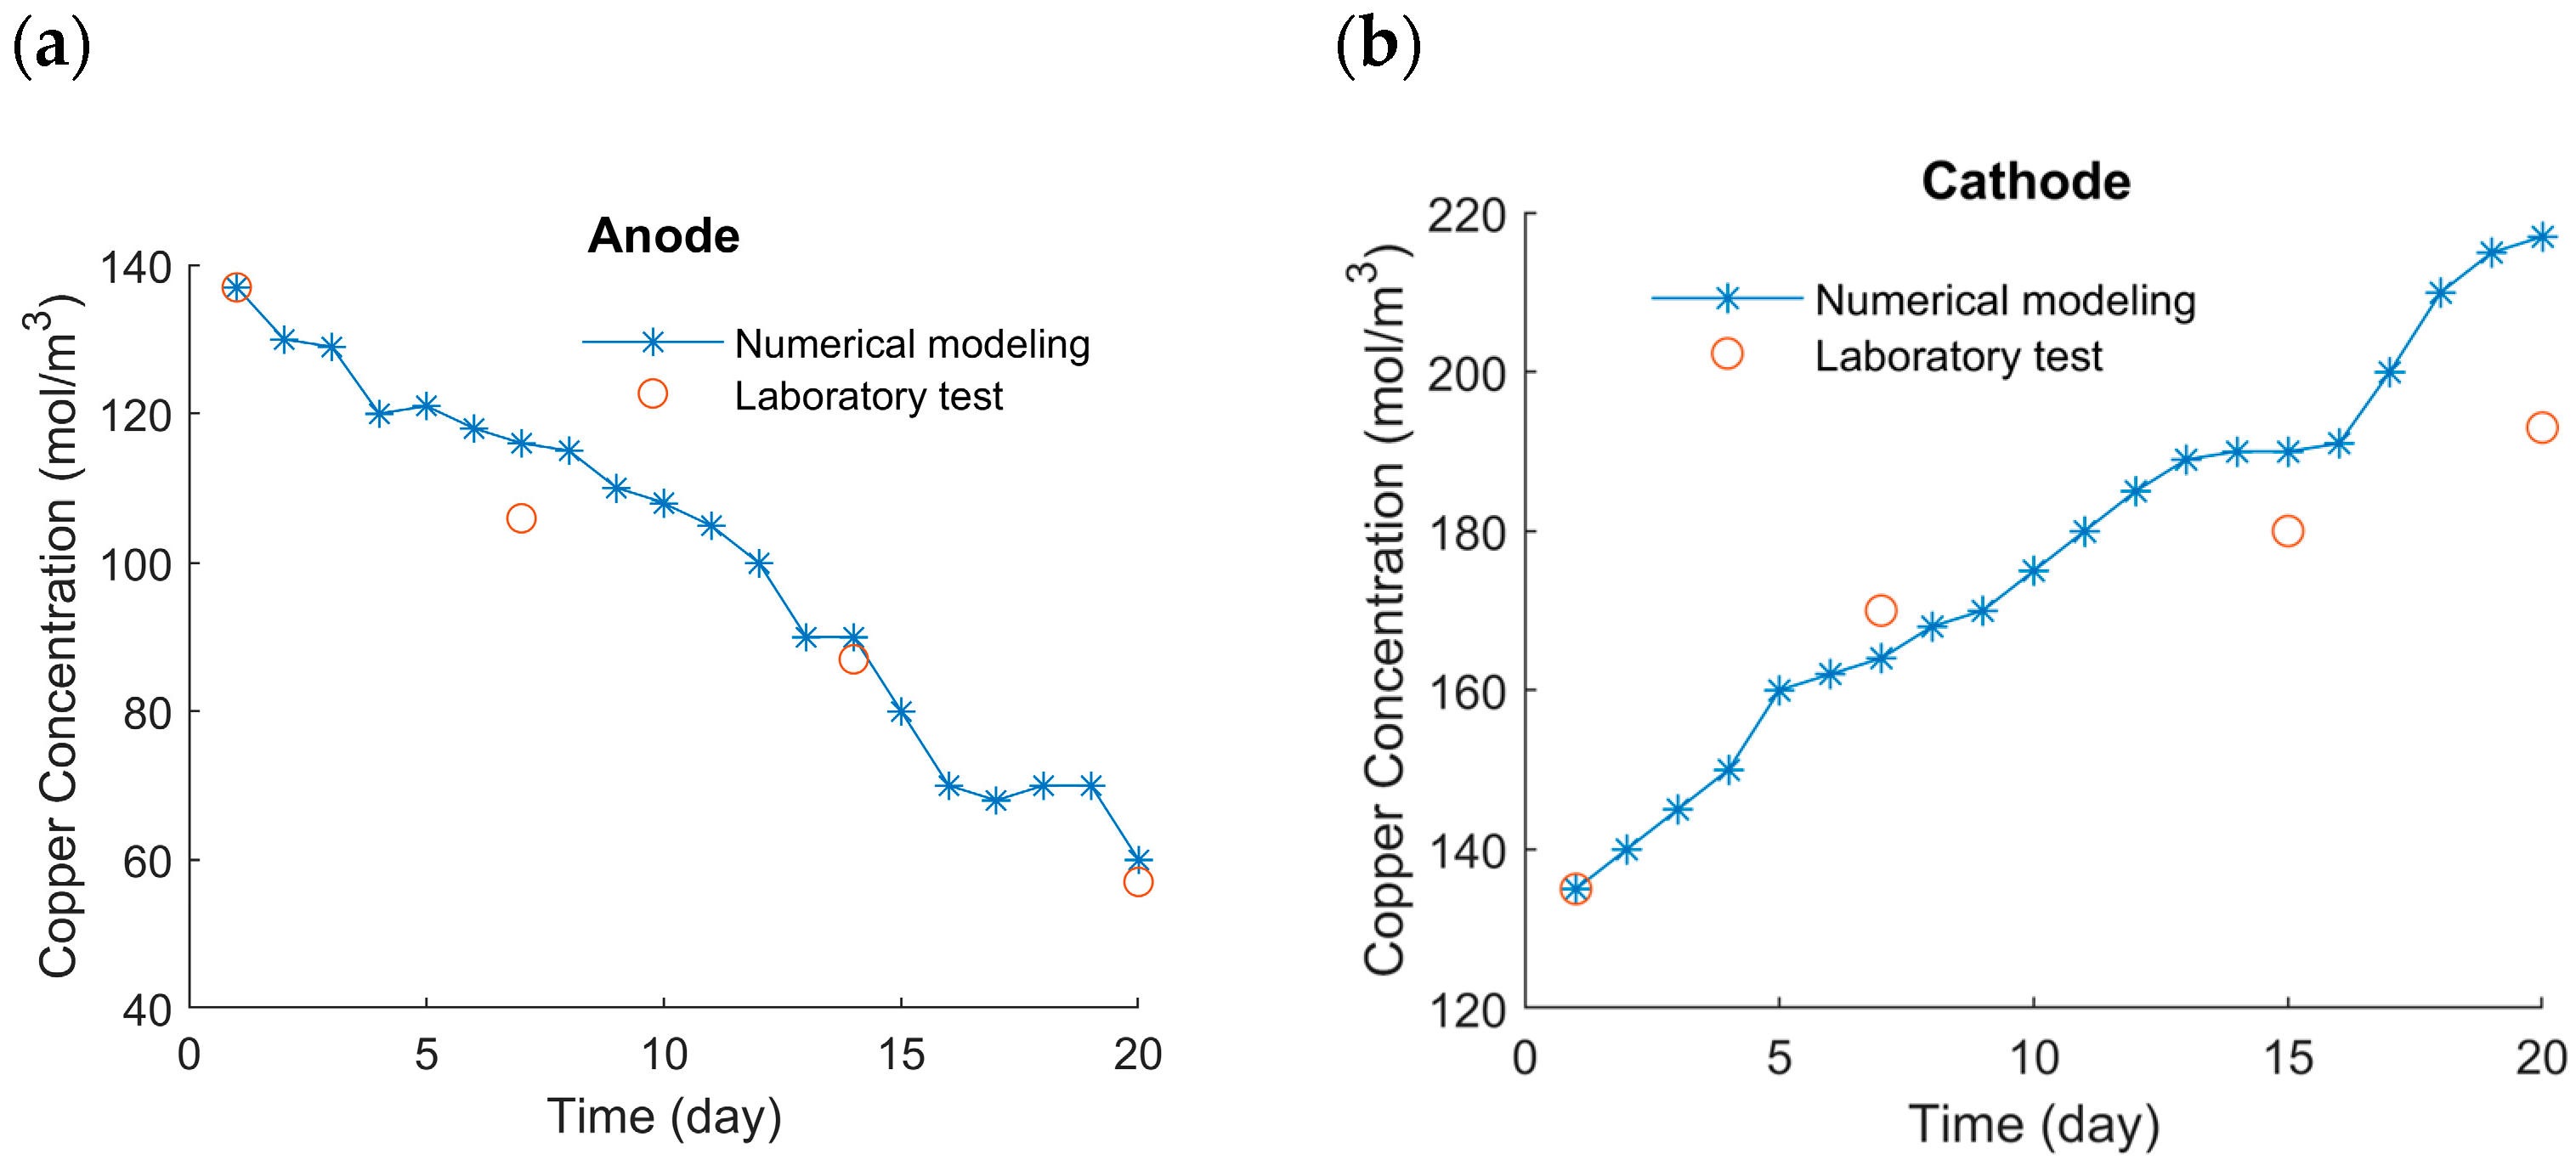
Figure 9d–f depicts the 8th, 14th, and last days of the test, respectively. The simulated copper concentrations align well with the laboratory measurements. A comparison between the experimental measurements and numerical modeling for the anode and cathode parts is presented in Figure 10a and Figure 10b, respectively.
The results obtained from modeling help optimize efficiency, cost, and energy. The use of an electrokinetic process facilitated the migration of copper cations from the anode to the cathode in the tank leaching system, which, in turn, reduced the cost and energy consumption.
Furthermore, as Figure 10 shows, the simulated Cu ion content on the cathode side increased from 135 mol/m3 to above 220 mol/m3 after 20 days. Also, in the same period of time, it decreased from 137.5 mol/m3 to less than 70 mol/m3 on the anode side. These results show that the electrokinetic process can significantly increase copper transport and its recovery efficiency in the tank leaching process.
As copper ions transport occurs via both electrokinetic and hydraulic mechanisms, this allows relatively rapid movement of ions through low hydraulic conductivity media, thus circumventing the need for permeability enhancement techniques such as ore crushing, which in turn reduces energy and tank washing time.
Both the modeling predictions and the results of the laboratory work show that the optimum time for the tank leaching operation was 20 days. Determining the optimal leaching time will increase the speed of metal recovery from ore, reduce operation time, and reduce related costs.

4. Conclusions and Future Prospects

Laboratory studies have shown that a significant amount of fluid, which contains 5 gr/L of copper, remains trapped in the fine-grained portion of the soil following the copper leaching process and the exit of the PLS. Given this, it becomes imperative for mining investors to devise a method to extract copper from this retained moisture, addressing both economic and environmental concerns. Recognized for its capacity to transport metals and aid water movement in soil, the electrokinetic process presents a potential solution. This research sought to explore the efficacy of the electrokinetic process in accelerating copper transport and extracting copper from soil moisture. This exploration involved both laboratory experiments and numerical modeling. Two electrode configurations—vertical and horizontal—were tested with variable electrode spacing and voltages to diminish the moisture content of the solid residues resulting from tank leaching. The findings revealed that horizontal electrodes were superior in facilitating moisture transfer owing to their enhanced contact with the soil. Specifically, in the cathode portion of the soil, a 20-day electrokinetic treatment led to a moisture content reduction of 12.28% with vertical electrodes, compared to a 38.4% reduction with horizontal ones. Additionally, this study delved into the transport dynamics of copper cations from the anode to the cathode under the influence of the electrokinetic process.
The study’s findings indicated that the copper content in the soil, located near the cathode electrode, rose from 0.54% to 0.77% following a 20-day electrokinetic treatment. Additionally, the experiments revealed that the electrokinetic process expedited the evaporation of pore water, which became evident when comparing scenarios with and without the application of the electrokinetic process. A numerical model was also established to study the transport of copper under the electrokinetic process in an aqueous solution. After a 20-day application of the process, the model predicted the copper cation concentration in the cathode region to be between 150 and 350 mol/m3. Experimental data indicated an actual concentration of 192.5 mol/m3 in the solution extracted from the cathode part, which aligns well with the model’s predictions. It is important to emphasize that while these results underscore the potential for scaling up the electrokinetic process, further research is required to confirm its wider applicability.
We recommend that future studies conduct experiments using various electrode configurations to explore the impact of electrode spacing and voltage on the transport and removal of copper from soil moisture. Such investigations would offer more comprehensive insights and facilitate the optimization of the electrokinetic process for enhanced copper extraction from soil moisture.
The determination and interpretation of electrical resistivity are complex within the tank leaching medium due to the joined impact of moisture variation, temperature changes, and chemical reactions such as hydrolysis, precipitation, and secondary minerals formation. This can increase the future relevance and significance of the research.
In addition, determining the minimum amount of energy consumption for the migration of copper ions remaining on the anode side can be considered in future studies; for this purpose, the optimal voltage should be determined correctly. In addition, a combination of mechanical pressure and the selection of an optimal voltage will enable us to transfer a considerable content of copper from the anode side to the cathode side, which will increase copper recovery, especially in low-grade ores with very low permeability.

Author Contributions

Conceptualization, F.E., F.D.A. and M.A.; methodology, F.E. and F.D.A.; formal analysis, F.E., M.A. and R.T.; investigation, F.E.; writing—review and editing, F.E., F.D.A., M.A., R.T. and C.B.; funding acquisition, F.D.A. All authors have read and agreed to the published version of the manuscript.

Funding

This research received no external funding.

Data Availability Statement

Data is contained within the article.

Acknowledgments

The authors greatly appreciate the MEHR laboratory of the University of Tehran for spiritual and financial support.

Conflicts of Interest

The authors declare that they have no conflict of interest.

References

  1. Nasim Cooper Mine. Introducing Our Copper Mines. 2021. Available online: https://koomehmine.com/en/copper-mines/ (accessed on 31 July 2021).
  2. Zanbak, C. Heap Leaching Techniques in Mining, within the Context of Best Available Techniques (BAT). Euromines—The European Association of Mining Industries, Metal Ores & Industrial Minerals. 2012. Available online: https://sdimi.org/wp-content/uploads/2021/12/SDIMI2013_03_-Heap-leaching-technique-in-mining-within-the-context-of-best-available-techniques.pdf (accessed on 13 October 2019).
  3. Mular, A.L.; Halbe, D.N.; Barratt, D.J. Mineral Processing Plant Design, Practice, and Control: Proceedings; Society for Mining, Metallurgy, and Exploration: Englewood, CO, USA, 2002. [Google Scholar]
  4. Möller, U.K. Water Binding. In Sludge Characteristics and Behavior; Carberry, J.B., Englande, A.J., Eds.; Springer: Dordrecht, The Netherlands, 1983; pp. 182–194. [Google Scholar] [CrossRef]
  5. Smollen, M. Categories of moisture content and dewatering characteristics of biological sludges. Proc. Fourth World Filtr. Congr. 1986, 14, 35–41. [Google Scholar]
  6. Smollen, M. Moisture retention characteristics and volume reduction of municipal sludges. Water SA 1988, 14, 25–28. [Google Scholar]
  7. Smollen, M.; Kafaar, A. Electroosmotically enhanced sludge dewatering: Pilot-plant study. Water Sci. Technol. 1994, 30, 159–168. [Google Scholar] [CrossRef]
  8. Tsang, K.R.; Vesilind, P.A. Moisture Distribution in Sludges. Water Sci. Technol. 1990, 22, 135–142. [Google Scholar] [CrossRef]
  9. Vesilind, P.A. Treatment and Disposal of Wastewater Sludges; Ann Arbor Science Publishers: Ann Arbor, MI, USA, 1979. [Google Scholar]
  10. Vesilind, P.A. The role of water in sludge dewatering. Water Environ. Res. 1994, 66, 4–11. [Google Scholar] [CrossRef]
  11. Dold, B.; Fontboté, L. Element cycling and secondary mineralogy in porphyry copper tailings as a function of climate, primary mineralogy, and mineral processing. J. Geochem. Explor. 2001, 74, 3–55. [Google Scholar] [CrossRef]
  12. Valenzuela, J.; Romero, L.; Acuña, C.; Cánovas, M. Electroosmotic drainage, a pilot application for extracting trapped capillary liquid in copper leaching. Hydrometallurgy 2016, 163, 148–155. [Google Scholar] [CrossRef]
  13. Alshawabkeh, A.N.; Gale, R.J.; Ozsu-Acar, E.; Bricka, R.M. Optimization of 2-D electrode configuration for electrokinetic remediation. J. Soil Contam. 1999, 8, 617–635. [Google Scholar] [CrossRef]
  14. Lyklema, H. Preface to Volume II: Solid-Liquid Interfaces. In Fundamentals of Interface and Colloid Science; Elsevier: New York NY, USA, 1995; pp. vii–ix. [Google Scholar]
  15. Eykholt, G.R.; Daniel, D.E. Impact of system chemistry on electroosmosis in contaminated soil. J. Geotech. Eng. 1994, 120, 797–815. [Google Scholar] [CrossRef]
  16. Zhou, J.; Liu, Z.; She, P.; Ding, F. Water removal from sludge in a horizontal electric field. Drying Technol. 2001, 19, 627–638. [Google Scholar] [CrossRef]
  17. Gill, R.T.; Thornton, S.F.; Harbottle, M.J.; Smith, J.W.N. Electrokinetic migration of nitrate through heterogeneous granular porous media. Groundw. Monit. Remediat. 2015, 35, 46–56. [Google Scholar] [CrossRef]
  18. Shafaei, F.; Doulati Ardejani, F.; Bahroudi, A.; Hoseini, M.; Khakpour, M. Mechanical-Electrical dewatering (EDW) of mine Tailings: Influence of voltage level on water recovery and moisture reduction. Miner. Eng. 2022, 175, 107303. [Google Scholar] [CrossRef]
  19. Yang, L.; Nakhla, G.; Bassi, A. Electro-kinetic dewatering of oily sludges. J. Hazard. Mater. 2005, 125, 130–140. [Google Scholar] [CrossRef]
  20. Shafaei, F.; Doulati Ardejani, F.; Bahroudi, A.; Yavarzade, M.; Amini, A. Electrokinetic Studies of Mine Tailings Considering Dewatering and Mass Transport at the Miduk Copper Mine, SE Iran. Mine Water Environ. 2021, 40, 847–863. [Google Scholar] [CrossRef]
  21. Acar, Y.B.; Alshawabkeh, A.N. Principles of electrokinetic remediation. Environ. Sci. Technol. 1993, 27, 2638–2647. [Google Scholar] [CrossRef]
  22. Reddy, K.R.; Cameselle, C. Electrochemical Remediation Technologies for Polluted Soils, Sediments and Groundwater; John Wiley & Sons: Hoboken, NJ, USA, 2009. [Google Scholar]
  23. Estabragh, A.; Naseh, M.; Javadi, A. Improvement of clay soil by electro-osmosis technique. Appl. Clay Sci. 2014, 95, 32–36. [Google Scholar] [CrossRef]
  24. Doulati Ardejani, F.; Badii, K.; Yousefi Limaee, N.; Mahmoodi, N.M.; Arami, M.; Shafaei, S.Z.; Mirhabibi, A.R. Numerical modelling and laboratory studies on the removal of Direct Red 23 and Direct Red 80 dyes from textile effluents using orange peel, a low-cost adsorbent. Dye. Pigment. 2007, 73, 178–185. [Google Scholar] [CrossRef]
  25. Ghadiri, M.; Asadollahzadeh, M.; Hemmati, A. CFD simulation for separation of ion from wastewater in a membrane contactor. J. Water Process Eng. 2015, 6, 144–150. [Google Scholar] [CrossRef]
  26. Hasani, S.; Ardejani, F.D.; Olya, M.E. Equilibrium and kinetic studies of azo dye (Basic Red 18) adsorption onto montmorillonite: Numerical simulation and laboratory experiments. Korean J. Chem. Eng. 2017, 34, 2265–2274. [Google Scholar] [CrossRef]
  27. Rabbani, M.G.; Warner, J.W. Shortcomings of Existing Finite Element Formulations for Subsurface Water Pollution Modeling and Its Rectification: One-Dimensional Case. SIAM J. Appl. Math. 1994, 54, 660–673. [Google Scholar] [CrossRef]
  28. Xiao, J.; Liu, Y.; Wang, J.; Bénard, P.; Chahine, R. Finite element simulation of heat and mass transfer in activated carbon hydrogen storage tank. Int. J. Heat Mass Transf. 2012, 55, 6864–6872. [Google Scholar] [CrossRef]
  29. Doulati Ardejani, F.; Badii, K.; Farhadi, F.; Aziz Saberi, M.; Jodeiri Shokri, B. A Computational Fluid Dynamic Model for Prediction of Organic Dyes Adsorption from Aqueous Solutions. Environ. Model. Assess. 2012, 17, 505–513. [Google Scholar] [CrossRef]
  30. Yustres, Á.; López-Vizcaíno, R.; Sáez, C.; Cañizares, P.; Rodrigo, M.A.; Navarro, V. Water transport in electrokinetic remediation of unsaturated kaolinite. Experimental and numerical study. Sep. Purif. Technol. 2018, 192, 196–204. [Google Scholar] [CrossRef]
  31. COMSOL BV; COMSOL OY. COMSOL Multiphysics User’s Guide© COPYRIGHT 1998–2010 COMSOL AB; 1998. Available online: https://citeseerx.ist.psu.edu/document?repid=rep1&type=pdf&doi=521dac082c90f5ef12439e0ed8e39dc1d0586f5b (accessed on 21 September 2023).
  32. Zhang, H.; Liu, X.; Tian, L.; Han, X.; Liu, S. Multilayer Microfluidic Electrokinetic Device with Vertical Embedded Electrodes. Key Eng. Mater. 2014, 609–610, 593–599. [Google Scholar] [CrossRef]
  33. Chun, M.-S. Electrokinetic flow velocity in charged slit-like microfluidic channels with linearized Poisson-Boltzmann field. Korean J. Chem. Eng. 2002, 19, 729–734. [Google Scholar] [CrossRef]
  34. Yao, S.; Huber, D.; Mikkelsen, J.C.; Santiago, J.G. A large flowrate electroosmotic pump with micron pores. In Proceedings of the International Mechanical Engineering Congress and Exposition, New York, NY, USA, 11–16 November 2001. [Google Scholar]
  35. Wissmeier, L.; Barry, D.A. Simulation tool for variably saturated flow with comprehensive geochemical reactions in two- and three-dimensional domains. Environ. Model. Softw. 2011, 26, 210–218. [Google Scholar] [CrossRef]
  36. Darcy, H. Les Fontaines Publiques de la Ville de Dijon: Exposition et Application; Victor Dalmont: Paris, France, 1856. [Google Scholar]
  37. Svensson, A. Estimation of Hydraulic Conductivity from Grain Size Analyses, a Comparative Study of Different Sampling and Calculation Methods Focusing on Västlänken. Master’s Thesis, Chalmers University of Technology, Göteborg, Sweden, 2014. [Google Scholar]
  38. Andersson, A.-C.; Andersson, O.; Gustafson, G. Brunnar Undersökning-Dimensionering-Borrning-Drift; Statens råd för byggnadsforskning: Stockholm, Sweden, 1984. [Google Scholar]
  39. Hughson, D.L.; Codell, R. Comparison of numerical and analytical models of unsaturated flow around underground openings. Min. Eng. 2001, 53, 45–48. [Google Scholar]
Figure 1. Arrangement of the tanks for mixing pulps and draining to the ponds with a gradient of 5% at Nasim mine. The tank’s length and diameter were 3 and 3.5 m, respectively.
Water 15 03923 g001
Figure 2. The plexiglass with dimensions of 0.25 × 0.40 × 1 m3 was used as the pulp storage pond.
Water 15 03923 g002
Figure 3. Condition of the soil after one week of natural drainage, with samples taken from three distinct sections: A, B, and C.
Water 15 03923 g003
Figure 4. The experimental setup used for the electrokinetic process.
Water 15 03923 g004
Figure 5. The particle size distribution of the material used in the experiments.
Water 15 03923 g005
Figure 6. The electrodes are placed horizontally in the soil to apply the electrokinetic process.
Water 15 03923 g006
Figure 7. The electrodes were placed vertically in the soil to apply the electrokinetic process: (a) anodes and (b) cathodes.
Water 15 03923 g007
Figure 8. A schematic representation of the 2D model of the experimental setup.
Water 15 03923 g008
Figure 9. The changes in copper concentration in 6 different days of applying the electrokinetic process in the tank leaching. (a) 0 day, (b) 1 day, (c) 2 day, (d) 8 day, (e) 14 day, (f) 20 day.
Water 15 03923 g009
Figure 10. Comparison between the numerical modeling and the laboratory test in (a) Anode and (b) Cathode parts.
Water 15 03923 g010
Table 1. The water content of the soil after natural drainage in the parts shown in Figure 3.
PartWater Content (%)
A13.42
B21.49
C53
Table 2. Some of the PLS parameters.
ParametersValuesUnits
pH3.6-
Eh413mV
EC10.92mS/cm
Table 3. The amount of residual moisture content in the anode place (section A). The applied voltage was 0.4 volt/cm.
Type of ProcessRmc-1 1 (%)Rmc-14 (%)Rmc-20 (%)Rmc-29 (%)Rmc-34
(%)
Leaching with the EK 2 process (vertical electrodes)13.6910.038.466.264.85
Leaching without the EK process13.1811.459.37.86.7
Leaching with the EK process (horizontal electrodes)13.424.62---
Notes: 1 Rmc-I: Residual moisture content (%) on the (I)th day; 2 Electrokinetic.
Table 4. The amount of residual moisture content in section B (Middle part of the soil). The applied voltage was 0.4 volt/cm.
Type of ProcessRmc-1 (%)Rmc-14 (%)Rmc-16 (%)Rmc-20 (%)Rmc-29 (%)Rmc-34 (%)
Leaching with the EK process (vertical electrodes)21.3815.9614.913.647.946.71
Leaching without the EK process21.1719.4419.1618.717.316.1
Leaching with the EK process (horizontal electrodes)21.4912.77.02---
Table 5. The amount of residual moisture content in section C (Cathode place). The applied voltage was 0.4 volt/cm.
Type of ProcessRmc-1 (%)Rmc-20
(%)
Rmc-29 (%)Rmc-34 (%)
Leaching with the EK process (vertical electrodes)54.284230.422.8
Leaching without the EK process59.657.653.7250.26
Leaching with the EK process (horizontal electrodes)5314.6--
Table 6. Cu (%) before the electrokinetic process.
SampleCu (%)
Anode part0.56
Middle part0.66
Cathode part0.54
Table 7. Cu (%) after using the electrokinetic process for 20 days.
SampleCu (%)
Anode part0.35
Middle part0.59
Cathode part0.77
Table 8. Soil hydraulic parameters used in the experimental setup and modeling.
ParameterValueUnit
ØA, B0.375-
Øc0.333-
Ρ1600kg.m−3
EC1.092S.m−1
Table 9. Diffusion coefficients of the ions [28,35].
Cation|z|Di·10−9 [m2s−1]
Ag+11.648
Al+330.559
Ba+220.848
Be+220.599
Ca+220.793
CaHCO3+10.506
Cd+220.717
Co+220.732
Cr+330.595
Cu+220.733
Fe+220.719
Fe+330.604
Table 10. The calculated values of the parameters given by Equations (5)–(12).
Equation NumberParameterQuantityUnit
(8) C U 6.42-
(9)E0.19-
(10)g ( C U )2.28-
(11)E ( C U )11,329.39-
(7)k2.22 × 10−4m/s
(6) i 0.0988-
(5) v 2.194 × 10⁻⁵m/s
(12) u 5.85 × 10⁻⁵m/s
Table 11. The calculated modeling error at the anode and cathode.
Measuring PointAnodeCathode
Time (day)171420171520
Maximum error (%)09.43.455.2603.535.5612.4
Disclaimer/Publisher’s Note: The statements, opinions and data contained in all publications are solely those of the individual author(s) and contributor(s) and not of MDPI and/or the editor(s). MDPI and/or the editor(s) disclaim responsibility for any injury to people or property resulting from any ideas, methods, instructions or products referred to in the content.

