
Backwater Effects in Rivers and Lakes: Case Study of Dongping Lake in China


 , ,
, ,
Abstract
:1. Introduction
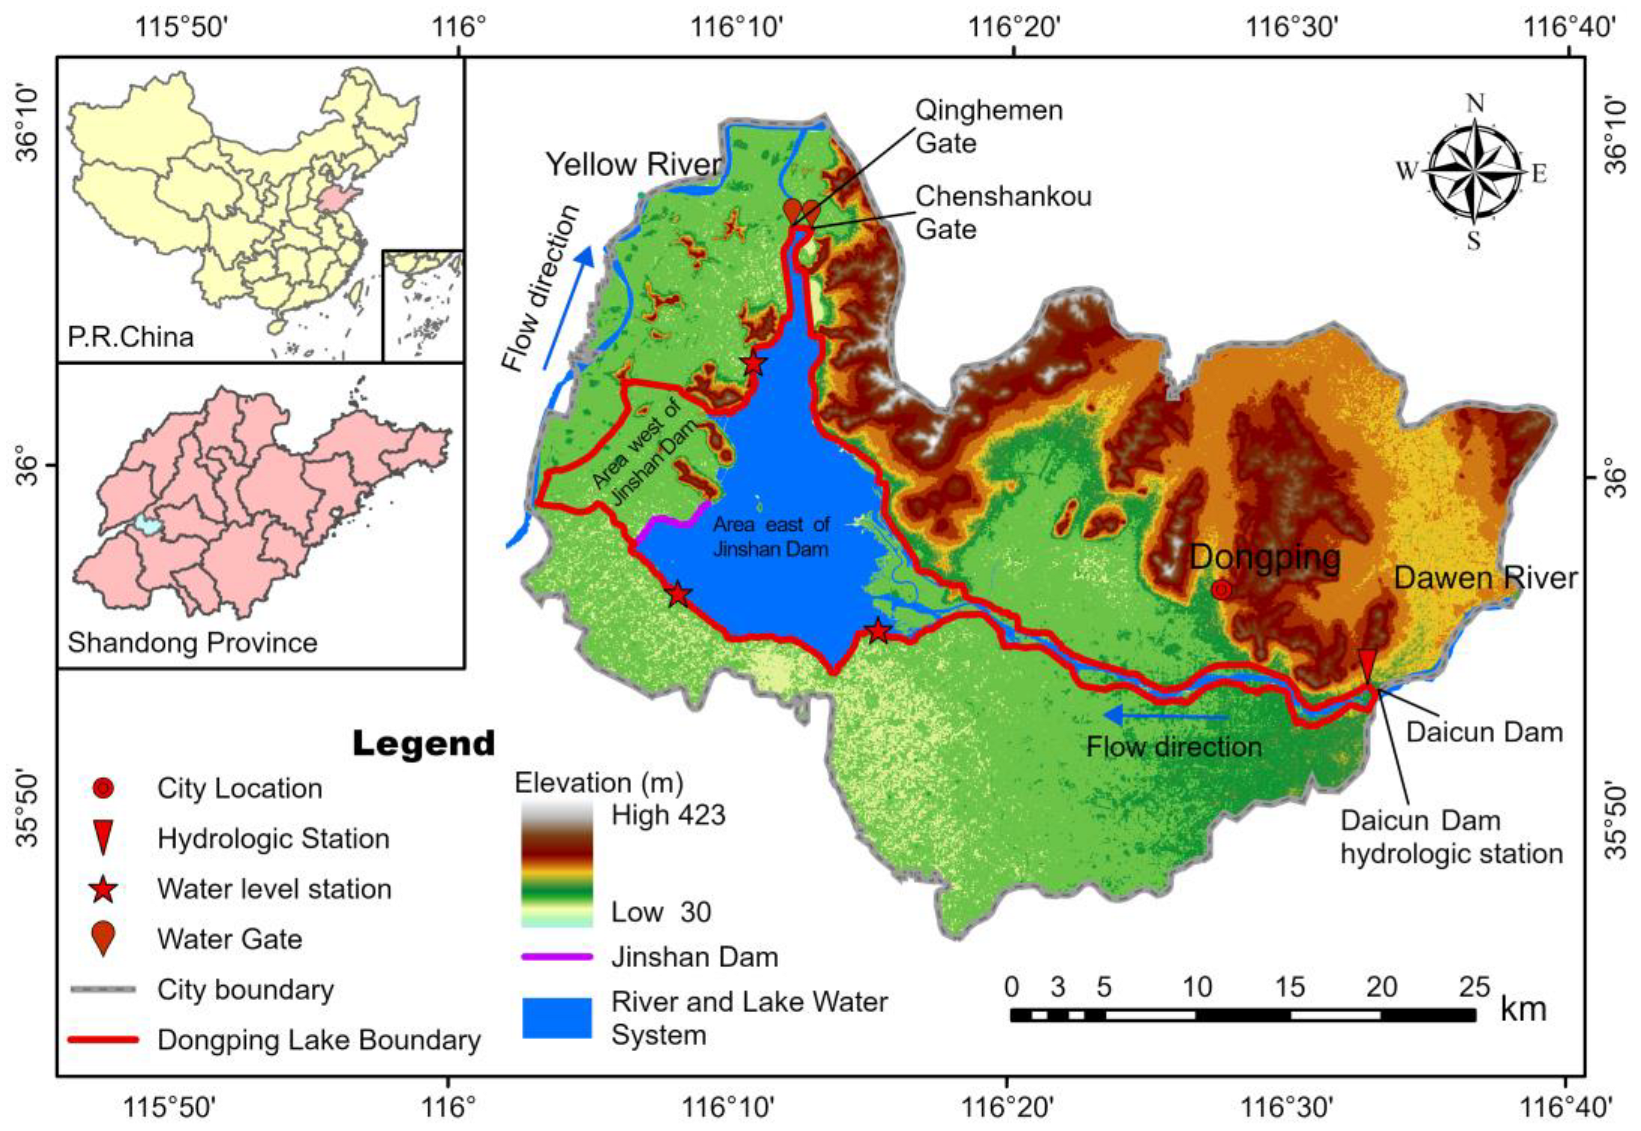
2. Study Area
3. Modeling
3.1. Description of Numerical Models
3.1.1. Governing Equations
3.1.2. Numerical Method
3.1.3. Treatment of Boundary Conditions
3.1.4. Treatment of Wet-Dry Varying Boundary
- (a)
- Definition of Wet and Dry Grids. A threshold value, hdw, is defined to determine wet and dry grids, and in this case, hdw is set to 0.1 m.
- (b)
- Determination of Wet-Dry Property for Each Computational Cell. Before commencing the computation at each time step, the wet-dry property of each computational cell is assessed. Firstly, the minimum water depth, hmin, of a specific computational cell is calculated using Equation (4):
3.1.5. Methodology for Dam Breach Simulation
- (a)
- Set up a water level observation point upstream of the pre-defined blasting point on the dam crest;
- (b)
- Introduce a second set of topographical data in the input file, where the shape of the breached dam has been modified. Apart from this modification, all other information in the second set of topographical data remains identical to the first set;
- (c)
- Before the commencement of the actual computation process in each time step, assess whether the water level has reached the pre-defined breach water level;
- (d)
- If the water level at the observation point meets or exceeds the breach water level, update the topographical data to the second set of data (Figure 3). Moreover, to ensure the smooth flow of water through the breach and downstream, this updating process is scheduled before the grid wet-dry determination step.
3.2. Design of Working Conditions
3.3. Terrain and Mesh Generation
3.4. Boundary Conditions and Initial Conditions
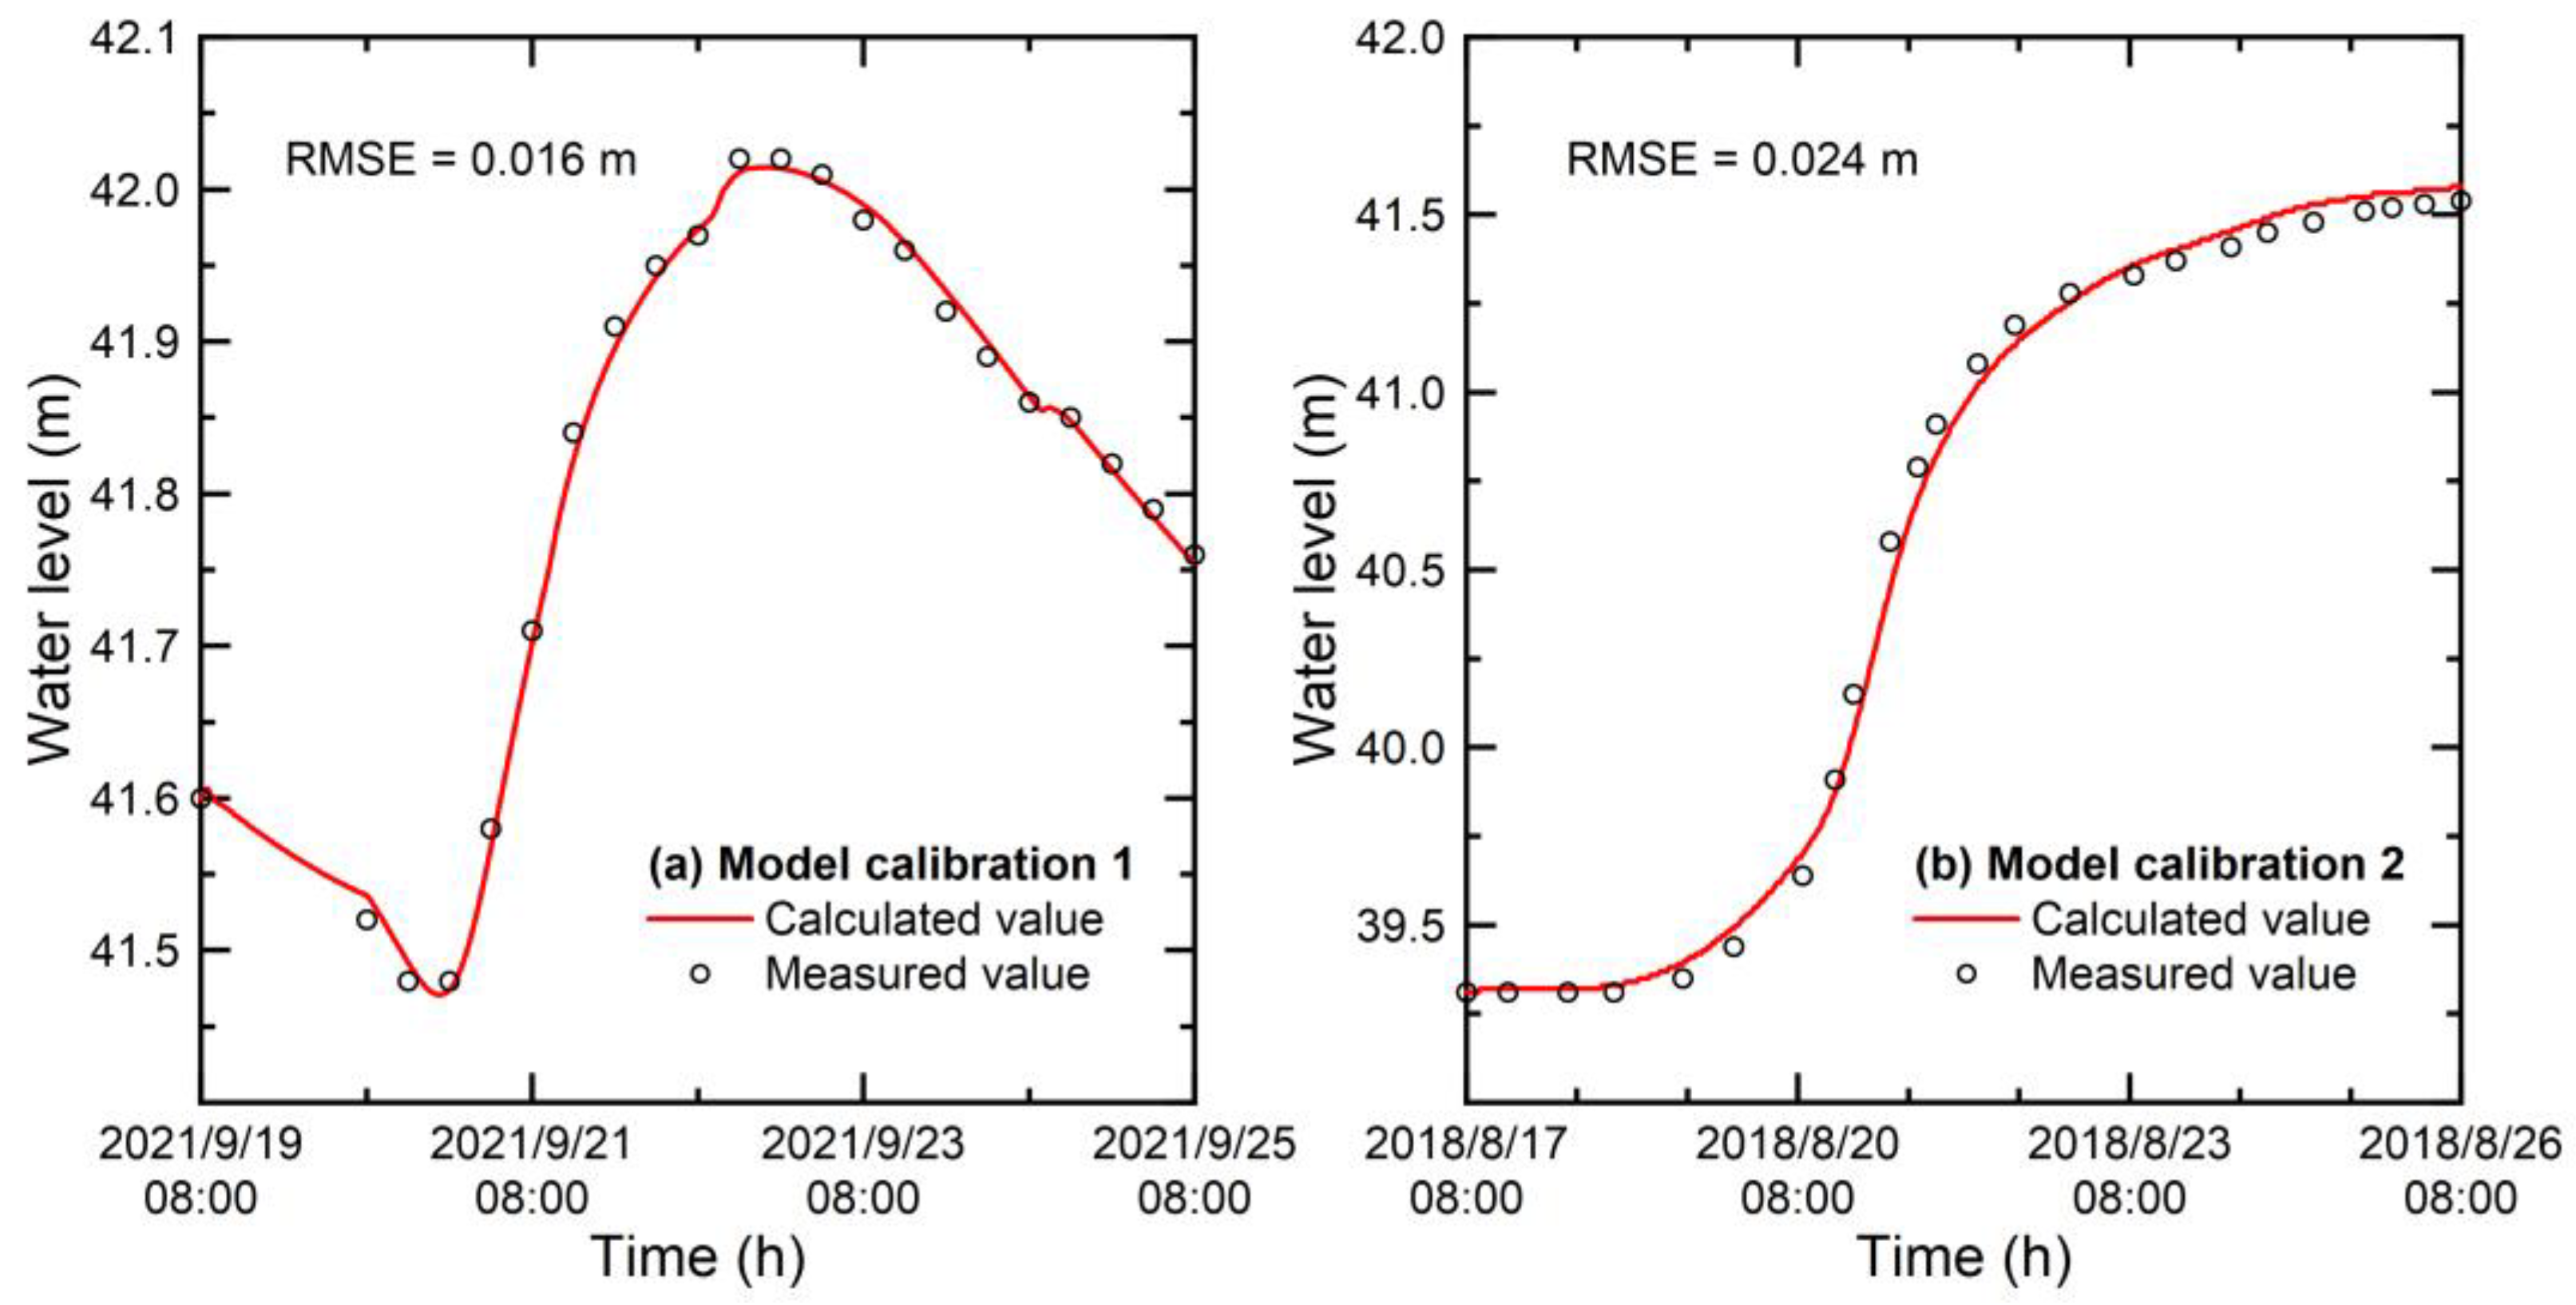
3.5. Model Calibration and Validation
4. Results and Analysis
4.1. Impact on the Area East of Jinshan Dam
- Rapid water level rise stage:
- Water level decline stage:
- Slow water level rise stage:
- Slow water level decline stage:
4.2. Impact on the Area West of Jinshan Dam
5. Discussions
5.1. Improvement and Applicability of Numerical Models
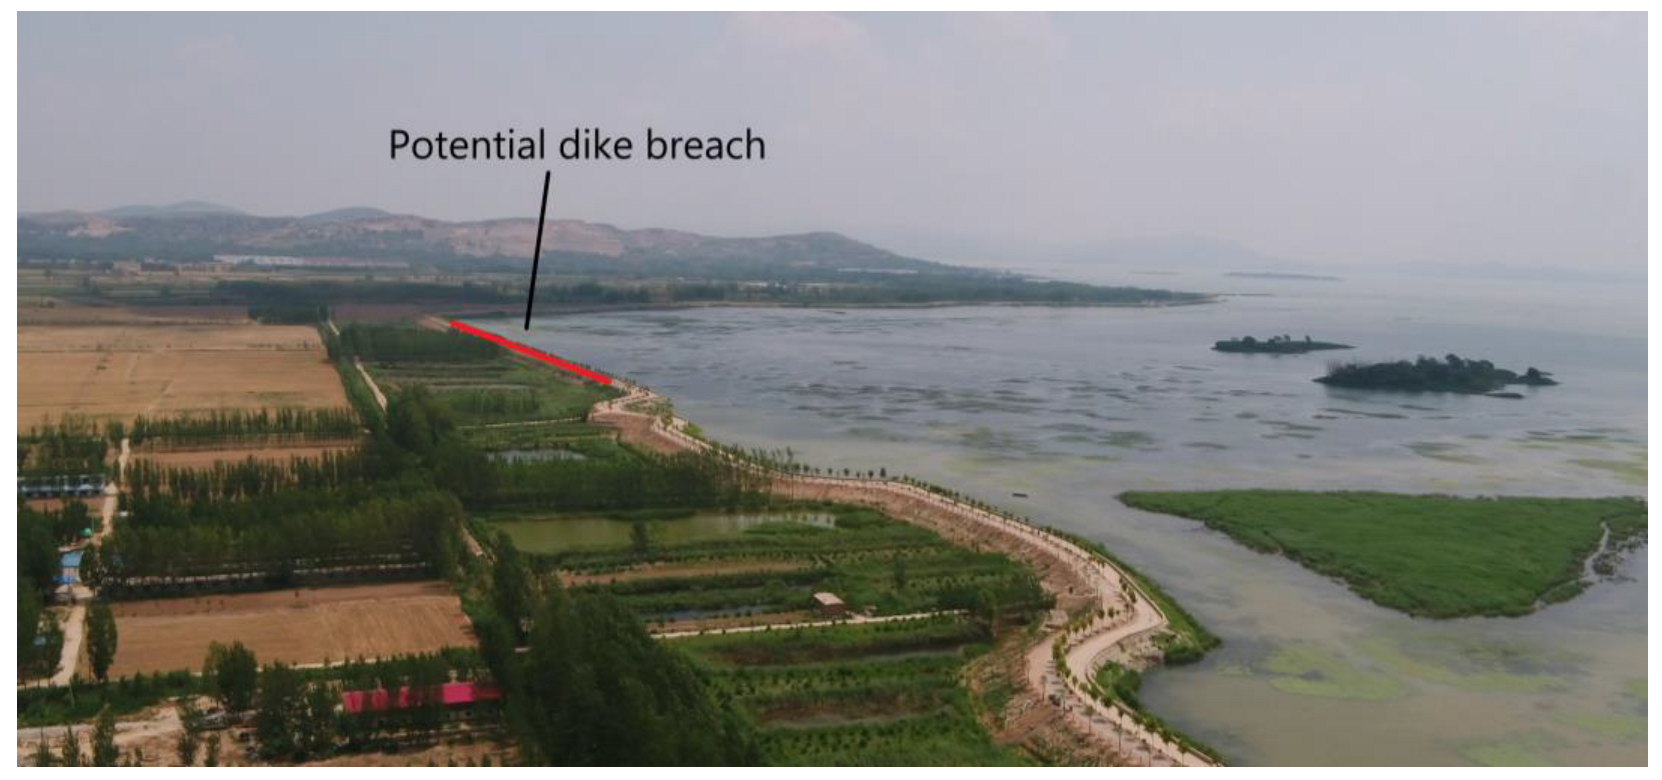
5.2. Measures to Address the Backwater Effect
5.3. The Referential Value of the Case
6. Conclusions
- (1)
- A hydrodynamic model was established based on a non-structured triangular mesh and the FVM with TVD characteristics. The successful application of the Roe-MUSCL scheme and the Runge-Kutta predictor-corrector method provided the model with second-order accuracy in both time and space. This model also introduced an approach to handle dam breaks and treatment of wet-dry varying boundaries;
- (2)
- The more severe the backwater effect faced by Dongping Lake, the greater the challenges it presents for flood control. The presence of the backwater effect leads to varying degrees of reduced outflow flood volumes and increased lake water levels. Residents west of Jinshan Dam face higher flood risks and have less time for flood evacuation;
- (3)
- The negative impacts resulting from the backwater effect can be reduced or eliminated through measures such as strengthening monitoring and early warning systems, developing and improving flood emergency plans, reassessing the suitability of flood control facilities, constructing pumping stations, and so on.
Author Contributions
Funding
Data Availability Statement
Conflicts of Interest
References
- Mayo, T.L.; Lin, N. Climate change impacts to the coastal flood hazard in the northeastern United States. Weather Clim. Extrem. 2022, 36, 100453. [Google Scholar] [CrossRef]
- Cui, L.; He, M.; Zou, Z.; Yao, C.; Wang, S.; An, J.; Wang, X. The influence of climate change on Droughts and floods in the Yangtze River basin from 2003 to 2020. Sensors 2022, 22, 8178. [Google Scholar] [CrossRef] [PubMed]
- PIETROIUSTIR Was the 2020 Lake Victoria Flooding ‘Caused’by Anthropogenic Climate Change? Vrije Universiteit Brussel: Ixelles, Belgium, 2022.
- Ahmed, T.; Geebu, R.; Thompson, S. Assessing Land Loss from Flooding in the Lake St. Martin Basin in Manitoba, Canada. J. Geosci. Environ. Prot. 2019, 7, 171. [Google Scholar] [CrossRef]
- Shang, H.; Hu, C.; Xia, J.; Zhou, M. Influence of Dongting Lake inflow on the degree and range of backwater effect in the Jingjiang reach. Adv. Water Sci. 2023, 34, 431–441. [Google Scholar]
- Wicaksono, A.; Herdiansyah, H. The impact analysis of flood disaster in DKI jakarta: Prevention and control perspective. J. Phys. Conf. Ser. 2019, 1339, 012092. [Google Scholar] [CrossRef]
- Mohamed, N.N. Importance of Aswan High Dam to Egypt. In Grand Ethiopian Renaissance Dam Versus Aswan High Dam: A View from Egypt; Springer: Cham, Switzerland, 2019; pp. 53–72. [Google Scholar]
- Karunanayake, C.; Gunathilake, M.B.; Rathnayake, U. Inflow forecast of iranamadu reservoir, Sri Lanka, under projected climate scenarios using artificial neural networks. Appl. Comput. Intell. Soft Comput. 2020, 2020, 8821627. [Google Scholar] [CrossRef]
- Jiao, H.; Wei, H.; Yang, Q.; Li, M. Application Research of CFD-MOEA/D Optimization Algorithm in Large-Scale Reservoir Flood Control Scheduling. Processes 2022, 10, 2318. [Google Scholar] [CrossRef]
- Guo, W.; Yue, J.; Zhao, Q.; Li, J.; Yu, X.; Mao, Y. A 110 Year Sediment Record of Polycyclic Aromatic Hydrocarbons Related to Economic Development and Energy Consumption in Dongping Lake, North China. Molecules 2021, 26, 6828. [Google Scholar] [CrossRef]
- Bacopoulos, P.; Hagen, S.C. Physics-based sizing functions for ocean-to-estuary shallow-water models. Ocean Model. 2022, 176, 102061. [Google Scholar] [CrossRef]
- Wang, W.; Chen, W.; Huang, G.; Liu, J.; Zhang, D.; Wang, F. A hybrid shallow water approach with unstructured triangular grids for urban flood modeling. Environ. Model. Softw. 2023, 166, 105748. [Google Scholar] [CrossRef]
- Ye, R.; Zhang, C.; Kong, J.; Jin, G.; Zhao, H.; Song, Z.; Li, L. A non-negative and high-resolution finite volume method for the depth-integrated solute transport equation using an unstructured triangular mesh. Environ. Fluid Mech. 2018, 18, 1379–1411. [Google Scholar] [CrossRef]
- Xu, Y.; Yang, G.; Hu, D. A three-dimensional ISPH-FVM coupling method for simulation of bubble rising in viscous stagnant liquid. Ocean Eng. 2023, 278, 114497. [Google Scholar] [CrossRef]
- Faroux, D.; Washino, K.; Tsuji, T.; Tanaka, T. Coupling non-local rheology and volume of fluid (VOF) method: A finite volume method (FVM) implementation. In EPJ Web of Conferences; EDP Sciences: Les Ulis, France, 2021; Volume 249, p. 03025. [Google Scholar]
- Bidadi, S.; Rani, S.L. On the stability and diffusive characteristics of Roe-MUSCL and Runge–Kutta schemes for inviscid Taylor–Green vortex. J. Comput. Phys. 2015, 299, 339–351. [Google Scholar] [CrossRef]
- Bidadi, S.; Rani, S.L. Corrigendum to “On the stability and diffusive characteristics of Roe-MUSCL and Runge-Kutta schemes for inviscid Taylor-Green vortex” [Journal of Computational Physics 299 (2015) 339-351]. J. Comput. Phys. 2016, 305, 1172. [Google Scholar] [CrossRef]
- Figuérez, J.A.; Galán, Á.; González, J. An enhanced treatment of boundary conditions for 2D RANS streamwise velocity models in open channel flow. Water 2021, 13, 1001. [Google Scholar] [CrossRef]
- Monnier, J.; Couderc, F.; Dartus, D.; Larnier, K.; Madec, R.; Vila, J.P. Inverse algorithms for 2D shallow water equations in presence of wet dry fronts: Application to flood plain dynamics. Adv. Water Resour. 2016, 97, 11–24. [Google Scholar] [CrossRef]
- Wintermeyer, N.; Winters, A.R.; Gassner, G.J.; Warburton, T. An entropy stable discontinuous Galerkin method for the shallow water equations on curvilinear meshes with wet/dry fronts accelerated by GPUs. J. Comput. Phys. 2018, 375, 447–480. [Google Scholar] [CrossRef]
- Yang, C.; Yang, L.; Xie, X. Study on the Time of Jinshan Dam Breaking when Dongping Lake Retains Dawen River Flood. Yellow River 2008, 30, 99–100. (In Chinese) [Google Scholar]
- Chen, C.; Fu, J.; Wu, M.; Gao, X.; Ma, L. High-efficiency sediment-transport requirements for operation of the Xiaolangdi Reservoir in the Lower Yellow River. Water Supply 2022, 22, 8572–8586. [Google Scholar] [CrossRef]
- Sparks, T.D.; Bockelmann-Evans, B.N.; Falconer, R.A. Development and analytical verification of an integrated 2-D surface water—Groundwater model. Water Resour. Manag. 2013, 27, 2989–3004. [Google Scholar] [CrossRef]
- Gupta, I.; Dhage, S.; Jacob, N.; Navada, S.V.; Kumar, R. Calibration and validation of far field dilution models for outfall at Worli, Mumbai. Environ. Monit. Assess. 2006, 114, 199–209. [Google Scholar] [CrossRef]
- Othata, P.; Pochai, N. A Mathematical Model of Salinity Control in a River with an Effect of Internal Waves using Two Explicit Finite Difference Methods. Engineering Letters 2021, 29, EL_29_2_37. [Google Scholar]
- Mohit MA, A.; Yamashiro, M.; Hashimoto, N.; Mia, M.B.; Ide, Y.; Kodama, M. Impact assessment of a major river basin in Bangladesh on storm surge simulation. J. Mar. Sci. Eng. 2018, 6, 99. [Google Scholar] [CrossRef]
- Kaptsov, E.I.; Dorodnitsyn, V.A.; Meleshko, S.V. Conservative invariant finite-difference schemes for the modified shallow water equations in Lagrangian coordinates. Stud. Appl. Math. 2022, 149, 729–761. [Google Scholar] [CrossRef]
- Tang, S.P.; Huang, Y.M. A fast ADI based matrix splitting preconditioning method for the high dimensional space fractional diffusion equations in conservative form. Comput. Math. Appl. 2023, 144, 210–220. [Google Scholar] [CrossRef]
- He, M.; Liao, W. A compact ADI finite difference method for 2D reaction–diffusion equations with variable diffusion coefficients. J. Comput. Appl. Math. 2024, 436, 115400. [Google Scholar] [CrossRef]
- Xu, R.; Borthwick, A.G.; Xu, B. Application of Large Time Step TVD High Order Scheme to Shallow Water Equations. Atmosphere 2022, 13, 1856. [Google Scholar] [CrossRef]
- Kuok, K.K.; Mersal, M.; Chiu, P.C.; Chin, M.Y.; Rahman, M.R.; Bakri, M.K.B. Climate change impacts on sea level rise to flood depth and extent of Sarawak River. Front. Water 2022, 4, 870936. [Google Scholar] [CrossRef]
- van Alphen, J.; Haasnoot, M.; Diermanse, F. Uncertain accelerated sea-level rise, potential consequences, and adaptive strategies in the Netherlands. Water 2022, 14, 1527. [Google Scholar] [CrossRef]
- De Bruijn, K.M.; Diermanse, F.L.; Weiler, O.M.; De Jong, J.S.; Haasnoot, M. Protecting the Rhine-Meuse delta against sea level rise: What to do with the river’s discharge? J. Flood Risk Manag. 2022, 15, e12782. [Google Scholar] [CrossRef]


| Working Conditions | The Extent of Backwater Effect | Yellow River Flood Conditions (Model Outlet) | Dawen River Inflow Conditions (Model Inlet) |
|---|---|---|---|
| Working condition 1 | No | “2001” flood | 20-year design flood |
| Working condition 2 | Moderate | “1996” flood | |
| Working condition 3 | Serious | “1964” flood |
| Main Parameters | Parameters Values |
|---|---|
| The composite Manning’s roughness coefficient | 0.032 |
| The computational time step (s) | 0.025 |
| Viscosity (N·s/m2) | 0.001 |
Disclaimer/Publisher’s Note: The statements, opinions and data contained in all publications are solely those of the individual author(s) and contributor(s) and not of MDPI and/or the editor(s). MDPI and/or the editor(s) disclaim responsibility for any injury to people or property resulting from any ideas, methods, instructions or products referred to in the content. |
© 2023 by the authors. Licensee MDPI, Basel, Switzerland. This article is an open access article distributed under the terms and conditions of the Creative Commons Attribution (CC BY) license (https://creativecommons.org/licenses/by/4.0/).
Share and Cite
Zhang, X.; Bi, Z.; Sun, X.; Wang, P.; Xu, Z.; Jia, B. Backwater Effects in Rivers and Lakes: Case Study of Dongping Lake in China. Water 2023, 15, 3850. https://doi.org/10.3390/w15213850
Zhang X, Bi Z, Sun X, Wang P, Xu Z, Jia B. Backwater Effects in Rivers and Lakes: Case Study of Dongping Lake in China. Water. 2023; 15(21):3850. https://doi.org/10.3390/w15213850
Chicago/Turabian StyleZhang, Xiaolei, Zhengzheng Bi, Xiaoming Sun, Pengtao Wang, Zhiheng Xu, and Benyou Jia. 2023. "Backwater Effects in Rivers and Lakes: Case Study of Dongping Lake in China" Water 15, no. 21: 3850. https://doi.org/10.3390/w15213850
APA StyleZhang, X., Bi, Z., Sun, X., Wang, P., Xu, Z., & Jia, B. (2023). Backwater Effects in Rivers and Lakes: Case Study of Dongping Lake in China. Water, 15(21), 3850. https://doi.org/10.3390/w15213850