Article

A Finite Volume Method for a 2D Dam-Break Simulation on a Wet Bed Using a Modified HLLC Scheme

by
Mohammad Milad Salamttalab
1,
Behnam Parmas
2,
Hedi Mustafa Alee
3,
Farhad Hooshyaripor
2,
Ali Danandeh Mehr
4,5,*,
Hamidreza Vosoughifar
6,
Seyed Abbas Hosseini
2,
Mohsen Maghrebi
7 and
Roohollah Noori
7,8
1
School of Civil Engineering, Iran University of Science and Technology, Narmak, Tehran 1684613114, Iran
2
Department of Civil Engineering, Science and Research Branch, Islamic Azad University, Tehran 14515, Iran
3
Department of Road and Construction, Erbil Technology College, Erbil Polytechnic University, Erbil 44001, Iraq
4
Civil Engineering Department, Antalya Bilim University, Antalya 07190, Turkey
5
New Era and Development in Civil Engineering Research Group, Scientific Research Center, Al-Ayen University, Thi-Qar 64001, Iraq
6
Civil and Environmental Engineering, University of Hawaii at Manoa, Manoa, HI 96822, USA
7
Graduate Faculty of Environment, University of Tehran, Tehran 1417853111, Iran
8
Faculty of Governance, University of Tehran, Tehran 1439814151, Iran
*
Author to whom correspondence should be addressed.
Water 2023, 15(21), 3841; https://doi.org/10.3390/w15213841
Submission received: 29 September 2023 / Revised: 23 October 2023 / Accepted: 31 October 2023 / Published: 3 November 2023

Abstract

:
This study proposes a numerical model for depth-averaged Reynolds equations (shallow-water equations) to investigate a dam-break problem, based upon a two-dimensional (2D) second-order upwind cell-centre finite volume method. The transportation terms were modelled using a modified approximate HLLC Riemann solver with the first-order accuracy. The proposed 2D model was assessed and validated through experimental data and analytical solutions for several dam-break cases on a wet and dry bed. The results showed that the error values of the model are lower than those of existing numerical methods at different points. Our findings also revealed that the dimensionless error parameters decrease as the wave propagates downstream. In general, the new model can model the dam-break problem and captures the shock wave superbly.

1. Introduction

In comparison to common river floods created by intense storms, dam-break floods have higher peaks and earlier times to peak. This makes dam-break floods more catastrophic, so its modelling is of paramount importance in hydraulic engineering. From a modelling perspective, mathematical problems in hydraulics are conventionally solved by either an analytical or a numerical method [1,2,3]. In the former, pure mathematical equations are used to solve for one value which is always correct [4,5]. However, in the latter, iterative calculations are used to find the closest value to the analytical solutions [6,7]. In recent studies, emerging soft-computing techniques, which may reduce computation time, are reported as alternatives for traditional numerical methods [8,9,10]. However, the quantification of uncertainties in soft computing techniques remains a challenging task [11,12,13].
Various hydrologic, hydraulic, and geotechnical factors must be analysed in a dam-break modelling problem. From a hydrological point of view, estimating a reservoir outflow (i.e., flood) hydrograph and its propagation along the downstream channel, also known as channel routing, are two primary issues in dam-break studies. These tasks have been successfully examined using a variety of numerical models [14,15,16]. These models solve the governing hydraulic equations to estimate flood wave characteristics throughout the broken dam/reservoir and river. Simulations of dam breaks and solutions to the Navier–Stokes equations, in general, have a relatively long history. Due to the nonlinearity and complexity of these equations, they cannot be solved analytically, except for in specific cases. This fact has resulted in the evolution of various numerical solutions for these equations. Due to high gradients (shock), numerical solutions to these equations are associated with specific complexities [17]. To model a dam-break problem, three-dimensional (3D) Reynolds-averaged Navier–Stokes equations could be solved [18,19,20,21], although solutions to the two-dimensional (2D) shallow-water equations (SWEs) are possible. Several researchers have compared 3D models based on the solution of depth-averaged Navier–Stokes equations and shallow water models and showed that the SWEs could even appropriately model the key aspects of the flood flow [18,22,23].
A variety of methods can be used to solve the SWEs, such as the finite element and finite volume methods [24,25,26,27]. Liang et al. [28] used MacCormack’s method, along with the total variation diminishing (TVD) algorithm as an explicit solution to the SWEs. The symmetric five-point TVD method was used in the prediction stage. They used a non-conservative form of the equations to solve the problem. The authors showed that the discretization of the conservative and non-conservative forms of the SWEs results in a similar finite difference method if the source term is discretized with a certain method. Liang et al. [29] generalised dynamic simulations of shallow water over a uniform Cartesian network, using McCormack’s method modified with the TVD algorithm. Further comparison between the McCormack–TVD and alternating direction implicit (ADI) methods revealed that they can predict the shock front of the shallow flow. According to the results, the ADI method is accurate for the prediction of the critical transient flows; in addition, the artificial viscosity for the removal of oscillation is introduced to the solution. The study demonstrated that the McCormack–TVD model can precisely simulate all flow regimes and produce perfectly matched results with the Godunov-type models. Parmas and Vosoghifar [30] proposed a smooth particle hydrodynamic method, namely PVS-Break, to model dam breaks and showed a good consistency between the numerical and experimental results. In another study, Vosoghifar et al. [31] used a Voronoi network to investigate the 2D dam-break wave at different times within 1.2 s after the break. Sing et al. [32] developed a 2D numerical model using a central reverse-direction method for the conservative form of the equations. This method was independent of the Riemann solver, in which a Courant number lower than 0.25 ensured the positivity of the flow depth over complex topographies. Baghlani [33] proposed a flux vector splitting approach for dam-break simulation on the Cartesian network, based on the finite element method. The new method was based on the combination of the flux difference and flux vector splitting, which are used for precise estimation of the numerical flux at the boundaries of each cell. Ferrari et al. [34] investigated the wave propagation on a dry bed after a dam-break simulation using two models. Aliparast [35] used the Harten–Lax–van Leer (HLL) approximate Riemann solver to handle discontinuous solutions through the computation of inviscid flux functions. Ying et al. [36] developed a powerful and precise model based on the finite element method and performed efficient computations for dam-break flow modelling on unstructured grids. The intercell flux was calculated by the Riemann approximate solver HLL. Kim et al. [37] reported that the approximate Riemann solvers are very vulnerable in the presence of strong shocks. This theory was made due to the turbulence transition in the transversal direction of the shock waves. As a result, to prevent such problems, a simple method was developed based on the Harten–Lax–van Leer-contact (HLLC) by defining an assessment function in the transversal direction of strong shocks within the finite volume framework. They combined HLLC and HLL within a single framework using a conversion function. The weighted average flux (WAF) method was used to enhance the order of accuracy. Their modified method was named HLLC-HLL and showed a satisfactory ability to control strong shocks. Loukili and Soulaimani [38] used the averaged equations of shallow water for the simulation of a dam-break on a wet bed. They applied the WAF method to SWEs. This method was applied to an unstructured triangular grid. The non-viscous fluxes were first obtained using HLLC. Then, they were determined using the weighted average method in which the TVD algorithm was employed. To enhance the bed slope calculation, the semi-implicit method was used for discretization of the source term and affecting a depth tolerance to dry areas. A comparison of the HLL, HLLC, Lax–Friedrichs, and WAF methods showed higher accuracy than WAF.
The conventional method of shock-capturing used in the abovementioned papers usually suffers from the numerical error of diffusion. To cope with this problem, some methods such as artificial viscosity have been used. However, in the modern shock-capturing methods a nonlinear numerical loss term with an automatic feedback mechanism must be used to adjust the loss amount in every cell in accordance with the solution gradient. Considering the importance of dam-break problems, the use of these new models would provide more accurate simulation in comparison to the conventional models. Therefore, in this study, a new numerical solution for the SWEs is proposed in which the finite volume method and Riemann approximate solver are used. To this end, the local Riemann problem, which appears due to the discreteness of the grid, is solved using the HLLC method in reciprocal cells. In addition, the equations are solved using the fully connected method. The new method guarantees the stability and accuracy of the solution even if there are strong shock waves. The proposed solution is validated with the laboratory results and the robustness of the model is demonstrated by comparing the results with two other numerical methods, namely, WAF and the semi-implicit method.

2. Methods

2.1. Analytical Solution (Wet Bed)

The SWEs are applicable for modelling many physical phenomena, including dam-break, flood propagation, hydraulic projection, pollution transmission, forces acting on coastal structures, tsunami, flow in the channel, and spillways. Neglecting the diffusion terms and Coriolis and wind effects, the conservative form of 2D depth-averaged shallow water equation is as shown in Equation (1) [39]:
U t + F ( U ) x + G ( U ) y = S ( U )
where, U is the vector of conservative variables, F(U) and G(U) are flux vectors, and S(U) is the source term vector defined as follows [39]:
F ( U ) = h u h u 2 + g h 2 2 h u v
G ( U ) = h u h v u h v 2 + g h 2 2
S ( U ) = 0 g h ( s 0 x s f x ) g h ( s 0 y s f y )
where h is the flow depth; u and v are the flow velocities in the x and y direction, respectively; g is the gravity acceleration; and are the channel bottom slopes in the x and y directions; and are the friction slopes, respectively, in the x and y directions which are replaced from the Manning equation. For a horizontal and frictionless wet channel with the length of L where the dam is in the middle of the channel, the analytical solution can be written for an instantaneous dam break. It is assumed that the dam is suddenly removed, and the initial velocity is zero throughout the channel. For a 1 m channel, the initial conditions for the depth at the left (hL) and right (hR) sides of the dam are as shown in Equation (5):
h ( x , 0 ) = h L    l e f t s i d e o f t h e d a m h R    t h e o t h e r
where the origin of the Cartesian coordinate is located at the far upstream end of the channel. To solve the above problem, Stoker proposed an analytical solution for u (Equation (6)) and h (Equation (7)) [40]:
u ( x , t ) = 0 i f x 0.5 t g h L 1 3 t ( 2 ( x + t g h L ) 1 ) i f 0.5 t g h L x ( u 2 c 2 ) t + 0.5 u 2 i f ( u 2 c 2 ) t + 0.5 < x < s t + 0.5 0 i f x > s t + 0.5
h ( x , t ) = h L i f x < 0.5 t g h L 1 9 g ( 2 g h L 1 2 t ( 2 x 1 ) ] 2 i f 0.5 t g h L x ( u 2 c 2 ) t + 0.5 h R 2 ( 1 + 8 s 2 g h R 1 ) i f ( u 2 c 2 ) t + 0.5 < x < s t + 0.5 h R i f x > s t + 0.5
where u2 and c2 are:
u 2 = S g h R 4 S ( 1 + 1 + 8 S 2 g h R
C 2 = g h R 2 1 + 8 S 2 g h R 1
The positive root velocity S can be found using the following equation:
u 2 + 2 C 2 2 g h R = 0

2.2. Numerical Method

2.2.1. Time Approximation

For time approximation, first-order Euler’s explicit method was used in this study. In the Euler’s explicit method, the integral term in the previous time step, t, multiplied by the time step value was assumed as the integral value, and the accuracy of the equations for time was of the first order. For the assumed function, F, which varies with time and space, the integral in the time range was as follows:
t t + Δ t F d t = F t × Δ t
In addition, this method does not need to solve an equation system for solving each cell as they are obtained explicitly from the values calculate in previous time step [41].

2.2.2. Approximate Solver Algorithm HLLC for Determination of Intercell Flux

To achieve an acceptable numerical solution to the problems of strong shocks, it is necessary to use nonlinear terms for shock capturing. In such cases, the error variation and numerical diffusion are significantly reduced, and the solution would be physically acceptable. To this end, several relaxation factors are generally used to control the gradient of the solution, and then the high instabilities are prevented. Given that the uniform methods (of stability) cannot be more than one degree, we tried to define methods of the second order of upstream type to utilize their innate properties of physical diffusion. Therefore, the numerical method is prevented from solving the numerical divergence problem. The main weakness of the HLL method is that it cannot resolve contact discontinuities exactly. Harten et al. [42] showed that this weakness is due to the lack of shear waves; although, it can be remedied by some techniques. Accordingly, Toro et al. [43] proposed the HLLC method in which C indicates the contact wave [42]. In this method, the deficiency of intermediate waves has been removed in the approximate solution of Riemann [43]. The HLLC method was firstly used for two-dimensional unsteady Euler’s equations. It has also been applied in two-dimensional shallow-water equations [44]. Considering individual fluid particles and their streamlines, we used the semi-Lagrangian technique to resolve the contact discontinuities problem in the present study.
Figure 1 shows the structure of the waves in a control volume for the solution of the Riemann problem. It is attached to the model in addition to wave velocities and mid-wave velocities to modify the structure of the solution. Considering the form and evaluation of the integral form of the law of conservation, we obtain the desired control volume for the Riemann equations.
The determination process of intercell flux through the approximate solver algorithm HLLC for the given wet bed is as follows:
  • Determination of h:
h * = 1 g 1 2 ( g h L + g h R ) + 1 4 ( u L u R ) 2 o r h * = ( h L + h R ) 1 4 ( u R u L ) ( h L + h R ) / ( g h L + g h R )
ii.
Obtaining velocities of SL, SR, and S * :
q R , L = 1 2 ( h * + h R , L ) h * h 2 R , L i f h * > h R , L 1 i f h * h R , L
S L = u L g h L q L    and    S R = u R g h R q R
S * = S L h R ( u R S R ) S R h L ( u L S L ) h R ( u R S R ) h L ( u L S L )
iii.
Determination of F * :
F * = S R F L S L F R + S L S R ( U R U L ) S R S L
iv.
Determination of F * L and F * R :
F * L = F * 1 F * 2 F * 1 ψ L    and F * R = F * 1 F * 2 F * 1 ψ R
v.
Calculation of intercell flux F i ± 1 / 2 :
F i + 1 / 2 h l l c = F L i f x t S L F * L i f S L x t S * F * R i f S * x t S R F R i f x t S R

2.2.3. Boundary Conditions

One of the main requirements of the numerical solution of SWEs is the definition of the boundary conditions at the upstream and downstream, and internal boundary conditions as well. In this research, an open-boundary condition was used for upstream and downstream boundaries. In the open boundaries, the flow parameters over the boundary were replaced without any change from the adjacent points. In this way, for the upstream and downstream boundaries, respectively, Equations (19) and (20) were employed [39]:
u n 0 = u n 1   and   h n 0 = h n 1
u n m + 1 = u n m   and   h n m + 1 = h n m
where u n 0 and u n 1 are the velocities at two sequent grids at the upstream end; h n 0 and    h n 1 are the flow depths at two sequent grids at the upstream end; u n m and u n m + 1 are the velocities at two sequent grids at the downstream end; and h n m and    h n m + 1 are the flow depths at two sequent grids at the downstream end.

2.3. Model’s Verification

To evaluate the numerical model’s performance, the numerical results are compared to the experimental and analytical data. In this regard, two non-dimensional statistical indices presented in Equations (21) and (22) are employed to analyse the compatibility of the developed numerical model.
E 1 h = h n u m h o b s h o b s h ¯ o b s
E 2 h = ( h n u m h o b s ) 2 ( h o b s h ¯ o b s ) 2
where E1(h) = Relative Error, E2(h) = Root Relative Square Error, hnum = flow depth in the numerical model, hobs = observed flow depth (analytical or experimental), and = mean observed flow depth. The same equations can be written for u, the flow velocity.

3. Results and Discussion

3.1. One-Dimensional (1D) Dam-Break Simulation

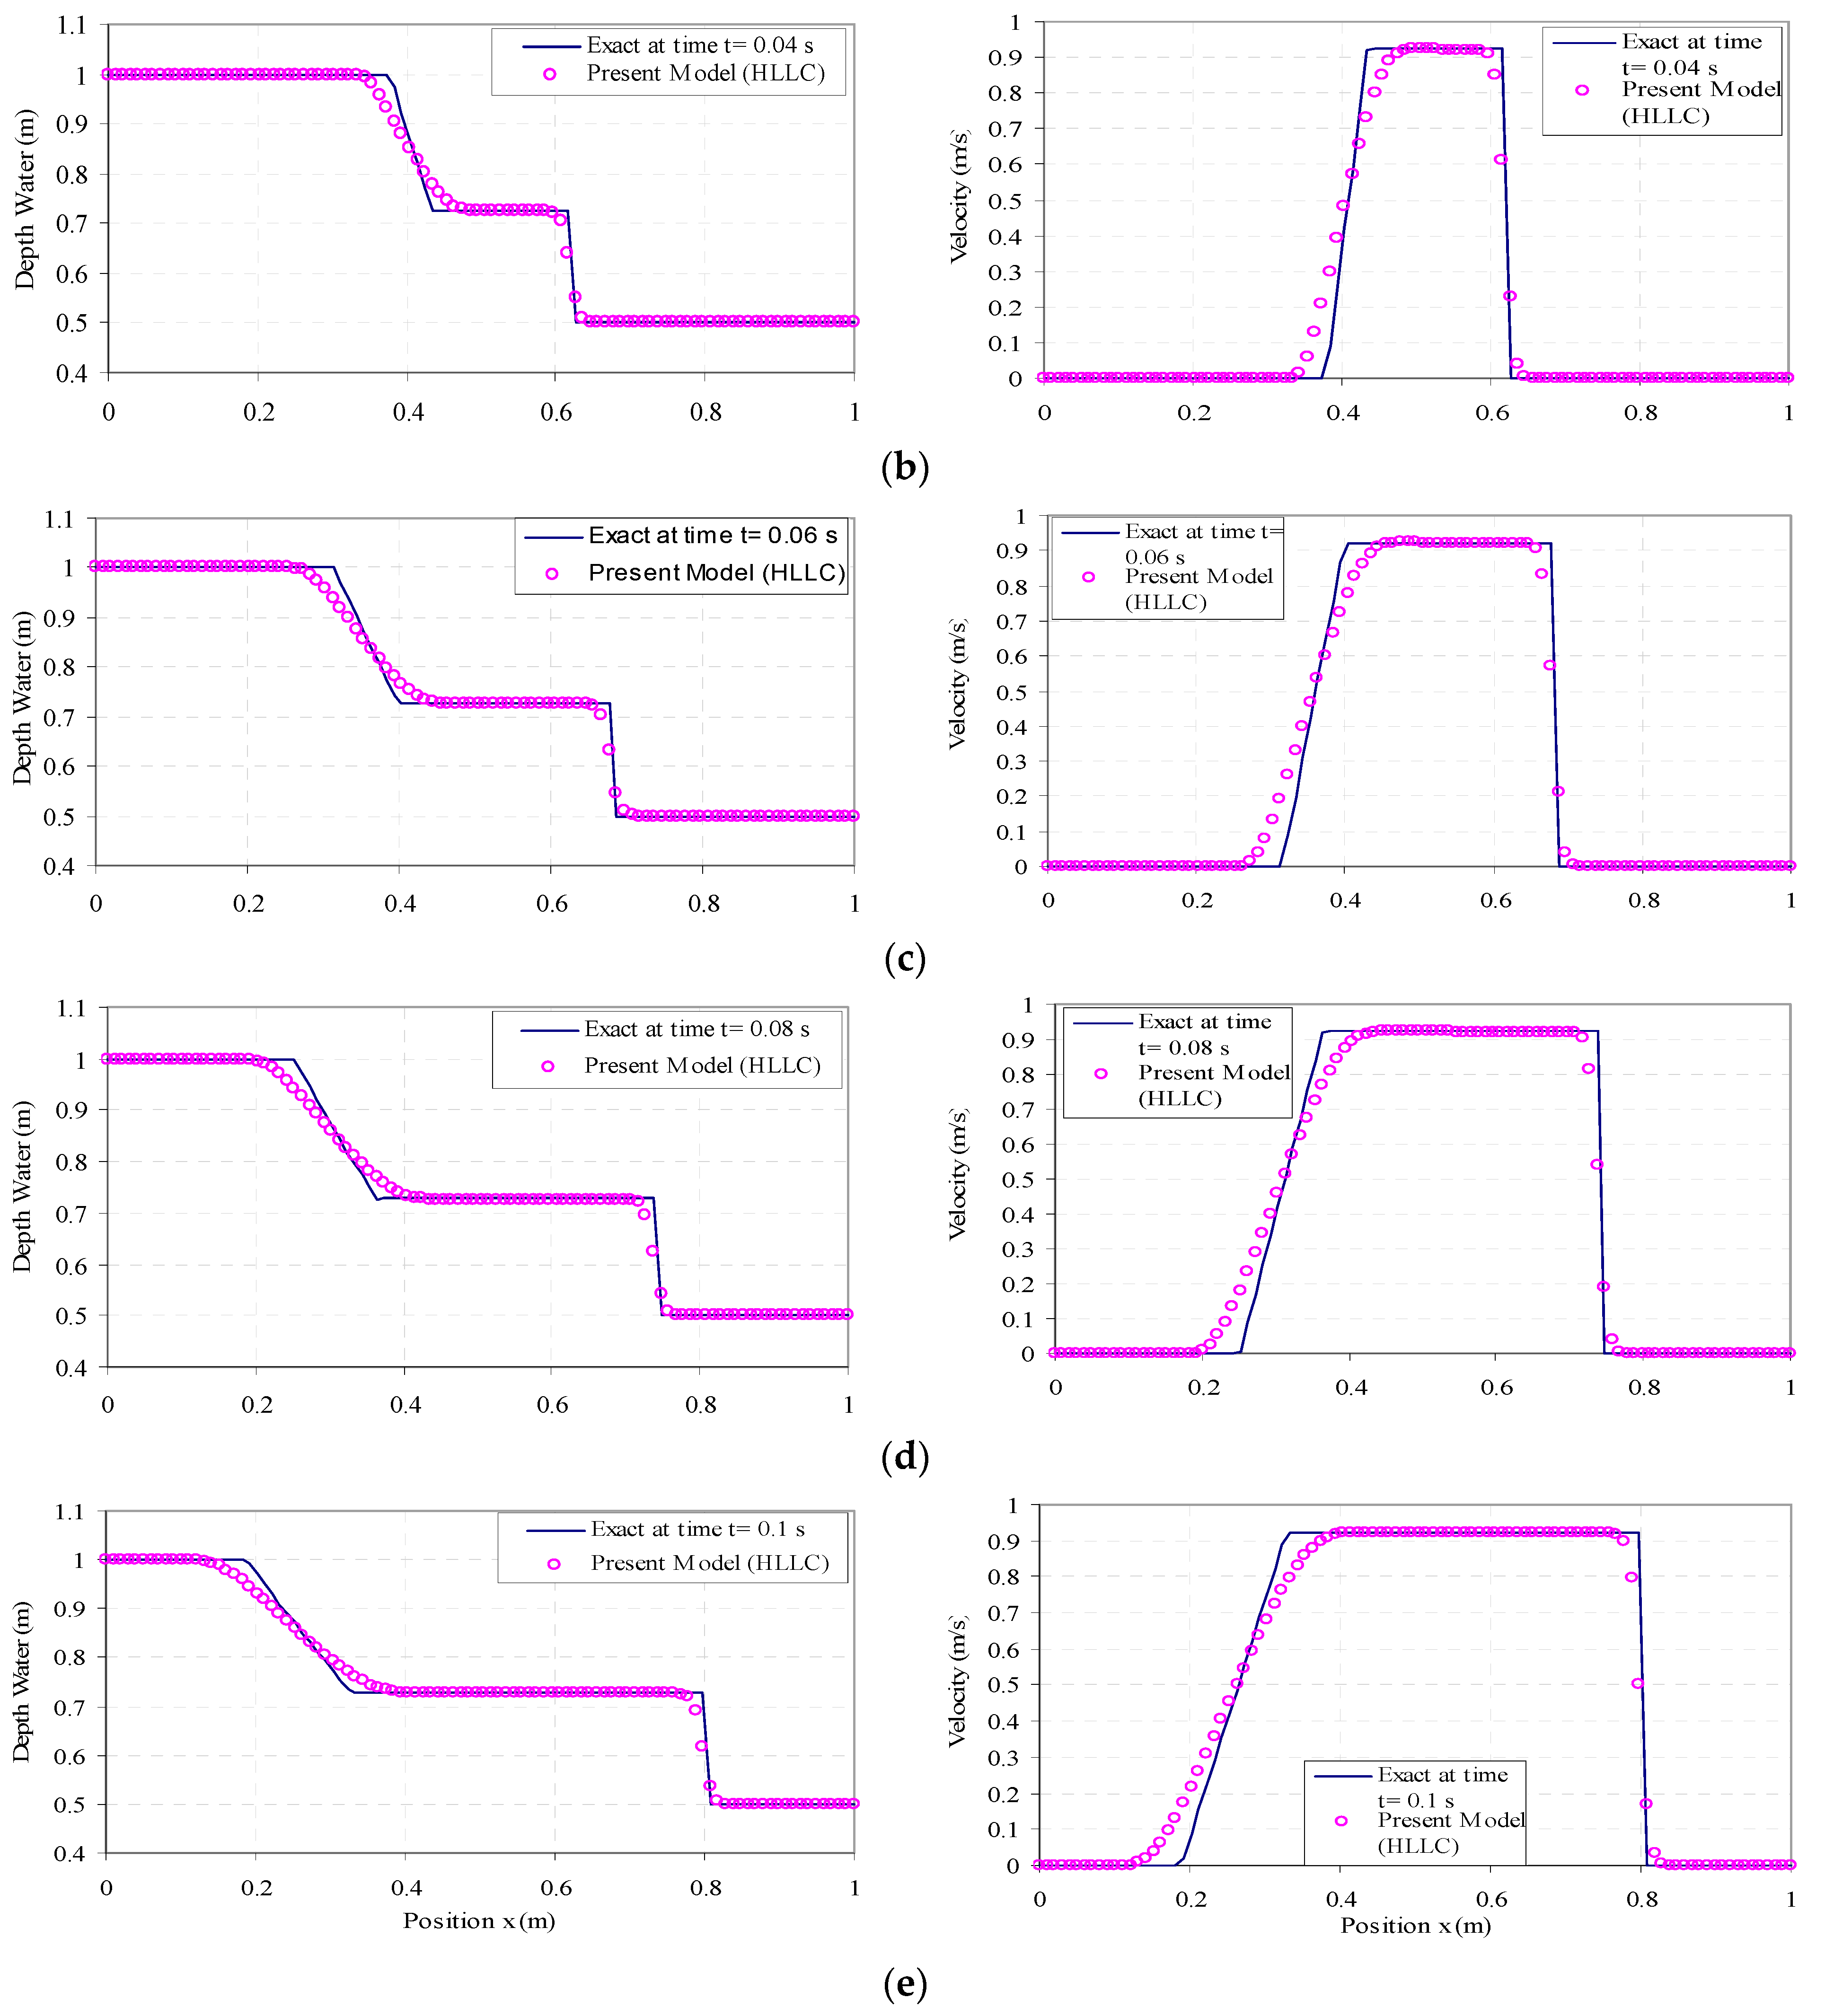
To evaluate the proposed numerical model, first, 1D dam-break problem in a wet bed is considered. The initial conditions in this test include: flow depths at upstream and downstream are 1.0 m and 0.5 m, respectively; initial flow velocity is zero; and the length of the model is 1.0 m. In numerical modelling, the flow length is divided into distances of Δx = 0.01 m. The value of 0.9 is assigned to the CFL number coefficient. In Figure 2, the numerical results in different times are compared to the Stoker analytical solution. Note that the dam is located at x = 0.5 m.
Figure 2 shows the formation of the shock wave in the right side and the negative wave in the left side of the dam.
In the analytical solution, where the expansion and compaction waves intersect with initial conditions, the graph is angled; whereas, the numerical solution graph in these areas is not smooth and does not completely overlap with that area. This is due to a numerical propagation error with artificially reduced sharpness in sharp areas or at the peak of the wave. However, the numerical graph shows satisfactory consistency with the analytical solution in the other areas. Table 1 presents the quantitative evaluation of the dimensionless error measures for the depth and velocity.

3.2. Two-Dimensional (2D) Dam Break

To evaluate the developed model, two experimental cases were considered. In the first case, the experimental test conducted by Fraccarollo and Toro [43] was employed and the data are taken from [45]. In this test, a reservoir sized 2 m × 1 m × 0.8 m was connected to a rectangular channel sized 2 m × 3 m through a rectangular gap sized 0.4 m × 0.8 m. Geometric characteristics of the experimental setup are presented in Figure 3 and Table 2. The water level in the reservoir was 0.6 m and the downstream was dry. The valve opened within a time interval of 0.1 s, and then the flow depths and velocities were measured at specific points of the reservoir and channel.
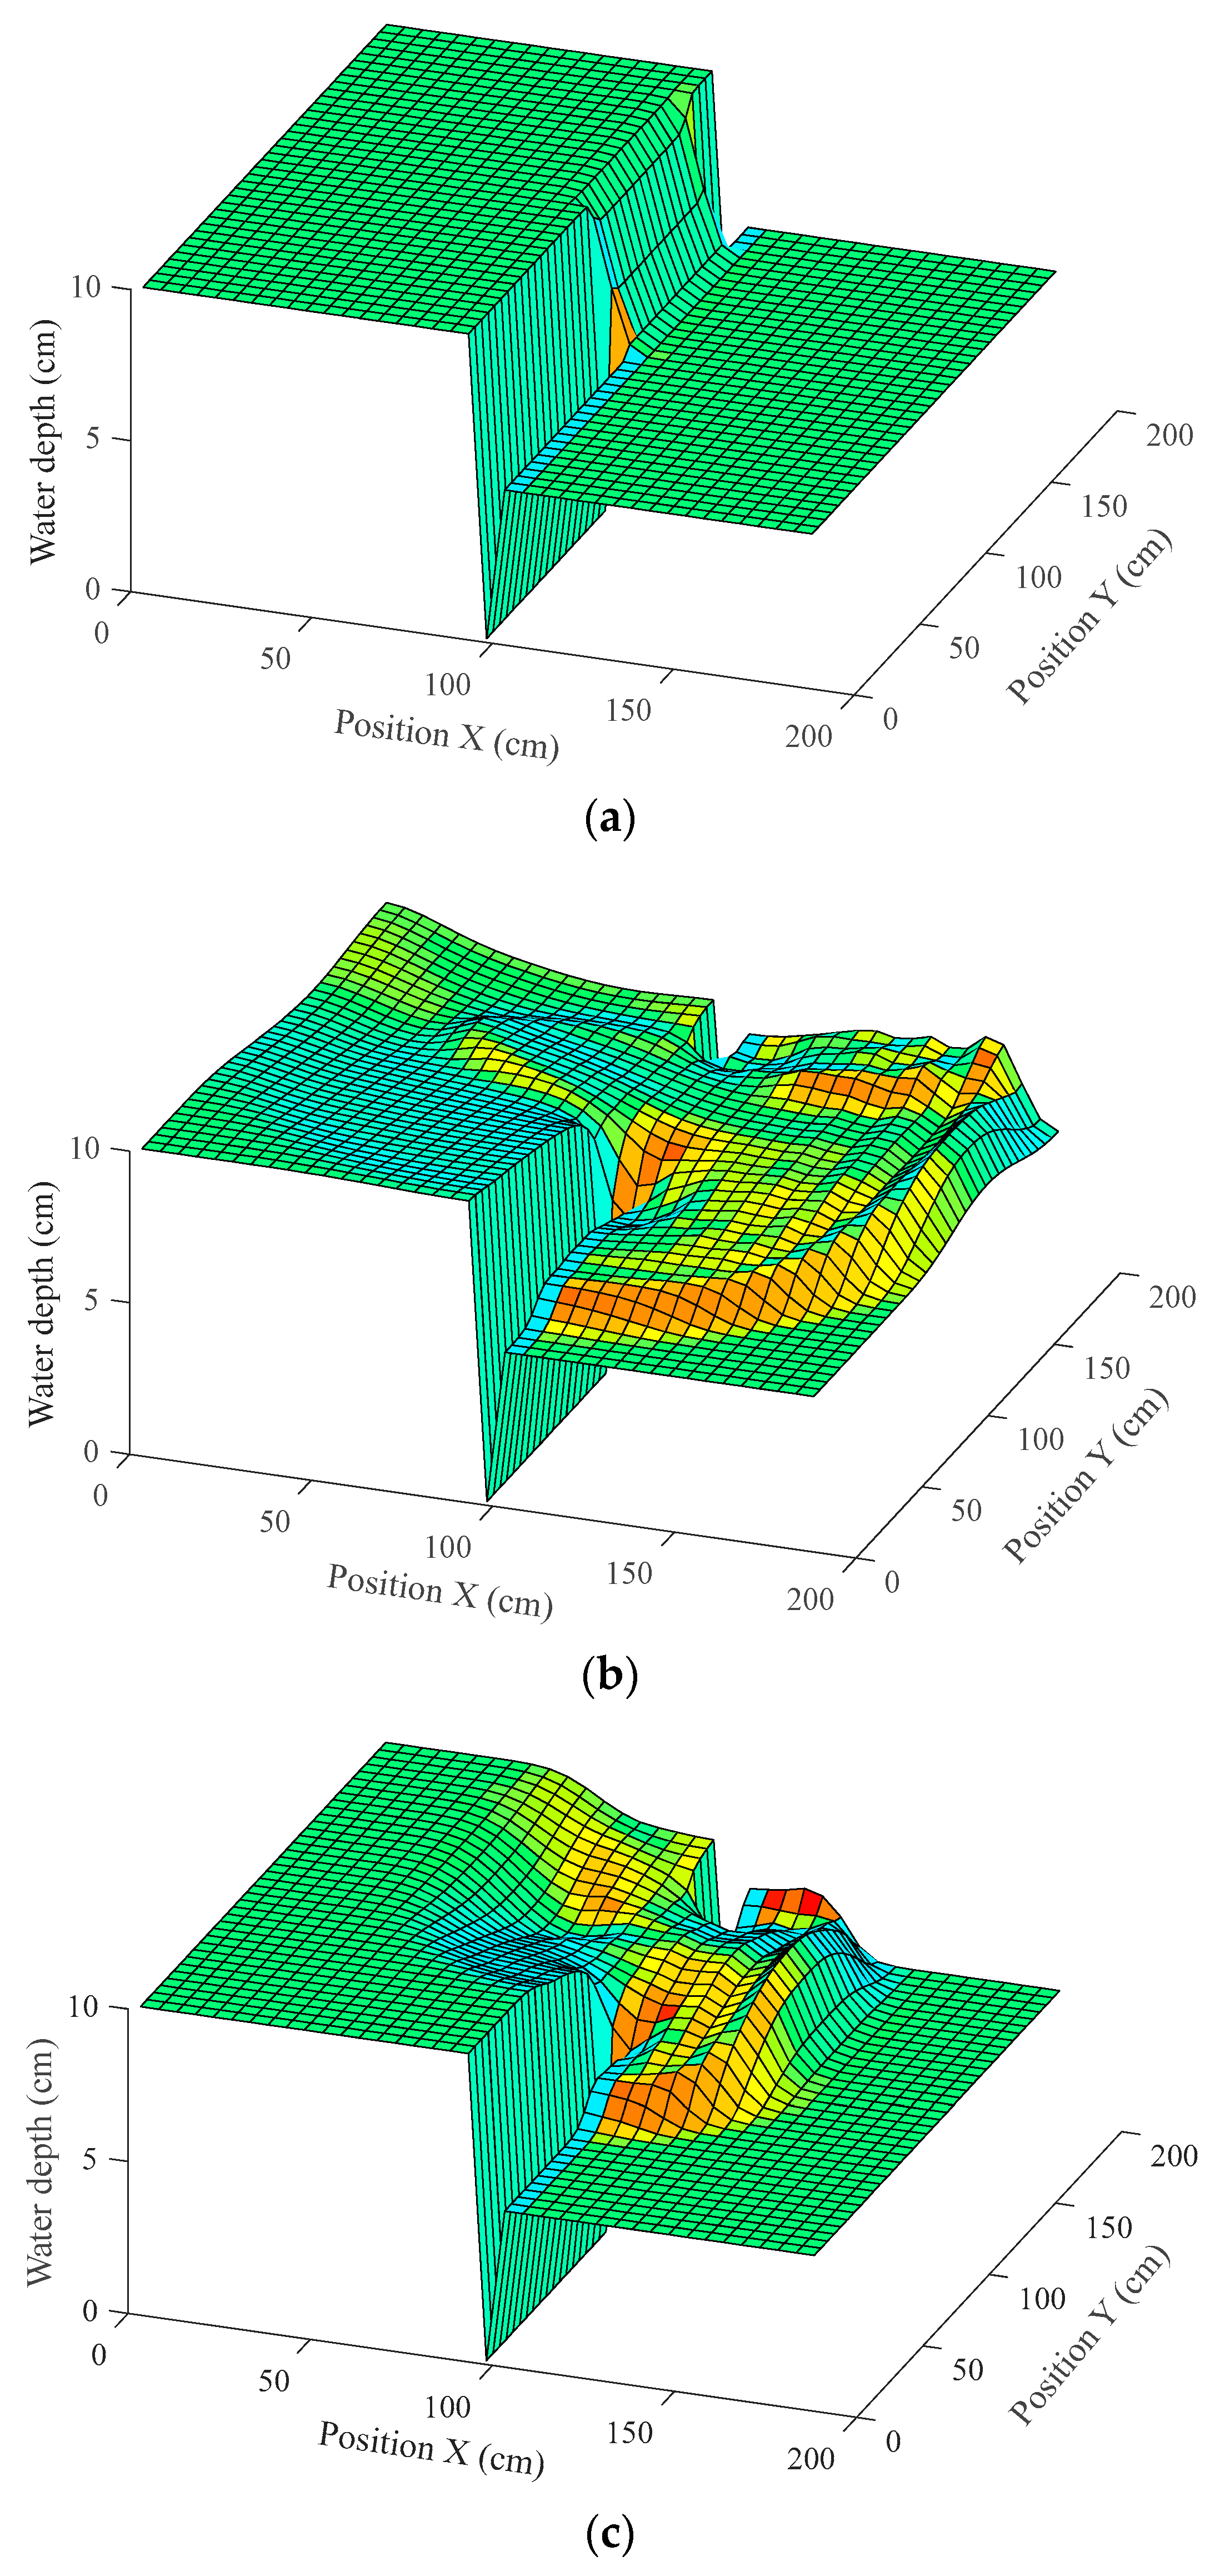
To solve this problem, a numerical solution on the basis of SWEs was developed. For the numerical model with a bed slope of zero, the computational elements were Δx = Δy = 0.04 m, the stability factor was 0.9, and the channel end was considered open [29]. Figure 4 illustrates a 3D view of the numerical model results.
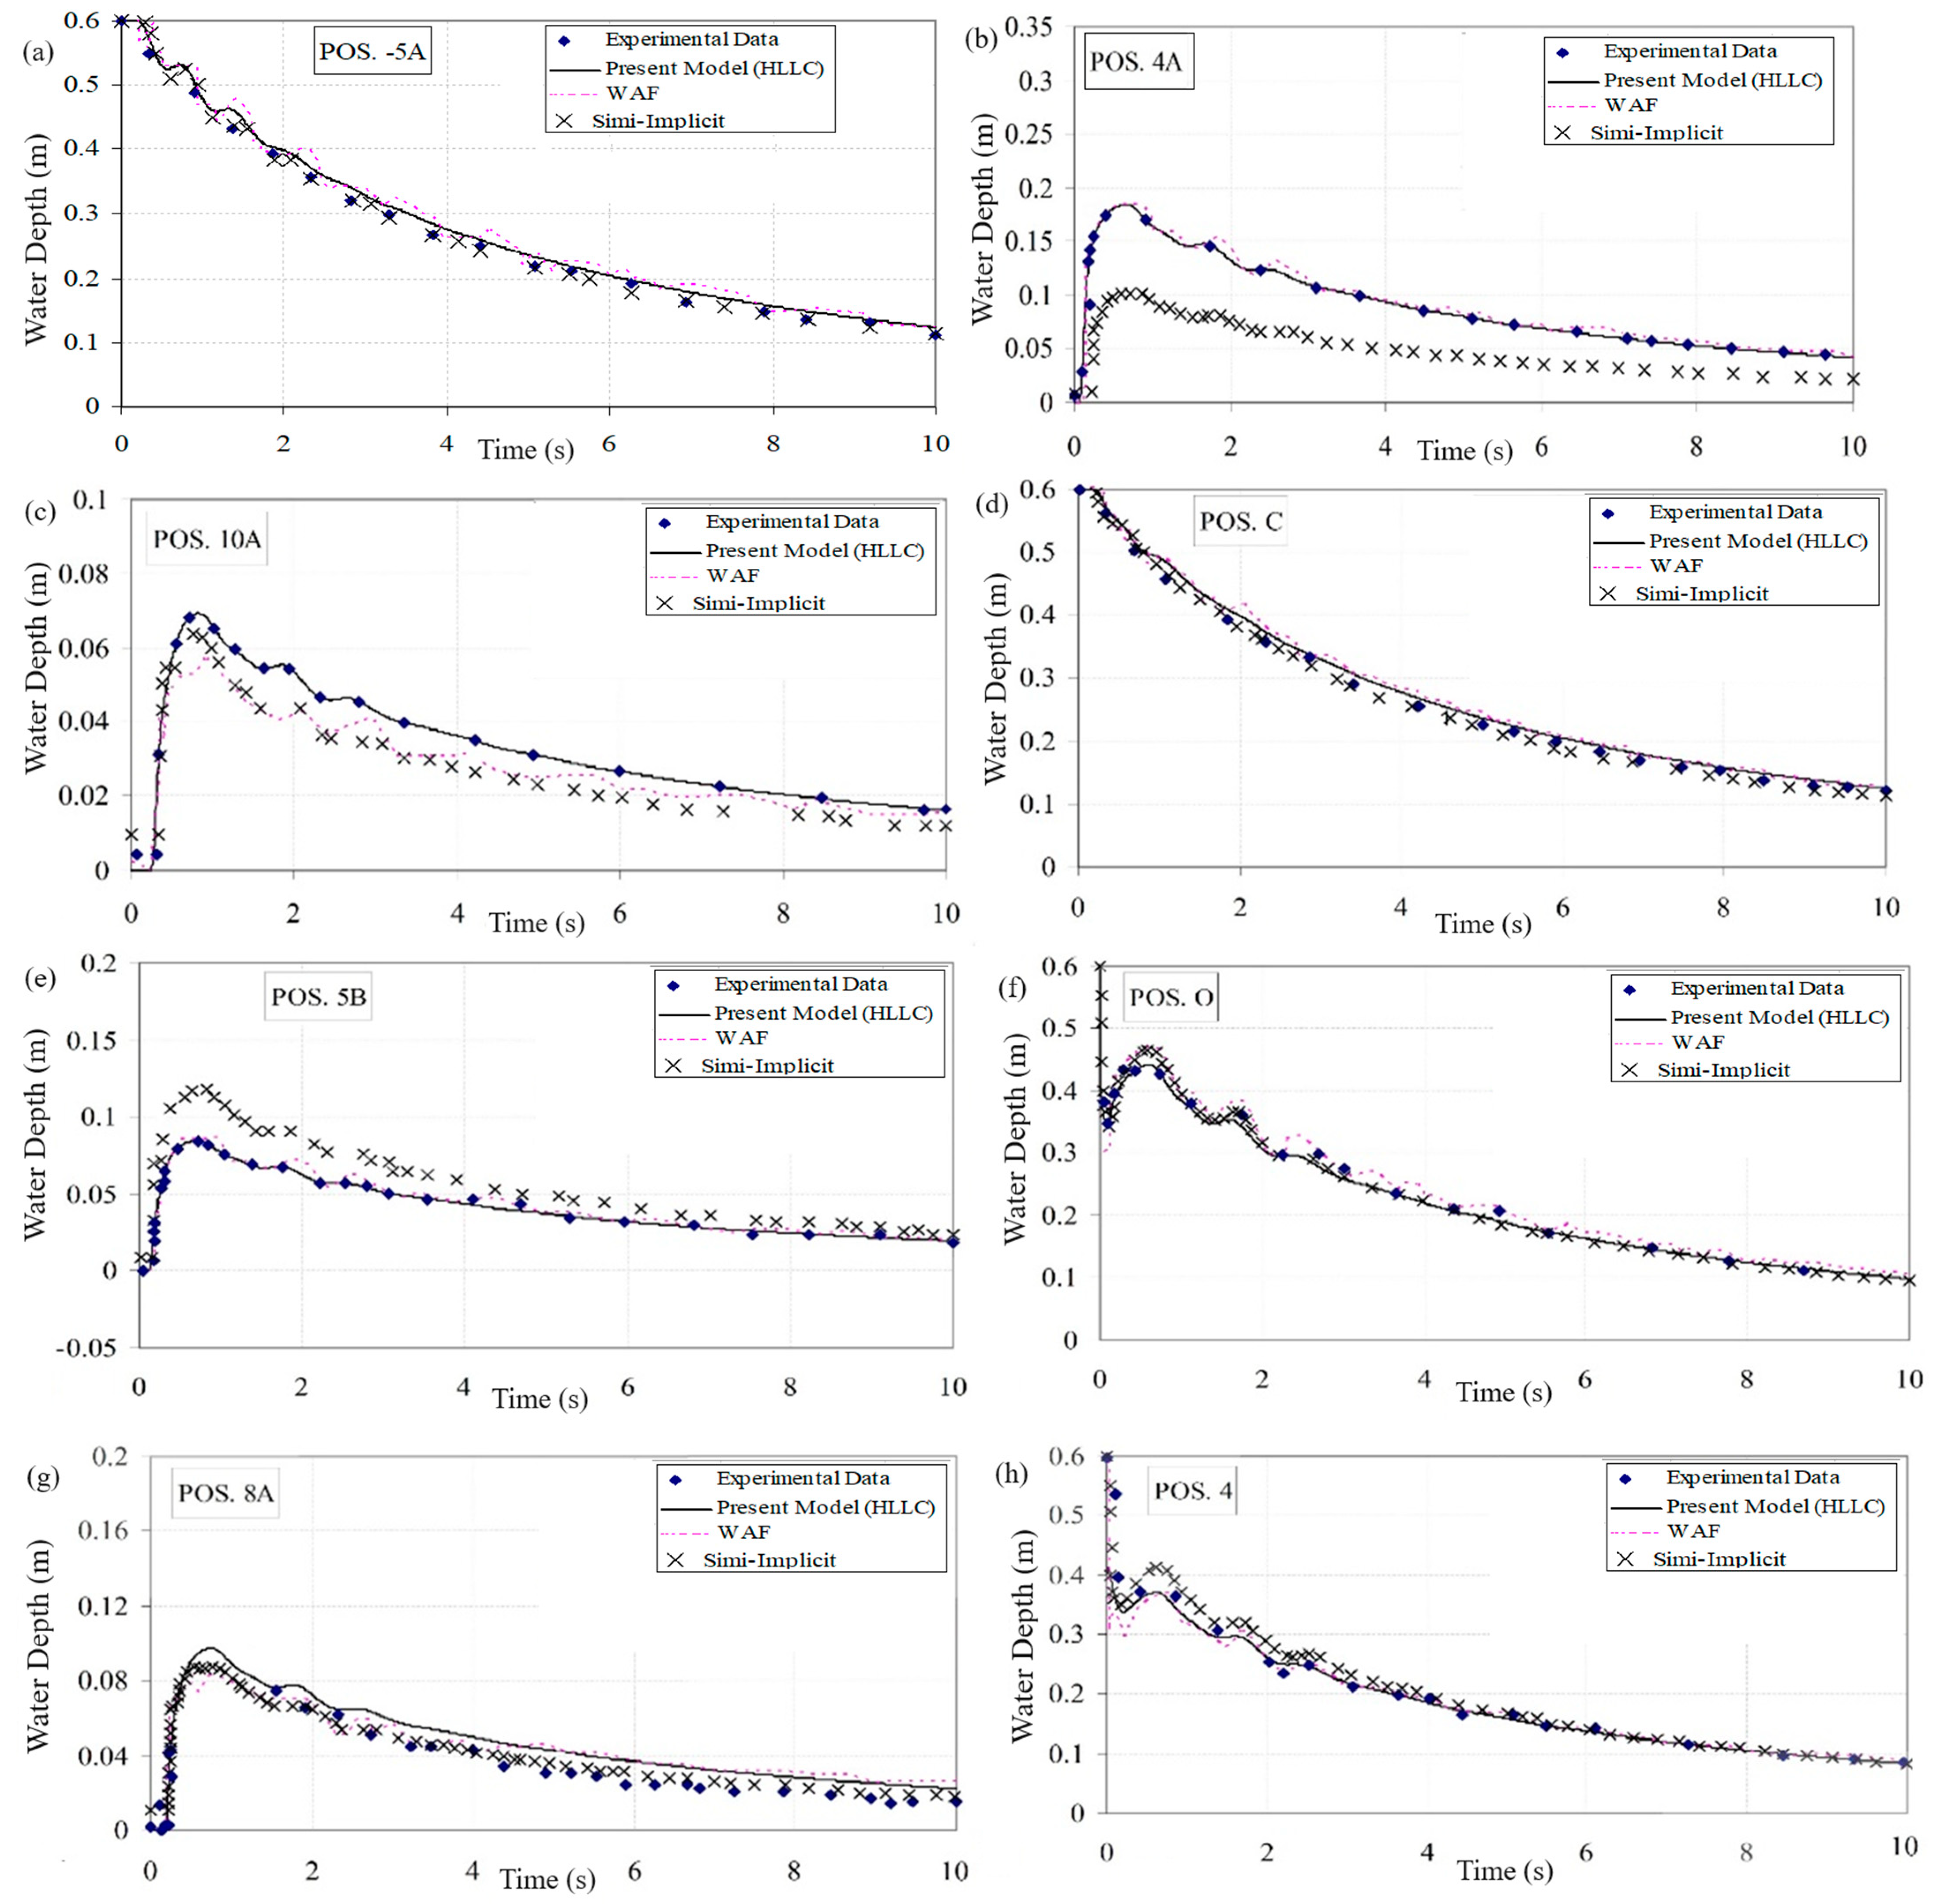
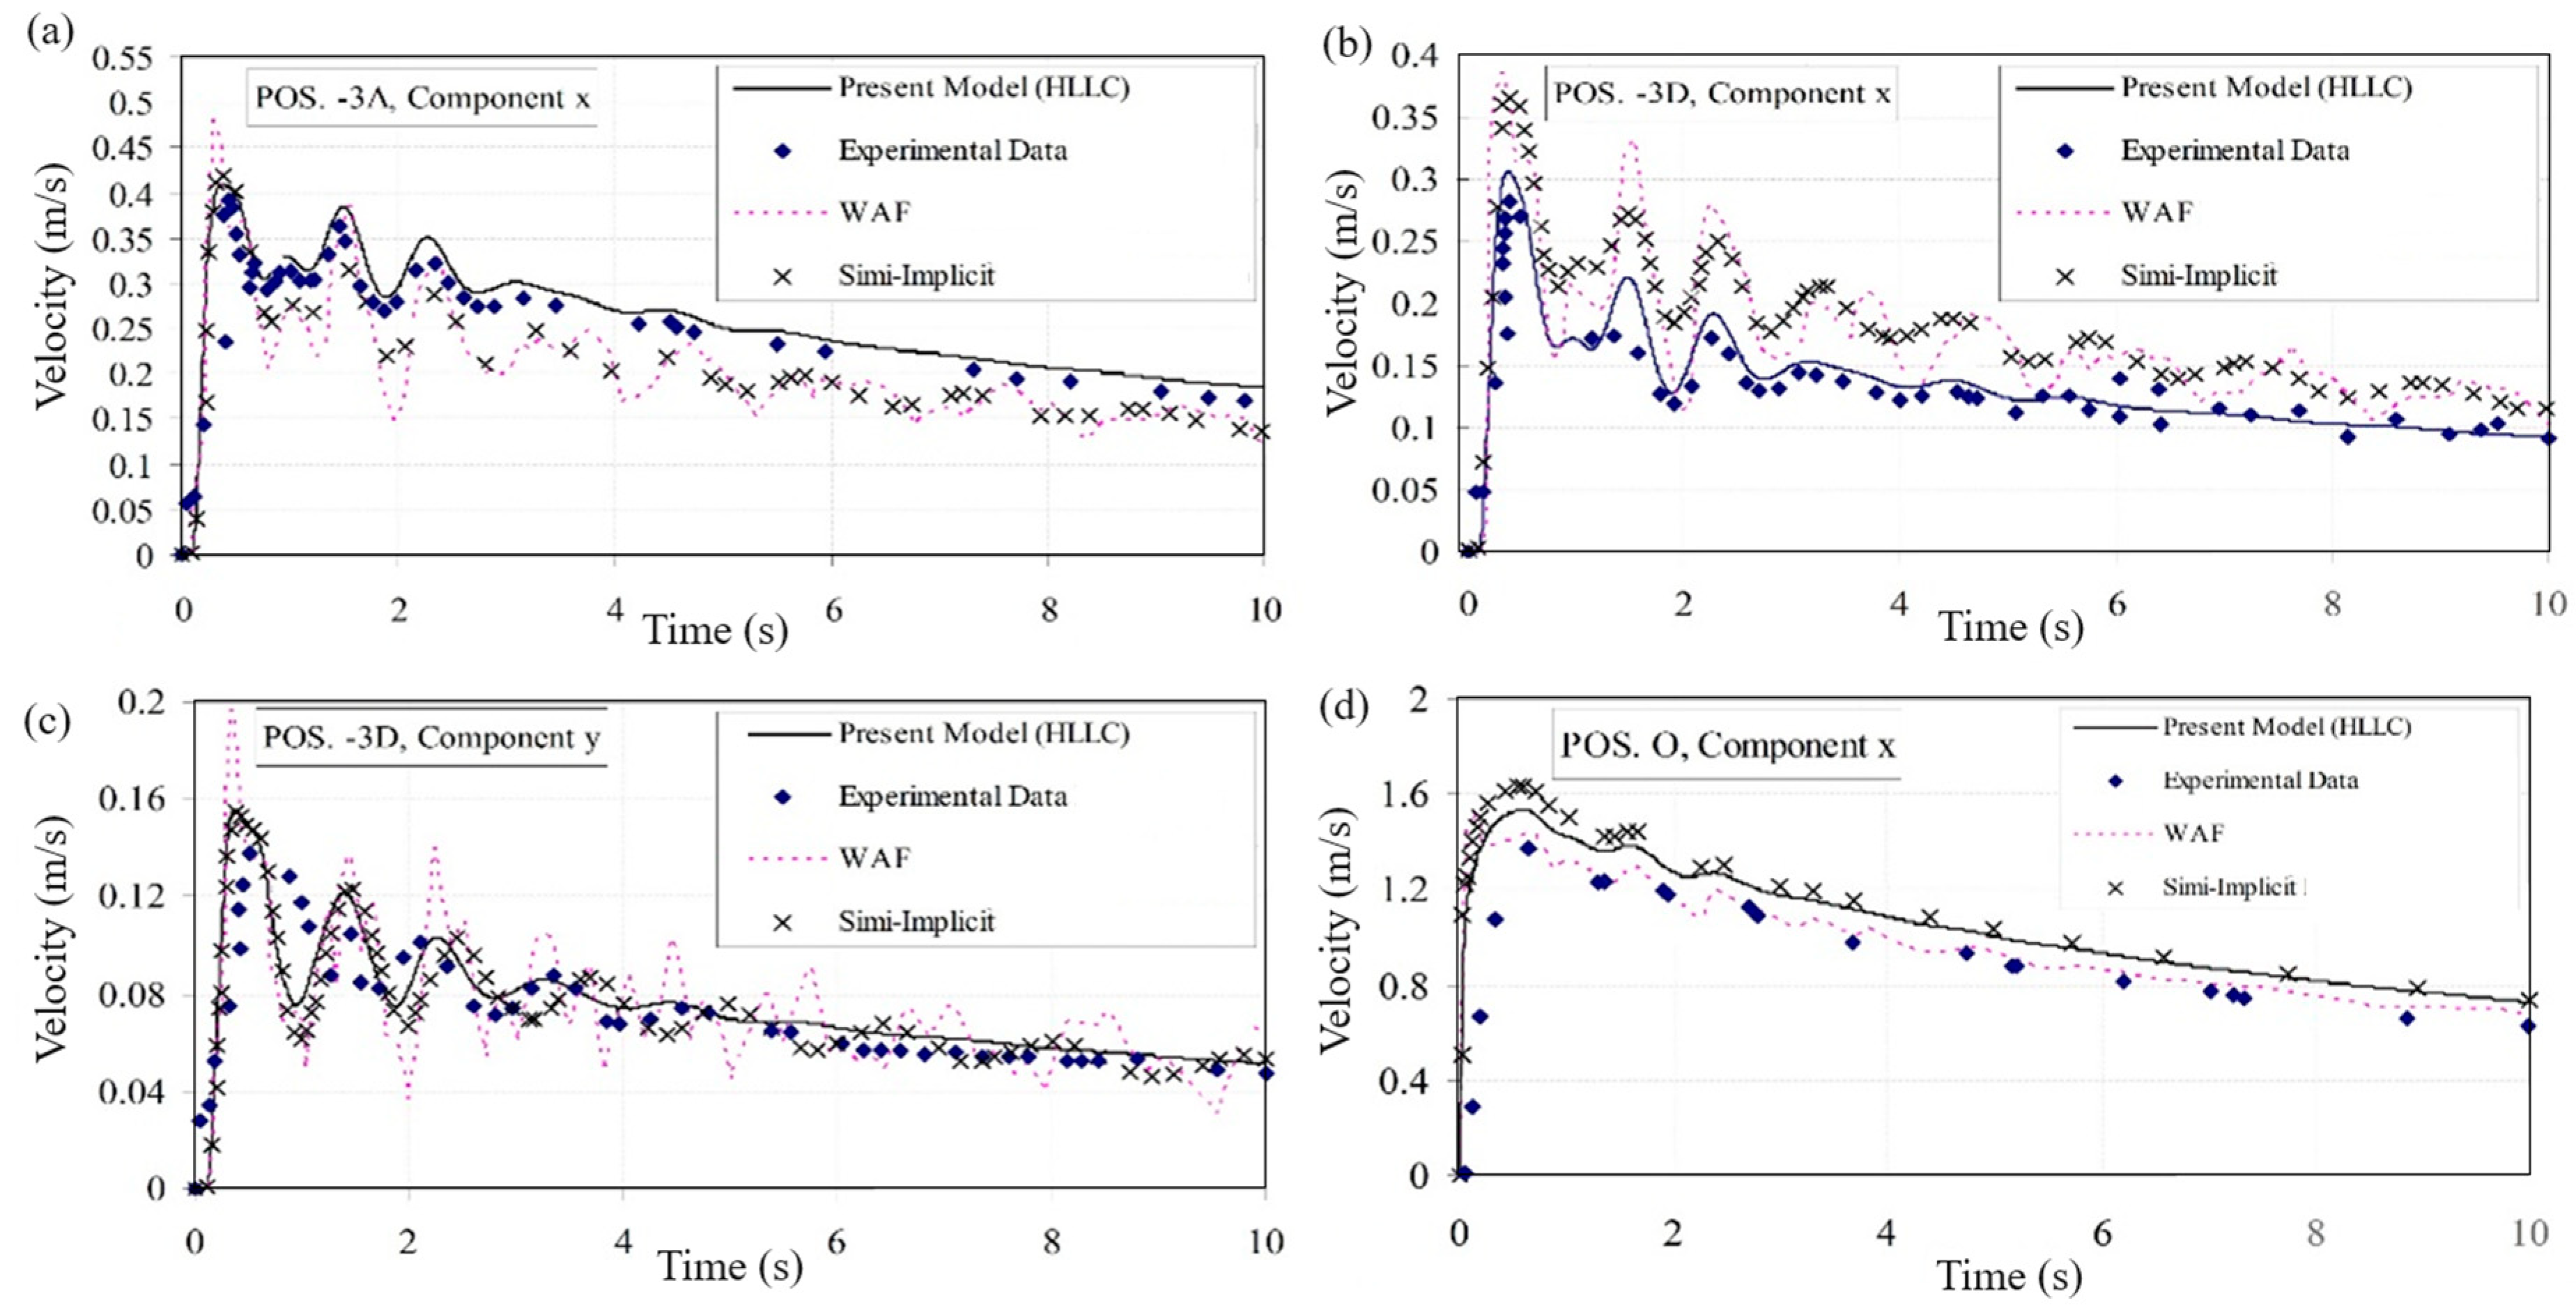
To evaluate and validate the results, the flow depth, and velocity values along the flow direction and perpendicular to it were recorded at predetermined points. Then, an adaptive graph-based comparison was made between the laboratory and the numerical results. The result of the model has also been compared to the WAF method developed in [38] and the semi-implicit method developed by Asadiani and Banihashemi [45], as seen in Figure 5 and Figure 6.
In addition, a quantitative evaluation was made via calculation of the dimensionless error parameter between the current model, the semi-implicit model, and the WAF model at the specified points. In Table 3 the model’s performance for flow depth calculation, and in Table 4 the results of flow velocity assessment, are presented.
According to Figure 5 and Figure 6 there is a good consistency between the numerical results and the laboratory data at most of the points. This consistency can also be observed in Table 3 and Table 4. The only significant difference between the results was at measurement point, 4A; although, the other numerical models have similar or worse conditions. This is due to the hypothesized sudden gate removal in the laboratory model; however, the gate is removed in 0.1 s. In collusion, despite a subtle difference between the numerical model and two other ones, these results suggested the power and accuracy of the first-order approximate HLLC solver in simulating this test.
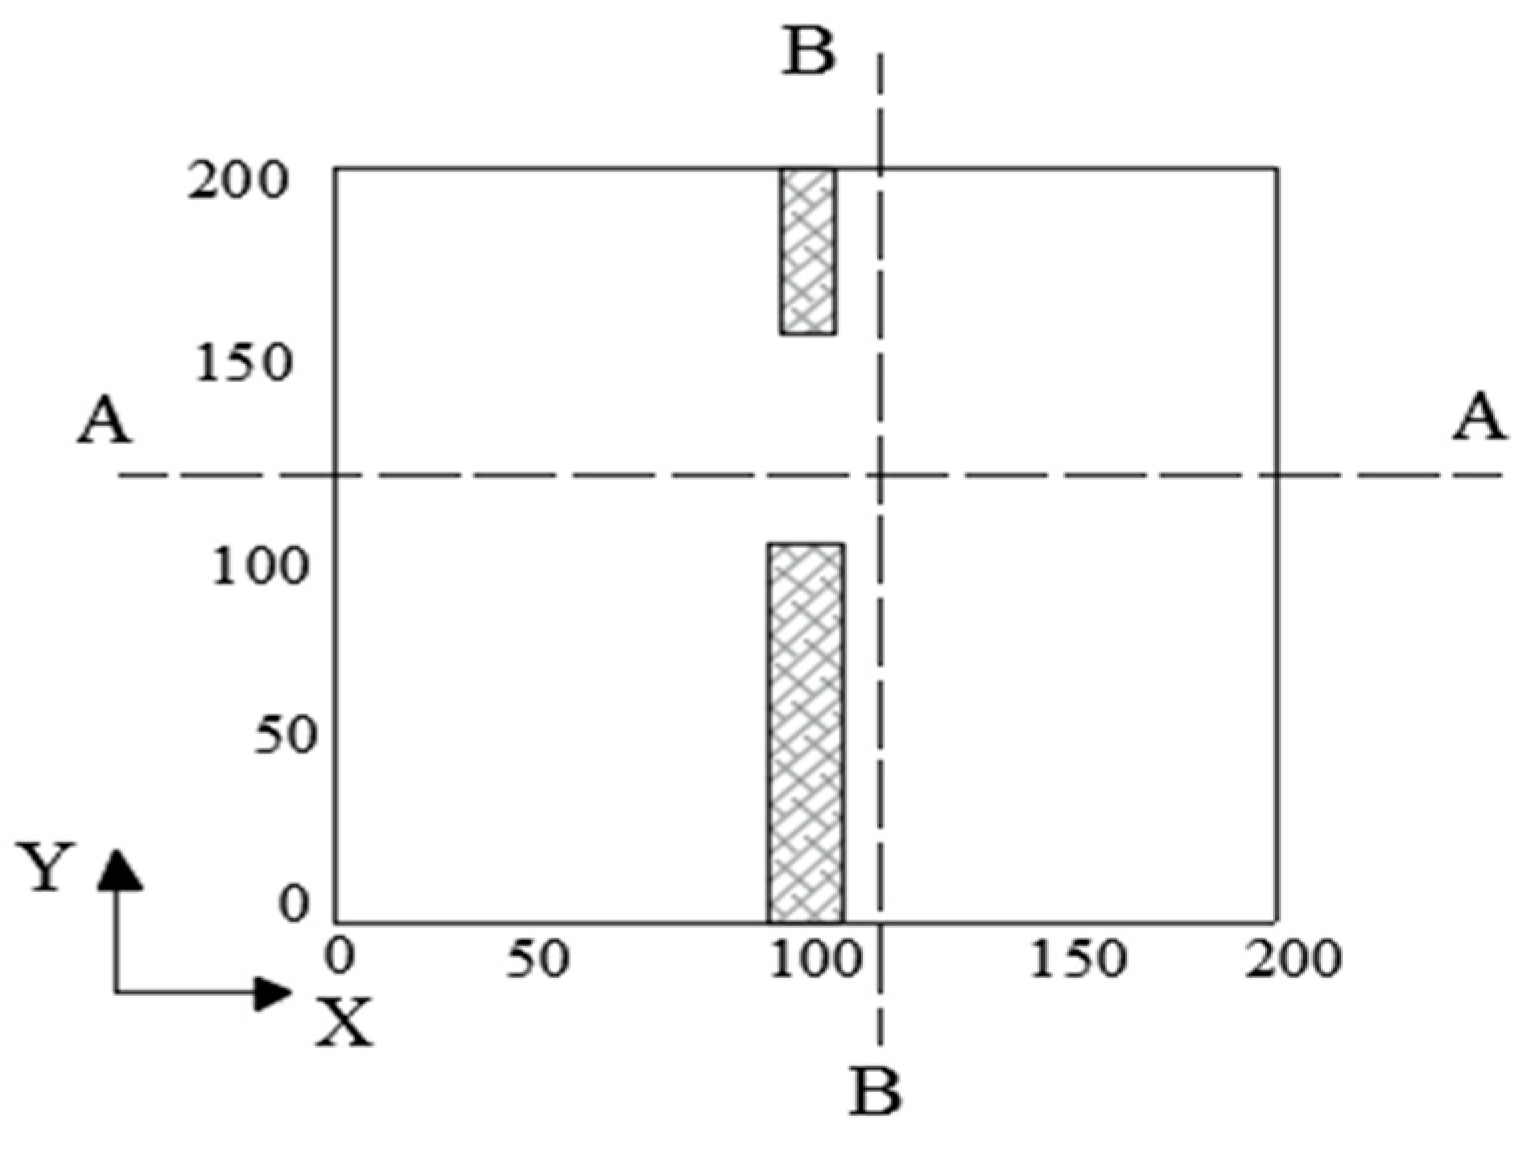
The next experimental dam-break case was performed by Alcrudo and Garcia-Navarro [46] and the simulated data were obtained from [38]. The computational area was a 200 m × 200 m area with closed boundary conditions and a bed slope of zero with an asymmetric gap of 75 m; width at x = 100 m (Figure 7).
To perform this test, a wet bed with water depth of 5 m was considered, while the water depth upstream was 10 m. It is noticeable that the dam-break test on the dry downstream bed was also provided in this test. A uniform Cartesian mesh with 40 computational cells in x and y directions was used for meshing the computational area. The total execution time was 7.2 s [33,47]. The result of the model was compared to the experimental results of the WAF method and the semi-implicit method. It should be noted that, in the case of dry bed condition, the result of semi-implicit method was not available.
Figure 8 illustrates a 3D view of the conducted test at 7.2 s. To evaluate the developed 2D model, two longitudinal and transversal cross-sections at x = 110 m and y = 130 m were quantitively considered (Figure 7), and the water level data were compared to those of the other numerical methods and the experimental data. Figure 9 illustrates the comparison results for the two cases of dry and wet bed in t = 7.2 s. In addition, Table 5 presents the dimensionless error parameters for quantitative evaluation of the method’s performance.
Comparison of the longitudinal and transversal cross-sections diagrams of the current numerical model for a wet bed with the other numerical works shows a good consistency between them; however, a slight difference was due to the type of numerical method, meshing, and the simplifications of the 2D SWEs.

4. Conclusions

In this paper, a new numerical model for partial dam-break modelling on wet beds was developed and evaluated using the laboratory data and two benchmark numerical models: the second order WAF method and the semi-implicit method. Two different tests were used for the model’s verification against the benchmarks: asymmetrical and symmetrical partial dam-break. In the first case, the comparison of the water level values indicated a higher accuracy of the proposed model compared to the benchmark methods. With respect to the dry bed, the model was only compared to the WAF model, and the error values in longitudinal and transversal cross-sections were evaluated. We found that the error value of the present model was lower than that of the WAF method, which was due to the application of an approximate solution of HLLC for flux determination. In the case of symmetrical partial dam-break, the flow depth was measured at ten specific points. In addition, the flow velocity was measured at four points. The obtained flow–depth graphs showed consistency between the proposed numerical model and laboratory results at different points. In the channel downstream, our results became more accurate by increasing the distance from the gate. This conclusion was in line with the results of the two benchmark numerical methods. Our results also showed that the error value of the second-order accuracy model was the highest. With respect to the velocity at the reservoir, where it was measured perpendicular to the flow, the error rate of the presented model was the least. Despite the subtle difference with the second-order methods at other points, a satisfactory consistency was seen between the current model and the laboratory results.
Our initial simulations showed that the HLL and FVS models are able to solve the first-order model, but they had a lot of errors in solving the second-order model. Therefore, these errors were minimized in the proposed HLLC model. Although the HLLC model can be used to model dam-break in both dry and wet beds, our model was limited to the wet bed condition. Extending the proposed model to dry-bed is suggested as a potential topic for future studies.

Author Contributions

Conceptualization, M.M.S., B.P., F.H., S.A.H. and R.N.; methodology, F.H., H.M.A. and B.P.; software, M.M.S., B.P., F.H. and M.M.; validation, B.P., F.H., S.A.H. and R.N.; formal analysis, B.P., F.H., M.M.S. and R.N.; data curation, H.V. and R.N.; writing—original draft preparation, B.P., F.H., M.M.S., H.M.A. and H.V.; writing—review and editing, M.M.S., B.P., F.H., S.A.H., A.D.M. and R.N.; visualization, M.M.S., B.P. and F.H., supervision, H.V., S.A.H. and R.N. All authors have read and agreed to the published version of the manuscript.

Funding

This research received no external funding.

Data Availability Statement

The datasets generated during and/or analysed during the current study are available from the corresponding author upon reasonable request.

Conflicts of Interest

The authors declare that they have no known competing financial interest or personal relationship that could have appeared to influence the work reported in this paper.

References

  1. Noori, R.; Ghiasi, B.; Sheikhian, H.; Adamowski, J.F. Estimation of the dispersion coefficient in natural rivers using a granular computing model. J. Hydraul. Eng. 2017, 143, 04017001. [Google Scholar] [CrossRef]
  2. Bagherzadeh, M.; Mousavi, F.; Manafpour, M.; Mirzaee, R.; Hoseini, K. Numerical simulation and application of soft computing in estimating vertical drop energy dissipation with horizontal serrated edge. Water Supply 2022, 22, 4676–4689. [Google Scholar] [CrossRef]
  3. Yin, L.; Wang, L.; Ge, L.; Tian, J.; Yin, Z.; Liu, M.; Zheng, W. Study on the thermospheric density distribution pattern during geomagnetic activity. Appl. Sci. 2023, 13, 5564. [Google Scholar] [CrossRef]
  4. Bouchaala, F.; Ali, M.Y.; Matsushima, J. Estimation of seismic attenuation in carbonate rocks using three different methods: Application on VSP data from Abu Dhabi oilfield. J. Appl. Geophys. 2016, 129, 79–91. [Google Scholar] [CrossRef]
  5. Xu, J.; Lan, W.; Ren, C.; Zhou, X.; Wang, S.; Yuan, J. Modeling of coupled transfer of water, heat and solute in saline loess considering sodium sulfate crystallization. Cold Reg. Sci. Technol. 2021, 189, 103335. [Google Scholar] [CrossRef]
  6. Panji, M.; Habibivand, M. Seismic analysis of semi-sine shaped alluvial hills above subsurface circular cavity. Earthq. Eng. Eng. Vib. 2020, 19, 903–917. [Google Scholar] [CrossRef]
  7. Panji, M.; Mojtabazadeh-Hasanlouei, S.; Fakhravar, A. Seismic ground response including underground horseshoe-shaped cavity. Transp. Infrastruct. Geotechnol. 2022, 9, 338–355. [Google Scholar] [CrossRef]
  8. Shafagh Loron, R.; Samadi, M.; Shamsai, A. Predictive explicit expressions from data-driven models for estimation of scour depth below ski-jump bucket spillways. Water Supply 2023, 23, 304–316. [Google Scholar] [CrossRef]
  9. Naganna, S.R.; Beyaztas, B.H.; Bokde, N.; Armanuos, A.M. On the evaluation of the gradient tree boosting model for groundwater level forecasting. Knowl. Based Eng. Sci. 2020, 1, 48–57. [Google Scholar] [CrossRef]
  10. Liu, Q.Y.; Li, D.Q.; Tang, X.S.; Du, W. Predictive Models for Seismic Source Parameters Based on Machine Learning and General Orthogonal Regression Approaches. Bull. Seismol. Soc. Am. 2023. [Google Scholar] [CrossRef]
  11. Ghiasi, B.; Noori, R.; Sheikhian, H.; Zeynolabedin, A.; Sun, Y.; Jun, C.; Hamouda, M.; Bateni, S.M.; Abolfathi, S. Uncertainty quantification of granular computing-neural network model for prediction of pollutant longitudinal dispersion coefficient in aquatic streams. Sci. Rep. 2022, 12, 4610. [Google Scholar] [CrossRef]
  12. Samadi, M.; Sarkardeh, H.; Jabbari, E. Prediction of the dynamic pressure distribution in hydraulic structures using soft computing methods. Soft Comput. 2021, 25, 3873–3888. [Google Scholar] [CrossRef]
  13. Uyumaz, A.; Danandeh Mehr, A.; Kahya, E.; Erdem, H. Rectangular side weirs discharge coefficient estimation in circular channels using linear genetic programming approach. J. Hydroinform. 2014, 16, 1318–1330. [Google Scholar] [CrossRef]
  14. Pilotti, M.; Tomirotti, M.; Valerio, G.; Bacchi, B. Simplified Method for the Characterization of the Hydrograph Following a Sudden Partial Dam Break. J. Hydraul. Eng. 2010, 136, 693–704. [Google Scholar] [CrossRef]
  15. Hooshyaripor, F.; Tahershamsi, A.; Razi, S. Dam Break Flood Wave under Different Reservoir’s Capacities and Lengths. Sādhanā 2017, 42, 1557–1569. [Google Scholar] [CrossRef]
  16. Haltas, I.; Tayfur, G.; Elci, S. Two-Dimensional Numerical Modeling of Flood Wave Propagation in an Urban Area Due to Ürkmez Dam-Break, İzmir, Turkey. Nat. Hazards 2016, 81, 2103–2119. [Google Scholar] [CrossRef]
  17. Togun, H.; Sadeghinezhad, E.; Kazi, S.N. Navier-Stokes Equations and High-Resolutions: Advancements in Accurate Incompressible Flow Simulations. Knowl. Based Eng. Sci. 2023, 4, 51–59. [Google Scholar]
  18. Biscarini, C.; Di Francesco, S.; Manciola, P. CFD Modelling Approach for Dam Break Flow Studies. Hydrol. Earth Syst. Sci. 2010, 14, 705–718. [Google Scholar] [CrossRef]
  19. Ozmen-Cagatay, H.; Kocaman, S. Dam-Break Flow in the Presence of Obstacle: Experiment and CFD Simulation. Eng. Appl. Comput. Fluid Mech. 2011, 5, 541–552. [Google Scholar] [CrossRef]
  20. Hooshyaripor, F.; Tahershamsi, A. Effect of Reservoir Side Slopes on Dam-Break Flood Waves. Eng. Appl. Comput. Fluid Mech. 2015, 9, 458–468. [Google Scholar] [CrossRef]
  21. Tahershamsi, A.; Hooshyaripor, F.; Razi, S. Reservoir’s Geometry Impact of Three Dimensions on Peak Discharge of Dam-Failure Flash Flood. Sci. Iran. 2018, 25, 1931–1942. [Google Scholar] [CrossRef]
  22. Pilotti, M.; Maranzoni, A.; Tomirotti, M.; Valerio, G. 1923 Gleno Dam Break: Case Study and Numerical Modeling. J. Hydraul. Eng. 2011, 137, 480–492. [Google Scholar] [CrossRef]
  23. Ozmen-Cagatay, H.; Kocaman, S.; Guzel, H. Investigation of Dam-Break Flood Waves in a Dry Channel with a Hump. J. Hydro-Environ. Res. 2014, 8, 304–315. [Google Scholar] [CrossRef]
  24. Heniche, M.; Secretan, Y.; Boudreau, P.; Leclerc, M. A Two-Dimensional Finite Element Drying-Wetting Shallow Water Model for Rivers and Estuaries. Adv. Water Resour. 2000, 23, 359–372. [Google Scholar] [CrossRef]
  25. Yoshioka, H.; Unami, K.; Fujihara, M. A finite element/volume method model of the depth-averaged horizontally 2D shallow water equations. Int. J. Numer. Methods Fluids 2014, 75, 23–41. [Google Scholar] [CrossRef]
  26. Liang, Q.; Marche, F. Numerical Resolution of Well-Balanced Shallow Water Equations with Complex Source Terms. Adv. Water Resour. 2009, 32, 873–884. [Google Scholar] [CrossRef]
  27. Pilotti, M.; Maranzoni, A.; Milanesi, L.; Tomirotti, M.; Valerio, G. Dam-Break Modeling in Alpine Valleys. J. Mt. Sci. 2014, 11, 1429–1441. [Google Scholar] [CrossRef]
  28. Liang, D.; Falconer, R.A.; Lin, B. Comparison between TVD-MacCormack and ADI-Type Solvers of the Shallow Water Equations. Adv. Water Resour. 2006, 29, 1833–1845. [Google Scholar] [CrossRef]
  29. Liang, D.; Lin, B.; Falconer, R.A. Simulation of Rapidly Varying Flow Using an Efficient TVD–MacCormack Scheme. Int. J. Numer. Methods Fluids 2007, 53, 811–826. [Google Scholar] [CrossRef]
  30. Parmas, B.; Vosoughifar, H.R. Novel Method of Boundary Condition of Dam-Break Phenomena Using Ghost-Particle SPH. Nat. Hazards 2016, 84, 897–910. [Google Scholar] [CrossRef]
  31. Vosoughifar, H.R.; Dolatshah, A.; Sadat Shokouhi, S.K. Discretization of Multidimensional Mathematical Equations of Dam Break Phenomena Using a Novel Approach of Finite Volume Method. J. Appl. Math. 2013, 2013, 642485. [Google Scholar] [CrossRef]
  32. Singh, J.; Altinakar, M.S.; Ding, Y. Two-Dimensional Numerical Modeling of Dam-Break Flows over Natural Terrain Using a Central Explicit Scheme. Adv. Water Resour. 2011, 34, 1366–1375. [Google Scholar] [CrossRef]
  33. Baghlani, A. Simulation of Dam-Break Problem by a Robust Flux-Vector Splitting Approach in Cartesian Grid. Sci. Iran. 2011, 18, 1061–1068. [Google Scholar] [CrossRef]
  34. Ferrari, A.; Fraccarollo, L.; Dumbser, M.; Toro, E.F.; Armanini, A. Three-Dimensional Flow Evolution after a Dam Break. J. Fluid Mech. 2010, 663, 456–477. [Google Scholar] [CrossRef]
  35. Aliparast, M. Two-Dimensional Finite Volume Method for Dam-Break Flow Simulation. Int. J. Sediment Res. 2009, 24, 99–107. [Google Scholar] [CrossRef]
  36. Ying, X.; Jorgeson, J.; Wang, S.S.Y. Modeling Dam-Break Flows Using Finite Volume Method on Unstructured Grid. Eng. Appl. Comput. Fluid Mech. 2009, 3, 184–194. [Google Scholar] [CrossRef]
  37. Kim, S.D.; Lee, B.J.; Lee, H.J.; Jeung, I.-S. Robust HLLC Riemann Solver with Weighted Average Flux Scheme for Strong Shock. J. Comput. Phys. 2009, 228, 7634–7642. [Google Scholar] [CrossRef]
  38. Loukili, Y.; Soulaimani, A. Numerical Tracking of Shallow Water Waves by the Unstructured Finite Volume WAF Approximation. Int. J. Comput. Methods Eng. Sci. Mech. 2007, 8, 75–88. [Google Scholar] [CrossRef]
  39. Toro, E.F. Shock-Capturing Methods for Free-Surface Shallow Flows; Wiley and Sons Ltd.: Hoboken, NJ, USA, 2001; ISBN 0471987662. [Google Scholar]
  40. Hudson, J. Numerical Techniques for Morphodynamic Modeling. Ph.D. Thesis, University of Reading, Berkshire, UK, 2001. [Google Scholar]
  41. Liu, M.; Cao, W.; Fan, Z. Convergence and Stability of the Semi-Implicit Euler Method for a Linear Stochastic Differential Delay Equation. J. Comput. Appl. Math. 2004, 170, 255–268. [Google Scholar] [CrossRef]
  42. Harten, A.; Lax, P.D.; Leer, B. van On Upstream Differencing and Godunov-Type Schemes for Hyperbolic Conservation Laws. SIAM Rev. 1983, 25, 35–61. [Google Scholar] [CrossRef]
  43. Fraccarollo, L.; Toro, E.F. Experimental and Numerical Assessment of the Shallow Water Model for Two-Dimensional Dam-Break Type Problems. J. Hydraul. Res. 1995, 33, 843–864. [Google Scholar] [CrossRef]
  44. Toro, E.F. Riemann Solvers and Numerical Methods for Fluid Dynamics: A Practical Introduction; Springer Science & Business Media: Berlin, Germany, 2013; ISBN 3662034905. [Google Scholar]
  45. Yekta, A.H.A.; Banihashemi, M.A. A Godunov-type Fractional Semi-implicit Method Based on Staggered Grid for Dam-break Modeling. Int. J. Numer. Methods Fluids 2011, 67, 1291–1309. [Google Scholar] [CrossRef]
  46. Alcrudo, F.; Garcia-Navarro, P. A High-resolution Godunov-type Scheme in Finite Volumes for the 2D Shallow-water Equations. Int. J. Numer. Methods Fluids 1993, 16, 489–505. [Google Scholar] [CrossRef]
  47. Mingham, C.G.; Causon, D.M. High-Resolution Finite-Volume Method for Shallow Water Flows. J. Hydraul. Eng. 1998, 124, 605–614. [Google Scholar] [CrossRef]
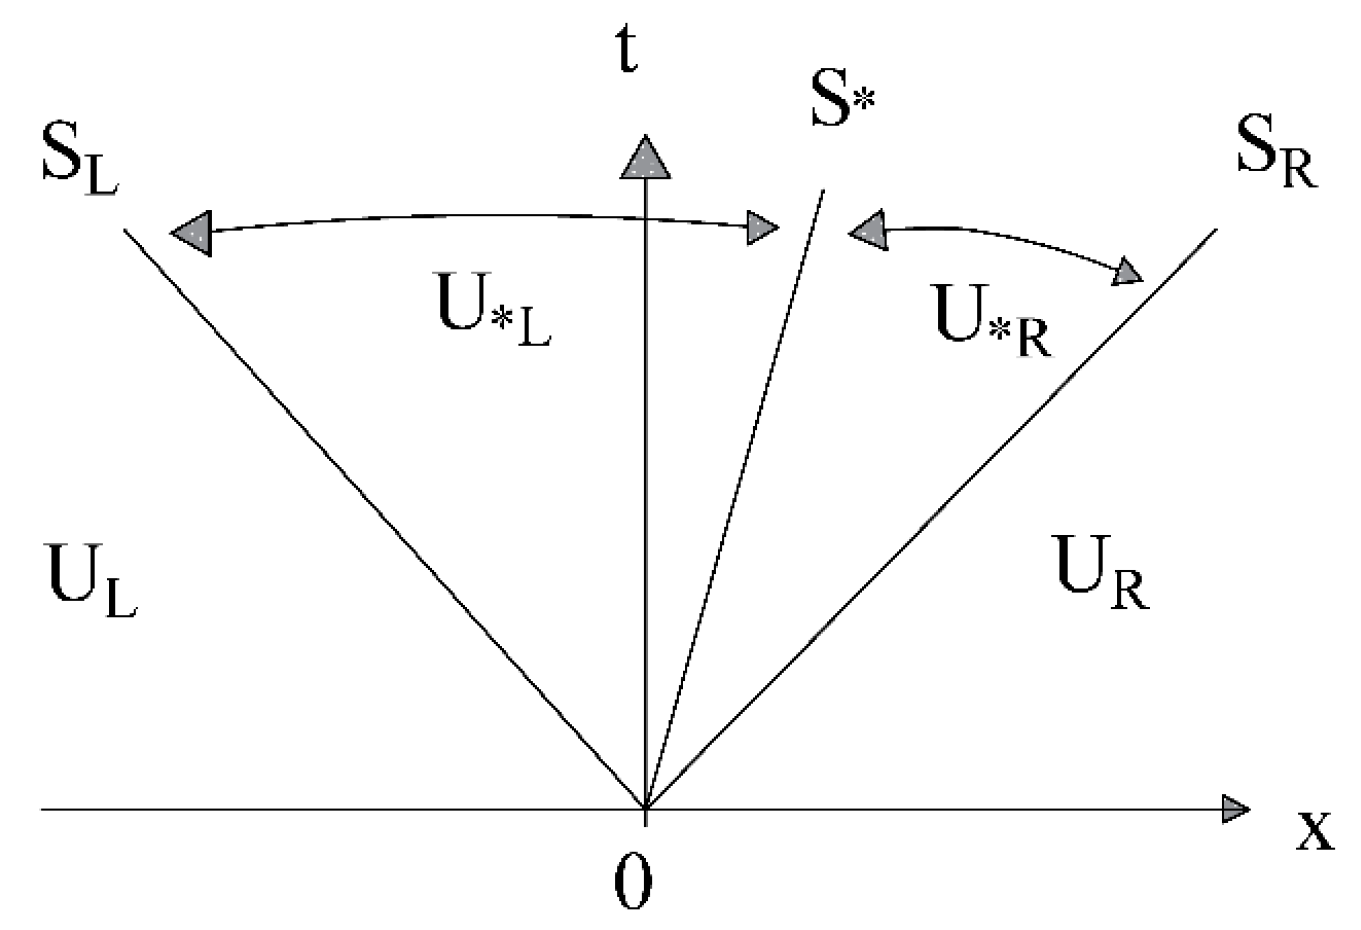
Figure 1. The structure of the waves in the HLLC method (S is the intermediate wave speed).
Water 15 03841 g001
Figure 2. Comparison of the numerical model results with the analytical solution at (a) t = 0.02 s, (b) t = 0.04 s, (c) t = 0.06 s, (d) t = 0.08 s, and (e) t = 0.1 s.
Water 15 03841 g002aWater 15 03841 g002b
Figure 3. Measurement points in 2D dam-break laboratory test.
Water 15 03841 g003
Figure 4. Three-dimensional (3D) view of the symmetrical partial dam-break at (a) t = 0.4 s, (b) t = 5 s, and (c) t = 10 s.
Water 15 03841 g004
Figure 5. Comparison of the water level profile between the developed numerical model and the laboratory test or the other numerical models in 2D symmetrical partial dam-break laboratory test at points (a) −5A, (b) 4A, (c) 10A, (d) C, (e) 5B, (f) O, (g) 8A, and (h) 4.
Water 15 03841 g005
Figure 6. Comparison of the present numerical model with the laboratory test and the other numerical models in the symmetrical partial dam-break for flow velocity component (a) u at point −3A, (b) u at point −3D, (c) v at point −3D, and (d) u at point O.
Water 15 03841 g006
Figure 7. Computational area in the partial dam-break test [24]. A and B shows location of cross sections.
Water 15 03841 g007
Figure 8. Water surface in partial dam-break test on the wet bed at 7.2 s.
Water 15 03841 g008
Figure 9. Comparison of the model results with WAF and semi-implicit methods on a wet and dry beds.
Water 15 03841 g009
Table 1. Dimensionless error parameters for the 1D dam break.
t (s)0.020.040.060.080.1
E1 (h)−0.002−0.002−0.003−0.003−0.003
E1 (u)0.030.0070.001−0.001−0.003
E2 (h)0.0210.0210.0220.0220.022
E2 (u)0.020.1430.1170.010.094
Table 2. Coordinates of the measurement points.
Position−5A4A−4BC4O5B8A9B10A−3A−3D
x (m)−820322−845−520004547228021020−420−420
y (m)00−500−6001500250045000200
Table 3. Quantitative evaluation of the developed numerical model for water depth for the symmetrical partial dam-break.
PointHLLCSemi-Implicit Method *WAF Method **
E2 (h)E2 (h)E2 (h)
−5A0.0540.0420.06
4A0.3560.6450.351
10A0.2940.1370.124
C0.0350.0270.041
5B0.4340.2980.434
O0.150.1310.149
8A0.3410.3230.359
40.0340.0030.045
−4B0.0420.0130.039
9B0.1880.2570.136
Notes: * [45] ** [38].
Table 4. Quantitative evaluation of the developed numerical model for the flow velocity for the symmetrical partial dam-break.
PointVelocity
Component
HLLCSemi-Implicit Method *WAF Method **
E2 (u)E2 (u)E2 (u)
−3AU0.3920.1480.203
−3DU0.2220.1810.231
−3DV0.2060.290.364
Ou0.3610.4650.389
Notes: * [45] ** [38].
Table 5. Error values in the asymmetric partial dam-break problem on the wet and dry beds.
DownstreamError IndexExperimentSemi-Implicit Method *WAF Method **
A-A Cross-SectionB-B Cross-SectionA-A Cross-SectionB-B Cross-SectionA-A Cross-SectionB-B Cross-Section
Wet bedE1 (h)0.1020.09650.08760.0670.08940.0876
E2 (h)0.01120.01310.01280.05580.00860.0266
Dry bedE1 (h)0.04560.0123--0.05670.0763
E2 (h)0.02010.0114--0.05090.0661
Notes: * [45] ** [38].
Disclaimer/Publisher’s Note: The statements, opinions and data contained in all publications are solely those of the individual author(s) and contributor(s) and not of MDPI and/or the editor(s). MDPI and/or the editor(s) disclaim responsibility for any injury to people or property resulting from any ideas, methods, instructions or products referred to in the content.