Article

Assessment of Regression Models for Surface Water Quality Modeling via Remote Sensing of a Water Body in the Mexican Highlands

by
Alejandro Cruz-Retana
1,2,*,
Rocio Becerril-Piña
3,
Carlos Roberto Fonseca
2,*,
Miguel A. Gómez-Albores
2,
Sandra Gaytán-Aguilar
4,
Marivel Hernández-Téllez
2 and
Carlos Alberto Mastachi-Loza
2
1
Tecnológico de Estudios Superiores de Jocotitlán (TESJo), Jocotitlan 50700, Mexico
2
Instituto Interamericano de Tecnología y Ciencias del Agua (IITCA), Toluca 50295, Mexico
3
Red Lerma- IITCA, Toluca 50295, Mexico
4
Deltares, 5058 Delft, The Netherlands
*
Authors to whom correspondence should be addressed.
Water 2023, 15(21), 3828; https://doi.org/10.3390/w15213828
Submission received: 4 September 2023 / Revised: 25 October 2023 / Accepted: 30 October 2023 / Published: 2 November 2023
(This article belongs to the Special Issue Water Quality Assessment and Modelling)

Abstract

:
Remote sensing plays a crucial role in modeling surface water quality parameters (WQPs), which aids spatial and temporal variation assessment. However, existing models are often developed independently, leading to uncertainty regarding their applicability. This study focused on two primary objectives. First, it aimed to evaluate different models for chemical oxygen demand (COD), total phosphorus (TP), total nitrogen (TN), and total suspended solids (TSS) in a surface water body, the J. A. Alzate dam, in the Mexican highland region (R2 ≥ 0.78 and RMSE ≤ 16.1 mg/L). The models were estimated using multivariate regressions, with a focus on identifying dilution and dragging effects in inter-annual flow rate estimations, including runoff from precipitation and municipal discharges. Second, the study sought to analyze the potential scope of application for these models in other water bodies by comparing mean WQP values. Several models exhibited similarities, with minimal differences in mean values (ranging from −9.5 to 0.57 mg/L) for TSS, TN, and TP. These findings suggest that certain water bodies may be compatible enough to warrant the exploration of joint modeling in future research endeavors. By addressing these objectives, this research contributes to a better understanding of the suitability of remote sensing-based models for characterizing surface water quality, both within specific locations and across different water bodies.

1. Introduction

Effective water resource management requires monitoring supply sources’ water quality. Alterations in water resources’ quality limit their intended functions, which include providing safe drinking water, recreation, ecosystems services, irrigation, and regional planning, among other vital uses [1]. Conventionally, surface water resources are monitored by collecting water samples and analyzing them in a laboratory, which is reliable, but time-consuming and costly [2,3,4]. Furthermore, this method has limitations regarding spatio-temporal variation identification [5]. The rapid development of remote sensing techniques has enabled the inference of water quality over time and space, even from inaccessible sampling sites [6]. Remote sensing for water quality monitoring is regarded as a promising and cost-effective monitoring tool that offers new opportunities to assess water quality, particularly in developing countries. Valuable reviews for consideration include those conducted by [5].
Numerous studies have elucidated the relationship between reflectance data acquired from remote sensors and water quality parameters (WQPs). Reflections are affected by change in one or more of these parameters; this dynamic has allowed the development of various WQP estimation analysis methods. Empirical approaches have been developed using statistical regression techniques that establish a connection between in situ WQP measurements and the reflectance of the optimal band or a combination of bands. Their greatest advantages are simplicity, operability, and that their precision can be improved by selecting spectral bands. However, these models’ applicability might be limited to the region and temporality for which they were originally developed, and their precision is based on the size and representativeness of field samples [7].
Some WQPs play a strategic role in decision-making processes regarding integrated water management. Two critical parameters are chemical oxygen demand (COD) and total suspended solids (TSS). These parameters offer valuable insights into water quality in a given environment, which aids the identification of potential pollution sources and overall aquatic ecosystem health. They are essential for evaluating the environmental impact of activities such as industrial discharges, agricultural runoff, and urban development.
In addition to COD and TSS, total nitrogen (TN) and total phosphorus (TP) are also significant WQPs that provide valuable information about the environmental and economic dynamics associated with a water body. Elevated levels of these nutrients can lead to eutrophication, resulting in harmful algal blooms and oxygen depletion. Monitoring TN and TP concentrations is crucial for implementing strategies to prevent or mitigate eutrophication. Many regions have established regulations and standards governing permissible concentrations of COD, TSS, TN, and TP in wastewater discharges and natural water bodies. Consequently, water treatment plants rely on data related to COD, TSS, and nutrient levels to optimize treatment processes, ensure pollutant removal, and produce safe drinking water [8].
Furthermore, these parameters’ concentrations are closely linked to optical mechanisms that facilitate estimation. In the context of optical measurements, absorption and scattering are the primary mechanisms associated with TSS, while absorption is a dominant mechanism associated with COD, TN, and TP. Refraction plays a minor role in these measurements, primarily when light interacts with particles in the water.
Measuring concentrations relies on the absorption of specific wavelengths. For TSS measurement, the 600–700 nm wavelength range is particularly important, due to its influence on reflectance [9,10,11]. Reflectivity increases and spectral signature variations depend on particle size and solid properties. As particle size decreases, reflectivity increases [12,13]. However, if particles are of an organic origin, reflectivity is also influenced by their chromatic characteristics [14]. Reflectance in the 600–700 nm wavelength range has been linearly related to TSS concentrations ranging from 0 to 50 mg/L [15,16,17]. Beyond this range, the relationship may exhibit a curvilinear trend. In the context of optical sensors such as the Landsat 8 OLI, green (B3) and blue (B2) spectrum bands can be as effective as the red (B4) band for TSS estimation, especially when combined with a near-infrared band (B5 or B7) [18].
For COD, the absorption of energy occurs in wavelength bands from B1 (472 nm) to B4 (670 nm) [18,19]. For TP, absorption is prominent in bands B5 (880 nm) and B4 (670 nm). TN mainly absorbs energy at wavelengths close to 472 and 670 nm. TP can often be found at the water’s surface (0.0–0.60 m) and can be represented by wavelengths within the visible spectrum, particularly in Landsat 8 OLI bands B2 and B3 [3].
Machine learning has the ability to process large amounts of information in non-linear frameworks [4], such as decision trees (DTs), support vector machines (SVMs), artificial neural networks (ANNs) [5], and genetic algorithms (GAs). However, the initial training phase can be a costly and time-consuming process that is difficult to apply if sufficient data are unavailable; therefore, non-linear models have been developed to a lesser extent [20,21,22,23,24,25,26].
Some bio-optical characterization studies [20,21,22,27,28,29] have reported satisfactory results for parameters such as chlorophyll-a, total suspended solids, and turbidity; multiple regression models have been the most used approach [30,31,32,33], while non-linear models have been developed to a lesser extent [30,34,35,36,37].
Linear regression analysis has allowed simplicity in the models’ explanatory capacity. Some models consulted for this study (Table 1) had explanatory capacities in the range 0.69 ≤ R2 ≤ 0.98 of the TSS; most were above R2 ≥ 0.69. To attain these explanatory capacities, different studies’ authors used different sampling universes. For example, other studies, such as [38], used a density of approximately 0.32 samples/km2, whereas [39] used a density of 0.000216 samples/km2. The study with the highest sampling density corresponded to 0.64 samples/km2 for TSS and COD [17]. In [40], there were 14 samples (0.001 samples/km2), and [3] used 18 samples (0.32 fields/km2). Previous studies noted that it is advisable to collect water samples at an average depth of 0.1 m [27,35,37,41,42,43].
In the studies consulted, it was possible to highlight the range of concentration models estimated. For a coastal water body [22], a TSS range between 0 and 135 mg/L was observed; ranges between 0 and 386 mg/L were observed in continental water bodies [44,45]. For TN and TP, 0–26 mg/L concentrations were observed in intervals [3]; these WQPs are generally present in 0–30 mg/L intervals in rivers, dams, and lakes. Some studies [18,46] reported 0–86 mg/L COD concentrations, highlighting similar environmental, urban, and agricultural characteristics.
Regression models used to estimate water quality parameters (WQPs) were calibrated considering the specific environmental conditions of each water body and each sensor’s characteristics [31,34,35,36]. Thus, when these models were applied outside their intended contexts, they tended to yield highly uncertain estimates [12]. Regarding environmental conditions, uncertainties stem from factors such as cloud cover, geographical coordinates (longitude, latitude, and altitude), atmospheric conditions, and concentrations of algae within the water body [4]. Regarding sensor characteristics, limitations often pertain to the platform type (height, inclination, etc.), as well as spatial, radiometric, and temporal resolutions [4,10,20,47]. Nevertheless, despite these differences, one can observe a degree of similarity in these models’ structures, such regression models’ band weights and the choice of linear or non-linear regression techniques [4,10,20,48].
Considering the above factors, there might be some compatibility among these models when applied to water bodies different from those for which they were initially designed. Confirming such compatibility could facilitate the development of integrated models. As a result, our study focused on two primary objectives. First, we aimed to assess various models for estimating chemical oxygen demand (COD), total phosphorus (TP), total nitrogen (TN), and total suspended solids (TSS) in a surface water body, the J. A. Alzate Dam, in the Mexican highland region. These models were derived using multivariate regression techniques; however, in addition to results from similar previous studies, we intended to identify dilution and dragging effects in inter-annual flow rate estimations, which included runoff from precipitation and municipal discharges.
Secondly, our study sought to explore these models’ potential applicability in other water bodies by comparing mean WQP values. Importantly, this comparison was not intended to determine which model was superior, but rather to provide evidence of their compatibility. This comparison considered models (from [3,46,49,50]) developed in conditions as similar as possible with respect to sensor types, resolution, available information, and the choice of regression techniques.
In the context of remote-sensing water quality studies in Mexico, some available research focuses on chemical oxygen demand (COD), total dissolved solids, chlorophyll-a, total suspended solids (TSS), and temperature [36,42,44]. However, comprehensive data regarding reflectance and WQPs selected for this study were limited for replication and thorough analysis. Furthermore, in this investigation, a select number of viable water bodies were identified as similar for comparison purposes using the obtained models. Based on these findings, the studies listed in Table 1 were chosen to assess the applicability of the model derived from this study.
Table 1. Primary contributions of different authors to WQP estimation using Landsat 8 OLI.
WQPSurface (km2)Resolution (m)Sample of SizeBands of NormalizationR2Estimation Interval (mg/L)Author
TSS12,00030 m26 Y ^ = 161.98 B 5 B 4 3 + 713.478 B 5 B 4 2 811.43 B 5 B 4   + 278.46 0.980–386[45]
30 m14 Y ^ = ( 1.5212 L O G B 2 L O G B 3 0.3698 ) 0.690–135[22]
TN5330 m18 Y ^ = e ( 8.228 2.713 ( I n B 3 B 2 ) --------0–36[3]
TP5330 m18 Y ^ = e ( 0.4081 8.659 ( I n B 3 B 2 ) --------0–26[3]
COD150 30 m------- Y ^ = 2.76 17.27 B 1 + 72.15 B 2 12.11 B 3 --------0–19.3[19]
Symbology: Chemical oxygen demand (COD), total phosphorus (TP), total nitrogen (TN), total suspended solids (TSS), remote sensing bands (Bn), adjusted coefficient of determination ( R ¯ 2 ), and no data (---).

2. Materials and Methods

In the study area, a WQP estimation using multispectral images was carried out through the development of regression models; the spatio-temporal distribution of estimated WQPs; and the assessment of the scope of its application relative to other water bodies. The WQPs considered were total suspended solids (TSS), total nitrogen (TN), chemical oxygen demand (COD), and total phosphorus (TP). The study area was the J. A. Alzate Dam, in Toluca, Mexico (Figure 1). Imagery from the Landsat 8 OLI sensor (Path 26 Raw 46) [47] was obtained from the United States Geological Survey database and coincided with dates of water quality monitoring campaigns. Notably, the Landsat 8 sensor was chosen for its appropriate spatial resolution (approximate 51,000 m2 water body surface), and for the assessment of the model’s scope in similar studies.
To develop regression models, measuring WQP in the laboratory from representative samples (14 sites) and pretreating satellite images were necessary. The WQP concentrations were obtained following standards for TN [51], TSS [52], TP [53], and COD [54,55]. According to some authors [37,48], samples should be collected under different seasonal conditions, with caution and appropriate validation; therefore, samples were geographically distributed, as indicated in Figure 1, and divided into two seasons. This research involved two distinct sampling campaigns for two main reasons: first, to ensure the field data robustness throughout the year; and second, to account for the varying sample densities observed in previous studies [3,19,22,45,56], which ranged from 0.0002 to 0.64 samples per square kilometer. Interestingly, these sample density variations did not appear to significantly affect results.
To ensure a representative sample for the finite population under study, we determined that a resolution of 0.3 samples per square kilometer was sufficient for the J. A. Alzate Dam. Consequently, we organized the sampling process into two campaigns, which were conducted both before and after the rainy season (19 May 2018 and 16 October 2018, respectively), and classified based on the standard Mexican normative [55].
The MODTRAN 4 module was used to pretreat satellite images [27,57], as it could consider study area characteristics such as altitude, latitude, proximity to the sea, aerosol type, atmosphere type, and image visibility in atmospheric correction. To accurately identify pixels in each satellite image corresponding to the water body, we employed the normalized difference water index (NDWI). The NDWI is a widely used remote sensing index for detecting the presence of water in satellite or aerial imagery [19,32,57]. Positive NDWI values generally indicate the presence of water; however, its specific water detection threshold can vary depending on the dataset and environmental conditions. After analyzing NDWI values in the J. A. Alzate Dam area, we observed a mean 0.65 NDWI value with a 0.17 standard deviation. Notably, some pixels situated along the water body’s shoreline exhibited values below this standard deviation. Based on this observation, we established a reliable range for water detection (0.12 < NDWI < 1.0) within a 0.17 standard deviation in the reflectance for each multispectral band. Utilizing the NDWI not only aided in the delineation of pixels constituting the water body, but also restricted the occurrence of anomalous data, particularly with regard to TSS.

2.1. Statistical Analysis for Model Development

The first stage (development of regression models) was cross-validation, which has been commonly used in similar studies. For example, in [4] and [57] the authors considered 11 random combinations to model chlorophyll (Chl-a) and suspended particulate matters (SPM), with mean RMSEs of 1.6–1.7 m g / m 3 and 8.8 to 11.4 g / m 3 , respectively. In [40], cross-validation was applied in a random forest-type study with a RMSE = 0.02–3.03 (mg/L), using 10 iterations that reached an explanatory capacity of R2 = 95–99%. The developed regression models were evaluated during the cross-validation process, which included multiple iterations (i) between the testing and validation subsets. The primary metric used for evaluation was the root mean square error R M S E = 1 i i = 1 i y i y ^ i 2     calculated as the average of discrepancies between predicted values and actual observations. Additionally, we considered the adjusted coefficient of determination R ¯ 2 = 1 n 1 n k 1 1 R 2   to assess the models’ explanatory power, taking the number of multispectral bands employed into account. The coefficients’ collinearity and heteroscedasticity were also considered as selection criteria.
A recommended range for the adjusted R2 is between 0.6 and 0.8, which is considered suitable for estimating water quality parameters (WQPs), as per the reference. This range ensures that errors exhibit appropriate behavior. When R2 ≥ 0.9, estimates are regarded as both statistically significant and well fitting in relation to established values [58]. The reference’s authors also analyzed the multiple linear regression from which they obtained a RMSE = 0.03–3.14 (mg/L) using 10 iterations, reaching an explanatory capacity of R2 = 55–91%. The multivariate regression models proposed in the present study correspond to linear types ( y ^ = β 0 + β 1 x 1 + β 2 x 2 + β 3 x 3 + + β n x n + u ), such as those presented in [35] and [56]), exponential types ( y ^ = e ( β 0 + β 1 x 1 + β 2 x 2 β n x n )   such as those studied in [3,13,19,35]), and polynomials with the structure y ^ = β 0 + β 1 x 1 + β 2 x 2 + β 3 x 1 2 + β 4 x 2 2 + β 5 x 1 x 2 + + β n x n n [36,45,48,59]. A SIG environment, TerrSet® [59], tools such as IBM SPSS Statistics® [60,61], and add-ins for Excel®, including RISK Simulator, Analyse-It, and XLSTAT [59], were used. In cases of input value validation (reflectance and TSS sampling), the first procedure proposed in [62], it was verified that input values complied with homoscedasticity, adequate micro numerosity, omitted outliers (depending on the model), non-linearity (if applicable), normality, and the absence of multicollinearity. Wavelengths that depict regressive variables were selected individually for each WQP. For TSS, B1, B4, and B6 have shown acceptable behaviors both linearly and non-linearly [24,31,40]. For TN and TP, some authors used B1 and B3 from the Landsat and Sentinel sensors (non-linearly) because B3 captures chlorophyll-a pigment associated with aquatic vegetation [3]. COD has been linearly studied based on bands 1, 2, and 3 [46], and in a non-linear way based on bands 2, 6, and 7 [18].

2.2. Spatio-Temporal Distribution of Estimated WQPs

Once the model with the best fit was identified, its model equation could be applied to classify a water body according to intervals established by applicable regulations (in this case, Mexican regulations) [55]. This is how regions were evaluated; intervals were evaluated for agricultural use (whose permissible limits were TSS = 60–75 mg/L, TN = 40–60 mg/L, and COD = 60–75 mg/L).
In addition to representing the information’s spatial distribution, it was possible to analyze the WQPs’ temporal behaviors relative to the influent water. This study estimated municipal water discharges (depending on population size), as well as inflow (measured by [63]) to infer causal relationships for the WQP concentrations’ variation throughout the year.
Furthermore, to evaluate the possibility of implementing a regression model in different water bodies, at this stage, the difference of means was analyzed based on regression models’ estimates for other bodies with conditions similar to those of the J. A. Alzate Dam (sensor and model type). In this way, regression models whose mean difference (μ1–μ2) were close to zero, or a tolerable under- or over-estimation, were considered as similar, assuming a t-distribution (Equation (1)). The studies considered as references were [3,19,45].
x ¯ 1 x ¯ 2 t / 2 s 1 2 n 1 + s 2 2 n 2 < μ 1 μ 2 < = x ¯ 1 x ¯ 2 + t / 2 s 1 2 n 1 + s 2 2 n 2   ,
where x ¯ 1 is the study’s sample mean using the authors’ equation [mg/L]; x ¯ 2 is the study’s sample mean using the present study’s equation [mg/L];   s 1 2 corresponds to the variance in the authors’ data [mg/L]; s 2 2 is the variance in this study’s data [mg/L]; and n 1   a n d     n 2   are sample sizes.

3. Results and Discussion

To develop multivariate regression models (stage 1), each model type’s reflectances from the considered bands and each sample’s WQP concentrations were evaluated. Although it was difficult to observe a clear spatial trend, Table 2 shows that, in general, WQPs before the rainy season had, on average, 59.3% higher concentrations than after the rainy season, assuming a preliminary dilution effect.
In contrast, Table 3 shows the results of various statistical tests regarding the quality treatment of input data. In general terms, the data showed a normal trend, homoscedasticity (i.e., W-pvalue > 0.1 and χ2 < Vcrit), no globally identified outliers (≤1 sample), and no collinearity of sampling results (r ≤ 0.75 and VIF ≤ 4.0); most models did not present multi-collinearity (F > Vcrit). Finally, the p-value was significant (Pvalue < Vcrit) for variables in exponential models for COD, TP, and TSS; in linear models for TN and TP; and in polynomial models for TP.
The development of the current regression models used various statistical criteria, including the adjusted determination coefficient, mean square error, p-values of coefficients, and confidence intervals. Additionally, techniques such as cross-validation were employed to mitigate the risk of overfitting, while residual analysis was used to assess model assumptions and check for heteroscedasticity. The cross-validation results are presented in Table 4 and provide insights into each regression model’s coefficients.
In the context of TSS, both linear and non-linear models indicated that the B3 and B5 wavelengths had the most substantial influence; this aligns with findings from previous studies [48,50]. In contrast to the model presented in [3], the exponential model for TN was primarily influenced by B1. Although the polynomial model exhibited a higher determination coefficient and a lower RMSE, it raised concerns related to the significance and collinearity of certain coefficients.
For TP, the ratio B5/B2 and B6 exerted significant influence and provided acceptable estimates within the 18 to 98 mg/L concentration range in the polynomial model, whereas in the model used in [3], this parameter was largely dependent on B2.
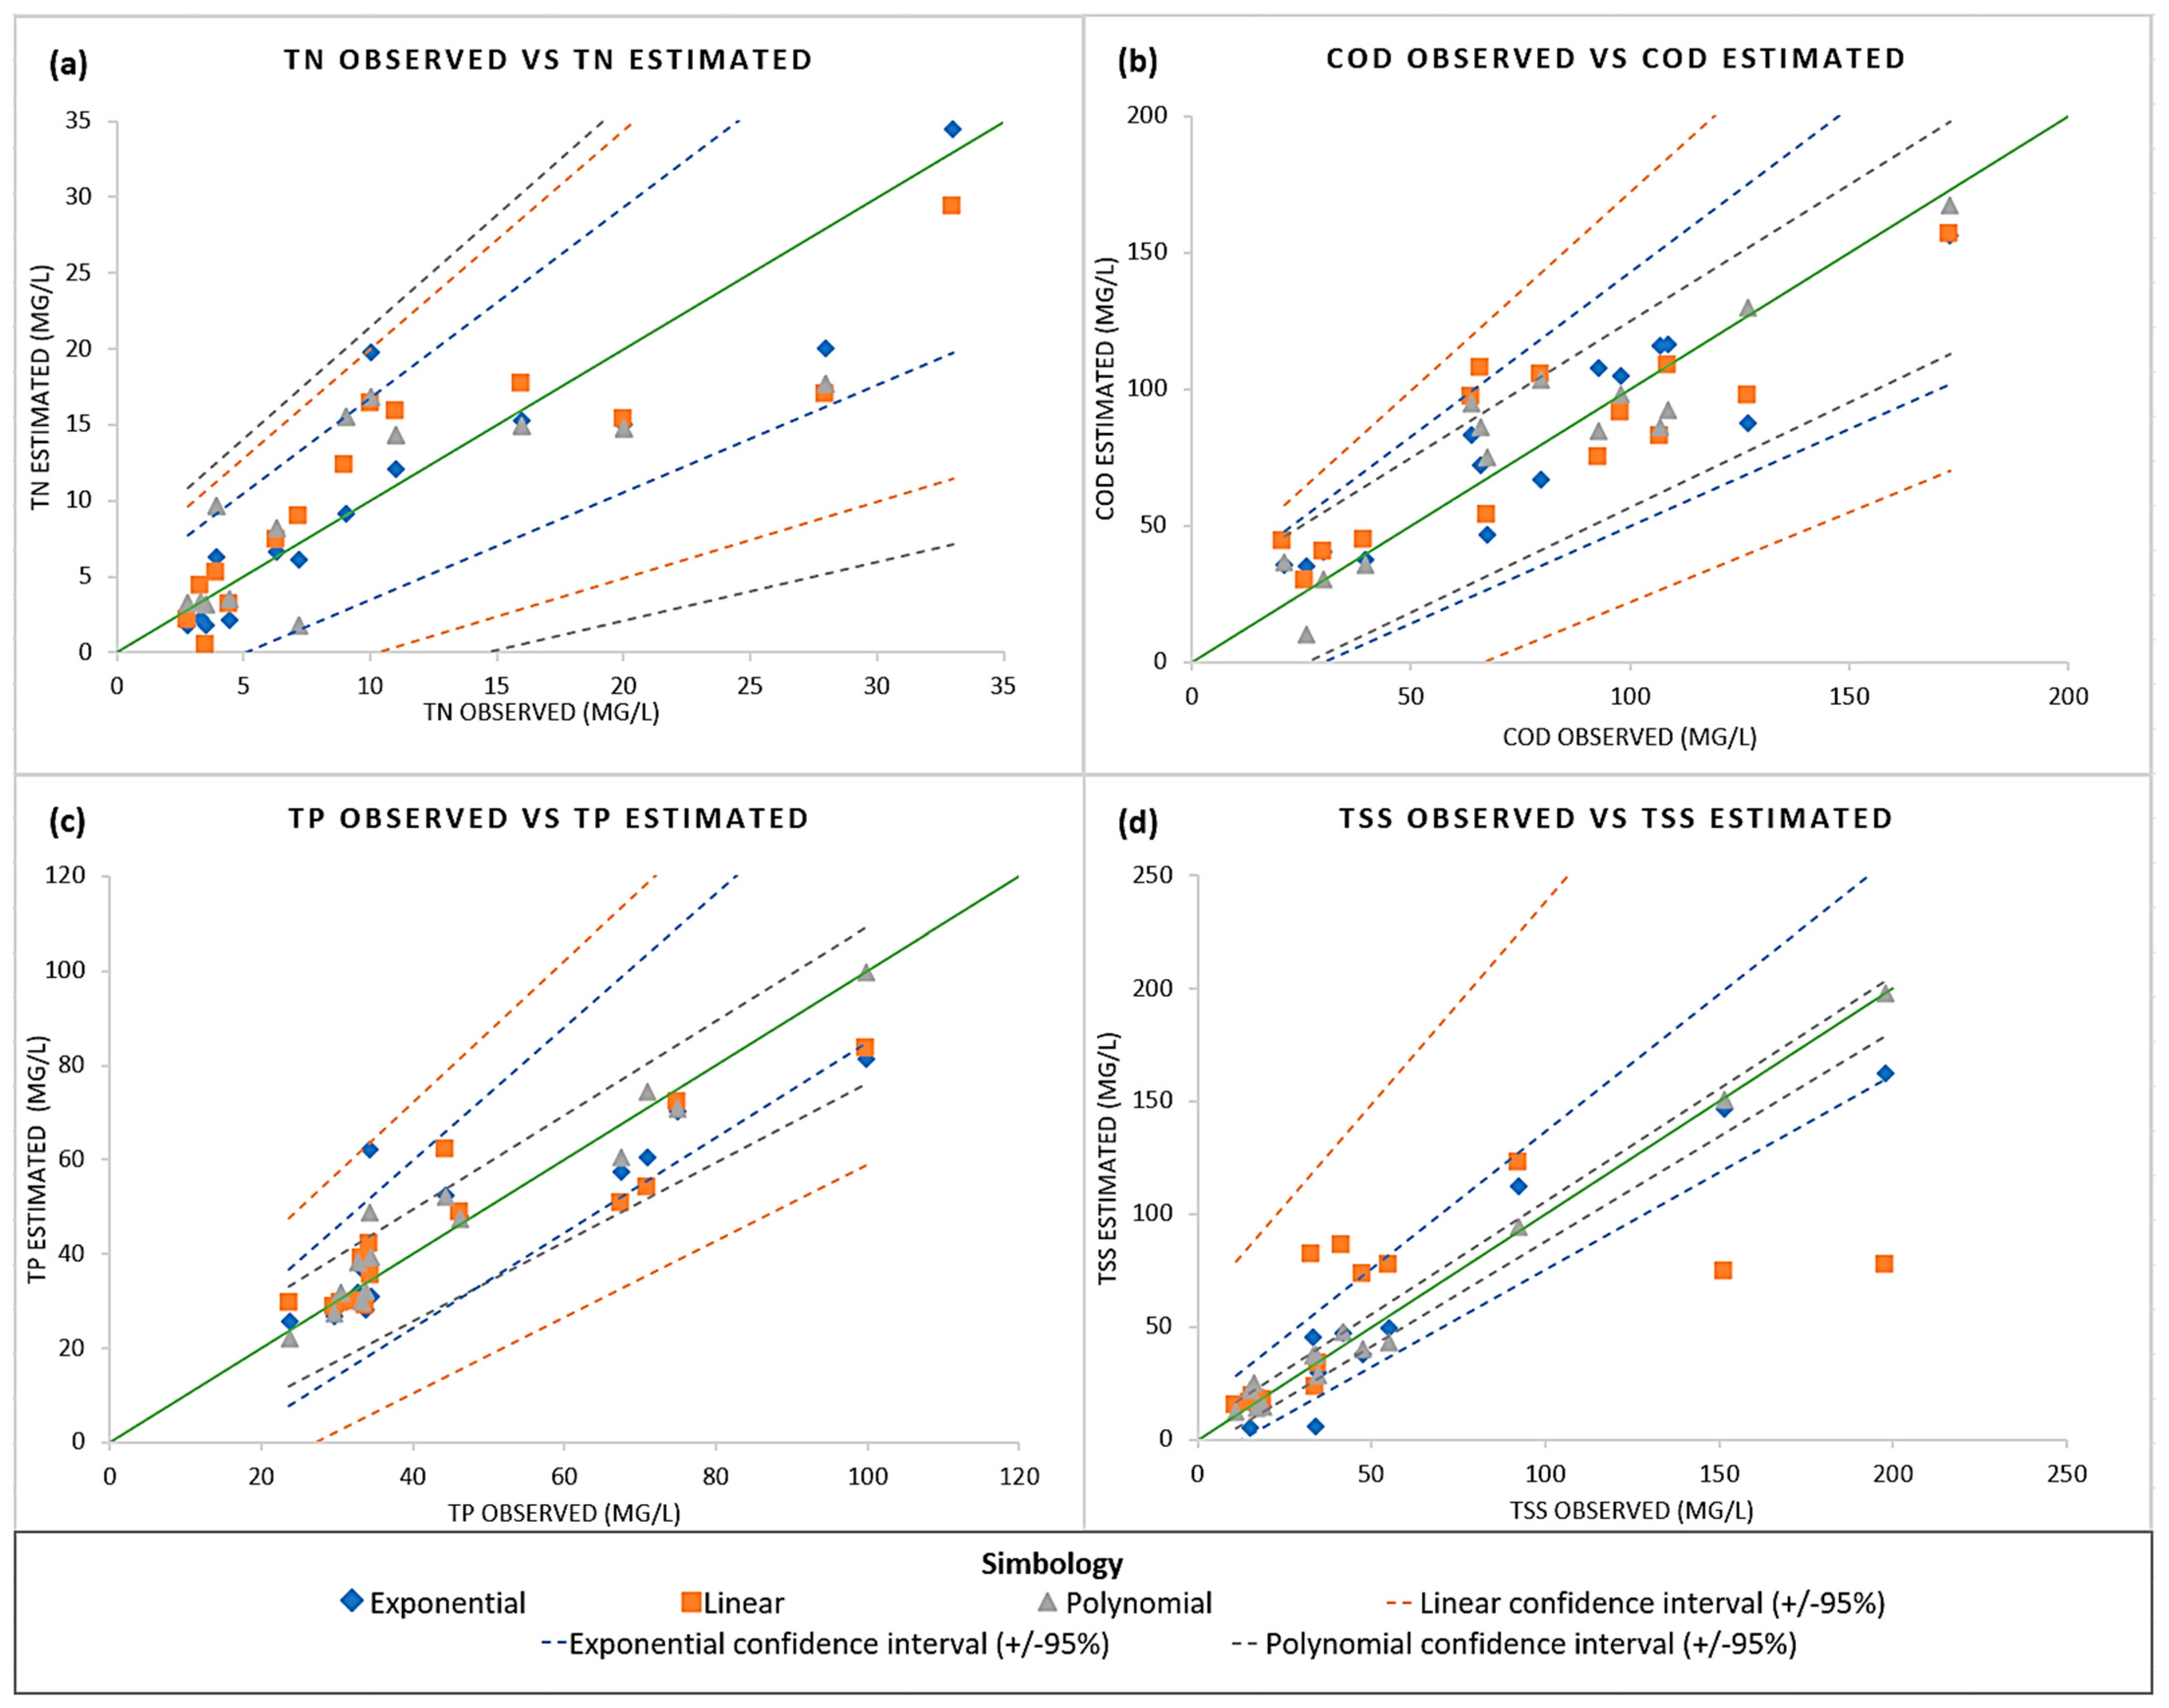
COD was primarily influenced by the B2/B3 relationship in the exponential model, consistent with findings in [46] and [63]. The exponential model demonstrated a superior explanatory capacity for TN and COD (as shown in Figure 2a,b) based on the determination coefficient and RMSE. However, the model might have slightly overestimated COD concentrations exceeding 150 mg/L.
All models (as depicted in Figure 2c,d) exhibited a good fit with determination coefficients greater than 0.92, particularly in the polynomial configuration (Table 4); notably, both linear and exponential models tended to underestimate concentrations in these cases.
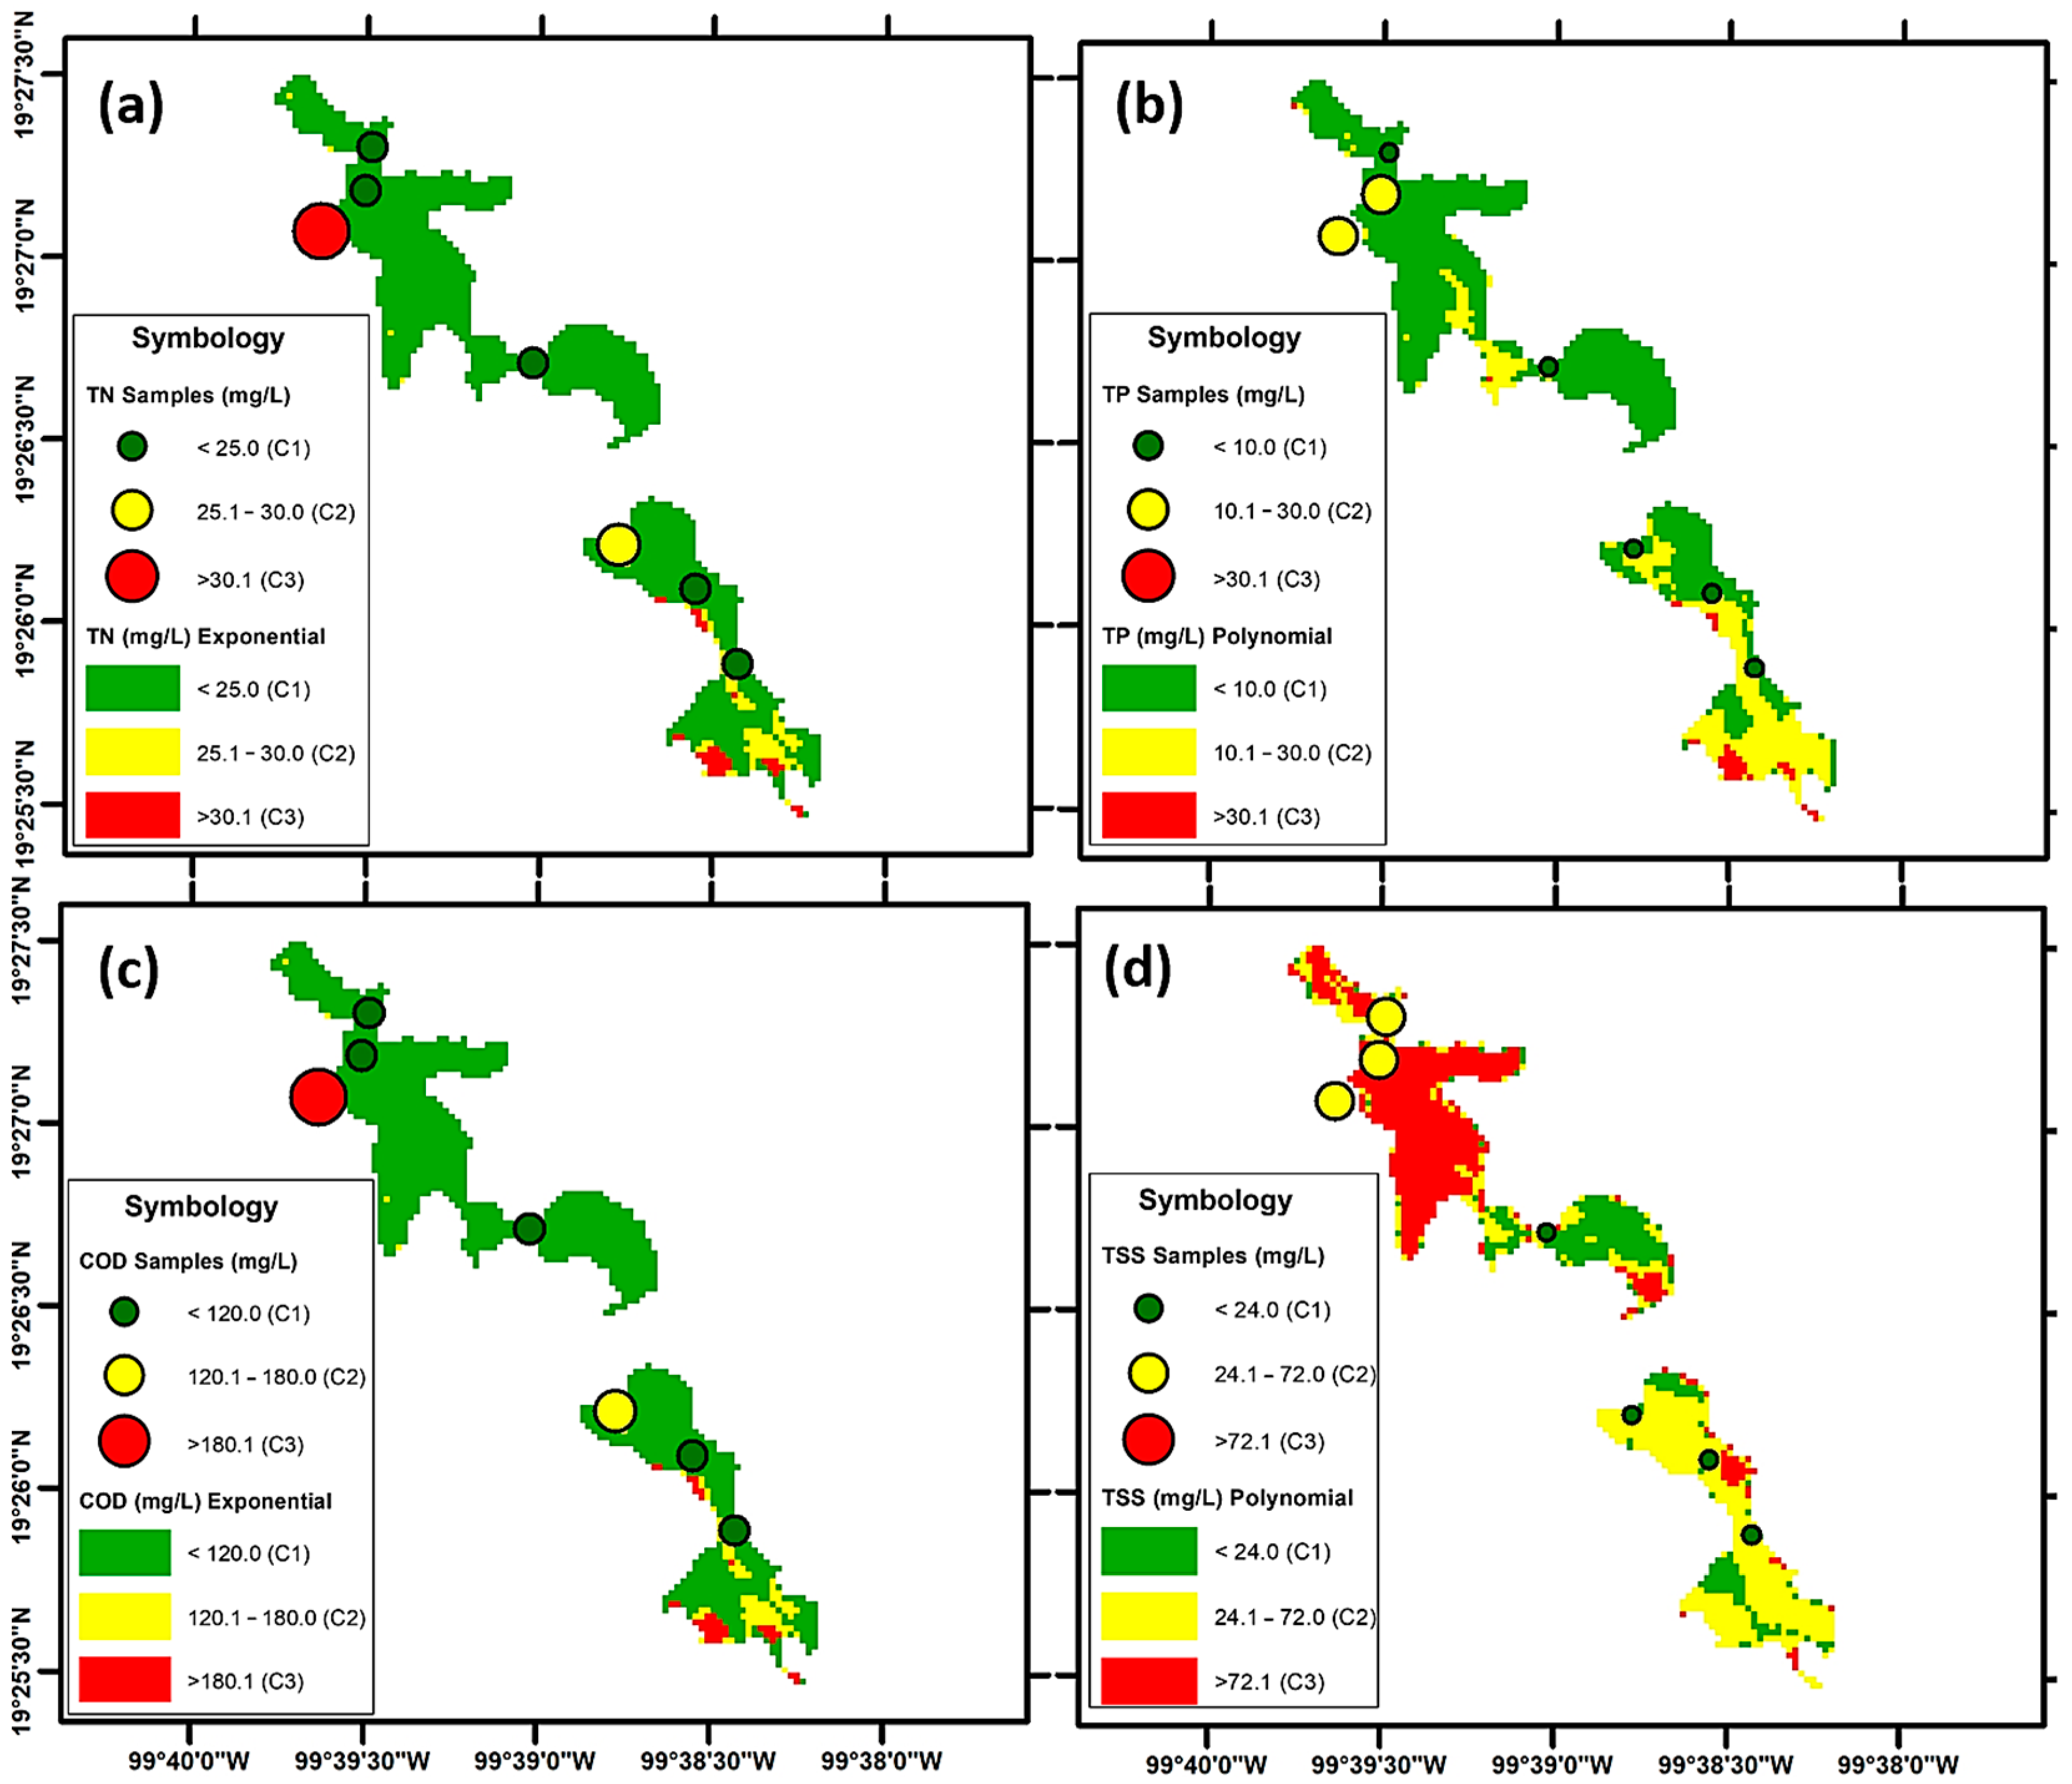
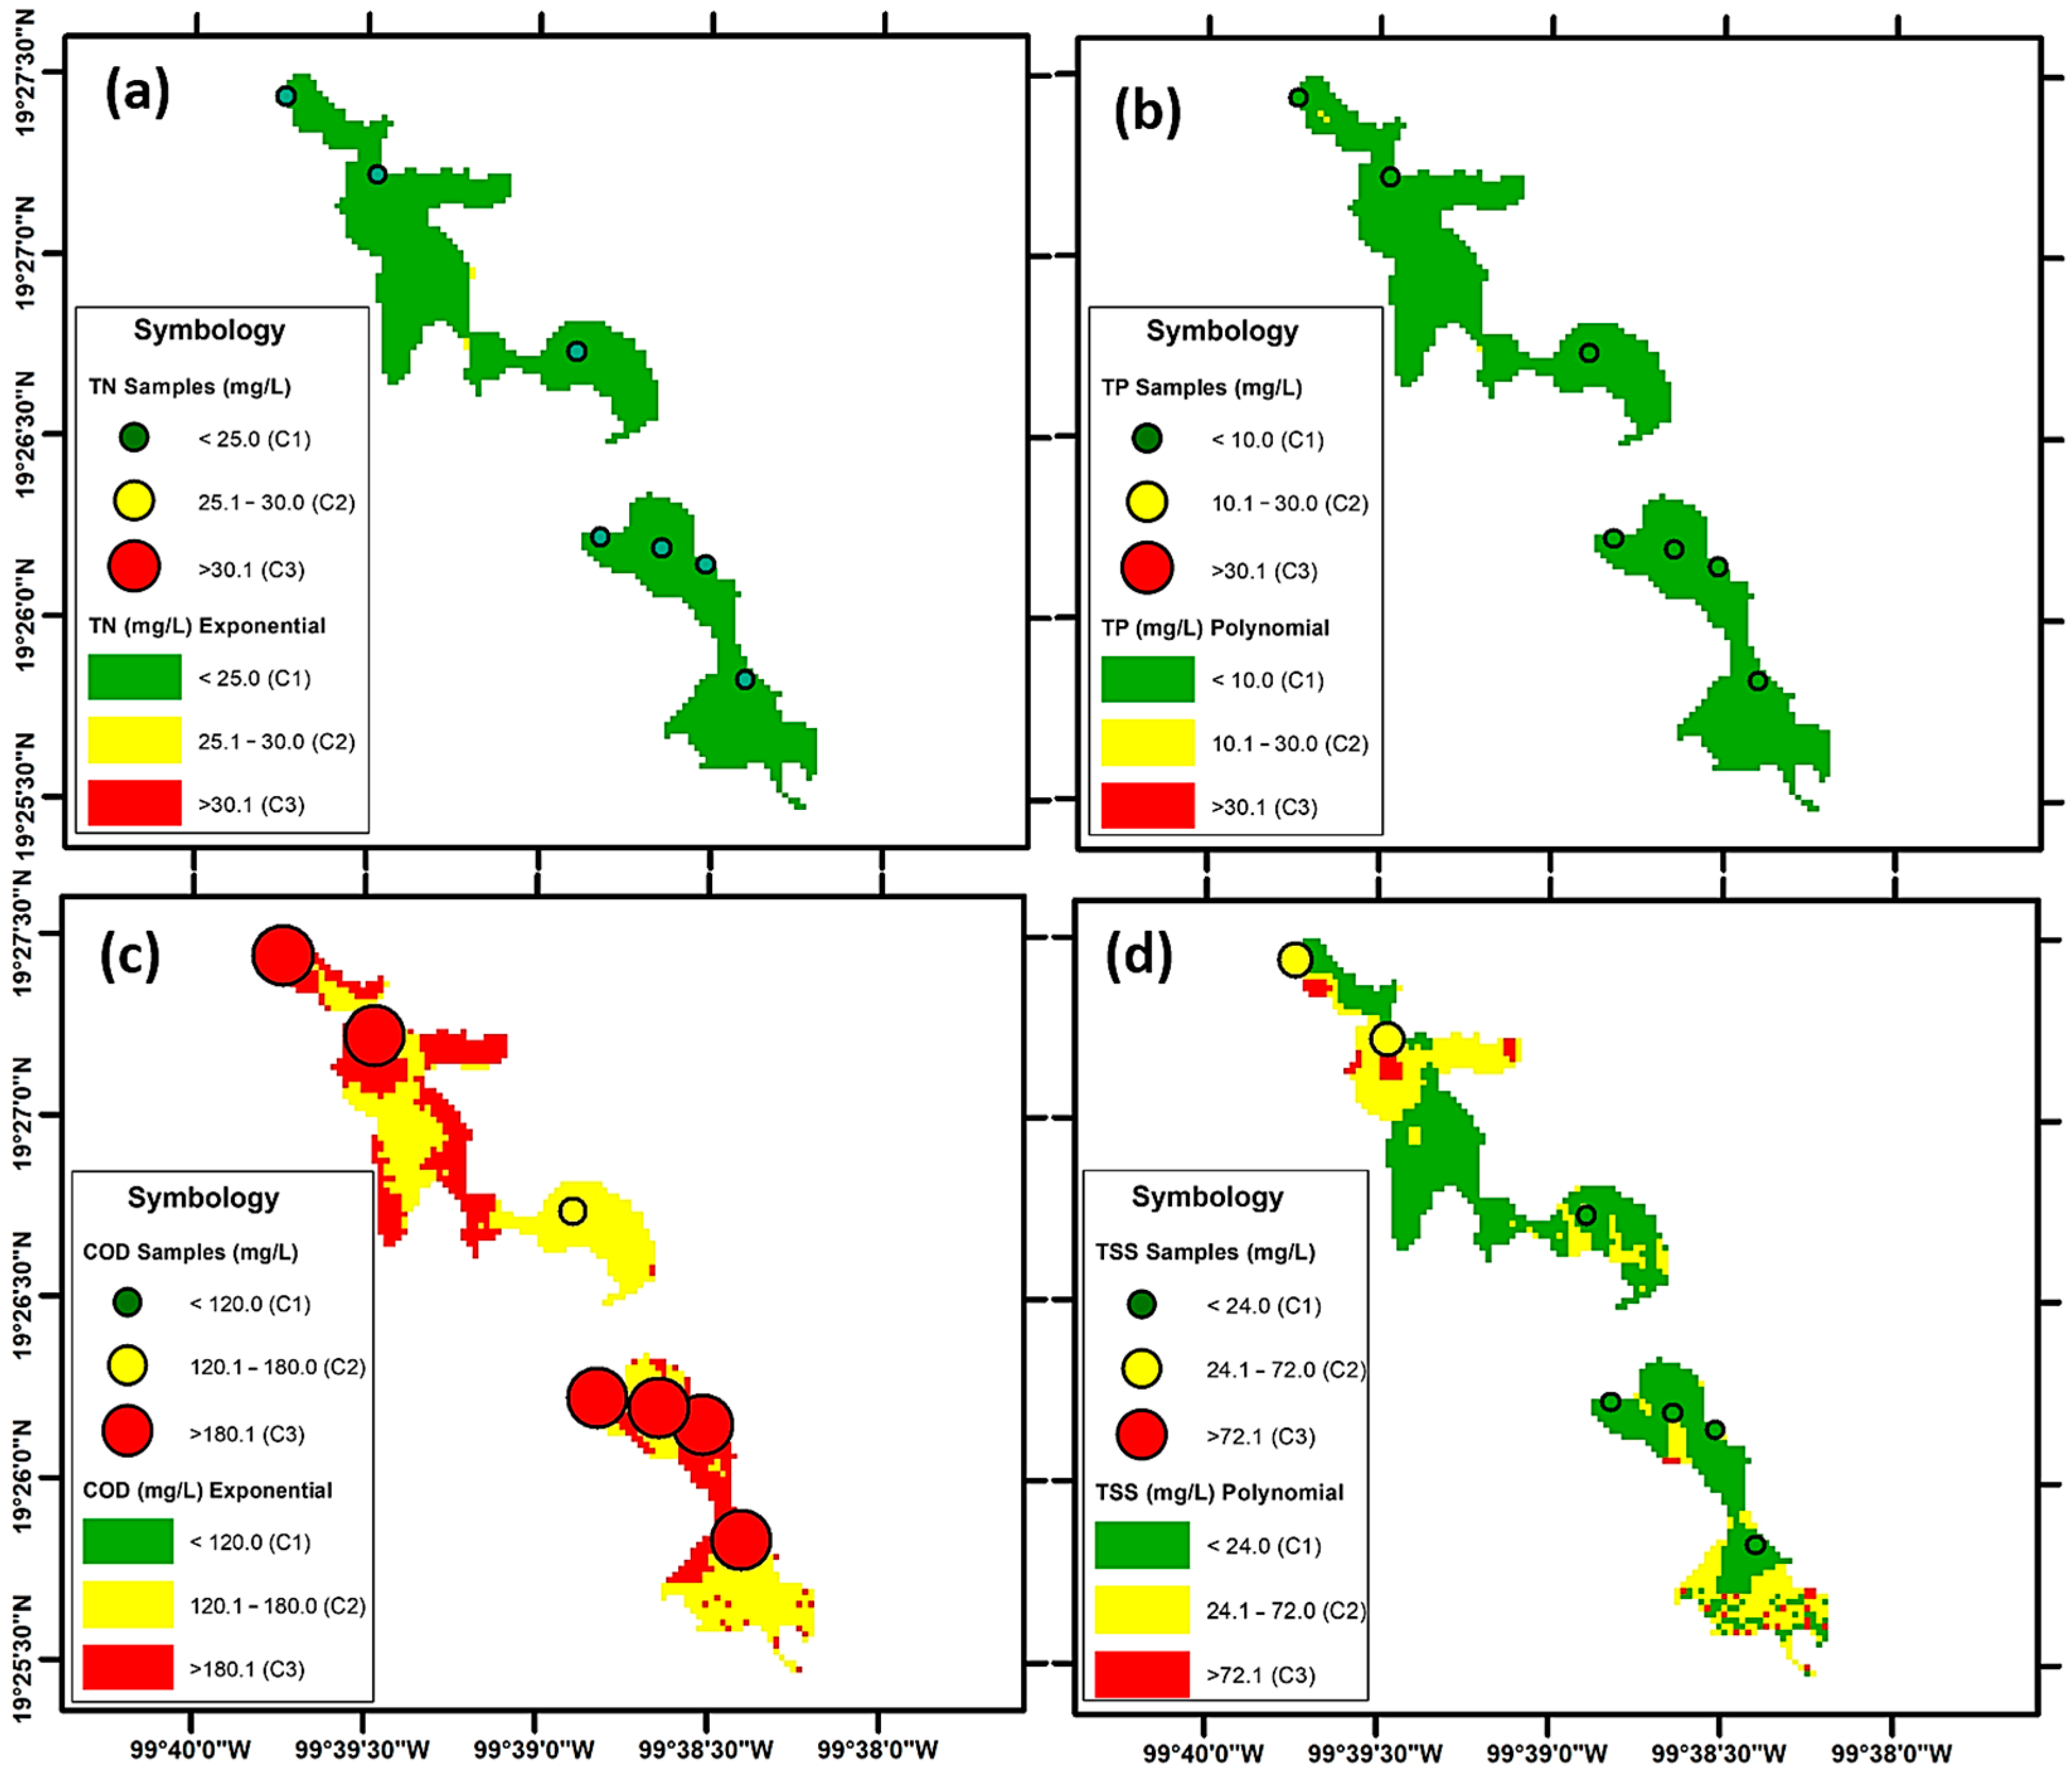
The application of regression models (stage 2) was carried out according to a classification based on standard Mexican concentrations [51,52,53,54,55] permitted for discharges into rivers, streams, and drains (C1); reservoirs, lakes, and lagoons (C2); and outside permissible limits (C3). It was observed that before the rainy season, 92% of the surface (1.32 km2) was below the permissible C1 limit for TN discharge (Figure 3a). After the rainy season, this area increased (especially in the southern zone) to 99.7% (1.42 km2), inferring a dilution process (Figure 4a). COD presented a similar dilution behavior; in the dry season 73.2% of the surface was below the permissible C2 limit; after the rainy season, it increased to 99.7%, mainly in the central zone (Figure 3b and Figure 4b). The water body’s surface presented 92.2% and 41.0% concentrations out of TP’s range (C3) before and after the rainy season, respectively (Figure 3c and Figure 4c). The surface outside permissible TSS limits decreased from 97.01% to 60.7% before and after the rainy season, respectively (Figure 3d and Figure 4d). TSS’ and COD’s percentages presented a lower sensitivity to rain and can be explained by municipal and industrial discharges along the Lerma River. It should be noted that certain data points in Figure 3 and Figure 4 may appear to be outside the established region’s range due to the dots’ size relative to the resolution of the value distribution image.
In addition to examining the WQPs’ spatial distributions, we also investigated their interannual variations by applying the developed models to imagery captured between 2019 and 2021. These variations were influenced by factors such as dilution and dragging, which were identified through changes in inflow and domestic discharge patterns. The analysis considered recorded inflows at gauge station 12,374, known as ‘La Y’ [48], and municipal wastewater discharges, which were estimated based on demographic data (as shown in Figure 5).
Through WQP estimation using selected models over a two-year period, we were able to elucidate patterns of concentration influenced by dilution and dragging effects. This analysis involved comparing variations in WQP concentrations with inflow variations, which encompassed both runoff and municipal discharges (based on observations from [64]).
Figure 5 illustrates the dynamic relationship between inflow and WQP concentrations. Notably, there was a nearly constant minimum flow of 5 m3/s stemming from municipal discharges. During the rainy season, this flow could increase up to fourfold. In contrast, concentrations of COD, TN, and TP exhibited their highest values during the dry season; on average, TN and COD concentrations doubled, while TP concentrations increased threefold. This behavior is indicative of a dilution effect resulting from increased water volume.
However, TSS concentrations followed a different pattern. As the inflow rate increased, TSS concentrations also increased, indicating a dragging effect. Notably, during the last few months, TSS experienced a significant increase, deviating from this typical trend. In summary, this analysis demonstrates the interplay between inflow dynamics and WQP concentrations. While TN, COD, and TP exhibited dilution patterns, TSS displayed a dragging effect, with exceptions noted during the later months. Understanding these effects is crucial for effective water quality management and environmental monitoring.
In the context of modeling water quality parameters, it is essential to explore the similarities and differences between various models. This discussion focuses on the TSS, TN, and TP models (Figure 6).
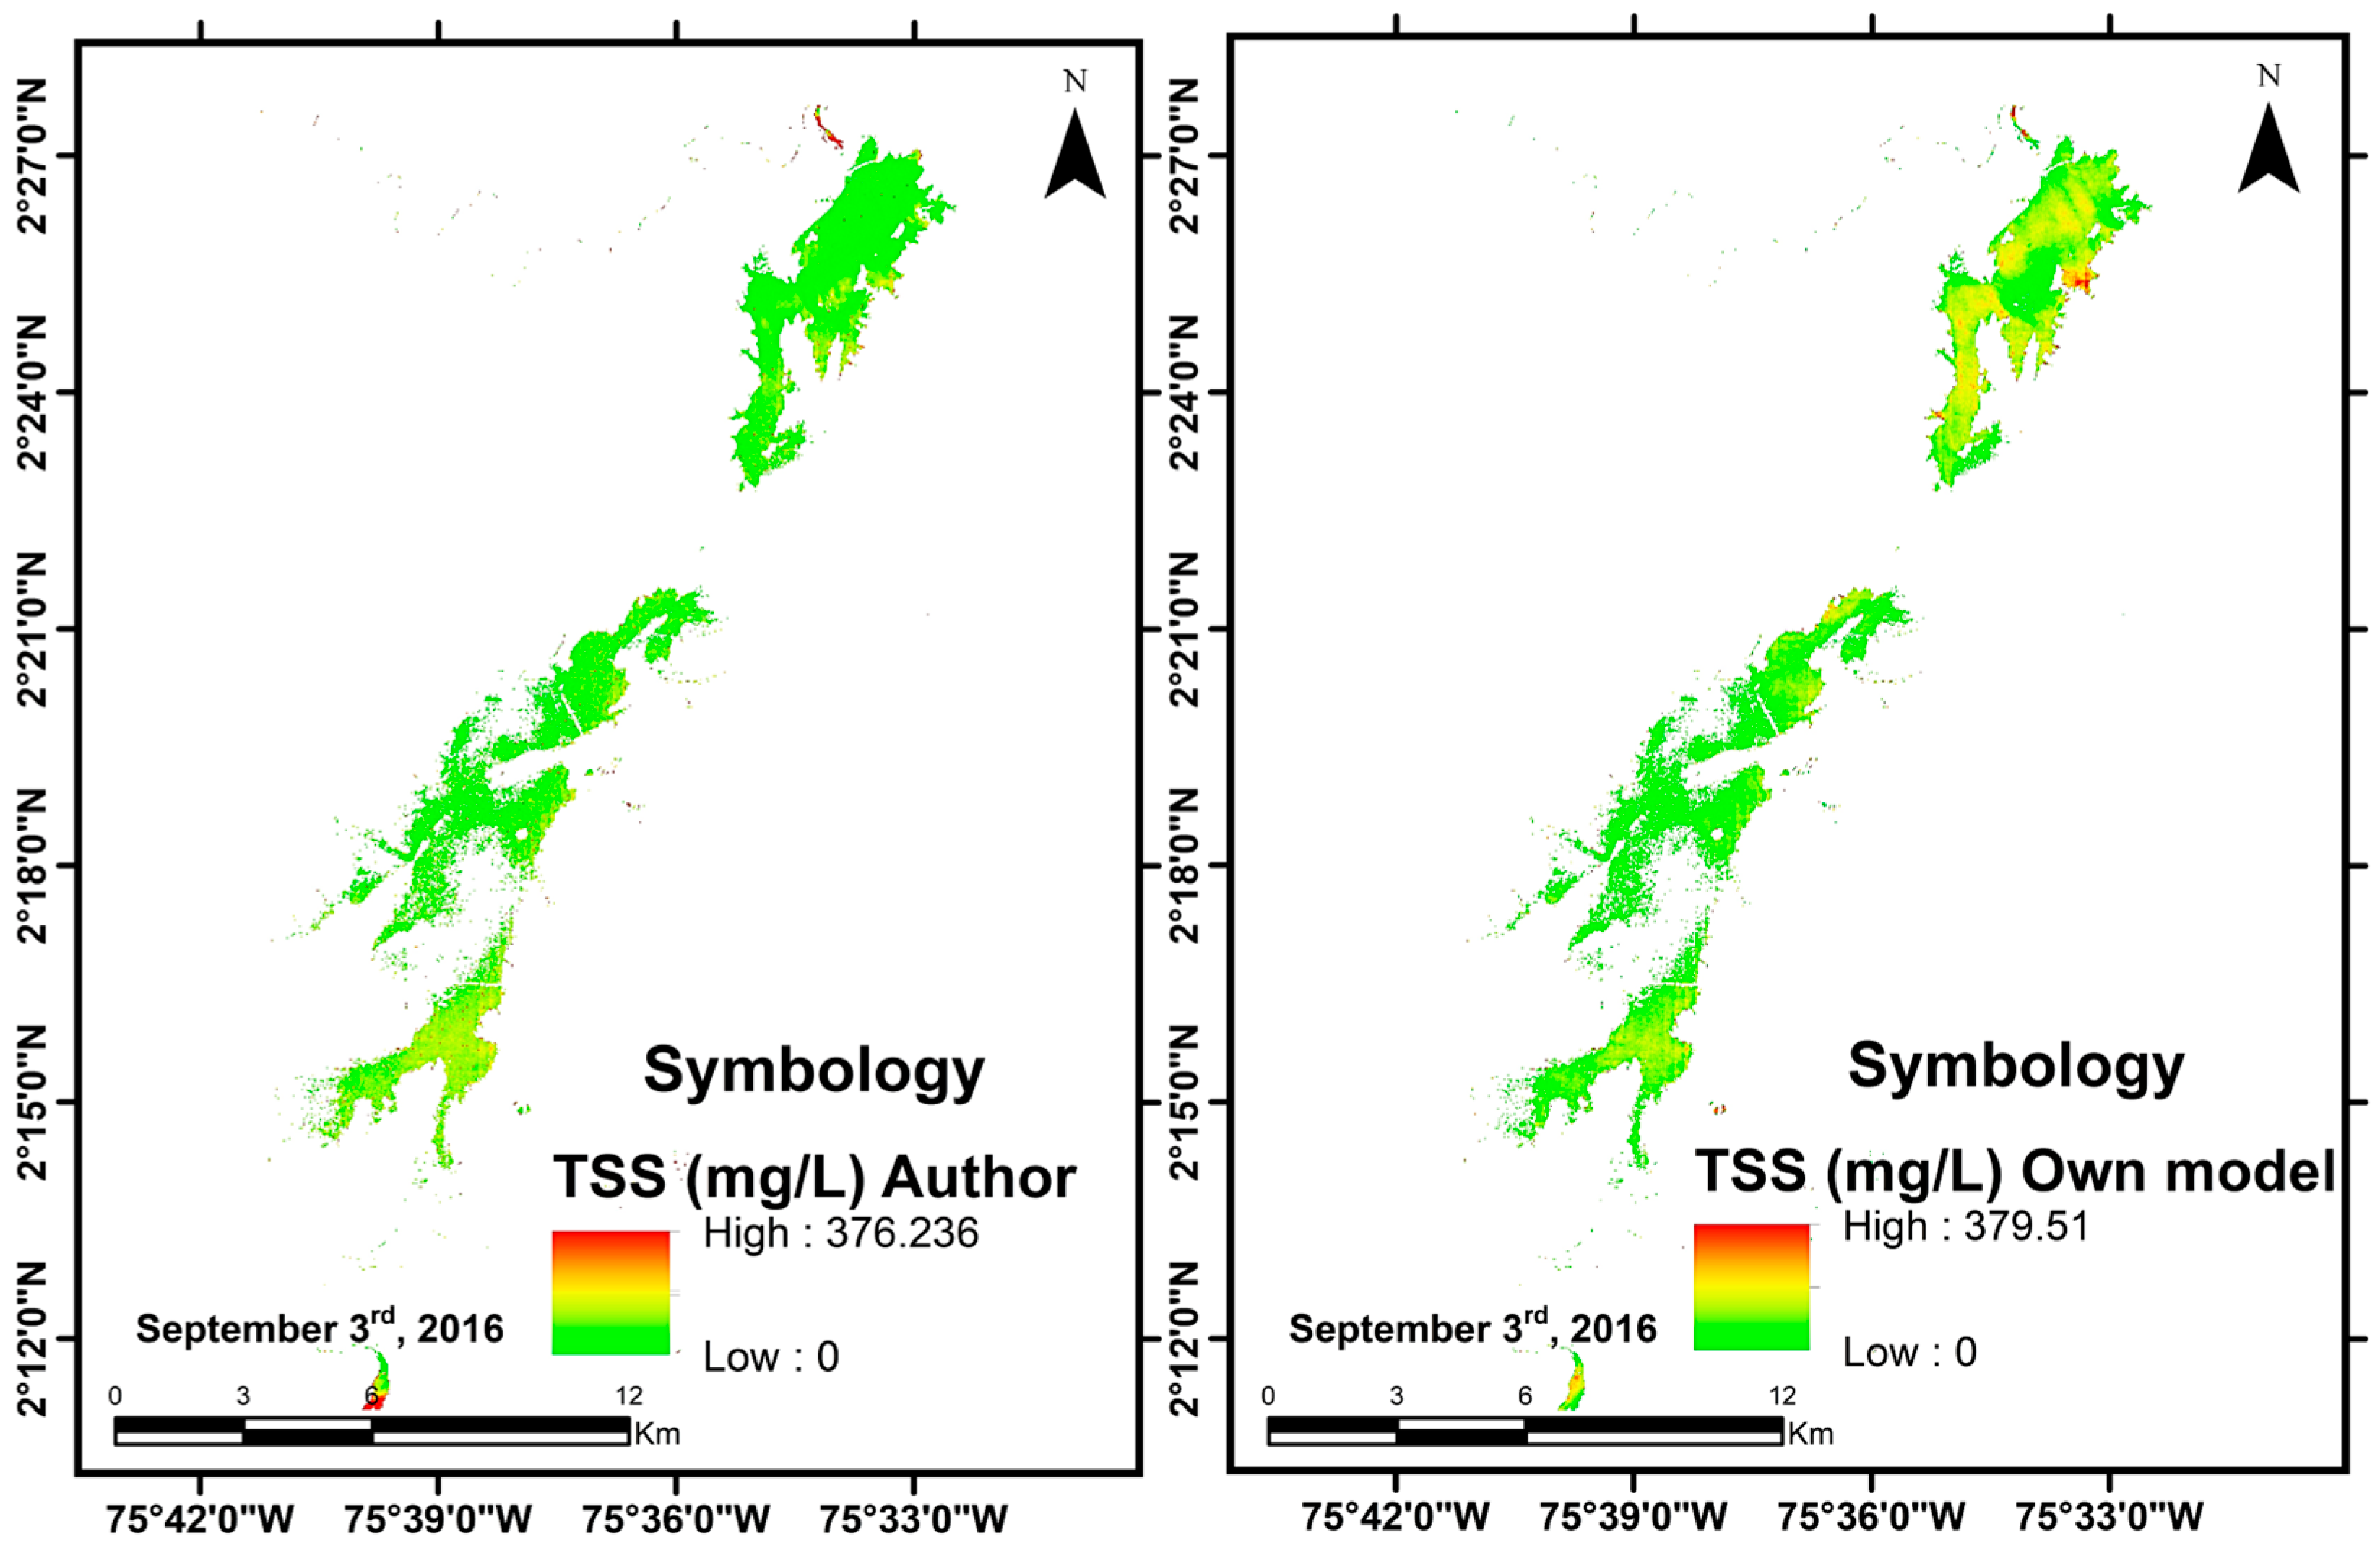
First, when examining [45]’s TSS model, we noted that it (along with one of the models developed for the J. A. Alzate Dam) employs a non-linear function based on bands 4 and 5. Both models predict TSS concentrations that reach up to 500 mg/L. Comparing these models’ estimations to a stratified sample using the same reflectance images, we observed that the authors’ TSS model appeared to exhibit more scattering, with a standard deviation 2.5 times higher than the current model’s. However, on average, the models indicated the potential for providing similar estimations, as the difference between their means ranged from −9.51 to 0.57 (Table 5). In other words, the current model tended to slightly overestimate TSS concentrations compared to the authors’ model. It is important to note that this comparison did not intend to determine which model was superior. Instead, it highlighted that certain models, even when developed under different climatological and geographical conditions, can exhibit close correlations, as demonstrated in Figure 6. The spatial distribution of estimations in this case not only helped identify the location of detected overestimations (northeastern shore) for high TSS values, but also indicated slight underestimations of concentrations ranging from 95 to 110 mg/L.
Notably, the current TN and TP models tended to overestimate concentrations by 2.8% for TN and 14.8% for TP. However, the dispersion of these estimates appeared to follow a pattern similar to that observed for TSS when considering deviation standards. This suggests that it would be advisable to develop integrative models that take the nature and type of model specific to each water quality parameter (WQP) into account.
In summary, the comparison of these models underscores the need to carefully assess model performance and consider the variability associated with different environmental conditions. By doing so, we can make informed decisions about which models are suitable for particular applications, and whether integrated models should be developed to account for the nuances of each WQP.

4. Conclusions

As noted in similar studies, some regression models were satisfactorily adjusted using cross-validation to estimate (through remote sensing) some water quality parameters, such as total nitrogen (TN), total phosphorus (PT), chemical oxygen demand (COD), and total suspended solids (TSS), in a surface water body, the J. A. Alzate Dam, in the Mexican highlands. The proposed configurations of these models were polynomial, exponential, and linear for each WQP, according to a review of similar previous studies. Several model characteristics were identified. First, the polynomial model provided a better fit for COD than the exponential model did; however, it presented a slower cross-validation convergence. These models’ respective terms might be subject to a lower significance and greater collinearity. Second, the exponential model presented a higher determination coefficient for TN; its terms had no problems of significance, homoscedasticity, or collinearity. Third, the polynomial models for TP and TSS presented a better goodness-of-fit, although their collinearity of terms could be present in any TP model. Therefore, given the present research, it is recommended that input data be evaluated under linear and non-linear schemes. Notably, using remote sensing requires the proper identification of pixels corresponding to the water body. In this case, in addition to using the normalized water index, the dispersion of reflectance values (represented by their standard deviations) was relevant, which helped significantly reduce outliers in the models’ terms.
In addition to identifying the most appropriate models, it was possible to determine a spatial distribution of WQP concentrations and their temporal behaviors. On the one hand, spatial distribution serves as a tool for the classification of critical regions under some regulations. For example, in this case study, Mexican regulations were used to determine areas that exceeded maximum permissible limits for water discharges. On the other hand, the estimation of WQPs’ temporal behavior was useful during the monitoring and retrospective evaluation of the water body. To do this, it was necessary to estimate influents (such as flows) using precipitation and discharge from human settlements. This provided evidence of dilution and drag effects, as observed in this case study. Dilution was associated with a decrease in concentrations of TN, TP, and COD, while the drag effect corresponded to TSS, which presented higher concentrations in the first months after the rain. In this sense, it is important to consider a strategic distribution of sampling throughout the year to enhance a model’s scope.
Each model’s scope was evaluated with respect to different regression types and its applicability to other water bodies under conditions similar to those in which the model was developed (regression and sensor types). In general, a low relationship was observed between results obtained using the current models and those of other authors. However, in three models differences between their means were identified as acceptable, indicating model compatibility. This supports the approach of studies that developed integrated models according to the characterization or regionalization of surface water bodies, e.g., [65,66].

Author Contributions

Conceptualization, A.C.-R., C.R.F., R.B.-P. and M.H.-T.; methodology, A.C.-R., C.R.F., R.B.-P. and M.A.G.-A.; software use, A.C.-R., R.B.-P., C.A.M.-L., M.A.G.-A. and M.H.-T.; validation, C.R.F., C.A.M.-L., R.B.-P., A.C.-R., S.G.-A. and M.A.G.-A.; formal analysis, A.C.-R., S.G.-A., R.B.-P., M.A.G.-A., C.R.F. and C.A.M.-L.; investigation, A.C.-R., R.B.-P. and C.R.F.; resources, A.C.-R., R.B.-P., C.R.F., M.A.G.-A., S.G.-A., M.H.-T. and C.A.M.-L.; data curation, A.C.-R., R.B.-P., C.R.F. and M.A.G.-A.; writing—original draft preparation, A.C.-R., C.R.F. and R.B.-P.; writing—review and editing, M.A.G.-A., S.G.-A., M.H.-T. and C.A.M.-L.; visualization, A.C.-R., R.B.-P., M.A.G.-A. and C.A.M.-L.; supervision, C.R.F. and R.B.-P. All authors have read and agreed to the published version of the manuscript.

Funding

This research was funded by CONACYT, grant number 475828, and the UAEMex through the project “Decision-making models for the water resources recovery: characterization through remote sensing and comprehensive rainwater harvesting systems”; grant number pending.

Data Availability Statement

The available research data can be found on the IDRISI portal Uaemex: “https://www.idrisi.uaemex.com. (accessed on 15 April 2023)”.

Acknowledgments

The authors appreciate the generous support of CONACyT, COMECyT and UAEMex, Folio E430/I.A./51829/19, and Edgar R. Diaz [CTP-64500+527229010675] for manuscript translation services.

Conflicts of Interest

The authors declare no conflict of interest.

References

  1. Adjovu, G.E.; Stephen, H.; James, D.; Ahmad, S. Measurement of Total Dissolved Solids and Total Suspended Solids in Water Systems: A Review of the Issues, Conventional, and Remote Sensing Techniques. Remote Sens. 2023, 15, 3534. [Google Scholar] [CrossRef]
  2. Zeinalzadeh, K.; Rezaei, E. Determining spatial and temporal changes in surface water quality using principal component analysis. J. Hydrol. Reg. Stud. 2017, 13, 1–10. [Google Scholar] [CrossRef]
  3. Zeiny, A.; Kafrawy, S. Assessment of water pollution induced by human activities in Burullus Lake using Landsat 8 operational land imager and GIS. Egypt. J. Remote Sens. Space Sci. 2016, 20, 549–556. [Google Scholar]
  4. Ouma, Y.; Noor, K.; Herbert, K. Modelling Reservoir Chlorophyll-a, TSS, and Turbidity Using Sentinel-2A MSI and Landsat-8 OLI Satellite Sensors with Empirical Multivariate Regression. J. Sens. 2020, 2020, 8858408. [Google Scholar] [CrossRef]
  5. Gholizadeh, M.H.; Melesse, A.M.; Deddi, L. A Comprehensive Review on Water Quality Parameters Estimation Using Remote Sensing Techniques. Sensor 2016, 16, 1298. [Google Scholar] [CrossRef]
  6. Wang, X.; Yang, W. Water quality monitoring and evaluation using remote sensing techniques in China: A systematic review. Ecosyst. Health Sustain. 2019, 5, 47–56. [Google Scholar] [CrossRef]
  7. Yang, H.; Kong, J.; Hu, H.; Du, Y.; Gao, M.; Chen, F. A review of remote sensing for water quality retrieval: Progress and challenges. Remote Sens. 2022, 14, 1770. [Google Scholar] [CrossRef]
  8. Chang, N.B.; Imen, S.; Vannah, B. Remote Sensing for Monitoring Surface Water Quality Status and Ecosystem State in Relation to the Nutrient Cycle: A 40-Year Perspective. Crit. Rev. Environ. Sci. Technol. 2015, 45, 101–166. [Google Scholar] [CrossRef]
  9. Chang, N.B.; Bai, K.; Imen, S.; Chen, C.F.Y.; Gao, W. Fusión y creación de redes de imágenes satelitales multisensor para el monitoreo ambiental en todo clima. IEEE Syst. J. 2018, 12, 1341–1357. [Google Scholar] [CrossRef]
  10. Fauzi, M.; Wicaksono, P. Total Suspended Solid (TSS) Mapping of Wadaslintang Reservoir Using Landsat 8 OLI. In IOP Conference Series: Earth and Environmental Science-Proceedings of the 2nd International Conference of Indonesian Society for Remote Sensing (ICOIRS), Yogyakarta, Indonesia, 17–19 October 2016; IOP Publishing: Bristol, UK, 2019; Volume 47, pp. 1–9. [Google Scholar]
  11. Wang, H.; Wang, J.; Cui, Y.; Yan, S. Consistency of Suspended Particulate Matter Concentration in Turbid Water Retrieved from Sentinel-2 MSI and Landsat-8 OLI Sensors. Sensor 2021, 21, 1662. [Google Scholar] [CrossRef]
  12. Gómez, J.L.; Dalence, J.S. Determinación del parámetro sólidos suspendidos totales (SST) mediante imágenes de sensores ópticos en un tramo de la cuenca media del río Bogotá (Colombia). Rev. UD Geomática 2014, 9, 19–27. [Google Scholar]
  13. Torres Vera, M.A. Mapping of total suspended solids using Landsat imagery and machine learning. Int. J. Environ. Sci. Technol. 2023, 20, 11877–11890. [Google Scholar] [CrossRef]
  14. Xu, H.; Xu, G.; Hu, X.; Wang, Y. Lockdown effects on total suspended solids concentrations in the Lower Min River (China) during COVID-19 using time-series remote. Int. J. Appl. Earth Obs. Geoinf. 2021, 98, 102301. [Google Scholar] [CrossRef] [PubMed]
  15. Kumar, A.; Equeenuddin, S.M.; Mishra, D.R.; Acharya, B.C. Remote monitoring of sediment dynamics in a coastal lagoon: Long-term Spatio-temporal variability of suspended sediment in Chilika. Estuar. Coast. Shelf Sci. 2016, 170, 155–172. [Google Scholar] [CrossRef]
  16. Li, W.; Yu, W. Modelling Reservoir Turbidity Using Landsat 8 Satellite Imagery by Gene Expression Programming. Water 2019, 11, 1479. [Google Scholar] [CrossRef]
  17. Langhorst, T.; Pavelsky, T.; Eidam, E.; Cooper, L.; Davis, L.; Spellman, K.; Clement, S.; Arp, C.; Bondurant, A.; Friedmann, E.; et al. Increased scale and accessibility of sediment transport research in rivers through practical, open-source turbidity and depth sensors. Res. Square 2023, 1, 1–23. [Google Scholar] [CrossRef]
  18. Hajigholizadeh, M.; Melesse, A.M. Assortment and spatiotemporal analysis of surface water quality using. CATENA 2016, 151, 247–258. [Google Scholar] [CrossRef]
  19. Li, J.; Meng, Y.; Li, Y.; Cui, Q.; Yand, X.; Tao, C.; Wang, Z.; Li, l.; Zhang, W. Accurate water extraction using remote sensing imagery based on Normalized difference water index and unsupervised deep learning. J. Hydrol. 2022, 612, 128202. [Google Scholar] [CrossRef]
  20. Zhang, Y.; Wu, L.; Ren, H.; Deng, L.; Zhan, P. Retrieval of Water Quality Parameters from Hyperspectral Images Using Hybrid Bayesian Probabilistic Neural Network. Remote Sens. 2020, 12, 1567. [Google Scholar] [CrossRef]
  21. Chang, N.B.; Benjamin, W.; Jeffrey-Yang, Y.; Elovitz, M. Evaluation of dynamic linkages between evapotranspiration and land-use/land-cover changes with Landsat TM and ETM+ data. Int. J. Remote Sens. 2014, 33, 3733–3750. [Google Scholar]
  22. Jaelani, L.M.; Ratnaningsih, R.Y. Spatial and Temporal Analysis of Water Quality Parameter using Sentinel-2A Data; Case Study: Lake Matano and Towuti. Int. J. Adv. Sci. Eng. Inf. Technol. 2018, 8, 547–553. [Google Scholar] [CrossRef]
  23. Zheng, Z.; Wang, D.; Gong, F.; He, X.; Bai, Y. A Study on the Flux of Total Suspended Matter in the Padma River in Bangladesh Based on Remote-Sensing Data. Water 2021, 13, 2373. [Google Scholar] [CrossRef]
  24. Abdelmalik, K.W. Role of statistical remote sensing for Inland water quality parameters prediction. Egypt. J. Remote Sens. Space Sci. 2016, 21, 193–200. [Google Scholar] [CrossRef]
  25. Rahman, A.S.; Rahman, A. Application of Principal Component Analysis and Cluster Analysis in Regional Flood Frequency Analysis: A Case Study in New South Wales, Australia. Water 2020, 12, 781. [Google Scholar] [CrossRef]
  26. Sagan, V.; Peterson, K.T.; Maimaitijiang, M.; Sidike, P.; Sloan, J.; Greeling, B.A.; Adams, C. Monitoring inland water quality using remote sensing: Potential and limitations of spectral indices, bio-optical simulations, machine learning, and cloud computing. Earth-Sci. Rev. 2020, 205, 103187. [Google Scholar] [CrossRef]
  27. Bernardo, N.; Watanabe, F.; Rodrigues, T.; Alcántara, E. Atmospheric correction issues for retrieving total suspended matter concentrations in inland waters using OLI/Landsat-8 image. Adv. Space Res. 2017, 59, 2335–2348. [Google Scholar] [CrossRef]
  28. Chen, J.; Quan, W.; Duan, H.; Xing, Q.; Xu, N. An Improved Inherent Optical Properties Data Processing System for Residual Error Correction in Turbid Natural Waters. IEEE J. Sel. Top. Appl. Earth Obs. Remote Sens. 2021, 14, 6596–6607. [Google Scholar] [CrossRef]
  29. Wang, C.; Chen, S.; Li, D.; Wang, D.; Liu, W.; Yang, J. A Landsat-based model for retrieving total suspended concentration of estuaries and coasts in China. Geoscientific Model Dev. 2017, 10, 4347–4365. [Google Scholar] [CrossRef]
  30. Loaiza, J.G.; Rangel-Peraza, J.G.; Monjardín-Armenta, S.A.; Bustos-Terrones, Y.A.; Bandala, E.R.; Sanhouse-García, A.J.; Rentería-Guevara, S.A. Surface Water Quality Assessment through Remote Sensing Based on the Box–Cox Transformation and Linear Regression. Water 2023, 15, 2606. [Google Scholar] [CrossRef]
  31. Chongyang, W.; Weijiao, L.; Shuisen, C.; Dan, L.; Danni, W.; Jia, L. The spatial and temporal variation of total suspended solid concentration in Pearl River Estuary during 1987–2015 based on remote sensing. Sci. Total Environ. 2018, 618, 1125–1138. [Google Scholar]
  32. Ghada, Y.E.; Marieke, A.E.; Meinte, B.; Kessel, T.; Gaytan, S.; Hendrik, J. Improving the Description of the Suspended Particulate Matter Concentrations in the Southern North Sea through Assimilating Remotely Sensed Data. Ocean Sci. J. 2011, 46, 179–204. [Google Scholar]
  33. Cahyono, B.; Jamilah, U.L.; Nugroho, M.A.; Subekti, A. Analysis of Total Suspended Solids (TSS) at Bedadung River, Jember District of Indonesia Using Remote Sensing Sentinel 2A Data. Singap. J. Sci. Res. 2019, 9, 117–123. [Google Scholar]
  34. Saberioon, M.; Brom, J.; Nedbal, V.; Soucek, P.; Cízar, P. Chlorophyll-a and total suspended solids retrieval and mapping using Sentinel-2A and machine learning for inland waters. Ecol. Indic. 2020, 113, 106236. [Google Scholar] [CrossRef]
  35. Vakili, T.; Amanollahi, J. Determination of optically inactive water quality variables using Landsat 8 data: A case study in Geshlagh reservoir affected by agricultural land use. J. Clean. Prod. 2019, 247, 119134. [Google Scholar] [CrossRef]
  36. Zhao, J.; Zhang, F.; Chen, S.; Wang, C.; Chen, J.; Zhou, H.; Xue, Y. Remote Sensing Evaluation of Total Suspended Solids Dynamic with Markov Model: A Case Study of Inland Reservoir across Administrative Boundary in South China. Sensors 2020, 20, 6911. [Google Scholar] [CrossRef]
  37. Pizani, F.C.; Ferreira, A.F.; Amorim, C.C. Estimation of water quality in a reservoir from Sentinel-2 MSI and Landsat 8-OLI Sensor. SPRS Ann. Photogramm. Remote Sens. Spat. Inf. Sci. 2020, 3, 401–408. [Google Scholar] [CrossRef]
  38. Ekercin, S. Water Quality Retrievals from High-Resolution Ikonos Multispectral Imagery: A Case Study in Istanbul, Turkey. Water Air Soil Pollut. 2007, 183, 239–251. [Google Scholar] [CrossRef]
  39. Carrillo, I.D.; Medina, R.J. Multitemporal analysis of the flow of sediments using modis MYD09 and MOD09 images. Cienc. Ing. Neogranadina-Univ. Mil. Nueva Guin. 2019, 29, 69–86. [Google Scholar] [CrossRef]
  40. Yeboah, Y.; Quaye-Ballard, J.; Amatey, A.; Appiah, A. Spatial prediction mapping of water quality of Owabi reservoir from satellite imageries and machine learning models. Egypt. J. Remote Sens. Space Sci. 2021, 24, 825–833. [Google Scholar]
  41. Nguyen, T.H.; Phan, D.; Nguyen, H.T.; Tran, S.; Tran, T.; Tran, B.; Doan, T. Total Suspended Solid Distribution in au River Using Sentinel 2A Satellite Imagery. ISPRS Ann. Photogramm. Remote Sens. Spat. Inf. Sci. 2020, 4, 91–97. [Google Scholar] [CrossRef]
  42. Markogianni, V.; Kalivas, D.; Petropoulos, G.; Dimitriou, E. Analysis on the Feasibility of Landsat 8 Imagery for Water Quality Parameters Assesment in an Oligotrophic Mediterranean Lake. Int. J. Geol. Environ. Eng. 2017, 11, 906–914. [Google Scholar]
  43. Wang, D.; Ma, R.; Xue, K.; Loiselle, S.A. The Assessment of Landsat-8 OLI Atmospheric Correction Algorithms for Inland Waters. Remote Sens. 2019, 11, 169. [Google Scholar] [CrossRef]
  44. Kavurmacı, M.; Karakuş, C.B. Evaluación de la calidad del agua de riego mediante análisis envolvente de datos e índices de calidad del agua basados en procesos de jerarquía analítica: El caso de la ciudad de Aksaray, Turquía. Contam. Agua Aire Suelo 2020, 55, 1–123. [Google Scholar]
  45. Ruiz, D.C. Method of Estimating Total Suspended Solids as an Indicator of Water Quality Using Satellite Images. In Reposiorio Institucional-Biblotteca Digital; National University of Colombia: Bogotá, Colombia, 2017; pp. 1–47. [Google Scholar]
  46. Fernández, A.; Moreira, J.M. Methodology for the Multitemporal Monitoring of the Quality of Coastal Waters in Andalusia through Landsat-TM Image Processing; Remote Sensing Uses and Applications, University of Seville; Deposito de Investigation Universidad de Sevilla: Seville, Spain, 2014; Volume 1, pp. 1–65. [Google Scholar]
  47. Lu, H.; Liu, Q.; Liu, X.Y.; Zhang, Y. Un estudio sobre la construcción semántica y la aplicación de imágenes y datos de teledetección por satélite. Rev. De Informática Organ. Usuario Final. (JOEUC) 2021, 33, 1–20. [Google Scholar]
  48. Hernandez, J. Methodology for the Evaluation of Volumetric and Energy Impacts Inflows by Transfer: Case Study Upper Course of the Lerma River. Master’s Thesis, Inter-American Water Resources Center/UAEMex, Toluca, Mexico, 2018. (In Spanish). [Google Scholar]
  49. Ciancia, E.; Campanelli, A.; Lacava, T.; Palombo, A.; Pascucci, S.; Pergola, N.; Tramutoli, V. Modeling and Multi-Temporal Characterization of Total Suspended Matter by the Combined Use of Sentinel 2-MSI and Landsat 8-OLI Data: The Pertusillo Lake Case Study (Italy). Remote Sens. 2020, 12, 2147. [Google Scholar] [CrossRef]
  50. Doña, C. Monitoring water quality and hydrological patterns of wetlands using recent techniques in remote sensing. In Departament de Física de la Terra i Termodinàmica; Universitat Valencia: Valencia, Spain, 2016; pp. 1–93. [Google Scholar]
  51. DOF. Water Analysis—Measurement of Total Nitrogen Kjeldahl in Natural Water, Wastewater and Treated Wastewater—Test Method; Ministry of Economy: Mexico City, Mexico, 2010. (In Spanish)
  52. DOF. Water Analysis—Measurement of Dissolved Solids and Salts in Natural Water, Wastewater, and Treated Wastewater—Test Method; Ministry of Economy: Mexico City, Mexico, 2015. (In Spanish)
  53. DOF. Water Analysis—Measurement of Total Phosphorus in Natural Water, Wastewater, and Treated Wastewater—Test Method; Ministry of Economy: Mexico City, Mexico, 2001. (In Spanish)
  54. DOF. Water Analysis—Measurement of Chemical Oxigen Demand in Natural Water, Wastewater, and Treated Wastewater—Test Method; Ministry of Economy: Mexico City, Mexico, 2012. (In Spanish)
  55. NOM-001-SEMARNART-2021; Official Mexican Standard. SEGOB: Mexico City, Mexico, 2023. (In Spanish)
  56. Kim, Y.; Im, J.; Ha, H.K.; Choi, J.-K.; Ha, S. Machine learning approaches to coastal water quality monitoring using GOCI Satellite data. GIS Sci. Remote Sens. 2014, 51, 158–174. [Google Scholar] [CrossRef]
  57. Li, C.; Rousta, I.; Olafsoon, H.; Zhang, H. Lake Water Quality and Dinamics Assesssment during 1990–2020 (A case Study: Chao Lake: China). Atmosphere 2023, 14, 382. [Google Scholar] [CrossRef]
  58. Li, L.; Gu, M.; Gong, C.; Hu, Y.; Wang, X.; Yang, Z.; He, Z. An advanced remote sensing retrieval method for urban non-optically active water quality parameters: An example from Shanghai. Sci. Total Environ. 2023, 880, 163389. [Google Scholar] [CrossRef]
  59. Mun, J. Risk Simulator User Manual in Spanish; R-Real Options Valuation: Dublin, Ireland, 2012. [Google Scholar]
  60. Swain, R.; Sahoo, B. Improving river water quality monitoring using satellite data product and a genetic algorithm processing aproach. Sustain. Water Qual. Ecol. 2017, 10, 122–149. [Google Scholar]
  61. IBM. IBM SPSS Statistics 28 Brief Guide; IBM Corporation: Endicott, NY, USA, 2021; Volume 1, pp. 1–90. [Google Scholar]
  62. Zou, D.; Lloyd, J.V.; Baumbusch, J.L. Using SPSS to analyze Complex Survey Data: A Primer. J. Mod. Appl. Stat. Methods 2019, 18, 16. [Google Scholar] [CrossRef]
  63. Aiman, M.; Mohosen, M.; Hossam, S. Statistical estimation of Rosetta Branch Water Quality using multi-spectral data. Water Sci. 2014, 28, 18–30. [Google Scholar]
  64. CONAGUA. (1 July 2019). National Water Commission. Available online: https://app.conagua.gob.mx/bandas/ (accessed on 14 April 2021).
  65. Tu, M.C.; Smith, P.; Filippi, A.M. Hybrid forward-selection method-based water-quality estimation via combining Landsat TM, ETM+, and OLI/TIRS images and ancillary environmental data. PLoS ONE 2018, 13, e0201255. [Google Scholar] [CrossRef] [PubMed]
  66. Sundarabalan, V.; Pahlevan, N.; Smith, B.; Binding, C.; Schalles, J.; Loisel, H.; Boss, E. Robust algorithm for estimating total suspended solids (TSS) in inland and nearshore coastal waters. Remote Sens. Environ. 2020, 246, 111768. [Google Scholar]
Figure 1. Delimitation of the study area and georeferencing of sampling for water quality parameters.
Water 15 03828 g001
Figure 2. Comparison of WQPs measured in the laboratory vs. WQPs estimated through remote sensing.
Water 15 03828 g002
Figure 3. Pre-rainy season multiple regression model maps: (a) TN, (b) COD, (c) TP, and (d) TSS (mg/L).
Water 15 03828 g003
Figure 4. Post-rainy season multiple regression model maps: (a) TN, (b) COD, (c) TP, and (d) TSS (mg/L). C1: permissible limit concentration for any discharge; C2: permissible limit for discharge into reservoirs, lakes, and lagoons; C3: out of permissible limit.
Water 15 03828 g004
Figure 5. Box plot for time series (June 2019 to June 2021) for concentrations of (a) TN, (b) COD, (c) TP, and (d) TSS.
Water 15 03828 g005
Figure 6. Spatio-temporal distribution of estimated WQPs for author model [45] and current model for TSS.
Water 15 03828 g006
Table 2. Sampling in the J. A. Alzate Dam, Mexico.
IDX (W Longitude)Y (N Latitude)SeasonChemistry ParametersPhysics p.
TN (mg/L)COD (mg/L)TP (mg/L)TSS (mg/L)
PL = 40–60PL = 60–75 PL = 20–30PL = 12–75
1−99.66056419.451172Before the rain
season
18th May
3317399.7692.5
2−99.65848619.4530871112746.27151.5
3−99.65813119.455031166644.34198
4−99.65039319.44522999334.2548
5−99.64623719.4369192810770.9133
6−99.64250419.434917209867.3455
7−99.64046219.4314721010974.9242
8−99.66235519.457317After the rain season
26th October
7.267.533.1635
9−99.65786919.4536696.36434.4634
10−99.64823419.4456053.98023.6415.2
11−99.64404319.4365554.42130.7611
12−99.64193219.4357853.53032.7916
13−99.63998519.4305142.82630.3917
14−99.64702119.4370273.339.533.7119
Symbology: sample fields (ID), Total phosphorus (TP), total nitrogen (TN), chemical oxygen demand (COD), total suspended solids (TSS), permissible limits (PL).
Table 3. Validation assumptions in the input data.
Statistical TestWQPTotal Nitrogen (TN)Chemistry Oxygen Demand (COD)
Model TypeExponentialLinearPolynomialExponentialLinearPolynomial
Independent VariablesB1, B3B3, B6, (B3 + B7)(B1/B3)LN(B5), LN(B2/B3), LN(B7)(B1/B6), (B7/B4), (B2/B1), (B2/B3)(B3/B1), (B3/B5)
VcritVVcritVVcritVVcritVVcritVVcritV
HomoscedasticityW-pvalue > Vcrit0.10.250.10.330.10.230.10.180.10.250.10.38
Square chi testχ2 < Vcrit7.814.547.814.6511.079.307.812.259.482.2611.070.82
Atypical valuesVcalc ≤ Vcrit212121212021
CollinearityVIF < Vcrit40.2140.1644.040.2142.641.17
r ≤ Vcrit0.750.740.750.750.750.860.750.740.750.780.750.78
MulticollinearityF > Vcrit3.7022.903.7013.203.686.253.7019.083.636.753.6811.82
NormalityD < Vcrit0.220.120.220.170.170.220.220.190.220.080.220.16
SignificancePvalue ≤ Vcrit0.050.190.050.050.050.060.050.000.050.090.050.79
Statistical TestWQPTotal Phosphorus (TP)Total Suspended Solids (TSS)
Model TypeExponentialLinearPolynomialExponentialLinearPolynomial
Independent VariablesLN(B5), LN(B6)(B5/B4), (B5/B6)(B5/B2), (B5/B2)LN(B4), LN(B3+B5), LN(B5+B7), LN(B2/B3), LN(B2/B4)(B7/B4), (B7/B5)(B3/B5), B3
VcritVVcritVVcritVVcritVVcritVVcritV
HomoscedasticityW-pvalue > Vcrit0.10.180.10.640.10.100.10.110.10.110.10.12
Square chi testχ2 < Vcrit5.994.875.992.6211.075.6111.075.933.325.9911.071.90
Atypical valuesVcalc ≤ Vcrit212021212021
CollinearityFIV < Vcrit42.6346.3142.8844.141.2841.38
r ≤ Vcrit0.750.780.750.90.750.800.750.870.750.460.750.52
MulticollinearityF > Vcrit3.9818.653.9824.33.6825.633.6830.603.9811.283.68136.12
NormalityD < Vcrit0.220.160.230.220.220.120.220.150.220.200.220.15
SignificancePvalue ≤ Vcrit0.050.000.050.0030.050.000.050.040.050.070.050.09
Symbology: Water quality parameter (WQP), significance for White test (W-pvalue), variance inflation factor (VIF), calculated value (V), critical value (Vcrit), and significance (Pvalue).
Table 4. Multiple regression models to different WQPs.
WQPTypeRegression Model i RMSE R 2
TN (mg/L)Exp. e ( 4.49 2.47 L N B 1 + 1.10 L N B 5 0.69 L N B 7 ) 53.820.79
Linear 30.71 + 1120.39 B 3 + 823.79 B 6 1269.80 ( B 3 + B 7 ) 74.240.73
Pol. 8.4 42.3 B 7 B 1 + 21.6 B 5 B 4 + 109.3 B 7 B 1 2 + 34.5 B 5 B 4 2 123 B 7 B 1 B 5 B 4 1431.130.68
COD (mg/L)Exp. e ( 4.2069 + 0.9788234 L N B 5 2.4215 L N ( B 2 / B 3 ) 0.5209 L N B 7 ) 616.10.80
Linear 66.73 + 5.66 B 1 B 6 + 110.16 B 7 B 4 + 240.1259 B 2 B 1 222.73 B 2 B 3 521.40.62
Pol. 129.04 + 612.5 B 3 B 1 396.95 B 3 B 5 266.95 B 3 B 1 2 + 42.51 B 3 B 5 2 + 173.42 B 3 B 1   B 3 B 5 915.350.84
TP (mg/L)Exp. e ( 5.1265551 + 1.154335 L N B 5 0.52206356 L N B 6 ) 810.250.74
Linear L o g T P = 1.3544 + 0.1240 B 5 B 4 + 0.04610 B 5 B 6 59.630.79
Pol. 14.79 + 62.96 B 5 B 2 1644.8 B 6 + 41.86 B 5 B 2 2 + 71481.28 B 6 2 3642.34 B 5 B 2 B 6 55.490.92
TSS (mg/L)Exp. e ( 0.2663 4.05 L N B 4 + 7.49 L N ( B 3 + B 5 ) 4.03 L N ( B 5 + B 7 ) + 3.99 L N ( B 2 / B 3 ) + 1.4 L N ( B 2 / B 4 ) ) 514.370.90
Linear L o g T S S = 2.0848 + 0.339 B 7 B 4 1.316 B 7 B 5 543.90.61
Pol. 72.79 + 1695.66 B 3 + 36.58 B 3 B 5 + 51578.99 B 3 2 + 143.87 B 3 B 5 2 6246.61 ( ( B 3 ) ( B 3 B 5 ) ) 67.190.98
Symbology: total suspended solids (TSS), chemistry oxygen demand (COD), total phosphorus (TP), total nitrogen (TN), wavelength band (Bi), adjusted determination coefficient (R2), number of iterations (i), root mean square error (RMSE), best model (---), and other models (---).
Table 5. Differences in means between regression models.
WQPMean in Samples (mg/L)Standard Deviation (mg/L)Confidence
Interval for
Difference in Means ( μ 1 μ 2 )   (mg/L)
Author
A.M.C.M.A.M.C.M.
TSS11.0615.7422.798.81−9.510.57[45]
TN23.7126.991.360.94−3.62−2.94[3]
TP33.2136.148.155.32−4.92−0.92[3]
Symbols: Author model (A.M.), current linear model (C.M.), total nitrogen (NT), total phosphorus (TP), total suspended solids (TSS). The images used for the estimation are the same as those used by the author.
Disclaimer/Publisher’s Note: The statements, opinions and data contained in all publications are solely those of the individual author(s) and contributor(s) and not of MDPI and/or the editor(s). MDPI and/or the editor(s) disclaim responsibility for any injury to people or property resulting from any ideas, methods, instructions or products referred to in the content.