Article

Ammonia Nitrogen Removal by Gas–Liquid Discharge Plasma: Investigating the Voltage Effect and Plasma Action Mechanisms

1
School of Sciences, Shihezi University, Shihezi 832003, China
2
Key Laboratory of Materials Modification by Laser, Ion, and Electron Beams (Dalian University of Technology), Ministry of Education, Dalian 116024, China
3
Xinjiang Production & Construction Corps Key Laboratory of Advanced Energy Storage Materials and Technology, Shihezi University, Shihezi 832000, China
*
Authors to whom correspondence should be addressed.
Water 2023, 15(21), 3827; https://doi.org/10.3390/w15213827
Submission received: 6 October 2023 / Revised: 26 October 2023 / Accepted: 28 October 2023 / Published: 2 November 2023

Abstract

:
Atmospheric pressure gas–liquid discharge plasma has garnered considerable attention for its efficacy in wastewater contaminant removal. This study utilized atmospheric oxygen gas–liquid discharge plasma for the treatment of ammonia nitrogen wastewater. The effect of applied voltage on the treatment of ammonia nitrogen wastewater by gas–liquid discharge plasma was discussed, and the potential reaction mechanism was elucidated. As the applied voltage increased from 9 kV to 17 kV, the ammonia nitrogen removal efficiency rose from 49.45% to 99.04%, with an N2 selectivity of 87.72%. The mechanism of ammonia nitrogen degradation by gas–liquid discharge plasma under different applied voltages was deduced through electrical characteristic analysis, emission spectrum diagnosis, and further measurement of the concentration of active species in the gas–liquid two-phase system. The degradation of ammonia nitrogen by gas–liquid discharge plasma primarily relies on the generation of active species in the liquid phase after plasma–gas interactions, rather than direct plasma effects. Increasing the applied voltage leads to changes in discharge morphology, higher energy input, elevated electron excitation temperatures, enhanced collisions, a decrease in plasma electron density, and an increase in rotational temperatures. The change in the plasma state enhances the gas–liquid transfer process and increases the concentration of H2O2, O3, and, O H in the liquid phase. Ultimately, the efficient removal of ammonia nitrogen from wastewater is achieved.

1. Introduction

The innovation in nitrogen fixation processes has led to the rapid expansion of the ammonia nitrogen industry, while concurrently introducing a range of challenges. These challenges include imbalances in the Earth’s nitrogen cycle and the accumulation of ammonia nitrogen in the environment [1,2,3,4]. Ammonia nitrogen consists of non-ionic ammonia (NH3-N) and ionic ammonia ( NH 4 + -N) [5]. Its degradation presents challenges due to the inherent difficulty in cleaving the N-H bond [6]; NH3 is the most stable form of nitrogen-containing substances but it is difficult to break the N-H bond. The excessive accumulation of ammonia nitrogen in the environment can lead to water eutrophication, posing a threat to aquatic ecosystems and human health [7]. Therefore, various physicochemical and biological methods have been developed to remove ammonia nitrogen from wastewater [8,9,10].
Current traditional ammonia nitrogen treatment technologies, such as chemical precipitation, biological treatment, adsorption, and photocatalysis, often have limitations in terms of efficiency, selectivity, and environmental friendliness. Chemical precipitation consumes a significant quantity of chemicals and generates secondary pollution, whereas biological treatment is influenced by factors such as pH, temperature, and nutrient levels [8,10]. Adsorption methods using activated carbon or zeolites face challenges related to low removal rates and difficulties in regeneration [11]. Photocatalytic technology has a low cost, environmentally friendly process, and no secondary pollution; however, its selectivity is poor, and it has limitations in the treatment of wastewater with a high concentration or poor light transmittance [12]. Therefore, there is an urgent need to explore alternative technologies for the treatment of wastewater containing ammonia nitrogen.
In recent years, plasma treatment technology has gained significant attention in the field of wastewater treatment due to its numerous advantages. These advantages include high pollutant removal efficiency, robust environmental adaptability, and simplicity of operation [13,14]. Numerous studies on the plasma treatment of wastewater have shown that various discharge forms at the gas–liquid interface generate abundant reactive oxygen species (ROS), reactive nitrogen species (RNS), and reactive nitrogen oxygen species (RONS) in the gas–liquid two-phase system [15,16,17,18]. Plasma initiates a series of physicochemical processes in the gas–liquid two-phase system, leading to the formation of primary and secondary reactive species in the gas–liquid environment. This facilitates the degradation of pollutants [15,16]. Recently, studies on the plasma treatment of ammonia nitrogen wastewater have reported that plasma can efficiently and environmentally remove ammonia nitrogen [19,20,21,22]. Researchers have made significant improvements in the efficiency of ammonia nitrogen removal by combining gas–liquid discharge plasma with zeolite catalysts [19,20]. Through further optimization of experimental parameters such as initial pH, concentration, and gas flow rate, plasma treatment can achieve the environmentally friendly and efficient removal of ammonia nitrogen. Furthermore, the applied voltage plays an important role in regulating parameters [21,22]. However, there is a significant lack of research on the effect of applied voltage on the ammonia nitrogen removal process and the mechanism of gas–liquid discharge plasma in the removal of ammonia nitrogen.
Therefore, the main goal of this work is to study the effect of applied voltage on the ammonia nitrogen removal process and the mechanism of gas–liquid discharge plasma in the ammonia nitrogen removal process. Thus, a gas–liquid discharge device was designed to treat ammonia nitrogen wastewater. The influence of the main operating parameters was then optimized for the reaction system, including the initial ammonia nitrogen concentration, initial pH, and gas flow rate. The effect of applied voltage on the ammonia nitrogen removal process was explored. Combining the electrical characteristics and optical emission spectra (OES) diagnosis, the state of the electron excitation temperature, rotation temperature, and electron density of the plasma during the ammonia nitrogen removal process were further studied. Finally, the mechanism of the ammonia nitrogen removal process by liquid discharge plasma was discussed and summarized.

2. Materials and Methods

2.1. Experimental Setup

A schematic diagram of the ammonia nitrogen wastewater treatment platform using plasma is shown in Figure 1. The experimental setup primarily consists of a plasma reactor, a high-voltage alternating current (AC) power supply, and a detection system. The plasma reactor comprises a hollow stainless steel needle electrode with a diameter of 8 mm and a tip diameter of 0.15 mm, a quartz tube with an outer diameter of 19 mm and a wall thickness of 3 mm, a ground electrode immersed in the solution, and a 100 mL quartz container. The plasma reactor is mainly composed of high-voltage electrodes, quartz tubes and ground electrodes. The high-voltage electrode is made of hollow stainless steel with a di-ameter of 8 mm and a tip diameter of 0.15 mm. The outer diameter of the quartz tube is 19 mm and the wall thickness is 3 mm. The ground electrode consists of copper wire. One end of the copper wire is immersed in the bottom of the 100 mL quartz container, and the other end is grounded. The needle electrode is fixed inside the quartz tube, forming a sealed gas chamber with an 8 mm distance between the needle tip and the horizontal plane of the quartz tube’s bottom. The quartz tube is submerged 2–3 cm below the liquid surface, and the discharge occurs between the needle tip and the liquid surface. Gas is introduced from the top of the hollow needle electrode into the quartz container and is discharged through an outlet in a gas-washing bottle containing deionized water. The high-voltage AC power supply (YY30-6000, Dalian Yijia Ocean Technology Co., Ltd., Dalian, China) has a voltage adjustment range of 0–30 kV. The high-voltage output of the power supply is connected to the needle electrode after being connected in series with a 100-pF capacitor. The electrical detection system consists of an oscilloscope (MDO3034, Tektronix, Shanghai, China, 350 MHz), a voltage probe (P6015A, Tektronix, 1000×, 3.0 pF, 100 MΩ), and a current probe (TCP312, Tektronix, 100 MHz). Plasma emission spectroscopy is conducted using fiber optics and a monochromator (SR-750i, Andor, Shanghai, China). The concentrations of pollutants and active species are analyzed using a UV-visible spectrophotometer (Cary 300, Agilent, Shanghai, China) and a fluorescence spectrophotometer (FL6500, PerkinElmer, Shanghai, China).

2.2. Experimental Procedure

In this study, ammonia nitrogen wastewater was simulated by dissolving analytical-grade ammonium chloride in deionized water. In each experiment, 25 mL of ammonia nitrogen solution with a certain initial concentration was prepared and introduced into the plasma reaction vessel. The initial pH was determined using a pH meter (PB-10, Sartorius, Göttingen, Germany). The initial pH was adjusted using hydrochloric acid or sodium hydroxide standard solutions, according to the experimental design. Oxygen gas (99.999%) was introduced into the reactor at a controlled mass flow rate using a mass flow controller (S48-300, Horiba Stec, Singapore). The voltage of the power supply was adjusted to the set value, and the ammonia nitrogen solution was subjected to plasma discharge treatment. After a specific treatment time, the discharge was stopped, and the treated solution was poured into a beaker and sampled for analysis. OES measurements primarily utilized a fiber optic probe to collect the radiation emitted during plasma discharge treatment. The emitted light was then dispersed by a 2400-line grating in a monochromator (SR-750i, Andor) and detected by a photomultiplier tube.

2.3. Analysis Methods

The concentration of ammonia nitrogen in the solution was determined using Nessler’s reagent method. This method is based on the reaction between free ammonia or ammonium ions and Nessler’s reagent to produce a brownish-yellow complex where the absorbance peak intensity at 420 nm is proportional to the ammonia nitrogen content [23]. In this study, a UV-visible spectrophotometer (Cary 300, Agilent) was utilized to establish a linear correlation between the absorbance of the characteristic peak and the concentration of standard solutions with varying concentrations. This allowed for the quantification of the ammonia nitrogen concentration in the treated solution. Similarly, the concentration of H2O2 in the solution was measured by UV-VIS spectroscopy at 407 nm using the sulfuric acid–titanium dioxide method [24]. The concentration of nitrite ions in the solution was determined by measuring the intensity of the azo dye formed when the NO2 reacts with N-(1-naphthyl)-ethylenediamine dihydrochloride in a phosphate solution. The measurement was taken at 540 nm using UV-VIS spectroscopy [25]. The concentration of NO3 in the solution was determined using the 2,6-dibromophenol spectrophotometric method and measured at 324 nm using UV-VIS spectroscopy [26]. The ozone concentration in the solution was measured using indigo disulfuric acid spectrophotometry [27]. The concentration of radicals was measured using a fluorescence spectrophotometer (FL6500, PerkinElmer) and the chemical probe method, which is based on the reaction of O H radicals with terephthalic acid (TA) [28]. This principle involves the rapid reaction of TA with O H to form 2-hydroxyterephthalic acid, which exhibits characteristic fluorescence spectra when exposed to UV light at 310 nm while terephthalic acid does not fluoresce.
The instantaneous power P t (W), coupled input energy Q T (J), and average power P T (W) of the gas–liquid plasma discharge were calculated using Formulas (1)–(3) [17]:
P t = U t × I t
Q T = 0 T U t × I t
P T = 0 T U t × I t d t
where “ U t ” (V) represents the instantaneous applied voltage at “ t ”(s) time, “ I t ” (A) represents the instantaneous discharge current at t time, and “T” (s) represents the time required for a change cycle of the alternating current.
The ammonia nitrogen removal efficiency η (%) was calculated using Formula (4):
η = C 0 C t C 0   ×   100 %
where “ C 0 ” (mg/L) represents the initial concentration of ammonia nitrogen solution and “ C t ” (mg/L) represents the concentration of the solution treated by plasma for t time.
The degradation kinetics of ammonia nitrogen were analyzed using a quasi-first-order kinetic model Formula (5) [19]:
ln ( C t C 0 ) = k t
where “ k ” (min−1) represents the kinetic constant.
The energy efficiency EE (g/kWh) was calculated using Formula (6) [17], to indicate the amount of pollutant degradation per unit of electrical energy input:
E E = m 0 m t P t × t
where “ t ” (h) represents the plasma treatment time, “ m 0 ” (g) represents the initial mass of the ammonia nitrogen solution, and “ m t ” (g) represents the residual mass of the ammonia nitrogen solution treated by plasma for a duration of t time. “ P t ” represents the average power obtained from Formula (3) with the conversion of units to kW.

3. Results and Discussion

3.1. Experimental Parameter Optimization

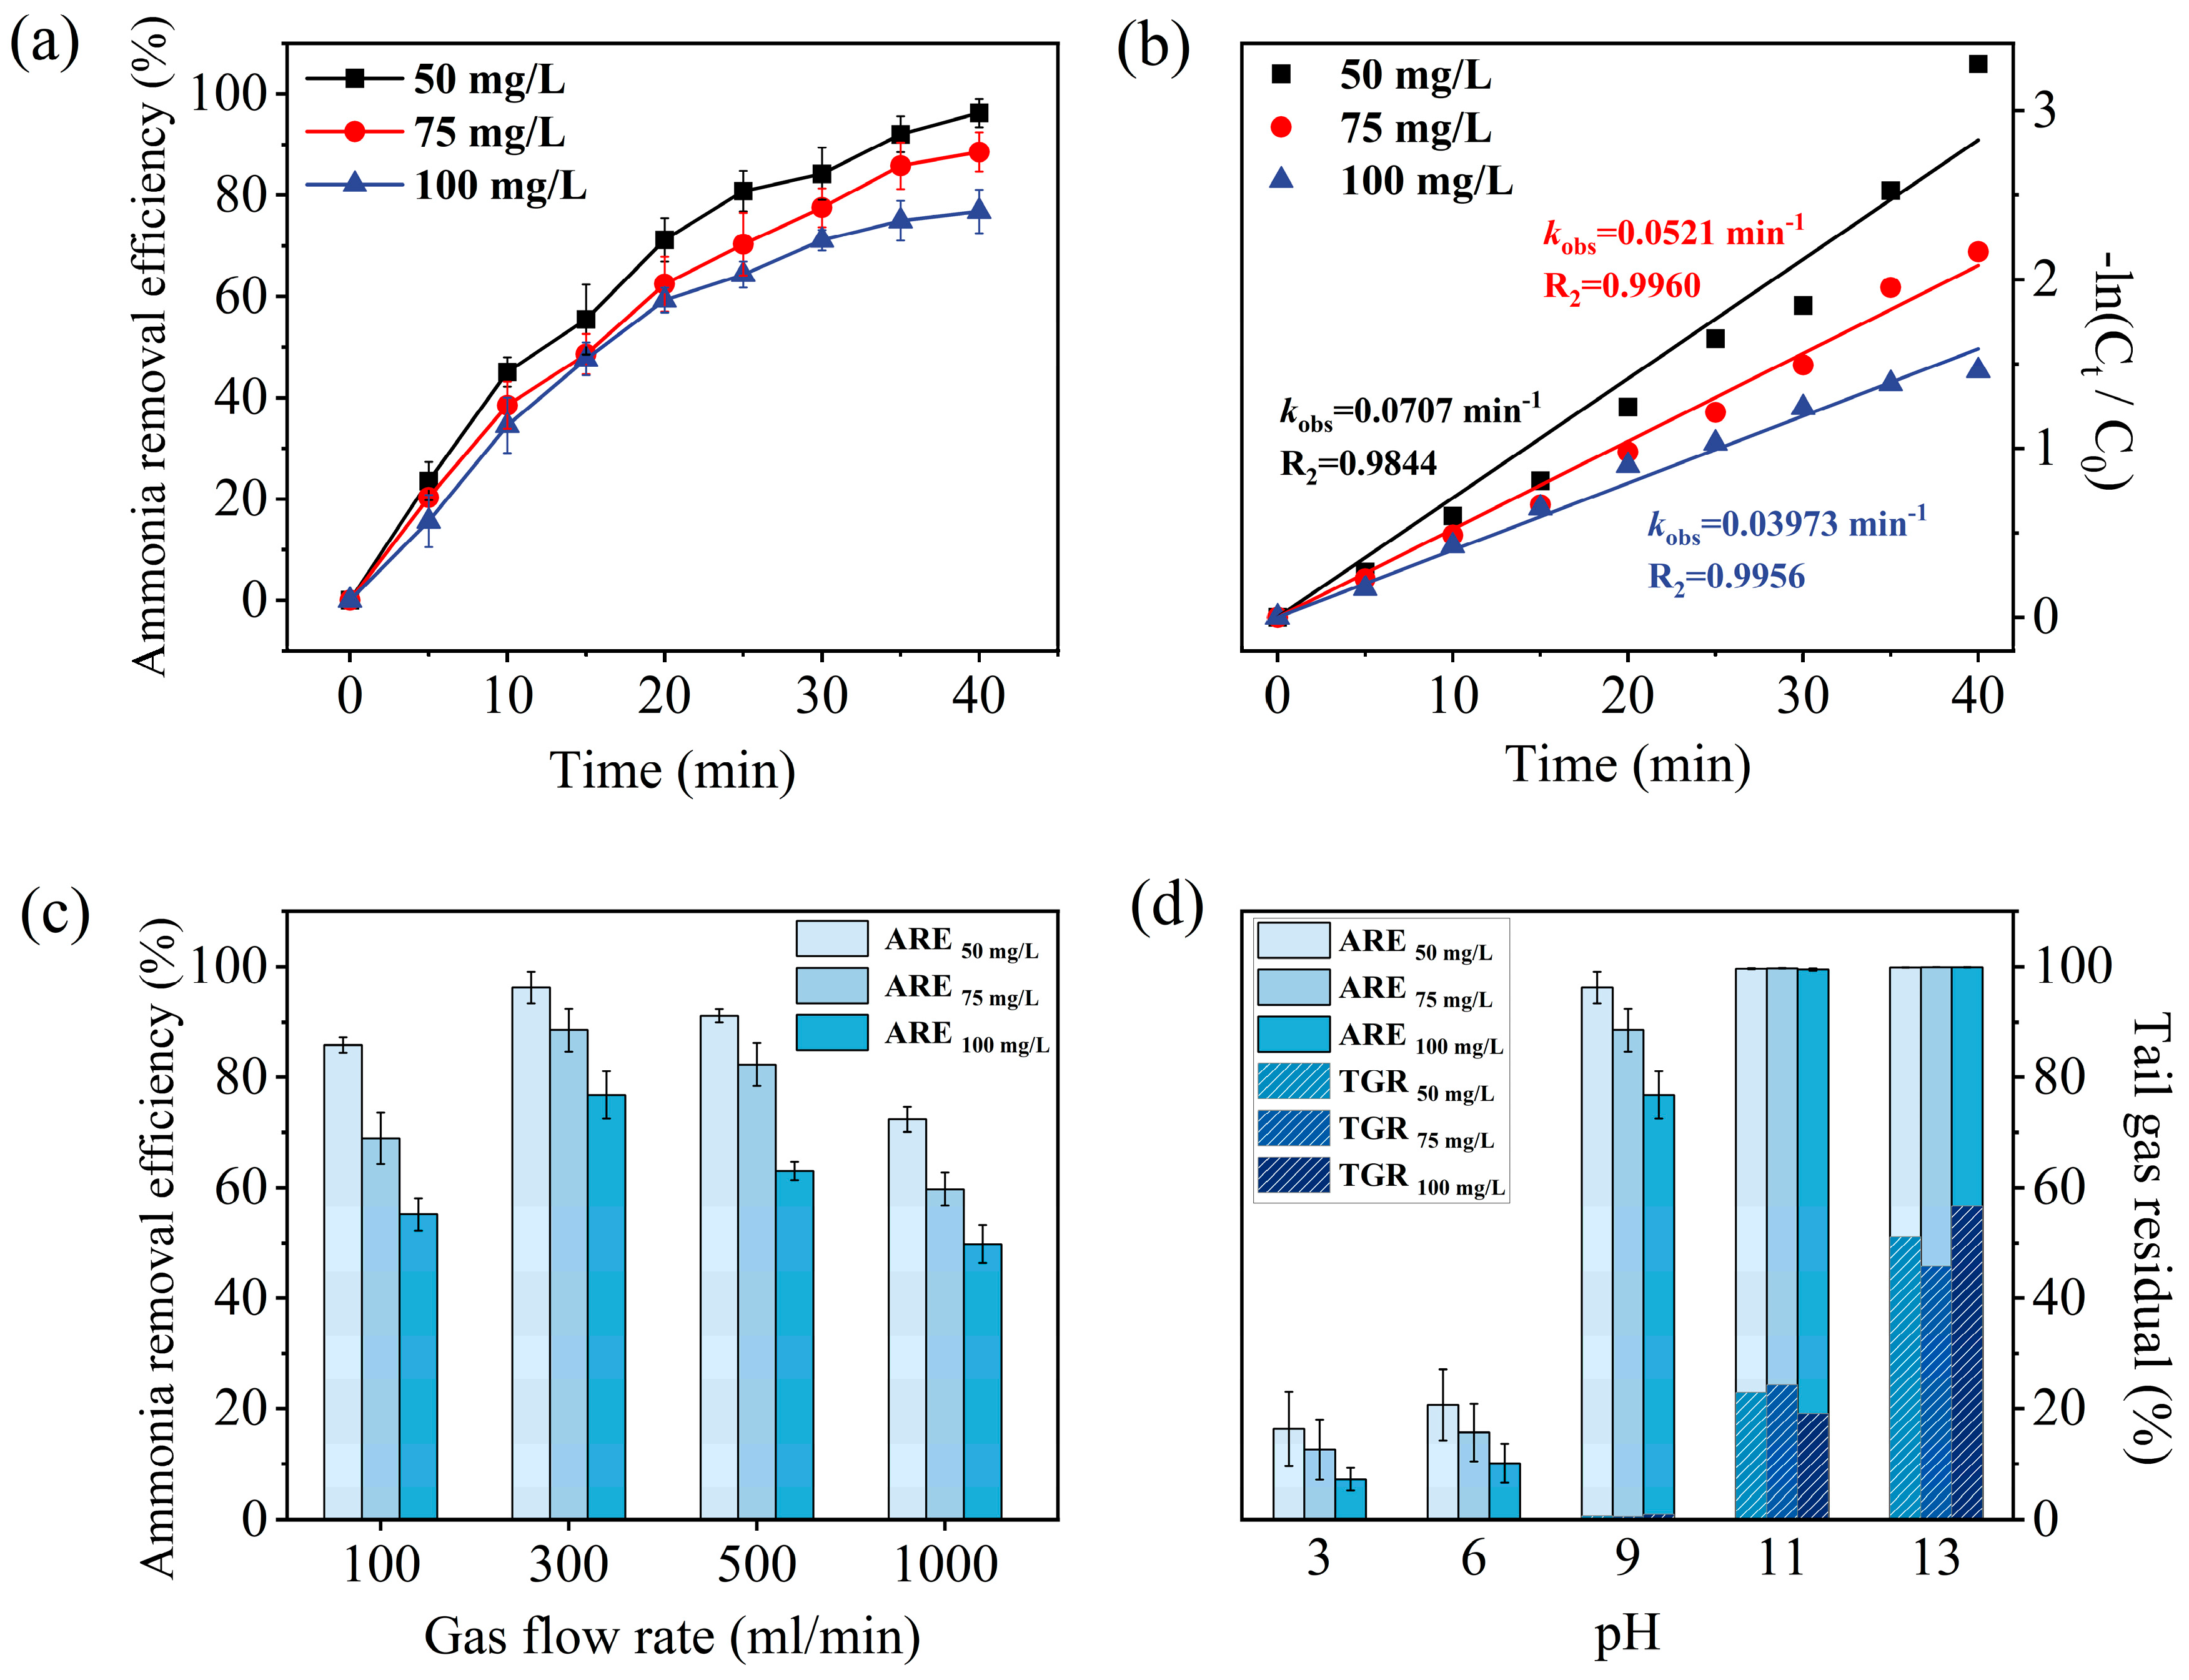
When using gas–liquid discharge to treat ammonia nitrogen, several factors have a significant impact on its removal, including the applied voltage, initial concentration, initial pH, and gas flow rate [21,29]. In order to focus on exploring the effect of applied voltage on the ammonia nitrogen re-moval rate, the optimal experimental parameters of initial concentration, pH and gas flow rate were first explored. Figure 2a illustrates the trend of ammonia nitrogen removal efficiency (ARE) over time at various initial concentrations. For wastewater containing ammonia nitrogen with initial concentrations of 50 mg/L, 75 mg/L, and 100 mg/L, the ammonia nitrogen removal efficiencies were 96.32%, 88.52%, and 76.80%, respectively, after 40 min of plasma treatment. Within the same treatment time, the removal efficiency decreased slightly with the increase in initial concentration. As shown in Figure 2b, the corresponding kinetic constant also decreased from 0.0707 min−1 to 0.03973 min−1. Choosing a lower initial concentration (50 mg/L) achieved better removal within the same treatment time. Figure 2c illustrates the impact of the gas flow rate on the removal of ammonia nitrogen. It can be observed that the ammonia nitrogen degradation rate first increases and then decreases with the gas flow rate. Higher gas flow rates within a certain range are conducive to enhanced collisions and the production of more active species. However, an excessive gas flow rate will lead to unstable discharge, reduce the residence time of bubbles in the liquid, weaken the gas–liquid transfer process, and is not conducive to the generation of active species. The optimal experimental parameter in this study is 300 mL/min. Figure 2d shows the trends of the ammonia nitrogen removal rate and residual ammonia nitrogen in the exhaust gas as the initial pH changes. Higher initial pH values favor the removal of ammonia nitrogen, but excessively high pH levels result in a higher proportion of residual ammonia nitrogen in the exhaust gas. The ammonia nitrogen content in the tail gas was collected and detected through a gas scrubber bottle. The tail gas residual (TGR) represents the percentage of ammonia nitrogen emitted in the tail gas to the ammonia nitrogen in the wastewater before treatment. For initial concentrations of 50 mg/L, 75 mg/L, and 100 mg/L, the TGR was 22.93%, 24.28%, and 19.16% respectively, at an initial pH of 11. When the initial pH increased to 13, the TGR further increased to around 50%. However, achieving an initial pH of 9 resulted in improved removal of ammonia nitrogen and lower residual ammonia nitrogen rates. Based on these experimental results, unless otherwise specified, this study adopts the default experimental parameters for subsequent research. These parameters include an initial ammonia nitrogen concentration of 50 mg/L, an initial pH of 9, and a gas flow rate of 300 mL/min.

3.2. Effect of Applied Voltage on Ammonia Nitrogen Removal

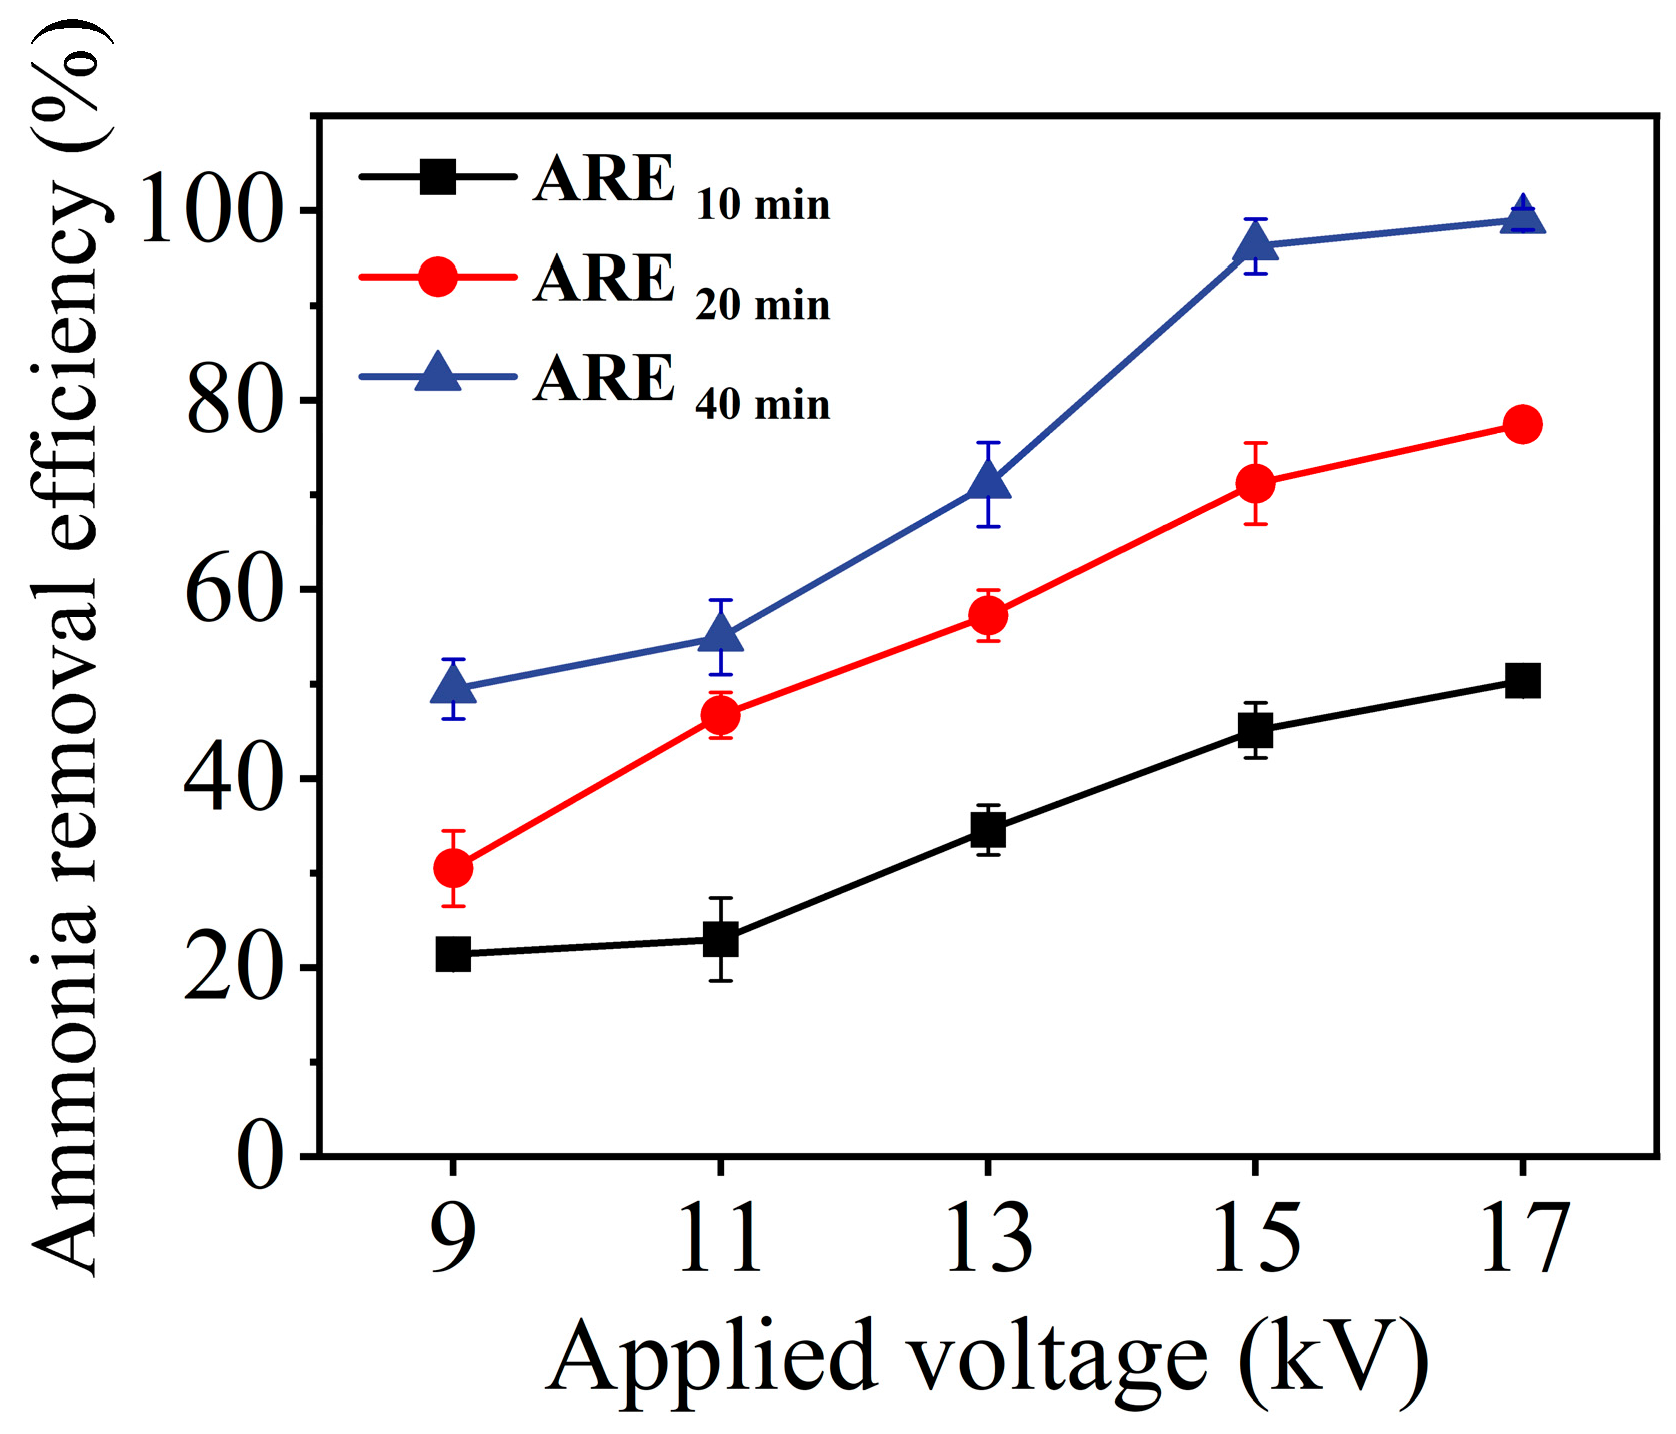
Figure 3 shows the change in the ammonia nitrogen removal rate when treating ammonia nitrogen wastewater for 10 min, 20 min, and 40 min, respectively, under different applied voltages. Higher applied voltages lead to greater degradation efficiency, resulting in significantly better removal within the same timeframe. When the initial concentration is 50 mg/L, increasing the applied voltage from 9 kV to 17 kV results in an increase in ammonia nitrogen removal from 49.45% to 99.04%. Correspondingly, the average ammonia nitrogen removal rate increases from 0.015 mg/min to 0.019 mg/min. Within the same treatment time, increasing the applied voltage from 9 kV to 17 kV results in approximately a twofold improvement in the removal of ammonia nitrogen. This indicates that the applied voltage has a significant effect on the process of degrading ammonia nitrogen in gas–liquid discharge plasma. The detailed mechanisms of this process will be explored in the next section.

3.3. Discharge Characteristics of Gas–Liquid Discharge Plasma

First, the effect of time-voltage on the discharge morphology of gas–liquid discharge plasma is studied. Images of the plasma morphology are captured using a digital camera (EOS 70D, Canon) with an exposure time of 50 ms, as shown in Figure 4. It is observed that the discharge intensity and morphology change significantly with increasing voltage applied. At a peak-to-peak voltage of 9 kV, the discharge corresponds to a glow discharge mode, which is characterized by a relatively narrow and bright filament that emits purple–white light. As the applied voltage increases to 13 kV, the plasma region expands, emitting a brighter light. The plasma discharge transitions into a pseudo-glow mode. With a further increase in voltage, the volume of the plasma decreases, resulting in a brighter white light emission. This causes the discharge to transition into an abnormal glow/arc mode.
Figure 5 displays the voltage-current waveforms corresponding to different applied voltages, as well as the variations in instantaneous power and coupled input energy. Figure 5a indicates that the discharges occur in both the positive half-cycle (0 to 60 μs) and the negative half-cycle (60 to 120 μs). As the applied voltage increases, the amplitude and peak of the discharge current increase significantly. At peak voltages of 9 kV and 11 kV, there is only one primary discharge current peak. However, with a further increase in voltage, secondary discharges gradually appear due to the presence of a capacitor. By connecting a capacitor in series to the high-voltage end of the power supply, charge accumulates due to the external electric field and is promptly discharged when the gap breaks down. The capacitor is then charged by primary discharge, creating a reverse electric field that weakens the original field and partially suppresses an excessive discharge current [30]. The primary discharge, caused by ionization and heating effects, facilitates the breakdown of existing discharge channels and the generation of secondary discharges [31]. Figure 5b illustrates the change in instantaneous power during gas–liquid discharge. It is evident that raising the applied voltage from 9 kV to 17 kV leads to a rise in instantaneous power from 29 W to 127 W. Higher applied voltages amplify the instantaneous power within each repetition cycle. As the applied voltage increases, both the instantaneous power of the primary discharge and the secondary discharge significantly increase. Coupled input energy, as shown in Figure 5c, further demonstrates that increasing the applied voltage from 9 kV to 17 kV results in a 315% increase in the total energy input per unit time. Higher applied voltages increase energy input, promoting excitation, ionization, and dissociation reactions in the gas–liquid discharge plasma which contributes to better ammonia nitrogen removal rates and effectiveness [32].
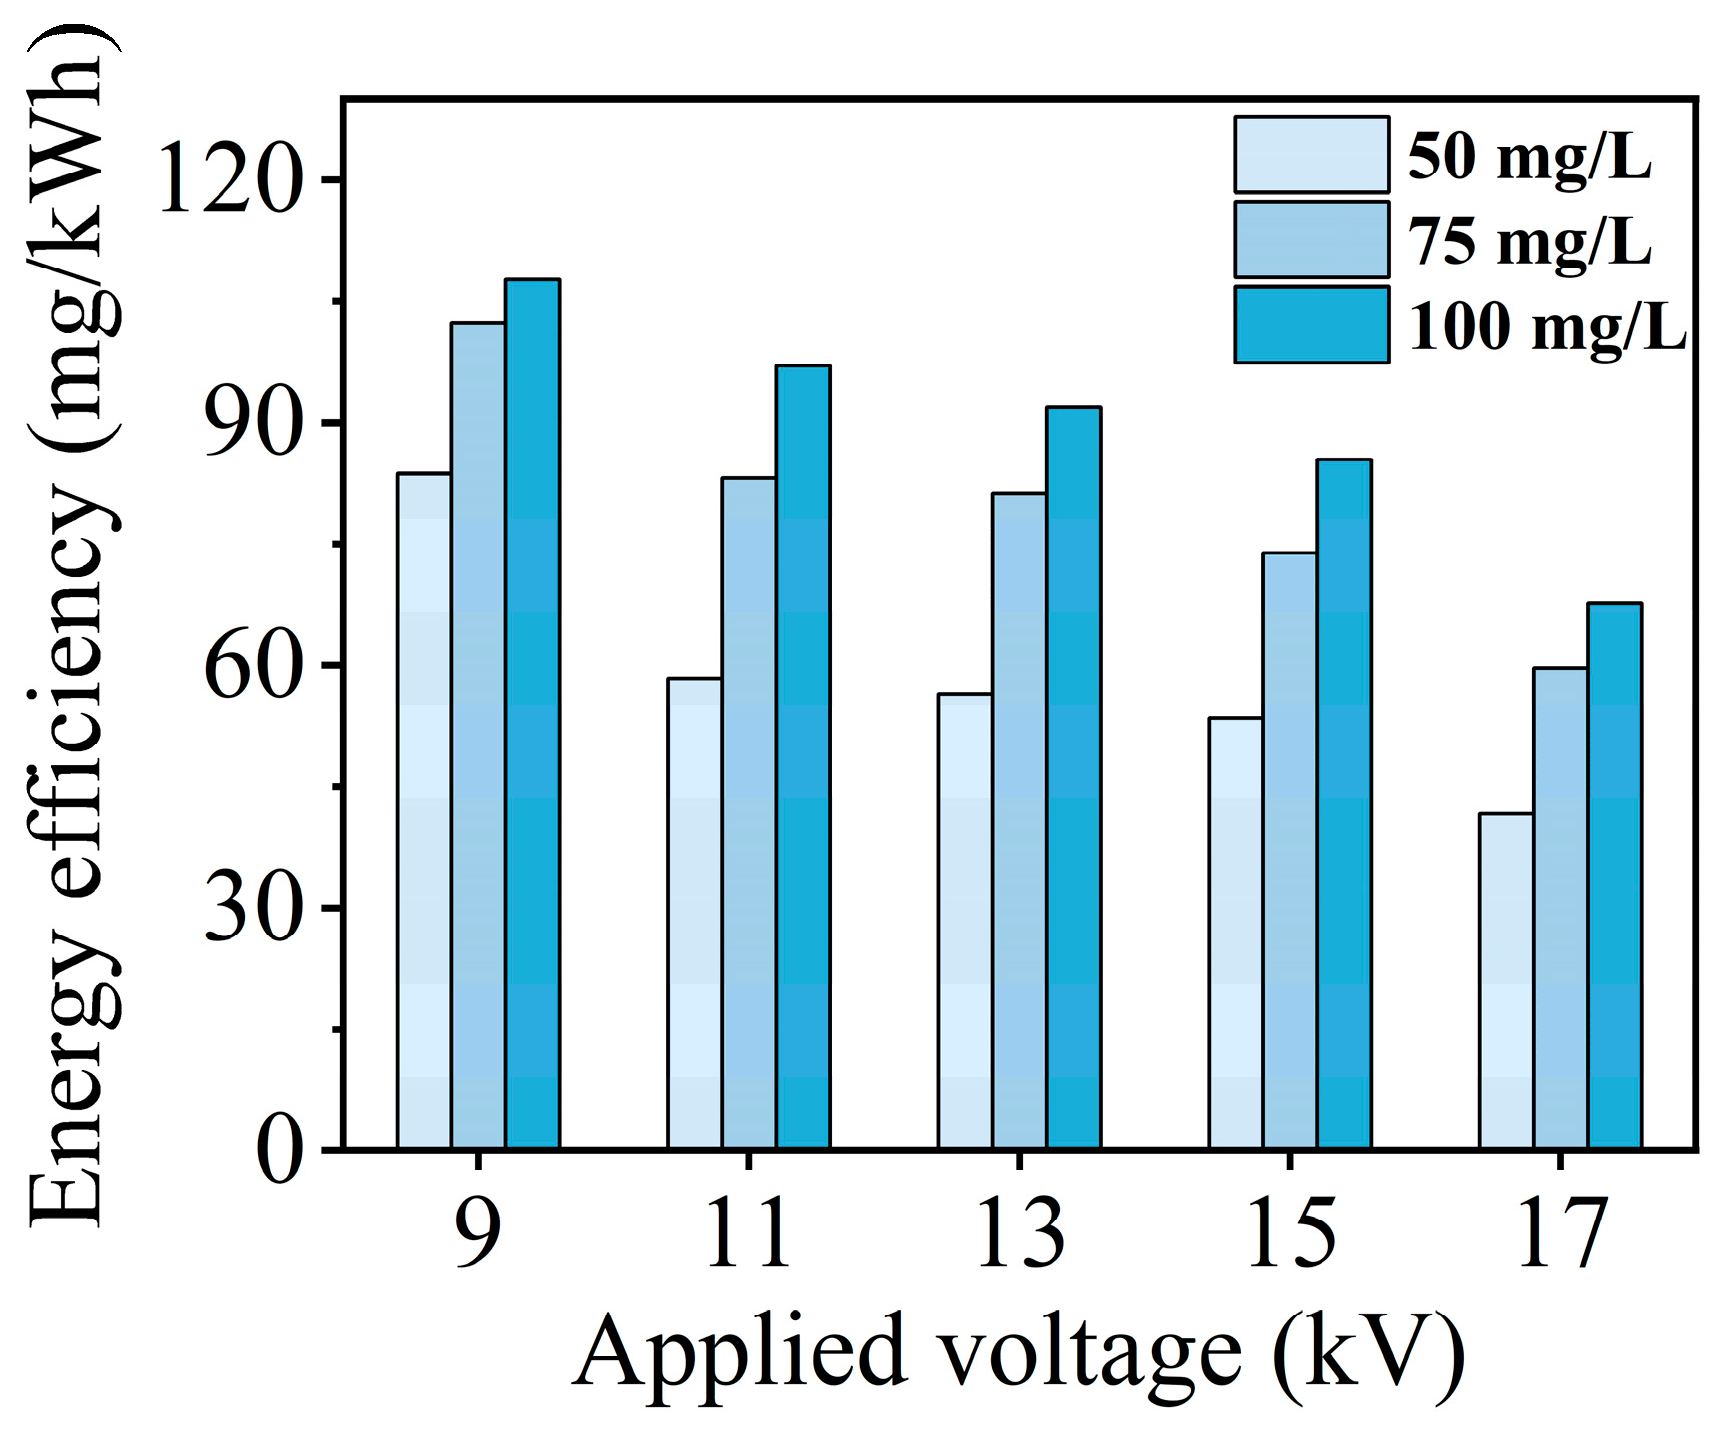
Figure 6 illustrates the effect of applied voltage on energy efficiency. When the initial concentration of ammonia nitrogen wastewater is 50 mg/L, increasing the applied voltage from 9 kV to 17 kV results in a decrease in energy efficiency from 83.68 mg/kWh to 41.71 mg/kWh. This decrease in energy efficiency can be attributed to the fact that the removal of ammonia nitrogen in the gas–liquid discharge plasma mainly relies on the active species produced in the liquid phase due to interactions between the plasma and gas, rather than the direct impact of the plasma. Higher voltage and input energy can enhance the generation of active species. However, it is important to note that most of these species have short lifespans and may be extinguished before reacting with ammonia nitrogen, thus resulting in lower energy efficiency at higher voltages [33,34]. Alternatively, by varying the initial concentration, it has been observed that increasing the initial concentration leads to an upward trend in energy efficiency at the same voltage. This result further supports the earlier hypothesis that increasing the initial concentration improves the utilization efficiency of active species, thereby enhancing energy efficiency. In the next section, the effect of applied voltage on active substances in ammonia nitrogen wastewater treatment by gas–liquid discharge plasma will be further explored.

3.4. Gas–Liquid Discharge Plasma Active Species
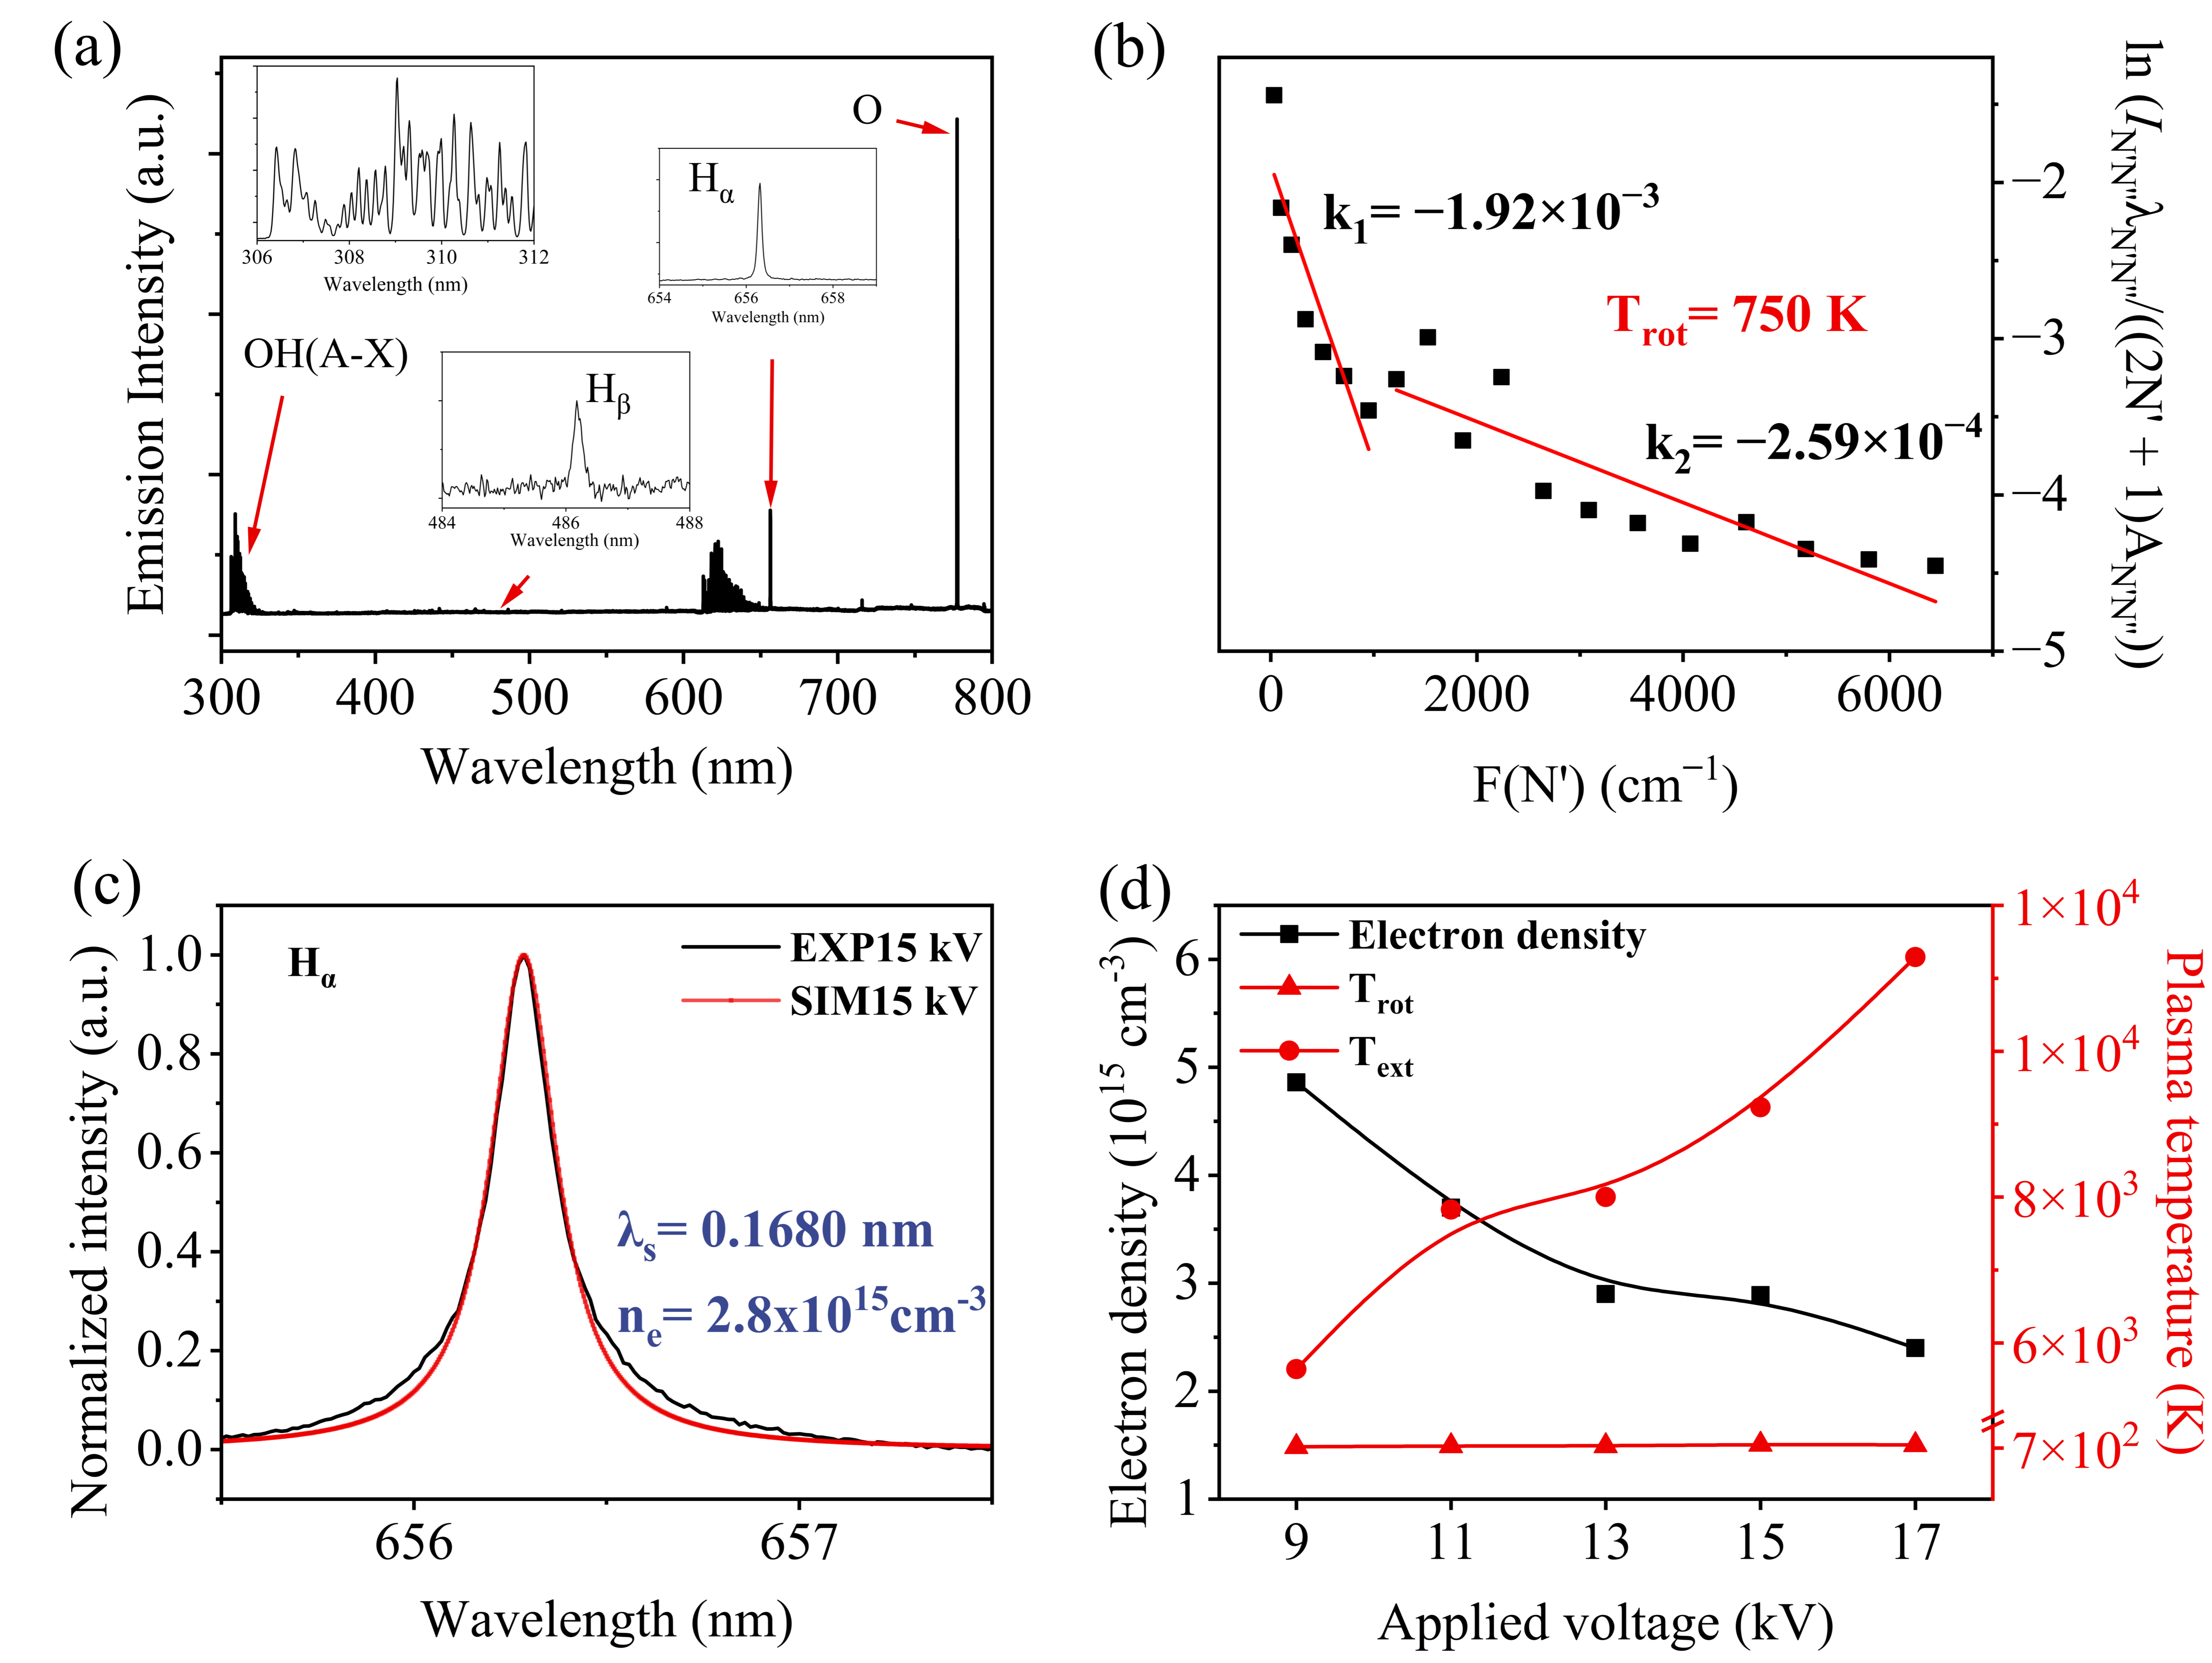
To identify the active species in the gas–liquid discharge plasma of this study, optical emission spectroscopy (OES) measurements in the range of 300–800 nm are recorded, as shown in Figure 7a. The emission spectrum mainly includes the OH(A-X) band at around 306–310 nm, a weak Hβ line at 486 nm, secondary OH diffraction bands at 612–620 nm, the Hα line at 656 nm, and the O atomic line at 777 nm. In the discharge reactions conducted in oxygen, active species are primarily generated through reactions R (7)–(10) [35,36,37]:
O 2 + e 2 O + e
e + O 2 O 2
O + H 2 O 2 O H
e + H 2 O e + O H + H
The high-energy electrons produced by the discharge collide with the O2 molecules provided by the surrounding environment, causing excitation, ionization, and dissociation [38]. This process leads to the formation of active oxygen species (ROS), including O atoms and radicals.
Figure 7b,c shows the results of calculating the plasma temperature using the Boltzmann slope method and the Stark broadening method, respectively. These changes were calculated based on the emission spectra of the relevant active species. The principles and methods of calculation can be found in these studies [39,40,41]. Figure 7d presents the changes in the plasma electron density and temperature in relation to the applied voltage. From the figure, it can be seen that the electron density of plasma decreases with the increase in applied voltage. Corresponding to the changes in discharge morphology (Figure 4), this decrease can be divided into three stages. In the glow discharge stage (9 kV), the electron density is around 4.90 × 1015 cm−3, in the pseudo-glow mode (13–15 kV), the electron density is around 2.90 × 1015 cm−3, and in the abnormal glow/arc mode (17 kV), the electron density is around 2.40 × 1015 cm−3. The primary reason for the reduction in electron density is that a higher voltage increases the strength of the electric field in the discharge region. A stronger electric field accelerates the motion of electrons, resulting in a higher kinetic energy when they collide with molecules. This leads to a greater effect [42]. Conversely, in contrast to the trend in electron density, the electron excitation temperature (Texc) and rotational temperature (Trot) of the plasma increase with increasing voltage. These temperatures primarily reflect the energy states of the electrons and ions in the plasma [43,44]. OH(A-X) is typically generated through the electronic excitation and radiative emission of water molecules. The increase in its rotation temperature indicates that the distribution of OH in high-energy states increases, and more water molecules collide and dissociate, which helps to produce more active species [45,46,47]. The decrease in plasma electron density, coupled with the increase in electron excitation temperature and rotational temperature, indicates that electrons transfer energy to other molecules through collisions. This may lead to the partial dissociation of molecules into ions, resulting in a decrease in electron density as electrons are consumed. By increasing the applied voltage, the effects of electron collisions are enhanced, resulting in higher electron excitation and rotational temperatures. This, in turn, promotes collision processes between electrons, reactive oxygen species (ROS), and pollutant molecules, thereby enhancing the reaction rates and ultimately improving the rates of ammonia nitrogen removal.
Figure 7. (a) The OES of gas–liquid discharge plasma, (b) the Boltzmann diagram method to calculate OH rotation temperature, (c) the Stark broadened fit to calculate electron density, (d) the effect of applied voltage on plasma electron density, rotational temperature, and electron excitation temperature.
Water 15 03827 g007
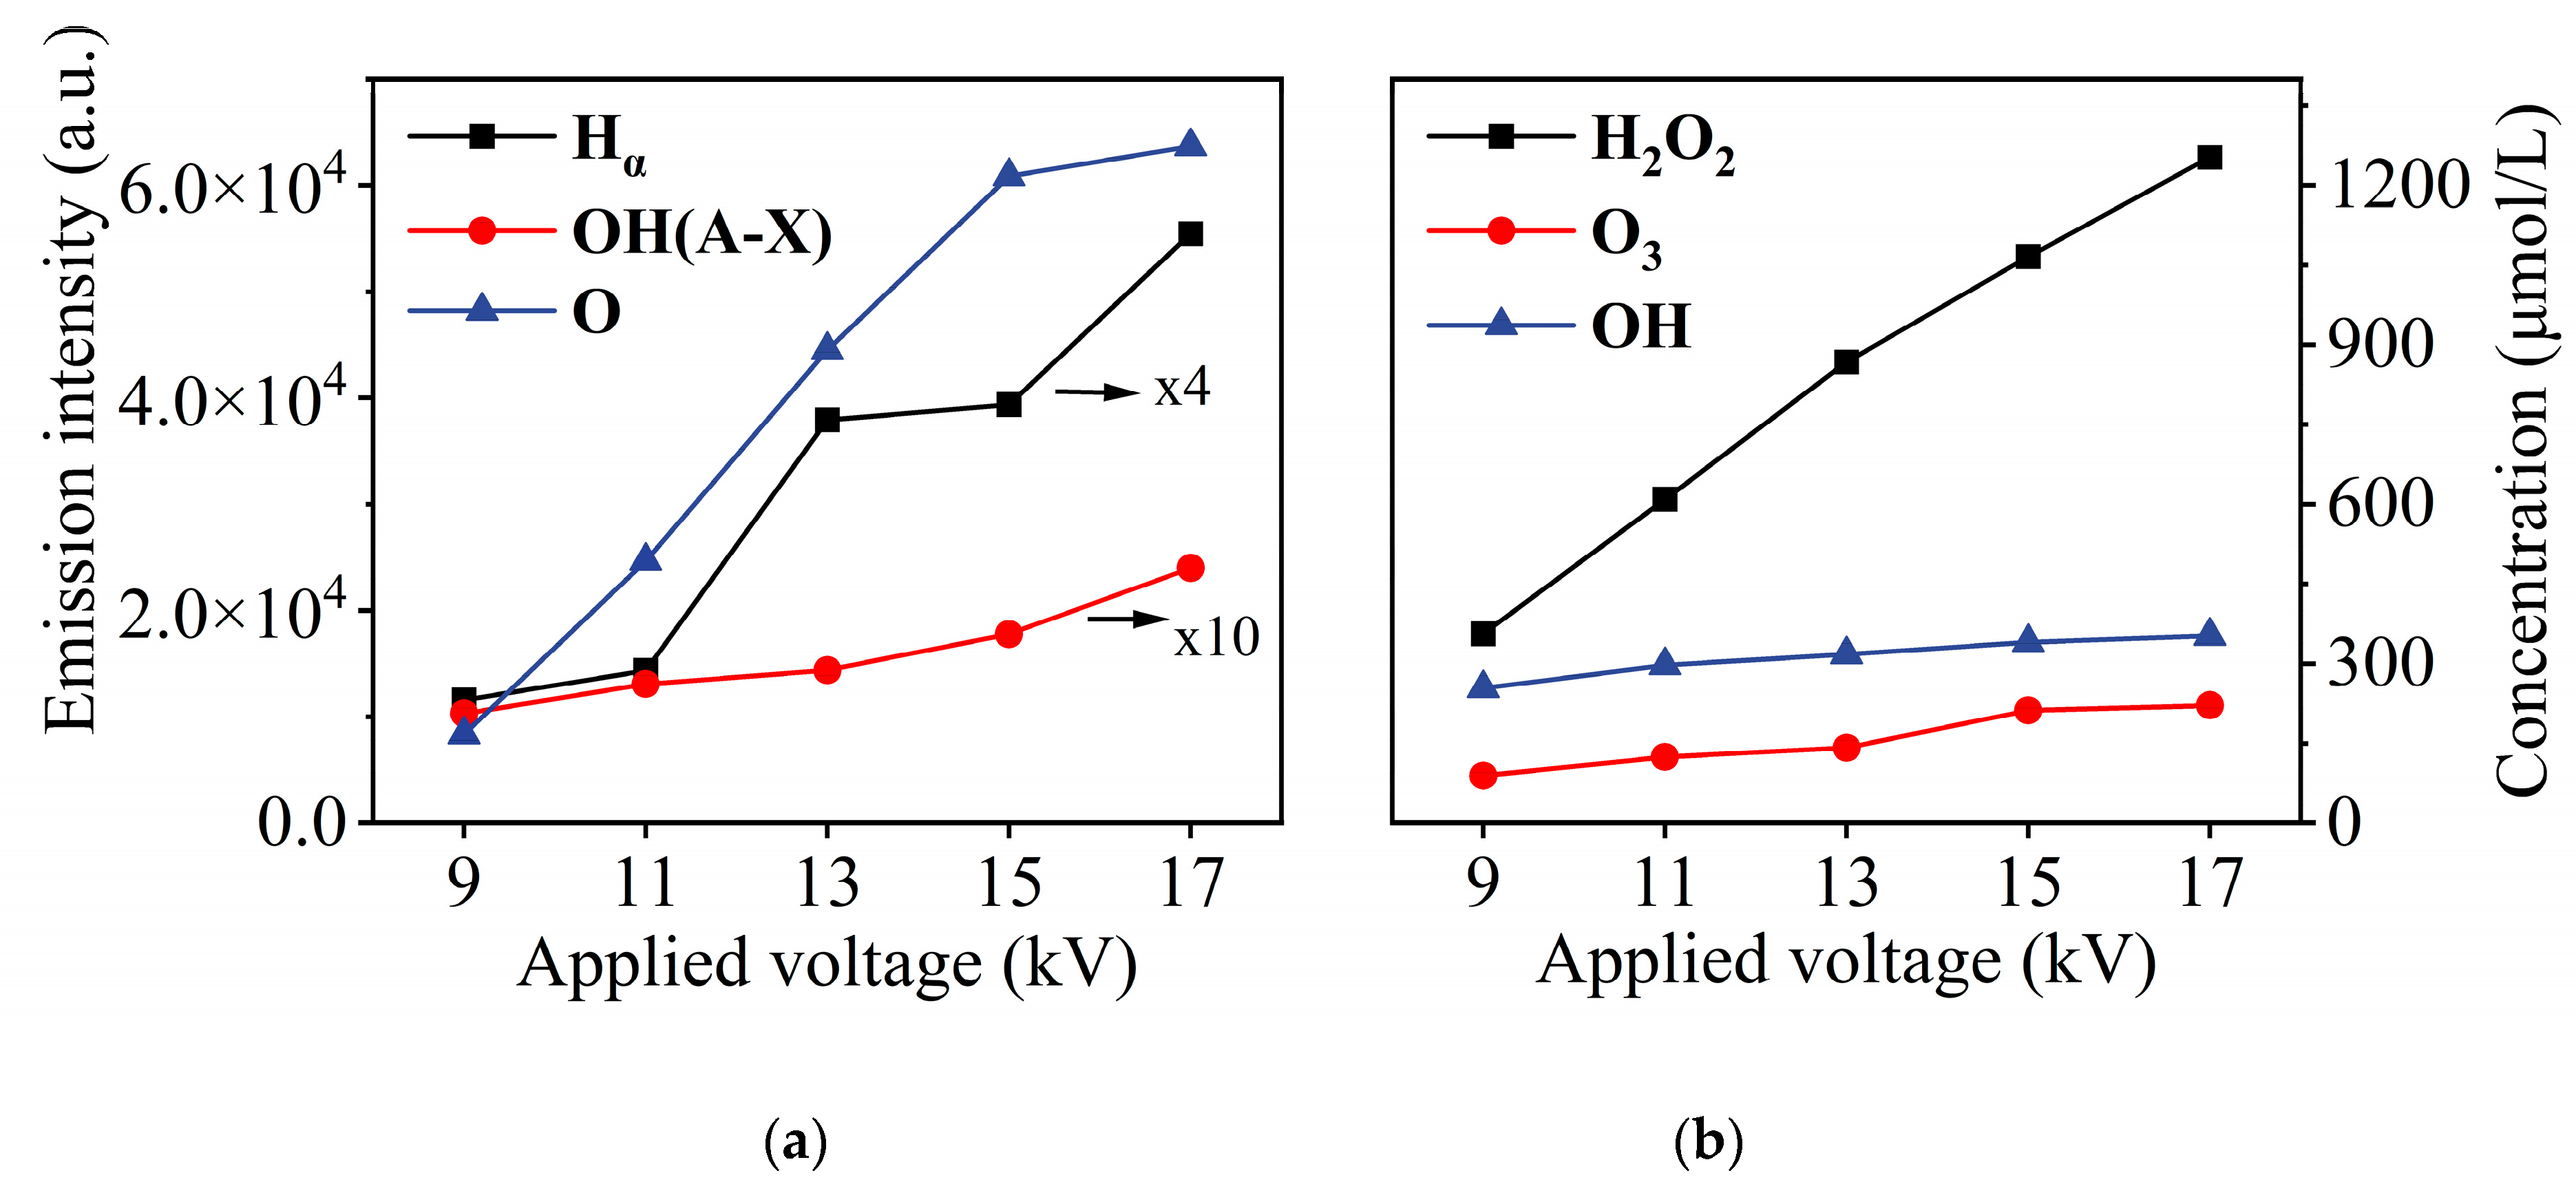
To validate the earlier hypothesis, the intensity and concentration of pertinent active species in both the gas phase and liquid phase of the gas–liquid discharge plasma were measured as the applied voltage varied. Figure 8a illustrates the effect of applied voltage on the intensity of the emission spectra of relevant active species in the gas phase. In order to facilitate a presentation on one coordinate axis, the emission intensities of Hα and OH(A-X) are magnified by a factor of 4 and 10, respectively. It is observed that the intensities of all three active species increase with an increasing applied voltage. As the applied voltage increases from 9 kV to 17 kV, the intensities of the Hα, OH(A-X), and O atomic lines increase by 479%, 232.91%, and 763.45%, respectively. This result confirms the earlier hypothesis that the decrease in electron density is associated with electron consumption, leading to the generation of more active species. Several studies have reported that H2O2, O3, and, O H are the main active species in the degradation process of ammonia nitrogen wastewater [21,48,49,50]. Figure 8b demonstrates the effect of the applied voltage on the concentrations of these three active species in the liquid phase. It is evident that increasing the applied voltage from 9 kV to 17 kV leads to an increase in the concentrations of H2O2, O3, and, O H z in the solution. This is mainly due to the following related reactions, R (11)–(15), in solution [51,52,53]:
O 2 + H H O 2
H O 2 + H O 2 H 2 O 2 + O 2
O 2 + O O 3
H 2 O + O 2 O H
O H + O H H 2 O 2
Figure 8. Effect of applied voltage on the (a) emission spectral intensity of the gas phase active species and (b) concentration of active species in the liquid phase.
Water 15 03827 g008
H2O2 exhibits a relatively higher molar concentration, and its concentration increases significantly with increasing voltage, mainly due to reaction R (15) in which O H is converted into H2O2 in the solution [54]. The increase in applied voltage enhances electron collision processes, thereby increasing collision frequencies, the concentration of active species [55], and ultimately, the reaction rates with pollutant molecules. This results in improved degradation efficiency.

3.5. Mechanism of Ammonia Nitrogen Removal by Gas–Liquid Discharge Plasma

The concentration of ammonia nitrogen in the solution and the corresponding transformation of nitrogen elements are shown in Figure 9. Figure 9a displays the concentration of ammonia nitrogen, NO3, and NO2 in the solution with varying applied voltages. For wastewater containing ammonia nitrogen with an initial concentration of 50 mg/L, the concentration of ammonia nitrogen decreases from 31.70 mg/L to 13.36 mg/L after 20 min of plasma discharge treatment, as the applied voltage increases from 9 kV to 17 kV. Correspondingly, the concentrations of NO3 and NO2 increase from 1.46 mg/L and 0.13 mg/L to 11.25 mg/L and 0.49 mg/L, respectively. The primary reaction processes may include the direct oxidation of active species in the solution as well as indirect reactions. The reaction pathways reported in most literature are as follows [19,21,52,56]:
H 2 O 2 + O 3 OH + H O 2 + O 2
N H 3 + O 3 N O 2 + H 2 O + O 2
N H 3 + O 3 N O 3 + H 2 O + O + O 2
N H 3 + OH N H x + H 2 O
N H x + N H y N 2 H x + y
N 2 H x + y + x + y OH N 2 + x + y H 2 O
N H 3 + OH N H 2 OH + H +
N H 2 OH + OH N O 2
N O 2 + 2 OH N O 3 + H 2 O
NO3 and NO2 were not found when analyzing the components in the washing bottle. Therefore, it can be inferred that the ultimate product of ammonia nitrogen degradation is primarily N2. Figure 9b shows the transformation of nitrogen elements in ammonia nitrogen wastewater during the degradation process with different applied voltages. With the applied voltage increasing from 9 kV to 17 kV and after 20 min of discharge treatment, the concentration of ammonia nitrogen decreases from 63.41% to 26.73% and the selectivity of N2 increases from 35.64% to 66.36%. In the same treatment time, increasing the applied voltage improves both the rate of ammonia nitrogen removal and the selectivity for N2, with a slight increase in NO3 ion concentration. Figure 9c,d depicts the results of ammonia nitrogen wastewater treatment and the transformation of ammonia nitrogen in the solution under an applied voltage of 15 kV. Under the experimental conditions with an initial concentration of 50 mg/L, an initial pH of 9, a gas flow rate of 300 mL/min, and an applied voltage of 15 kV, the gas–liquid discharge plasma treatment achieved a 96.23% removal of ammonia nitrogen and an 87.72% selectivity for N2 after 40 min. The high selectivity of N2, in addition to the aforementioned reactions R (19)–(21), may also be related to the catalytic effect of chloride ions in the solution [21,52,56,57]. The relevant reactions are as follows:
C I + O H C l + O H
C l + C I C l 2
C l 2 + O 3 C l O + C I + O 2
N H 4 + + C l N H 2 + C I + H +
N H 4 + + C l O N H 2 + H C l O + 2 H +
2 N H 4 + + 3 H C l O N 2 + 3 H 2 O + 5 H + + 3 C I
N H 2 + H C l O N H 2 C l + O H
N H 2 C l + H 2 O N O H + 2 H + + 2 C I
N H 2 C l + N O H N 2 + H + + C I + H 2 O
Some studies have reported that electron transfer on the cathode surface in the solution also contributes to the generation of N2 [56,58,59,60]. The relevant reactions are as follows:
N O 3 + 3 H 2 O + 5 e 0.5 N 2 + 6 O H
N O 2 + 2 H 2 O + 3 e 0.5 N 2 + 4 O H
Based on the research results mentioned above, the mechanism of the gas–liquid discharge plasma’s ammonia nitrogen degradation process is summarized, as illustrated in Figure 10. The specific mechanisms involved are summarized as follows:
  • Altering the applied voltage leads to transitions in the discharge mode and affects the energy input.
  • With the strengthening of the electric field, the kinetic energy of electrons in the plasma region increases, resulting in higher electron excitation temperatures and intensified electron collision processes. This leads to a decrease in electron density in the plasma region, but an increase in the concentration of active species in the discharge zone.
  • The increase in the rotational temperature of the plasma facilitates higher collision frequencies between active species in the gas phase and the liquid phase. This, in turn, promotes gas–liquid interactions, increases the concentration of active species in the liquid phase, and ultimately improves ammonia nitrogen removal efficiency.
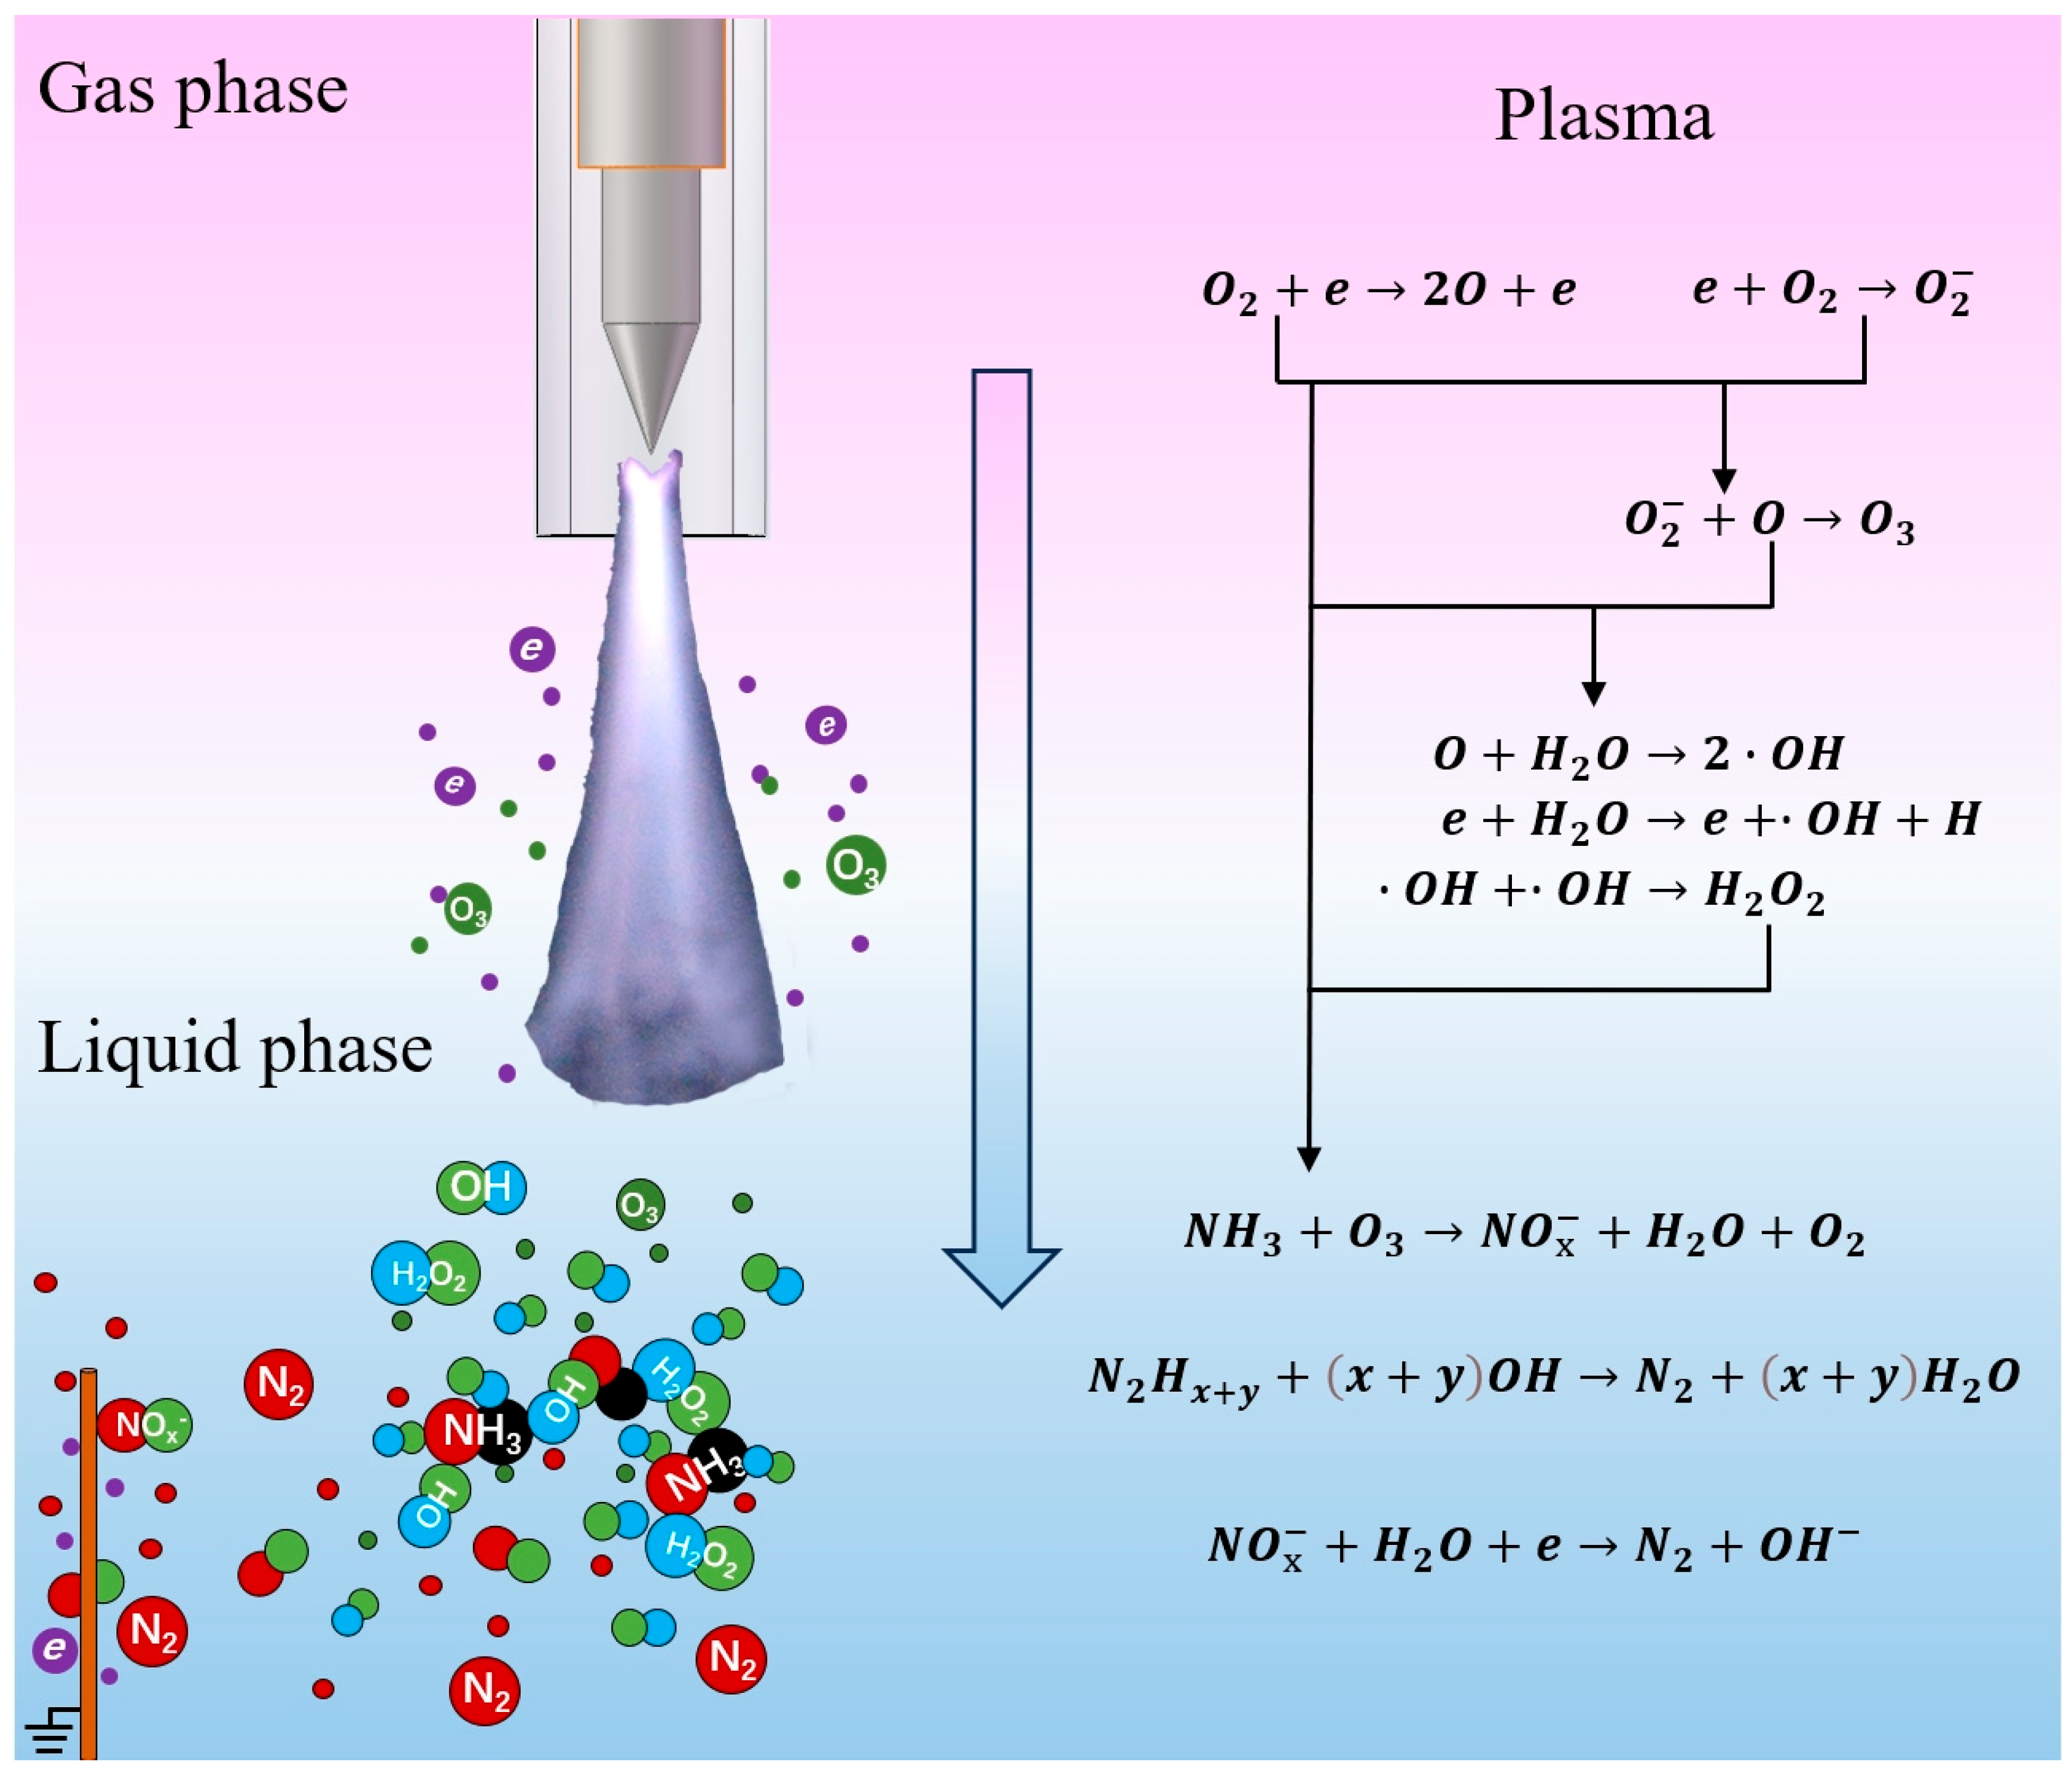
Figure 10. Mechanism of ammonia nitrogen degradation by gas–liquid discharge plasma.
Water 15 03827 g010
Increasing the applied voltage leads to changes in discharge morphology and enhances energy input. Elevated applied voltage results in an increased electron excitation temperature, enhanced collision, decreased electron density, and increased rotational temperature. These factors promote the concentration of H2O2, O3, and O H in the liquid phase, ultimately enhancing the reaction rate with ammonia nitrogen.

4. Conclusions

In this study, the effect of applied voltage on the treatment of ammonia nitrogen wastewater by gas–liquid discharge plasma was investigated, and the underlying plasma mechanism was elucidated. Increasing the applied voltage from 9 kV to 17 kV resulted in a significant enhancement in ammonia nitrogen removal efficiency, increasing from 49.45% to 99.04%. The applied voltage plays a significant role in the degradation of ammonia nitrogen in gas–liquid discharge plasma. Through analysis of electrical characteristics and plasma diagnostics, it was determined that the effective elimination of ammonia nitrogen in gas–liquid discharge plasma is mainly dependent on the production of H2O2, O3, and, O H in the liquid phase through interactions between the plasma and gas, rather than direct plasma treatment. Increasing the applied voltage leads to changes in discharge morphology and enhances energy input. Elevating the applied voltage results in an increased electron excitation temperature, enhanced collision, decreased electron density, and increased rotational temperature. These factors promote the concentration of H2O2, O3, and, O H in the liquid phase, ultimately enhancing the reaction rate with ammonia nitrogen.
This study lays the groundwork for future research on the effective elimination of ammonia nitrogen from wastewater. It suggests adjusting the applied voltage according to the initial concentration, manipulating discharge modes, and modulating the concentration of active species in the solution as potential methods. Subsequent work will involve wastewater treatment under various environmental conditions, further optimization of parameters, improved energy utilization, and the advancement of gas–liquid discharge plasma technology for applications in wastewater treatment and environmental remediation.

Author Contributions

Conceptualization, D.Y. and D.C.; methodology, Z.Z. and J.L.; software, Z.Z.; validation, Z.Z., X.C. and K.L.; formal analysis, Z.Z. and Y.L.; investigation, Z.Z.; resources, D.C. and D.Y.; data curation, Z.Z. and D.C.; writing—original draft preparation, Z.Z.; writing—review and editing, D.C., J.L. and K.L.; visualization, Z.Z.; supervision, D.C. and D.Y.; project administration, D.C. and D.Y.; funding acquisition, D.C. and D.Y. All authors have read and agreed to the published version of the manuscript.

Funding

This research was funded by the National Natural Science Foundations of China (Grant Nos. 52077026 and 11965018) and the Science and Technology Plan Project of the Ninth Fund of Xinjiang Production and Construction, grant number 2021JS005.

Data Availability Statement

The data that support the findings of this study are available from the corresponding author upon reasonable request.

Conflicts of Interest

The authors declare no conflict of interest.

References

  1. MacFarlane, D.R.; Cherepanov, P.V.; Choi, J.; Suryanto, B.H.R.; Hodgetts, R.Y.; Bakker, J.M.; Ferrero Vallana, F.M.; Simonov, A.N. A Roadmap to the Ammonia Economy. Joule 2020, 4, 1186–1205. [Google Scholar] [CrossRef]
  2. Winter, L.R.; Chen, J.G. N-2 Fixation by Plasma-Activated Processes. Joule 2021, 5, 300–315. [Google Scholar] [CrossRef]
  3. Stevens, C.J. Nitrogen in the Environment. Science 2019, 363, 578–580. [Google Scholar] [CrossRef]
  4. Xiong, G.; Zhu, X.; Liu, M.; Yang, Y.; Chen, G.; Fu, T.; Ding, R.; Xu, X.; Wu, J. Nitrogen Cycle Pattern Variations during Seawater-Groundwater-River Interactions Enhance the Nitrogen Availability in the Coastal Earth Critical Zone. J. Hydrol. 2023, 624, 129932. [Google Scholar] [CrossRef]
  5. Zhang, L.; Xu, E.G.; Li, Y.; Liu, H.; Vidal-Dorsch, D.E.; Giesy, J.P. Ecological Risks Posed by Ammonia Nitrogen (AN) and Un-Ionized Ammonia (NH3) in Seven Major River Systems of China. Chemosphere 2018, 202, 136–144. [Google Scholar] [CrossRef] [PubMed]
  6. Zhou, Y.; Xiao, B.; Liu, S.-Q.; Meng, Z.; Chen, Z.-G.; Zou, C.-Y.; Liu, C.-B.; Chen, F.; Zhou, X. Photo-Fenton Degradation of Ammonia via a Manganese–Iron Double-Active Component Catalyst of Graphene–Manganese Ferrite under Visible Light. Chem. Eng. J. 2016, 283, 266–275. [Google Scholar] [CrossRef]
  7. Camargo, J.A.; Alonso, A. Ecological and Toxicological Effects of Inorganic Nitrogen Pollution in Aquatic Ecosystems: A Global Assessment. Environ. Int. 2006, 32, 831–849. [Google Scholar] [CrossRef]
  8. Luo, H.; Zeng, Y.; Cheng, Y.; He, D.; Pan, X. Recent Advances in Municipal Landfill Leachate: A Review Focusing on Its Characteristics, Treatment, and Toxicity Assessment. Sci. Total Environ. 2020, 703, 135468. [Google Scholar] [CrossRef]
  9. Miklos, D.B.; Remy, C.; Jekel, M.; Linden, K.G.; Drewes, J.E.; Huebner, U. Evaluation of Advanced Oxidation Processes for Water and Wastewater Treatment—A Critical Review. Water Res. 2018, 139, 118–131. [Google Scholar] [CrossRef]
  10. Kabuba, J.; Lephallo, J.; Rutto, H. Comparison of Various Technologies Used to Eliminate Nitrogen from Wastewater: A Review. J. Water Process Eng. 2022, 48, 102885. [Google Scholar] [CrossRef]
  11. Han, B.; Butterly, C.; Zhang, W.; He, J.; Chen, D. Adsorbent Materials for Ammonium and Ammonia Removal: A Review. J. Clean. Prod. 2021, 283, 124611. [Google Scholar] [CrossRef]
  12. Chiu, Y.-H.; Chang, T.-F.; Chen, C.-Y.; Sone, M.; Hsu, Y.-J. Mechanistic Insights into Photodegradation of Organic Dyes Using Heterostructure Photocatalysts. Catalysts 2019, 9, 430. [Google Scholar] [CrossRef]
  13. Giwa, A.; Yusuf, A.; Balogun, H.A.; Sambudi, N.S.; Bilad, M.R.; Adeyemi, I.; Chakraborty, S.; Curcio, S. Recent Advances in Advanced Oxidation Processes for Removal of Contaminants from Water: A Comprehensive Review. Process Saf. Environ. Prot. 2021, 146, 220–256. [Google Scholar] [CrossRef]
  14. Dong, G.; Chen, B.; Liu, B.; Hounjet, L.J.; Cao, Y.; Stoyanov, S.R.; Yang, M.; Zhang, B. Advanced Oxidation Processes in Microreactors for Water and Wastewater Treatment: Development, Challenges, and Opportunities. Water Res. 2022, 211, 118047. [Google Scholar] [CrossRef] [PubMed]
  15. Magureanu, M.; Bilea, F.; Bradu, C.; Hong, D. A Review on Non-Thermal Plasma Treatment of Water Contaminated with Antibiotics. J. Hazard. Mater. 2021, 417, 125481. [Google Scholar] [CrossRef] [PubMed]
  16. Jiang, B.; Zheng, J.; Qiu, S.; Wu, M.; Zhang, Q.; Yan, Z.; Xue, Q. Review on Electrical Discharge Plasma Technology for Wastewater Remediation. Chem. Eng. J. 2014, 236, 348–368. [Google Scholar] [CrossRef]
  17. Liang, J.-P.; Zhou, X.-F.; Zhao, Z.-L.; Yang, D.-Z.; Wang, W.-C. Degradation of Trimethoprim in Aqueous by Persulfate Activated with Nanosecond Pulsed Gas-Liquid Discharge Plasma. J. Environ. Manag. 2021, 278, 111539. [Google Scholar] [CrossRef] [PubMed]
  18. Aggelopoulos, C.A. Recent Advances of Cold Plasma Technology for Water and Soil Remediation: A Critical Review. Chem. Eng. J. 2022, 428, 131657. [Google Scholar] [CrossRef]
  19. Fan, J.; Wu, H.; Liu, R.; Meng, L.; Fang, Z.; Liu, F.; Xu, Y. Non-Thermal Plasma Combined with Zeolites to Remove Ammonia Nitrogen from Wastewater. J. Hazard. Mater. 2021, 401, 123627. [Google Scholar] [CrossRef]
  20. Wu, H.; Fan, J.; Chen, W.; Yang, C. Dielectric Barrier Discharge-Coupled Fe-Based Zeolite to Remove Ammonia Nitrogen and Phenol Pollutants from Water. Sep. Purif. Technol. 2020, 243, 116344. [Google Scholar] [CrossRef]
  21. Aka, R.J.N.; Wu, S.; Mohotti, D.; Bashir, M.A.; Nasir, A. Evaluation of a Liquid-Phase Plasma Discharge Process for Ammonia Oxidation in Wastewater: Process Optimization and Kinetic Modeling. Water Res. 2022, 224, 119107. [Google Scholar] [CrossRef] [PubMed]
  22. Back, S.; Saito, N.; Lee, S. A Facile and Efficient Approach for the Removal of High Concentrations of Ammonia Nitrogen in Wastewater: Liquid-Phase Plasma Treatment. J. Environ. Chem. Eng. 2023, 11, 109075. [Google Scholar] [CrossRef]
  23. Adams, V.D. Water and Wastewater Examination Manual; Routledge: New York, NY, USA, 2017; ISBN 978-0-203-73413-1. [Google Scholar]
  24. Liang, J.P.; Zhao, Z.L.; Zhou, X.F.; Yuan, H.; Wang, H.L.; Wang, W.C.; Yang, D.Z. The Influences of Shielding Gas and Quartz Tube on Discharge Properties and Reactive Species Productions of Nanosecond Pulsed Gas-Liquid Discharge. J. Phys.-Appl. Phys. 2022, 55, 195204. [Google Scholar] [CrossRef]
  25. Zhou, X.; Zhao, Z.; Liang, J.; Yuan, H.; Wang, W.; Yang, D. Measurement of Reactive Species in Different Solutions of Bubble Discharge with Varying O2/N2 Proportion in Ar: Analysis of Reaction Pathways. Plasma Process. Polym. 2019, 16, e1900001. [Google Scholar] [CrossRef]
  26. Hartley, A.M.; Asai, R.I. Spectrophotometric Determination of Nitrate with 2,6-Xylenol Reagent. Anal. Chem. 1963, 35, 1207–1213. [Google Scholar] [CrossRef]
  27. Bader, H.; Hoigné, J. Determination of Ozone in Water by the Indigo Method. Water Res. 1981, 15, 449–456. [Google Scholar] [CrossRef]
  28. Kanazawa, S.; Kawano, H.; Watanabe, S.; Furuki, T.; Akamine, S.; Ichiki, R.; Ohkubo, T.; Kocik, M.; Mizeraczyk, J. Observation of OH Radicals Produced by Pulsed Discharges on the Surface of a Liquid. Plasma Sources Sci. Technol. 2011, 20, 034010. [Google Scholar] [CrossRef]
  29. Zhao, D.; Wang, D.; Yan, G.; Ma, H.; Xiong, X.; Luo, J.; Zhang, X.; Liu, D.; Yang, S. Plasma Treatment of Industrial Landfill Leachate by Atmospheric Pressure Dielectric Barrier Discharges. Plasma Sci. Technol. 2011, 13, 612–616. [Google Scholar] [CrossRef]
  30. Yuan, H.; Feng, J.; Yang, D.-Z.; Zhou, X.-F.; Liang, J.-P.; Zhang, L.; Zhao, Z.-L.; Wang, W.-C. Plasma Characteristics and Mode Transition of Atmospheric Pressure Gas–Liquid Discharge Oxygen Plasma. J. Appl. Phys. 2020, 128, 093303. [Google Scholar] [CrossRef]
  31. Chen, S.; Chen, X.; Wen, J.; Yao, C.; Xu, G.; Li, Y.; Chang, Z.; Zhang, G.-J. Primary and Secondary Discharges in an Atmospheric Pressure Plasma Jet Fed with Heliumand Tetrafluoromethane Mixtures. Phys. Plasmas 2019, 26, 010703. [Google Scholar] [CrossRef]
  32. Meropoulis, S.; Aggelopoulos, C.A. Plasma Microbubbles vs Gas-Liquid DBD Energized by Low-Frequency High Voltage Nanopulses for Pollutants Degradation in Water: Destruction Mechanisms, Composition of Plasma-Activated Water and Energy Assessment. J. Environ. Chem. Eng. 2023, 11, 109855. [Google Scholar] [CrossRef]
  33. Wang, X.; Mei, J.; Luo, J.; Huang, Y.; Dionysiou, D.D. Process Intensification of Tetrabromobisphenol S Removal with a Bubble-Film Hybrid Plasma Reactor. Chem. Eng. J. 2022, 427, 131736. [Google Scholar] [CrossRef]
  34. Ognier, S.; Iya-sou, D.; Fourmond, C.; Cavadias, S. Analysis of Mechanisms at the Plasma-Liquid Interface in a Gas-Liquid Discharge Reactor Used for Treatment of Polluted Water. Plasma Chem. Plasma Process. 2009, 29, 261–273. [Google Scholar] [CrossRef]
  35. Kenner, R.D.; Ogryzlo, E.A. Rate Constant for the Deactivation of O2 (A3Σu+ by N2. Chem. Phys. Lett. 1983, 103, 209–212. [Google Scholar] [CrossRef]
  36. Li, Y.; Yang, D.-Z.; Qiao, J.-J.; Zhang, L.; Wang, W.-Z.; Zhao, Z.-L.; Zhou, X.-F.; Yuan, H.; Wang, W.-C. The Dynamic Evolution and Interaction with Dielectric Material of the Discharge in Packed Bed Reactor. Plasma Sources Sci. Technol. 2020, 29, 055004. [Google Scholar] [CrossRef]
  37. Kapaldo, J.; Han, X.; Ptasinska, S. Shielding-Gas-Controlled Atmospheric Pressure Plasma Jets: Optical Emission, Reactive Oxygen Species, and the Effect on Cancer Cells. Plasma Process. Polym. 2019, 16, e1800169. [Google Scholar] [CrossRef]
  38. Lukes, P.; Appleton, A.T.; Locke, B.R. Hydrogen Peroxide and Ozone Formation in Hybrid Gas-Liquid Electrical Discharge Reactors. IEEE Trans. Ind. Appl. 2004, 40, 60–67. [Google Scholar] [CrossRef]
  39. Hofmann, S.; Van Gessel, A.F.H.; Verreycken, T.; Bruggeman, P. Power dissipation, gas temperatures and electron densities of cold atmospheric pressure helium and argon RF plasma jets. Plasma Sources Sci. Technol. 2011, 20, 065010. [Google Scholar] [CrossRef]
  40. Nyholm, K. Measurements of OH Rotational Temperatures in Flames by Using Polarization Spectroscopy. Opt. Commun. 1994, 111, 66–70. [Google Scholar] [CrossRef]
  41. Konjević, N.; Ivković, M.; Sakan, N. Hydrogen Balmer Lines for Low Electron Number Density Plasma Diagnostics. Spectrochim. Acta Part B At. Spectrosc. 2012, 76, 16–26. [Google Scholar] [CrossRef]
  42. Wang, S.; Yang, D.-Z.; Zhou, R.; Zhou, R.; Fang, Z.; Wang, W.; Ostrikov, K. Mode Transition and Plasma Characteristics of Nanosecond Pulse Gas-Liquid Discharge: Effect of Grounding Configuration. Plasma Process. Polym. 2020, 17, e1900146. [Google Scholar] [CrossRef]
  43. Adams, N.G.; Poterya, V.; Babcock, L.M. Electron Molecular Ion Recombination: Product Excitation and Fragmentation. Mass Spectrom. Rev. 2006, 25, 798–828. [Google Scholar] [CrossRef] [PubMed]
  44. Yue, Y.; Kondeti, V.S.S.K.; Sadeghi, N.; Bruggeman, P.J. Plasma Dynamics, Instabilities and OH Generation in a Pulsed Atmospheric Pressure Plasma with Liquid Cathode: A Diagnostic Study. Plasma Sources Sci. Technol. 2022, 31, 025008. [Google Scholar] [CrossRef]
  45. Simek, M. Optical Diagnostics of Streamer Discharges in Atmospheric Gases. J. Phys.-Appl. Phys. 2014, 47, 463001. [Google Scholar] [CrossRef]
  46. Bruggeman, P.; Schram, D.C.; Kong, M.G.; Leys, C. Is the Rotational Temperature of OH(A–X) for Discharges in and in Contact with Liquids a Good Diagnostic for Determining the Gas Temperature? Plasma Process. Polym. 2009, 6, 751–762. [Google Scholar] [CrossRef]
  47. Bruggeman, P.; Schram, D.C. On OH Production in Water Containing Atmospheric Pressure Plasmas. Plasma Sources Sci. Technol. 2010, 19, 045025. [Google Scholar] [CrossRef]
  48. Yang, Y.; Ricoveri, A.; Demeestere, K.; Van Hulle, S. Advanced Treatment of Landfill Leachate through Combined Anammox-Based Biotreatment, O3/H2O2 Oxidation, and Activated Carbon Adsorption: Technical Performance, Surrogate-Based Control Strategy, and Operational Cost Analysis. J. Hazard. Mater. 2022, 430, 128481. [Google Scholar] [CrossRef]
  49. Xue, W.; Zhang, C.; Zhou, D. Positive and Negative Effects of Recirculating Aquaculture Water Advanced Oxidation: O3 and O3/UV Treatments Improved Water Quality but Increased Antibiotic Resistance Genes. Water Res. 2023, 235, 119835. [Google Scholar] [CrossRef]
  50. Jozwiakowski, K.; Marzec, M.; Fiedurek, J.; Kaminska, A.; Gajewska, M.; Wojciechowska, E.; Wu, S.; Dach, J.; Marczuk, A.; Kowlaczyk-Jusko, A. Application of H2O2 to Optimize Ammonium Removal from Domestic Wastewater. Sep. Purif. Technol. 2017, 173, 357–363. [Google Scholar] [CrossRef]
  51. Mouele, E.S.M.; Tijani, J.O.; Badmus, K.O.; Pereao, O.; Babajide, O.; Fatoba, O.O.; Zhang, C.; Shao, T.; Sosnin, E.; Tarasenko, V.; et al. A Critical Review on Ozone and Co-Species, Generation and Reaction Mechanisms in Plasma Induced by Dielectric Barrier Discharge Technologies for Wastewater Remediation. J. Environ. Chem. Eng. 2021, 9, 105758. [Google Scholar] [CrossRef]
  52. Jing, L.; Chen, B.; Wen, D.; Zheng, J.; Zhang, B. The Removal of COD and NH3-N from Atrazine Production Wastewater Treatment Using UV/O3: Experimental Investigation and Kinetic Modeling. Environ. Sci. Pollut. Res. 2018, 25, 2691–2701. [Google Scholar] [CrossRef] [PubMed]
  53. Hu, X.; Zhang, Y.; Wu, R.A.; Liao, X.; Liu, D.; Cullen, P.J.; Zhou, R.-W.; Ding, T. Diagnostic Analysis of Reactive Species in Plasma-Activated Water (PAW): Current Advances and Outlooks. J. Phys.-Appl. Phys. 2022, 55, 023002. [Google Scholar] [CrossRef]
  54. Chen, Q.; Li, J.; Chen, Q.; Ostrikov, K. Recent Advances towards Aqueous Hydrogen Peroxide Formation in a Direct Current Plasma-Liquid System. High Volt. 2022, 7, 405–419. [Google Scholar] [CrossRef]
  55. Shen, J.; Zhang, H.; Xu, Z.; Zhang, Z.; Cheng, C.; Ni, G.; Lan, Y.; Meng, Y.; Xia, W.; Chu, P.K. Preferential Production of Reactive Species and Bactericidal Efficacy of Gas-Liquid Plasma Discharge. Chem. Eng. J. 2019, 362, 402–412. [Google Scholar] [CrossRef]
  56. Liu, X.; Wang, J. Selective Oxidation of Ammonium to Nitrogen Gas by Advanced Oxidation Processes: Reactive Species and Oxidation Mechanisms. J. Environ. Chem. Eng. 2023, 11, 110263. [Google Scholar] [CrossRef]
  57. Liu, Y.; Zhang, L.; Liu, T.; Wang, J. Photocatalytic Selective Oxidation of Ammonium to Dinitrogen by FeOx-MgO Activated Persulfate under Solar-Light Irradiation. Chem. Eng. J. 2023, 454, 140499. [Google Scholar] [CrossRef]
  58. Habibzadeh, F.; Miller, S.L.; Hamann, T.W.; Smith, M.R. Homogeneous Electrocatalytic Oxidation of Ammonia to N-2 under Mild Conditions. Proc. Natl. Acad. Sci. USA 2019, 116, 2849–2853. [Google Scholar] [CrossRef]
  59. Park, C.; Kwak, H.; Moon, G.; Kim, W. Biomimetic Photocatalysts for the Conversion of Aqueous- and Gas-Phase Nitrogen Species to Molecular Nitrogen via Denitrification and Ammonia Oxidation. J. Mater. Chem. A 2021, 9, 19179–19205. [Google Scholar] [CrossRef]
  60. Zhang, Y.; Li, J.; Bai, J.; Shen, Z.; Li, L.; Xia, L.; Chen, S.; Zhou, B. Exhaustive Conversion of Inorganic Nitrogen to Nitrogen Gas Based on a Photoelectro-Chlorine Cycle Reaction and a Highly Selective Nitrogen Gas Generation Cathode. Environ. Sci. Technol. 2018, 52, 1413–1420. [Google Scholar] [CrossRef]
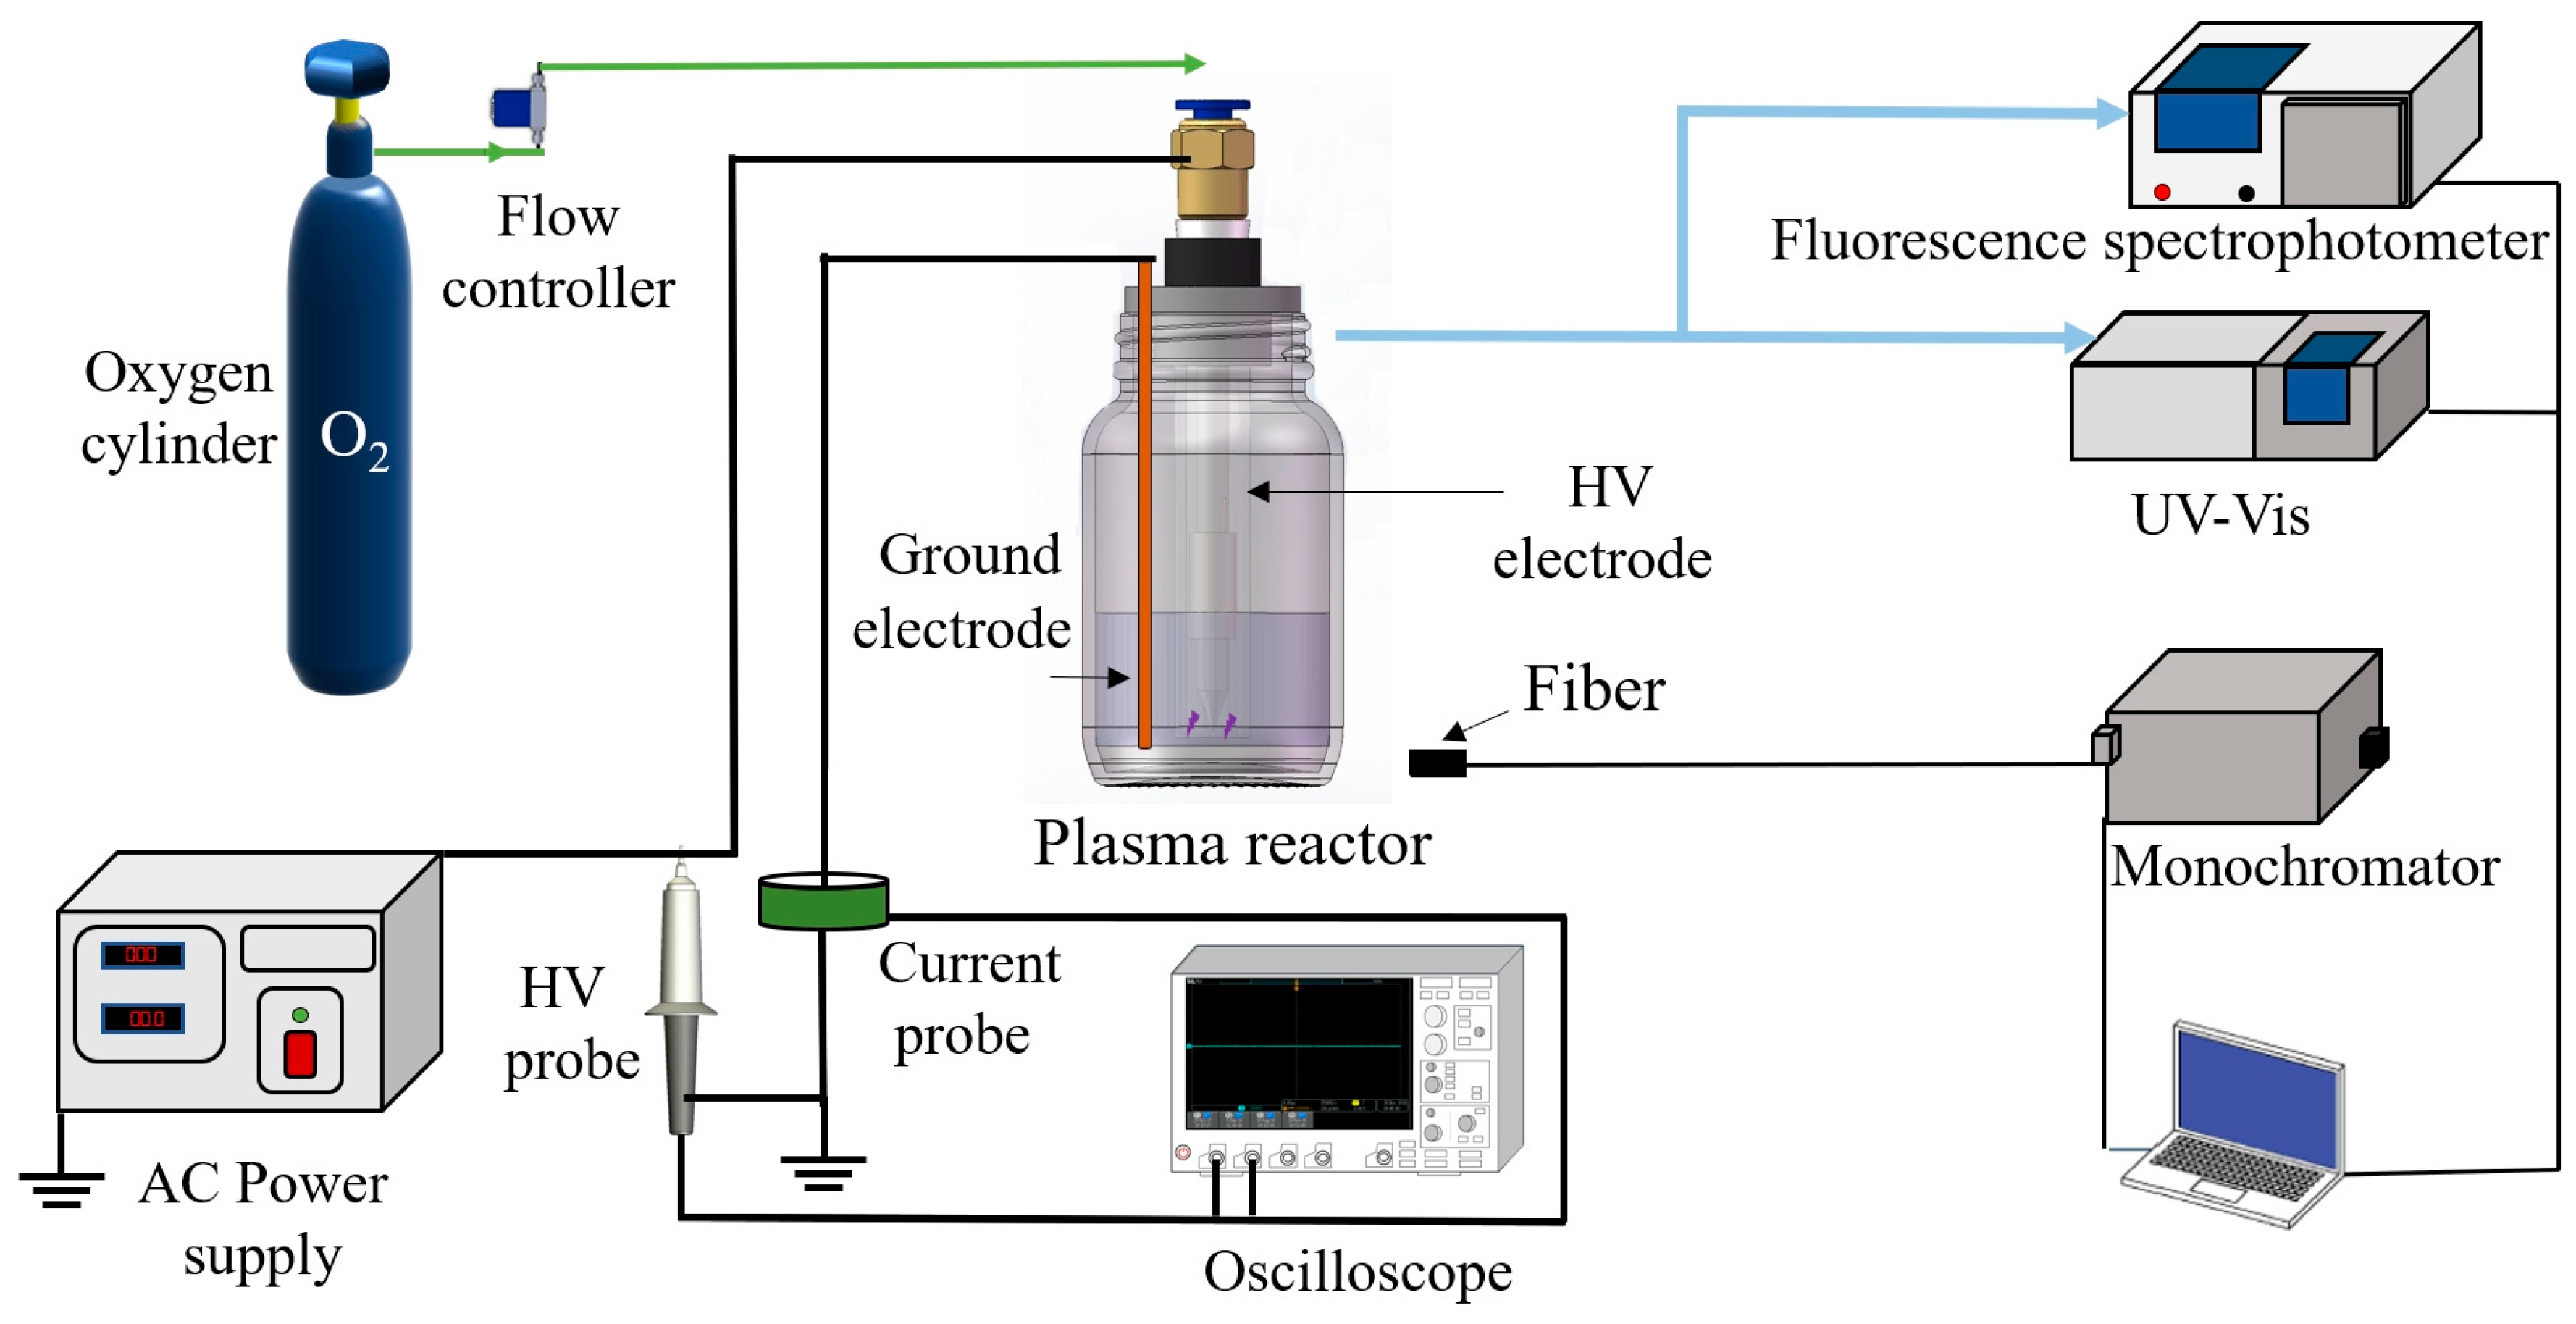
Figure 1. Schematic diagram of the plasma ammonia nitrogen wastewater treatment experimental platform.
Water 15 03827 g001
Figure 2. Effect of initial experimental parameters on ammonia nitrogen removal by gas–liquid discharge plasma: (a,b) effect of initial concentration and first-order kinetic fitting, (c) Effect of gas flow rate, and (d) initial pH effect (applied voltage = 15 kV).
Water 15 03827 g002
Figure 3. Effect of applied voltage on ammonia nitrogen removal (initial pH = 9, gas flow rate = 300 mL/min, and initial concentration = 50 mg/L).
Water 15 03827 g003
Figure 4. Photos of gas–liquid discharge plasma discharge under different voltages.
Water 15 03827 g004
Figure 5. Effect of applied voltage on (a) voltage and current (blue line) waveform (b) instantaneous power and coupled input energy (red line).
Water 15 03827 g005
Figure 6. Effect of applied voltage on energy efficiency.
Water 15 03827 g006
Figure 9. Effect of (a) applied voltage on the concentration of ammonia nitrogen and nitrite, (b) applied voltage on nitrogen transformation, (c) plasma treatment time on the concentration of ammonia nitrogen and nitrite, and (d) plasma treatment time on nitrogen transformation.
Water 15 03827 g009
Disclaimer/Publisher’s Note: The statements, opinions and data contained in all publications are solely those of the individual author(s) and contributor(s) and not of MDPI and/or the editor(s). MDPI and/or the editor(s) disclaim responsibility for any injury to people or property resulting from any ideas, methods, instructions or products referred to in the content.