1. Introduction
The world’s coastlines are in a constant state of flux and are increasingly vulnerable due to multiple factors, notably climate change and human activities. Coastal areas worldwide are facing considerable strain, as evident from recent extreme climatic events observed in various parts of the world. In the state of Kerala, located in southern India, coastal regions constitute less than 10% of the state’s total geographical area, yet they accommodate over 27% of Kerala’s population, mirroring a global trend [
1]. These regions are bustling with human settlements, fishing endeavors, agricultural practices, industrial operations, transportation networks, recreational activities, and more. In general, the majority of these activities impose significant threats to the ecosystem and exacerbate the deterioration of natural resources through processes such as inundation, coastal erosion, sedimentation, and habitat destruction. The years 2018 and 2019 witnessed severe flooding in Kerala, during which these coastal areas played a role in impeding the proper drainage of floodwaters into the oceans. This predicament is not unique to Kerala, as coastal regions worldwide face similar challenges. This issue puts over 200 million people globally at risk due to their vulnerability to flooding and rising sea levels [
2].
Assessing and monitoring coastal changes in a marine environment, especially in a humid tropical region, using Remote Sensing (RS) and Geographic Information System (GIS) techniques is of significant scientific importance. It is valuable to integrate different modern scientific tools (e.g., GIS, remote sensing, and GPS) when developing and analyzing databases. It is also helpful when developing and elaborating management action plans [
3,
4,
5]. This study is significant since it is a comprehensive and holistic approach to understanding the dynamics of coastal environments and their interactions with the changing climate and their impact on coastal islands, which can be linked to Shoreline Erosion and Sedimentation Studies, Environmental Monitoring and Management, Natural Disaster Preparedness and Mitigation, Climate Change Impact Assessment, Habitat Conservation and Biodiversity Assessment, Infrastructure Planning and Coastal Engineering, Water Quality Assessment, Socioeconomic Impact Analysis and Long-Term Trend Analysis and Predictive Modeling, etc.
The shoreline, marking the interface between land and the ocean, is in a constant state of change due to both human-induced (anthropogenic) and natural factors [
3]. The shifts in the shoreline, either towards the ocean or land, are primarily attributed to anthropogenic activities like the construction of structures for development or socio-cultural purposes, disrupting the natural balance [
4]. Structures such as artificial harbors, jetties, and sea walls significantly impact erosion and accretion patterns [
5]. Analyzing shoreline changes is crucial for assessing coastal vulnerability and understanding the key driving factors [
6]. The shoreline is inherently dynamic due to ever-changing environmental conditions, showcasing evidence of coastal landforms and their dynamics. A comprehensive understanding, continuous monitoring, and timely detection of shoreline alterations are essential to grasping coastal processes and dynamics. Natural forces like waves, tidal actions, currents, and winds, along with morphological, climatological, geological factors, and anthropogenic activities, collectively influence shoreline changes [
7]. The southern coast of India is particularly susceptible to coastal erosion and inundation, likely exacerbated by rising sea levels, impacting local populations, infrastructure, and livelihoods. Human activities, including deforestation, construction, overexploitation of resources, and infrastructure development, contribute significantly to shoreline shifts and increased vulnerability to flooding, particularly during the monsoon and high tides. Complex interactions between waves, storms, tides, tectonic activities, rivers, and physical processes in nearby regions affect the geometry of the shoreline [
8]. Utilizing thematic layers of shorelines extracted from LANDSAT imagery over different time periods can aid in comprehending changes, identifying causative factors, and implementing precautionary measures for the effective management of these vital coastal resources.
The other aspects that erode the shoreline include a rise in sea level, sources of sand and their sinks, geomorphological characteristics of the shore, etc. [
9]. Erosion and accretion can lead to rapid shoreline changes and create severe social and economic problems. Monitoring the coastal/shoreline changes in a different time series (temporal) on a quantitative basis will help to establish the driving forces and processes such as accretion/erosion and assist in developing proper coastal management plans and interventions. Geometry and the shoreline position are possibly the most significant indicators that can be used to monitor the changes in coastal regions [
8].
Monitoring shoreline changes and positions involves a variety of methods, such as surveys, aerial photographs, satellite imagery, and LIDAR-based approaches. Newer methods, like Principal Components Analysis and Histogram segmentation, use advanced algorithms to detect morphological features and hydrodynamic patterns for change detection in shorelines [
10,
11,
12,
13,
14]. While some methods are costly and time-consuming, integrating the GIS with RS proves highly efficient in comprehending landform changes due to its multispectral database and cost-effectiveness. Space technologies, providing vast data and extensive coverage, are indispensable for understanding coastal features and planning sustainable coastal development. Statistical tools and geospatial techniques aid in predicting future trends and understanding the dynamics of shoreline variation. The Digital Shoreline Analysis System (DSAS) in ArcGIS software is particularly useful for detailed analysis and prediction of coastline changes [
15]. Utilizing geo-spatial technologies for analyzing shoreline changes is vital for effective action plans to manage vulnerable coastal areas prone to erosion [
16]. Several research gaps exist within this domain, which include spatial and temporal data availability, modeling and prediction accuracy, and identifying sustainable coastal management solutions in a holistic manner. Given the escalating global degradation of coastal zones, continuous monitoring and assessment of shoreline migration patterns are critical for understanding coastal ecosystems and the sea-land interaction. A study was conducted to analyze changes in the tropical coastal islands of Kerala, specifically Vypin, Vallarpadam, and Bolgatty, highlighting their changes over time. The main objective of the study was to use RS and GIS techniques to comprehensively characterize the various types and extents of coastal changes occurring in coastal islands within a humid tropical marine environment and analyze the changes in coastal dynamics, including erosion and accretion, over a period of time.
2. Materials and Methods
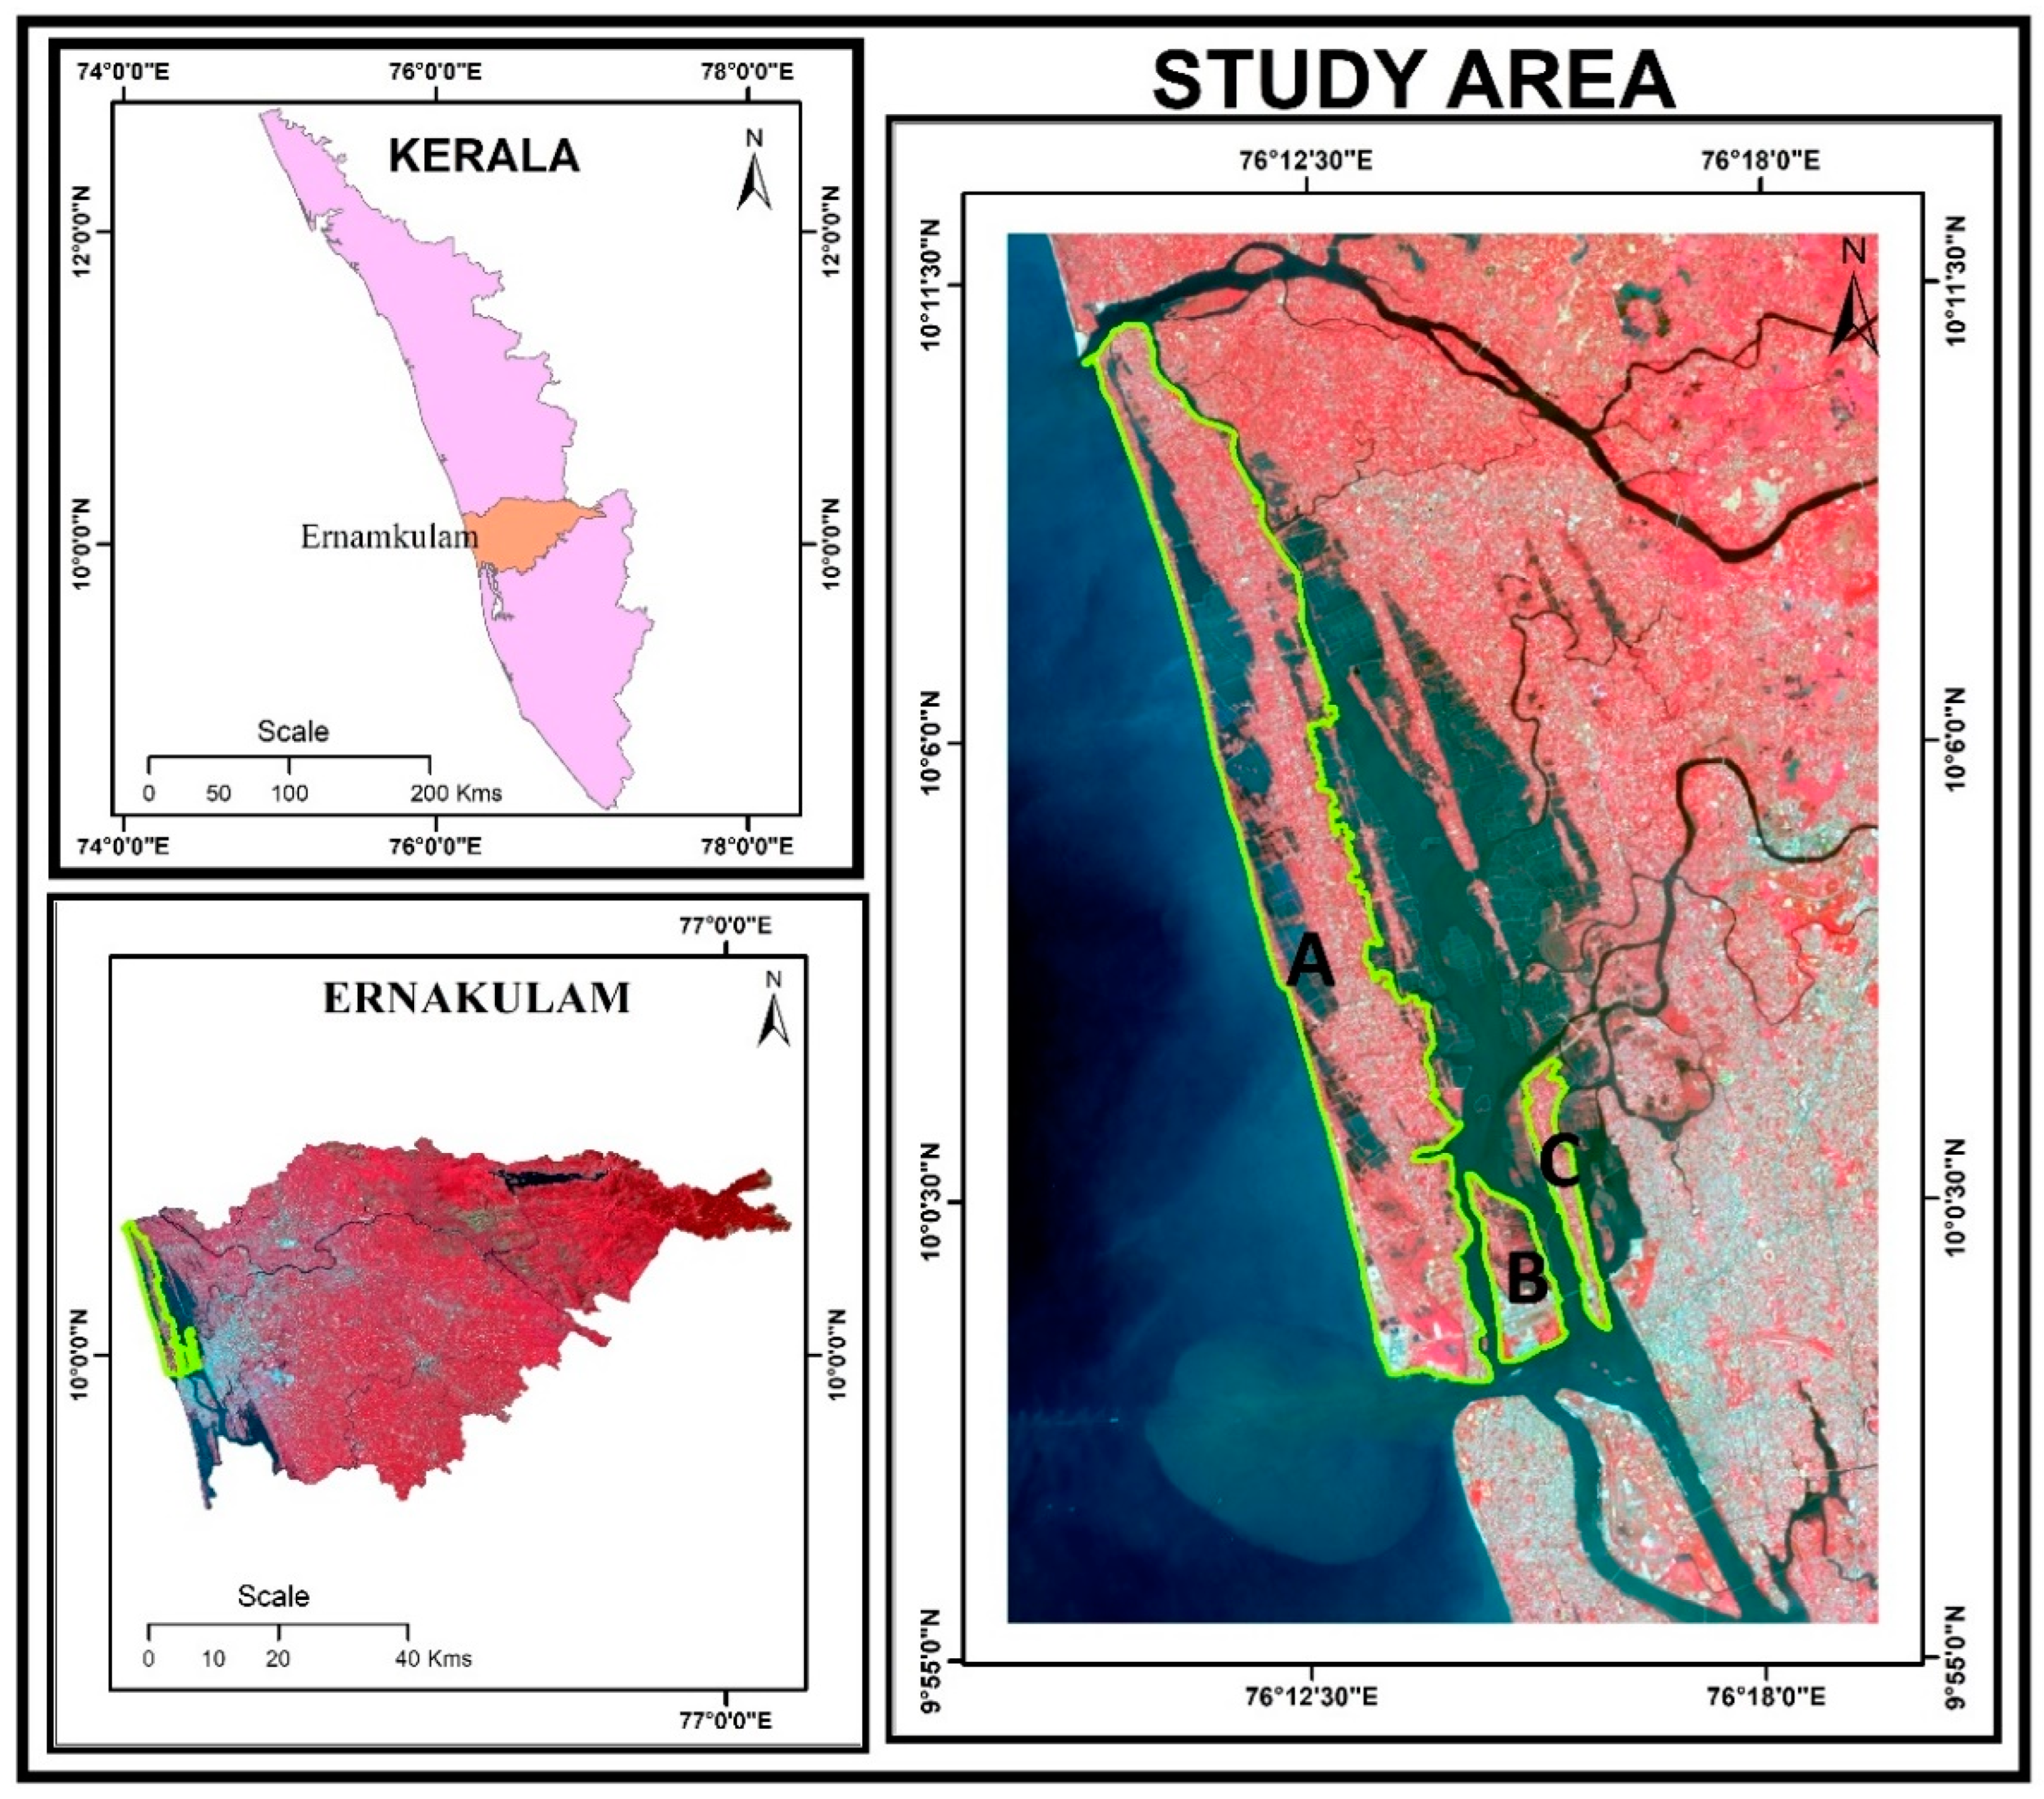
The study area chosen for the current study is Vypin, Vallarpadam, and Bolgatty islands, and they are one of the groups of islands that belong to the Cochin estuary in the South Indian state of Kerala (
Figure 1). Puthuvype Island, Bolgatty Island, and Vallar Padam Islands are prominent landforms within the Cochin estuary, grappling with dense populations and a host of environmental issues such as coastal erosion and increasing sea levels caused by both human activities and natural phenomena. It is for this reason that we have selected these islands as the focus of the study. In
Figure 1, there are two distinct areas depicted, with one appearing more like a section of the mainland than a standalone island. The second area, known as Wellington Island, is positioned between two mainland regions and is notable for its designation as a heavily guarded military zone. It is located in Lake Vembanad, known locally as Lake Kochi. These islands are one of the most densely populated islands in Asia (7348/km
2). Vypin Island is about 27 km long and linked to Kochi by a sequence of bridges known as the Goshree Bridges, starting at Kalamukku in Vypin, entering two other islands, and ending at Marine Drive, covering a total distance of about three kilometers.
The western coast of Vypin, namely Cherai Beach, has Kochi’s longest beaches, including Cherai, Kuzhuppilly, and Puthuvype Beaches. Munambam is home to the Munambam Fishing Harbor, Kochi’s largest fishing harbor, at the northern tip of Vypin. The southern edge of Vypin is called Puthuvypin, a growing suburban area of Kochi city. It is the largest industrial hub because of several industrial projects happening there, including the BPCL plant, the LNG Terminal, and the IOC bottling plant. Vallarpadam is one of the two islands, the other being Wellington Island, surrounded by Kochi Harbor. The port’s International Container Transshipment Terminal is entirely on the island of Vallarpadam. The island of Vypin lies on its west side, and the island of Mulavukad lies to the east. Bolgatty Island is on the eastern edge of the Cochin estuary, surrounded by the backwater. This ecosystem is richly endowed with natural and socio-economic resources along the west coast of Central Kerala. The major landforms in the study area are barrier islands, sandbars, mud flats, strand lines, tidal flats, and Mangrove Swamps. The sea regulates shifts in wetland hydrology, which plays a major role in regulating migrant fauna. Therefore, given its ecological importance, this ecosystem should be managed.
2.1. Methodology
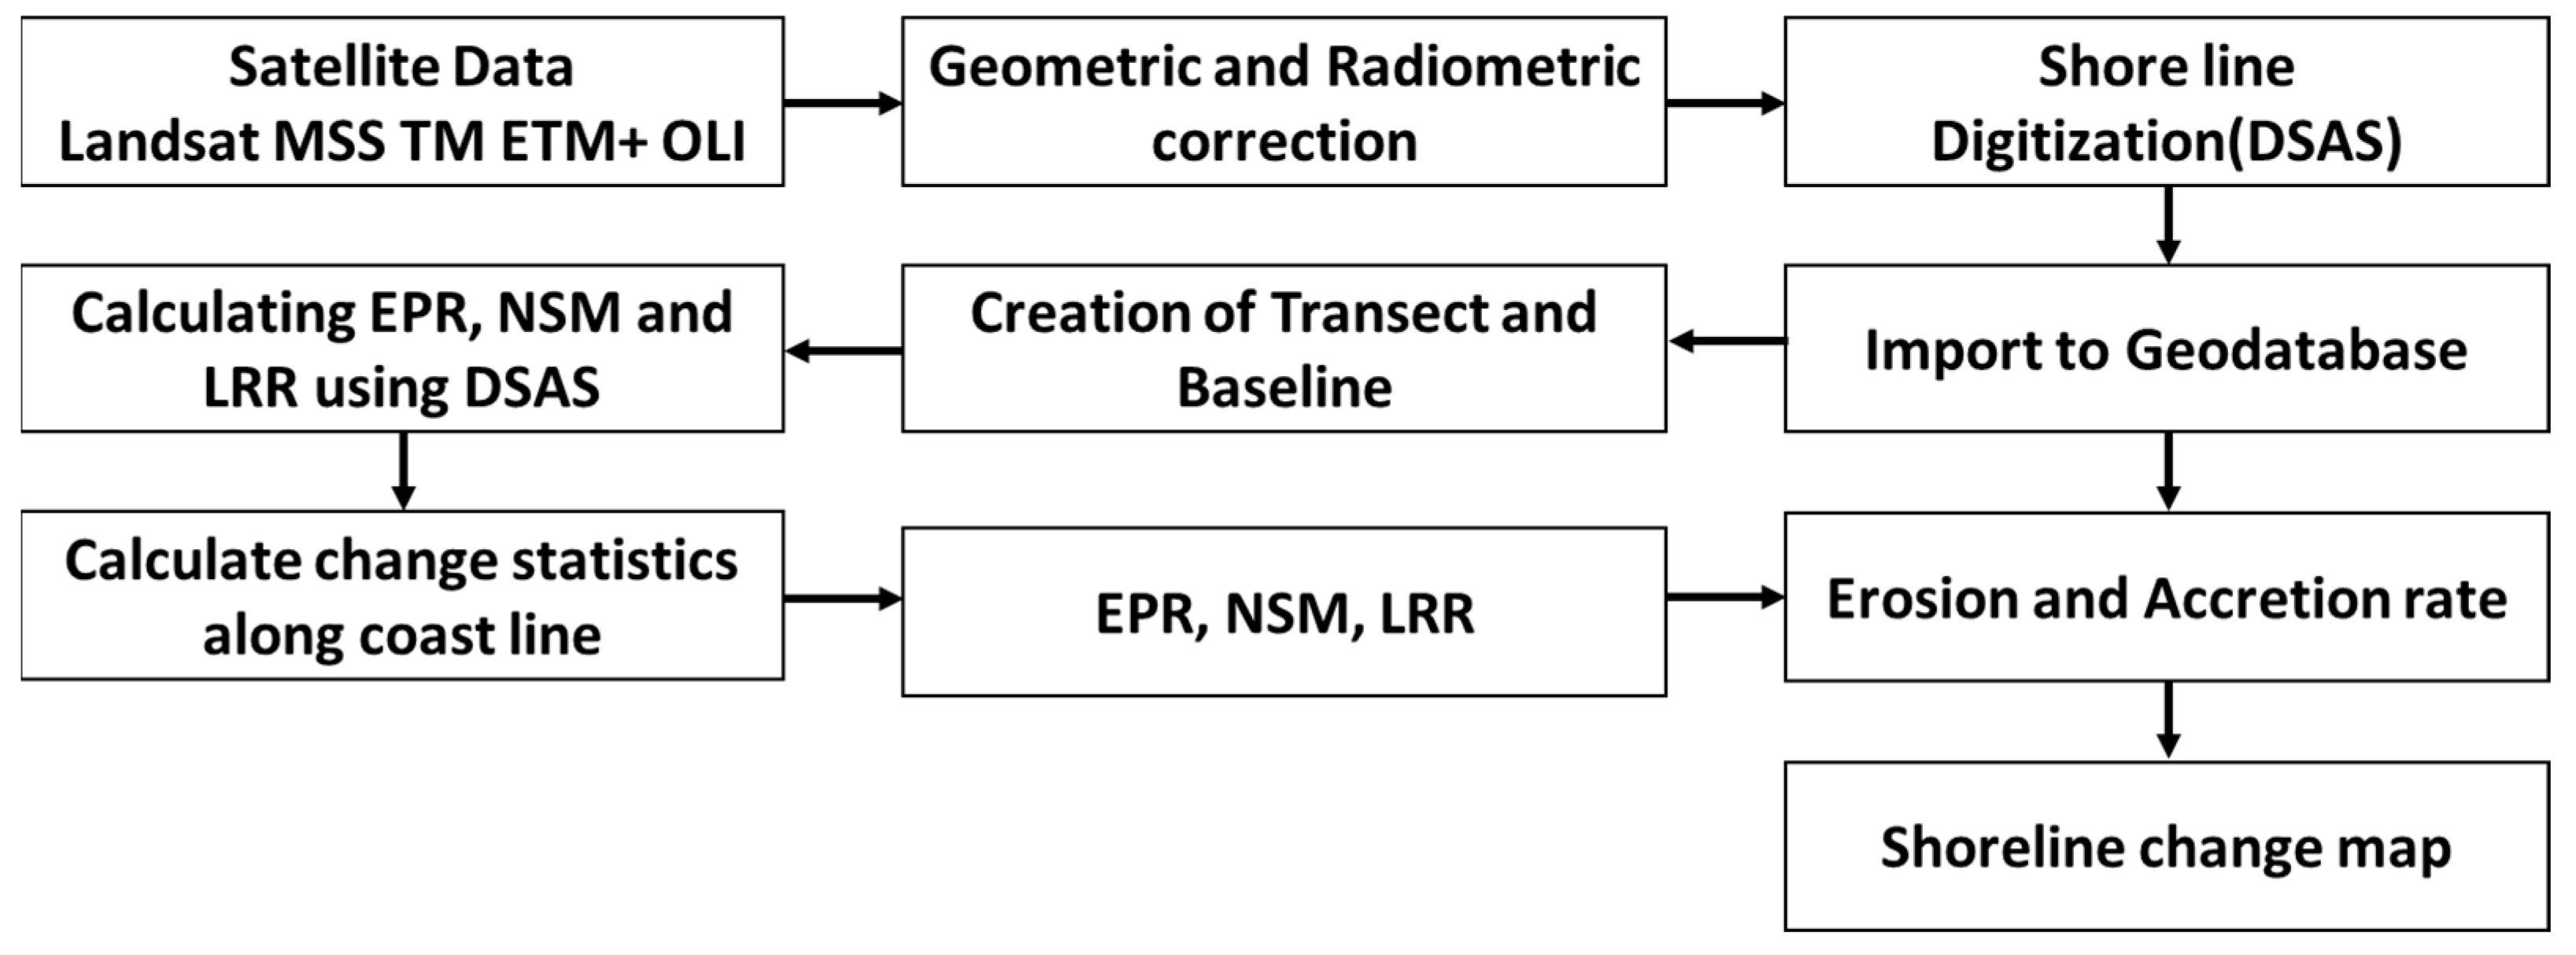
Shoreline delineation was done by adopting different methods, such as digital image processing, band masking, and on-screen digitization. The methodology is explained in the flow chart (
Figure 2).
Satellite images for the period from 1973 to 2019 were initially acquired, and from these 25 years, five multi-dated satellite images were used in this study to detect the shoreline changes methodology (1973, 2001, 2008, 2015, and 2019 years). However, the frequency of retrieval of satellite images was not uniform because of the lack of cloud-free images. The data used for the analysis were selected based on cloud parameters covering < 10% of the season during which the datasets were acquired. The current study focuses on the visual interpretation of images from five multi-dated satellite images. Primary and secondary images are pre-processed to accurately estimate the shoreline change rate. The downloaded images are georeferenced for registration and removal of geometric distortion. The edge enhancement process is carried out on the georeferenced image to delineate the shoreline for increasing the interpretability of the image because precise discrimination and monitoring of the shoreline for spatial and temporal (long-, short-term, and seasonal) changes are essential for understanding the coastal processes [
17]. Using ArcGIS, visually interpreted shorelines are digitized manually, exported as shapefiles, and projected into the same map projection system. The shoreline’s digitized shape files are stacked to get the shoreline change map and to perform the analysis of shoreline change detection. The trend of shoreline changes is analyzed through the use of the DSAS extension in Arc GIS. The DSAS allows end users to extract statistical data from shoreline changes from multiple shoreline positions over a time series of consecutive years. The DSAS has three main components: first, a baseline must be generated, an orthogonal transect must be implemented at user-defined intervals along the coast, and multiple shorelines must be developed. The current study deals with three major types of methods to evaluate shoreline changes in the study area: Linear Regression Rate (LRR), End Point Rate (EPR), and Net Shoreline Movement (NSM). Furthermore, by using the buffer technique, the baseline is prepared for landward with respect to the existing coastline. The baseline is the starting point for the DSAS application, casting all transects. Baselines can be built beyond the normal trend of the selected shorelines and perpendicular to them. The extension uses various codes to formulate transects and rates and to automate and systematically customize the user’s interface using the Avenue programming environment. The shoreline change rates, such as EPR, LRR, and NSM, have been described as follows [
18]. The EPR is quantified by dividing the length of the movement of the shoreline by the time between the periods, i.e., the earlier and the latest shorelines. The EPR’s main gain is its technical and procedural simplicity and limited information requirements about the shorelines (two shorelines). LRR was estimated by a regression line with least squares from the regression of all the similar shoreline points of the different periods for specific transects. The negative value of EPR and LRR indicates the rate of erosion, and the positive value indicates the vice versa (accretion).
2.2. Uncertainty Analysis
The negative and positive values obtained from the DSAS in the result depict erosion and accretion, respectively. As a result of the uncertainty factors, the performance of analysis using DSAS will have errors. The accuracy of such analysis on shoreline position and change rate in shoreline is influenced by several uncertainties, such as image resolution, image registration, digitization error, position of tidal level, and elevation-related issues [
19,
20]. In order to calculate shoreline positional accuracy (
Ea), each transect was calculated on the basis of Equation (1):
where
Es is the seasonal error,
Ew is the tidal level error, and
Ed is the digitization error.
Er is the rectification error, and
Ep is the pixel error. This method assumes that component errors are normally distributed [
21]. The total uncertainties were used as weights in the calculations of shoreline change. Values were calculated annually to provide an error estimate (
Eu) of the rate of shoreline change at any given cross section and are expressed by Equation (2):
where
t1,
t2, and
tn are the total shoreline position errors for the various years, and in this study,
T is the 25-year period of analysis.
3. Results and Discussion
3.1. Shoreline Changes Rate Using DSAS
The shoreline change calculation encompassed the entire Vypin, Vallarpadam, and Bolgatty coastlines and was based on visual representation. Shorelines were derived from satellite images captured in 1973, 2001, 2008, 2015, and 2019. The study’s findings are categorized into three primary shoreline operation types: depositional characteristics (accretion), erosional characteristics, and a stable condition without noticeable changes. These conclusions were arrived at through the utilization of statistical methods, namely EPR, LRR, and NSM. The results indicate numerous alterations to the shoreline during the specified study period, as presented in
Table 1. The results are represented as positive and negative variables, respectively, involving processes of accretion and erosion.
This study employed robust statistical methodologies such as EPR, LPR, and NSM (outlined in
Table 1) to assess and quantify the rates of shoreline alteration. These methods are recognized as reliable indicators for understanding and scrutinizing such dynamic changes in the shorelines. The outcomes derived from this analysis reveal considerable and substantial shifts in shoreline configurations over the designated study timeframe. The findings underscore the profound transformations experienced by the study area, characterized by notable marine transgressions and erosional phenomena during the observed period. These outcomes are elucidated through a dichotomy of positive and negative variables, denoting accretionary and erosional processes, respectively. The Kerala coastline, renowned for its distinctive attributes including Lateritic cliffs, expansive beaches, meandering estuaries, rocky headlands, offshore formations, lagoons, spits, and bars [
22], plays an influential role in governing these shoreline dynamics. The expansive presence of lagoons, backwaters, sand ridges, and barrier islands serves as indicators of a dynamic coastal milieu characterized by historical accretional and erosional shifts (transgressions and regressions) over geological epochs.
These islands generally showed a drastic shoreline shift, where marked accretion is evident. The islands are subject to an accretion cycle with very low levels of erosion. It should be noted that this is caused by marine tidal forces (a possible reason for this is that in 2004, tsunami waves hit these shores) and coastal anthropogenic activity. The accretion on Vypin Island brings about the shifting of the shoreline in a seaward direction [
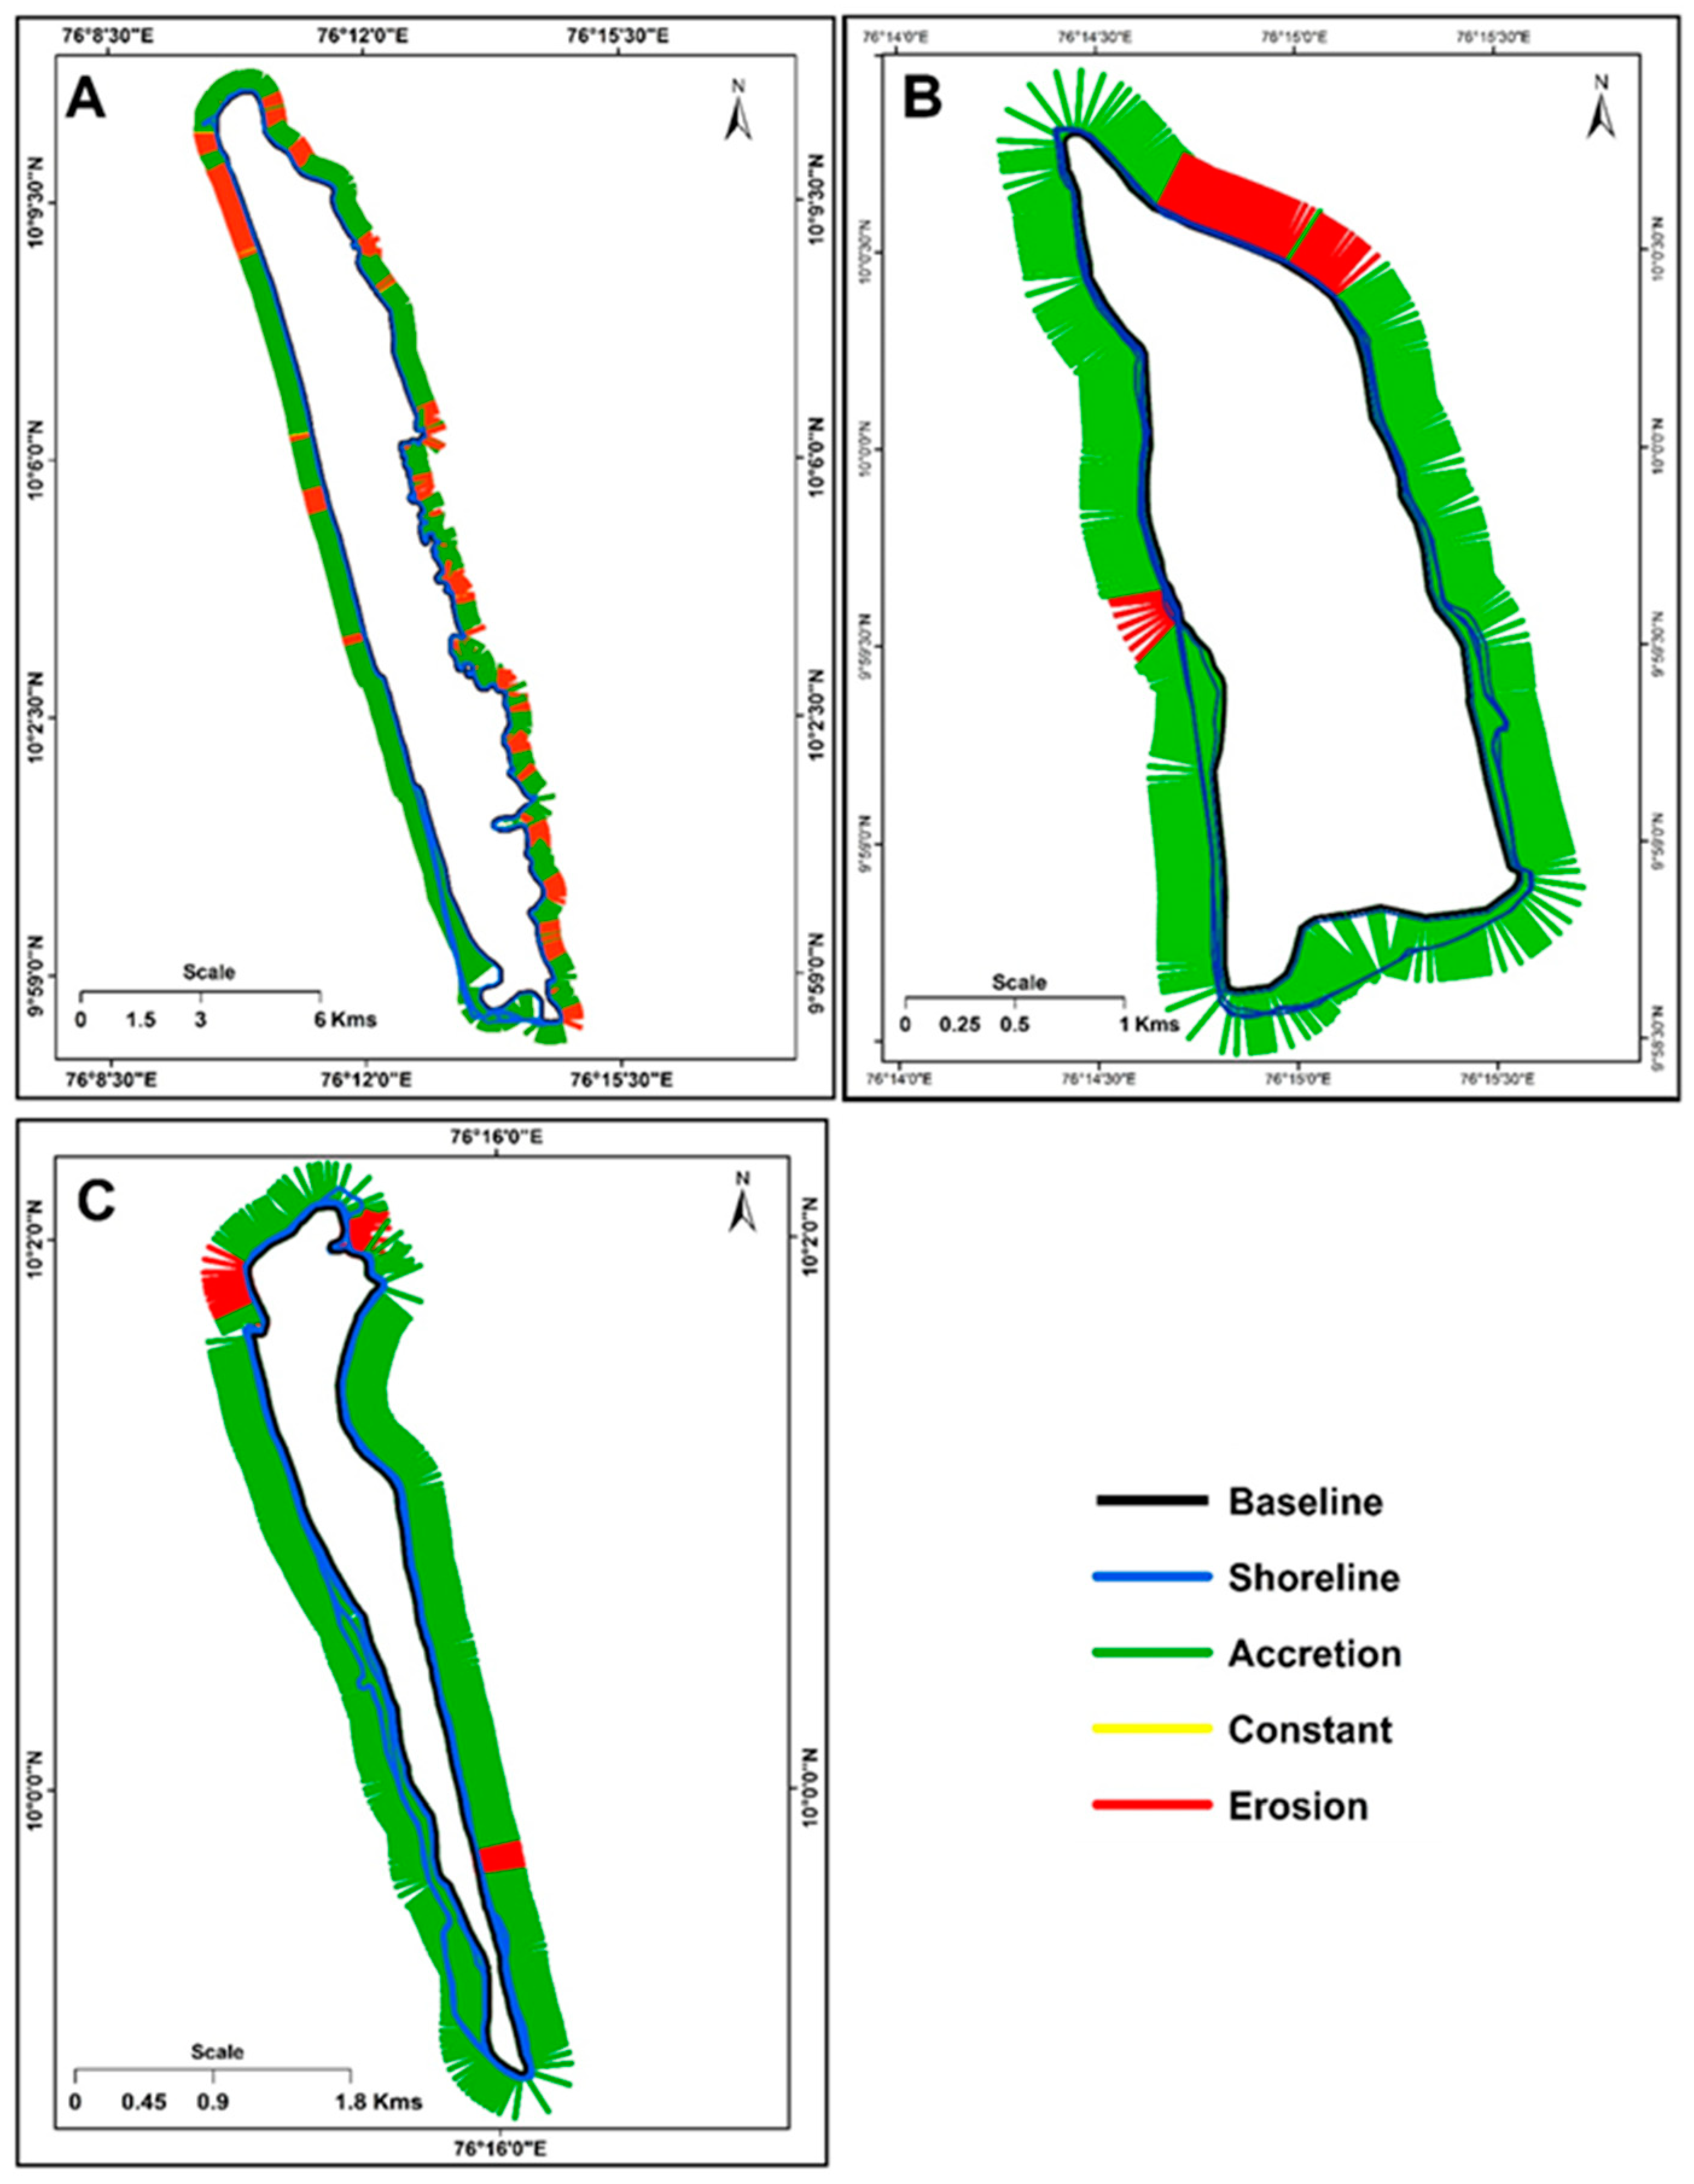
23]. At the same time, the islands of Vallarpadam and Bolgatty showed a dramatic shoreline change from 1973 to 2019. There is the fastest accretion process in the southern part of the islands of Vallarpadam and Bolgatty, and minimal erosion was noticed on these islands from 1973 to 2019 (
Table 1,
Figure 3). The islands have maximum accretion throughout the section. However, there are very few erosion activities on the northwest and northeastern sides of the Vallarpadam and Bolgatty islands, which might be due to the effect of backwater and other anthropogenic activities (
Figure 4).
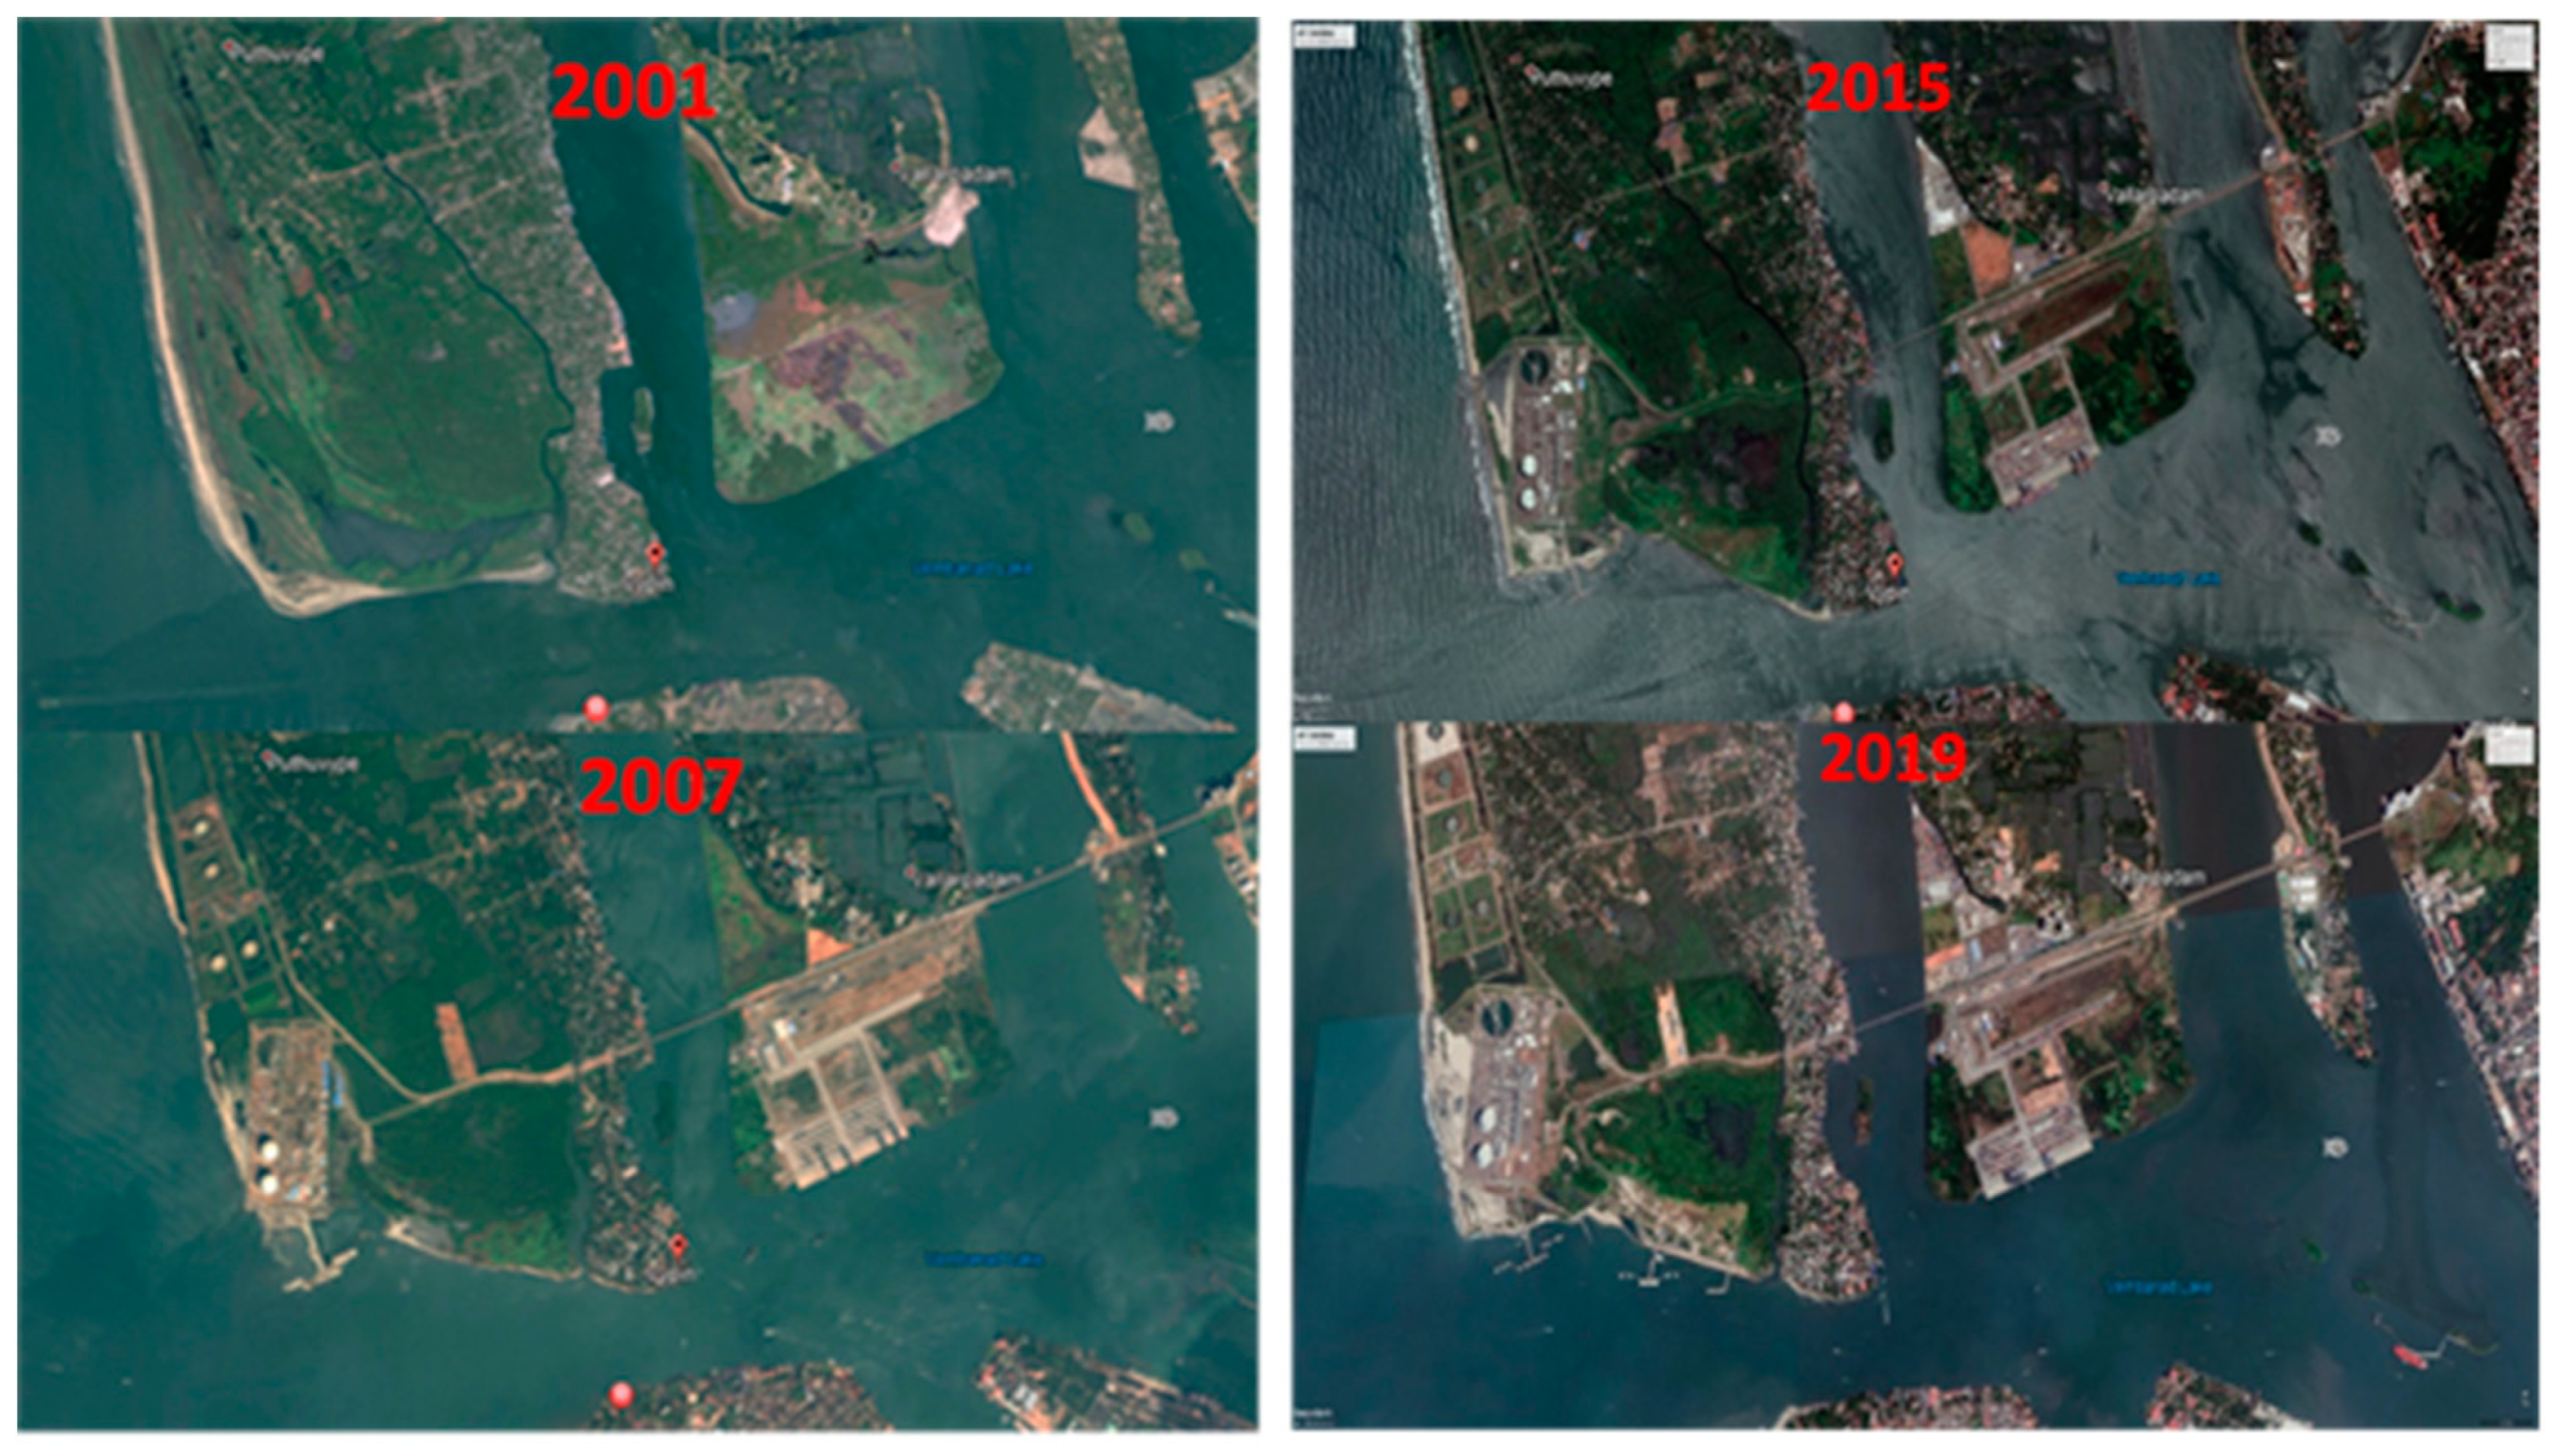
The southern section of Vypin Island experienced the most rapid accretion between 1973 and 2001. However, following 2001, a gradual shift towards the opposite direction was observed, primarily along the southwestern edge of Vypin Island. This shift was predominantly limited to this specific area of the island and may have been influenced by tidal and anthropogenic activities in the region. It’s worth noting that the 2004 tsunami is a potential contributing factor to these alterations [
23]. Furthermore, after 2005, the construction of an oil refinery in this vicinity, as evident in
Figure 5, could have significantly impacted coastal processes and, consequently, shoreline dynamics. This industrial development resulted in pronounced accretion after 2001, with the exception of this particular zone (
Figure 5).
The changes from 2015 to 2019 also showed the maximum accretion processes on the shoreline, which is again attributed to the construction of a jetty in this area (
Figure 5), which is evident from the NSM, LRR, and EPR values from 2015 to 2019. Tidal deposition, backwater deposition, and human activity are reflected in Vypin Beach, Northwest Edge, and the eastern part of Vypin Island. All these activities resulted in limited erosion activity. These interpretations have arrived at the basis of the images selected across the timeline, and the images were selected on the basis of data coverage, cloud cover, and interpretability. However, a word of caution is that the results may differ if the time period is different since the Net Shoreline Movement (NSM) is determined by examining the earliest and most recent shorelines between the selected periods. To avoid this, care has been taken to keep the starting year consistent across the islands chosen, so that comparison is possible.
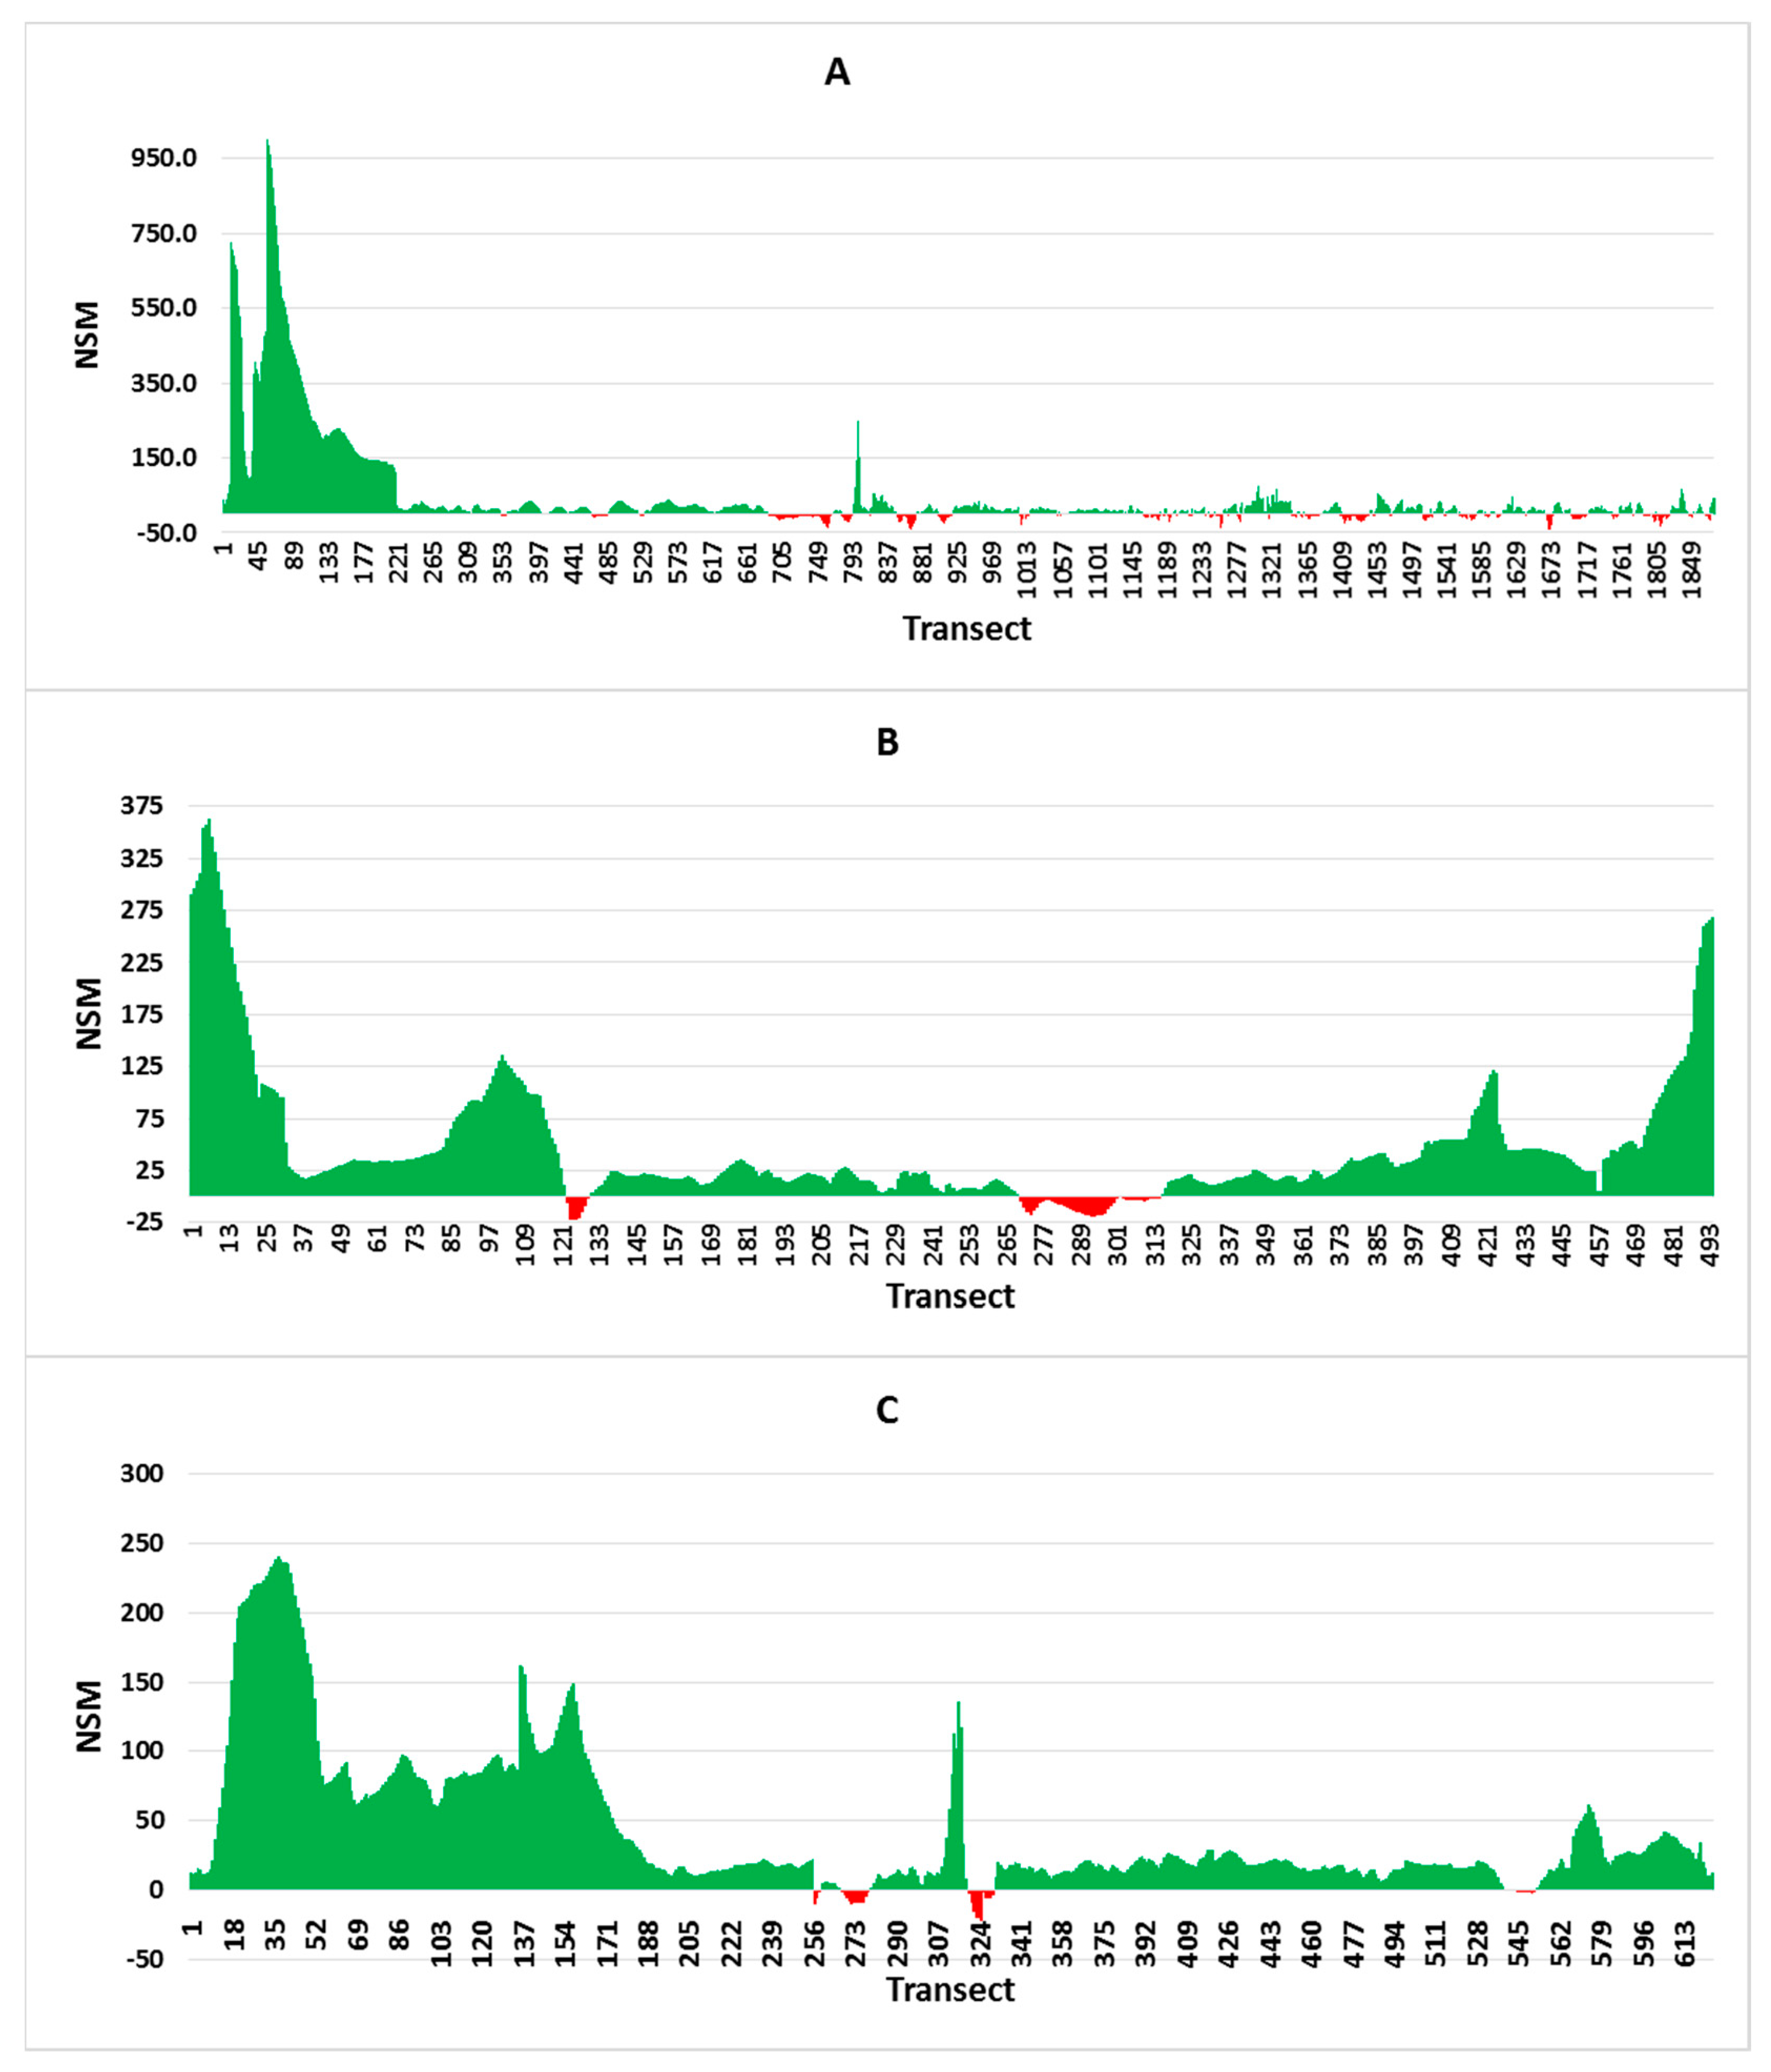
3.2. Net Shoreline Movement (NSM)
Net Shoreline Movement (NSM) is the distance from each transect created between the oldest (1973) and recent years (2019). When analyzing the NSM rates of three islands, it can be shown that these islands were subjected to the process of accretion during the 1973–2001 period (
Figure 6). During the period 1973 to 2001, the NSM value of Vypin is shown to be minimal compared to other periods (
Table 1), which means the maximum accretion process happened during this period, and after 2001, the southern portion of the Vypin island showed a negative tendency, which, as earlier discussed, might be due to the tsunami and human activity.
Figure 5 shows changes in shoreline, land use, and human activity in the study area. During the period from 2001 to 2008, the NSM minimum value was −309.39, and from 2008 to 2015, the NSM minimum value was −263.6. This might have happened due to tsunami waves and anthropogenic activities such as infrastructure construction (building structures and oil refineries) on the southwestern edge of Vypin Island, where the shorelines are moved to the east. This movement is also strongly reflected in the NSM value. Due to these issues, the period of 2008–2015 also showed a −1.41 m mean value for Vypin Island. During this time, the minimum NSM values on the island of Vallarpadam are −41.44 and the average NSM values are −0.49, so the island of Vallarpadam also shows the eastward motion due to human and tidal activity. In the same period, Bolgatty Island showed low accretion activity compared to other times, meaning that this island also follows the same pattern as Vypin and Vallarpadam Island. Still, this island had high accretion activity compared to Vypin and Vallarpadam between 2008 and 2015.
This is because of the island’s position; there is no direct hit on the island of Bolgatty from tsunami waves, and there is a minimum of human activity on this island compared to other islands. This clearly states that in the aftermath of the 2004 earthquake on the west and east coasts of the Indian subcontinent and other Southeast Asian nations, tsunami waves and their impact combined with coastal sedimentation processes might have created the erosional/depositional impact [
24]. The intricate interplay of various physical oceanographic phenomena significantly governs the amplitudes of tsunamis. These phenomena encompass a spectrum of processes, including the convergence and divergence of tsunami energy prompted by bathymetric configurations, the occurrence of Helmholtz resonance within harbors, quarter wave resonance amplification, intricate interactions with tides, and the reflection phenomena originating from both the Lakshadweep Islands and distant coastlines such as Somalia in Africa.
The behavior of tsunamis can be deciphered through the synergistic interaction of diverse physical oceanographic mechanisms, notably constructive interference, boundary reflections, intricate couplings with internal waves arising from ocean density gradients, interactions with wind-generated waves, and the consequential effects of tidal influences [
24]. This comprehensive study illuminated that the magnitudes of tsunami waves in isolation do not suffice to elucidate the observed peak amplitudes directly. Instead, it was evident that local resonances and zones of convergence could augment these amplitudes in specific locations. The temporal occurrences of maximum amplitudes unequivocally highlight the substantial roles played by waves reverberating from the Lakshadweep Islands as well as the distant coast of Somalia on the African continent. Moreover, the interaction between the tidal forces and the tsunami wave field contributed significantly to this intricate dynamic. Notably, the influence of the reflected waves exhibited greater prominence along the northern expanse of the Kerala coast, in contrast to its relatively subdued impact on the southern counterpart [
24]. As stated in earlier studies, the tsunami might have caused a substantial exchange of materials from the shelf and near-shore zones to the beach and marine environments [
25] as the waves were diffracted, hence not having a direct impact. Maximum accretion activity is shown from 1973 to 2019; there is maximum positive shoreline movement of three islands in these 30 years (
Figure 6), and generally, these three islands are developing day by day due to tidal and human forces.
Shoreline changes are subject to a multitude of influences, stemming from both natural forces and human activities. These transformations can manifest across varying timeframes and carry substantial consequences for coastal ecosystems. Noteworthy factors driving shoreline alterations in the study area include wave, and current dynamics, wind patterns, tidal fluctuations, sea level fluctuations, the effects of climate change, geological and geomorphological characteristics, anthropogenic interventions, activities such as dredging and sand mining, as well as the encroachment of urbanization, among others.
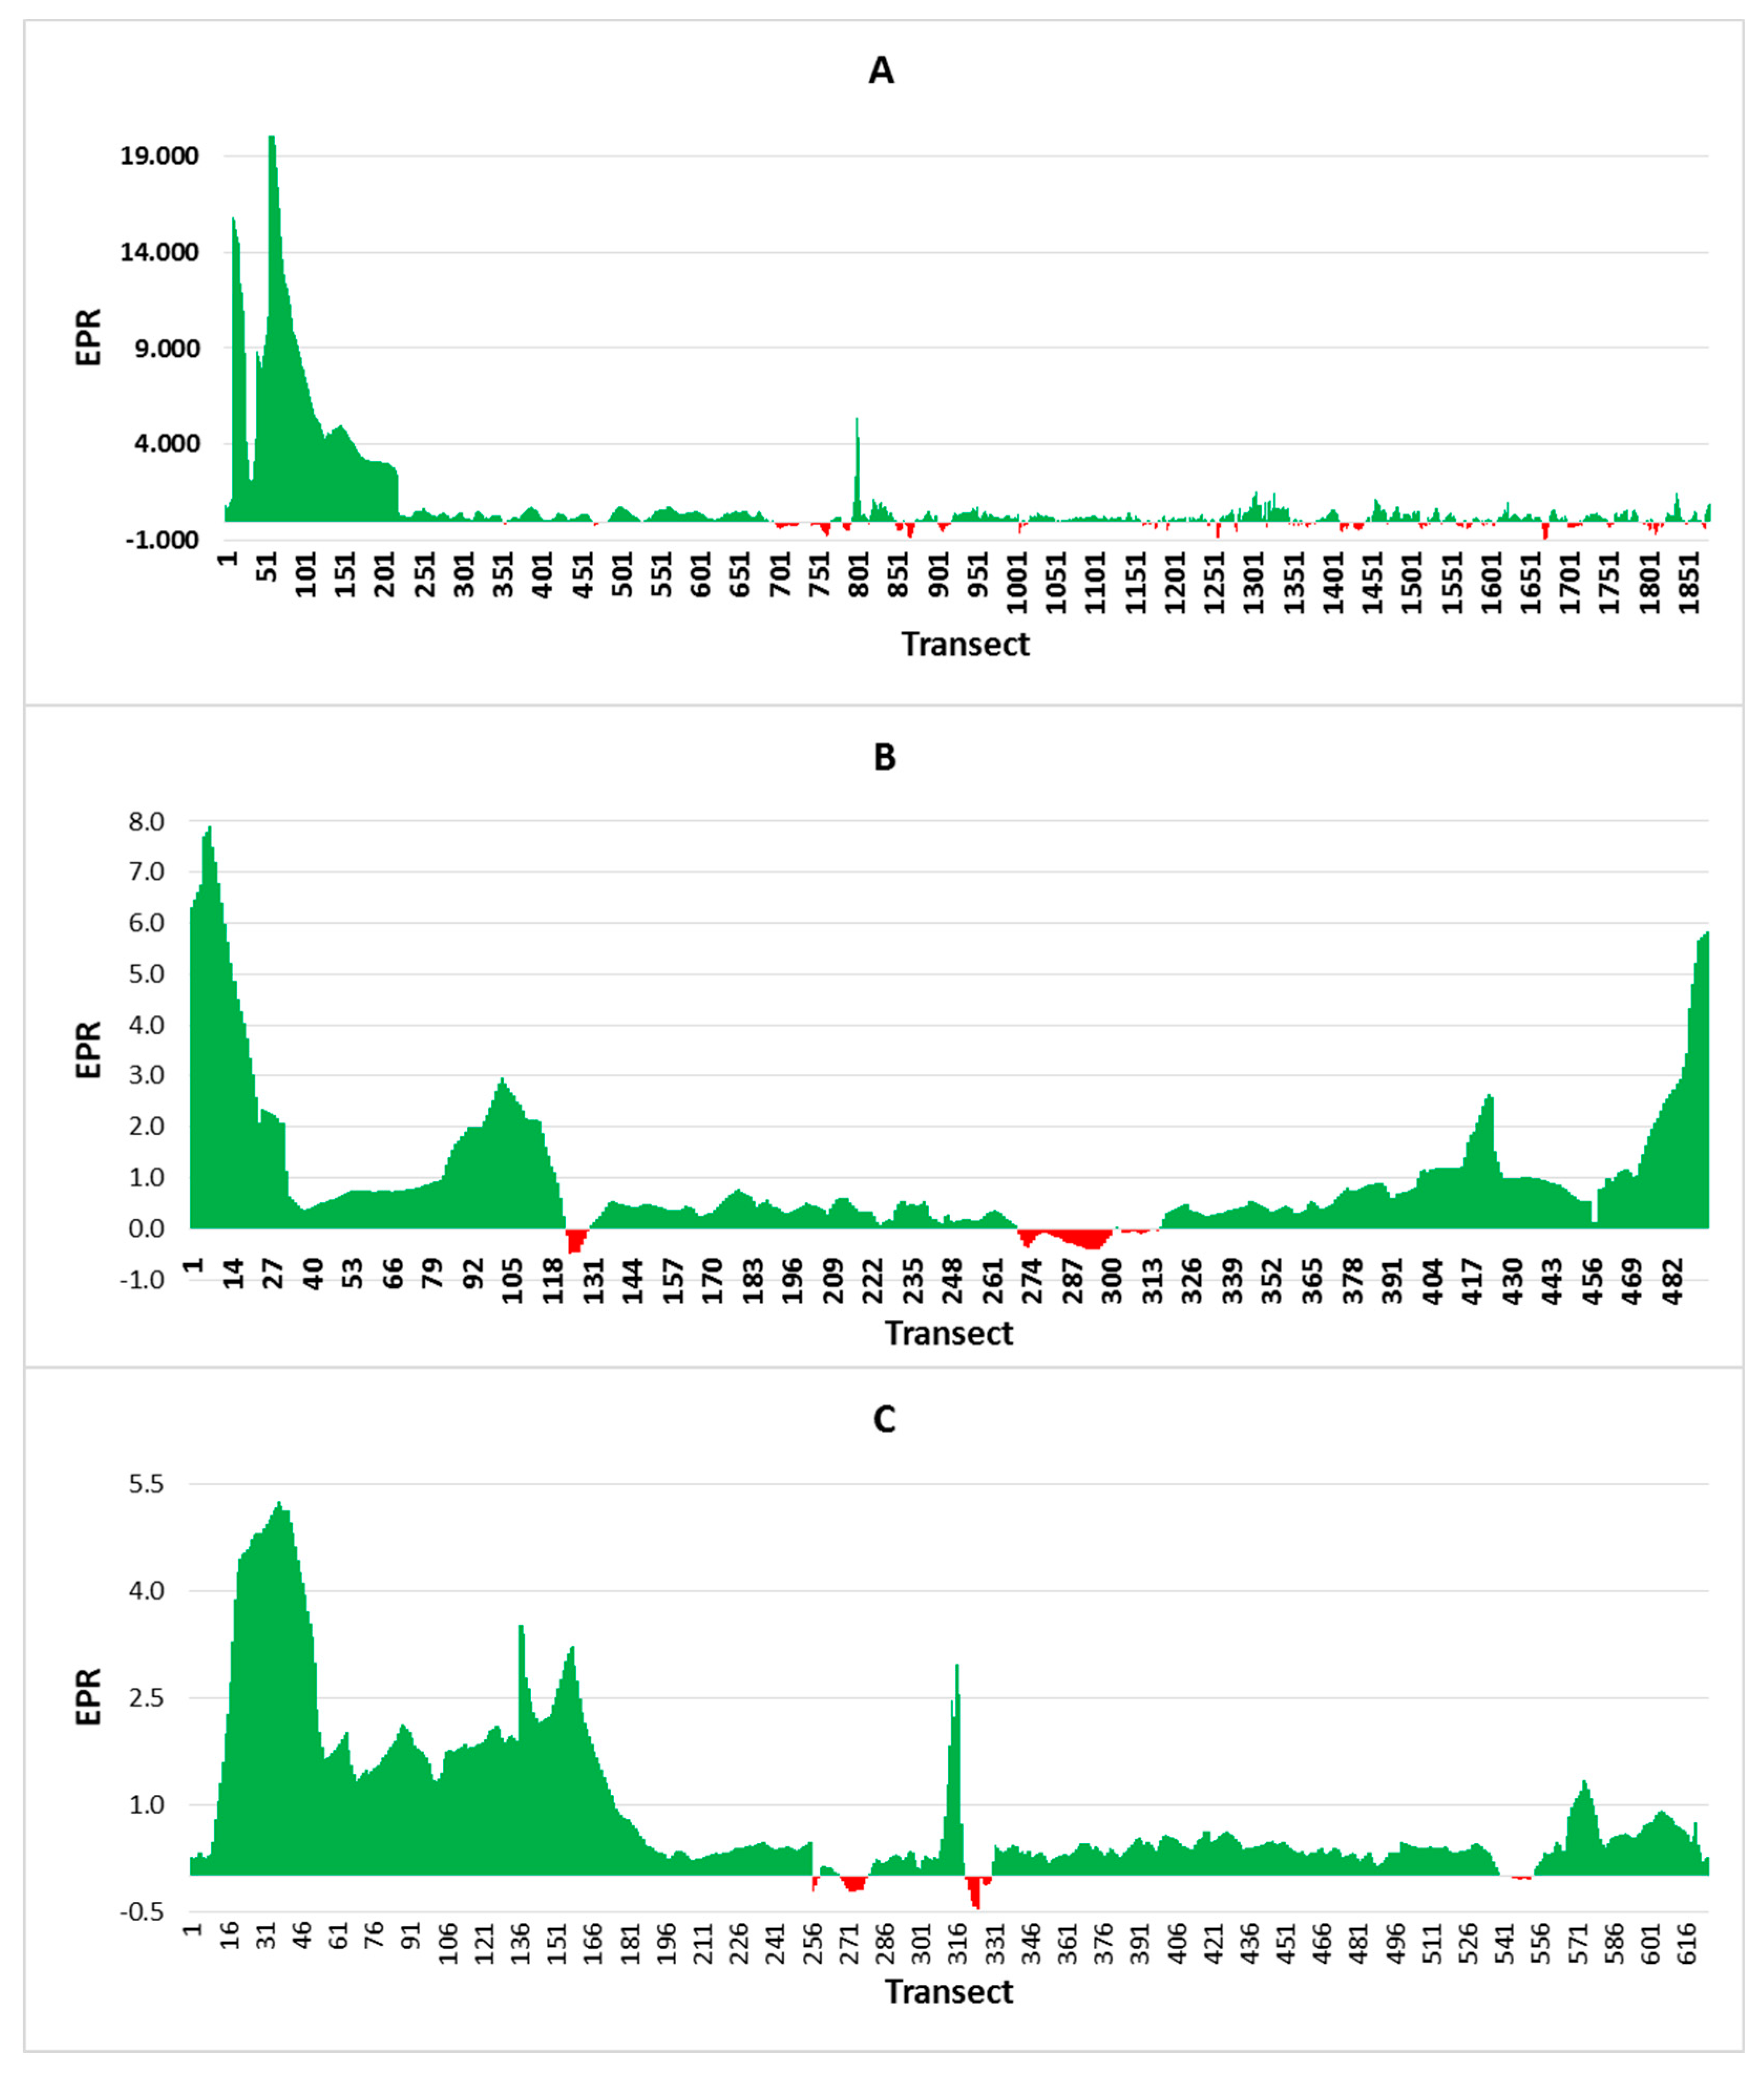
3.3. End Point Rate (EPR)
The EPR is calculated by dividing the distance between the oldest and the latest shoreline by the time (DASA V.4.3). During the period of 1973–2001, the Vypin island showed a minimum EPR rate of −1.87 m, and peak erosion levels were shown in the period 2015–2019 with −64.3 m. It is observed that the period 2015–2019 is the year of high erosion compared to the rest of the period. This again shows human activities’ effect on islands and the beach. However, during this time period, erosion occurred in a limited area of the islands of Vypin, Vallarpadam, and Bolgatty, which is justified by mean EPR and NSM values (
Table 1). This indicates low erosion throughout the islands in this time-limited area, indicating high erosion compared to 2008 to 2015. The mean value of EPR from 2008 to 2015 shows a negative value due to southern edge erosion and some other areas of these three islands, and a vast area was eroded from 2008 to 2015 compared to 2015 to 2019. The process was already taking place from 2001 to 2008, during which oceanic and human activities eroded the southern edge of these islands. After this time, the same process was also reflected.
Figure 3 shows maximum erosion activity on the southern edge of Vypin Island from 2001 to 2008, which is also reflected in EPR values (
Table 1). During 2001, the southern edge of the Vypin shoreline was most extended to the sea (green line), but when it reached 2008, it revealed a dramatic shift in erosion due to this, and the coastline appeared within the islands (
Figure 4 and
Figure 5). This again confirms the reality of the effects of the tsunami on the wetlands and beaches following the Indian Ocean tsunami of 2004 on December 26, with a wave height of more than 5 m. During this time, peak erosion occurred due to the direct effects of tsunami waves. However, human activities have also been affected to help increase erosion over the years. There is peak erosion activity for the Vypin Islands and the mean EPR value also indicates a minimum of 1.18. For Vallarpadam Island, Bolgatty was partially affected by the tsunami because the islands of Vallarpadam and Bolgatty are located inside the backwater. Maximum accretion activity is shown from 1973 to 2019, and there is maximum positive shoreline movement of three islands in these 30 years (
Figure 7). Generally, these three islands are developing day by day due to tidal and human forces. These erosion or accretion conditions are then subject to the larger-scale control exerted by alongshore adjustments between net sediment supply or availability, wave and current energy, and sediment redistribution by waves and currents [
26,
27,
28,
29].
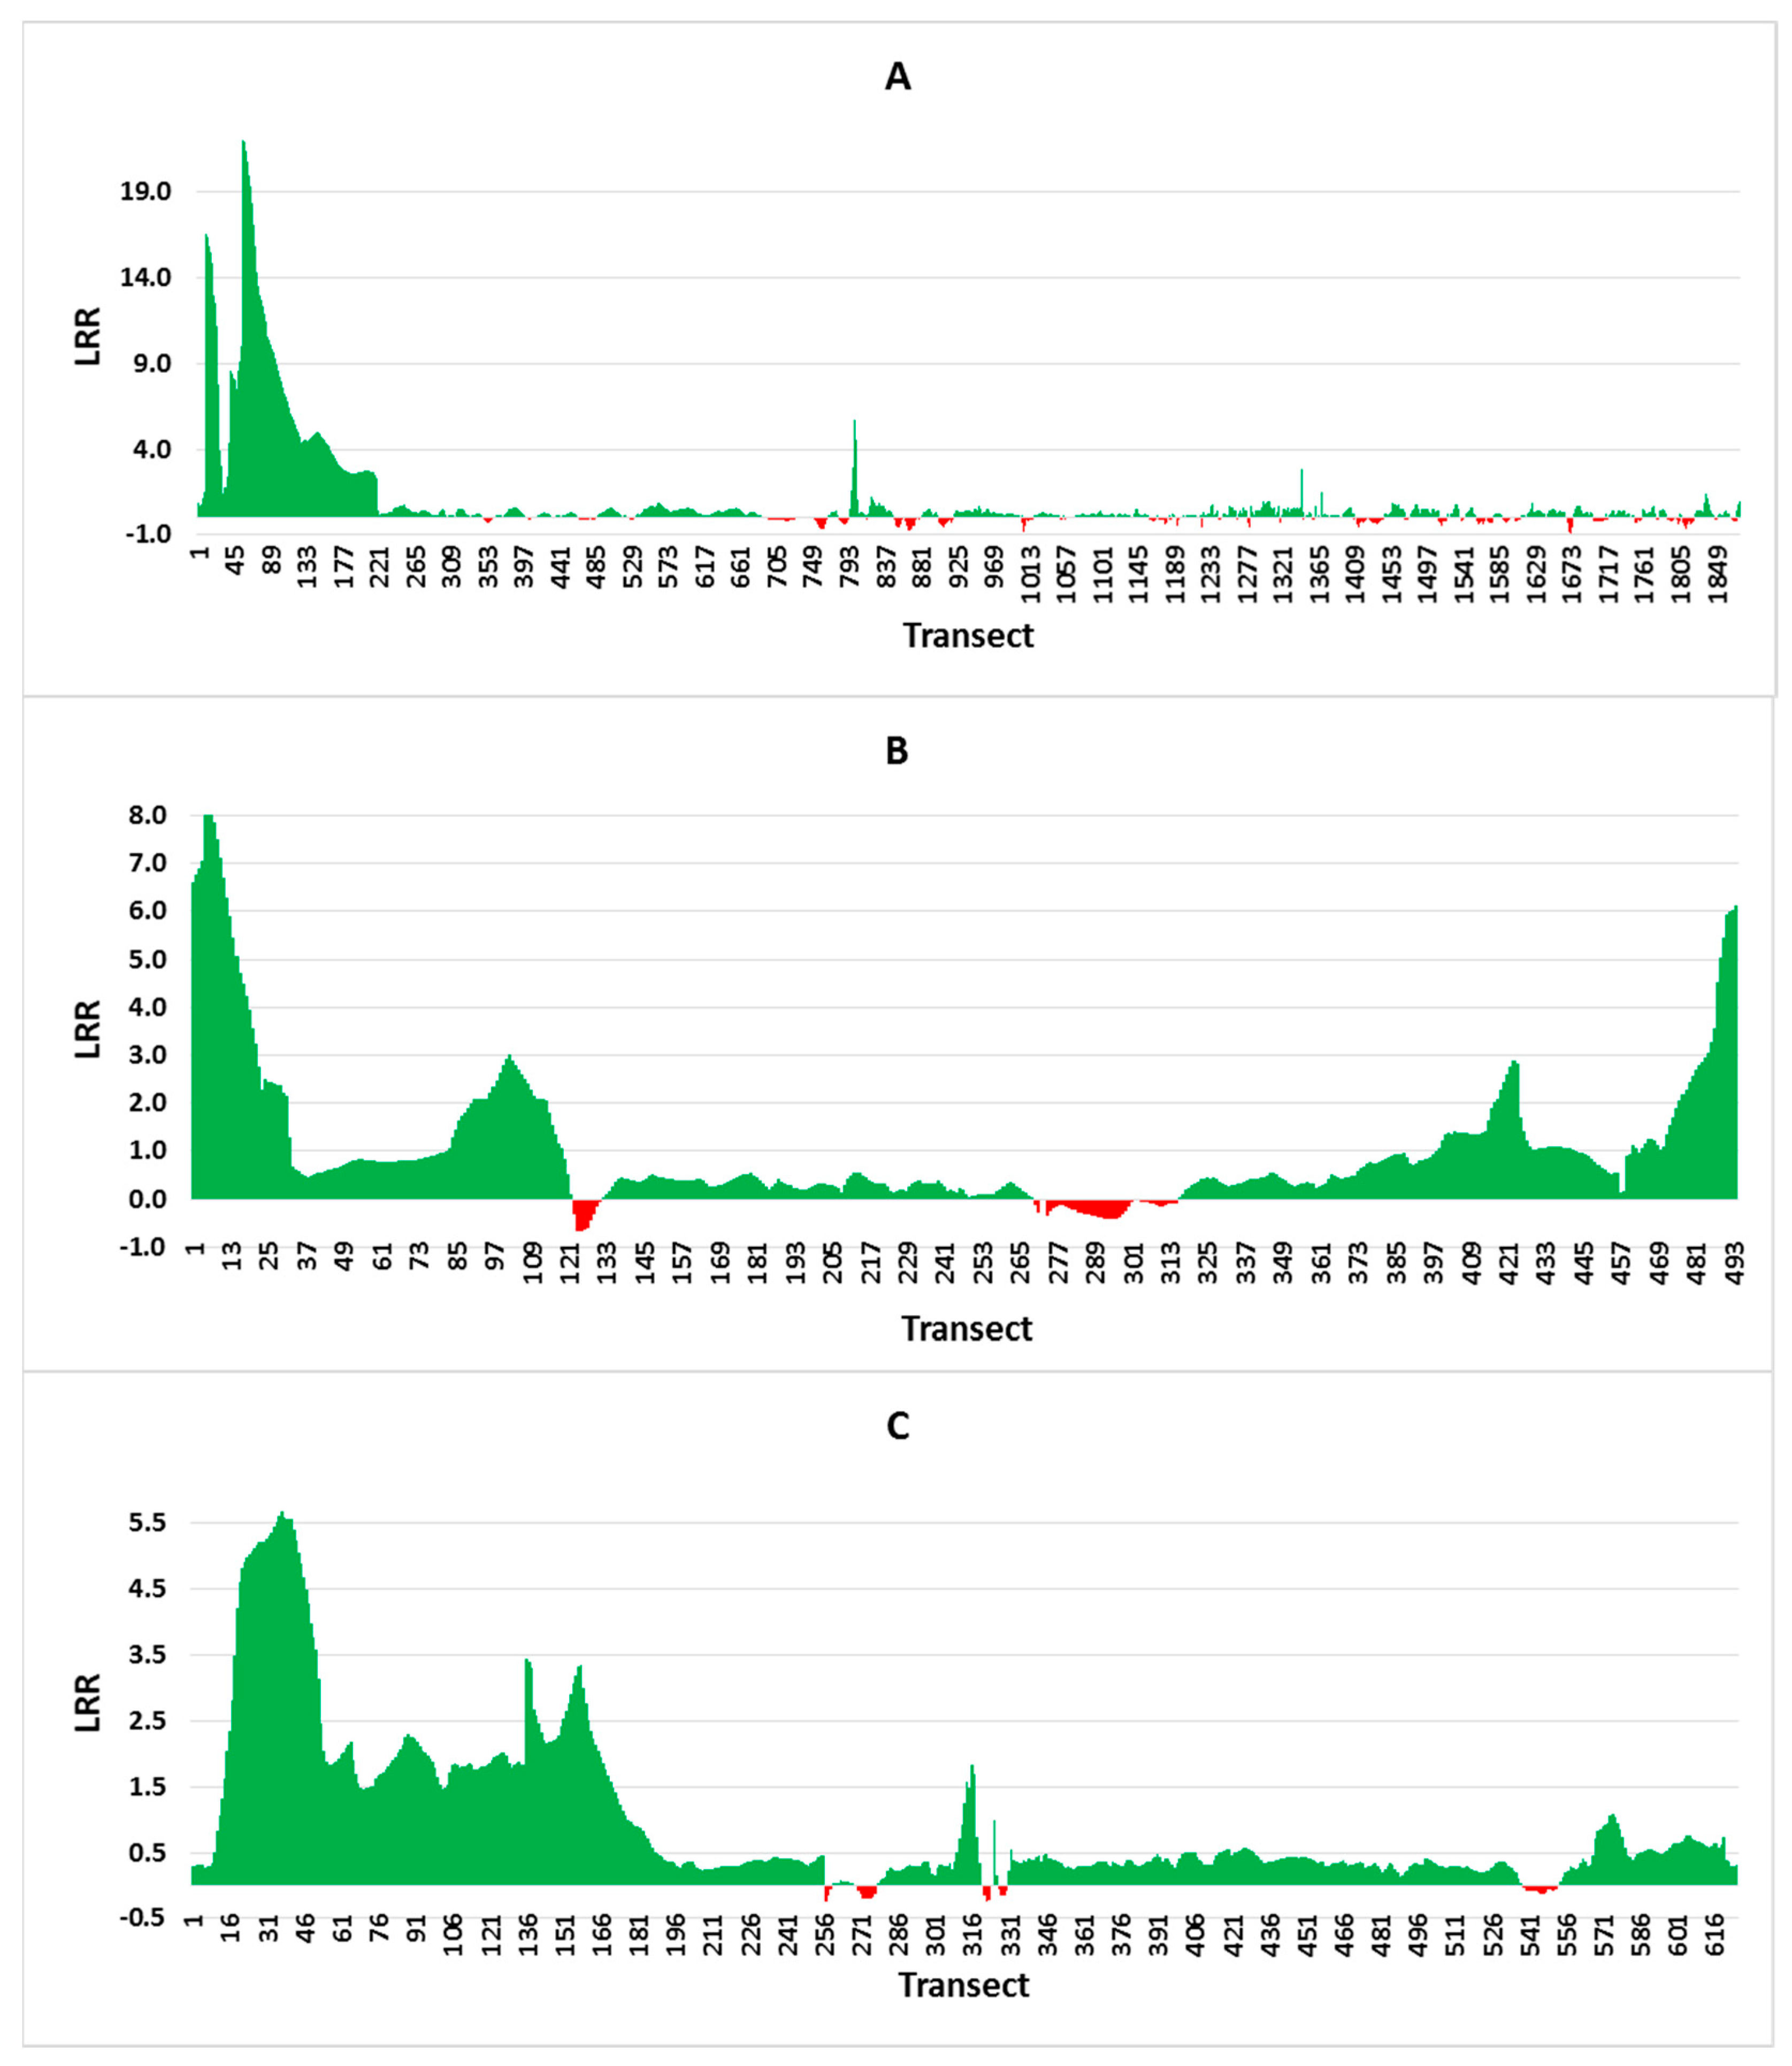
3.4. Linear Regression Rate (LRR)
Table 1 provides a detailed overview of the linear regression frequency and the average levels of shoreline transition for the three islands. The LRR is calculated based on the least squares regression line fitting all shoreline points for a given transect. To calculate the sum of square residues, the regression line is fitted in the computation process, and the slope of the line indicates the linear regression rate [
28]. Vypin mean LRR values indicated an LRR of 0.97, which was subjected to deposition during the study period. All the islands in the study area have positive values that indicate depositional activity.
Figure 4 displays the graphical representation of three islands by LRR. These graphs show that Vypin Island’s maximum value is 22.13 and its minimum is −0.93. The maximum mean value of LRR found on the island of Vallarpadam is 1.03, and at least 0.95 on the island of Bolgatty. This is supported by high accretion rates on Vypin, Vallarpadam, and Bolgatty Island from 1973 to 2019 (
Figure 8).
The analysis of uncertainty reveals that the highest annualized uncertainty, when employing the best estimate, stands at ±0.37 m per year. This finding underscores the presence of a notable level of uncertainty associated with the measurements and predictions within the study. This uncertainty may emanate from diverse sources, including measurement methods, data quality, or the inherent variability within coastal processes [
29,
30,
31,
32]. This underscores the ongoing need for the development and utilization of more accurate and precise methodologies for the investigation of coastal erosion and deposition.
3.5. Way Forward with Suggestions
The results showed that there is a pressing necessity for the formulation of comprehensive coastal management plans that effectively address issues of erosion and deposition. These management plans play a pivotal role, serving as invaluable tools for local self-governing departments (LSGDs) to not only identify these challenges but also to strategize for the impact of climate change while developing plans for adaptation and mitigation within their respective regions. Kerala, being a front-runner in the implementation of the three-tier planning process, can make these planning processes included in the budget preparation of LSGDs.
Coastal zones, as profoundly populated and dynamic natural landscapes, bear a tremendous influence on the livelihoods of numerous individuals. Consequently, it becomes imperative to chart out meticulous coastal zone management actions. Historically, the management of accretion and erosion within coastal zones has been predominantly reactive in nature, often neglecting the potential existence of long-term trends [
32,
33,
34,
35]. However, the contemporary landscape has evolved due to the influence of climate variability and extremes, driving a shift towards more proactive management plans that encompass extended temporal horizons. This approach is pivotal in formulating appropriate adaptation strategies that can effectively address evolving challenges.
The exemplars set by countries such as the UK and the Netherlands, where shoreline management plans extend over century-long timescales, serve as a testament to this proactive shift. This strategic evolution is a response to the increasing need for resilience against climate-induced alterations, demonstrating the paramount importance of comprehensive, future-oriented coastal management.
In summary, the study’s revelations underscore the critical requirement for robust coastal management plans that holistically address erosion, deposition, and the intricacies of climate change. By transitioning from reactive measures to proactive, forward-looking strategies, coastal regions can better prepare for the challenges of the future, ensuring the sustenance of both natural ecosystems and the livelihoods of the people reliant upon them.
Already, the state of Kerala has implemented the Integrated Coastal Zone Management (ICZM) policy, which deals with the development of an effective Integrated Coastal Zone Management (ICZM) framework with a comprehensive and holistic approach that takes into account the ecological, social, economic, and governance aspects of coastal areas. The successful implementation of this comprehensive framework will require strong political commitment, adequate funding, and a long-term perspective to ensure the sustainable development and protection of coastal zones.
4. Conclusions
Coastal managers must devise optimal strategies for adapting to and preserving this delicate ecosystem. To achieve this, they require accurate information pertaining to various aspects of coastal areas, encompassing spatial and temporal alterations in morphology. This information needs to be correlated with the vulnerability of the coastal population, which may be exacerbated by additional stresses stemming from extreme events or climate change processes. Satellite technology offers a comprehensive viewpoint, delivering data at regular time intervals. This facilitates the continuous monitoring of shoreline evolution on a regional scale over multiple timeframes. The current study reveals the following points. It can be mentioned that, from data obtained from various satellite images collected during the study period (1973–2019), there is maximum positive shoreline movement of three islands in this 36-year period. Generally, these three islands are developing day by day due to tidal and human forces. To conclude, from 1973 to 2001, these islands showed the maximum accretion process, but from 2001 to 2015, drastic erosion activity was noticed on the southern edge of Vypin Island. Overall, the study confirms that these coastal islands suffered a greater impact, and accretion on both sides led to the formation of new land on these islands. The long-term analysis showed that these islands have been subject to marine transgression and have been subjected to accretion in the case islands, and this is attributed to the anthropogenic impacts. The coastal zone is known for its dynamic nature, and in Kerala, these areas are heavily populated with high density and are intensely used. The coastal islands are treated as an asset to those who rely on them since they provide a wide range of essential services and products. However, because of the pressure exerted by these anthropogenic activities, these coastal islands pose a constant threat. Hence, regular monitoring of shoreline changes is essential to update our perception of the changes on the coastline and to take practical management actions to protect these islands, and this can be brought under the Integrated Coastal Zone Management (ICZM) policy framework for the sustenance of the same.


 ,
, 

