Article

Feature Extraction Algorithm of Massive Rainstorm Debris Flow Based on Ecological Environment Telemetry

1
School of Civil Engineering, Sichuan University of Science & Engineering, Zigong 643000, China
2
Gongqing Institute of Science and Technology, Gongqingchengshi 332020, China
3
School of Civil Engineering, University Teknologi MARA, Shah Alam 40450, Selangor, Malaysia
4
School of Civil Engineering, Henan Polytechnic University, Jiaozuo 454003, China
*
Author to whom correspondence should be addressed.
Water 2023, 15(21), 3807; https://doi.org/10.3390/w15213807
Submission received: 21 August 2023 / Revised: 7 October 2023 / Accepted: 26 October 2023 / Published: 31 October 2023

Abstract

:
In order to accurately extract the characteristics of debris flow caused by group rainstorms, effectively identify the on-site information of debris flow, and provide a scientific basis for debris flow monitoring, early warning and disaster control, this paper proposes a method for extracting the characteristics of heavy rainstorm debris flow using multiregional ecological environment remote sensing. In the ecological environment where debris flows occur frequently, remote sensing data of heavy rainstorm debris flows are preprocessed using remote sensing technology, providing an important basis for the feature extraction of debris flows. The kernel principal component analysis method and Gabor filters are innovatively used to extract the spectral and texture features of rainstorm and debris flow remote sensing images, and the convolutional neural network structure is improved based on the open source deep learning framework, integrating multilevel features to generate debris flow feature maps. The improved convolution neural network is then used to extract the secondary features of the fusion feature map, and the feature extraction of heavy rainstorm debris flow is realized. The experiment shows that this method can accurately extract the characteristics of heavy rainstorm debris flow. Fused remote sensing images of debris flow effectively ameliorate the problem of insufficient informational content in a single image and improve image clarity. When the Gabor kernel function has eight different directions, the feature extraction effect of the debris flow image in each direction of the heavy rainstorm is the best.

1. Introduction

Most mudslides occur alongside mountain floods [1]. The difference between mudslides and general floods is that the former contain sufficient amounts of solid debris. This includes sand and stones, with such components comprising between 15% and 80% of the mudslide volume. The entire flow process can last up to several hours, making these events more destructive than floods. The most extreme form of this disaster sees mass debris flow caused by a local rainstorm [2]. The presence of multiple gullies makes it easier for such events to inflict superimposed damage and cause more serious harm [3]. According to statistics, under the excitation of a high-intensity rainstorm, the losses from mass debris flow disasters caused by rainstorms can reach between 90% and 95% of the total disaster losses [4]. It can be said that massive rainstorm debris flow is extremely destructive due to the characteristics of having many points and wide areas during the disaster formation process. Dealing with this has become the difficulty of debris flow prevention [5]. Therefore, in order to prevent and reduce disasters, it is very important to extract the relevant features of debris flow caused by massive rainstorms.
In this regard, Bernard et al. predict debris flows using real-time meteorological data and actual rainfall measurements. They utilize real-time measurement networks to monitor the evolution dynamics of debris flow areas and obtain rainwater characteristic information when debris flows occur. Based on this information, real-time rainfall data of the debris flow disaster area can be obtained by monitoring the upstream and downstream rainfall conditions using a rain gauge. Using rainfall data, meteorological data, and radar monitoring data, the authors can accurately estimate the actual rainfall in areas prone to debris flows in an effort to prevent and control debris flows. However, in the process of debris flow prediction, this method only uses rainfall information to prevent and control debris flow, and the final prediction results are not comprehensive [6]. Sturzenegger et al. proposed a method for creating a regional-scale debris flow susceptibility map based on a digital surface morphology model index to effectively identify potential areas of debris flow occurrence. They identify potential areas of debris flow occurrence, construct relevant models based on water flow change in the area, and compare and analyze the models with actual alluvial fans extracted to support the development of debris flow risk prevention and control strategies. Finally, they apply the relevant research results to an area of 125,000 km (2) in the southern part of British Columbia, Canada. However, in the process of constructing a debris flow monitoring model, this method lacks comprehensive data and has not been validated on site, resulting in the final results having low reliability and accuracy [7]. Meyrat et al. proposed an extended two-layer debris flow model. The first layer of the model was a combination of solid and granular fluid, and the second layer was a free-flowing muddy fluid. In the process of flow evolution, the granular material and the solid material were sheared to cause expansion. By changing the position of the solid center of mass and the quantity of mud fluid and solid particles, it is possible to obtain different flow compositions, including information such as the front of debris flow composed of solid substances or the tail of debris flow containing water, and thus realize the downstream evolution of debris flow density using the obtained relevant information. However, this method is used to analyze debris flow with relatively few components and cannot accurately reflect the real flow situation of debris flow [8].
‘Telemetering’ refers to the collection of objects to be studied at a remote point from which they are then automatically transmitted to a receiving device for monitoring [9]. Telemetry technologies offer excellent integration performance, tracking performance and remote-control performance, being widely used to analyze and manage natural disasters [10]. Therefore, this paper suggests an algorithm for extracting the characteristics of massive rainstorms and debris flow via remote sensing of the ecological environment in high-frequency areas. Additionally, we suggest an algorithmic method for the accurate identification of debris flow field information via extracting multilevel features of debris flow and rainstorm graphics.

2. Feature Extraction of Debris Flow in Two Massive Rainstorms

2.1. Acquisition and Preprocessing of Massive Rainstorm and Debris Flow Data under Remote Sensing of Ecological Environment in Frequent Areas

Among the various types of natural disasters, debris flow disasters are undoubtedly some of the most destructive. This is especially true for massive rainstorms and debris flows that occur in the areas prone to such events. These locations witness large numbers of disasters, with a large scale of damage, a wide scope of destruction, serious damage to the environment, and major threat to personal safety [11]. Due to the gradual accumulation of debris flow materials during the process of debris flow, massive amounts of kinetic energy are generated, severely damaging the ecosystem in the area of debris flow. Therefore, in the process of promoting sustainable environmental development, people have adopted various methods to monitor the debris flow in the ecological environment of flow-prone areas. Telemetering technology fully combines sensing, communication, and data processing technology, offering the advantages of high speed, wide application range and low risk, compensating for the time-consuming nature and poor accessibility of field exploration and acting as an effective technical means for the long-term and dynamic monitoring of debris flow [12]. Thus, this paper is based on the use of telemetering technology to obtain and preprocess data related to the mass rainstorms and debris flow in the ecological environment of disaster-prone areas and extract the characteristics of this kind of debris flow event using this information.

2.1.1. Hyperspectral Remote Sensing Image Feature Data Acquisition of Rainstorm Debris Flow

Rainfall and terrain conditions are the basis for the occurrence of debris flow. As such, one of the necessary conditions for the occurrence of debris flow disasters is continuous rainfall. This is especially true for mass rainstorm and debris flow, which are accompanied by a wide coverage and high intensity [13]. Ordinary sensors cannot meet the requirements of obtaining the data of mass rainstorm and debris flow. Therefore, this paper chooses optical sensors to obtain hyperspectral remote sensing images (HSIs) of mass rainstorm and debris flow in the ecological environment of multiple areas. Because HSI images can contain not only accurate spatial feature information but also spectral feature information about mass rainstorm events and debris flow, we can effectively obtain information about debris flow by extracting the features of HSI images of mass rainstorm and debris flow, such as ground objects and scenes.
The Global System for Mobile Communications (GSM) has a relatively stable network structure. Long-distance communication can be carried out through this network, efficiently and safely completing information and data transmission work. Additionally, the network information coverage is wide [14]. In this regard, remote monitoring and the transmission of large-scale rainstorm and debris flow image data can be realized using the GSM network combined with wireless transmission technology. For areas without GSM network coverage, it is necessary to combine the multinetwork communication mode to complete the real-time transmission of image data. The GSM network can be deeply integrated with the radio frequency (RF) communication mode, and the debris flow image data can be shared to the communication network coverage area for expansion. This completes the transmission of large-scale rainstorm and debris flow HSI images, fundamentally solving the problem of difficulty forming wired networks due to the long-distance, efficient and accurate transmission of debris flow data information.

2.1.2. Data Preprocessing of Massive Rainstorm and Debris Flow

When obtaining HSI image feature data, due to the defects of the sensor itself, the atmosphere in the data transmission process, and various other factors, a large volume of rainstorm and debris flow data will have varying degrees of distortion in spectral and geometric characteristics, determining the shape, color, texture and other spatial information of surface objects [15]. Therefore, it is necessary to preprocess the collected HSI impact characteristic data of debris flows to adjust for the true situation of debris flows. Aiming to preprocess large-scale rainstorm debris flow HSI image feature data, this paper studies radiometric calibration, atmospheric correction, geometric correction and image fusion.
(1)
Radiation calibration
In order to improve sensor accuracy and solve the error problem in high-speed sensors, a radiometric calibration method is used to convert the pixel DN values of remote sensing images of debris flows and determine the radiation value of the sensor inlet in the form of reflectivity.
The DN value can be converted into the equivalent apparent radiance data at the entrance pupil by Formula (1):
L = Q z D N + D
where L represents the converted radiation brightness, z D N represents the DN value of the debris flow remote sensing image, Q represents the scaling slope, and D represents the calibration intercept.
(2)
Atmospheric correction
The purpose of atmospheric correction is to remove air-soluble impurities, brightness and other unfavorable conditions in order to obtain the real parameters of the reflectivity of ground objects in debris-flow-prone ecological areas. In this paper, the MODTRAN radiation transmission model method is used to correct the debris flow data after radiation calibration. The MODTRAN radiation transmission model uses the theoretical model of spectral absorption and the scattering and emission of water vapor, gas molecules, aerosols, dust particles and other atmospheric components in order to correct the atmospheric impact item by item and then reconstruct the ground spectrum. The model can be directly transplanted from MODTRAN5 through using the FLAASH module (Fast Line-of-Sight Atmospheric Analysis of Spectral Hypercubes). Firstly, it is necessary to make a conditional estimation of the surface conditions in the debris-flow-prone areas, assuming that the surface is a non-uniform Lambert surface model, which is described as follows:
L = L ( ( a × p ) / ( 1 p ¯ s ) ) + ( ( b × p ) / ( 1 p ¯ s ) ) + L α
where L is the overall radiation brightness received by the sensor, p is the pixel surface reflectivity, p ¯ is the average of the reflectivity of the pixels around the pixel, s is the hemispherical albedo of the atmosphere downward, L α is the atmospheric backscattering emissivity, and a and b are coefficients that depend on the transmittance and geometry of the atmosphere. Among which, the section ( a × p ) / ( 1 p ¯ s ) represents the radiation brightness of light radiation that enters the surface through the atmosphere and then directly enters the sensor through reflection, while the ( b × p ) / ( 1 p ¯ s ) part represents the radiation brightness of the surface pixel, which is reflected by atmospheric scattering and entering the sensor. The difference between p and p ¯ occurs mainly due to the “adjacent pixel effect” caused by atmospheric scattering. The FLAASH module uses the atmospheric and point spread function to correct the effect of adjacent pixels, and its value is estimated using the following equation:
L ¯ L ( ( a + b ) p ¯ ) / ( 1 p ¯ s ) + L α
where L ¯ is the average value of the spatial radiation images of the pixel and its surroundings, which can be calculated from the original image. The values of a , b , s and L α can be calculated by simulating the water vapor content in the atmosphere according to the MODTRAN model, and the reflectivity of adjacent pixels can be calculated according to the reflectivity of pixels and the spatial average reflectivity around them— p ¯ —and correct the adjacent pixel effect. After calculating the reflectivity of neighboring pixels, the radiance received by the sensor and the atmospheric correction parameters simulated by MODTRAN are substituted into Equation (2). The result is that the real reflectivity of ground objects in rainstorm and debris flow areas can be obtained, after which the atmospheric correction of debris flow data can be completed.
(3)
Geometric correction
The process of eliminating the coordinate difference between image pixels in the image coordinate system and the map coordinate system is called geometric correction. This can be caused by many factors, such as the differences among the imaging projections, the influence of curvature, the rotation of the earth, and the terrain fluctuation [16]. Generally speaking, geometric correction is divided into two steps. The first step is to transform the coordinates of each pixel in the HIS image of mass rainstorm and debris flow, which can be realized by matrix multiplication. After this process, because the gray value of some pixel values of the image pixels has been transformed, the second step is to resample the pixel gray value. At present, geometric fine correction is the most commonly used method, and the specific operation process is as follows: firstly, the control points in the HIS image of mass rainstorm and debris flow are selected. Then, it is necessary to find the spatial transformation between the image and the map and establish the mapping between them. Finally, the geometric transformed image is resampled using a specific interpolation algorithm in order to complete the geometric fine correction of the HIS image of the mass rainstorm and debris flow.
(4)
Image fusion
The main purpose of image fusion is to integrate all kinds of information regarding remote sensing images and improve the recognition ability of methods for assessing debris flow HIS images and the accuracy of image extraction. In this paper, the IHS image fusion method is adopted. Firstly, the hyperspectral image is color-transformed using Equation (4), and the red, green and blue bands are converted into brightness ( I ), hue ( H ) and saturation ( S ) images. Secondly, the registered panchromatic image is stretched on the basis of the gray level. Finally, it is compared with brightness ( I component) to obtain a new brightness component I , and a fused image is formed using the inverse transformation Formula (5). The image fusion method, which is performed based on this transform and histogram matching, not only retains the spectral and spatial characteristics of the image before fusion but also improves the interpretation and classification accuracy.
In the process of image fusion, the forward transformation of HIS is described as follows:
[ I v 1 v 2 ] = [ 1 / 3 1 / 3 1 / 3 1 / 6 1 / 6 2 / 6 1 / 2 1 / 2 0 ] [ R G B ]
The inverse transformation of HIS is described as follows:
[ R G B ] = [ 1 / 3 1 / 6 1 / 2 1 / 3 1 / 6 1 / 2 1 / 3 1 / 6 0 ] [ I v 1 v 2 ]
where v 1 and v 2 represent intermediate variables, while R , G , and B represent, respectively, three color channels of red, green and blue. Tone component H and saturation component S can be obtained using the following formula:
{ H = t g 1 [ v 1 / v 2 ] S = v 1 2 + v 2 2
The use of hyperspectral remote sensing image feature data, processed via radiometric calibration, atmospheric correction, geometric correction and image fusion, effectively avoids the brightness difference of different sensors at different times and under varying observation conditions; removes the scattering, absorption and other effects caused by atmospheric influence in the image; and fuses multiple bands or remote sensing images by correcting the geometric distortion of the image. Thus, its use can ensure the geometric and positional accuracy of hyperspectral remote sensing images, improve classification accuracy, and target recognition ability. The hyperspectral remote sensing feature image can more accurately and truly reflect the spectral and spatial characteristics of surface objects, providing an important basis for extracting the characteristics of large-scale rainstorm debris flow. Finally, extracting the spectral features of surface objects through hyperspectral remote sensing feature images can effectively divide the surface of debris flow prone areas into multiple types, such as water bodies, forest land, exposed land, etc., to help identify potential alluvial areas and debris flow channels. At the same time, the relationship between reflectance at different wavelengths and soil moisture is used to estimate soil moisture. The stability and moisture content of soil are analyzed by extracting the distribution and health level of vegetation, and the risk of debris flow is evaluated and classified. At the same time, it is necessary to determine the evolution and development trends in risk-prone areas to in order to detect debris flow risks.

2.2. Multilevel Feature Extraction of Large-Scale Rainstorm Debris Flow Image

Since fusing hyperspectral remote sensing feature images with debris flow feature data cannot accurately identify the features of rainstorm debris flow, and as the image of the debris flow occurrence area also has the problems of insufficient information and unclear imagery, in order to better retain the information of the original image, highlight the useful information in the image, improve the image clarity, and achieve accurate extraction of rainstorm debris flow features, it is necessary to extract multilayer features of heavy rainstorm debris flow. At the same time, as spectral information reflects the magnitude of electromagnetic wave energy reflected by ground objects (which is the basis for the visual interpretation of images), texture features, as important information in remote sensing images, can fully reflect the visual roughness of ground objects via spatial changes and the repeatability of grayscale. This roughness is an important foundation for describing and recognizing images [17]. Therefore, in the process of multilevel feature extraction of large-scale rainstorm and debris flow images, this paper compiles the spectral features and texture features of large-scale rainstorm and debris flow HSI images, uses the network framework to carry out the in-depth fusion of features, and extracts a fused feature map in order to achieve the accurate extraction of large-scale rainstorm and debris flow features.

2.2.1. Spectral Feature Extraction of Mass Rainstorm Debris Flow Images Based on Kernel Principal Component Analysis

This paper combines hyperspectral remote sensing feature images to extract the spectral characteristics of large-scale rainstorm and debris flow HSI images accurately and effectively according to the spectral characteristics of ground objects [18]. In HSI images of mass rainstorm and debris flow, the brightness value of each pixel represents the average radiation value of the ground objects in the pixel, which varies with the composition, texture, state, surface characteristics, and electromagnetic wave bands used.
Transforming raw indicators through principal component analysis (PCA) technology can be usefully applied to data with high correlation between bands. If there is a high correlation between different bands of a multiband image, it means that a considerable amount of the data are redundant. The purpose of principal component transformation is to concentrate the useful information in the original wave bands into as few new principal component images as possible and make these principal component images irrelevant to each other, that is, to ensure they contain different ground information and at the same time minimize the loss of information in the unprocessed image. This can be carried out by using KPCA to complete data mapping in high-dimensional kernel space and then via the extraction of data features in kernel space [19]. From this, it can be seen that KPCA has significant nonlinear characteristics, describing the correlation between multiple pixels based on the high-order statistics of input data, and it can transform problems that cannot be linearly classified in input space into feature space to realize linear classification, simplifying classifier design. In this paper, the KPCA method is used to extract the spectral characteristics of images of mass rainstorm and debris flow.
Hyperspectral remote sensing images of mass torrential rain and debris flow are collected using historical debris flow data, and a sample dataset of mass torrential rain and debris flow remote sensing images is established, from which the number is selected with n samples as the KPCA input sample, the input space U through nonlinear transformation φ mapping to feature space inside F , which is described as follows:
φ : U F
The sample points of the remote sensing image of massive rainstorm and debris flow in U are recorded as follows φ ( x i ) , i = 1 , 2 , , n , assuming that it has been centralized, i.e., the following conditions are met:
i = 1 n φ ( x i ) = 0
After completing remote sensing image sampling, another step is initiated. According to the sampling point location, the spatial large-scale rainstorms and mudslide remote sensing image samples, as two groups of random variables, are used as a measure to assess the statistics of linear correlation between the two random variables, that is, to judge the degree of linear correlation between the spatial large-scale rainstorms and mudslide remote sensing image samples. Firstly, by calculating the mean value of the random variables, the deviation of each data point from the mean value of the corresponding random variable is calculated, and then the cumulative summation operation is performed on the result of the product of the deviations to determine the correlation numerical result. In this process, covariance is positive, negative or zero. Ultimately, based on the results of the calculation of the covariance, a symmetric matrix of variable dimensions with equal numbers of rows and columns is set up, and the computed covariance is found in the diagonal as well as non-diagonal positions of the square matrix. Additionally, by means of each element of the covariance, as well as the diagonal and the non-diagonal positions in the square matrix, it is necessary to construct the covariance matrix by describing the covariance between the variables corresponding to each element. In this way, the correlation and variance between multiple random variables are demonstrated, and the linear relationship between random variables is explicitly obtained. Thus, covariance matrix C of remote sensing image samples of massive rainstorm and debris flow in F space can be described as follows:
C = 1 n i = 1 n j = 1 n φ ( x i ) φ ( x j ) T , ( i , j = 1 , 2 , , n )
According to C V = V , it is possible to obtain C ’s eigenvalue of and ’s corresponding feature vector V F \ { 0 } , where C ’s eigenvalues are non-negative. Since all feature vectors can be expressed as samples in spaces F φ ( x i ) , i = 1 , 2 , , n where is a linear tensor, therefore, V can be expressed as:
V = i = 1 n i φ ( x i )
In this formula, i is the projection coefficient.
Consider the equation:
φ ( x i ) C V = ( φ ( x i ) V )
Define a n × n ’s ordered kernel matrix of K , which is described as:
K = ( k i j ) n × n = φ ( x i ) ( φ ( x i ) H S V ) = k ( x i , x j )
In the formula, x i and x j are the sample vectors of remote sensing images representing massive rainstorm and debris flow, and k ( ) represents a kernel function. Generally, the k ( ) can be a Gaussian kernel function k ( x i , x j ) = e x p ( x i x j / 2 σ 2 ) . The mathematical thinking behind the Gaussian kernel function is mainly based on the exponential function, which is used to map the sample data to the high-dimensional feature space; i.e., the exponential function is used to measure the distance between random samples. Mathematically speaking, the exponential function takes the value range of [0, +∞). The closer the input distance is to 0, the more the value of the exponential function tends toward 1, indicating that the similarity between the samples is higher. When the input distance is further away from 0, the value of the exponential function tends to be closer to 0, which means that the similarity between the samples is lower. Ultimately, combined with the similarity calculation results, the kernel technique effectively maps the data onto a higher-dimensional feature space. This plays an important role in classification and regression problems. σ represents the function state characteristic control parameter.
Substituting Formulas (9) and (10) into Formula (11), we can obtain:
K = n
Because the initial nuclear transformation is not guaranteed i = 1 n φ ( x i ) = 0 , it is therefore not necessary to check the kernel matrix, K , which is normalized according to the expression:
K i j = ( K E n K K E n + E n K E n ) i j
where E n is a n × n matrix, and ( E n ) i j = 1 / n .
The eigenvalue equation can be written as:
n = K i j
According to Equation (15), a set of non-zero eigenvalues can be obtained: i ( i = 1 , 2 , , n ) and i ( i = 1 , 2 , , n ) .
If the observation value of the hyperspectral image of the mass rainstorm debris flow is x j , then the image of the m ( m = 1 , 2 , , n ) ’s principal component image can be obtained by projecting all the observed data, following kernel transformation, in order of size relative to  m ’s feature vector V m and obtain:
V m = i = 1 n i r K i j ( x i , x j ) / φ ( x j )
To summarize, the steps involved in spectral feature extraction from the images of mass rainstorm and debris flow based on KPCA are as follows:
(1)
Select a certain number of hyperspectral remote sensing image samples of massive rainstorm, debris flow and appropriate kernel function.
(2)
Calculate the kernel matrix according to Formula (12) and Formula (14) to obtain K  and K .
(3)
Use Formula (15) to obtain K ’s eigenvalue of and , and conduct normalization.
(4)
Obtain the characteristic values in descending order, and select m ’s eigenvectors corresponding to non-zero eigenvalues for use as principal components.
(5)
All spectral vectors in the feature space are projected onto the image corresponding to the first image m ’s eigenvectors corresponding to three eigenvalues V m ; see Equation (16). Then, the obtained vector is restored to a two-dimensional image—the m ’s principal component image—in order to complete the extraction of spectral characteristics of mass rainstorm debris flow images.

2.2.2. Texture Feature Extraction of Mass Rainstorm Debris Flow Images Based on Gabor and Three-Patch Local Binary Patterns

Compared with the spectral features of the target objects in the debris-flow-prone areas, texture features of the objects in the debris flow images are relatively more stable and are not easily affected by external factors such as color and brightness. In this regard, this method can effectively and selectively preserve multidimensional band information in the image based on obtaining spectral features. It is helpful to select the filter suitable for multiband analysis, extract the texture features in the image, and accurately extract the features of rainstorm debris flow. Therefore, Gabor filters are used to extract the features of the debris flow images in all directions [20], and then the texture features of the images are extracted via three-patch local binary patterns (TPLBP).
In a two-dimensional coordinate system ( x , y ) , a point in 2D space is assumed to be the difference coordinate in relation to the origin through which the position of the filter is controlled. The two-dimensional space input coordinates can be transformed into difference coordinates with respect to the center point, and the magnitude portion of the filter response, i.e., the exponential function portion, can be constructed from the difference coordinates. The phase portion of the filter response, i.e., the cosine function portion, is also calculated, and the two portions are multiplied together to obtain the final filter response, supporting the frequency domain response frequency range determination below. The mathematical expression of Gabor filter can be described as follows:
g ( x , y , λ , θ , ζ , δ , γ ) = V m exp ( x 2 + γ 2 y 2 2 δ 2 ) cos ( i ( 2 π x λ + ζ ) )
Among which:
{ x = x cos θ + y sin θ y = x sin θ + y cos θ
where λ represents the wavelength of the sinusoidal plane wave, ζ represents a phase shift, and θ indicates the direction of the Gabor kernel function. Additionally, different θ texture features of debris flow images in different directions can be obtained using the value, while γ represents the aspect ratio of kernel functions in the spatial domain, δ represents the amplitude variation range of the extracted data, and its value depends on the distance occupied by a complete cycle in space λ . Additionally, Gabor filters have a responsive frequency range in the frequency domain b w , and the relationship between them is defined as follows:
δ = ( λ / π ) ln 2 2 2 b w + 1 2 b w 1
For a pixel point in the image of mass rainstorm and debris flow, the calculation steps of the TPLBP value are as follows:
Step 1: Select a pixel with a size of w × w and central module of O . Based on this module, calculate the LBP value. The specific calculation process is as follows:
Z L B P N , r ( g c ) = g ( x , y , λ , θ , ζ , δ , γ ) p = 0 N 1 S ( g p g c ) 2 p
Among which:
S ( g ) = { 1 , g p g c 0 , g p < g c
where g c represents the brightness or grayscale level corresponding to the center pixel of the image, and the distance from its point r ’s p gray values of the surrounding pixels are measured by g p for description. N indicates the total number of pixel points, and S represents a threshold function.
Step 2: Around the central module O , generate a radius of r as the circular area. Then, for the circular area on the individual boundary line M and central module O for modules with the same size, calculate the LBP value of the central pixel point of each module.
Step 3: Two modules connected to the center module at α angle are selected from the connection module, and the LBP values of the center module and its center pixel are calculated respectively. In this paper, the Euclidean distance between the LBP values of the central pixels is used to obtain the similarity.
Step 4: Subtract the two obtained similarities and then obtain binary data. These are weighted to obtain the final TPLBP value, whose mathematical definition is as follows:
T P L B P ( p ) = Z L B P N , r ( g c ) i M f ( d ( Z i Z p ) d ( Z i + α mod M , Z p ) ) 2 i
where Z i and Z i + α mod M are the LBP values of the central pixel points of the two modules in the radius circle r , Z p is the LBP value of the central pixel point of the central module, d ( ) represents the Euclidean distance between the LBP values of the central pixel points of two modules, and the definition of the function f is as follows:
f ( x ) = { 1 , x τ 0 , x < τ
where this article set τ = 0.01 .
The TPLBP value of each pixel in the image of the mass rainstorm and debris flow is calculated according to Formula (22).
To sum up, based on Gabor and TPLBP, the steps of texture feature extraction of mass rainstorm debris flow images are as follows:
(1)
For each input remote sensing image of mass rainstorm and debris flow, a Gabor filter is used to extract the texture features of the image in different directions.
(2)
For the remote sensing image of mass rainstorm and debris flow after Gabor filtering in all directions, the TPLBP value of each pixel in the image is calculated using Formula (22). Then, the image is divided into non-overlapping rectangular windows with the same size, and the frequency value of each TPLBP value in each rectangular window is calculated to produce a statistical histogram of T P L B P ( p ) .
(3)
The histograms of each rectangular window are connected with each other to form a feature vector of the remote sensing image of mass rainstorm and debris flow after filtering in a certain direction, and finally, the feature vectors in all directions are joined together to obtain the final spatial texture feature map of a remote sensing image of mass rainstorm and debris flow.

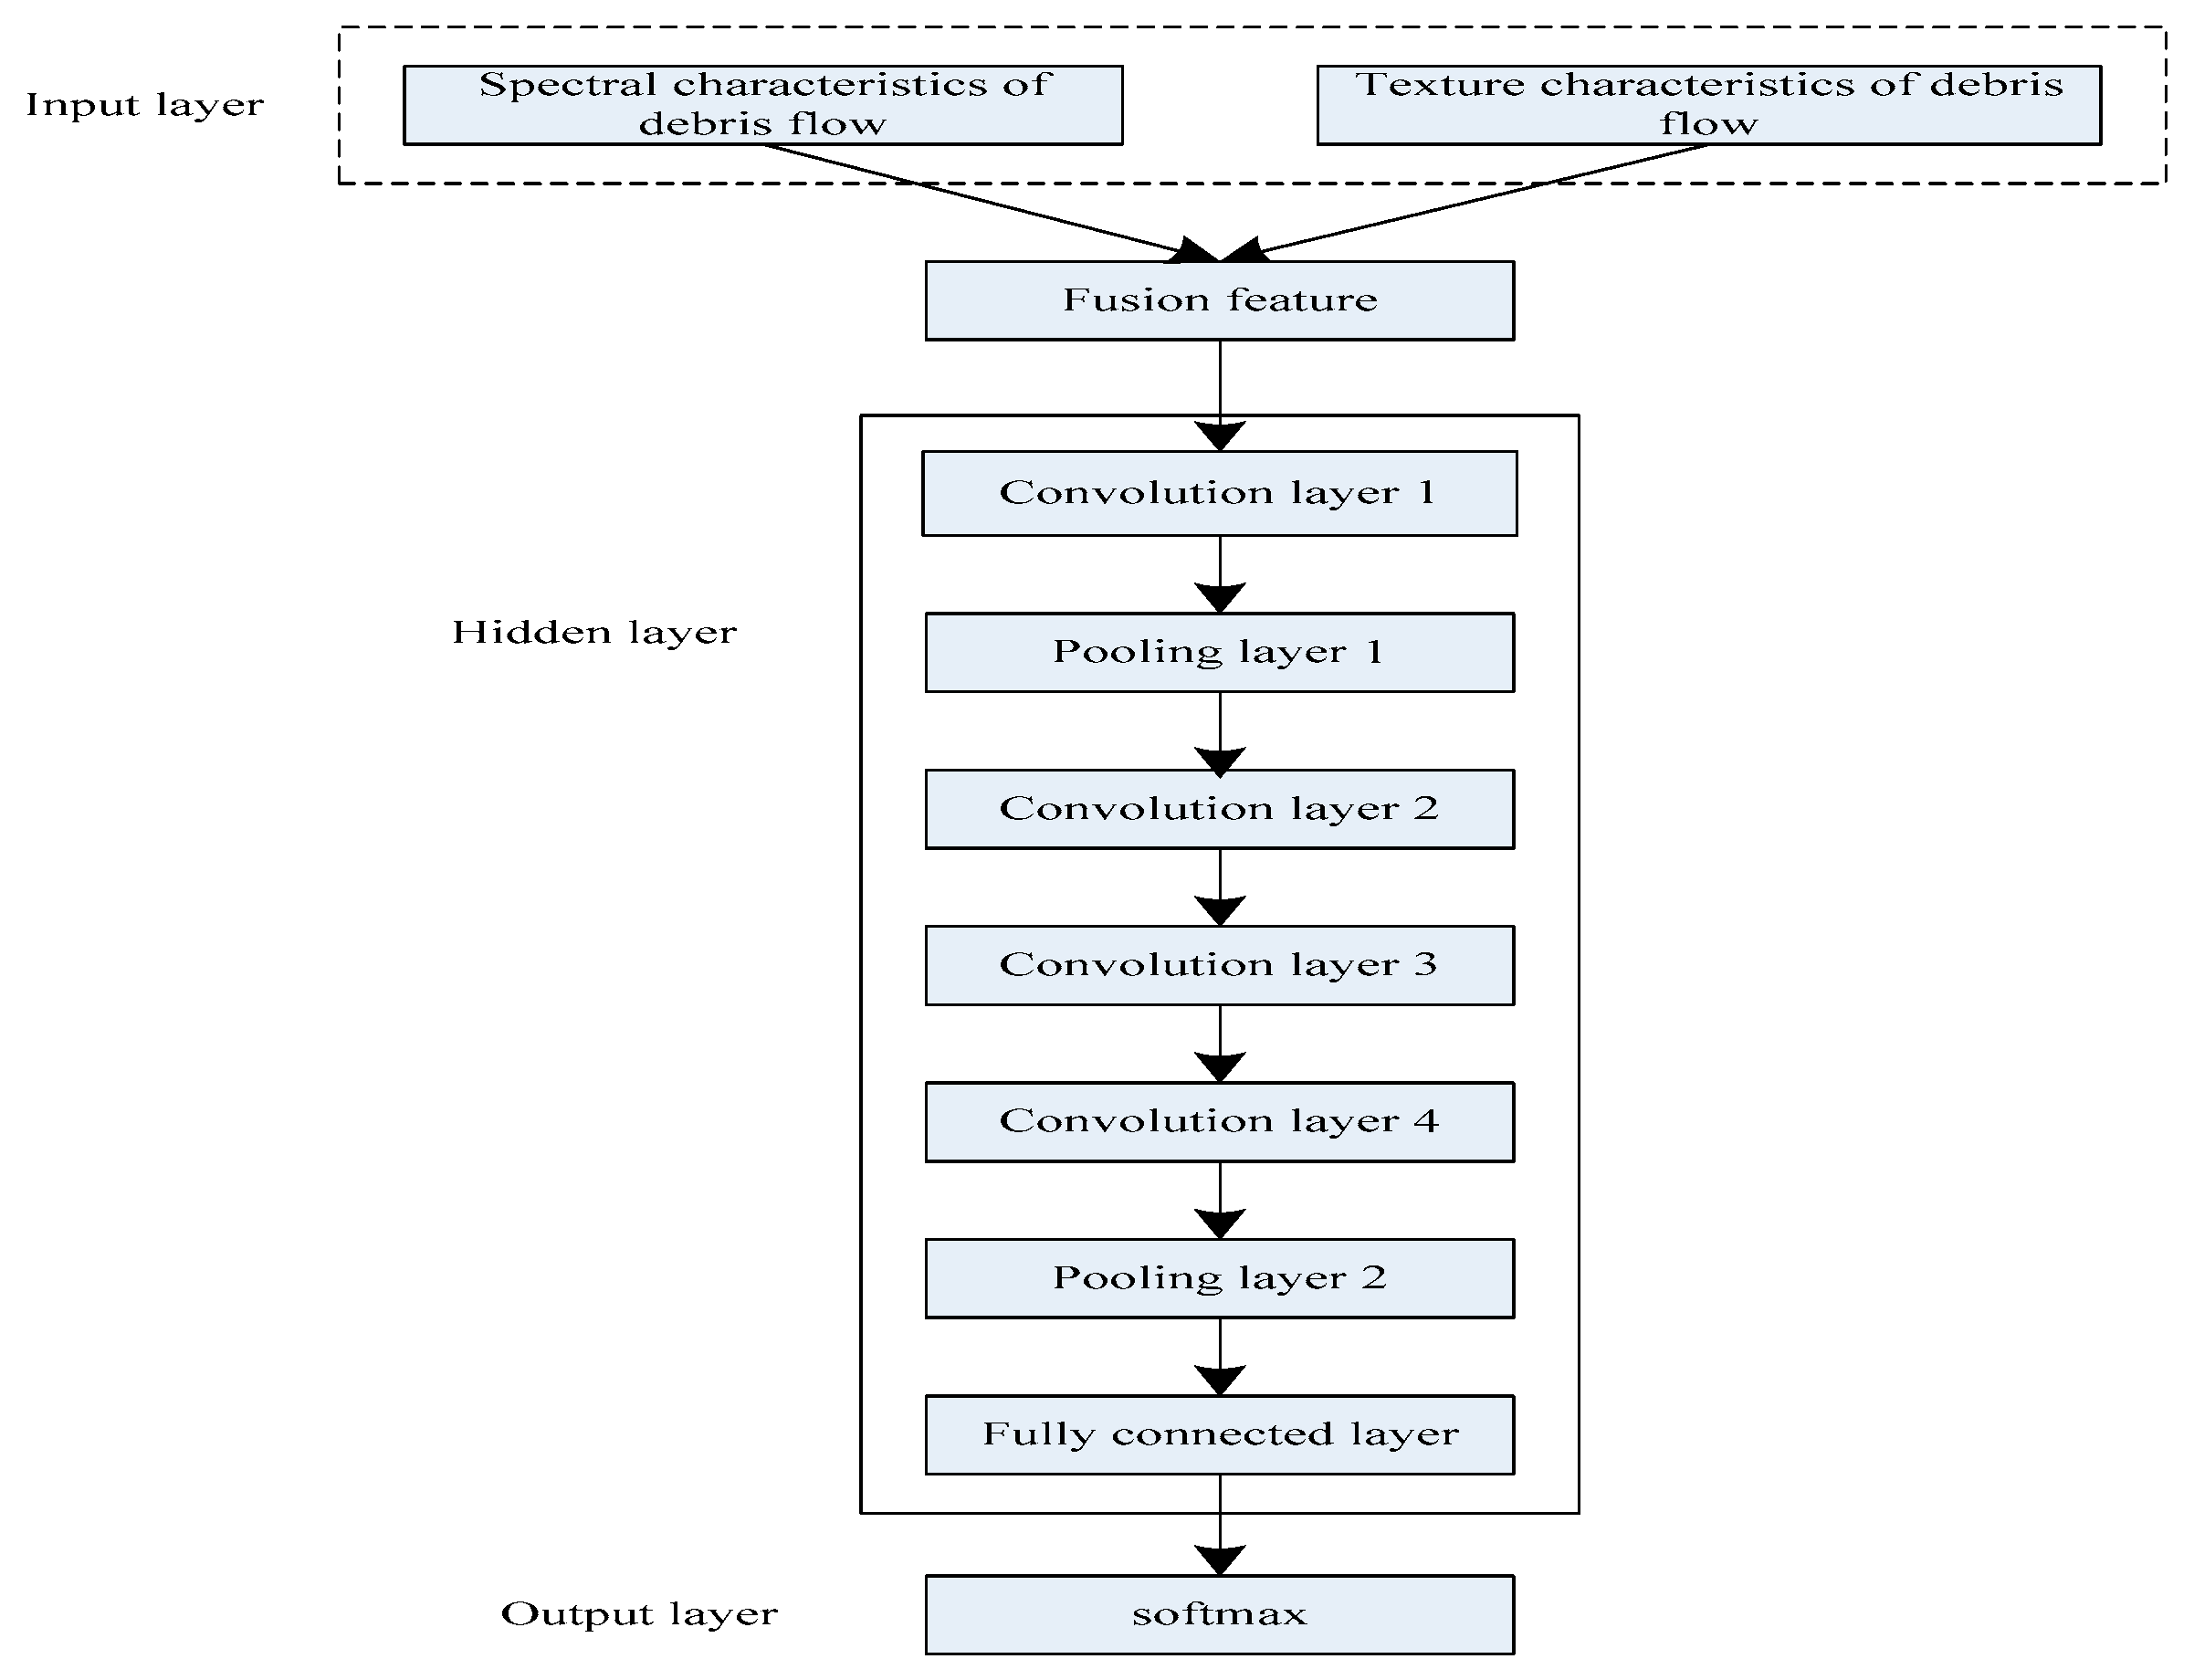
2.2.3. Multilevel Feature Extraction of Large-Scale Rainstorm Debris Flow Image Based on Improved Convolution Neural Network Structure

After obtaining the spectral characteristics and texture characteristics of rainstorm debris flow hyperspectral remote sensing feature images, the feature vector of high-quality rainstorm debris flow remote sensing images can be formed, and the feature vectors can be connected to each other in all directions, thus obtaining a spatial texture feature map of high-quality rainstorm debris flow remote sensing images.
However, after the fusion of remote sensing images of debris flows, spectral and texture features cannot effectively preserve the original image information, and the individual image information is insufficient. The clarity of remote sensing image of rainstorm debris flow cannot be guaranteed, which affects the accuracy of feature extraction. In order to extract more accurate and effective features of large-scale rainstorm and debris flow, the spectral feature map and texture feature map of debris flow are fused under the framework of convolutional neural network, and the features of the fused feature map are extracted.
However, because the traditional convolutional neural network cannot extract and fuse the features of the spectral feature map and the texture feature map at the same time, this paper constructs a multilevel feature extraction network model based on the Pytorch database (Pytorch is an open source deep learning framework). This is carried out in order to extract the features of heavy rainstorm and debris flow in the ecological environment of debris-flow-prone areas. The core parts of the process of feature extraction using convolutional neural networks include the pooling layer and convolutional layer. Usually, the gradient descent method is used to reverse-adjust the internal hierarchy of the network. The accuracy of network recognition is improved through frequent iterative training. The network model framework is shown in Figure 1.
Firstly, the obtained spectral feature map and texture feature map of mass rainstorm and debris flow are taken as the input items of the network. Then, the feature quantities are spliced in the specified dimension by torch.cat instruction to generate the fused debris flow features. Afterwards, the fused features of mass rainstorm and debris flow are extracted by overlapping the convolution layer and pool layer, the input and output neurons are connected through the full connection layer, and the data are reduced in terms of dimensions. Finally, the recognized features of mass rainstorm and debris flow are output using a Softmax classifier.
In order to prevent gradient explosion or the disappearance of layer activation output during the forward propagation of the network, this paper uses the Kaiming initialization method to deal with the convolution layer weight, and the output of each layer is processed via normalization and Relu activation function, thus improving the convergence speed of training the whole network. The loss function chooses the cross-entropy function. When the set stop condition is reached, the network model stops running, and the final feature extraction result of mass rainstorm and debris flow is output [21,22,23].

3. Experimental Analysis

Taking a mountainous area in Yunnan as the experimental object, there are numerous peaks, high and deep, with large longitudinal slopes and deep road cuts. The whole mountainous area is dominated by gneiss, granite and dolomite, and the rocks are obviously weathered and peeled off, producing debris deposits. In addition, the significant difference in topography creates a three-dimensional climate with a subtropical plateau monsoon climate as the baseband, with an average annual rainfall of more than 1200 mm. There have been five debris flow disasters in this area, which belongs to the debris-flow-prone area. Two such events occurred in groups, and all were caused by continuous heavy rain.
In order to verify the validity of the method in this paper, the dynamic remote sensing data of this area were collected by using an ROSIS sensor when continuous rainstorm occurred in this area, and the data were transmitted to the remote monitoring host through the GSM network. The collected hyperspectral remote sensing data contain 98 bands, and the image size of the data is 610 × 340 pixels. The parameter settings for each layer of the improved convolutional neural network are shown in Table 1, in which an original hyperspectral remote sensing image of debris flow is shown in Figure 2, and the debris flow image after feature extraction using this method is shown in Figure 3.
As can be seen from Figure 2, the original hyperspectral remote sensing image of debris flow describes the landform characteristics of this area in detail. There are many peaks, large longitudinal slopes of valleys, and numerous gullies in this area, and the terrain is very complicated. It is possible to see that due to continuous heavy rain, a large number of mudslides have formed. The white part in the picture indicates where the mudslides occur. Although the original hyperspectral remote sensing image of debris flow can be used to understand the debris flow, it is not intuitive. As can be seen from Figure 3, the debris flow image after feature extraction using this method not only retains the information in the original image but also highlights the useful information in the image, allowing workers to quickly and accurately grasp the distribution of and trends in debris flows in different river basins. This shows that the method in this paper can effectively and accurately extract the characteristics of mass rainstorm and debris flow.
According to the principle of information theory, the image information entropy EN can be defined as follows:
E N = i = 0 J 1 ρ i log 2 ( ρ i )
where J represents the total number of gray levels of an image, and ρ i indicates that the gray value is i ’s ratio of the number of pixels to the total number of pixels.
Therefore, the experiment uses an information entropy index to select debris flow remote sensing images with different definitions than multi-historical debris flow remote sensing images, uses the image fusion method proposed in this paper to fuse them, and evaluates the fused images using an image information entropy index, and the results are shown in Figure 4.
As can be seen from Figure 4, with the increase in signal-to-noise ratio, the information entropy of the debris flow remote sensing image fused by this method gradually increases, especially when the signal-to-noise ratio is 80 dB. When the definition of the debris flow remote sensing image to be fused is 4.5, the information entropy of the fused image exceeds 7.98 (usually, the theoretical value of image information entropy is 8, and the closer it is to the theoretical value, the better the image quality will be). Even if the signal-to-noise ratio is 10 dB, the information entropy of the fused image exceeds 7.88, while the resolution of the high-debris-flow remote sensing image is 3.5. Therefore, after the remote sensing image of debris flow is produced by this method, the information of the original image is well preserved. This can effectively make up for the lack of information in a single image, improve image clarity, and lay the foundation for the subsequent feature extraction of debris flow images.
When extracting the texture features of debris flow images of mass rainstorm, this method uses Gabor filters to extract the features of debris flow images in all directions. In this link, the value of Gabor kernel function direction θ is very important. Different θ values can obtain the texture features of debris flow images in different directions, exerting an important impact on the feature extraction effect. For the Gabor filtering process, the feature extraction effect of θ different values is tested under different Gabor filter half-response spatial frequency bandwidth conditions of b w . Three sets of θ values are set, respectively, in the experiment, including [ 0 ° ,   45 ° ,   90 ° ,   135 ° ] in four directions, [ 0 ° ,   30 ° ,   60 ° ,   90 ° ,   120 ° ,   150 ° ] in six directions, and [ 0 ° ,   22.5 ° ,   45 ° ,   67.5 ° ,   90 ° ,   112.5 ° ,   135 ° ,   157.5 ° ] in eight directions. The FI value index is used to evaluate the information of Gabor filters, extracting different directions of debris flow images of mass rainstorm. The experimental results are shown in Figure 5.
The FI value is an indicator of comprehensive recall and accuracy. The higher the FI value, the better the feature extraction effect will be. It can be seen from Figure 5 that under different b w conditions, θ values are different, and the Gabor filter has different effects when extracting different directions of information from debris flow images of mass rainstorm. Under the same condition of b w , when θ takes eight directions and [ 0 ° ,   22.5 ° ,   45 ° ,   67.5 ° ,   90 ° ,   112.5 ° ,   135 ° ,   157.5 ° ] directions, the FI value performs best, reaching over 90%, which is better than the extraction effect of θ taking four directions and six directions, while the extraction effect of θ on four directions is relatively poor. On the whole, when b w = 4 and θ takes eight directions and [ 0 ° ,   22.5 ° ,   45 ° ,   67.5 ° ,   90 ° ,   112.5 ° ,   135 ° ,   157.5 ° ] , the Gabor filter proposed in this paper has the best effect on the feature extraction of debris flow images of mass rainstorm in all directions, and it can maintain high accuracy and recall.

4. Discussion

After extracting the features of the debris flow image using the method proposed in this article, the debris flow image effectively retains the information of the original image and highlights the useful information contained in the image. The image demonstrates the distribution position and trend of debris flow in different watersheds, allowing the characteristics of rainstorm debris flow to be effectively and accurately extracted. This is mainly because the method in this paper uses the idea of extracting multilevel features of the image to extract the features of debris flow. After obtaining the image spectrum features and texture features, the method is able more accurately extract the features of rainstorm debris flow in the image, including debris flow valley texture, soil erosion features, exposed surfaces, etc., more comprehensively and accurately judge whether there is rainstorm debris flow in the image, and it can also help distinguish different types of ground objects, thus improving the performance of debris flow monitoring and identification. However, if only a single image feature is extracted, there will be a lack of comprehensiveness for the debris flow monitoring and recognition results. It is impossible to retain the original image feature information while highlighting the details in the map, thus affecting the accuracy of rainstorm debris flow feature extraction.
In the process of feature image fusion, this method adopts methods such as open-minded initialization, normalization, and Rayleigh activation function so that the improved network can better preserve the details and structural information of the original image. The cross-entropy function is used as a loss function to fully utilize various features in the image to improve the accuracy of debris flow monitoring and thus extract image features. In the process of using the cross-entropy function, the degree of detail presentation of image information is measured by calculating information entropy, and whether it can reflect the complexity and non-repeatability of information in the image is evaluated. The higher the information entropy of an image is, the more diverse and diverse information it will contain. In the fusion of debris flow remote sensing images, a higher information entropy indicates that more debris flow features and details are retained in the fused image. Even in low signal-to-noise ratios, when the resolution of high-resolution remote sensing images of debris flows is 3.5, the information entropy of the fused image is still greater than 7.88. This indicates that even in cases where the image quality is not ideal, the fusion method can still effectively preserve the information of the image and improve the clarity and quality of remote sensing images of debris flows. As the signal-to-noise ratio increases, the noise in the image is reduced, and the debris flow features are better represented, leading to an increase in the information entropy of the fused image. By using this method, it becomes clear that under a high signal-to-noise ratio and appropriate definition of the fused debris flow remote sensing image, a fused image with high information entropy can be obtained, thereby improving image quality and clarity. This provides an important foundation for further utilizing remote sensing technology for debris flow monitoring and analysis.
Texture features, as valuable information in remote sensing images, can fully reflect the visual roughness of ground objects through spatial changes and the repeatability of grayscale, which is an important foundation for describing and recognizing images. This paper uses Gabor filters to extract all-round features from debris flow images, and it evaluates the feature extraction effect by comparing comprehensive recall and accuracy indicators in different directions. In this article, using Gabor filters in eight directions can more accurately extract debris flow features with rich and diverse directionality, resulting in the best feature extraction effect and sustaining a high accuracy and recall rate. This is mainly due to the fact that the method proposed in this article, based on obtaining spectral features of HSI images, explicitly requires the selective preservation of multidimensional band information in the image during the process of extracting texture features. This utilizes filters to monitor the edge information of debris flow areas and effectively remove image noise, providing reliable texture features for debris flow monitoring and recognition.

5. Conclusions

There are many kinds of debris flow disasters, varying in terms of geographical distribution, frequency and size of losses. Once a debris flow disaster occurs, it poses a great threat to local life safety and economic development. This is especially true for mass rainstorm and debris flow, which cause immeasurable harm and losses to people and represent great challenges for disaster relief and reconstruction. Therefore, this paper proposes a feature extraction algorithm of heavy rainstorm debris flow based on multiregional ecological environment remote sensing. With the support of remote sensing technology, the characteristics of group rainstorms and debris flow in the ecological environment of many regions were extracted. When the resolution of the high-resolution remote sensing image of debris flow is 3.5, even if the signal-to-noise ratio is 10 dB, the information entropy of the fused image is still greater than 7.88, and the Gabor filter is used to extract the features of large-scale rainstorm debris flow images in eight directions and is able to maintain high accuracy and recall. This research provides ways of improving the study and analysis of the time characteristics of group rainstorm and debris flow, putting forward prevention and control suggestions for such disasters and providing experience and references to guide future practical work.

Author Contributions

Conceptualization, J.L. and N.H.; methodology, Y.Z.; software, F.G.; validation, J.L. and N.H.; formal analysis, Y.Z.; investigation, F.G.; resources, Y.Z.; data curation, J.L.; writing—original draft preparation, J.L.; writing—review and editing, N.H.; visualization, N.H.; supervision, N.H.; project administration, Y.Z.; funding acquisition, J.L. All authors have read and agreed to the published version of the manuscript.

Funding

This research received no external funding.

Data Availability Statement

Not applicable.

Conflicts of Interest

The authors declare no conflict of interest.

References

  1. Wang, Y.; Hu, X.; Wu, L.; Ma, G.; Yang, Y.; Jing, T. Evolutionary history of post-fire debris flows in ren′e yong valley in Sichuan province of China. Landslides 2022, 19, 1479–1490. [Google Scholar] [CrossRef]
  2. Wang, F.; Yan, K.; Nam, K.; Zhu, G.; Peng, X.; Zhao, Z. The wuxie debris flows triggered by a record-breaking rainstorm on 10 June 2021 in Zhuji city, Zhejiang province, China. Landslides 2022, 19, 1913–1934. [Google Scholar] [CrossRef]
  3. Wang, Z.; Liu, D.C.; You, Y.; Lyu, X.B.; Liu, J.F.; Zhao, W.Y.; Sun, H.; Wang, D.W.; Liu, Y. Characteristics of debris flow impact on a double-row slit dam. J. Mt. Sci. 2023, 20, 415–428. [Google Scholar] [CrossRef]
  4. Sun, T.; Sun, D.Y.; Wang, X.K.; Ma, Q.; Gourbesville, P.; Nohara, D. Erratum to: Numerical analysis of landslide-generated debris flow on July 3, 2021 in Izu mountain area, Shizuoka county, Japan. J. Mt. Sci. 2022, 19, 2742. [Google Scholar] [CrossRef]
  5. Sun, L.; Ma, B.; Pei, L.; Zhang, X.; Zhou, J.L. The relationship of human activities and rainfall-induced landslide and debris flow hazards in central China. Nat. Hazards 2021, 107, 147–169. [Google Scholar] [CrossRef]
  6. Bernard, M.; Gregoretti, C. The use of rain gauge measurements and radar data for the model-based prediction of runoff-generated debris-flow occurrence in early warning systems. Water Resour. Res. 2021, 57, e2020WR027893. [Google Scholar] [CrossRef]
  7. Sturzenegger, M.; Holm, K.; Lau, C.A.; Jakob, M. Debris-flow and debris-flood susceptibility mapping for geohazard risk prioritization. Environ. Eng. Geosci. 2021, 27, 179–194. [Google Scholar] [CrossRef]
  8. Yang, Z.; Xiong, J.; Zhao, X.; Meng, X.; Wang, S.; Li, R.; Wang, Y.; Chen, M.; He, N.; Yang, Y.; et al. Column-Hemispherical Penetration Grouting Mechanism for Newtonian Fluid Considering the Tortuosity of Porous Media. Processes 2023, 11, 1737. [Google Scholar] [CrossRef]
  9. Hu, X.D.; Zhou, L.Q.; Liu, W.M.; Wang, H.; Cui, L. Geomorphic effect of debris-flow sediments on the min river, Wenchuan earthquake region, western China. J. Mt. Sci. 2021, 18, 2427–2440. [Google Scholar] [CrossRef]
  10. Wang, Y.; Wang, T. Numerical simulation of a heavy rainstorm in northeast china caused by the residual vortex of typhoon 1909 (lekima). Atmosphere 2021, 12, 120. [Google Scholar] [CrossRef]
  11. Chen, Y.; Li, Y. Convective characteristics and formation conditions in an extreme rainstorm on the eastern edge of the tibetan plateau. Atmosphere 2021, 12, 381. [Google Scholar] [CrossRef]
  12. Baggio, T.; Mergili, M.; D′Agostino, V. Advances in the simulation of debris flow erosion: The case study of the Rio Gere (Italy) event of the 4th August 2017. Geomorphology 2021, 381, 107664. [Google Scholar] [CrossRef]
  13. Huebl, J.; Kaitna, R. Monitoring debris-flow surges and triggering rainfall at the Lattenbach creek, Austria. Environ. Eng. Geosci. 2021, 27, 213–220. [Google Scholar] [CrossRef]
  14. Dai, Z.; Xu, K.; Wang, F.; Yang, H.; Qin, S. Numerical investigation on the kinetic characteristics of the yigong debris flow in Tibet, China. Water 2021, 13, 1076. [Google Scholar] [CrossRef]
  15. Ding, X.; Cao, X. Characteristics and risk analysis of debris flow movement in a strong earthquake area—Sichuan earthquake stricken area as an example. Int. J. Environ. Eng. 2021, 11, 30–38. [Google Scholar] [CrossRef]
  16. Coviello, V.; Theule, J.I.; Crema, S.; Arattano, M.; Marchi, L. Combining instrumental monitoring and high-resolution topography for estimating sediment yield in a debris-flow catchment. Environ. Eng. Geosci. 2021, 27, 95–111. [Google Scholar] [CrossRef]
  17. Luo, H.Y.; Zhang, L.M.; He, J.; Yin, K.S. Reliability-based formulation of building vulnerability to debris flow impacts. Can. Geotech. J. 2022, 59, 40–54. [Google Scholar] [CrossRef]
  18. Chen, J.; Luo, Y.; Xiong, J.; Zhang, S.; Xia, M.; Yang, H.; Ge, Q. A thermal-effect-based monitoring method for debris flow warning. Geomorphology 2022, 400, 108097. [Google Scholar] [CrossRef]
  19. Cui, W.; Wu, Y.M.; Cao, F.K. Feature extraction of cracks in aircraft main body alloy from industrial CT image. Ordnance Mater. Sci. Eng. 2022, 45, 115–119. [Google Scholar]
  20. Chen, J.; Gong, Z.; Gao, X.B. Design and Simulation of a Feature Extraction Method in Weakly Enhanced Image. Comput. Simul. 2022, 39, 197–200+370. [Google Scholar]
  21. Yang, Z.-Q.; Wei, L.; Liu, Y.-Q.; He, N.; Zhang, J.; Xu, H.-H. Discussion on the Relationship between Debris Flow Provenance Particle Characteristics, Gully Slope, and Debris Flow Types along the Karakoram Highway. Sustainability 2023, 15, 5998. [Google Scholar] [CrossRef]
  22. Yang, Z.; Chen, M.; Zhang, J.; Ding, P.; He, N.; Yang, Y. Effect of initial water content on soil failure mechanism of loess mudflow disasters. Front. Ecol. Evol. 2023, 11, 1141155. [Google Scholar] [CrossRef]
  23. Zhao, X.; Yang, Z.; Meng, X.; Wang, S.; Li, R.; Xu, H.; Wang, X.; Ye, C.; Xiang, T.; Xu, W.; et al. Study on Mechanism and Verification of Columnar Penetration Grouting of Time-Varying Newtonian Fluids. Processes 2023, 11, 1151. [Google Scholar] [CrossRef]
Figure 1. Multilevel feature extraction network framework of mass rainstorm debris flow.
Water 15 03807 g001
Figure 2. Hyperspectral remote sensing image of the original debris flow.
Water 15 03807 g002
Figure 3. Image of debris flow after feature extraction using the proposed method.
Water 15 03807 g003
Figure 4. Information entropy of fused images under different definition conditions.
Water 15 03807 g004
Figure 5. Feature extraction effect when different values are taken.
Water 15 03807 g005
Table 1. Improve the parameter settings of each layer of convolutional neural networks.
Name of Each Layer of the Network ModelParameter Setting
Convolution layer 1Kernel_size = 5, stirde = 1, padding = 2
Pooled horizon 1Kernel_size = 3, stirde = 2
Convolution layer 2Kernel_size = 3, stirde = 1, padding = 1
Convolution layer 3Kernel_size = 3, stirde = 1, padding = 1
Convolution layer 4Kernel_size = 3, stirde = 1, padding = 1
Pooled horizon 2Kernel_size = 3, stirde = 2
Disclaimer/Publisher’s Note: The statements, opinions and data contained in all publications are solely those of the individual author(s) and contributor(s) and not of MDPI and/or the editor(s). MDPI and/or the editor(s) disclaim responsibility for any injury to people or property resulting from any ideas, methods, instructions or products referred to in the content.

