Article

Possible Pollution of Surface Water Bodies with Tequila Vinasses

by
Allan Tejeda
1,
Arturo Montoya
1,2,
Belkis Sulbarán-Rangel
2 and
Florentina Zurita
1,*
1
Environmental Quality Research Center, Centro Universitario de la Cienega, University of Guadalajara, Ocotlan 47820, Jalisco, Mexico
2
Department of Water and Energy, Centro Universitario de Tonala, University of Guadalajara, Tonala 45425, Jalisco, Mexico
*
Author to whom correspondence should be addressed.
Water 2023, 15(21), 3773; https://doi.org/10.3390/w15213773
Submission received: 26 September 2023 / Revised: 19 October 2023 / Accepted: 26 October 2023 / Published: 28 October 2023
(This article belongs to the Special Issue Water Quality, Water Security and Risk Assessment)

Abstract

:
The aim of this study was to evaluate the water quality in two streams of the Valles region of Jalisco, Mexico and fully determine if they are being used as tequila vinasse disposal sites. Three sampling campaigns were carried out at eight different points of the two streams that run near tequila factories (TFs). Different physicochemical parameters of water quality were measured: chemical oxygen demand (COD); biochemical oxygen demand (BOD5); total suspended solids (TSSs); total phosphates; fats, oils, and grease (FOG); Kjeldal nitrogen; nitrite; nitrate; pH; conductivity; temperature; dissolved oxygen (DO); and turbidity. Also, the analysis of samples of tequila vinasses (TVs) diluted with tap water were carried out to have a reference for the level of pollution in the streams. Furthermore, due to the fact that COD could be considered the main indicator of pollution with TVs, a linear regression was performed between COD concentrations and the percentage of dilution of TVs (with tap water). A positive correlation was found between these two variables, and based on this analysis, the vinasse content was estimated at each sampling point of the streams. It was found that on average, a volume of 8.5 ± 6.3% and 11.5 ± 4.9% of TVs were present in each sampling point of the Atizcoa and Jarritos Streams, respectively. Additionally, it was found that, in general, the concentration of pollutants increased as the streams passed through the TFs, particularly the Atizcoa Stream. According to the Water National Commission criteria, most of the points would be classified as highly polluted, since they reach concentrations of COD and BOD5 up to 6590 mg/L and 3775 mg/L, respectively, temperature values up to 37 °C, and DO values of 0.5 mg/L. Therefore, it was confirmed that the streams are being used as tequila vinasse disposal sites. Due to the above, there is an urgent need for tequila companies to implement treatment systems for the vinasse generated, since under current conditions, the monitored streams are practically devoid of aquatic life.

1. Introduction

Tequila production is an iconic activity of great social and economic importance for the producing regions of Mexico, particularly for the state of Jalisco [1,2]. However, throughout the tequila production process, a liquid residue is generated at the bottom of the stills during the distillation process of the fermented must known as tequila vinasse [3,4]. In general, the number of tequila factories (TFs) that treat their vinasses prior to discharge is low, since it is mainly large companies that do so [5]. The rest of the companies do not treat their effluents, mainly justifying this decision with the economic limitations (especially micro- and small companies) of paying for the construction, operation, maintenance, and personnel of a conventional wastewater treatment plant [4]. Therefore, the untreated vinasse ends up being discharged into the soils or surface water bodies (rivers, streams, and lakes) located in the tequila production regions, without complying with the requirements established by current Mexican regulations [2,6,7].
Tequila vinasses are characterized by their typical dark reddish-brown color and an alcohol-caramel smell, with high temperatures of up to 90 °C, an acidic pH of approximately 3.4 to 4.5, and high electrical conductivity (2.4 to 5.8 mS/cm) [3,8]. In addition, vinasses contain fats, oils, and grease (FOG) in concentrations of 10 to 100 mg/L, total chemical oxygen demand (COD) from 60,000 to 100,000 mg/L, total biochemical oxygen demand (BOD5) from 35,000 to 60,000 mg/L, total solids from 25,000 to 50,000 mg/L, phosphates from 100 to 700 mg/L, and total nitrogen from 20 to 50 mg/L, among others [9,10,11].
These characteristics of tequila vinasses make them a highly dangerous waste for surface aquatic ecosystems if they are discharged without any treatment or with inadequate treatment. Different studies have shown evidence for the negative consequences for the environment of vinasses from other types of industries but with similar characteristics to tequila vinasses [12]. Among them, the evaluation of the toxicity of sugarcane vinasse from the production of refined sugar and ethanol stands out [4]. It was found that vinasse has toxic and cytotoxic potential in fish liver and that this depends on the concentration of vinasse in bodies of water [13,14]. Gunkel et al. [15] evaluated the Ipojuca river in northeastern Brazil, which receives runoff from vinasse irrigation from sugarcane crops, and revealed that vinasse was the main source of contamination in the river, because it causes an increase in the temperature and acidification of the water and increases the turbidity and depletion of dissolved oxygen [13,15].
On the other hand, the Valles region of the State of Jalisco, located in the region with Denomination of Origin to produce Tequila in Mexico [16], stands out as the region with the highest number of tequila factories (44), with the municipality of Tequila having 22 TFs in 2021 [2]. In this way, the main economic activity in both the region and the municipality is the production of tequila [17]. This municipality is part of the Tequila Route in the Agave Landscape that attracts hundreds of both national and international tourists per year [18]. Furthermore, due to the increase in tequila consumption around the world in recent years [16], the number of tequila factories is increasing, which implies a greater generation of tequila vinasses. Due to the physicochemical characteristics of the vinasses and their possibly inadequate disposal, the Valles region is considered an environmental risk area since there are no effective vinasse disposal plans [5].
In addition, in general, given the inappropriate management of wastewater in Mexico, the surface water exhibits different degrees of deterioration. An example of this is the Santiago River, which is considered one of the most polluted and deteriorated rivers in Mexico since it receives constant discharges of domestic and industrial wastewater, with contributions of up to 4.22 ton/day of COD, 1.87 ton/day of BOD5, and 4.44 tons/day of total suspended solids (TSSs) [19,20]. The Santiago River has a length of 562 km, originates in Lake Chapala, and flows into the Pacific Ocean in the state of Nayarit [21]; part of its route takes place in the Valles region of the state of Jalisco. Tequila vinasses are among the industrial wastewaters that the Santiago River receives, since these are discharged without treatment or with incomplete treatment in different streams that end up flowing into this river [5]. In Mexico, despite the increasing production of tequila [16] and the consequent generation of vinasse, as well as the common perception that it is discharged without treatment, there are no studies that fully demonstrate such discharges and their impacts.
Therefore, the aim of this research was to evaluate and analyze the quality of water in two streams in the municipality of Tequila in the Valles region of the state of Jalisco, Mexico and to comprehensively demonstrate whether or not they are being used as sites of final disposal of tequila vinasses. In this way, we expect to make visible the negative impacts of managing tequila vinasse in a very important tequila-producing region. This study was carried out by measuring water quality parameters at different points in the streams during the dry season and in different samples of tequila vinasse diluted with tap water (as a frame of reference) to analyze the level of contamination in the streams.

2. Materials and Methods

2.1. Study Area

The surface waters monitored were the Atizcoa and Jarritos Streams located in the municipality of Tequila, belonging to the Valles region of the state of Jalisco in Mexico. The Atizcoa Stream originates in the Tequila volcano and runs approximately 16.5 km until it empties into the Santiago River [22] as part of the Lerma Santiago basin (Figure 1). These streams are the most important in the town of Tequila, Jalisco. The Jarritos Stream is smaller than the Atizcoa Stream and there is no information available on where it originates or its source; apparently, it originates within the same town of Tequila, near some tequila factories where the first monitoring point was located.

2.2. Monitoring of Atizcoa and Jarritos Stream

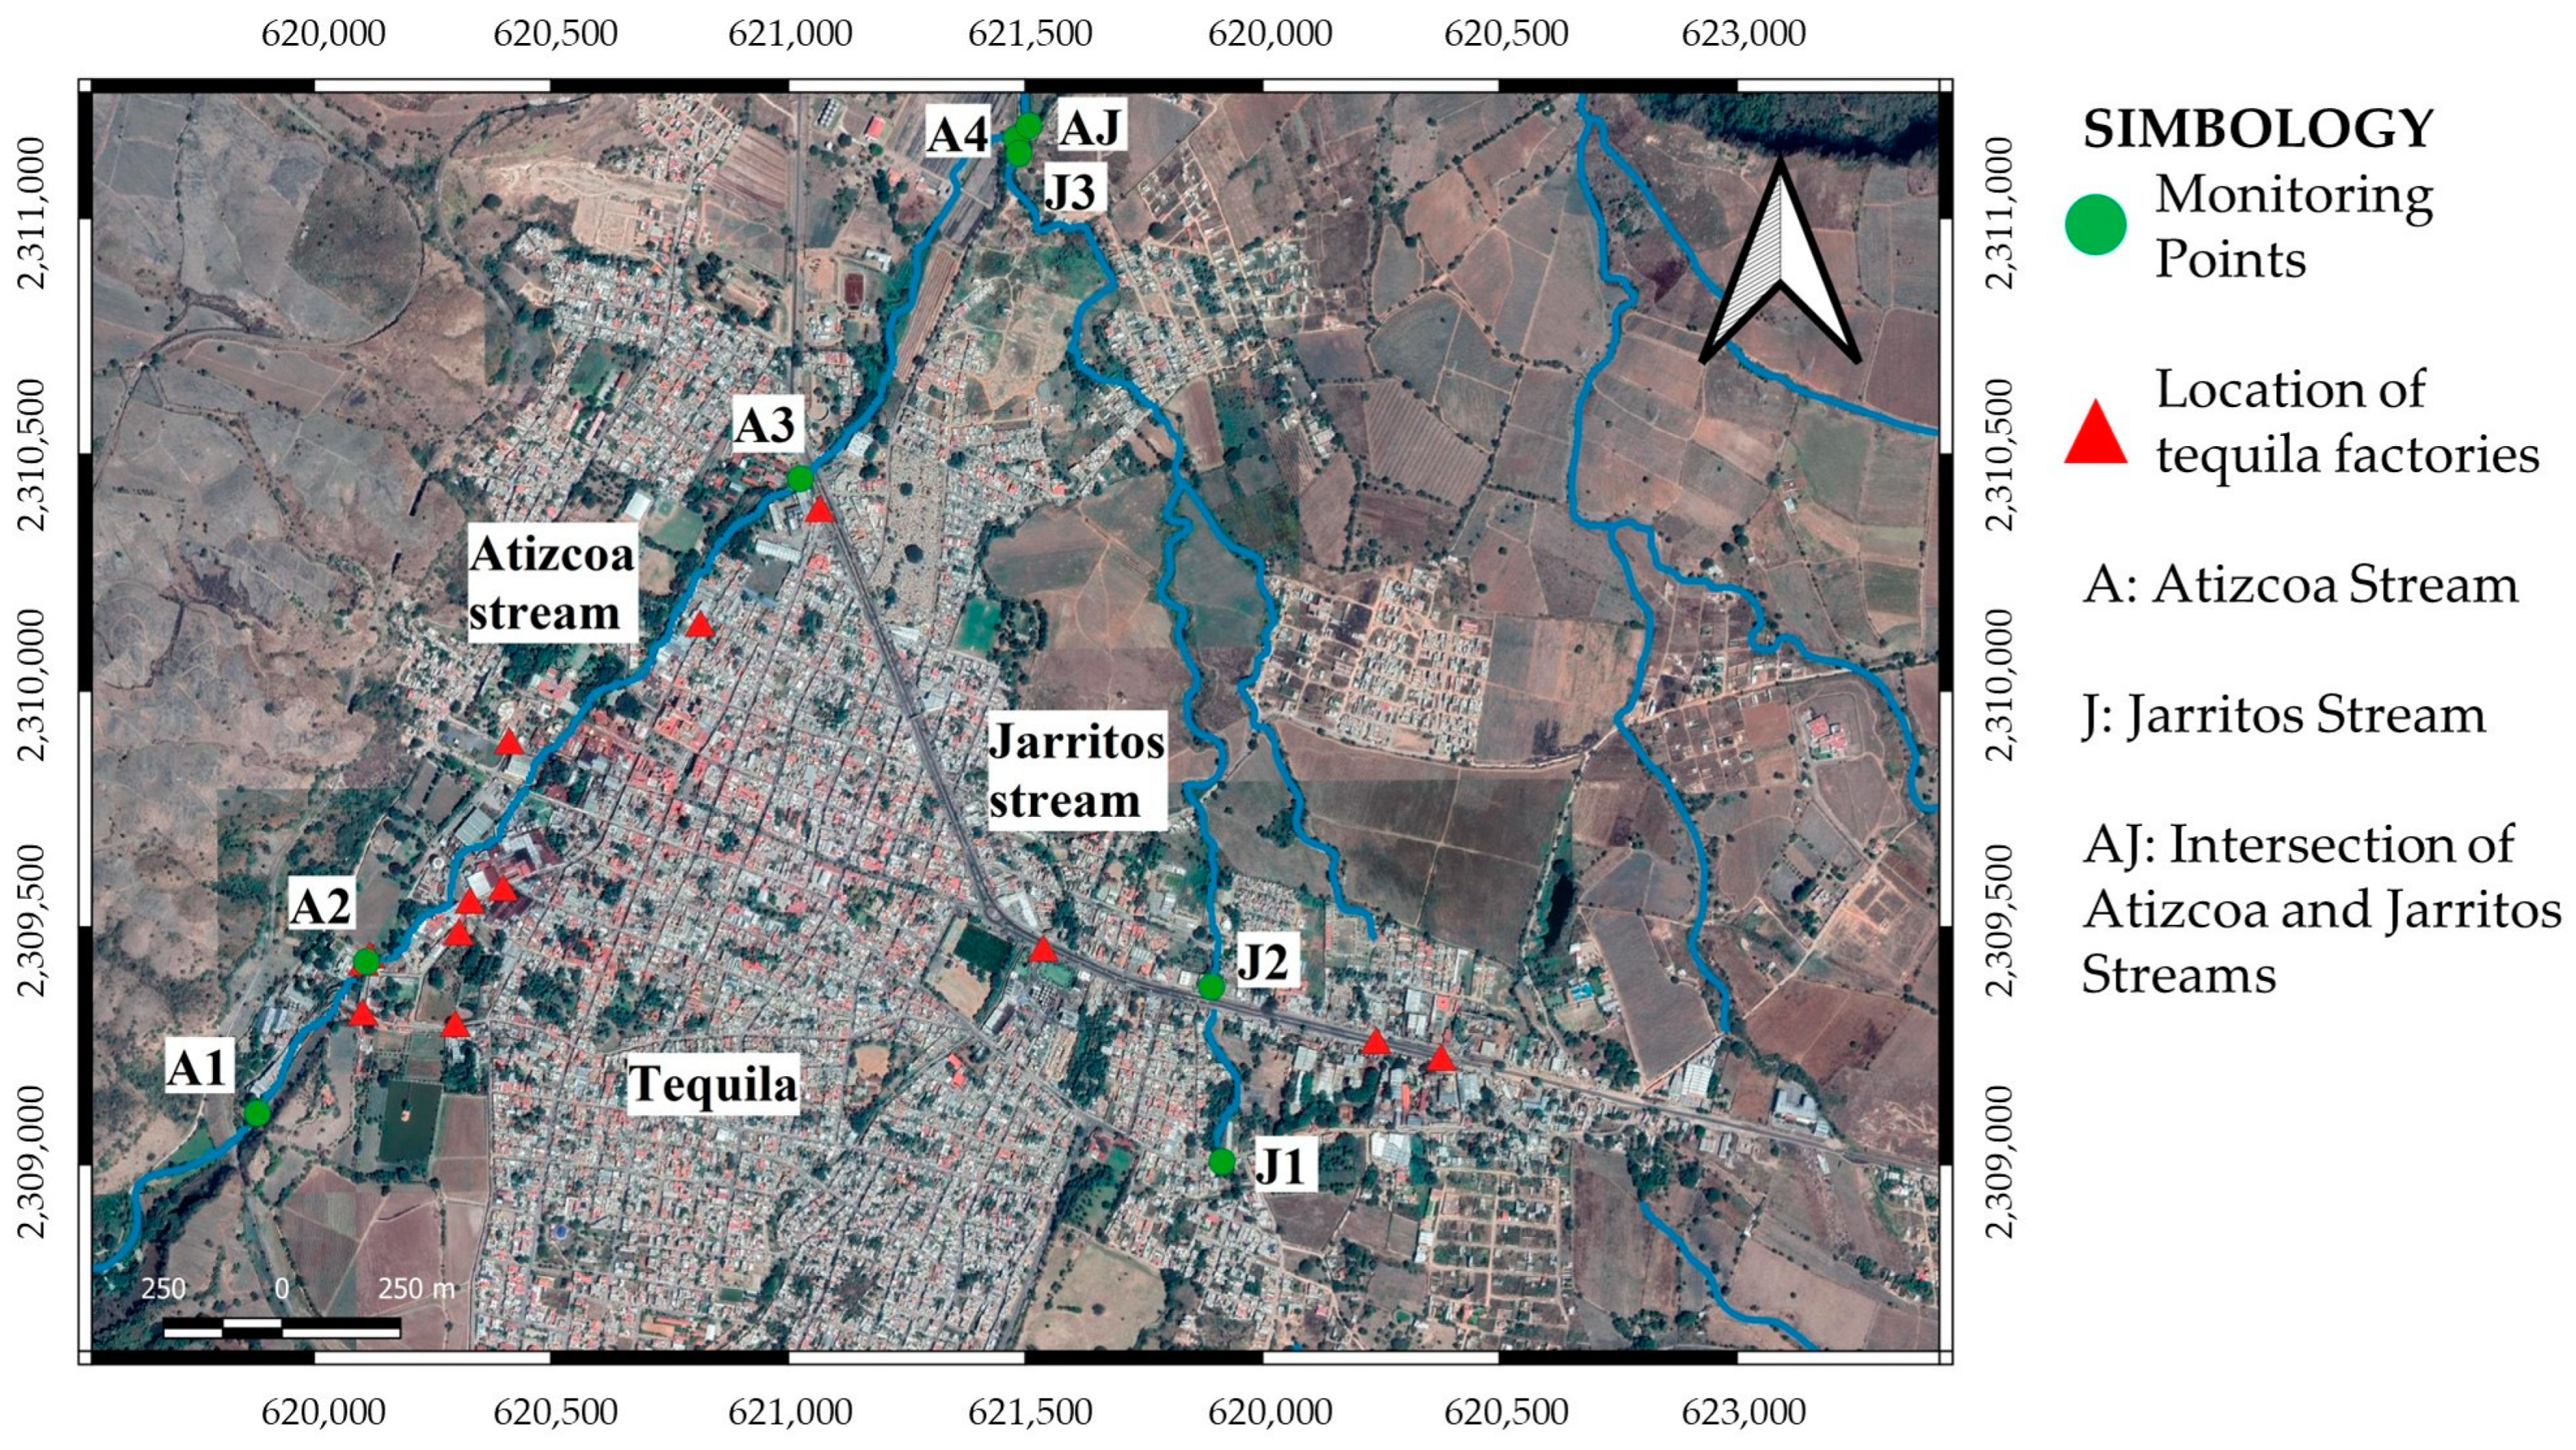
The monitoring was carried out in the dry season to avoid the dilution of probable contaminants. Three sampling campaigns were carried out every 15 days (2 February, 16 February and 1 March 2021) at 8 different points in the water bodies identified as the Atizcoa and Jarritos Streams. Figure 2 shows the location of the streams, the sampling points and evidence of the location of tequila factories near the streams. The 8 sampling points were located along the two streams; 4 of them in the Atizcoa Stream, 3 points in the Jarritos and 1 point after the union of both streams. The points were chosen for their proximity to tequila companies and the ease and accessibility of taking water samples. These points were numbered in ascending order in each of the streams as they moved downstream. In the Atizcoa Stream, the 4 points were identified as A1 (located before the stream passed through the tequila factories), A2, A3 (located very close to several tequila factories), and A4 (located after the stream passed through the tequila factories). In the Jarritos Stream, the 3 points were identified as J1, J2 (located near some tequila factories), and J3 (after the stream passed through the factories). Finally, the point after the union of both streams was named AJ.
With regard to the monitored parameters, some of them were measured directly in the monitored streams, that is, the measurements were made on-site. These parameters were pH, conductivity, dissolved oxygen, and temperature. For this, a HACH model HQ40d portable meter was used with specific INTELLICAL probes for each of the parameters. The other parameters, that is, turbidity, FOG, total suspended solids (TSSs), total phosphates, nitrite, nitrate, ammonia, organic nitrogen, COD, and BOD5 were determined at the Environmental Quality Research Center of the University of Guadalajara Campus Ciénega, located in the municipality of Ocotlán, Jalisco. The samples were preserved at 4 °C until processing and the techniques used were based on the Mexican standards, which in turn are based on the standard methods for the analysis of water and wastewater [23]. It is worth mentioning that the parameters were selected from those contaminants usually found in tequila vinasses. Furthermore, to have a reference to compare the concentration of each of the contaminants in the monitored streams, most of these parameters were evaluated in vinasse samples diluted with tap water (TW). Furthermore, the flow rate along the streams was estimated approximately using the well-known velocity/area method, which consists of measuring the mean velocity of the flow and the cross-sectional area of the stream (Flow rate (Q) = A (area of the cross-section transverse) × V (velocity of the water at the surface)) [24].

2.3. Statistical Analysis

Because COD is the parameter that best reflects contamination by tequila vinasse, a linear regression was carried out from control samples (tequila vinasse diluted with tap water) to determine the relationship between vinasse concentration (independent variable) and COD, and then, according to the model, estimate the presence of vinasse in the water courses. Additionally, a randomized block experimental design was used to analyze changes in water quality parameters at each stream sampling point. For the analyses, the response variables were the on-site measurements as well as the laboratory measured quality parameters mentioned in the last section. The treatments were all sampling points along each stream, specifically, A1, A2, A3, A4, and AJ for Atizcoa que Stream and J1, J2, J3, and AJ for Jarritos Stream. The date of the sampling campaign was used as a blocking factor. The linear regression and analysis of variance (ANOVA) were performed using STATGRAPHICS CENTURION XV.II with a significant level of p = 0.05. Specifically, when the ANOVA revealed significant differences, multiple comparisons were made using the least significant difference (LSD) test in order to determine the difference between means.

3. Results and Discussion

3.1. Measurements of Pollutants in Diluted Vinasse Samples as a Frame of Reference

Table 1 shows the concentrations of the different contaminants measured in diluted vinasse samples (with tap water). It is evident that contaminant concentrations were very low or absent in tap water and increased dramatically when the percentage of TV increased. In the case of pH, the value in tap water was 8.58 and was reduced to a value close to 4 when the samples contained between 25% and 100% vinasse. Due to the fact that, to the best of our knowledge, this is the first study in which TV discharges to surface waters are evaluated, there is no reference study to compare our results, so we consider these results with diluted vinasses to be suitable as a reference.
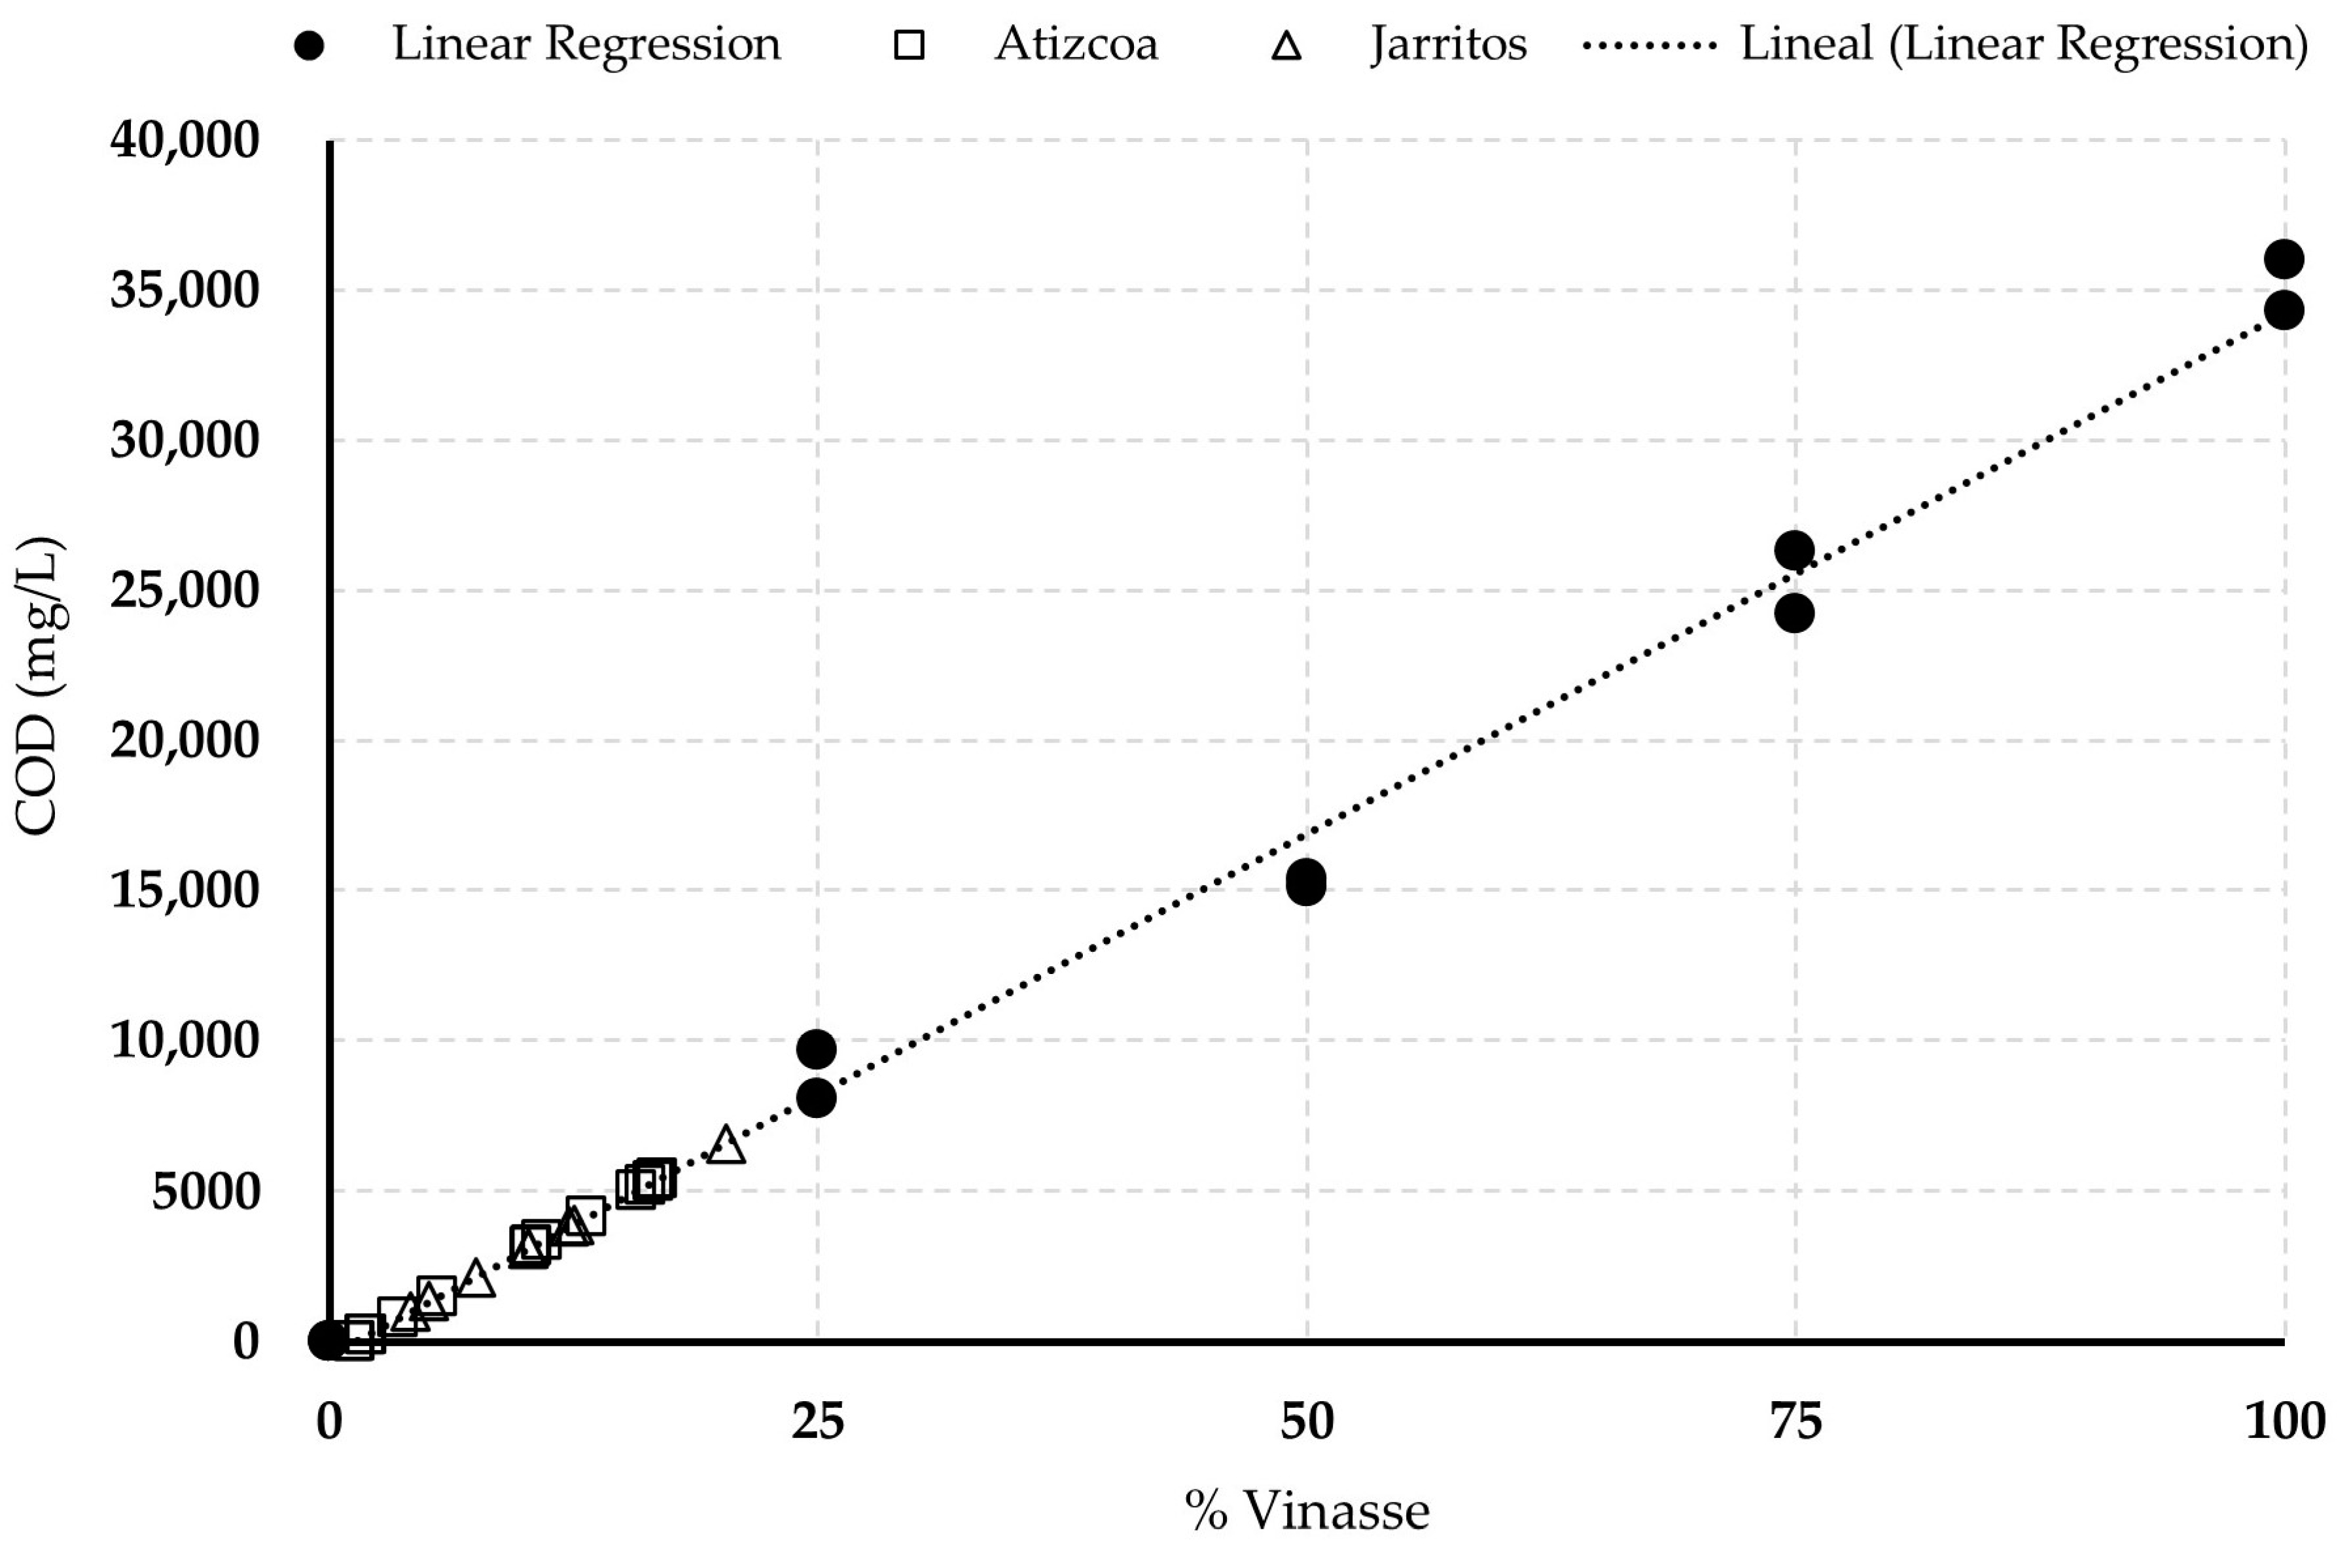
On the other hand, COD could be considered the main indicator of the presence of vinasse in water bodies, since its value can increase significantly in water bodies that receive vinasse discharges, as a result of its high values in the raw tequila vinasses, from 60,000 to 100,000 mg/L [2]. Additionally, linear regression models are widely used in environmental study cases in order to determine relationships between specific variables and specific industrial/anthropogenic activities or pollutants [25,26]. Figure 3 shows a positive correlation between vinasse concentration (%) and COD with a r2 of 0.9955. In addition, the variance analysis shows a p value < 0.05, which means that the variables have a significant statistical relationship. The adjusted regression model resulted in the following equation:
C O D = 439.6 + 346.692   ( %   V i n a s s e )
Based on this equation, the vinasse content was estimated in each of the sampling points of the streams, which were also graphed in Figure 3. In this way, the calculated values show the presence of vinasses in the two streams. For Atizcoa, it was estimated that there is an average vinasse content of 8.46 ± 6.3% in each of the sampling points, while in the Jarritos Stream the vinasse content is slightly higher, that is, 11.86 ± 4.9%.

3.2. Parameters Measured on Site

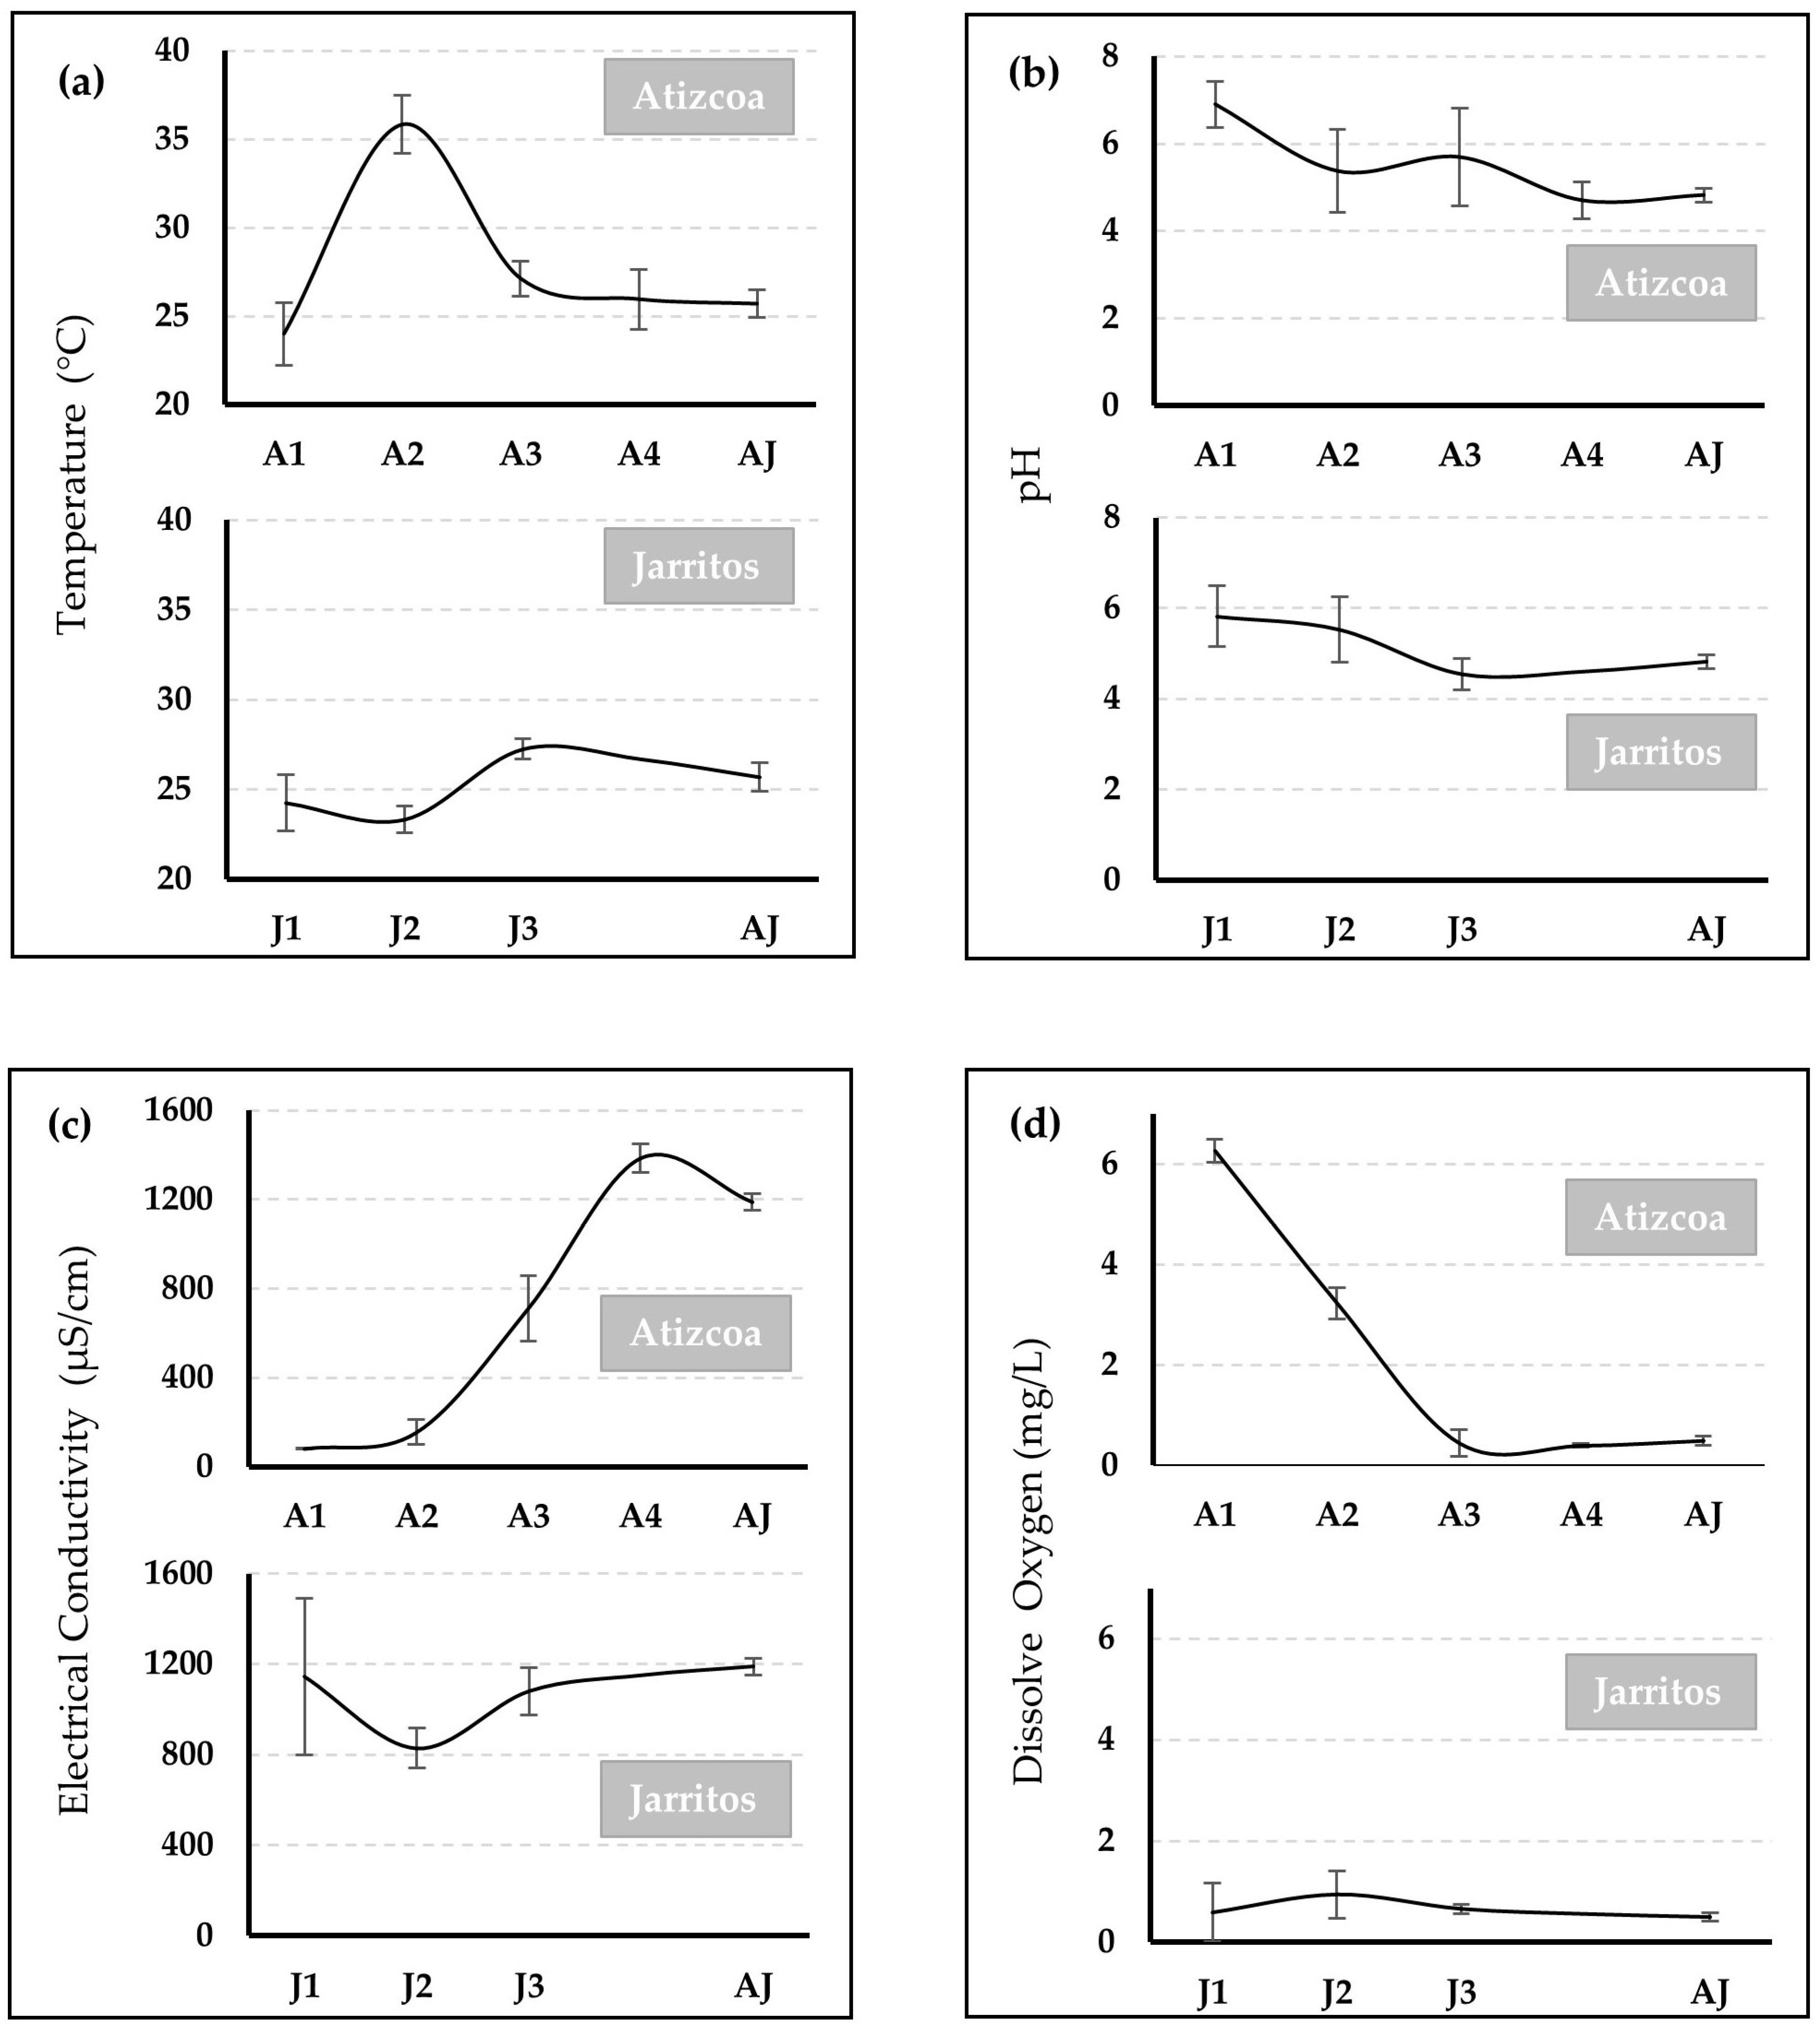
Figure 3 shows the average results of the parameters measured on site. These were temperature, conductivity, pH, and dissolved oxygen. The temperature (Figure 4a) results showed, in the Atizcoa Stream, a considerable increase at point A2 (37 °C) with respect to A1, with a significant difference (p < 0.05); this value was reduced as the stream advanced in its course, but even so, it remained above the value found in A1. In the Jarritos Stream, at point J3 there was also a considerable increase in the temperature value compared to J1 and J2 (from 22 to 28 °C), also with significant differences (p < 0.05). These increases in temperature demonstrate the discharges of vinasse, since vinasse is generated at 90 °C [10]. As is known, high temperatures have an impact on the physical and chemical properties of water, especially density, viscosity, solubility of dissolved oxygen, and the speed of chemical and biochemical reactions that could occur in the body of water [27].
Regarding the pH (Figure 4b), in the Atizcoa Stream, at point A1, the values were in the optimal range for aquatic life (7–7.5) [28]. However, as the stream ran through the other points near the TFs, these values decreased considerably until reaching acidic values (4–5) statistically different in comparison to A1 (p < 0.05). Meanwhile, in the Jarritos Stream, slightly acidic pH values (5–6.5) were found at all points, because from the first sampling point there were several TFs that, it seems, discharge their vinasses into the stream. No significant difference (p > 0.05) was found between the different sampling points. Consequently, point AJ, which is the union of the two streams, presented acidic pH values (4–5.5), which reflects the presence of vinasse discharges since such values are close to those measured in samples with 25 to 100% vinasse (Table 1). These pH values definitely preclude the existence of aquatic fauna in the two streams, since in general, acute or chronic exposure to acidic values negatively affects their physiological functions; most aquatic animals, including fish, live in a narrow pH range close to neutrality [28].
With respect to the conductivity results (Figure 4c), low values were found in the Atizcoa Stream at point A1, but as the stream ran through the area where the TFs are located (points A2, A3, and A4), these values increased significantly from one point to another (p < 0.05), reaching a final average value of 1384.77 ± 63.5 µS/cm at A4; this value is very similar to that found in the dilution of 50% of vinasse with tap water. Regarding the Jarritos Stream, high conductivity values were found at all points (between 750 and 1400 μS/cm) without significant differences (p < 0.05). As a result, at the AJ junction point, high values were also found (between 800 and 1400 μS/cm). Such values can only be due to discharges of tequila vinasse, since increases of such magnitude would not be reached if the discharges were domestic wastewater [27]. As the results in Table 1 suggest, tequila vinasses with high electrical conductivity values have the potential to modify the electrical conductivity of uncontaminated waters, such as streams.
Regarding DO concentrations (Figure 4d), in the Atizcoa Stream, the values were optimal at point A1, but as the stream flowed through the TFs, these values decreased significantly (p < 0.05) from 6 to 0.5 mg/L. In contrast, in the Jarritos Stream, at all points the DO concentrations were low, between 1.27 to 0.5 mg/L, without significant difference between them (p < 0.05) and, as expected, at point AJ, where both streams join, the DO concentration values were very low (0.5 mg/L). This was to be expected when physically seeing the state of the streams. The noticeable turbidity of the water prevents the sun’s rays from penetrating properly, making it impossible for photosynthetic organisms that produce oxygen to be present. The decrease in DO is also due to excess organic matter and high temperatures. The high concentrations of organic matter cause the aerobic microorganisms responsible for its degradation to demand more DO than usual, which leads to its reduction [2,13,20]. In this way, streams develop a toxic environment for aerobic aquatic life, enabling the life of only a small group of anaerobic microorganisms [27].

3.3. Parameters Measured in the Laboratory

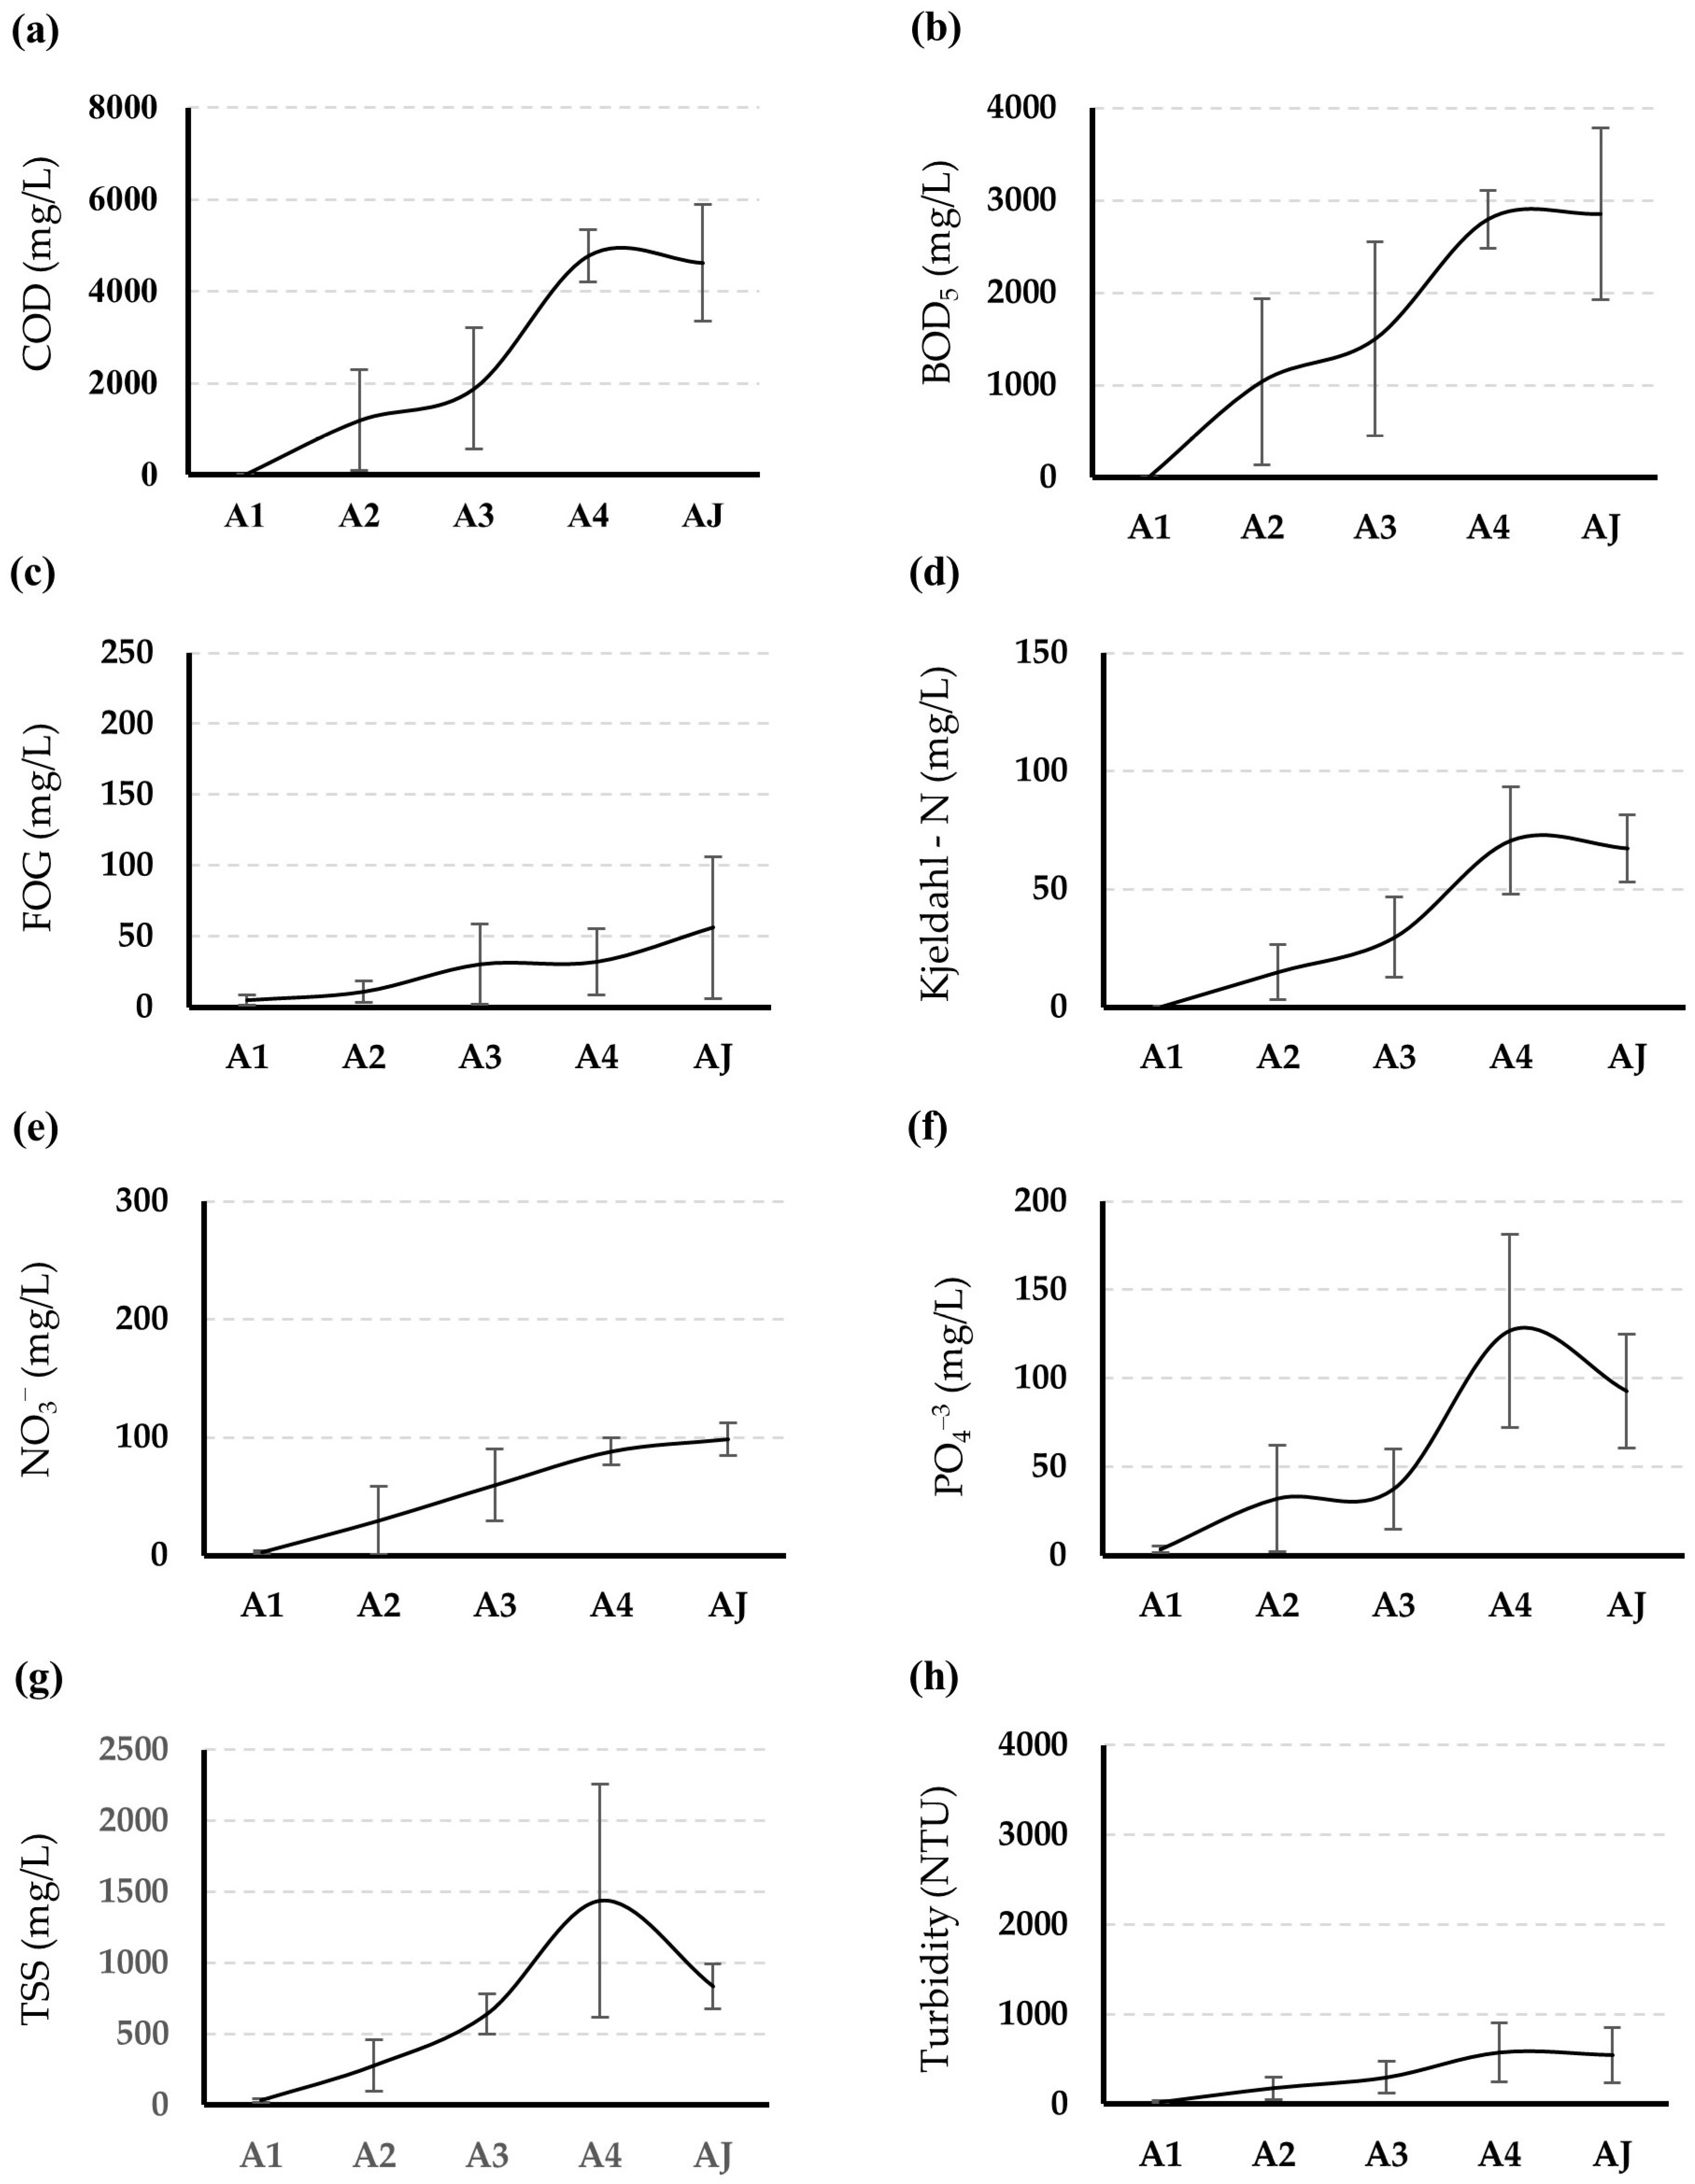
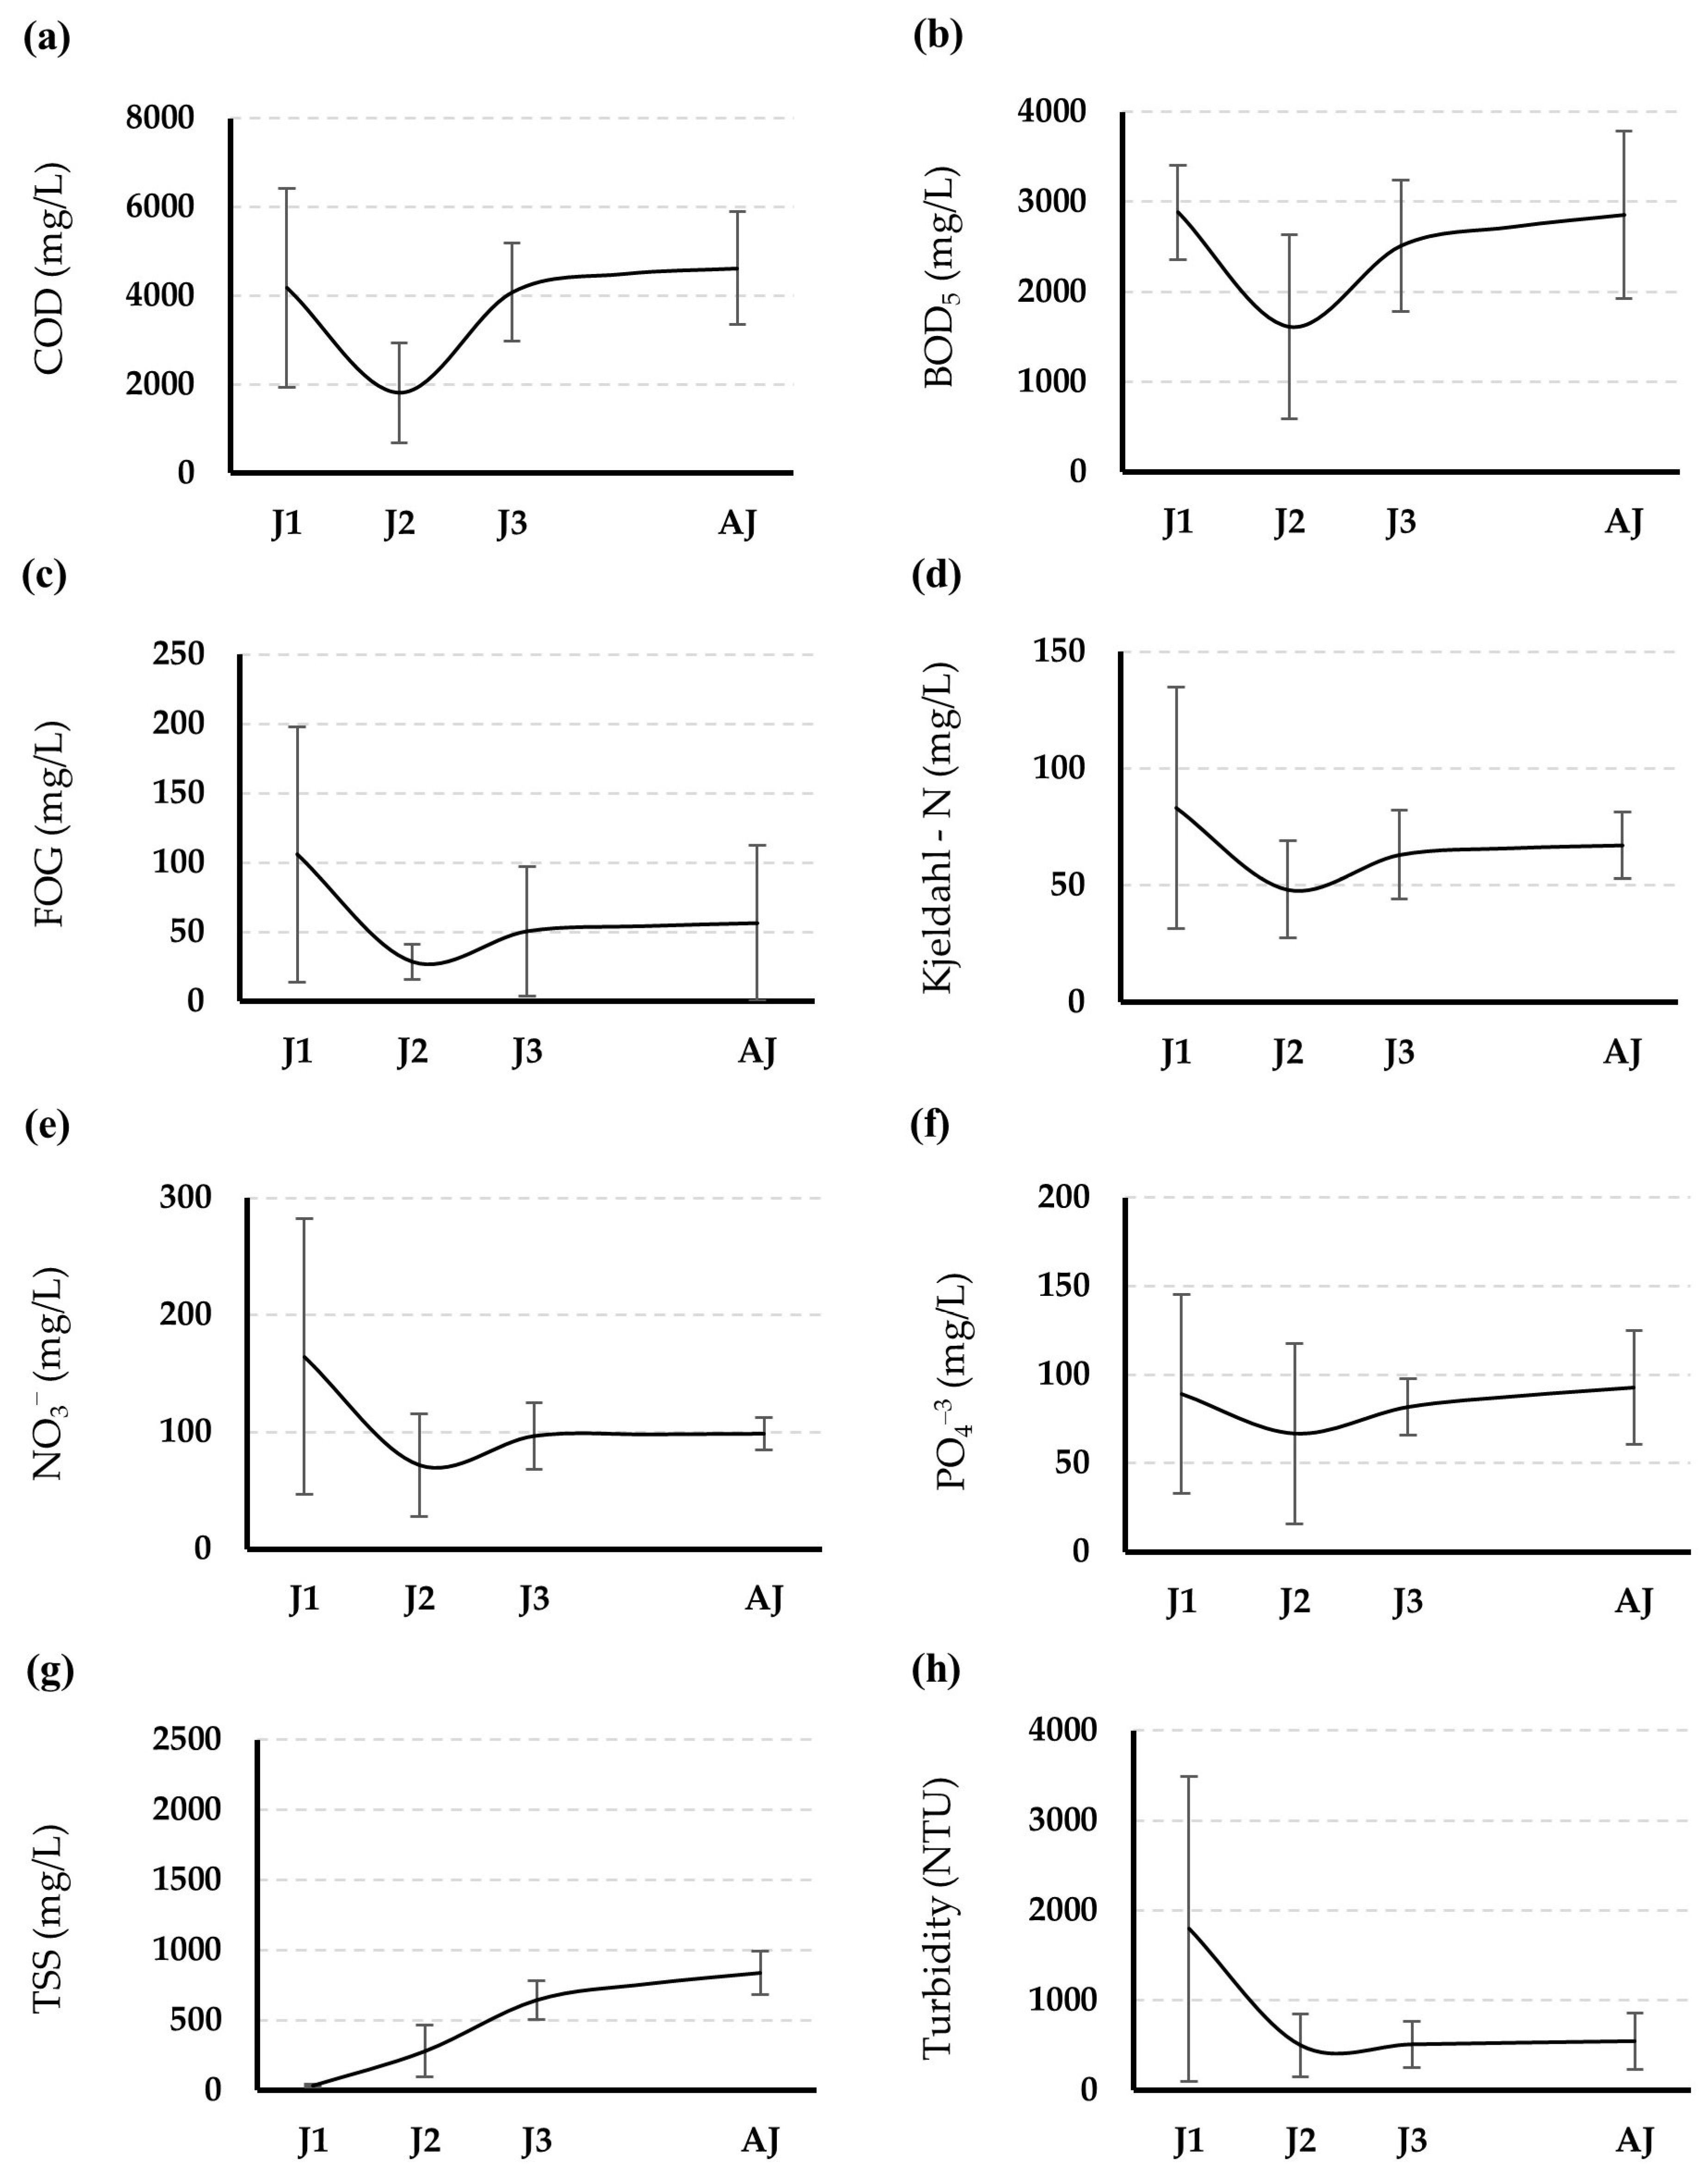
The parameters measured in the laboratory are reported in Figure 5 for Atizcoa Stream and Figure 6 for Jarritos Stream.
Regarding the results for COD and BOD5, which are indicators of the content of organic matter in the bodies of water, it was found that at point A1 of the Atizcoa Stream, the average values were low, that is, 9.7 ± 1.5 mg/L and 7.7 ± 1.9 mg/L, respectively. According to the water quality indices of the Water National Commission (CONAGUA) [1], such values allow the stream to be classified as “acceptable quality” for BOD5 and “good quality” for COD. However, as the stream flowed through the TFs (points A2, A3, and A4), these values increased significantly (p < 0.05) until reaching average values of 4778.5 ± 565.25 mg/L and 2792.5 ± 314.35 for COD and f BOD5, respectively, at A4. In contrast, in the Jarritos Stream, the concentrations of these pollutants were high in the three sampling points along the sampling campaigns (from 1005 to 6590 mg/L for COD and from 930 to 3346 mg/L for BOD5) without significant difference between the sampling points (p < 0.05). As a result, when the two streams joined, at point AJ, the concentrations were also high (between 3162.5 to 5395 mg/L for COD and between 1919.2 to 3775 mg/L for BOD5). Such values are unusually high, much higher than the values even for municipal wastewater considered to be of high concentration (400 mg/L for BOD5 and 1000 mg/L for COD) [29]. According to the estimation using the linear regression model between COD and % vinasse, the two streams had vinasse in different percentages. In general, the polluting potential of vinasses could be up to 100 times higher than that of domestic sewage due mainly due to the low pH, high corrosivity, and BOD5 concentrations [14]. Evidently, according to the CONAGUA quality indices, the two streams are classified as heavily polluted [1].
With respect to the concentration of FOG, in Atizcoa Stream the average concentrations did not show a significant difference between the sampling points (p > 0.05), although the average concentrations were 5.0 ± 3.6 and 56.2 ± 61.0 at A1 and A4, respectively. It is likely that the ANOVA was affected by the small number of samples. In the Jarritos Stream, the three points presented average high concentrations (28.5 ± 12.6 mg/L to 105.8 ± 91.7 mg/L), without significant differences (p > 0.05). Point AJ also presented a high concentration of FOG that was in the range of 12.62 to 125.94 mg/L. These values show again that the streams are receiving wastewater discharges, presumably tequila vinasse. According to [2], an average concentration of 119 ± 109 mg/L of FOG was found in the vinasse of 24 tequila factories. It is important to highlight that the presence of FOG in tequila vinasse is due to its content in the agave plant. In agave bagasse (the solid residue after extraction of the cooked juice during the production of tequila) the content of extractives, which includes fats, phenolics, resin acids, waxes, and inorganics, varies between 19 and 57% [30]. FOG are considered a basic contaminant, according to the Official Mexican Standard NOM-001-SEMARNAT 2021, which must be removed or stabilized by conventional processes; in this case, the values found in the two streams were mostly higher than the maximum limits allowed for discharges, which is 15 mg/L [31].
With regard to the results of nitrogen compounds, very high concentrations were found in some monitored points of the streams. Specifically, for Kjeldahl nitrogen, which is the sum of organic nitrogen and ammonia, the concentrations increased significantly from A1 to A4 (p < 0.5), reaching an average value of 70.6 mg/L after the stream flowed through the TFs. In the Jarritos Stream, at all points as well as at the AJ junction point, high concentrations were observed (between 28.9 and 131.4 mg/L) in the different sampling campaigns with no significant difference between the sampling points (p > 0.05). In this case, some values were similar to those in Table 1 for samples with 25% vinasse. In the case of nitrate, it can be seen in Figure 5 that at point A1 of the Atizcoa Stream, the average concentration was low (2.7 mg/L), but it increased significantly (p < 0.05)) as the stream flowed through the TFs. In contrast, in the Jarritos Stream, nitrate concentrations were high at all sampling points without difference (p > 0.05). Regarding nitrite, it can be highlighted that, in the eight points, the concentrations were low (between 0.01 and 0.6 mg/L); this was expected, since nitrite is an intermediate compound in the nitrogen transformation reactions [32]. In general, nitrogen is one of the main pollutants that cause eutrophication of surface waters when untreated or poorly treated wastewater is discharged into them [33].
Regarding phosphate concentrations, again, low concentrations were found in A1 of the Atizcoa Stream and increasing concentrations along the course of the stream (p < 0.05), as well as permanently high concentrations along the Jarritos Stream (p > 0.05). High concentrations of phosphates and nitrate in surface water bodies can cause eutrophication, resulting in the presence of algae and aquatic weeds in water bodies [34]. That being said, in the case of these streams, the high turbidity makes it impossible for sunlight to penetrate, so the presence of algae is not possible. However, when the streams finally flow into the Santiago River, there they can contribute to the eutrophication that is observed in some parts of the river, where it is covered with Eichornia crassipes [35].
Turbidity and TSS had the same trend as the aforementioned parameters. In the Atizcoa Stream, it can be seen in Figure 5 that the values of these parameters increased as the stream ran through the TFs. It has been reported that TSS reaches up to 24.7 g/L in tequila vinasses [4], so vinasse discharges significantly impact the concentration of these two parameters. The turbidity in the Atizcoa Stream ranged from 16 to 785 NTU and the TSS ranged from 36 to 829 mg/L. The variation between the sampling points was significant for both parameters (p < 0.05). In the Jarritos Stream, high turbidity and TSS values were also observed, mainly on February 16, where point J1 stood out with values of 4490 NTU of turbidity and 6185 mg/L of TSS; at point AJ, turbidity and SST also presented high values, between 227 and 844 NTU for turbidity and between 657.1 and 941.7 mg/L for TSS. In general, the values of both parameters were exceptionally high, indicating that the streams transported mainly vinasses. Some specific values were similar to those of samples with 75% vinasse (Table 1). In this case, there was no significant difference between the sampling points of the stream (p > 0.05). By comparison, [27] found mean values of 55.66 ± 4.18 NTU and 31.71 ± 1.41 mg/L for turbidity and TSS, respectively, at a domestic wastewater discharge point in a stream in Mali. Moreover, [36] reported a concentration 49.46 ± 21.59 mg/L of TSS and 76.23 ± 51.27 NTU of turbidity in the Cau River in Vietnam during the dry season. On the other hand, based on the concentration of TSS, the two streams are classified as highly polluted bodies of water (TSS concentration > 400 mg/L), according to the water quality indices of the Water National Commission (CONAGUA) [1].
Regarding the flow rate, it was found that in the Atizcoa Stream, it varied from 23 L/s at the point prior to its passage through the tequila plants (A1) to 53 L/s at point A2 and finally to 107 L/s before joining the Jarritos Stream (A4). Meanwhile, in the Jarritos Stream, the flow rate was lower, varying from 18 L/s to 84 L/s at the last sampling point. This increase in stream flow probably also reflects the incorporation of tequila vinasses.
Finally, the results of the physicochemical analyses of the water samples from the two streams show that their contamination is evident. Therefore, it is suggested that tequila companies in the Valles region implement best practices to mitigate this impact in the short term. It is recommended that tequila vinasses be treated using conventional wastewater treatment processes such as pretreatment, primary treatment, secondary treatment (physicochemical and/or biological), and advanced treatment processes. In cases of companies that cannot afford a conventional wastewater treatment plant, such as micro- and small factories, low-cost alternative technologies are recommended such as constructed wetlands [4] or advanced oxidation processes [37]. In addition, vinasses could be used and valorized for other applications such as the generation of biogas [38], the production of microbiological culture media in bioprocesses and bioremediation [39], or as raw material for the production of animal foods [40] due to the high content of organic matter, water, and nutrients such as potassium, calcium, magnesium, sulfur, and nitrogen.

4. Conclusions

By taking as reference the concentrations of contaminants in samples with different percentages of tequila vinasse as well as the estimation of the vinasse content in each of the monitored points (through a linear regression model developed between COD and % vinasse), we confirmed that the two monitored streams are being used as final disposal sites for tequila vinasse.
The state of total deterioration in which they are found is physically evident, as it is impossible for aquatic life to exist in such conditions. The increase in the concentration and values of parameters that reflect contamination from the discharge of vinasse (temperature, conductivity, turbidity, FOG, TSS, COD, BOD, total phosphate, nitrate, and Kjeldahl nitrogen), as well as the decrease in the concentration and values of important parameters for the development of aquatic life such as pH and DO, were found to be overwhelming once the streams flowed through the tequila factories. Due to the information above, there is an urgent need for tequila companies to implement treatment systems for the vinasse generated. It is recommended that alternative treatment systems be evaluated alongside the conventional and economically accessible ones so that through their implementation the contamination of these bodies of water can be reduced for the benefit of the locality itself.

Author Contributions

Conceptualization, F.Z.; methodology, A.T., A.M. and B.S.-R.; software, A.T.; validation, F.Z. and B.S.-R.; formal analysis, A.T., F.Z. and B.S.-R.; investigation, A.M.; resources, F.Z.; writing—original draft preparation, A.M. and B.S.-R.; writing—review and editing, A.T. and F.Z.; supervision, F.Z.; project administration, F.Z.; funding acquisition, F.Z. All authors have read and agreed to the published version of the manuscript.

Funding

This research was funded by the National Water Commission and National Council of Science and Technology of Mexico through the “FONDO SECTORIAL DE INVESTIGACIÓN Y DESARROLLO SOBRE EL AGUA”, CALL 2018 as part of the project “TECNOLOGÍAS SUSTENTABLES PARA TRATAMIENTO DE VINAZAS Y SU REUSO EN ACTIVIDADES PRODUCTIVAS”; grant number A3-S-66470.

Data Availability Statement

Not applicable.

Acknowledgments

We thank the University of Guadalajara through the Centro Universitario de la Ciénega for its support during the surface water monitoring process.

Conflicts of Interest

The authors declare no conflict of interest.

References

  1. Water National Comission (Comision Nacional del Agua). Estadisticas del Agua en México; Water National Comission: Mexico City, Mexico, 2023. [Google Scholar]
  2. Zurita, F.; Tejeda, A.; Montoya, A.; Carrillo, I.; Sulbarán-Rangel, B.; Carreón-Álvarez, A. Generation of Tequila Vinasses, Characterization, Current Disposal Practices and Study Cases of Disposal Methods. Water 2022, 14, 1395. [Google Scholar] [CrossRef]
  3. Montoya, A.; Tejeda, A.; Sulbarán-Rangel, B.; Zurita, F. Treatment of tequila vinasse mixed with domestic wastewater in two types of constructed wetlands. Water Sci. Technol. 2023, 87, 3072–3082. [Google Scholar] [CrossRef]
  4. Zurita, F.; Vymazal, J. Oportunities and challenges of using constructed wetlands for the treatment of high-strength distillery effluents: A review. Ecol. Eng. 2023, 196, 107097. [Google Scholar] [CrossRef]
  5. Díaz-Vázquez, D.; Carrillo-Nieves, D.; Orozco-Nunnelly, D.A.; Senés-Guerrero, C.; Gradilla-Hernández, M.S. An Integrated Approach for the Assessment of Environmental Sustainability in Agro-Industrial Waste Management Practices: The Case of the Tequila Industry. Front. Environ. Sci. 2021, 9, 682093. [Google Scholar] [CrossRef]
  6. Tejeda, A.; Valencia-Botín, A.J.; Zurita, F. Resistance evaluation of Canna indica, Cyperus papyrus, Iris sibirica, and Typha latifolia to phytotoxic characteristics of diluted tequila vinasses in wetland microcosms. Int. J. Phytoremediation 2023, 25, 1259–1268. [Google Scholar] [CrossRef]
  7. Toledo-Cervantes, A.; Villafán-Carranza, F.; Arreola-Vargas, J.; Razo-Flores, E.; Méndez-Acosta, H.O. Comparative evaluation of the mesophilic and thermophilic biohydrogen production at optimized conditions using tequila vinasses as substrate. Int. J. Hydrogen Energy 2020, 45, 11000–11010. [Google Scholar] [CrossRef]
  8. Kharayat, Y. Distillery wastewater: Bioremediation approaches. J. Integr. Environ. Sci. 2012, 9, 69–91. [Google Scholar] [CrossRef]
  9. García-Depraect, O.; León-Becerril, E. Fermentative biohydrogen production from tequila vinasse via the lactate-acetate pathway: Operational performance, kinetic analysis and microbial ecology. Fuel 2018, 234, 151–160. [Google Scholar] [CrossRef]
  10. López-López, A.; Contreras-Ramos, S.M. Tratamiento de Efluentes y aprovechamiento de residuos, capítulo 8. In Ciencia y Tecnología del Tequila: Avances y Perspectivas, 2nd ed.; Centro de Investigación y Asistencia en Tecnología y Diseño del Estado de Jalisco (CIATEJ): Guadalajara, Mexico, 2015. [Google Scholar]
  11. Ramírez-Ramírez, A.A.; Sulbarán-Rangel, B.C.; Jáuregui-Rincón, J.; Lozano-Álvarez, J.A.; la Torre, J.A.F.-d.; Zurita-Martínez, F. Preliminary Evaluation of Three Species of Ligninolytic Fungi for Their Possible Incorporation in Vertical Flow Treatment Wetlands for the Treatment of Tequila Vinasse. Water Air Soil Pollut. 2021, 232, 456. [Google Scholar] [CrossRef]
  12. Ratna, S.; Rastogi, S.; Kumar, R. Current trends for distillery wastewater management and its emerging applications for sustainable environment. J. Environ. Manag. 2021, 290, 112544. [Google Scholar] [CrossRef]
  13. Correia, J.E.; Christofoletti, C.A.; Marcato, A.C.C.; Marinho, J.F.U.; Fontanetti, C.S. Histopathological analysis of tilapia gills (Oreochromis niloticus Linnaeus, 1758) exposed to sugarcane vinasse. Ecotoxicol. Environ. Saf. 2017, 135, 319–326. [Google Scholar] [CrossRef]
  14. Marinho, J.F.U.; Correia, J.E.; Marcato, A.C.d.C.; Pedro-Escher, J.; Fontanetti, C.S. Sugar cane vinasse in water bodies: Impact assessed by liver histopathology in tilapia. Ecotoxicol. Environ. Saf. 2014, 110, 239–245. [Google Scholar] [CrossRef]
  15. Gunkel, G.; Kosmol, J.; Sobral, M.; Rohn, H.; Montenegro, S.; Aureliano, J. Sugar Cane Industry as a Source of Water Pollution—Case Study on the Situation in Ipojuca River, Pernambuco, Brazil. Water Air Soil Pollut. 2007, 180, 261–269. [Google Scholar] [CrossRef]
  16. Tequila Regulatory Council (Consejo Regulador del Tequila). Producción Total de Tequila y Tequila 100% en 2023. Available online: https://www.crt.org.mx/EstadisticasCRTweb/ (accessed on 1 March 2023).
  17. Instituto Nacional de Estadística y Geografía; Consejo Agroalimentario de Jalisco. Colección de estudios sectoriales y regionales. In Conociendo la Industria del Tequila y el Mezcal; Instituto Nacional de Estadística y Geografía: Aguascalientes, Mexico, 2019. [Google Scholar]
  18. Gómez-Cuevas, K.; Delgado-Cruz, A.; Palmas-Castrejón, Y.D. Originalidad del tequila como símbolo de identidad mexicana. Percepción del turista-consumidor a partir de su exportación. RIVAR (Santiago) 2020, 7, 59–80. [Google Scholar] [CrossRef]
  19. Almazán-Torres, M.G.; Ordóñez-Regil, E.; Ruiz-Fernández, A.C. Uranium and plutonium in anoxic marine sediments of the Santiago River mouth (Eastern Pacific, Mexico). J. Environ. Radioact. 2016, 164, 395–399. [Google Scholar] [CrossRef] [PubMed]
  20. Torres, G.; Lozano, F.; Solis, J.; Garcia Velasco, J.; Medina, M.G.; Peregrina-Lucano, A. Air Quality and its Effects on Child Health of a Metropolitan City in Jalisco, Mexico. 2016. Available online: https://www.researchgate.net/publication/340314393_Air_Quality_and_its_Effects_on_Child_Health_of_a_Metropolitan_City_in_Jalisco_Mexico (accessed on 1 March 2023).
  21. Rizo-Decelis, L.D.; Andreo, B. Water quality assessment of the Santiago River and attenuation capacity of pollutants downstream Guadalajara City, Mexico. River Res. Appl. 2015, 32, 1505–1516. [Google Scholar] [CrossRef]
  22. Pérez de la Vega Baños, A. Efecto de las Descargas de las Industrias Tequileras Sobre las Poblaciones de Macroinvertebrados Bentónicos en el Arroyo Atizcoa; Municipio de Tequila, Jalisco; Mexico (diciembre, 1986-mayo, 1987) Universidad de Guadalajara: Guadalajara, Mexico, 1988. [Google Scholar]
  23. APHA; AWWA; WEF. Standard Methods for the Examination of Water and Wastewater, 21st ed.; American Public Health Association: Washington, DC, USA, 2005. [Google Scholar]
  24. González, A.; Ramírez, J.D. Manual Piragüero-Medición del Caudal; LibroArte: Medellin, Colombia, 2014. [Google Scholar]
  25. Fernandes, A.P.; Fonseca, A.R.; Pacheco FA, L.; Fernandes, L.S. Water quality predictions through linear regression—A brute force algorithm approach. MethodsX 2023, 10, 102153. [Google Scholar] [CrossRef]
  26. Veeramsetty, V.; Shadamaki, N.; Pinninti, R.; Guduri, N.; Ashish, G. Water quality index estimation using linear regression model. AIP Conf. Proc. 2022, 2418, 040033. [Google Scholar] [CrossRef]
  27. Alves, R.N.; Mariz, C.F., Jr.; de Melo Alves, M.K.; Cavalcanti, M.G.N.; de Melo, T.J.B.; de Arruda-Santos, R.H.; Zanardi-Lamardo, E.; Carvalho, P.S.M. Contamination and Toxicity of Surface Waters Along Rural and Urban Regions of the Capibaribe River in Tropical Northeastern Brazil. Environ. Toxicol. Chem. 2021, 40, 3063–3077. [Google Scholar] [CrossRef]
  28. Kwong, R.W.; Kumai, Y.; Perry, S.F. The physiology of fish at low pH: The zebrafish as a model system. J. Exp. Biol. 2014, 217, 651–662. [Google Scholar] [CrossRef]
  29. Tchobanoglous, G.; Burton, F.L.; Stensel, H.D.; Metcalf, E. Wastewater Engineering: Treatment and Reuse; McGraw-Hill: New York, NY, USA, 2003. [Google Scholar]
  30. Octavio, G.-D.; Daryl Rafael, O.-L.; Elizabeth, L.-B. A Comprehensive Overview of the Potential of Tequila Industry By-Products for Biohydrogen and Biomethane Production: Current Status and Future Perspectives. In New Advances on Fermentation Processes; Rosa María, M.-E., Ed.; IntechOpen: Rijeka, Croatia, 2019; Chapter 6. [Google Scholar]
  31. Secretariat of Environment and Natural Resources (Secretaria del Medio Ambiente y Recursos Naturales). Norma Oficial Mexicana, NOM-001-SEMARNAT-2021 Que Establece los Límites Máximos Permisibles de Contaminantes en las Descargas de Aguas Residuales en Aguas y Bienes Nacionales. 2021. Available online: https://www.dof.gob.mx/nota_detalle.php?codigo=5645374&fecha=11/03/2022#gsc.tab=0 (accessed on 1 March 2023).
  32. Del Toro Farías, A.; Zurita Martínez, F. Changes in the nitrification-denitrification capacity of pilot-scale partially saturated vertical flow wetlands (with corncob in the free-drainage zone) after two years of operation. Int. J. Phytoremediation 2021, 23, 829–836. [Google Scholar] [CrossRef]
  33. Nakase, C.; Zurita, F.; Nani, G.; Reyes, G.; Fernández-Lambert, G.; Cabrera-Hernández, A.; Sandoval, L. Nitrogen Removal from Domestic Wastewater and the Development of Tropical Ornamental Plants in Partially Saturated Mesocosm-Scale Constructed Wetlands. Int. J. Environ. Res. Public Health 2019, 16, 4800. [Google Scholar] [CrossRef] [PubMed]
  34. Mora, A.; García-Gamboa, M.; Sánchez-Luna, M.S.; Gloria-García, L.; Cervantes-Avilés, P.; Mahlknecht, J. A review of the current environmental status and human health implications of one of the most polluted rivers of Mexico: The Atoyac River, Puebla. Sci. Total Environ. 2021, 782, 146788. [Google Scholar] [CrossRef] [PubMed]
  35. Hansen, A.M.; González-Márquez, L.C. Scenarios of metal concentrations in the Arcediano Dam (State of Jalisco, Mexico). J. Environ. Sci. Health Part A 2010, 45, 99–106. [Google Scholar] [CrossRef]
  36. Son, C.T.; Giang, N.T.H.; Thao, T.P.; Nui, N.H.; Lam, N.T.; Cong, V.H. Assessment of Cau River water quality assessment using a combination of water quality and pollution indices. J. Water Supply Res. Technol. Aqua 2020, 69, 160–172. [Google Scholar] [CrossRef]
  37. Castillo-Monroy, J.; Godínez, L.A.; Robles, I.; Estrada-Vargas, A. Study of a coupled adsorption/electro-oxidation process as a tertiary treatment for tequila industry wastewater. Environ. Sci. Pollut. Res. 2021, 28, 23699–23706. [Google Scholar] [CrossRef]
  38. Toledo-Cervantes, A.; Méndez-Acosta, H.O.; Arreola-Vargas, J.; Gabriel-Barajas, J.E.; Aguilar-Mota, M.N.; Snell-Castro, R. New insights into microbial interactions and putative competitive mechanisms during the hydrogen production from tequila vinasses. Appl. Microbiol. Biotechnol. 2022, 106, 6861–6876. [Google Scholar] [CrossRef]
  39. Díaz-Vázquez, D.; Orozco-Nunnelly, D.A.; Yebra-Montes, C.; Senés-Guerrero, C.; Gradilla-Hernández, M.S. Using yeast cultures to valorize tequila vinasse waste: An example of a circular bioeconomy approach in the agro-industrial sector. Biomass Bioenergy 2022, 161, 106471. [Google Scholar] [CrossRef]
  40. Alemán-Nava, G.S.; Gatti, I.A.; Parra-Saldivar, R.; Dallemand, J.-F.; Rittmann, B.E.; Iqbal, H.M.N. Biotechnological revalorization of Tequila waste and by-product streams for cleaner production—A review from bio-refinery perspective. J. Clean. Prod. 2018, 172, 3713–3720. [Google Scholar] [CrossRef]
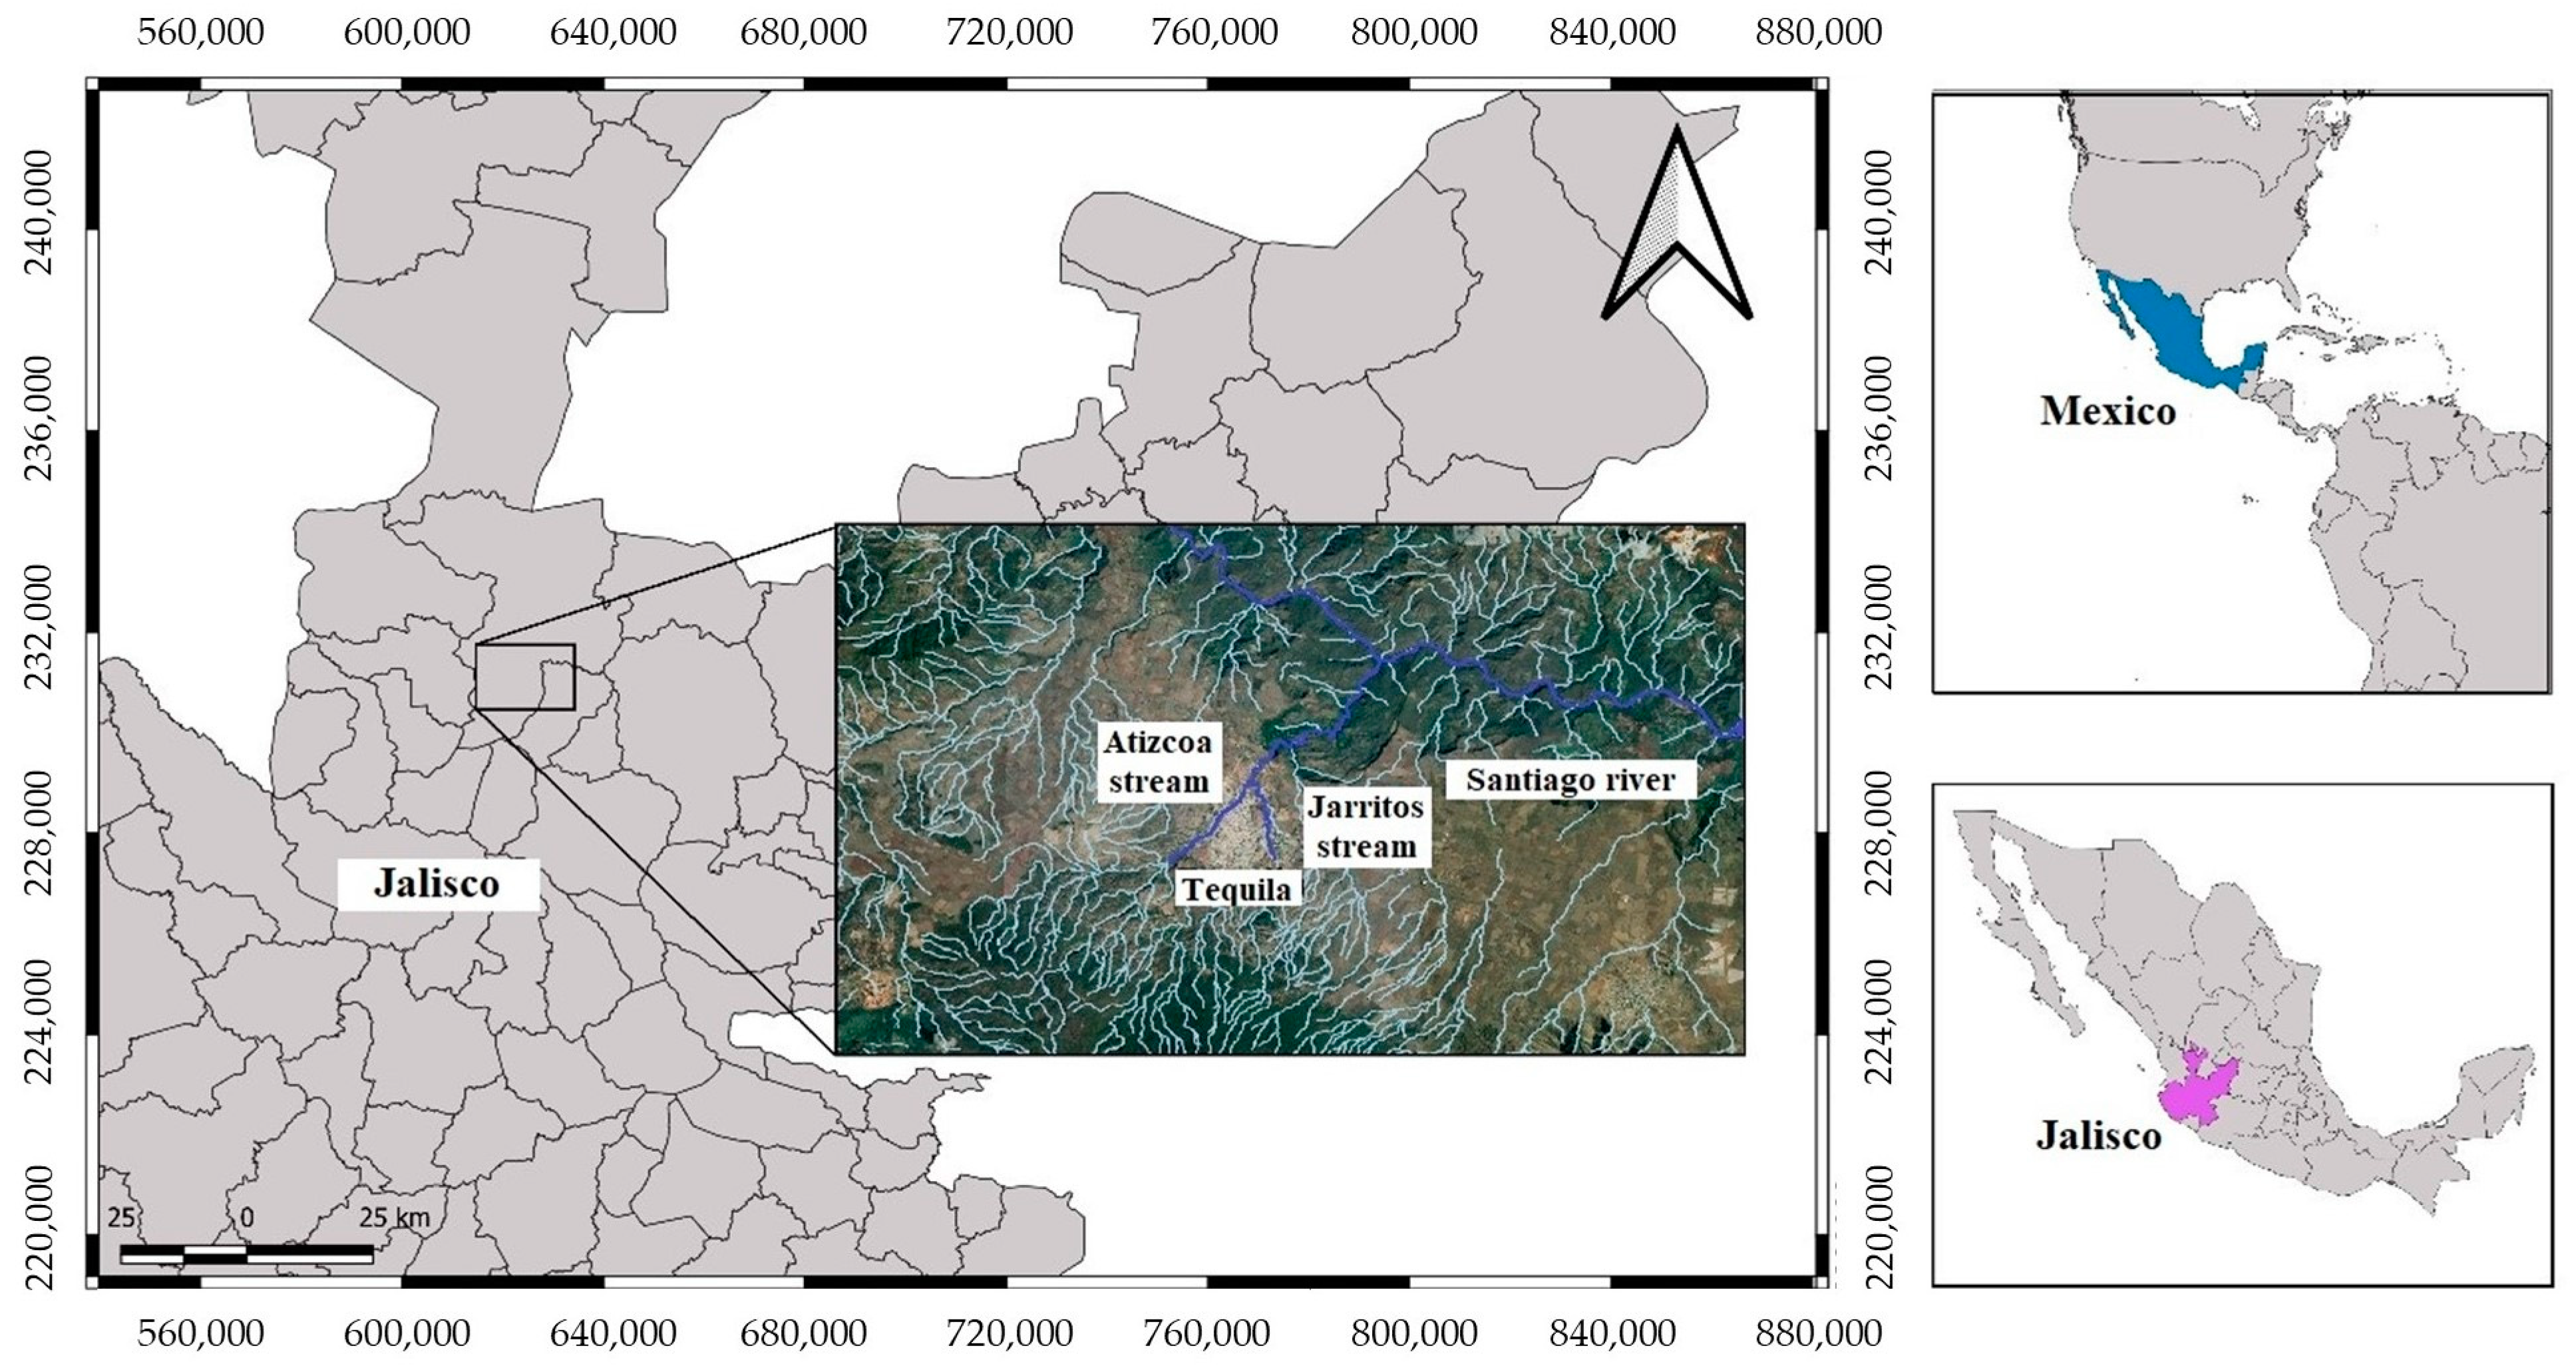
Figure 1. Geographical location of the study area in the municipality of Tequila.
Water 15 03773 g001
Figure 2. Sampling points in the Atizcoa and Jarritos Streams and evidence of the presence of tequila factories around them in the town of Tequila.
Water 15 03773 g002
Figure 3. Scatter plot with regression line that shows the relationship between COD and vinasse percentage.
Water 15 03773 g003
Figure 4. Parameters measured on-site in the Atizcoa and Jarritos Streams (mean ± confidence interval, p < 0.05, n = 3). (a) Temperature; (b) pH; (c) electrical conductivity; (d) dissolved oxygen.
Water 15 03773 g004
Figure 5. Parameters measured in the laboratory from sampling points of the Atizcoa Stream (mean ± confidence interval, p < 0.05, n = 3). (a) Chemical oxygen demand; (b) biochemical oxygen demand; (c) fats, oils, and grease; (d) Kjeldahl nitrogen; (e) nitrate; (f) phosphates; (g) total suspended solids; (h) turbidity.
Water 15 03773 g005
Figure 6. Parameters measured in the laboratory from sampling points of the Jarritos Stream (mean ± confidence interval, p < 0.05, n = 3). (a) Chemical oxygen demand; (b) biochemical oxygen demand; (c) fats, oils, and grease; (d) Kjeldahl nitrogen; (e) nitrate; (f) phosphates; (g) total suspended solids; (h) turbidity.
Water 15 03773 g006
Table 1. Pollutant concentrations in samples of diluted tequila vinasses with tap water a.
Dilutions of Tequila Vinasses with Tap Water
Parameter0% (TW)25%50%75%100%(TV)
Chemical oxygen demand (mg/L)13.5 ± 2.18850 ± 113115,225 ± 176.825,250 ± 1484.935,150 ± 1202.1
Total Kjeldahl nitrogen (mg/L)0.22 ± 0.02125.1 ± 4.8236.5 ± 8.9284.0 ± 21.7426.1 ± 2.8
Nitrate (mg/L)0.65 ± 0.07450 ±70.7655 ± 49.5880.0 ± 28.3220 ± 169.7
Nitrite (mg/L)0.004 ± 0.002.1 ± 0.002.9 ± 0.404.55 ± 0.216.05 ± 0.49
Total phosphates (mg/L)1.65 ± 0.78100 ± 14.1190 ± 70.7335 ± 7.1385 ± 49.5
Total suspended solids (mg/L)0.0 ± 0.03833 ± 235.78917 ± 117.912,417 ± 153217,833 ± 2121
Turbidity (NTU)0.0 ± 0.01300 ± 1182363 ± 40.34031 ± 298.46497 ± 1565.3
pH8.58± 0.003.96 ± 0.003.8 ±0.003.76 ±0.013.74 ± 0.01
Electrical conductivity (µs/cm)72.03 ± 0.10905.2 ± 0.571403.5 ± 0.711928.5 ± 2.122372 ± 1.41
Disclaimer/Publisher’s Note: The statements, opinions and data contained in all publications are solely those of the individual author(s) and contributor(s) and not of MDPI and/or the editor(s). MDPI and/or the editor(s) disclaim responsibility for any injury to people or property resulting from any ideas, methods, instructions or products referred to in the content.