Article

Study on the Evolution and Adaptability of the River Network System under Rapid Urbanization in the Xiangjiang River Basin, China

College of Geography and Tourism, Hengyang Normal University, Hengyang 421002, China
*
Author to whom correspondence should be addressed.
Water 2023, 15(21), 3768; https://doi.org/10.3390/w15213768
Submission received: 30 August 2023 / Revised: 10 October 2023 / Accepted: 14 October 2023 / Published: 27 October 2023
(This article belongs to the Section Hydrology)

Abstract

:
The research focuses on the difficult problem of quantifying the adaptation state of river network system development under rapid urbanization. Based on the river network system data and remote sensing image data of the past 30 years, this study discusses the evolution of the river network system and its adaptability. The geographically and temporally weighted regression (GTWR) model was used to reveal the response of the river network system in the Xiangjiang River Basin to urbanization. The results suggest that the Xiangjiang River Basin has experienced a significant increase in urban land due to the strong disturbance by human activities in the last 25 years. The number indicators of river network system such as overall water surface rate and river network density have decreased by 10.04% and 13.99%, respectively. Drainage structure indicators such as tributary development coefficient and structural stability decreased by 6.89% and 4.40%, respectively. The influence of three-dimensional urbanization on the intensity of river network density change is spatiotemporal heterogeneity during 1995–2020. It shows that population factors have a significant negative impact on the upstream area. The regression coefficient between river network density and per capita GDP in the basin is positive. The regression coefficient of urban land is negative, indicating that urban expansion has a significant negative effect on river network density in Xiangjiang River basin. The analysis of the relationship between urbanization and river network system evolution by using the coordination degree model shows that: in the early stage, the level of urbanization is low, the adjustment capacity and carrying capacity of river network are strong, and the coordination degree of urbanization and river network system is small. The level of urbanization has reached a new height, especially in the upstream central cities such as Chang-Zhu-Tan from 2015 to 2020. At this time, the increase of coordination degree is characterized by the mutual promotion of urbanization and river network development, and the improvement of their adaptive development requirements. This study quantitatively reveals the changing characteristics and influencing factors of the adaptability of river network systems and urban spatial development, which can provide scientific support for regional human–water harmony, flood prevention and mitigation, and green urbanization development.

1. Introduction

According to the UN’s World Cities Report, the proportion of people living in urban areas is expected to grow from 56% in 2021 to 68% by 2050 [1]. The rapid urbanization of the world is only temporarily delayed by the new COVID-19 epidemic, and the global urban population is still growing rapidly. Studies have found that 60% of land change is linked to human activity, and the resulting evolution of river network systems has led to a dramatic increase in flood risk, hindering the sustainable development of regional economies and societies [2,3,4,5].Rapid urbanization is accompanied by rapid urban spatial change, and it has been accompanied by a dramatic expansion of urban space, an increase in the size of urban populations, and the gradual destruction of urban ecology, while urban river network systems have also faced challenges such as being filled in, an over-reliance on water projects, persistent water pollution, and the cutting off of natural barges, which has led to increasingly severe drought and flooding events while destroying the urban landscape [6]. The river network system and the city have been a unifying force for thousands of years. River network systems and cities are the result of thousands of years of human ingenuity and are an organic blend of the natural environment and human society. Furthermore, Sustainable Development Goal 11 refers to “making cities and human settlements inclusive, safe, resilient and sustainable”. Therefore, this study considers the Xiangjiang River Basin as a complex system and introduces the concept of ‘adaptability’ into the analysis and evaluation of urban river network systems to reveal the adaptive characteristics and influencing factors of the evolution of river network systems and urban expansion and development, which will help cities and towns be more resilient in coping with floods and other disasters. The concept of adaptability originates from the field of biology, and it is the core idea of evolutionary theory. It is a characteristic of a subject that evolves in harmony with its environment, i.e., “survival of the fittest” [7]. Adaptability has become one of the central concepts in the science of global change in a time of rapid change in the global environment. The four major scientific programs on global change—the World Climate Research Program (WCRP), the International Human Dimensions Program on Global Environmental Change (IHDP), the International Geosphere-Biosphere Program (IGBP), and the International Biodiversity Program (DIVERSITAS)—all consider scientific adaptation to future environmental change as an important criterion for human society to maintain sustainable development. At present, the resilience of human society to extreme floods and droughts has yet to be improved [8,9]. As the urban environment itself is always changing dynamically, river network systems have to adapt through constant change, thus exploring the adaptive properties of urban river network systems, and scientifically understanding urban-river network system adaptation mechanisms have definite theoretical significance and application value.
There have been many studies on the response of the river network system structure to urbanization [10,11,12,13,14] or the effects of land cover change on river morphology and chemical elements [15,16,17]. These studies have been conducted in the past. Previous studies have shown that human activities can disrupt the hydrological connectivity of watersheds [18,19] and the capacity of rivers to store water and prevent flooding [20,21,22]. However, research on the adaptability of river network systems has not been conducted. Some scholars have studied the adaptation of the urban distribution of the Haihe Plain to the geomorphological environment of the river and the reconstruction of its hydrological structure over the past 2200 years from the perspective of ancient river channels [23], or how the reconstruction of water cycle processes reveals the evolution of human–water relations in Chinese Tunbao over 600 years [24]. Another study explored the spatially non-stationary relationship between the urbanization of the plain and the characteristics and water storage regulation capacity of river network systems [25]. The complexity of the coupling of human and natural systems is reflected in the relationship between cities and rivers and their need to achieve a harmonious coexistence. This is a key issue in building a new type of urbanization and achieving sustainable development. A large number of the studies above have described and assessed the hydrological response to urban development from a unidirectional perspective of ‘urban development → river network system change’. However, complexity science systems theory recognizes that urban and aquatic systems are intertwined as a whole. A typical one-way analysis would overlook and miss key components of the two-way socio-hydrological process. This study uses river network system indicators to quantitatively characterize changes in the river network system structure on the one hand, and spatiotemporal geographically and temporally weighted regression (GTWR) and coordination models on the other hand to improve understanding of urbanization and the adaptation of river network river network systems. While the traditional geographically weighted regression (GWR) model allows for parameter estimates of the variation of different drivers with spatial geographic location, the spatiotemporal geographically and temporally weighted regression (GTWR) model extends this model by adding the latitude of time, taking into account both spatial heterogeneity and temporal non-stationarity [26,27], which is more useful in revealing the adaptive characteristics of river network systems.
The Xiangjiang River is one of the major tributaries of the Yangtze River and is subject to high levels of human activity, especially in the lower reaches of the Yangtze River. With socioeconomic development and population growth, flooding, and degradation of the river network in the Xiangjiang River Basin are becoming increasingly serious, and the ‘life-water artery’ of cities is under threat. This shows the urgency of studying the adaptive mechanisms of river network system integration and development under urbanization. Therefore, it is of great relevance and urgency to study the evolution and adaptation of river network systems in the Xiangjiang River Basin in the context of rapid urbanization. There are few studies on the adaptive mechanisms of river network system integration in the context of urbanization, and most of the existing studies focus on the river network in the lower Yangtze River plain and coastal areas, with few studies on rivers in the hilly inland areas. There is a need to achieve a harmonious coexistence between cities and rivers. In order to address the issues above, the purpose of this study is to (1) analyze the characteristics of the evolution of river network system morphology against the background of urbanization in the Xiangjiang River Basin, analyze the trend of the integration and development of river network systems in urbanization, identify and explore key periods and turning points in the development trend of the two, and reveal the response degree of typical area river network system changes to urbanization; (2) quantify the coordination and adaptability of river network systems with urbanization development, and analyze the threshold of comprehensive river network system indicators and their regulation and storage functions for urbanization development. On this basis, with urbanization as the background, the adaptive state and mechanism of river network system development in typical areas are elucidated to achieve healthy and sustainable urban development.

2. Study Area

Xiangjiang River is located at 24°31′~29°01′ N and 110°30′~114°01′ E, and it is one of the first-class tributaries of the Yangtze River and the mother river of Hunan Province (Figure 1). The basin has a humid subtropical monsoon climate and is dominated by mountains and hills. The river basin originates from Lanshan County, Yongzhou, converging with the Xia Shui in Yongzhou, then with the Chongming, Lei, Steaming, and Shoe waters in Hengyang, the Juan and Lian waters in Xiangtan, the Bryan waters in Zhuzhou County, the Liuyang, Liaozha, and Weixi waters in Changsha, and the Haohe mouth in Xiangyin County, where it converges with Dongting Lake. There are 2157 large and small tributaries over 5 km, including 124 first-class tributaries, and 16 major tributaries with a basin area of more than 1000 km2, of which the Xiaoshui, the Leishui, and the Mishui have a basin area of more than 10,000 km2. Since this study discusses the impact of urbanization on river network systems, administrative boundaries are adopted in the study area.
The Xiangjiang River Basin is a concentrated and leading area for new urbanization, industrialization, and agricultural modernization in Hunan Province, closely connecting the Yangtze River Economic Belt with the Guangdong–Hong Kong–Macao Greater Bay Area. The spatial pattern of towns and cities in the basin shows a new spatial pattern of “one circle, three axes and more points” with the modernized metropolitan circle of Chang-Zhu-Tan as the core, Beijing–Guangzhou, Shanghai–Kunming, and Yu-Changxia as the urban development axes, Yueyang and Hengyang as the two sub-centers, and Chenzhou, Yongzhou, and Loudi as important regional central city nodes. The Chang-Zhu-Tan metropolitan area is the core growth pole of Xiangjiang River Basin development, including the whole area of Changsha City, Zhuzhou City central city and Liling City, Xiangtan City central city and Shaoshan City, and Xiangtan County, with an area of 18,900 km2, a resident population of 14.84 million in 2021, and a total economic output of RMB 1.79 trillion [28]. Along with rapid population growth and the accelerated expansion of urban land, the ecological environment of the Xiangjiang River is under unprecedented pressure due to the unprecedented damage to the river network system caused by the breadth and intensity of human activities. The imbalance between rivers and towns has become a stumbling block to the development of the river basin, and it is one of the major factors affecting the realization of the ecological barrier protection function of the Xiangjiang River Basin.

3. Research Data and Methods

3.1. Research Data

The data for this study (Table 1) consist primarily of river network system data and land use/cover change (LUCC) data, with the Landsat series of 30 m resolution remote sensing imagery and 30 m spatial resolution DEM data from 1995–2020 sourced from the Geospatial Data Cloud (https://www.gscloud.cn/) The land use data for the years 1995–2020 were obtained from the Resource and Environment Science and Data Centre of the Chinese Academy of Sciences (http://www.resdc.cn/).

3.2. Comprehensive Evaluation Method for the Evolutionary Characteristics of River Network Systems

This study adopts a unified river network system structure parameter index to identify and quantitatively describe the system pattern of the river network system in each period and reveals the inner structure and evolution pattern of the river network system in terms of quantitative characteristics and morphological and structural characteristics. Among them, the indicators of the quantitative characteristics of the river network system include river network density (Dd), water surface ratio (Wp), and river frequency (Fr); the morphological and structural characteristics of the river network system include river network curvature (Sr), tributary development coefficient (K), main stream area–length ratio (RAL), and structural stability (DR) (Table 2).

3.3. GTWR Model

In spatial regression analysis, changes in geographic location and time can cause changes in the relationship or structure between variables, which is known as spatiotemporal non-stationarity [36]. The evolution of river network systems is a spatiotemporal non-stationary process, and the drivers of river network system evolution are not consistent across time. At present, there are relatively few studies using the GTWR model to explore the adaptation of river network systems, and they are mainly focused on the coastal plain river network areas such as the Yangtze River Delta and the Pearl River Delta [37,38]. The majority of studies have used traditional geographically weighted regressions to explore the adaptation of river network systems. Most studies have used the traditional geographically weighted regression model GWR to analyze the relationship between the urbanization process and the evolution of river network systems. However, this model only considers spatial heterogeneity and ignores the uneven influence of the temporal dimension, which if expressed as a uniform regression coefficient of temporal variables, may lead to misjudgment of the model results, i.e., the assumption of temporal consistency does not meet the requirements of complex river network system analysis. The spatiotemporal geo-weighted regression model, on the other hand, effectively breaks through this limitation by introducing the time dimension into the geo-weighted regression model to address the spatial and temporal non-smoothness, making the estimation more effective.
In view of this, this paper uses a spatiotemporal geo-weighted regression model to explore the relationship between changes in river networks and the processes of population urbanization, economic urbanization, and urban land. Compared to ordinary regression as well as GWR models, the model can estimate results using parameters that vary with time and spatial location, quantifying the spatial response relationships between the data and providing greater efficiency in describing the adaptation of river network systems. The model is shown in the equation [39]:
Y i = β 0 u i , v i , t i + k = 1 p β k u i , v i , t i X i k + ε i
where y and x are the explanatory and explanatory variables, respectively; i is the sample area; u and v are the coordinates of the sample area; t is time; β0(ui,vi,ti) is the intercept term; βk(ui,vi,ti) is the estimated coefficient of the explanatory variable; β > 0 means the explanatory variable is positively correlated with the explanatory variable, while the opposite is negative; ε i is the random disturbance term.
The core of GTWR is the selection of spatial weight functions, and the spatial correlation of data is achieved through the construction of spatial weight matrices. The spatiotemporal weight function and spatiotemporal distance proposed by Huang et al. [39] are used in this paper to combine spatiotemporal information in two dimensions.
d i j S T = λ u i u j 2 + v i v j 2 + μ t i t j 2
w i j S T = e x p λ u i u j 2 + v i v j 2 + μ t i t j 2 b S T 2
where i and j are different sample areas; parameters λ and u are scaling factors measuring the differential impact of spatial and temporal distances in the uncorrelated metric system; bST is the bandwidth of the spatiotemporal weight function.

3.4. Coherence Model

The coherence model is a physical concept that refers to the phenomenon of two or more systems or forms of motion influencing each other through interaction [40,41]. In order to reveal and predict the degree of influence of urbanization on changes in the river network system, a coordination model of the integrated index of the river network system and the urbanization rate was constructed. The entropy value method was used to derive the weights of each indicator, to arrive at the comprehensive index of the river network system.
In the entropy method, entropy is defined as n evaluation objects and m evaluation indicators, forming a data matrix for the original data X = x i j m a x ; the larger the indicator value, the more important the role in the comprehensive evaluation. If all the indicators of the nth indicator have the same value, the indicator does not play a role in the comprehensive evaluation. In information theory, information entropy H X = p X i I n p x i is a measure of the degree of disorder in a system, and the degree of order in a system is characterized by information that is equal in absolute value and opposite in sign. The greater the degree of variation of the nth indicator, the lower the information entropy, the greater the amount of information contributed by the nth indicator, and the greater the weight of that indicator should be; conversely, the greater the amount of information contributed by the indicator and the smaller the weight of that indicator [42].
The urbanization rate (Y) and the comprehensive index of the river network system (X) construct the coordination evaluation model and calculate the formula:
D U , R = X Y 4 X + Y 2 2 X + Y 2
where D U , R indicates the degree of coordination between the urbanization rate and the river network system composite index. The higher the value, the better the coordination between the two, and the more the two systems will develop benignly.

4. Results and Discussion

4.1. Spatial and Temporal Land Use/Cover Changes and Shifts in the Xiangjiang River Basin

Between 1995 and 2020, the land use pattern of the Xiangjiang River Basin changed significantly, especially in the urban area, which increased from 1.60% to 3.79%, with the expansion of towns and cities leading to a large encroachment on arable land and water areas, and also showing a “misfit” between towns and river network systems (Figure 2). The conclusion of this study is basically consistent with the research findings of other domestic scholars in the Xiangjiang River Basin, and the significant feature of land use change is the continuous expansion of urban land [43]. In addition, the ecological land area in the Xiangjiang River Basin is decreasing [44].
The high rate of urbanization and economic development has led to dramatic changes in land use. The extent of land use transfer changes between 1995 and 2020 is more pronounced. Cropland was the main transferor out, mainly to urban land. Urban land was the main transferor in, receiving a large transfer of mainly cropland, forest land, and water over these 25 years with a faster expansion; forest land was mainly transferred out to cropland and urban land; grassland was mainly transferred out to forest land, with a partial shift to cropland and urban land (Figure 3).
In terms of the quantitative trajectory of the main land use types in the Xiangjiang River Basin (Figure 3), the period from 1990 to 2005 saw a clear shift from water to other land use types, with the main outflow being to urban land. From 2005 to 2015, the outflow of water to urban land continued and increased compared to the previous period. In addition, the trajectory of the chord diagram shows that the interconversion between land use types was more active during this period, with a wide range of transformation types, with arable land and forest land shifting significantly to urban land. In the period from 2015 to 2020, the transformation of land use types was mainly in the form of forest land shifting to other land types. Among them, the main flow of forest land was to arable land, urban land, and grassland. The chordal trajectory line was more complex during this period, and the diversity of land use change types was richer and more dynamic than in the previous period.
Note: UL, WL, GL, CL, FL, and UNL represent urban land, water, grassland, arable land, forest land, and unused land, respectively. The different color trajectory lines indicate the direction of flow of a particular land type in a given period of time, and the thickness of the trajectory line represents the amount of conversion; the larger the conversion, the thicker the trajectory line.
Overall, the inter-transformation behavior between land use types in the Xiangjiang River Basin during 1995–2020 is more frequent, and the transformation trajectories show diversification. Arable land → urban land is the main body of the transfer in the study area, with the largest transfer patches mainly in the Chang-Zhu-Tan urban agglomeration and Hengyang City with a relatively concentrated distribution. Arable land → water is sporadically distributed throughout the study area in the form of small patches, and the trend is obvious. Other types of transfer, such as forest land → urban land, arable land → forest land, urban land → arable land, etc., are mostly distributed in the form of scattered patches and are more scattered. Twenty-five years of population growth and economic development have combined to change the intensity and direction of land use change in the regional central cities; the rapid expansion of urban land has especially driven the reduction in water area. This is consistent with the research results of other scholars. For example, some scholars have found that the most significant changes in the entire Yangtze River Basin are the reduction in arable land and the increase in urban land. In terms of water volume, the expansion of arable land and the development of industry have led to an increase in water consumption and a decrease in water area [45].

4.2. Characteristics of the Evolution of the Xiangjiang River Basin River Network System

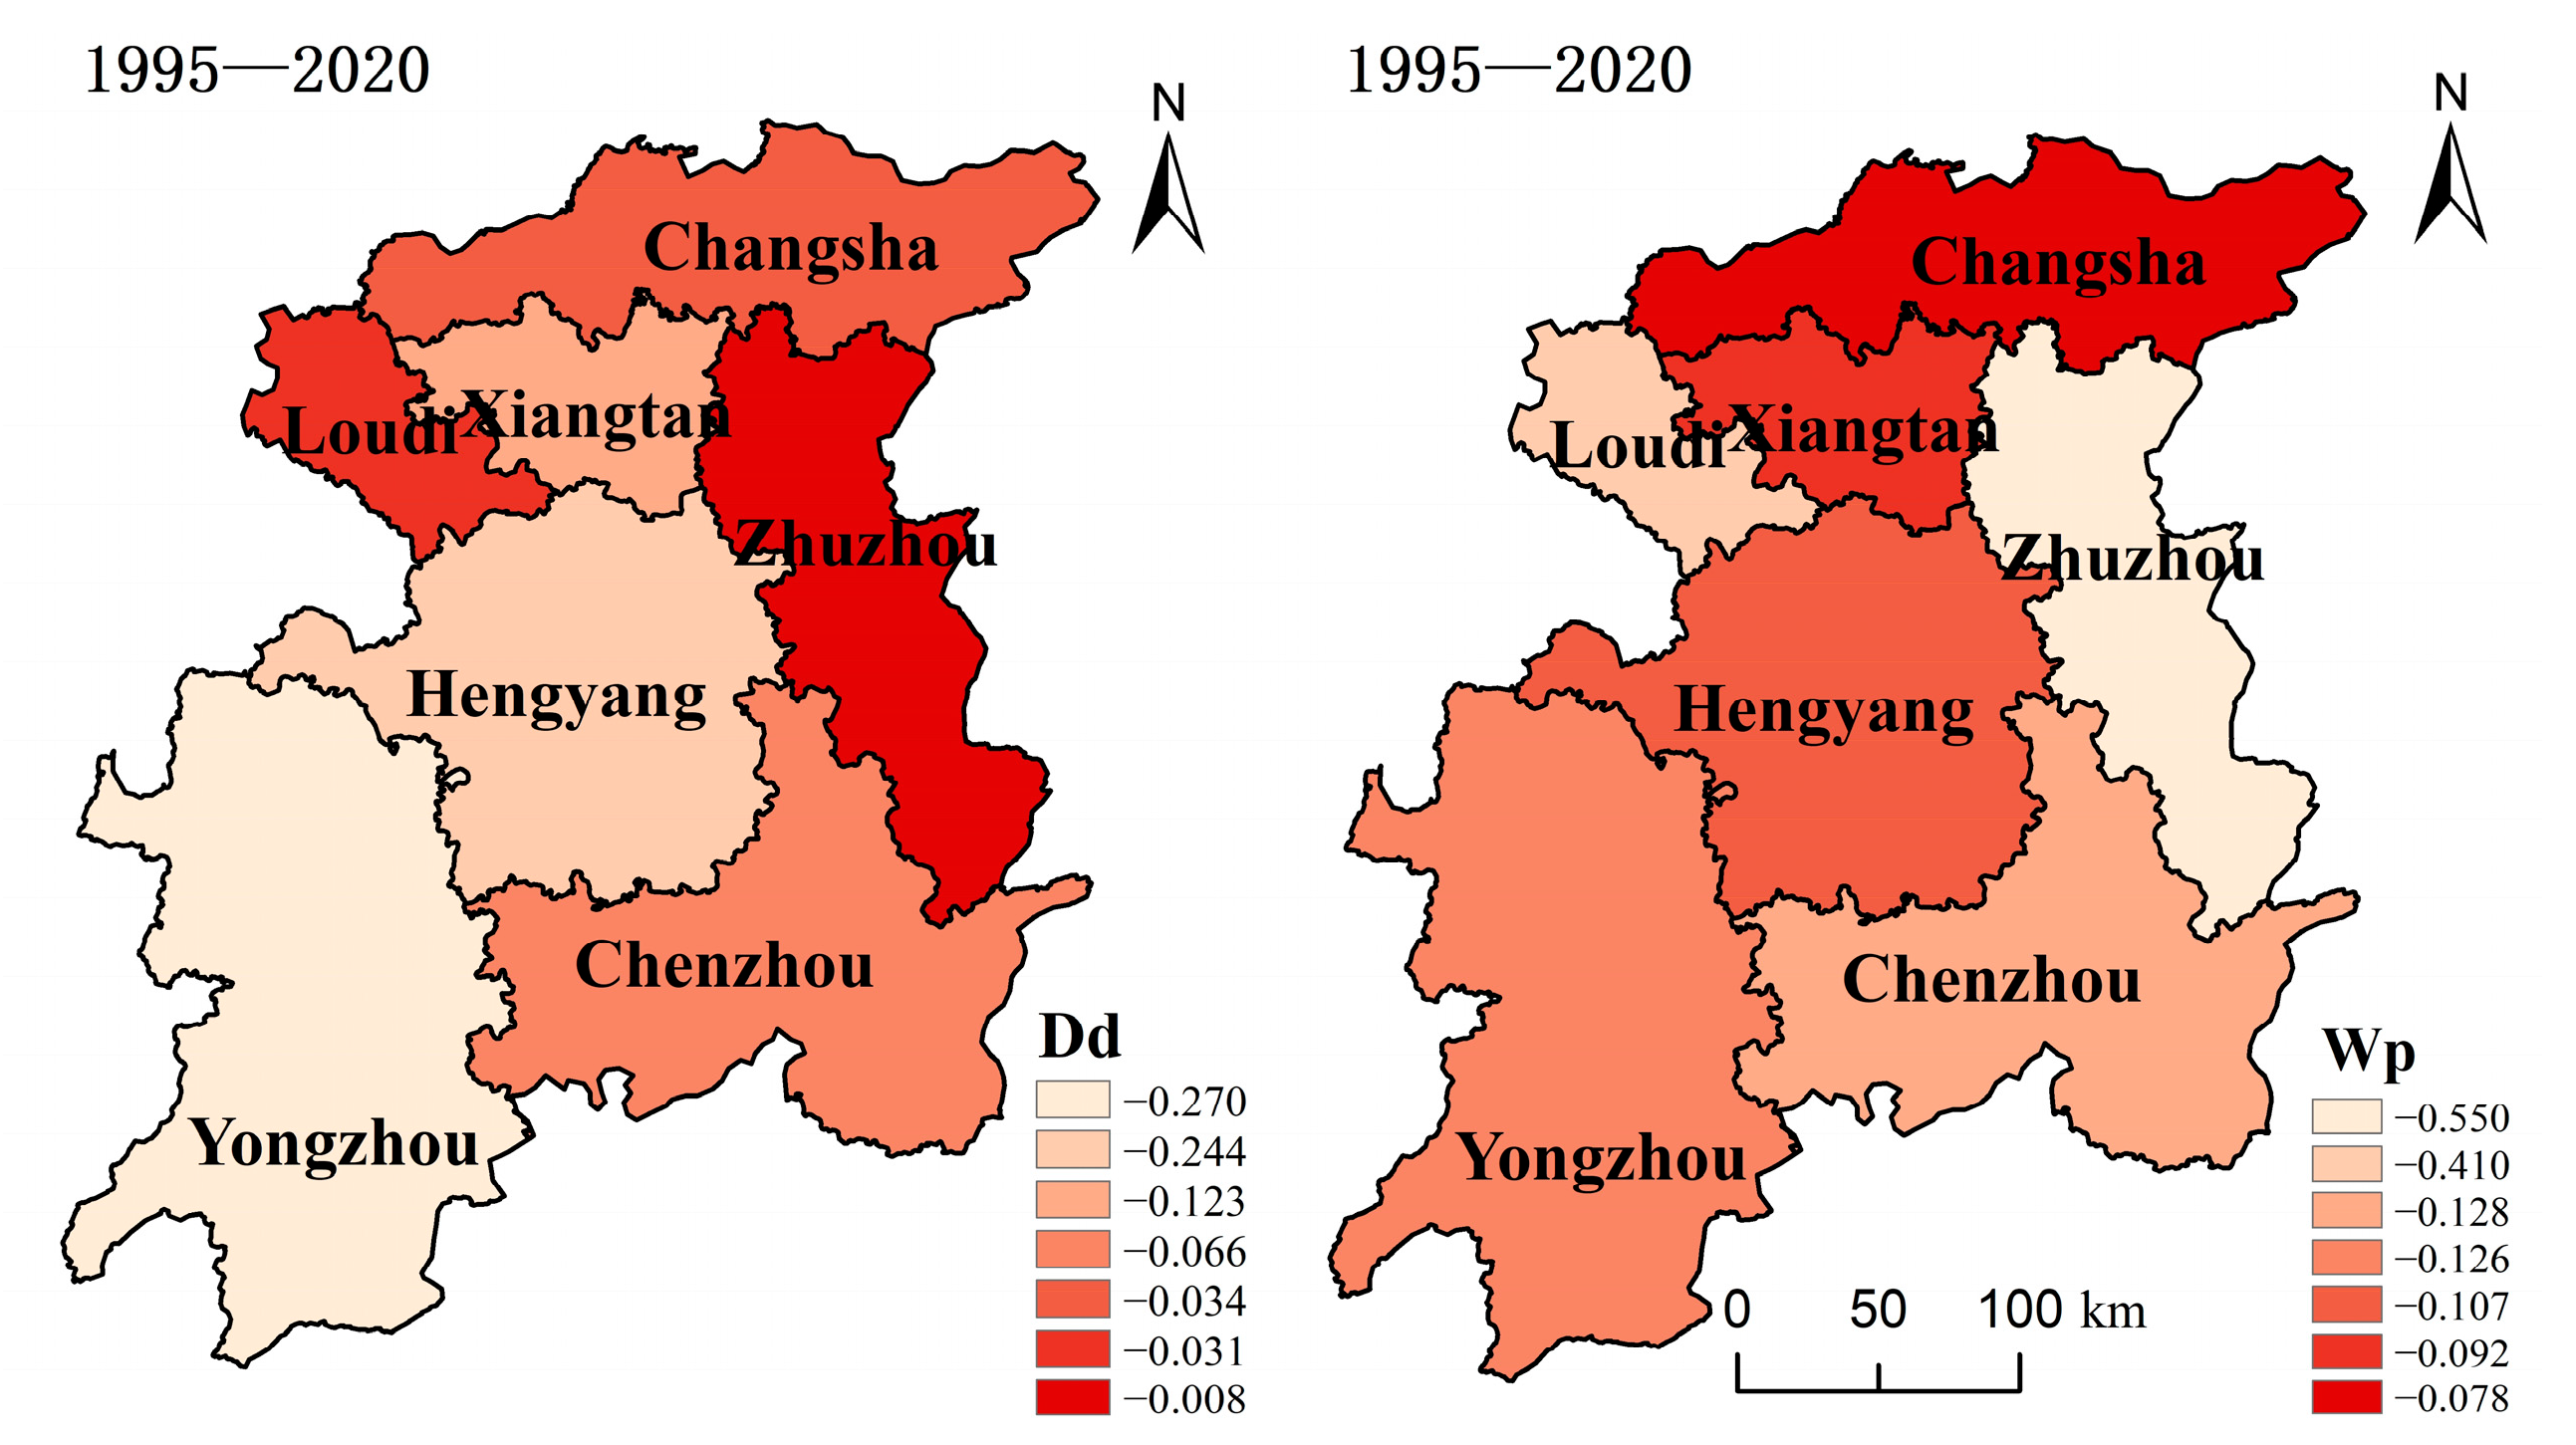
4.2.1. Evolution of the Quantitative Characteristics of the River Network System

From the 1990s to the 2020s, the river area in the study area decreased by 10.04% (109.92 km2), and the length decreased by 13.99% (1216.33 km2). The length and area changes of different levels of rivers vary, and high-level rivers such as main streams and primary tributaries showed little change. The changes in tertiary rivers were the most severe, with a significant decrease in area and length. Among them, the area attenuation rate reached 38.35% (12.76 km2), and the length attenuation rate reached 21.23% (236.15 km). The spatiotemporal differences in the rate of change in river network density and water surface rate were significant (Figure 4). In the past 25 years, the variation rate of river density in the research area has mostly ranged from −0.008~−0.270 km/km2. The area with the largest decrease in river density extends axially, such as in the direction of Xiangtan–Hengyang–Yongzhou. The spatial variation pattern of the water surface rate in the total river network is different from the density of the river network, and it is relatively dispersed in space. The areas where the water surface rate decreases rapidly are mainly Zhuzhou, Loudi, and Chenzhou. Overall, the numerical characteristics of the river network in the study area mainly decrease in space, and the rate of change in river network density and water surface rate varies at different temporal and spatial scales (Figure 4).
The main reason is that the Xiangjiang River Basin is an urban agglomeration in the middle reaches of the Yangtze River and an important area of the Yangtze River Economic Belt. The result is an increase in regional runoff pressure, susceptibility to flooding disasters, and an increase in urban flood risk [45]. The rapid economic and social development has led to a rapid increase in impermeable areas, resulting in the destruction and burial of low-level rivers [46]. With the development of urbanization, it has caused changes in the underlying surface of land use, thereby affecting the evolution and distribution pattern of the quantitative characteristics of the river network system. The density of the river network is the ratio of the total length of a river to the area of the watershed, reflecting the density of the river network in the region. The larger the value, the stronger the regional regulation and storage capacity. From 1995 to 2020, the density of the river network in the study area decreased from 0.1 km/km2 to 0.08 km/km2. In the past 25 years, the total length of the river network has rapidly decreased from 8692.44 km to 7476.11 km, with a cumulative decrease of 1216.33 km and a reduction rate of 13.99%. The length of the primary, secondary, and tertiary rivers decreased by 356.29 km, 570.66 km, and 236.15 km, respectively, with a reduction rate of 10.80%, 15.93%, and 21.23%, respectively. The water surface ratio is the proportion of the total area of rivers and lakes to the total area of the basin, and its changes reflect the changes in the water area of the study area. The water surface rate in the research area has shown a fluctuating decreasing trend since 1995, with an overall decrease of 10.04% over the past 25 years. From a temporal perspective, the interannual decay rate of water surface rate changes is not uniform, showing a “slow fast” fluctuating downward trend. Among them, the water surface rate decreased the fastest from 2005 to 2015, with a total decrease of 5.12% over those 10 years. This is consistent with previous research [46]. In the middle reaches of the Xiangjiang River, 2011 was the turning point for the reduction in the river surface area rate in each basin. From 2006 to 2011, the changes in transpiration and Chonglingshui river surface area rates were significant, decreasing by 16.31% and 17.26%, respectively [47]. This is related to the upward trend in population and economy in the Xiangjiang River Basin during this period. In addition, in terms of spatial urbanization, the overall basin shows a state of continuous expansion of regional urban land.

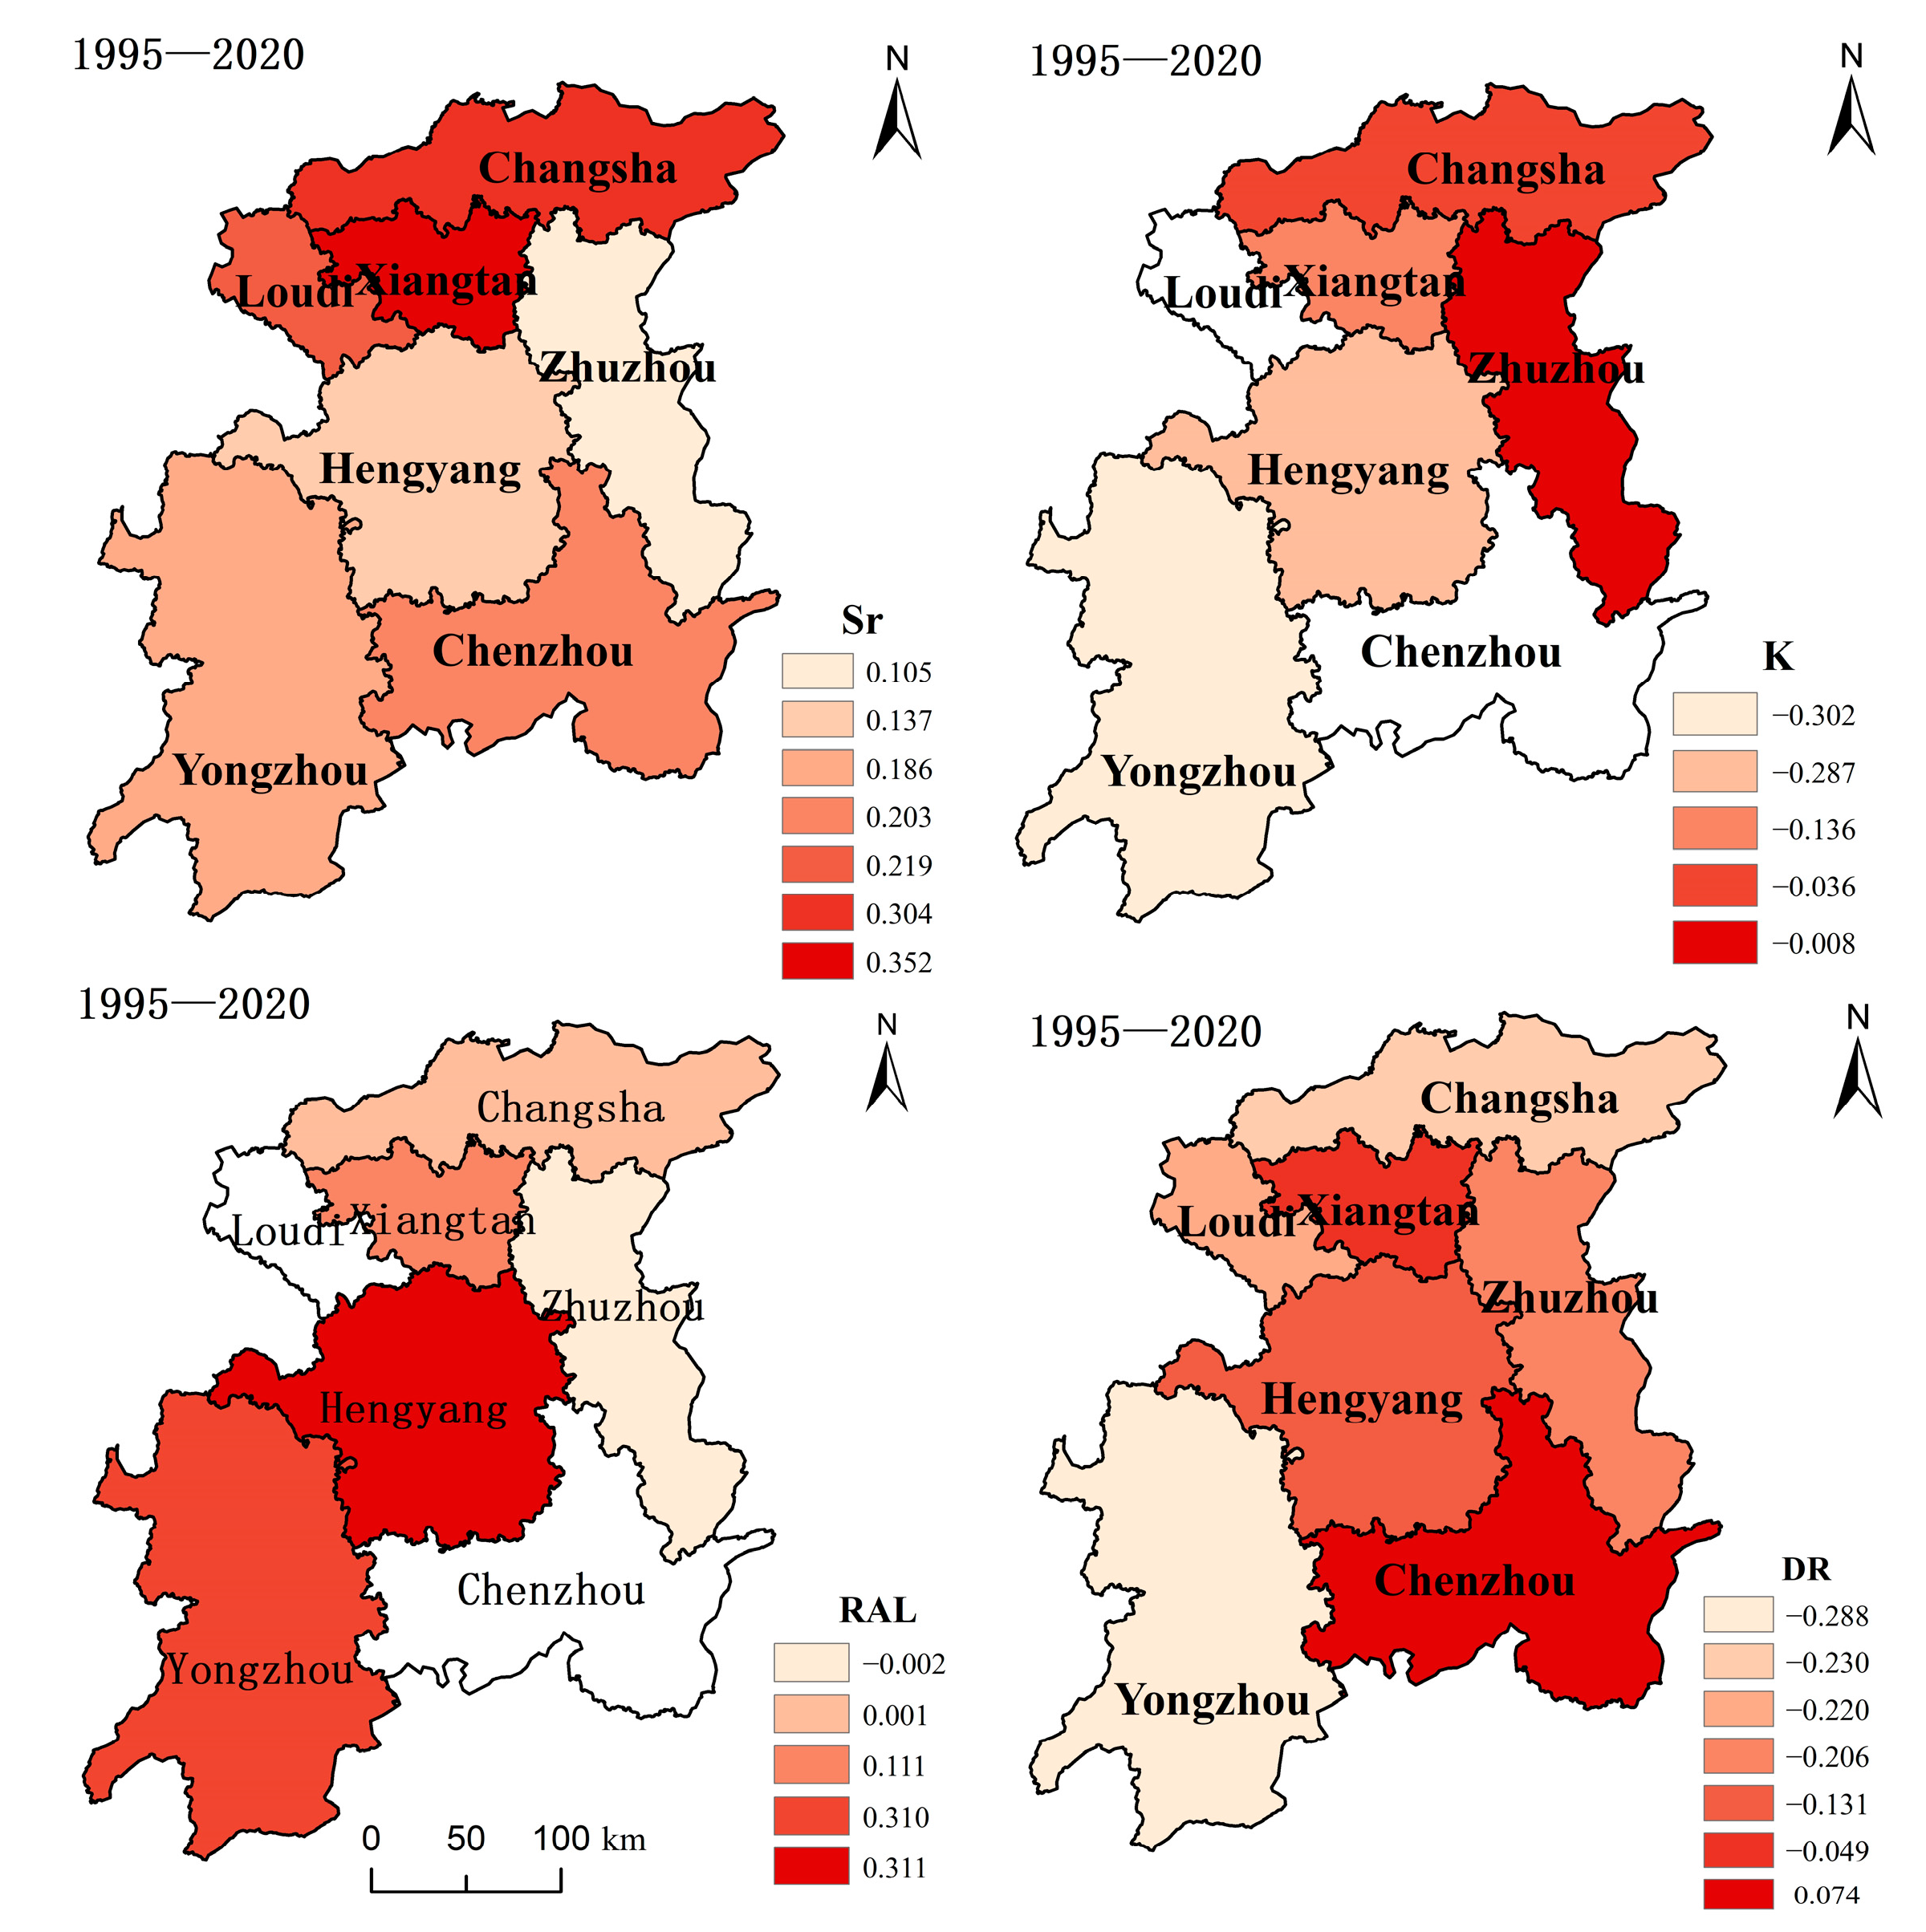
4.2.2. Evolution of the Morphological Characteristics of the River Network System

River curvature refers to the ratio of the actual length of a river network to the shortest distance between its two endpoints, reflecting the natural curvature of the river network. From a temporal perspective, the curvature of the rivers in the study area showed an annual trend, with a decrease of 24.04% from 1995 to 2020. The development coefficient of tributaries and the length ratio of the main stream area refer to the degree of tributary development and the water-carrying capacity of river network sections, respectively. In terms of space, the distribution pattern of the development coefficient of tributaries and the length ratio of the main stream area changes significantly (Figure 5). For example, the high value areas of the tributary development coefficient are distributed in the rapidly urbanizing Chang-Zhu-Tan area, indicating that urban development has led to the fragmentation of tributaries. The low-value areas of the length ratio of the main stream area are mostly distributed in the downstream areas of Chang-Zhu-Tan. This is because the urbanization development level in the downstream is high, and the main stream is the main protected object of urban development planning. In order to alleviate regional flood disasters, protecting the main stream is an inevitable choice for urban development. The structural stability reflects the stability of the river network, its daily storage capacity, and its ability to resist floods and droughts. From the research results, it can be seen that the structural stability of the upper reaches of the Xiangjiang River Basin is significantly higher than that of the middle and lower reaches.
With the acceleration of socioeconomic development, the human impacts on the river environment are becoming more and more severe. Among them, changes in the substratum caused by urbanization are the main factor in changing the pattern of river network systems. The present study is a quantitative and morphological study of the Xiangjiang River Basin. This study evaluates the river network system in the Xiangjiang River Basin from the quantitative and morphological perspectives, and the results show that the degradation of the river network mainly occurs in the middle and lower reaches of the Xiangjiang River Basin, and the changes in the quantitative and morphological indicators of the river network system are mainly due to the disappearance of the tertiary tributaries, i.e., the last tributaries, probably because the lower-grade rivers are more vulnerable to human activities [22]. Temporally, the most serious degradation of the river network occurred during the period from 1995 to 2015, during which the proportion of urban land in the basin almost doubled from 1.60% to 3.17%.
Compared with research results in other regions, it was found that urbanization has a significant impact on changes in the river network system. The higher the level of urbanization, the more intense the changes in the river network system. Shenzhen [48] is located in the Pearl River Delta, with a dense river network. From the perspective of the structure of the river network system, in 1980, the main river and its first-, second-, and third-level tributaries had a clear structure, showing a distinct tree-like structure. However, in 1988, the number of river tributaries significantly decreased, and the trend of the river trunk became apparent. In 2005, a hidden canal appeared, highlighting the main route of the river. In the plain area of the Yangtze River Delta, the density of the river network in Suzhou [33] is mainly decreasing in space, with an increase in the density of the main stream river network and a decrease in the density of the tributary river network. The morphology of the river network system tends to be simplified. When the urbanization rate of land is higher than 40%, the attenuation of the river network system tends to be significant. It can be seen that there are similarities in the river network system characteristics between the Xiangjiang River Basin and other plain river network system areas. Moreover, the degree of attenuation of river systems is not entirely consistent at different stages of urbanization [49].

4.3. Adaptation of River Network Systems in the Xiangjiang River Basin in the Context of Urbanization

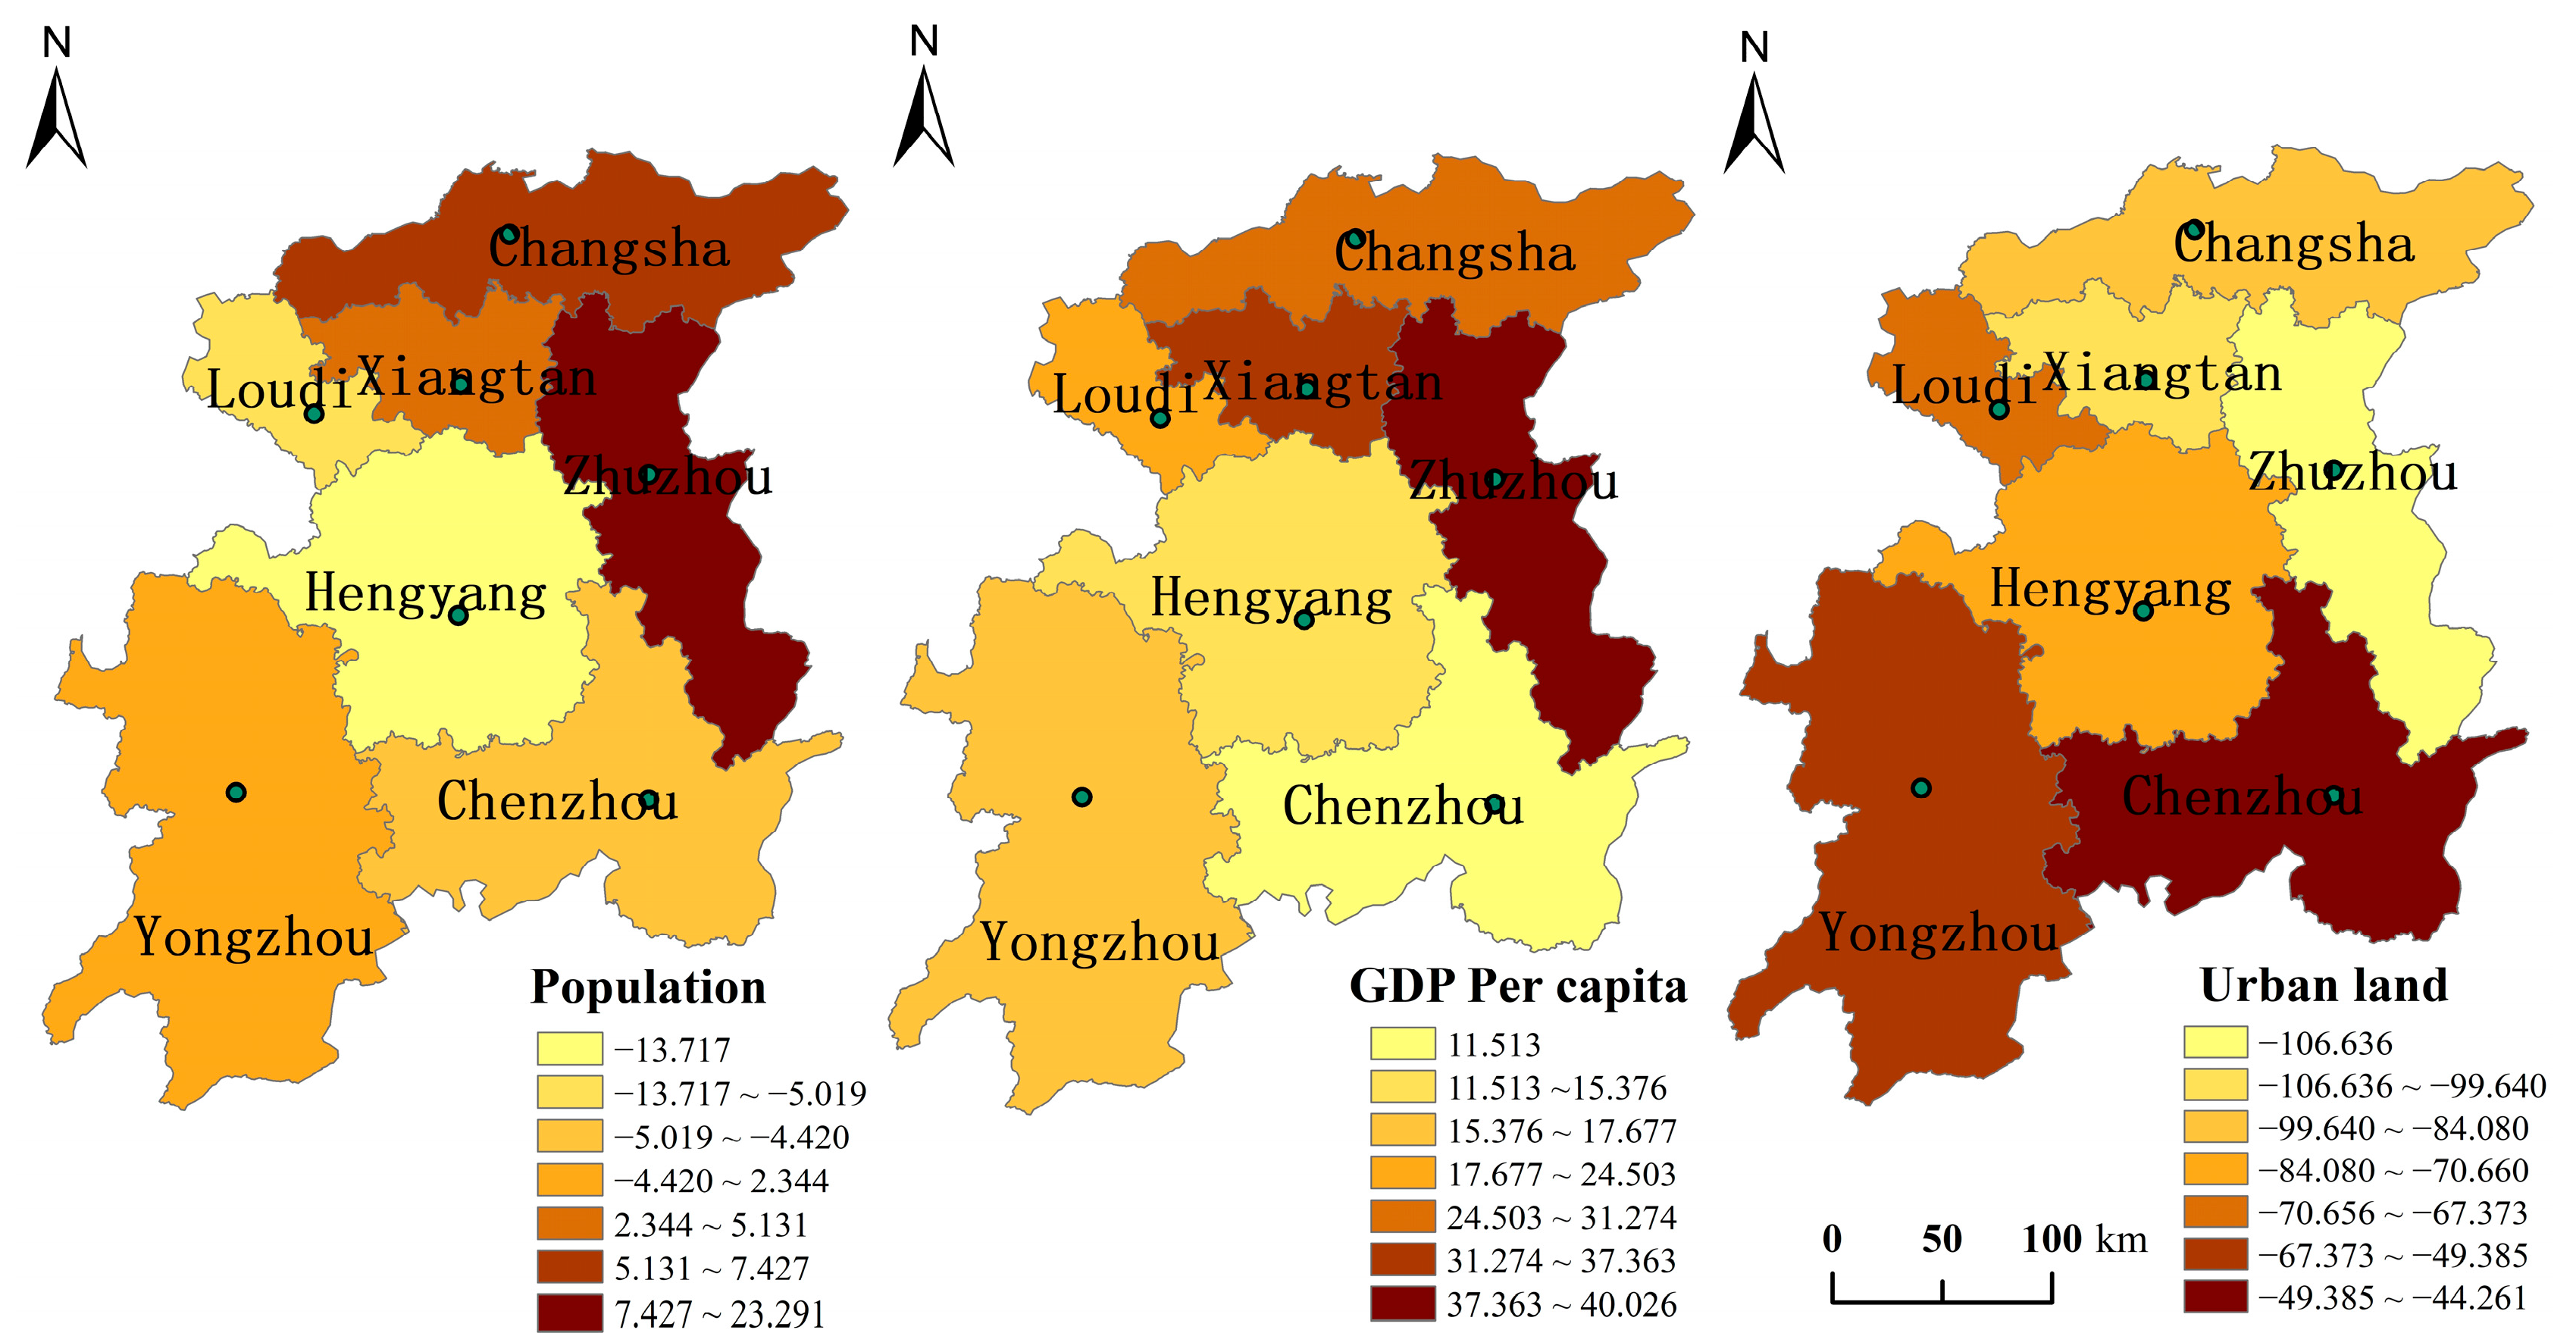
4.3.1. Response of River Network Systems to Urbanization

The ArcGIS-based spatiotemporal geo-weighted regression model found that there is spatiotemporal heterogeneity in the influence of various drivers on the intensity of change in river network density between 1995 and 2020. Specifically, the positive high-value areas of the total population at the end of the year are mainly distributed in Zhuzhou, Changsha, and Xiangtan; the negative high-value areas are distributed in Yongzhou, Loudi, Chenzhou, and Hengyang, indicating that the influence of population factors on changes in river network density in these regions is relatively weak. The per capita GDP has a positive impact, and the regression coefficient values are relatively large. The high-value areas appear in Changsha, Zhuzhou, and Xiangtan, indicating that the effect of GDP on river network density is relatively strong. This is related to the radiation impact of these areas on the Guangdong–Hong Kong–Macao Greater Bay Area and the urban agglomeration in the middle reaches of the Yangtze River. In terms of urban land, Zhuzhou, Xiangtan, and Changsha have negative coefficients and relatively high absolute values, followed by Hengyang, indicating that from 1995 to 2020, the expansion of urban land had a certain inhibitory effect on the density of river networks. Over time, the concept of green and high-quality development has taken hold, as evidenced by the ‘incompatibility’ of cities in the early stages of encroachment on river network systems, to the gradual adaptation of cities to river network systems in the later stages (Figure 6). The Xiangjiang River is one of the major tributaries of the Yangtze River, and the Xiangjiang River Basin connects the eastern coast of China with the central inland, bridging the Yangtze River Economic Belt with the Guangdong–Hong Kong–Macao Greater Bay Area, making it not only the most important economic belt in Hunan Province, but also the most important population, urban, and economic catchment area in central China. According to the Hunan Statistical Yearbook, the total population of Hunan Province has increased from 29,868,300 in 1949 to 72,958,800 in 2020. In the same period, the urbanization rate of the population has increased from less than 10% to 36%. With the rapid increase in urban population and total population, the conflict between humans and urban land in the region is getting worse. Considering the spatiotemporal heterogeneity between urban land expansion and river network degradation, the use of a spatiotemporal geo-weighted regression model is beneficial for further revealing the non-stationary spatial correlation, while the analysis from the perspective of administrative districts is also useful for subsequently proposing relevant policy measures. At the same time, the river network tends to be homogeneous, and the spatial heterogeneity of river network system distribution is greater due to the influence of factors such as urban land, population growth, and GDP growth; the spatiotemporal geographically weighted regression coefficients vary widely due to a variety of factors such as natural conditions and human activities. In addition, the spatiotemporal geographically weighted regression models, coupling river network density with population, GDP per capita, and urban land in the Xiangjiang River Basin, show negative local regression coefficients, which are dynamic and unstable, suggesting that there may be other factors influencing the river network system, such as flooding, agricultural irrigation, and other human activities.

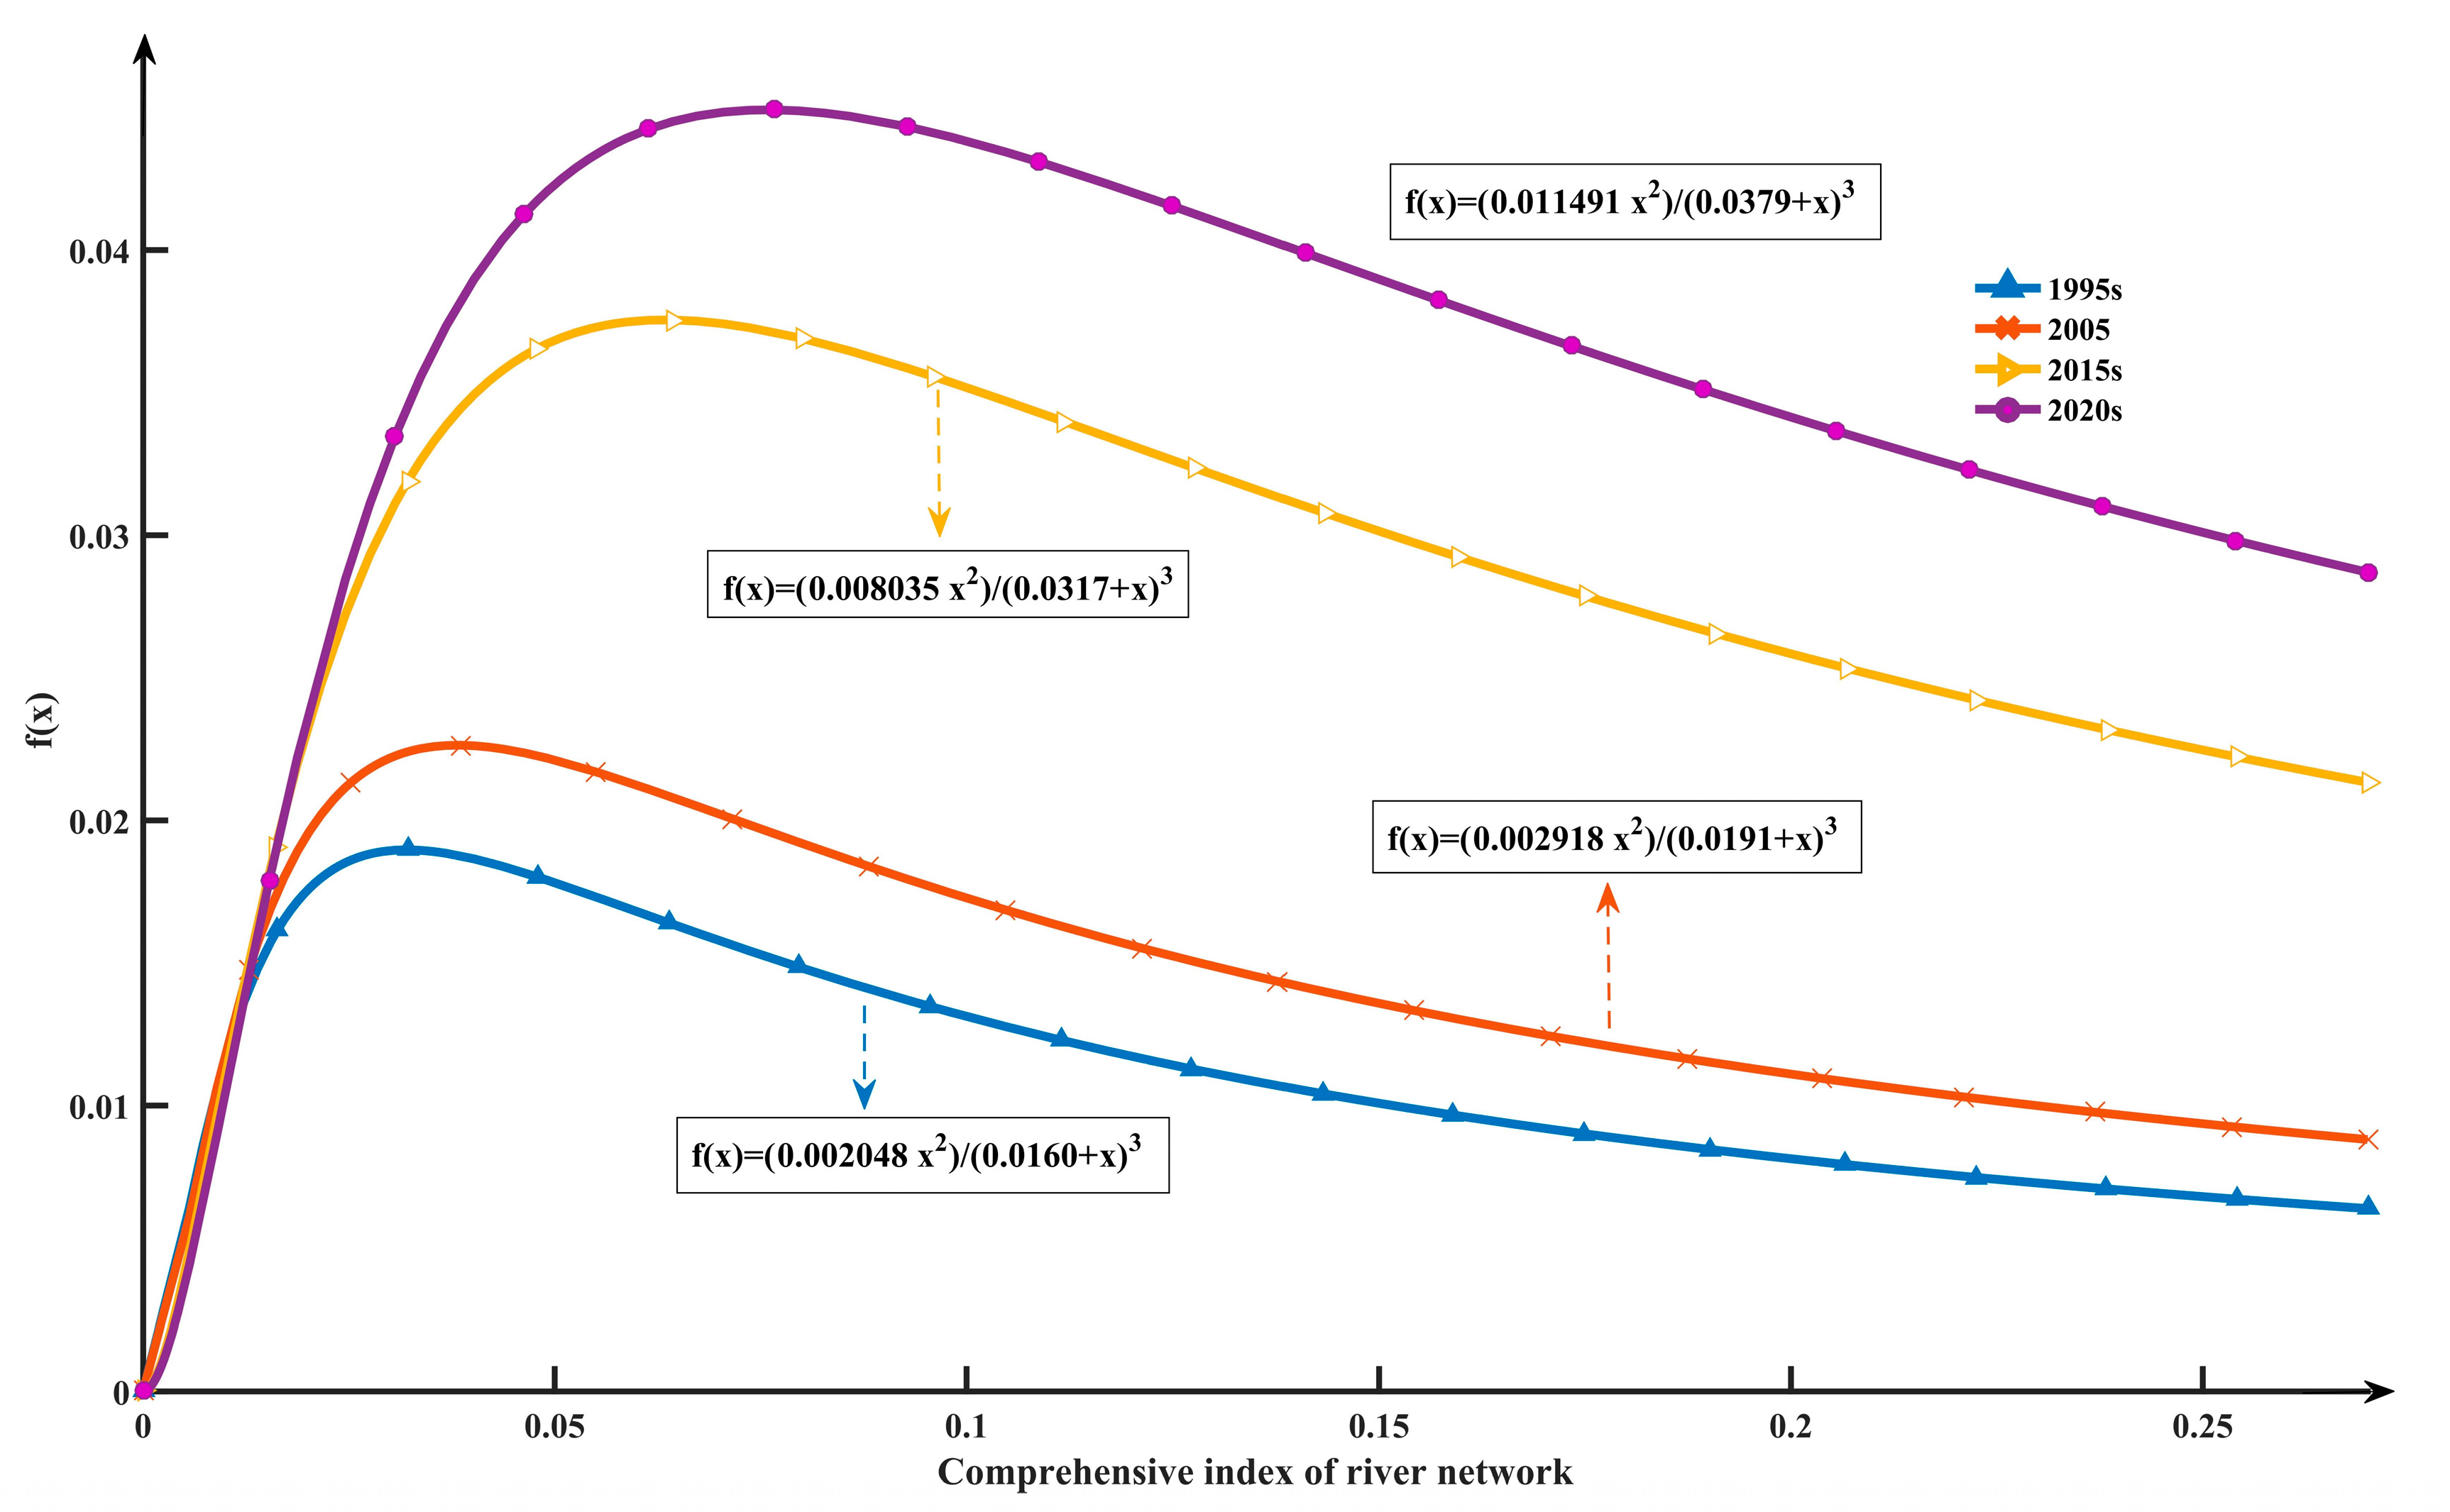
4.3.2. Optimum Harmony between Town and River Network System

The coordination degree function images of urbanization and river network system comprehensive index in 1995s, 2005s, 2015s and 2020s are obtained, as shown in Figure 7. The results show that the urbanization level is proportional to the optimal coordination degree, and the increase of urbanization level will lead to the increase of coordination degree. That is, with the passage of time, the impact of urbanization on river network system is more and more intense, and the requirements for the adaptive development of the two are also higher. In 1995, the level of urbanization was low, the adjustment capacity and carrying capacity of river network system were strong, and the coordination degree between urbanization and river network system was small. By 2005, the degree of optimal coordination is slightly higher than that of 1995. From 2015 to 2020, the level of urbanization has reached a new height, especially in the upstream Chang-Zhu-Tan area, the middle and downstream central cities such as Hengyang, Yongzhou and Chenzhou, and the surrounding areas with high development intensity and relatively developed industrialization and urbanization. At this time, the river network system space is crowded and buried, and the comprehensive carrying capacity of river network system decreases. At this time, the increase of coordination degree is characterized by the need for urbanization and river network system development to promote each other to jointly enter a new stage of high-level coordinated development, and the requirements for the adaptive development of the two are improved. To address these issues, the Xiangjiang River Basin should, in the future, focus on economic development goals while actively protecting the ecological environment of the basin, creating green ecological towns and promoting coordinated development of the upper, middle, and lower reaches. The middle and lower reaches of the main streams of the basin are mainly protected by embankments to meet flood control requirements. New flood control reservoirs will be built and expanded on the main tributaries of the Xiangjiang River to reduce the pressure of flood control on the main stream. Insist on protecting the river, strengthening ecological restoration, reducing man-made damage, maintaining the natural landscape, improving the adaptability of the river network system, and achieving harmonious development of the city and the river network system.
Currently, many developed regions at home and abroad have paid attention to the harmonious adaptation relationship between cities and river network systems, and there are many successful cases. For example, the Benthemplein Water Square in Rotterdam, the Netherlands, known as the ‘Water City’, uses the original urban facilities and public spaces such as building roof gardens, squares, and green spaces to provide flexible storage space for rainwater; Copenhagen’s storm water response plan introduces surface drainage into green spaces and ponds as a sponge body [50]. For the Ningbo Ecological Corridor, based on the location of historical rivers, the integrity of the river network system and the current topography, designers have assessed and marked the most efficient and effective nodes to solve the overall hydrological problem, connecting many small rivers, streams, and ponds to create a four-by-two effect [51]. And through these capillary-like rivers, they have created a more water-storing lowland river floodplain ecotype. In recent years, the Xiangjiang River Basin has undergone a relatively rapid urbanization process, which has resulted in changes to the substrate [52]. The topography of the Xiangjiang River Basin is more complex than that of the plain river network, comprising hills, mountains, and basins, and therefore the evolution and adaptability of the river network system is different from that of other plain river networks. In general, however, there is a pattern of adaptation between cities and river network systems. In the early stages of urban development, cities were built on water, reflecting the phenomenon of urban adaptation to river network systems [53]. In the later stages of urban development, as economic and social development and productivity increased, man’s ability to transform the natural environment gradually had been strengthened, showing that the river network system adapted to urban development [42,54]. Moreover, the adaptability of river network systems varies in different spatial and temporal states. In the future, more emphasis should be placed on the mutual adaptation of cities and river network systems to achieve sustainable development.
There has been an inextricable link between mankind and river network systems since ancient times. In China, there are countless cities built on water and living by rivers, and a network of cities based on canals has developed maturely. In the early years of history, suitable riverine environments provided good water, soil, biology, and transport resources for urban development, and different levels of urban centers had different mechanisms for selecting and adapting to riverine geomorphological environments [23]. However, with the increase in productivity and in the context of rapid urbanization, the human–land–water relationship in the region is changing, with low-grade rivers being filled in and the storage and drainage capacity of river network systems declining, leading to a series of water safety and water ecology problems [55]. Some studies have shown that river network structure has a greater impact on flooding than urbanization [21]. The impact of the river network structure on flooding is greater than that of urbanization. Therefore, there is an urgent need to take measures to improve the adaptability of river network systems in the context of urbanization. The 14th Five-Year Plan of Hunan Province mentions the need to improve the comprehensive carrying capacity of cities and towns, and to build green, sponge, and resilient cities. It can be seen that under the influence of ecological civilization policies, the issue of the adaptability of towns and river network systems is also gaining importance.
Although our findings build on previous studies and improve the understanding of the evolution of river network systems and their adaptations in the Xiangjiang River Basin, there are still some limitations to our methodology and analysis. First, the river network system data were extracted based on Landsat series imagery, which does not capture small bodies of water at high resolution [56]. This results in some small rivers with areas smaller than 30 m × 30 m are not being extracted and therefore potentially missed during the mapping process. Future remote sensing data will have higher resolution (e.g., Sentineland GF-, Planet Labs) and could provide better algorithms and higher spatial and temporal resolution of river network system data. However, this study does provide relatively reliable information on river network systems. Second, we used a spatiotemporal geographically weighted regression model to investigate the influence of three types of drivers on the intensity of change in river network density from 1995 to 2020: population, GDP per capita, and urban land. However, algorithmics, data analysis, or reporting errors may lead to extreme values, and some regression coefficients may be biased. However, the relevant data products are accurate. Third, the combined use of multiple datasets with different spatial resolutions also imposes analytical limitations on the characterization of trends in river network system evolution due to the inevitable biases in the generation of these datasets. In addition, the river network system extraction algorithm used in this study is based on spectral indices, annual frequencies, and thresholds, which allow for the identification of bodies of water. However, due to the limitations of the data and the algorithm, the seasonality of the river and the areas of mixed aquatic vegetation were not considered. Therefore, subsequent research is necessary to improve the algorithm by considering the seasonality of the data and optimizing the threshold parameters.

5. Conclusions

This research used river network system data, land use data and Statistical Yearbook (population and GDP per capita) data for 1995–2020. We use the comprehensive evaluation method of river network evolution characteristics to study the river network system in Xiangjiang River basin. Based on GTWR and coordination degree model, this research reveals the adaptability of river network system under rapid urbanization. The results show that: the rapid urbanization of the Xiangjiang River Basin over the past 25 years has led to robust human activity and a significant increase in urban land, with the main transferor being the water. The shrinkage of the water area has damaged the structure of the river network system in the Xiangjiang River Basin. The indicators of both quantitative and morphological characteristics of the river network system show a trend of decay, with the river network system being more affected by the urbanization process. The tributaries in the Chang-Zhu-Tan area have declined sharply, and the stability of the river network system structure has tended to reduce.
There is spatial and temporal heterogeneity in the influence of each driver on the intensity of change in river network density from 1995 to 2020. Specifically, the positive high values of year-end total population are mainly found in Changsha, Zhuzhou and Xiangtan. The negative high values are found in Yongzhou, Loudi, Chenzhou, and Hengyang. It is indicated that the influence of demographic factors on the change in river network density is weak in these regions. The regression coefficients of river network system density and per capita GDP in each region are large and high, indicating that the influence of GDP on river network density is more obvious. This is related to the radiation impact of the Greater Bay Area and the middle reaches of the Yangtze River on these regions. The regression coefficient between urban land and river network system density is negative in Chenzhou, Xiangtan and Changsha. This shows that the expansion of urban land would have a certain inhibitory effect on the density of the river network from 1995 to 2020.
Over time, the development of urbanization has more and more severe impact on the river network system, and the requirements for the adaptive development of river network system are also higher. In 1995, the level of urbanization was low, the jadaptability and carrying capacity of river network system were strong, and the coordination degree between urbanization and river network system was small. By 2005, the degree of optimal coordination is slightly higher than that of 1995. From 2015 to 2020, the level of urbanization has reached a new height, especially in the upstream Chang-Zhu-Tan area, the middle and downstream central cities such as Hengyang, Yongzhou and Chenzhou, and the surrounding areas with high development intensity and relatively developed industrialization and urbanization. At this time, the river network system space is crowded and buried. The comprehensive carrying capacity of river network system decreases. The increase of coordination degree is characterized by the need for urbanization and river network development to promote each other to jointly enter a new stage of high-level coordinated development, and the requirements for the adaptive development of the two are improved. Excessive urbanization is detrimental to the resilience of the river network system and increases the vulnerability of the urban ecosystem. Therefore, the environmental characteristics of the Xiangjiang River Basin need to be considered. We can relevant measures take to protect the river network system.

Author Contributions

Conceptualization, L.Y. and C.F.; methodology, L.Y.; software, H.L., L.P. and R.S.; validation, L.Y., H.L. and C.F.; formal analysis, L.Y.; resources, L.Y.; data curation, L.P. and R.S.; writing—original draft preparation, H.L.; writing—review and editing, H.L., L.Y. and C.F.; visualization, H.L.; project administration, H.L.; funding acquisition, H.L. All authors have read and agreed to the published version of the manuscript.

Funding

This work was supported by the National Natural Science Foundation of China (41901026, 42001024), the Hunan Province Natural Science Foundation of China (2022JJ40015, 2021JJ40011), the Scientific Research Foundation of Hunan Provincial Education Department, China (21B0646, 21B0625), Graduate Research Innovation Foundation of Hunan Province (CX20221271), and the Science Foundation Project of Hengyang Normal University (18D03).

Data Availability Statement

The data used in this study are available from the corresponding author upon reasonable request.

Acknowledgments

The authors express their profound gratitude to their mentors and evaluation experts for their efforts. Thanks to Jianan Zou, Yangyang Guo, Runze Xuan, Ziyi Liu, Chang Liu, Jin Xiang, Zhonghui Guo, Lijun Wu and many others for their help. The correction of the river network system is inseparable from the joint efforts of the team.

Conflicts of Interest

The authors declare no conflict of interest.

References

  1. World Cities Report 2022 Envisaging the Future of Cities; United Nations Human Settlements Programme: Nairobi, Kenya, 2022; pp. 1–387.
  2. Dottori, F.; Mentaschi, L.; Bianchi, A.; Alfieri, L.; Feyen, L. Cost-effective adaptation strategies to rising river flood risk in Europe. Nat. Clim. Chang. 2023, 13, 196–202. [Google Scholar] [CrossRef]
  3. Habersack, H.; Haspel, D.; Kondolf, M. Large Rivers in the Anthropocene: Insights and tools for understanding climatic, land use, and reservoir influences. Water Resour. Res. 2014, 50, 3641–3646. [Google Scholar] [CrossRef]
  4. Jiang, S.H.; Zhou, L.; Ren, L.L.; Wang, M.H.; Xu, C.Y.; Yuan, F.; Liu, Y.; Yang, X.L.; Ding, Y. Development of a comprehensive framework for quantifying the impacts of climate change and human activities on river hydrological health variation. J. Hydrol. 2021, 600, 126566. [Google Scholar] [CrossRef]
  5. Song, X.P.; Hansen, M.C.; Stehman, S.V.; Potapov, P.V.; Tyukavina, A.; Vermote, E.F.; Townshend, J.R. Global land change from 1982 to 2016. Nature 2018, 560, 639–643. [Google Scholar] [CrossRef] [PubMed]
  6. Wang, H.; He, G. Rivers: Linking nature, life, and civilization. River 2022, 1, 25–36. [Google Scholar] [CrossRef]
  7. Copenhagen, W.J. Adaptability of the Natal Crawfish. Nature 1933, 132, 354. [Google Scholar] [CrossRef]
  8. Bloschl, G.; Kiss, A.; Viglione, A.; Barriendos, M.; Bohm, O.; Brazdil, R.; Coeur, D.; Demaree, G.; Llasat, M.C.; Macdonald, N.; et al. Current European flood-rich period exceptional compared with past 500 years. Nature 2020, 583, 560–566. [Google Scholar] [CrossRef]
  9. Kreibich, H.; Van Loon, A.F.; Schroter, K.; Ward, P.J.; Mazzoleni, M.; Sairam, N.; Abeshu, G.W.; Agafonova, S.; AghaKouchak, A.; Aksoy, H.; et al. The challenge of unprecedented floods and droughts in risk management. Nature 2022, 608, 80–86. [Google Scholar] [CrossRef]
  10. Elmore, A.J.; Kaushal, S.S. Disappearing headwaters: Patterns of stream burial due to urbanization. Front. Ecol. Environ. 2008, 6, 308–312. [Google Scholar] [CrossRef]
  11. Han, L.F.; Xu, Y.P.; Lei, C.G.; Yang, L.; Deng, X.J.; Hu, C.S.; Xu, G.L. Degrading river network due to urbanization in Yangtze River Delta. J. Geogr. Sci. 2016, 26, 694–706. [Google Scholar] [CrossRef]
  12. Song, S.; Lin, Z.; Wang, Y.F.; Li, G.; Deng, X.J. The response of river network structure to urbanization: A multifractal perspective. J. Clean. Prod. 2019, 221, 377–388. [Google Scholar] [CrossRef]
  13. Wang, H.X.; Huang, L.T.; Hu, J.W.; Yang, H.; Guo, W.X. Effect of Urbanization on the River Network Structure in Zhengzhou City, China. Int. J. Environ. Res. Public Health 2022, 19, 2464. [Google Scholar] [CrossRef] [PubMed]
  14. Xu, G.L.; Li, A.J.; Yang, Q.Q.; Chi, J.Y. Spatiotemporal change in the river network in rapidly urbanized plain regions of the Yangtze River Delta in China. River Res. Appl. 2022, 38, 965–974. [Google Scholar] [CrossRef]
  15. Kang, C.S.; Kanniah, K.D. Land use and land cover change and its impact on river morphology in Johor River Basin, Malaysia. J. Hydrol. Reg. Stud. 2022, 41, 101072. [Google Scholar] [CrossRef]
  16. Tang, W.; Xu, Y.J.; Ni, M.F.; Li, S.Y. Land use and hydrological factors control concentrations and diffusive fluxes of riverine dissolved carbon dioxide and methane in low-order streams. Water Res. 2023, 231, 119615. [Google Scholar] [CrossRef]
  17. Wang, Q.; Xu, Y.P.; Xu, Y.; Wu, L.; Wang, Y.F.; Han, L.F. Spatial hydrological responses to land use and land cover changes in a typical catchment of the Yangtze River Delta region. Catena 2018, 170, 305–315. [Google Scholar] [CrossRef]
  18. Zhang, X.Y.; Li, F.W.; Zhao, Y. Impact of changes in river network structure on hydrological connectivity of watersheds. Ecol. Indic. 2023, 146, 109848. [Google Scholar] [CrossRef]
  19. Deng, X.J.; Xu, Y.P.; Han, L.F.; Song, S.; Xu, G.L.; Xiang, J. Spatial-temporal changes in the longitudinal functional connectivity of river systems in the Taihu Plain, China. J. Hydrol. 2018, 566, 846–859. [Google Scholar] [CrossRef]
  20. Yang, L.; Xu, Y.P.; Han, L.F.; Song, S.; Deng, X.J.; Wang, Y.F. River networks system changes and its impact on storage and flood control capacity under rapid urbanization. Hydrol. Process. 2016, 30, 2401–2412. [Google Scholar] [CrossRef]
  21. Liu, S.; Lin, M.N.; Li, C.L. Analysis of the Effects of the River Network Structure and Urbanization on Waterlogging in High-Density Urban Areas-A Case Study of the Pudong New Area in Shanghai. Int. J. Environ. Res. Public Health 2019, 16, 3306. [Google Scholar] [CrossRef]
  22. Han, L.F.; Xu, Y.P.; Deng, X.J.; Li, Z.W. Stream loss in an urbanized and agricultural watershed in China. J. Environ. Manag. 2020, 253, 109687. [Google Scholar] [CrossRef] [PubMed]
  23. Du, L.J.; Wang, F.; Zhang, Q.X.; Fang, Y.Y. Adaptation of urban distribution to the fluvial geomorphic environment and the reconstruction of the river system structure by urban distribution in Haihe Plain in the past 2200 years. River Res. Appl. 2021, 39, 1199–1211. [Google Scholar] [CrossRef]
  24. Yang, S.T.; Pan, Z.H.; Lou, H.Z.; Li, C.J.; Zhang, J.; Zhang, Y.J.; Yi, Y.; Gong, J.Y.; Luo, Y.; Zhi, M.; et al. Reconstruction of the water cycle process reveals the 600-year evolution of the human-water relationship in Tunpu, China. J. Hydrol. 2023, 617, 128927. [Google Scholar] [CrossRef]
  25. Lei, C.G.; Wang, Q.; Wang, Y.; Han, L.F.; Yuan, J.; Yang, L.; Xu, Y.P. Spatially non-stationary relationships between urbanization and the characteristics and storage-regulation capacities of river systems in the Tai Lake Plain, China. Sci. Total Environ. 2022, 824, 153684. [Google Scholar] [CrossRef] [PubMed]
  26. Brunsdon, C.; Fotheringham, A.S.; Charlton, M. Geographically weighted regression A method for exploring spatial nonstationarity. Geogr. Anal. 1996, 28, 281–298. [Google Scholar] [CrossRef]
  27. Fotheringham, A.S.; Charlton, M.E. Geographically weighted regression a natural evolution of the expansion method for spatial data analysis. Environ. Plan. A 1998, 30, 1905–1927. [Google Scholar] [CrossRef]
  28. Chen, Y.Z.; Zhou, G.H.; Wang, H.; Cui, S.Q.; Bi, F.Z.; Yu, X.X. The Evolution Characteristics and Enhancement Paths of the Economy-Society-Ecology Coordinated Development Level of Changsha-Zhuzhou-Xiangtan Urban Agglomeration. Trop. Geo. 2023, 43, 519–531, (In Chinese with English abstract). [Google Scholar] [CrossRef]
  29. Yang, K.; Yuan, W.; Zhao, J.; Xu, S.Y. Stream Structure Characteristic and Its Urbanization Responses to Tidal River System. Acta Ecol. Sin. 2004, 59, 557–564, (In Chinese with English abstract). [Google Scholar]
  30. Yuan, W.; Yang, K.; Wu, J.P. River Structure Characteristics and Classification System in River Network Plain During the Course of Urbanization. Sci. Geogr. Sin. 2007, 27, 401–407, (In Chinese with English abstract). [Google Scholar]
  31. Zhao, J.; Shan, F.Z.; Yang, K.; Wu, E.N. River sinuosity in tidal plain and its response to rapid urbanization. Adv. Water Sci. 2011, 22, 631–637, (In Chinese with English abstract). [Google Scholar] [CrossRef]
  32. Mueller, J.E. An Introduction to hydraulic and topographic sinuosity index. J. Assoc. Am. Geogr. 1968, 58, 371–385. [Google Scholar] [CrossRef]
  33. Wu, L.; Xu, Y.P.; Xu, Y.; Yuan, J.; Xiang, J.; Xu, X.; Xu, Y. Impact of rapid urbanization on river system in a river network plain. Acta Ecol. Sin. 2018, 73, 104–114, (In Chinese with English abstract). [Google Scholar] [CrossRef]
  34. Xu, G.L.; Xu, Y.P.; Wang, L.Y. Temporal and spatial changes of river systems in HangzhouJiaxing-Huzhou Plain during 1960–2000s. Acta Ecol. Sin. 2013, 68, 966–974, (In Chinese with English abstract). [Google Scholar]
  35. Yu, M.J. Changes of River System and Hydrological Process under the Impacts of Urbanization—A Case Study in Yinfeng Plain, Yongjiang River Basin, China; Nanjing University: Nanjing, China, 2013; pp. 1–88, (In Chinese with English abstract). [Google Scholar]
  36. Bai, Y.; Wu, L.X.; Qin, K.; Zhang, Y.F.; Shen, Y.Y.; Zhou, Y. A Geographically and Temporally Weighted Regression Model for Ground-Level PM2.5 Estimation from Satellite-Derived 500 m Resolution AOD. Remote Sens. 2016, 8, 262. [Google Scholar] [CrossRef]
  37. Hu, J.Y.; Liu, B.J. Analysis of River Network Changes Based on Spatial Auto-regression and Geographic Weighted Regression Model. J. China Hydrol. 2019, 39, 7–13, (In Chinese with English abstract). [Google Scholar]
  38. Xu, Y.; Xu, Y.P.; Wang, Q.; Wu, L.; Yang, J.Y.; Shi, H.Y. Relationship between urbanization and river network change in Taihu Lake basin, China. Adv. Water Sci. 2018, 29, 473–481, (In Chinese with English abstract). [Google Scholar]
  39. Huang, B.; Wu, B.; Barry, M. Geographically and temporally weighted regression for modeling spatio-temporal variation in house prices. Int. J. Geogr. Inf. Sci. 2010, 24, 383–401. [Google Scholar] [CrossRef]
  40. Li, Y.F.; Li, Y.; Zhou, Y.; Shi, Y.L.; Zhu, X.D. Investigation of a coupling model of coordination between urbanization and the environment. J. Environ. Manag. 2012, 98, 127–133. [Google Scholar] [CrossRef]
  41. Liu, Y.B.; Li, R.D.; Song, X.F. Analysis of Couping Degrees of Urbannization and Ecological Environment of China. J. Nat. Resour. 2005, 20, 105–112, (In Chinese with English abstract). [Google Scholar]
  42. Zhang, Y.; Yang, Z.F.; Li, W. Analyses of urban ecosystem based on information entropy. Ecol. Model. 2006, 197, 1–12. [Google Scholar] [CrossRef]
  43. Xiong, Y.; Zhang, F.M.; An, G.C.; Peng, L. Spatial-temporal Evolvement of Ecosystem Service Value in Hunan Province Based on LUCC. Resour. Environ. Yangtze Basin 2018, 27, 1397–1408, (In Chinese with English abstract). [Google Scholar]
  44. Peng, H.Z.; Zhou, G.H.; Cui, S.Q.; Shang, P. Evaluation and Obstacle Factor Identification of Multifunctionality of Land Use in Xiangjiang River Basin. Res. Soil. Water Conserv. 2022, 29, 308–315, (In Chinese with English abstract). [Google Scholar]
  45. Yuan, X.L.; Wang, C.; Li, B.Y.; Wang, W.; Chen, N.C. Review of the Driving Forces and Impacts of Land Use/Cover Change in the Yangtze River Basin. Geomat. Inf. Sci. Wuhan Univ. 2023, 48, 1241–1255, (In Chinese with English abstract). [Google Scholar]
  46. Yang, L.; Wang, C.Y.; Chang, F.; Li, H.Y.; Peng, L.L.; Xuan, R.Z. Four-dimensional assessment system for flood risks with the river network system evolution in Xiangjiang River Basin in Hunan of China. Trans. Chin. Soc. Agric. Eng. 2023, 39, 92–101, (In Chinese with English abstract). [Google Scholar]
  47. Xuan, R.Z.; Yang, L.; Feng, C.; Zhan, Q.; Hua, Y.Y.; Lv, L. Changes of River Network System in Midstream of Xiangjiang River and Its Response to Urban Expansion. Water Resour. Power 2023, 41, 30–33. [Google Scholar]
  48. Zhou, H.J.; Shi, P.J.; Wang, J.A.; Guo, L.; Zheng, J.; Yu, D.Y. River Network Change and Its Ecological Effects in Shenzhen Region in Recent 30 Years. Acta Geogr. Sin. 2008, 63, 969–980, (In Chinese with English abstract). [Google Scholar]
  49. Deng, X.J.; Xu, Y.P.; Han, L.F.; Li, G.; Wang, Y.F.; Xiang, J.; Xu, G.L. Spatial-temporal changes of river systems in Jiaxing under the background of urbanization. Acta Ecol. Sin. 2016, 71, 75–85, (In Chinese with English abstract). [Google Scholar] [CrossRef]
  50. Xu, H.Y.; Liu, L.; Ding, P.; Moller, M.S. Applying Ecosystem-Based Adaptation (EbA) in Multiple Scale Cooperative Stormwater Management in Climate Change Adaptation City: Case from Copenhagen. Landsc. Archit. 2022, 29, 53–66, (In Chinese with English abstract). [Google Scholar]
  51. Chen, S.C.; Liu, X.M. Analysis of Rainwater Garden Design in the Background of Sponge City: A case study of Ningbo Ecological Corridor. Contemp. Hortic. 2020, 7, 1–3, (In Chinese with English abstract). [Google Scholar]
  52. Gong, J.X.; Zou, B.; Liu, X.Q. Spatio-temporal differentiation of urbanization in the Xiangjiang Valley from 1990 to 2010. Resour. Sci. 2016, 38, 1723–1732, (In Chinese with English abstract). [Google Scholar]
  53. Liu, Y.B.; Li, R.D.; Song, X.F. Grey Associative Analysis of regional Urbanization and Eco-environment Coupling in China. Acta Geogr. Sin. 2005, 60, 237–247, (In Chinese with English abstract). [Google Scholar]
  54. Yang, L. Impact of Urbanization on River Networks System and Its Storage Flood Control Capacity in the Typical Areas of Yangtze River Delta: A Case Study of River Network Region in Suzhou; Nanjing University: Nanjing, China, 2017; pp. 1–122. [Google Scholar]
  55. Deng, X.J.; Xu, Y.P.; Han, L.F.; Yu, Z.H.; Yang, M.N.; Pan, G.B. Assessment of river health based on an improved entropy-based fuzzy matter-element model in the Taihu Plain, China. Ecol. Indic. 2015, 57, 85–95. [Google Scholar] [CrossRef]
  56. Jin, S.; Liu, Y.X.; Fagherazzi, S.; Mi, H.; Qiao, G.; Xu, W.X.; Sun, C.; Liu, Y.C.; Zhao, B.X.; Fichot, C.e.G. River body extraction from sentinel-2A/B MSI images based on an adaptive multi-scale region growth method. Remote Sens. Environ. 2021, 255, 112297. [Google Scholar] [CrossRef]
Figure 1. Geographical location and administrative divisions of Xiangjiang River Basin.
Water 15 03768 g001
Figure 2. Spatial distribution of land use types in Xiangjiang River Basin.
Water 15 03768 g002
Figure 3. Land use and chord map of Xiangjiang River Basin.
Water 15 03768 g003
Figure 4. Temporal and spatial evolution of river network system quantity characteristics in Xiangjiang River Basin.
Water 15 03768 g004
Figure 5. Temporal and spatial evolution of river network system morphological characteristics in Xiangjiang River Basin.
Water 15 03768 g005
Figure 6. Spatial distribution of GTWR model’s regression coefficient from 1995 to 2020.
Water 15 03768 g006
Figure 7. Deformation function of the river network system and urban land coordination degree in the study area.
Water 15 03768 g007
Table 1. Study data and processing.
Data NameData SourcesData ProcessingData Results
River network systemGeospatial Data Cloud 95/05/15/20 four-phase 30 m resolution remote sensing image mapThe acquired remote sensing images are subjected to pre-processing steps such as radiometric calibration, atmospheric correction, and image mosaic in ENVI. Manual calibration is performed based on Google HD resolution images.Obtained a four-phase river network system map, divided into main streams, primary rivers, secondary rivers, and tertiary rivers. All the main streams and tributaries include line and plane elements, and the total number is 48.
Land useCAS Resource and
Environmental Science and Data Centre 95/00/05/10/15/20 Six phases of 30 m resolution land use imagery
Reclassification and fusion of images with ArcMap.Classified into six types: arable land, forest land, grassland, water, urban land and unused land, and calculated land use transfer matrix.
Table 2. Evaluating indicators of stream structure.
Type of IndicatorIndicator Name and FormulaFormula MeaningPhysical Significance
Indicators of quantitative characteristicsRiver network density (Dd) [29]
Dd = LR/A
LR: Total length of river (km)
A: Total watershed area (km2)
The greater the value, the greater the regional storage capacity and vice versa
Water surface rate (Wp) [30]
Wp = (Aw/A) × 100%
River Frequency (Fr) [31]
Fr = N/A
Aw: Total area of rivers and lakes (km2)
N: Number of rivers in the region
Total area of rivers and lakes in the basin as a proportion of the total area of the basin
Indicates the development of the number of rivers
Morphological and structural indicatorsCurvature of the river network (Sr) [32]
Sr = L/Ls
Tributary development factor (K) [33]
K = LG/LT
Dry flow area to length ratio (RAL) [34]
RAL = AW/LT
Structural stability (DR) [35]
DR = LR/Aw
L: Straight-line distance between the start and end points of a river
Ls: The length of the river
LG: Total length of tributary
LT: Total length of mainstream in km
Ratio of mainstream area to main stream length
LT: Main stream length
Ratio of the total length of the corresponding class of river to the total area of the river
The ratio of the actual length of a river network to the shortest distance between its two endpoints, reflecting the natural curvature of the river network
Indicates the extent of tributary development
Reflects the overflow capacity of the river network cross-section
Reflects the stability of the river network, its daily storage capacity, and its ability to withstand floods and droughts. A value less than 1 indicates that the area of the river is decaying faster than its length, while a value greater than 1 indicates the opposite
Disclaimer/Publisher’s Note: The statements, opinions and data contained in all publications are solely those of the individual author(s) and contributor(s) and not of MDPI and/or the editor(s). MDPI and/or the editor(s) disclaim responsibility for any injury to people or property resulting from any ideas, methods, instructions or products referred to in the content.

