Numerical Modeling of the Dispersion Characteristics of Pollutants in the Confluence Area of an Asymmetrical River
Abstract
:1. Introduction
2. Mathematical Models and Verification
2.1. Control Equations
2.2. Model Validation
2.2.1. Verification Model Overview
2.2.2. Numerical Method
2.2.3. Model Verification
3. Program Design
3.1. Overview of the River Model
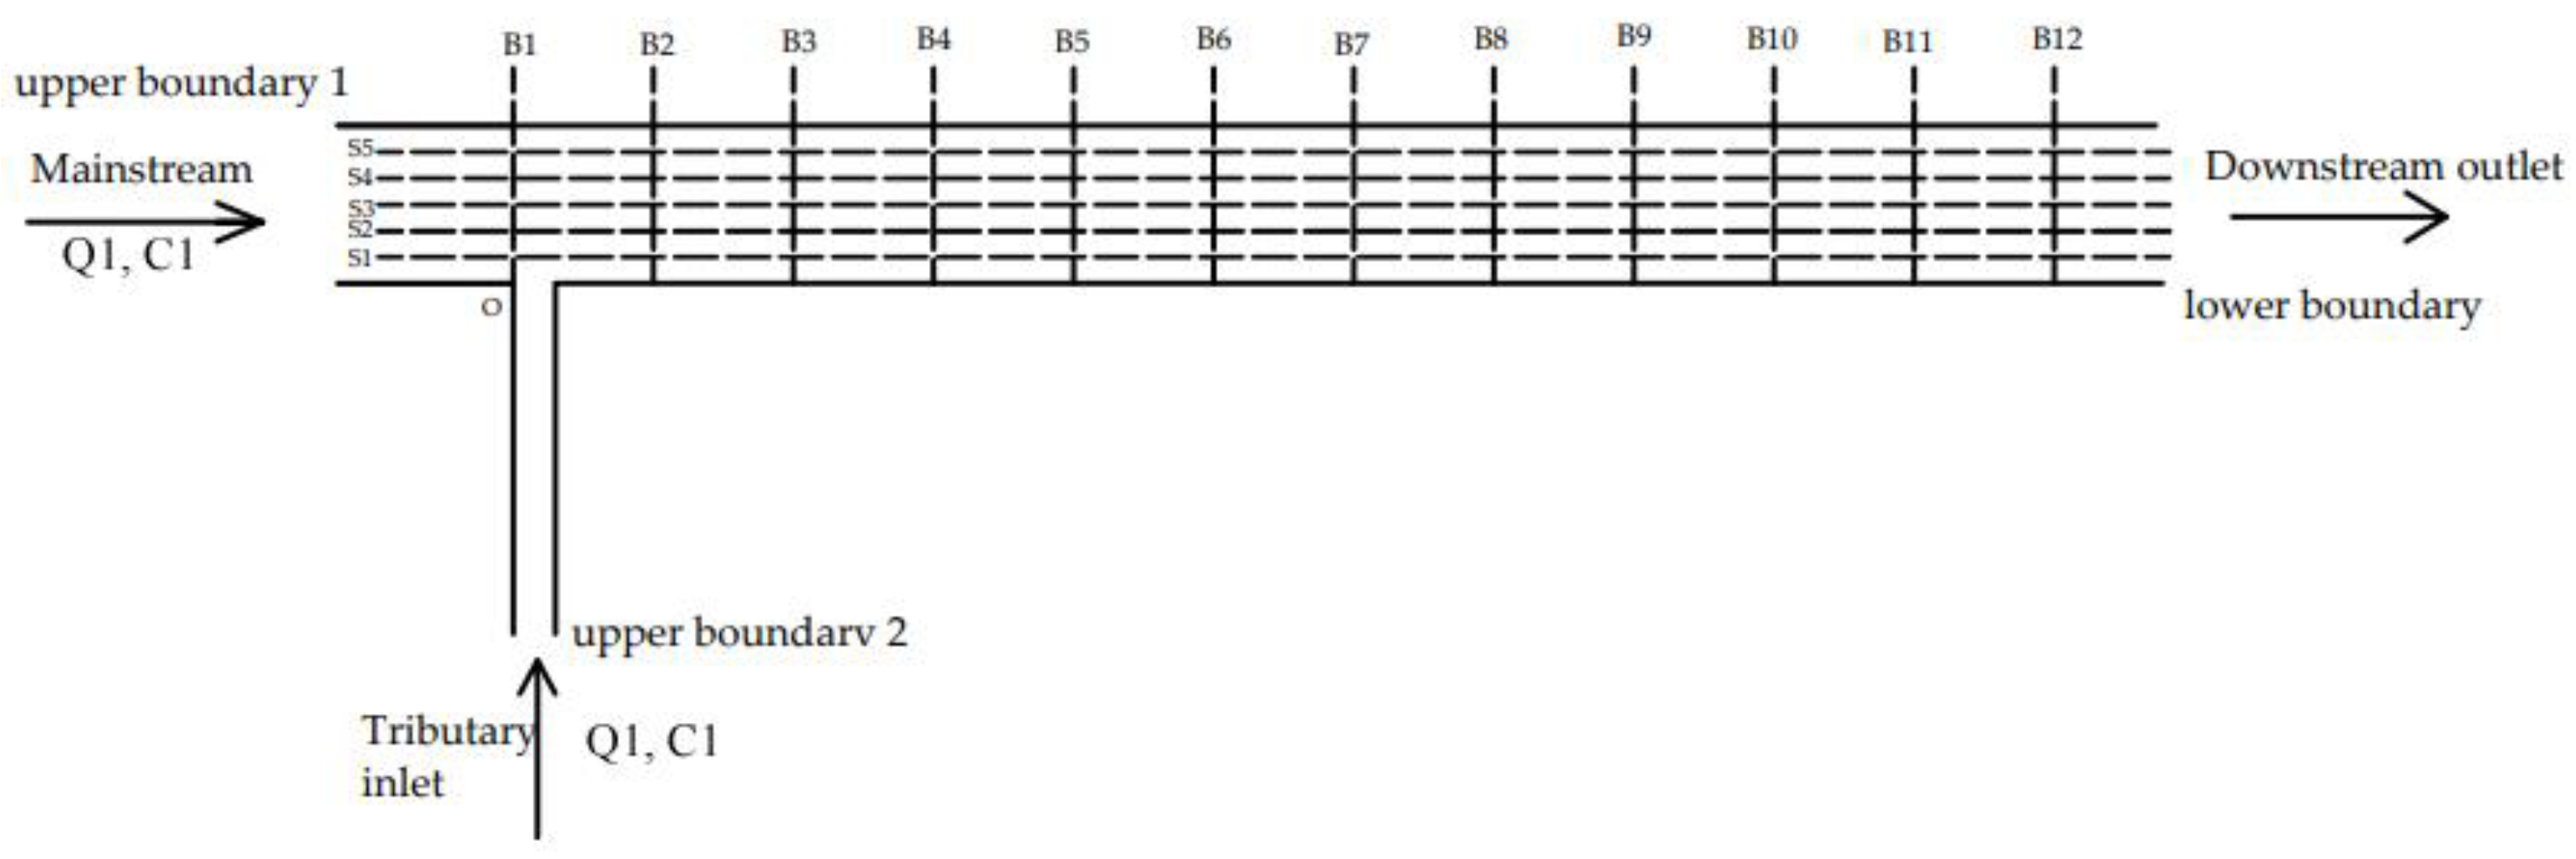
3.2. Measurement Point Placement and Cross-Sectional Monitoring
3.3. Calculation and Setting Conditions
3.3.1. Calculation Conditions
3.3.2. Establishing the Boundary Conditions
4. Analysis of Results
4.1. Analysis of the Horizontal Diffusion Characteristics of Pollutants
4.2. Trajectory Line of Pollutant Mixing Interface Changes along the Path
4.2.1. Influence of the Discharge Ratio on Trajectory Line Variation along the Pollutant Mixing Interface
4.2.2. Influence of the Width-Depth Ratio on Trajectory Line Variation along the Pollutant Mixing Interface
4.2.3. Influence of the Concentration Difference on the Trajectory along the Pollutant Mixing Interface
4.3. Mixing Characteristics of the Pollutant Concentration
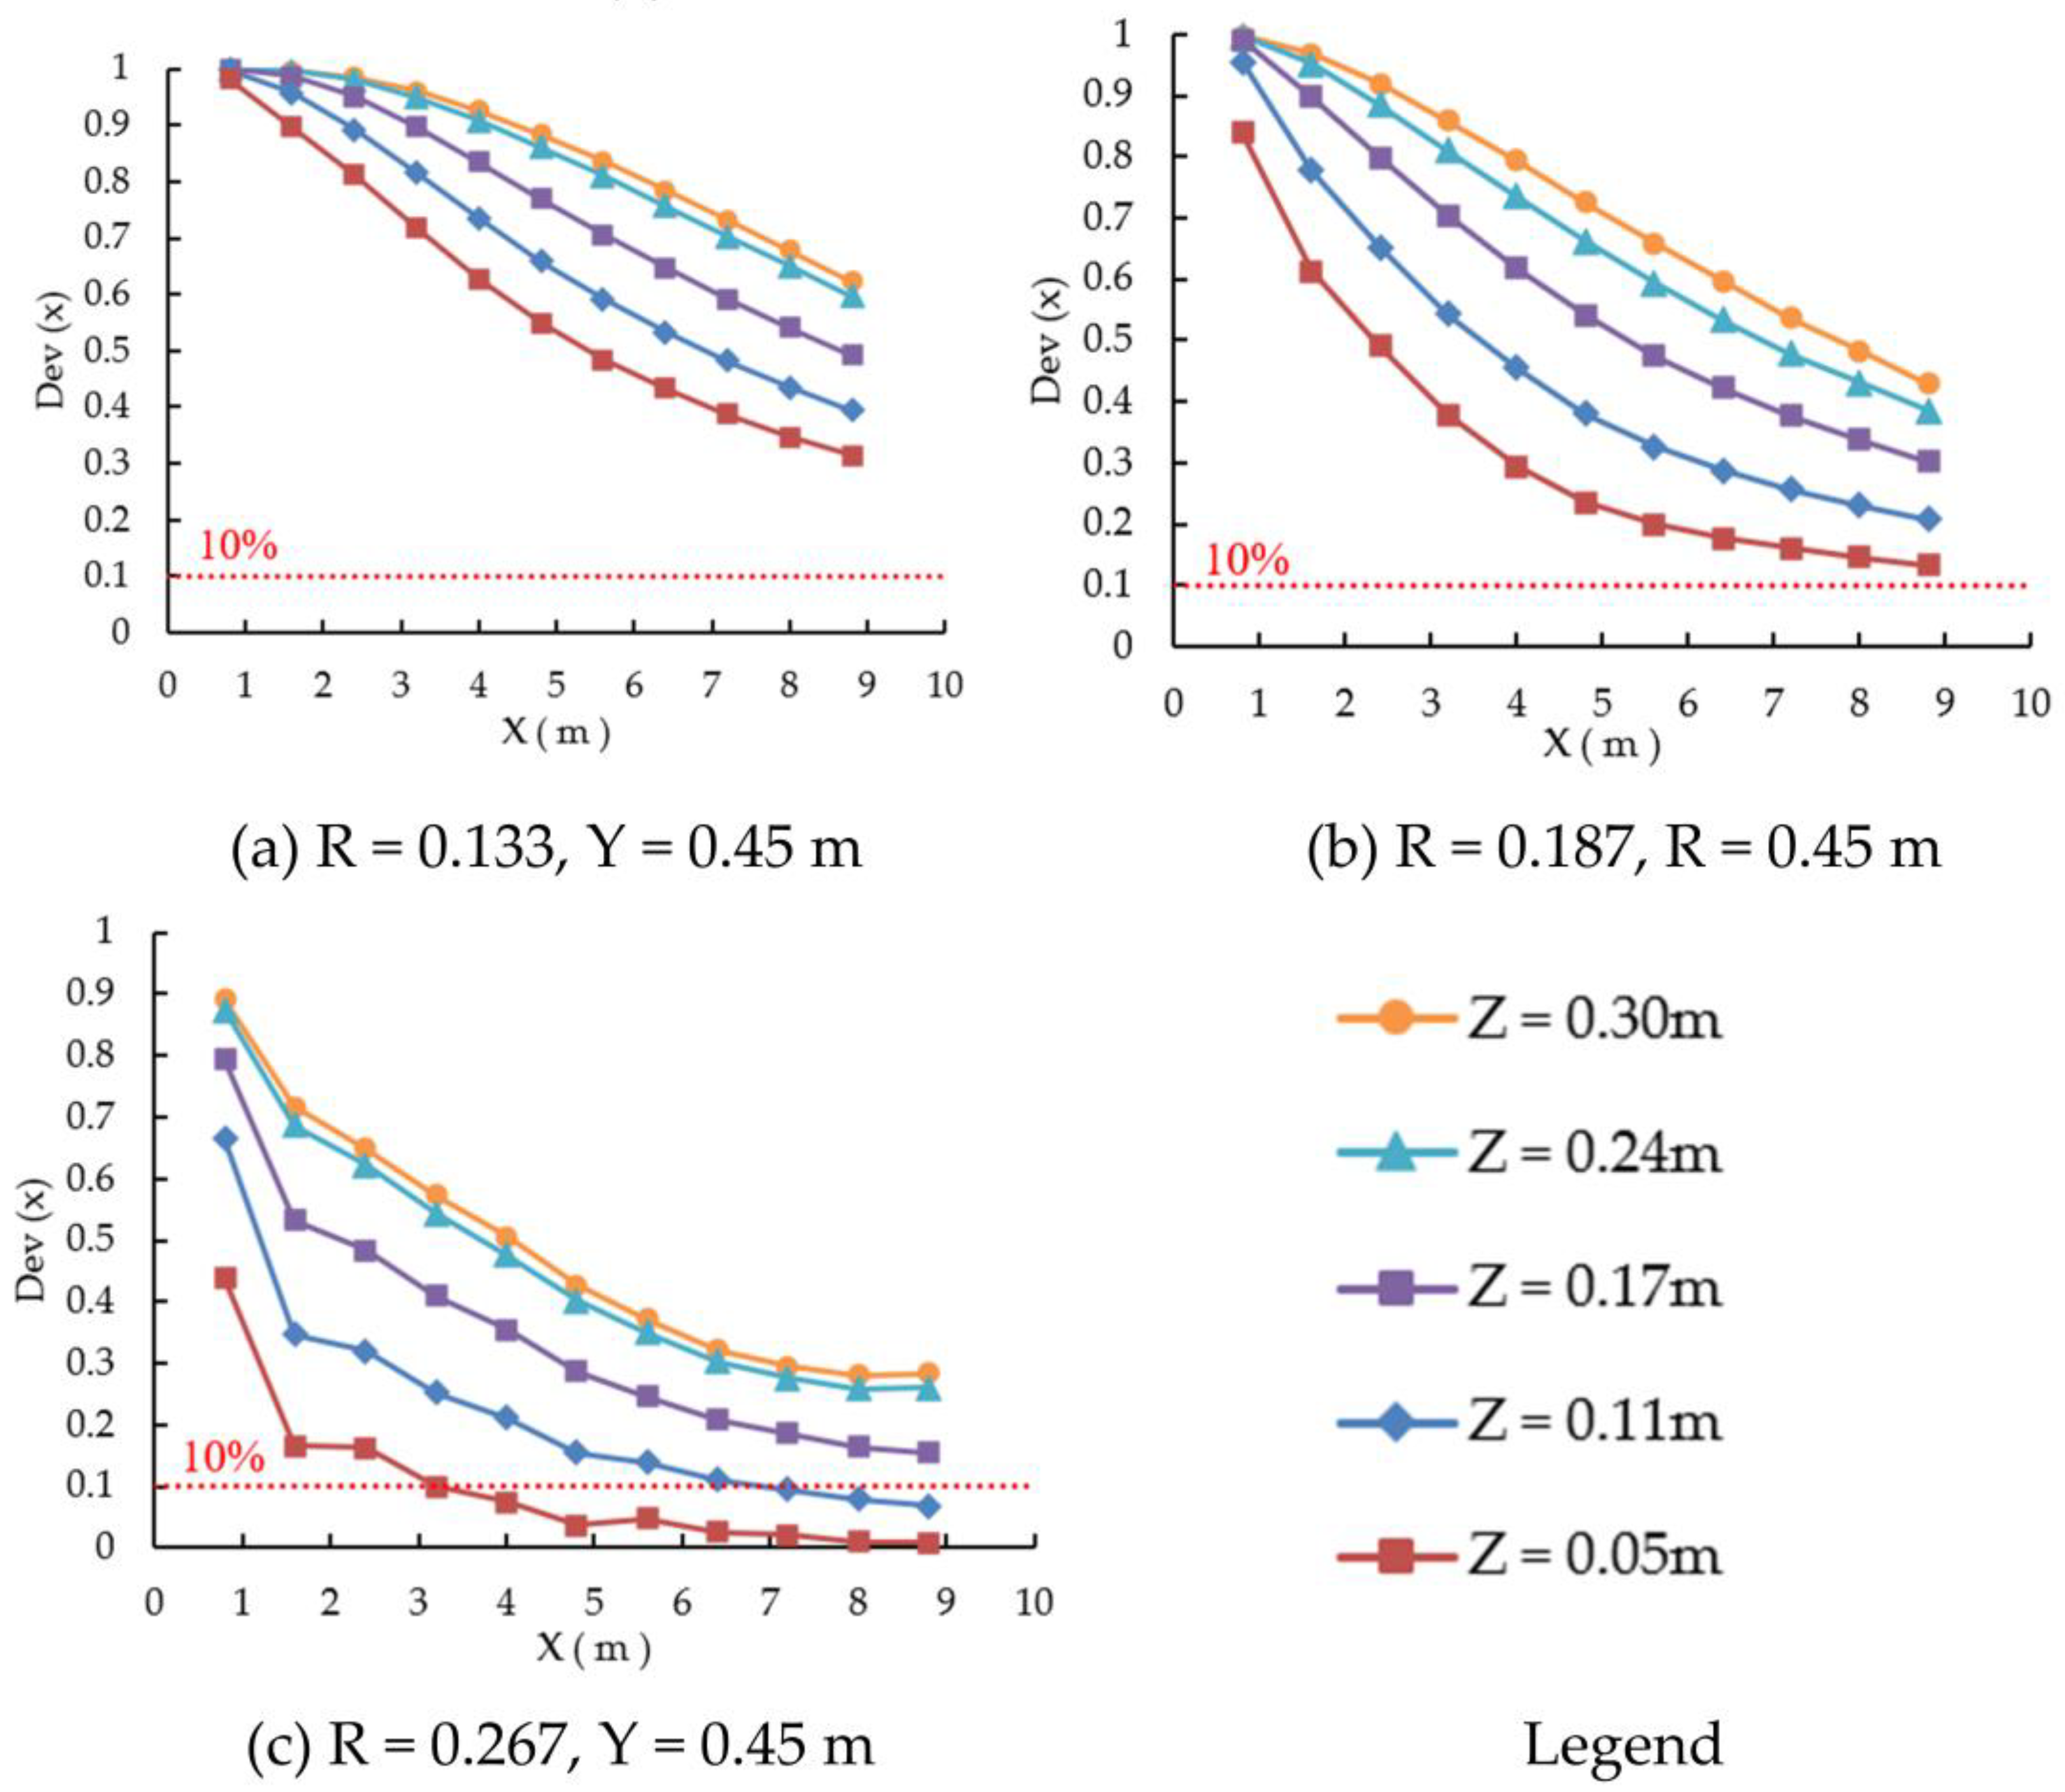
4.3.1. Effect of the Discharge Ratio on the Pollutant Mixing Characteristics
4.3.2. Effect of the Width-Depth Ratio on the Mixing Characteristics of Pollutants
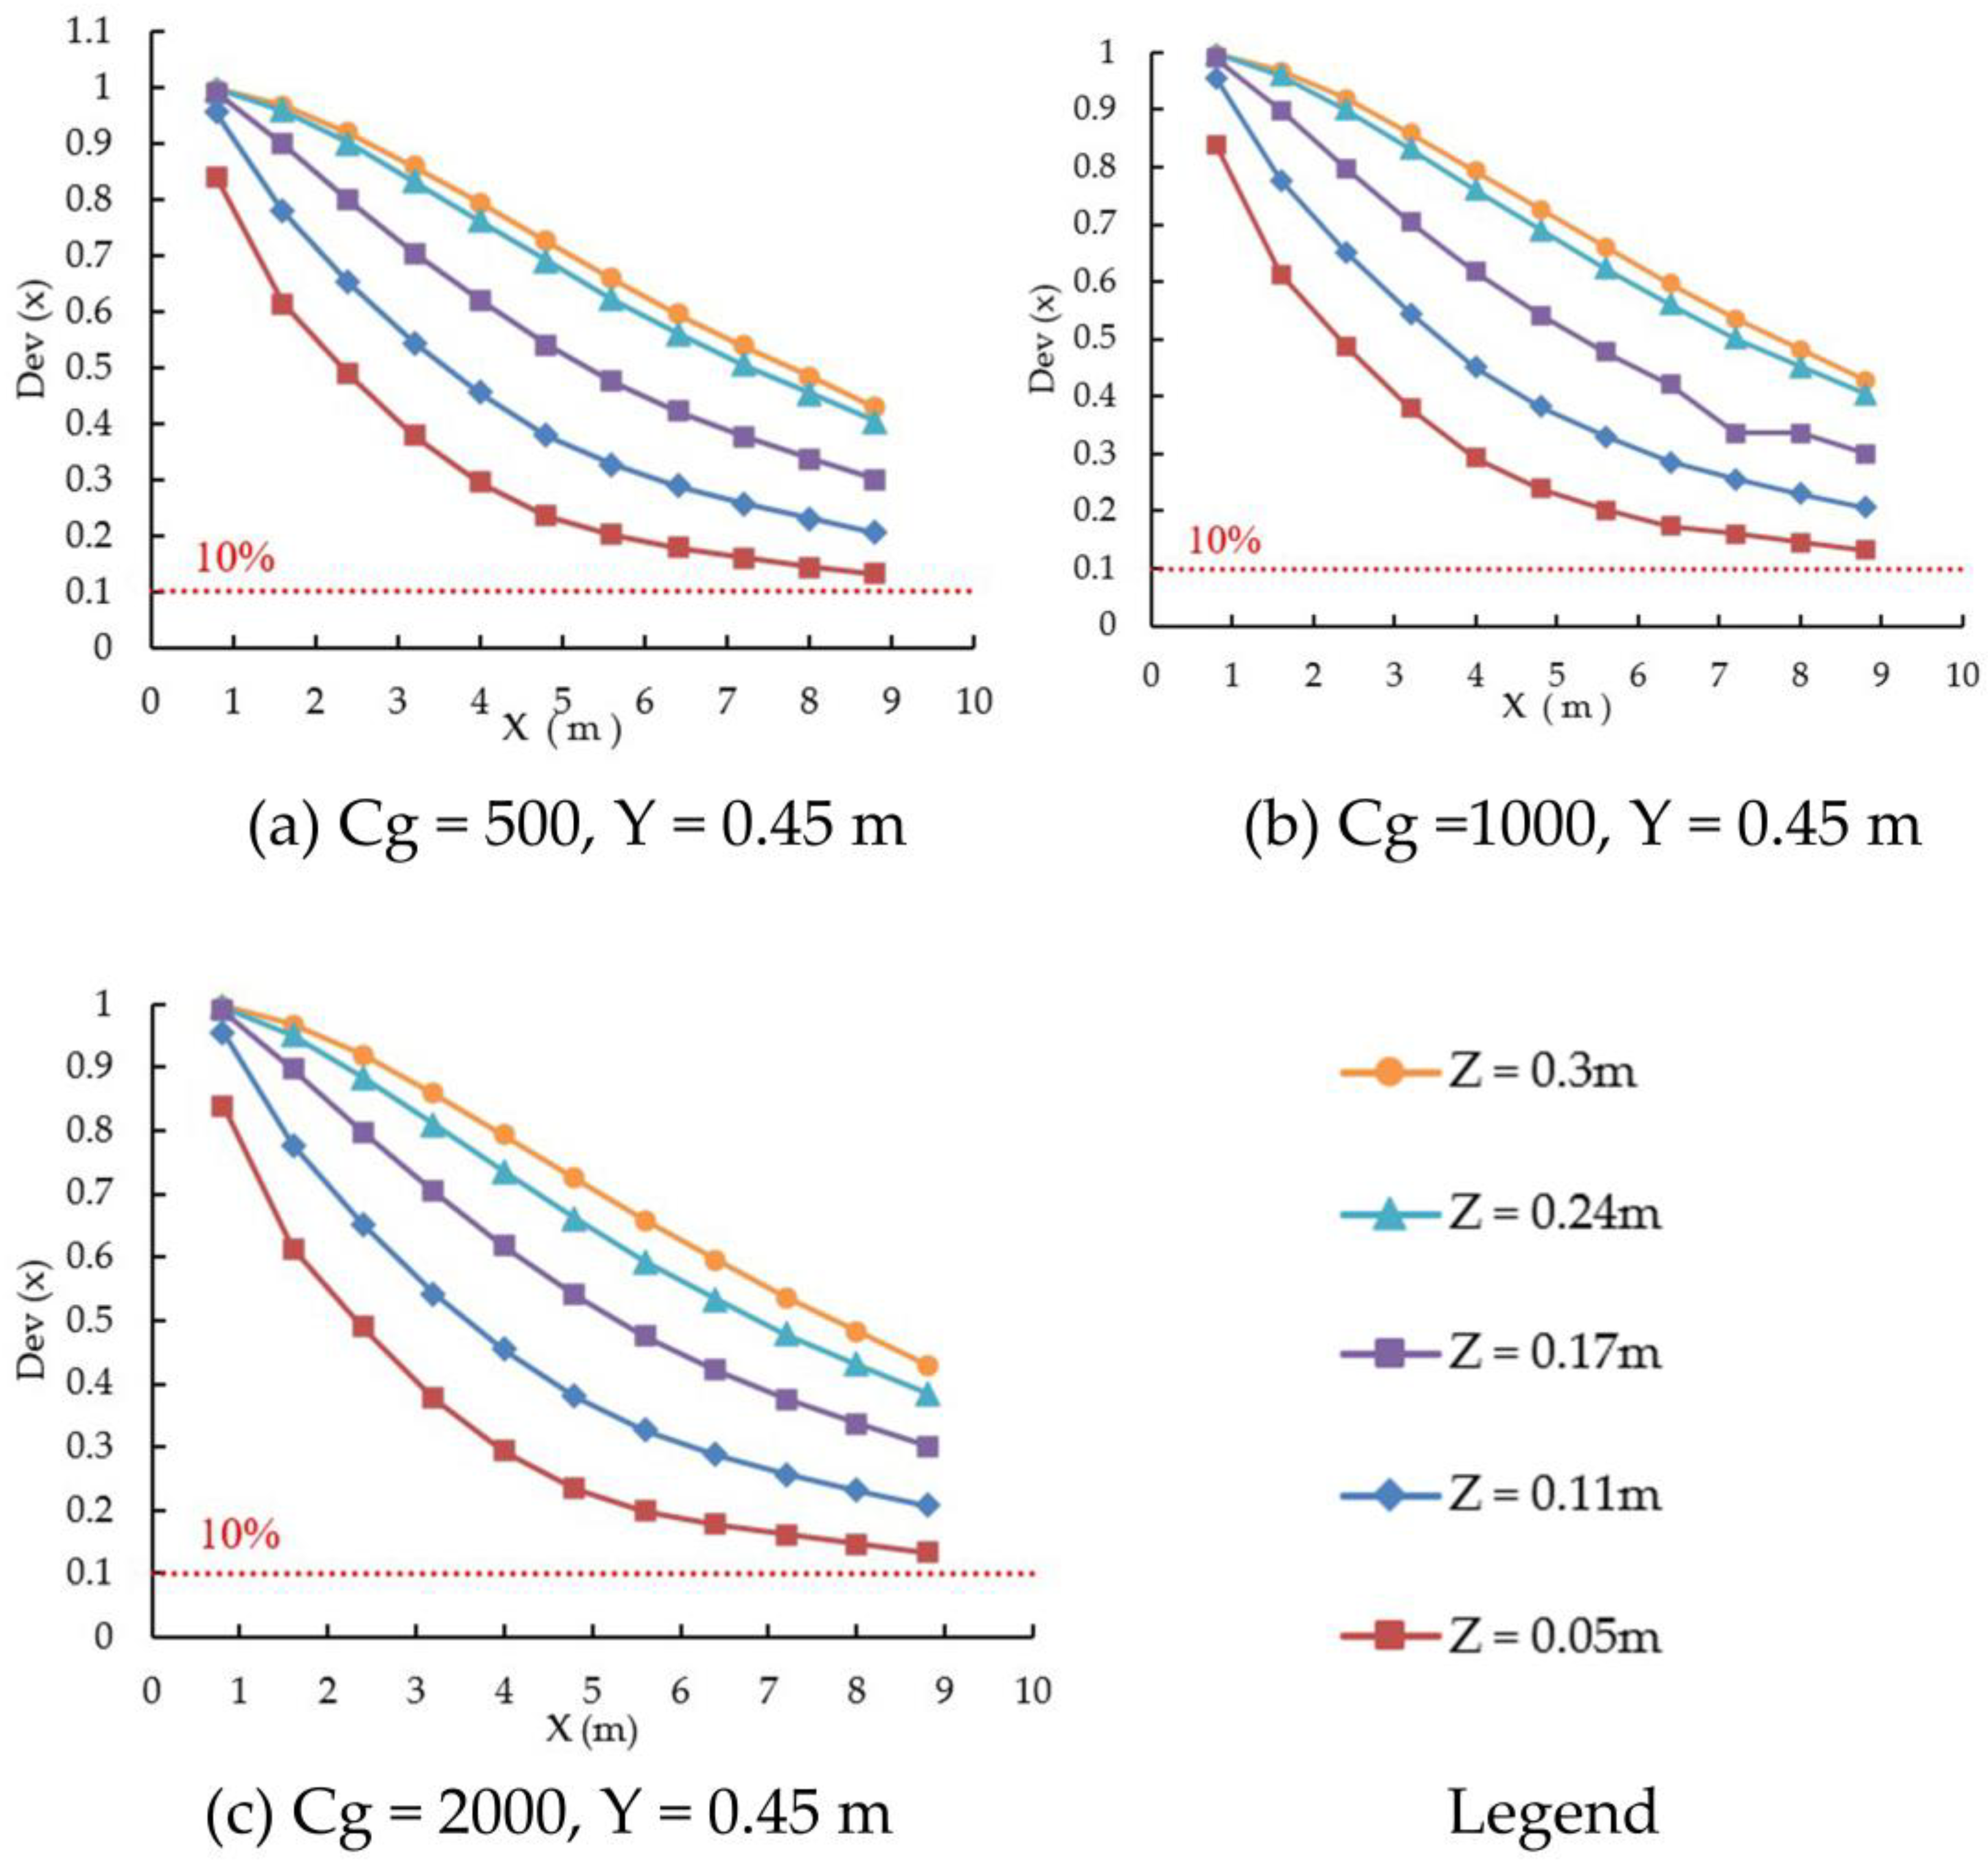
4.3.3. Effect of the Concentration Difference on the Mixing Characteristics of Pollutants
5. Discuss
6. Conclusions
- (1)
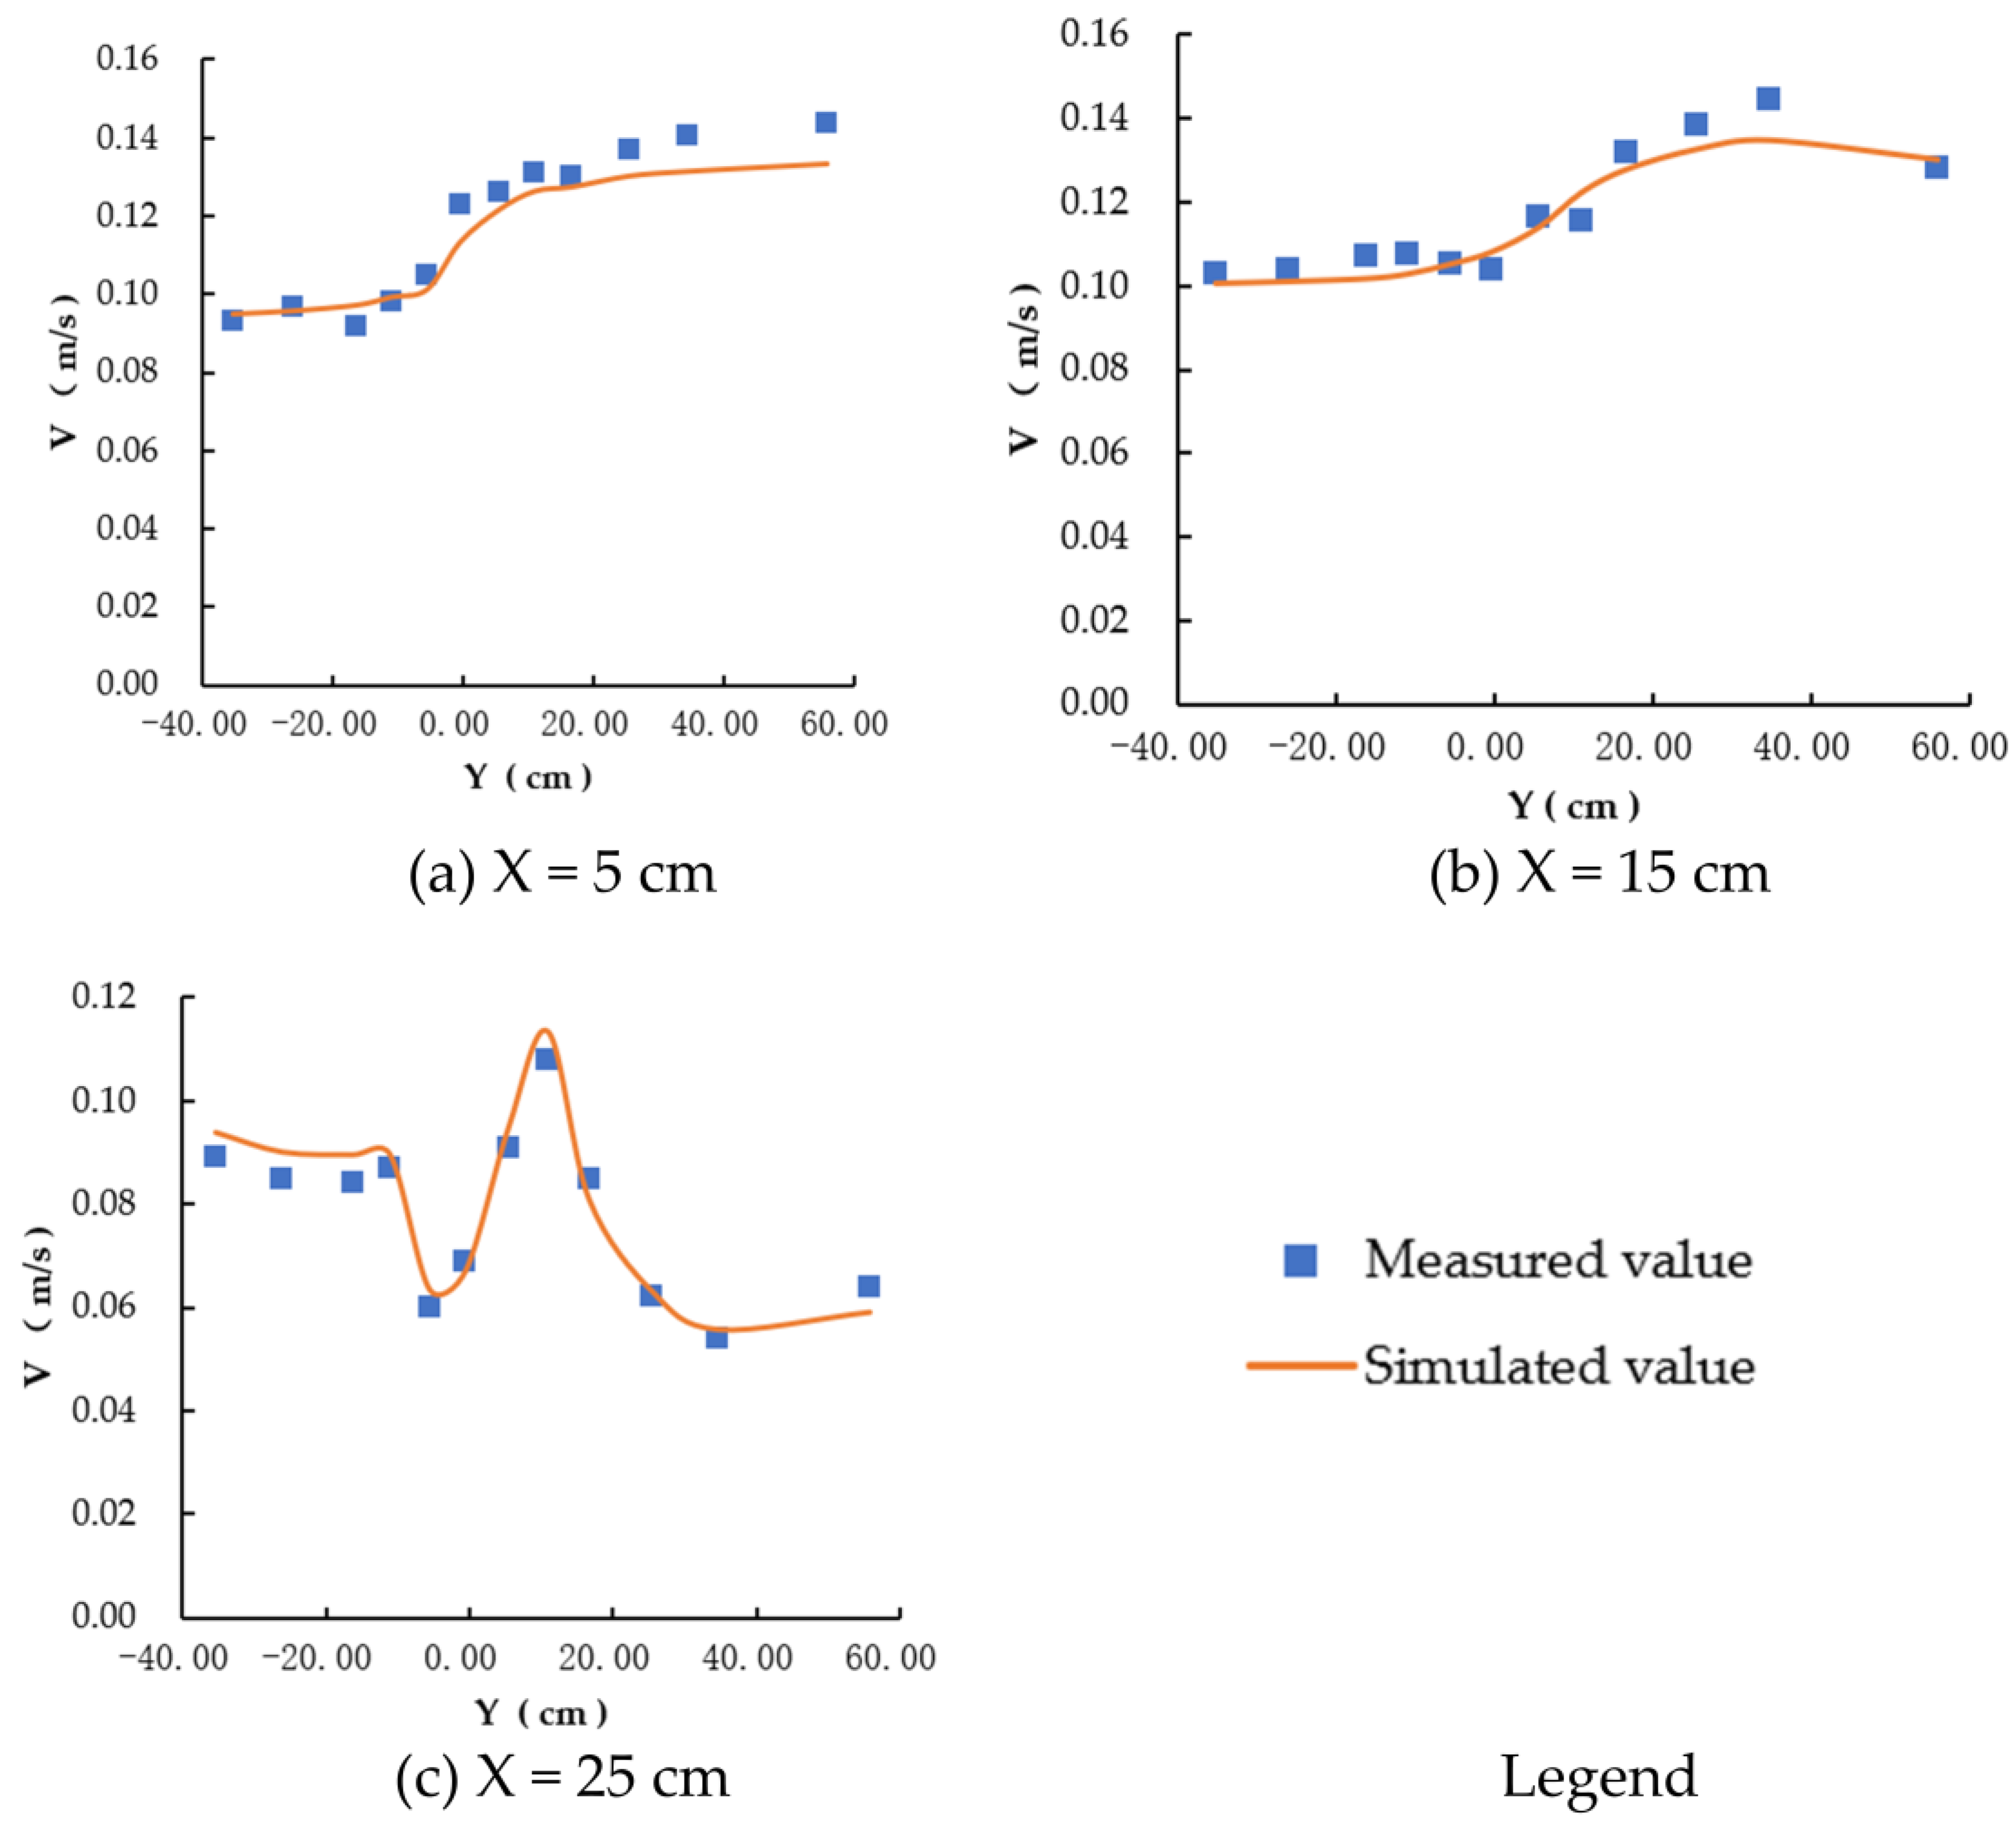
- The dependability of the numerical model is simulated and assessed. According to the verification findings, the flow rate and pollutant content in each section occur within tolerable limits. The numerical model may be used to explore the diffusion mechanism of contaminants in the asymmetric river junction region and to better capture hydrodynamic and water quality changes in the river intersection area.
- (2)
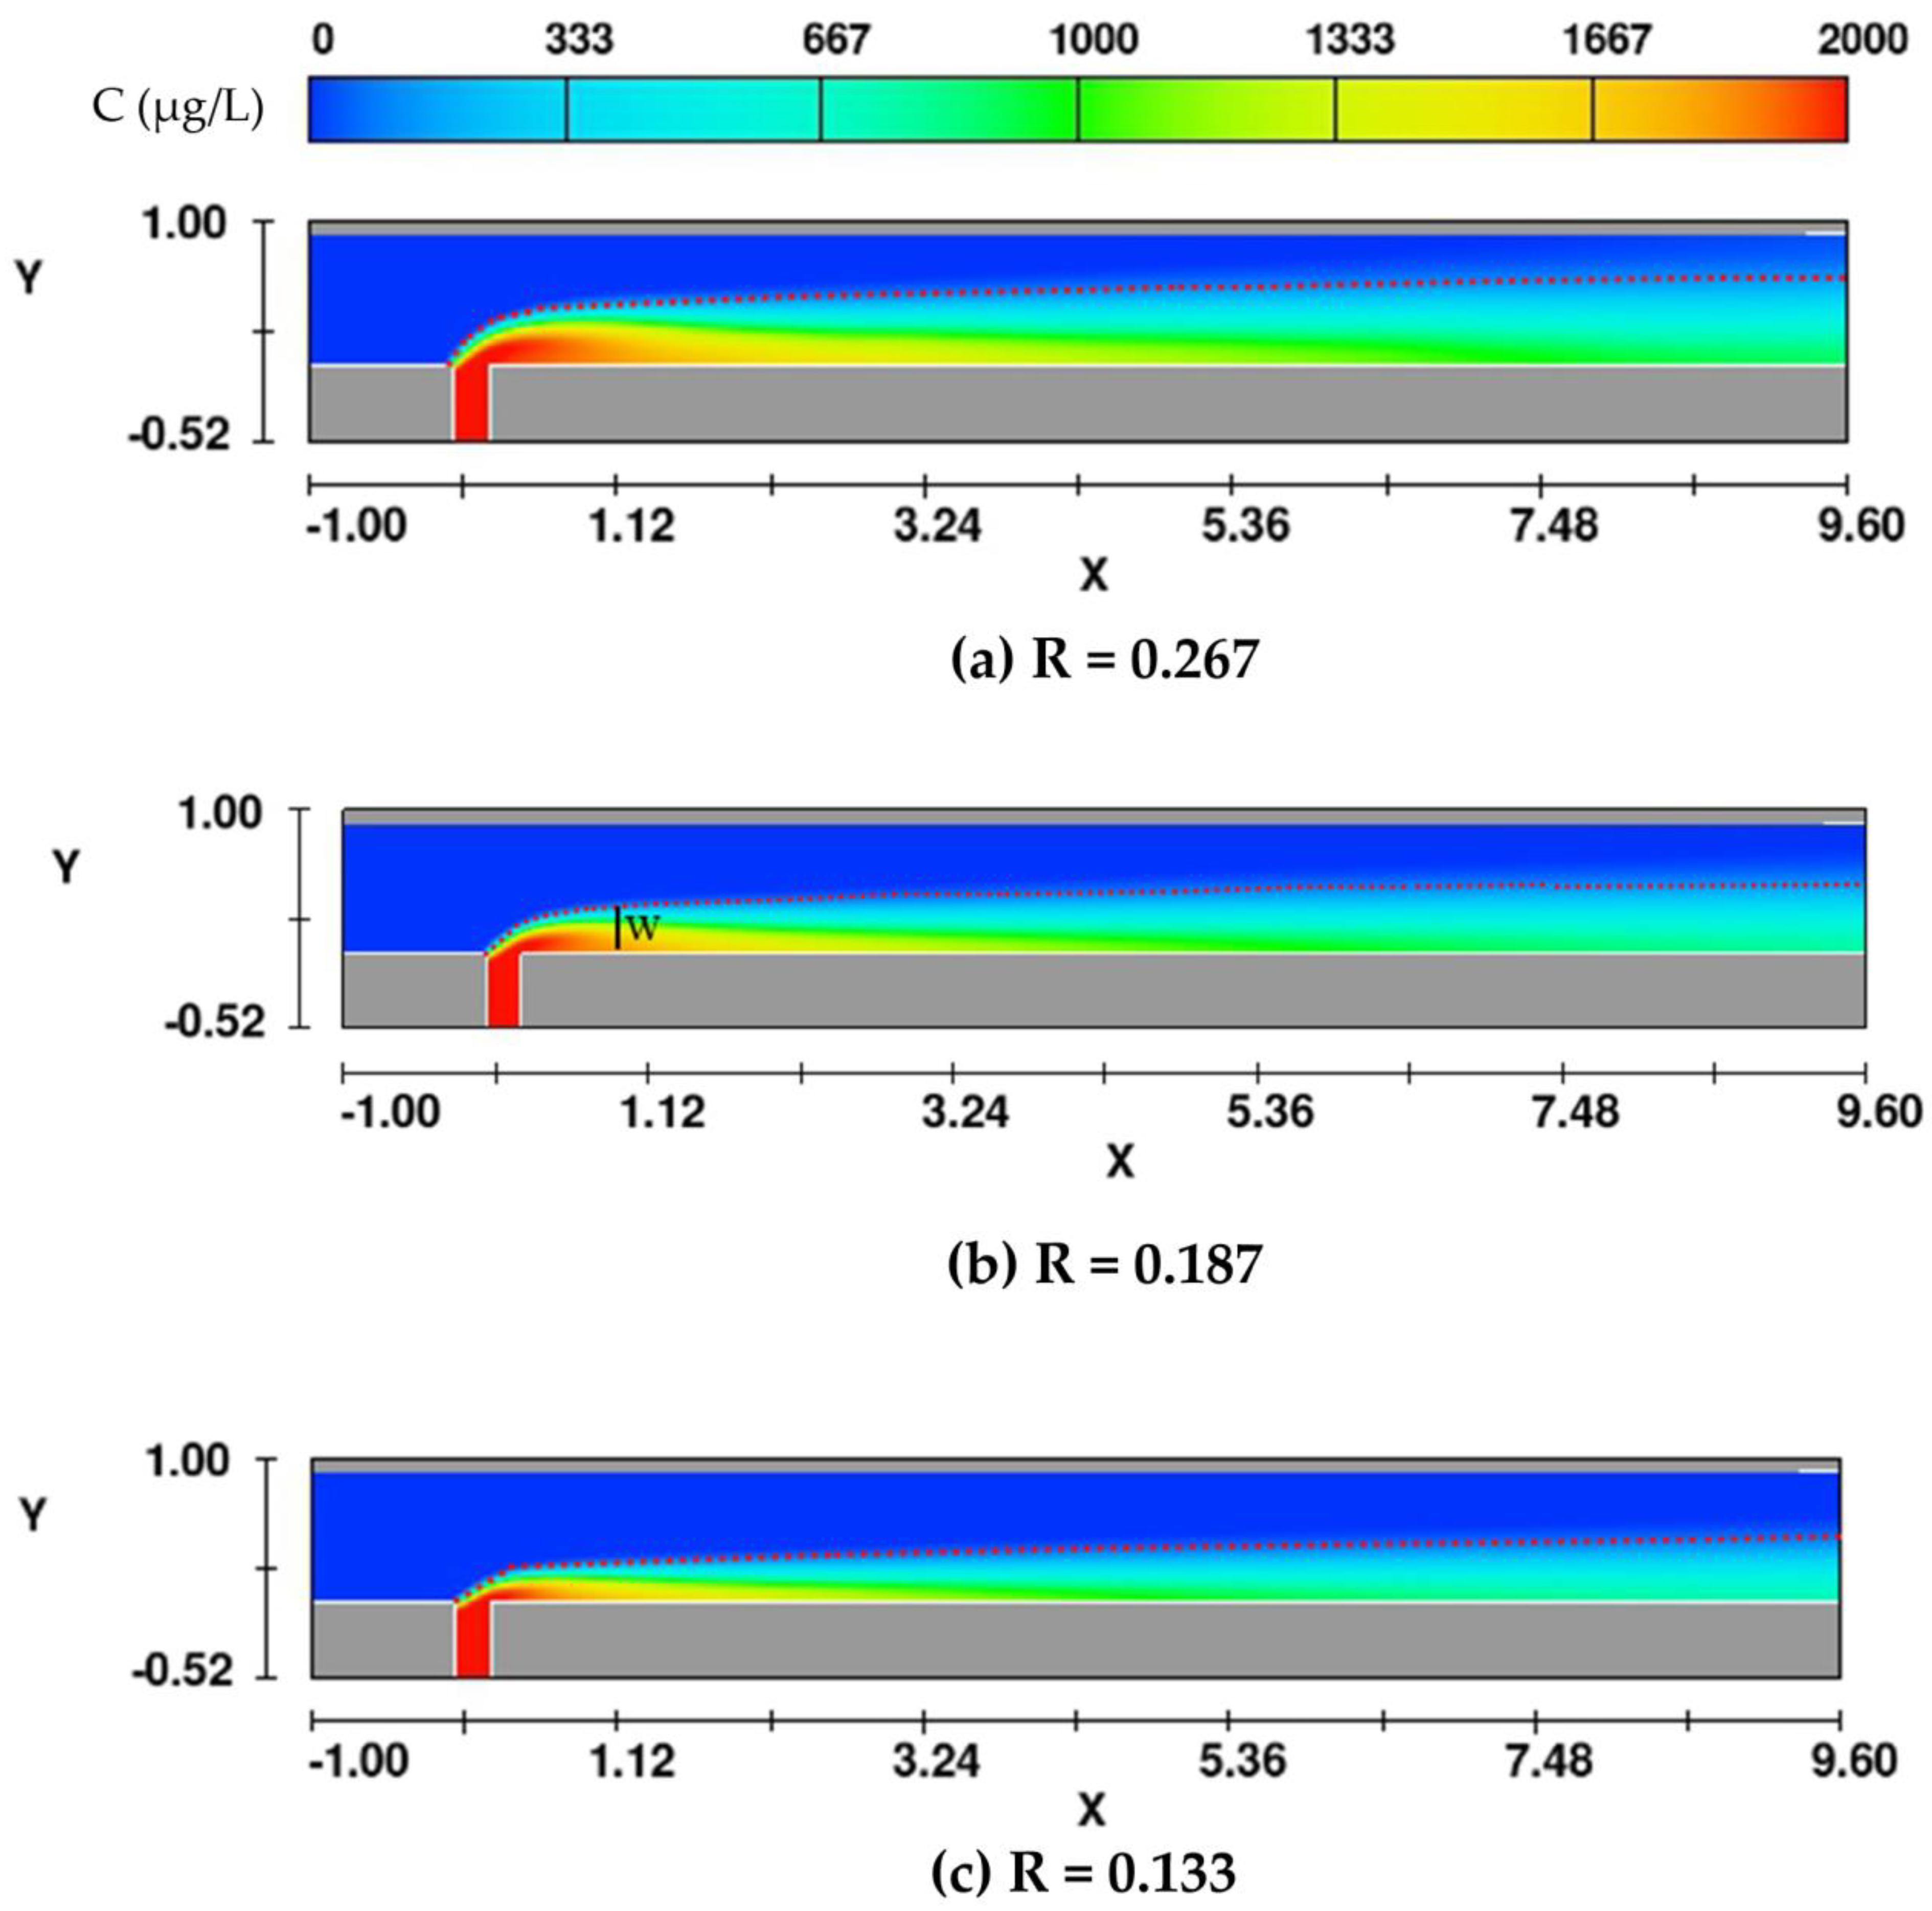
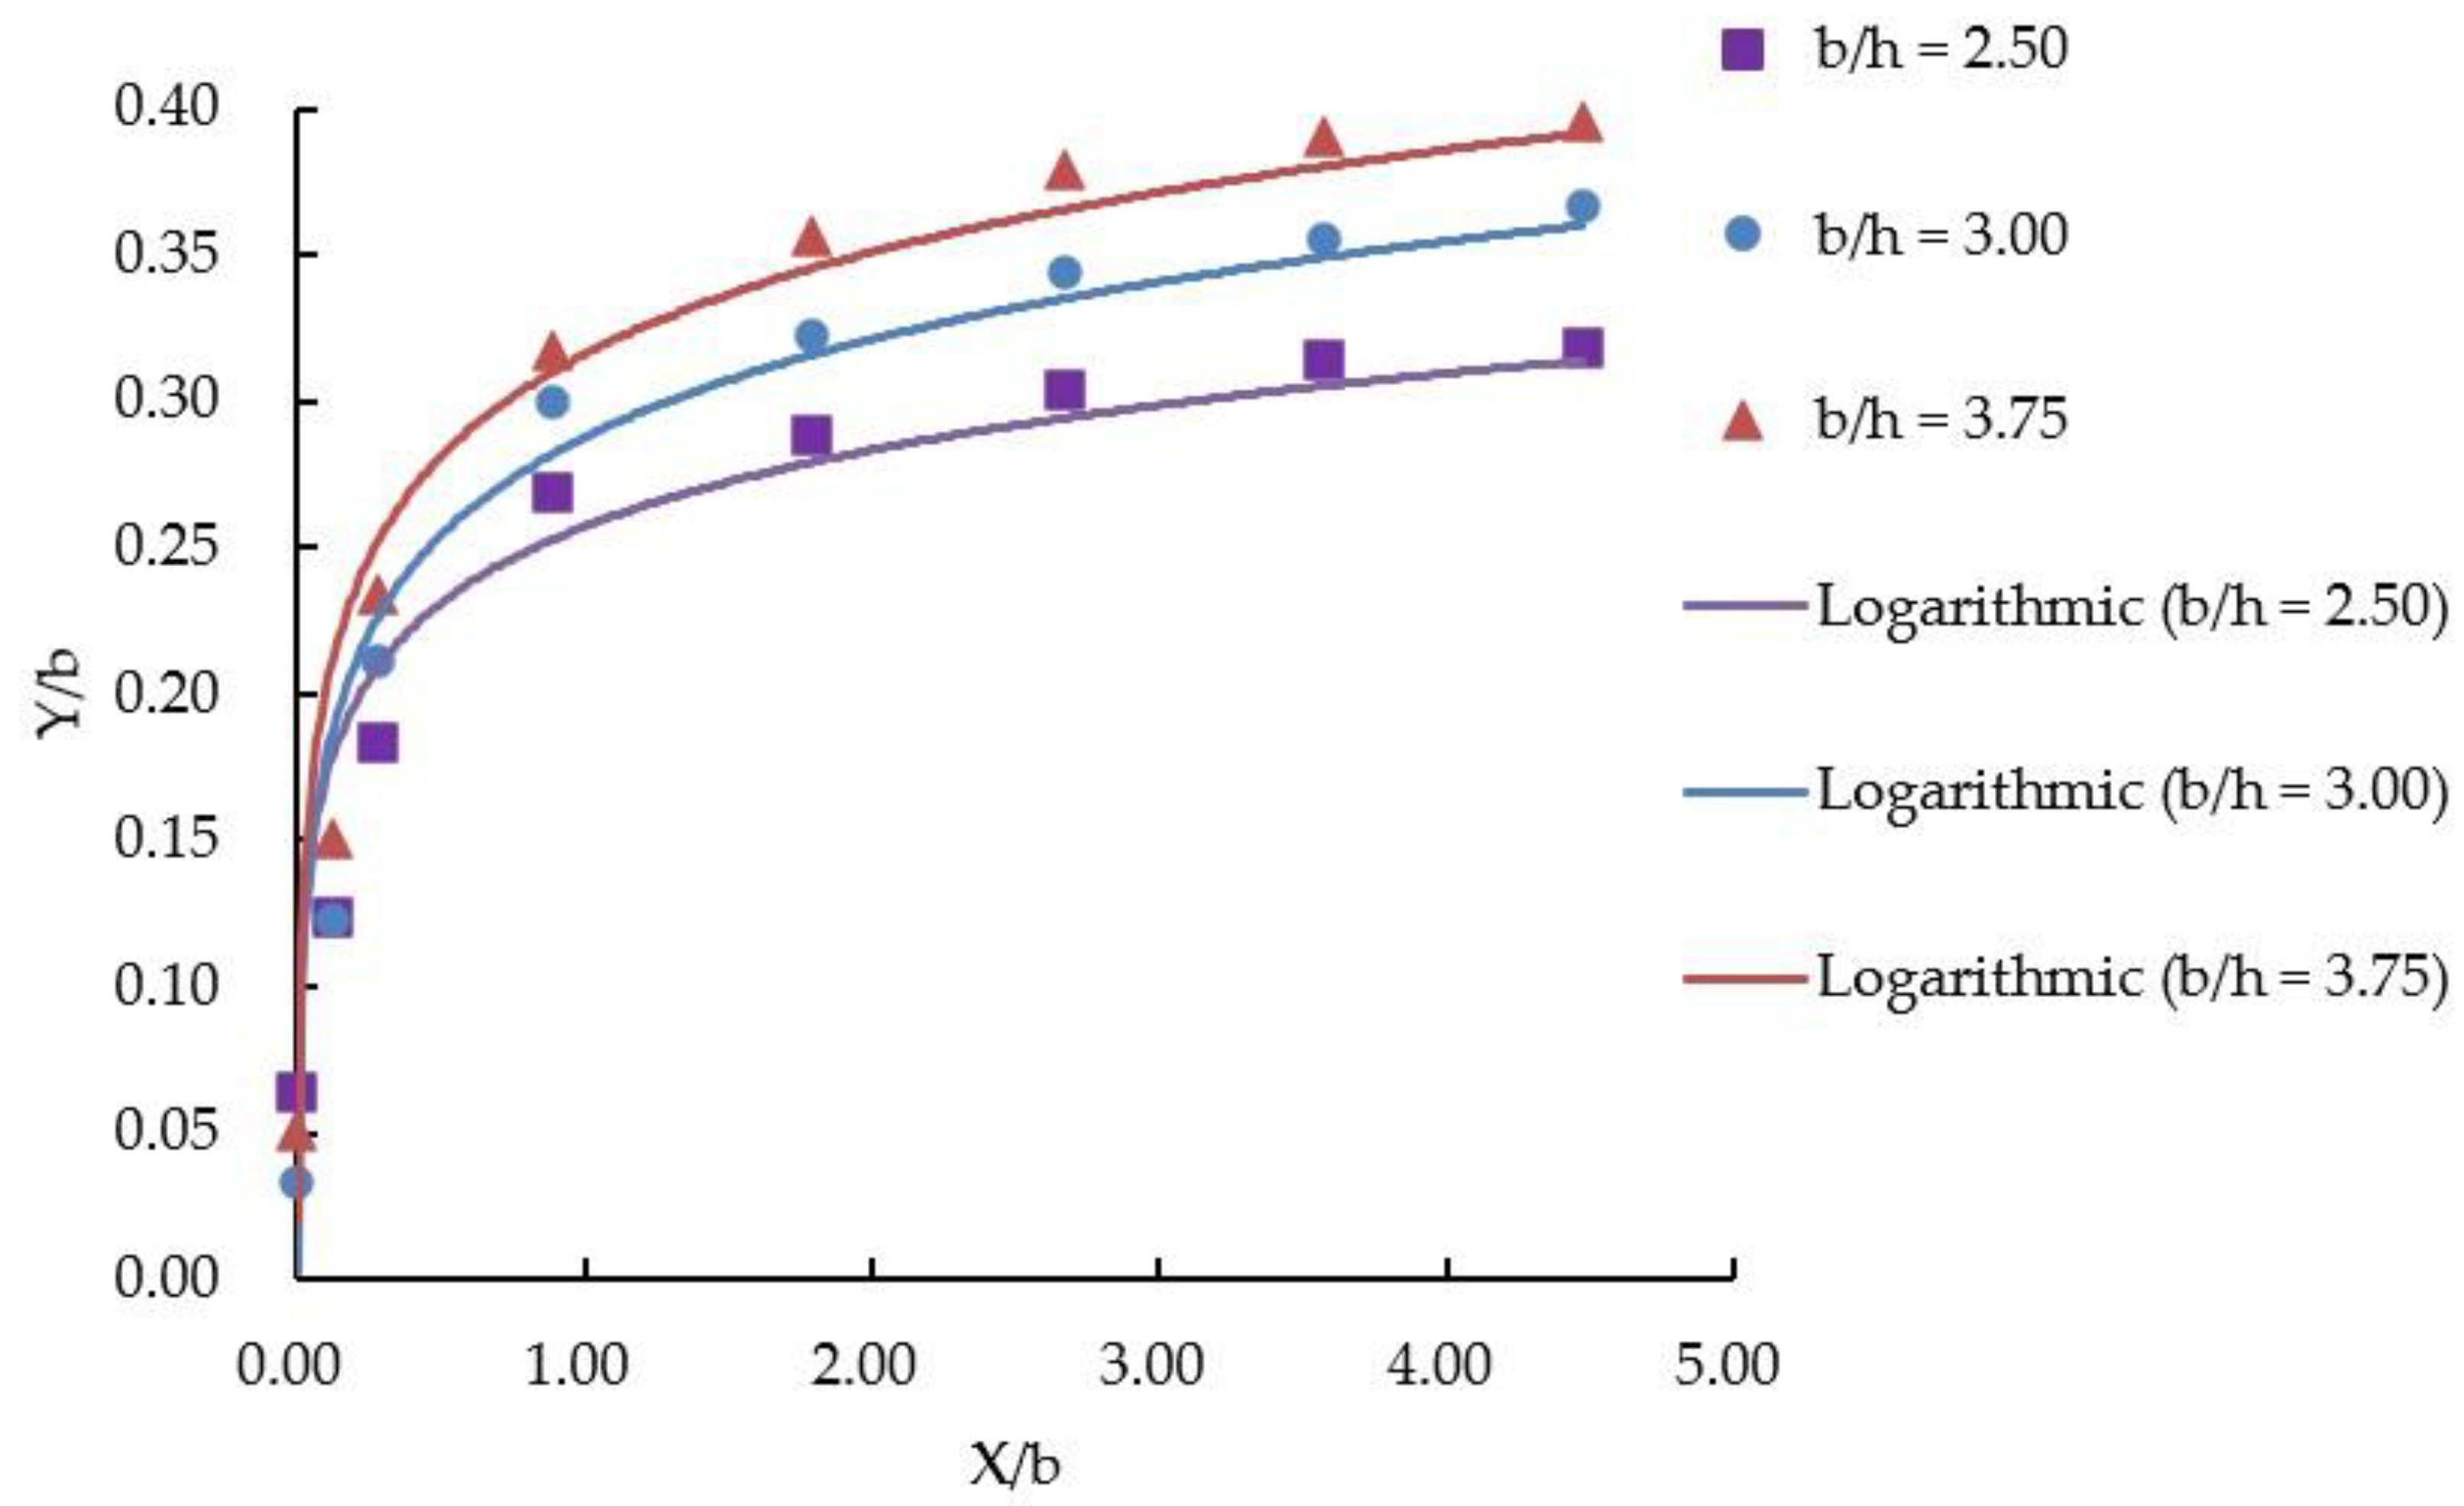
- The three-dimensional properties of the pollutant concentration distribution in the junction area are analyzed. The findings indicate that the discharge ratio and the aspect-to-width-depth ratio significantly impact the distribution of pollutants in the junction region. This is mostly manifested in the horizontal distribution of pollutants, the trajectory of the mixing interface, and the degree of mixing homogeneity. The horizontal diffusion range of pollutants increases with increasing discharge ratio and width-depth ratio, and the mixing homogeneity in each section increases. Pollutants in the bottom plane Z = 0.05 m are totally mixed in the downstream exit section for R = 0.267 and b/h = 3.75. In general, the trajectory line of the mixing interface of pollutants in the junction region exhibits a logarithmic growth tendency, and it progresses along the direction of water flow development. The mixing interface expands to the center axis point after progressively moving to the other side of the interchange.
- (3)
- The concentration difference affects the horizontal distribution and mixing degree of pollutants. The degree of influence, however, is not as high as that of the discharge ratio or width-depth ratio, with only a slight impact. However, the mixing interface trajectory line still exhibits a logarithmic development pattern, and with increasing concentration difference, the mixing interface slightly deviates to the opposite side of the interchange. Molecular diffusion due to concentration variations causes subtle changes in the mixing interface and inhomogeneity index. In summary, the concentration difference only affects the concentration in the pollution belt, but does not influence its width, length, or size.
Author Contributions
Funding
Data Availability Statement
Acknowledgments
Conflicts of Interest
References
- Wang, M.; Chen, X.; Lin, X.; Wang, P. Study on river channel characteristics of confluence of main and branch streams in the upper reaches of the Yangtze River. Hydro-Sci. Eng. 2014, 4, 58–64. (In Chinese) [Google Scholar] [CrossRef]
- Zhou, J. Three-Dimensional Numerical Simulation of Open Channel Confluence Flow. Master’s Thesis, Sun Yet-sen University, Guangzhou, China, 2010. (In Chinese). [Google Scholar]
- Best, J.L. Flow Dynamics at River Channel Confluences: Implications for Sediment Transport and Bed Morphology. In Recent Developments in Fluvial Sedimentology. Special Publication 39; Ethridge, F.G., Flores, R.M., Harvey, M.D., Eds.; Society of Economic Paleontologists and Mineralogists: Tulsa, OK, USA, 1987; pp. 27–35. [Google Scholar]
- Lan, B. The comprehensive analysis of the special property at the tributary junction of mountain river. J. Chongqing Jiaotong Inst. 1998, 17, 93–98. (In Chinese) [Google Scholar]
- Zhang, Q.; Wang, P.; Liu, Q. Reclassification of confluence forms of river branches and tributaries in mountainous areas. J. Chongqing Jiaotong Univ. Nat. Sci. Ed. 2010, 29, 458–460. (In Chinese) [Google Scholar]
- Mosley, M.P. An Experimental Study of Channel Confluences. J. Geol. 1976, 84, 535–562. [Google Scholar] [CrossRef]
- Liu, Z.; Liu, W.; Li, Z. Analysis of technical and economic significance of estuary management. Water Resour. Econ. 2007, 5, 64–67+78. (In Chinese) [Google Scholar]
- Riley, J.D.; Rhoads, B.L. Flow structure and channel morphology at a natural confluent meander bend. Geomorphology 2012, 163, 84–98. [Google Scholar] [CrossRef]
- Zhang, Y.F.; Wang, P.; Wu, B.S.; Hou, S.Z. An experimental study of fluvial processes at asymmetrical river confluences with hyperconcentrated tributary tributary flows. Geomorphology 2015, 230, 26–36. [Google Scholar] [CrossRef]
- Gao, Y.; Ye, L.; Wang, Y.; Xu, Z.; Wang, X. Three-dimensional numerical simulation of flow in the confluence of Shenxigou and Baisha River. Adv. Eng. Sci. 2020, 52, 78–85. (In Chinese) [Google Scholar] [CrossRef]
- Lv, M.; Zhu, X.; Wang, T.; Zhang, Y. Study on drainage drainage pollutant reduction based on TMDL concept. J. North China Univ. Water Resour. Electr. Power Nat. Sci. Ed. 2020, 41, 18–23. (In Chinese) [Google Scholar]
- Gillibrand, P.A.; Balls, P.W. Modelling salt intrusion and nitrate concentrations in the Ythan Estuary. Estuar. Coast. Shelf Sci. 1998, 47, 695–706. [Google Scholar] [CrossRef]
- Biron, P.M.; Ramamurthy, A.S.; Han, S. Three-dimensional numerical modeling of mixing at river confluences. J. Hydraul. Eng. 2004, 130, 243–253. [Google Scholar] [CrossRef]
- Isabel, C.A.; Adriano, A.B.; Pedro, M.D. Influence of river discharge patterns on the hydrodynamics and potential contaminant dispersion in the Douro estuary. Water Res. 2010, 44, 3133–3146. [Google Scholar] [CrossRef]
- Liu, X.-L. Numerical Simulation of Flow Field and Water Quality of Two Rivers Confluence in Chongqing. Master’s Thesis, Chongqing University, Chongqing, China, 2005. (In Chinese). [Google Scholar]
- Mao, Z.; Zhao, S.; Zhang, L. Experimental study on 3D flow characteristics at the confluence of open channel. J. Hydraul. Eng. 2004, 35, 1–7. (In Chinese) [Google Scholar]
- Mao, Z.; Zhao, S.; Luo, S.; Zhang, L. Study on separation zone in open channel junction. Adv. Water Sci. 2005, 16, 7–12. (In Chinese) [Google Scholar]
- Wei, J.; Li, R.; Kang, P.; Liu, S. Transport and diffusion characteristics of pollutants in water flow confluence area. Adv. Water Sci. 2012, 23, 822–828. (In Chinese) [Google Scholar] [CrossRef]
- Gu, L.; Zhao, X.; Dai, B.; Wu, J.; Chu, K. Influence of confluence ratio on dispersion coefficient of pollutants in U-shaped curved intersection river. J. Hohai Univ. Nat. Sci. Ed. 2018, 46, 189–195. (In Chinese) [Google Scholar]
- Yuan, S.; Tang, H.; Xiao, Y.; Qiu, X.; Zhang, H.; Yu, D. Turbulent flow structure at a 90-degree open channel confluence: Accounting for the distortion of the shear layer. J. Hydro-Environ. Res. 2016, 12, 130–147. [Google Scholar] [CrossRef]
- Wu, Z. Numerical Simulation of Hydraulic Characteristics of Jialing River Interchange of Yangtze River. Master’s Thesis, Chongqing Jiaotong University, Chongqing, China, 2012. (In Chinese). [Google Scholar]
- Wang, X. A review of research on force characteristics of sink drooling water. China Rural. Water Resour. Hydropower 2007, 10, 82–86. (In Chinese) [Google Scholar]
- Xu, H.; Qu, K. Numerical Calculation and Analysis of solid-liquid two-phase flow in a two-channel pump. J. Guangxi Univ. Nat. Sci. Ed. 2010, 35, 249–253. (In Chinese) [Google Scholar] [CrossRef]
- Feng, Z.; Liu, P.; He, R. Effect of section shape on turbulent flow and field coordination in spiral channel. J. Guangxi Univ. Nat. Sci. Ed. 2016, 41, 1960–1967. (In Chinese) [Google Scholar] [CrossRef]
- Yang, P.; Cai, D.-S.; Mo, C. Research on Hydraulic characteristics of vertical slit fishway based on FLOW-3D. J. Guangxi Univ. Nat. Sci. Ed. 2018, 43, 1675–1683. (In Chinese) [Google Scholar] [CrossRef]
- Zhang, J.; Zhan, J.; Gong, Y. Large eddy simulation of aeration process of sliding flow in stepped spillway dam. J. Guangxi Univ. Nat. Sci. Ed. 2017, 42, 1572–1580. (In Chinese) [Google Scholar] [CrossRef]
- Zhang, T. Study on Flow Structure and Pollutant Transport Law in Asymmetric River Confluence Area. Ph.D. Thesis, Xi’an Industry University, Xi’an, China, 2021. (In Chinese) [Google Scholar] [CrossRef]
- Chen, K.; Feng, M.; Zhang, T.; Teng, S. Study on distribution law of pollutant concentration field in open channel intersection area. J. Hydropower 2019, 38, 86–100. (In Chinese) [Google Scholar]
- Chen, K. Experimental Study on Hydrodynamic Characteristics and Pollutant Concentration Field in Open Channel Intersection Area. Master’s Thesis, Xi’an University of Technology, Xi’an, China, 2019. (In Chinese). [Google Scholar]
- Tan, M.I.; Jian, Y.A.O. Simulation of pollutant diffusion in Y-shaped river confluence area. Environ. Sci. Technol. 2020, 43, 9–16. (In Chinese) [Google Scholar] [CrossRef]
- Zhao, Z. Study on Dynamic Characteristics and Water Quality Variation of City Artificial Lake Water -Taking Yanming Lake as an example. Master’s Thesis, Xi’an University of Technology, Xi’an, China, 2018. (In Chinese). [Google Scholar]
- Hua, Z. Environmental Hydraulics; Science Press: Beijing, China, 2020. (In Chinese) [Google Scholar]
- Quinn, W.L.; Bruce, L. Rhoads. Rates and patterns of thermal mixing at a small stream confluence under variable incoming flow conditions. Hydrol. Process. 2015, 29, 4442–4456. [Google Scholar]
- Teng, S. Study on Transport and Diffusion Characteristics of Transversal Jet Pollutants in Vegetation Open Channels. Ph.D. Thesis, Xi’an University of Technology, Xi’an, China, 2019. (In Chinese). [Google Scholar]
- Kamotani, Y.; Greber, I. Experiments on a Turbulent Jet in a Cross Flow. AIAA J. 1972, 10, 1425–1429. [Google Scholar] [CrossRef]
- Gaudet, J.M.; Roy, A.G. Effect of bed morphology on flow mixing length at river confluences. Nature 1995, 373, 138–139. [Google Scholar] [CrossRef]
- Wei, W.; Shao, S.-P.; Liu, Y.-L. Large eddy Simulation of three-dimensional hydraulic characteristics of open channel interchanges at different intersection angles. Chin. J. Appl. Mech. 2015, 32, 57–63+172. (In Chinese) [Google Scholar]
- Pascale, B.; Antoine, R.; Alistair, K.; Roy, A.G.; Han, S.S. Spatial patterns of water surface topography at a river confluence. Earth Surf. Process. Landf. 2002, 27, 913–928. [Google Scholar] [CrossRef]
- Claudine, B.; Andre, G.R.; James, L.B. Dynamic of a river channel confluence with discordant beds: Flow turbulence, bed load sediment transport, and bed morphology. J. Geophys. Res. Earth Surf. 2006, 111, 1–22. [Google Scholar] [CrossRef]
- Bruce, L.R.; Alexander, N.S. Field investigation of three-dimensional flow structure at stream confluences: 1. Thermal mixing and time-averaged velocities. Water Resour. Res. 2001, 37, 2392–2410. [Google Scholar] [CrossRef]
- Bruce, L.R.; Stephen, T.K. Time-averaged flow structure in the central region of a stream confluence. Earth Surf. Process. Landf. 1998, 23, 171–191. [Google Scholar] [CrossRef]
- James, L.B. Sediment transport and bed morphology at river channel confluences. Sedimentology 1988, 35, 481–498. [Google Scholar] [CrossRef]
- Alexander, N.S.; Bruce, L.R. Field investigation of three-dimensional flow structure at stream confluences: 2. Turbulence. Water Resour. Res. 2001, 37, 2411–2424. [Google Scholar] [CrossRef]
- Shabayek, S.; Steffler, P.; Hicks, F.E. Dynamic Model for Subcritical Combining Flows in Channel Junctions. J. Hydraul. Eng. 2002, 128, 821–828. [Google Scholar] [CrossRef]
- Signell, R.P.; Jenter, H.L.; Blumberg, A.F. Predicting the Physical Effects of Relocating Boston’s Sewage Outfall. Estuar. Coast. Shelf Sci. 1999, 50, 59–71. [Google Scholar] [CrossRef]
- Ng, S.M.Y.; Wai, O.W.H.; Li, Y.S.; Jiang, Y. Integration of Agis and a complex three-dimensional hydrodynamic, sediment and heavy metal transport numerical model. Adv. Eng. Softw. 2009, 40, 391–401. [Google Scholar] [CrossRef]
- Xing, Y.; Ai, C.; Jin, S. A three-dimensional hydrodynamic and salinity transport model of estuarine circulation with an application to a macrotidal estuary. Appl. Ocean. Res. 2013, 39, 53–71. [Google Scholar] [CrossRef]
- Yang, Z.; Mi, T.; Yao, J.; Zhang, T. Rivers confluence area pollutant diffusion numerical simulation study. J. North China Univ. Water Hydropower Nat. Sci. Ed. 2021, 42, 86–92. (In Chinese) [Google Scholar] [CrossRef]
- Lu, W.; Zhou, X. Theoretical study on horizontal diffusion of soluble pollutants in river channels. J. Yangzhou Univ. Nat. Sci. Ed. 2012, 15, 79–82. (In Chinese) [Google Scholar] [CrossRef]
- Yuan, H. Study on Pollutant Mixing Law and Transverse Coefficient Distribution of Inclined Branch Confluence River. Master’s Thesis, Hohai University, Nanjing, China, 2016. (In Chinese). [Google Scholar]
- Hua, Z.L.; Wei, J.; Shan, N.N.; Wu, W. Pollutant mixing and transport process via diverse transverse release positions in a multi-anabranch river with three braid bars. Water Sci. Eng. 2013, 6, 250–261. [Google Scholar] [CrossRef]
- Wu, D.; Yan, Y.; Li, R. Simulation of pollutant migration trajectory at Xuliujing control node. J. Oceanogr. Chin. Ed. 2009, 31, 158–166. (In Chinese) [Google Scholar]






| NS Value | Result Evaluation |
|---|---|
| NSE < 0 | Measured values outperform the simulated values |
| 0.5 < NSE < 0.65 | Acceptable value |
| 0.65 < NSE < 0.75 | Improved simulation results |
| NSE > 0.75 | Excellent simulation results |
| NSE = 1 | Perfect match between the simulated and measured values |
| Variables | Cross-Section | MRE (%) | NSE |
|---|---|---|---|
| Velocity of flow (m/s) | X = 5 cm | 4.13 | 0.899 |
| X = 15 cm | 3.20 | 0.998 | |
| X = 25 cm | 3.37 | 0.934 | |
| Concentration of pollutant (μg/L) | Y = 11 cm | 4.49 | 0.992 |
| Y = 32 cm | 4.95 | 0.983 | |
| Y = 53 cm | 4.68 | 0.962 | |
| Y = 74 cm | 3.16 | 0.959 | |
| Y = 116 cm | 4.84 | 0.975 |
| Working Conditions | Number | Investigation Factors | Mainstream Flow Q1(m3/h) | Discharge Ratio R | Water Depth h(m) | Width-Depth Ratio b/h | Concentration of Tributary C2 (μg/L) | Concentration Difference Cg (μg/L) |
|---|---|---|---|---|---|---|---|---|
| 1 | 1(a) | Discharge ratio | 136.08 | 0.267 | 0.3 | 3 | 2000 | 2000 |
| 1(b) | 194.40 | 0.187 | 0.3 | 3 | 2000 | 2000 | ||
| 1(c) | 272.16 | 0.133 | 0.3 | 3 | 2000 | 2000 | ||
| 2 | 2(a) | Width-depth ratio | 194.40 | 0.187 | 0.24 | 3.75 | 2000 | 2000 |
| 2(b) | 194.40 | 0.187 | 0.3 | 3 | 2000 | 2000 | ||
| 2(c) | 194.40 | 0.187 | 0.36 | 2.5 | 2000 | 2000 | ||
| 3 | 3(a) | Concentration difference | 194.40 | 0.187 | 0.3 | 3 | 500 | 500 |
| 3(b) | 194.40 | 0.187 | 0.3 | 3 | 1000 | 1000 | ||
| 3(c) | 194.40 | 0.187 | 0.3 | 3 | 2000 | 2000 |
| Number | Pollutant Concentration Distribution Area (m2) | Proportion of the Intersection Area (%) |
|---|---|---|
| 1(a) | 5.25 | 60.77% |
| 1(b) | 3.90 | 45.16% |
| 1(c) | 2.97 | 34.34% |
| 2(a) | 5.08 | 58.82% |
| 2(b) | 3.90 | 45.16% |
| 2(c) | 3.65 | 42.27% |
| 3(a) | 3.77 | 43.68% |
| 3(b) | 3.86 | 44.66% |
| 3(c) | 3.90 | 45.16% |
| Number | Investigation Factors | Mainstream Flow Q1 (m3/h) | Concentration of Mainstream C1 (μg/L) | Tributary Flow Q2 (m3/h) | Concentration of Tributary C2 (μg/L) | Average Concentration Cp (μg/L) |
|---|---|---|---|---|---|---|
| 1(a) | R = 0.267 | 136.08 | 0 | 36.29 | 2000 | 421.05 |
| 1(b) | R = 0.187 | 194.40 | 0 | 36.29 | 2000 | 314.61 |
| 1(c) | R = 0.133 | 272.16 | 0 | 36.29 | 2000 | 235.29 |
| 2(a) | b/h = 3.75 | 194.40 | 0 | 36.29 | 2000 | 314.61 |
| 2(b) | b/h = 3.00 | 194.40 | 0 | 36.29 | 2000 | 314.61 |
| 2(c) | b/h = 2.50 | 194.40 | 0 | 36.29 | 2000 | 314.61 |
| 3(a) | Cg = 500 | 194.40 | 0 | 36.29 | 2000 | 78.65 |
| 3(b) | Cg = 1000 | 194.40 | 0 | 36.29 | 2000 | 157.30 |
| 3(c) | Cg = 2000 | 194.40 | 0 | 36.29 | 2000 | 314.61 |
Disclaimer/Publisher’s Note: The statements, opinions and data contained in all publications are solely those of the individual author(s) and contributor(s) and not of MDPI and/or the editor(s). MDPI and/or the editor(s) disclaim responsibility for any injury to people or property resulting from any ideas, methods, instructions or products referred to in the content. |
© 2023 by the authors. Licensee MDPI, Basel, Switzerland. This article is an open access article distributed under the terms and conditions of the Creative Commons Attribution (CC BY) license (https://creativecommons.org/licenses/by/4.0/).
Share and Cite
Wang, X.; Yang, J.; Wang, F.; Xu, N.; Li, P.; Wang, A. Numerical Modeling of the Dispersion Characteristics of Pollutants in the Confluence Area of an Asymmetrical River. Water 2023, 15, 3766. https://doi.org/10.3390/w15213766
Wang X, Yang J, Wang F, Xu N, Li P, Wang A. Numerical Modeling of the Dispersion Characteristics of Pollutants in the Confluence Area of an Asymmetrical River. Water. 2023; 15(21):3766. https://doi.org/10.3390/w15213766
Chicago/Turabian StyleWang, Xu, Jiening Yang, Fan Wang, Na Xu, Peixuan Li, and Ai Wang. 2023. "Numerical Modeling of the Dispersion Characteristics of Pollutants in the Confluence Area of an Asymmetrical River" Water 15, no. 21: 3766. https://doi.org/10.3390/w15213766
APA StyleWang, X., Yang, J., Wang, F., Xu, N., Li, P., & Wang, A. (2023). Numerical Modeling of the Dispersion Characteristics of Pollutants in the Confluence Area of an Asymmetrical River. Water, 15(21), 3766. https://doi.org/10.3390/w15213766


