2.1. Background and Analytical Framework
Decision makers in the industrial sector typically aim to achieve optimal outputs and minimize inputs while utilizing water resources and emissions of wastewater. Consequently, evaluating water systems’ efficiency in industrial production necessitates considering minimizing inputs and maximizing outputs. Generating economic benefits within the industrial sector involves utilizing water resources and releasing pollutants. It is necessary to decrease the discharge of pollutants, which may potentially result in a reduction in economic outputs or the incorporation of additional input elements [
37]. Environmental regulations refer to the governmental implementations of environmental standards and other mechanisms to address the adverse effects of industrial production and water usage practices, such as negative externalities and market imperfections [
38]. Its objective is to transform the discharge of industrial wastewater and the impact on water environments from being merely guided by “soft constraints” to being strictly enforced as “hard constraints”. In the context of industrial production, implementing rigorous and suitable regulations can effectively steer technical advancements and perhaps improve the economic performance of firms. Consequently, it becomes imperative to incorporate environmental regulatory components into water pollution management to explore their impact in greater detail.
According to Bian [
39] and Wang et al. [
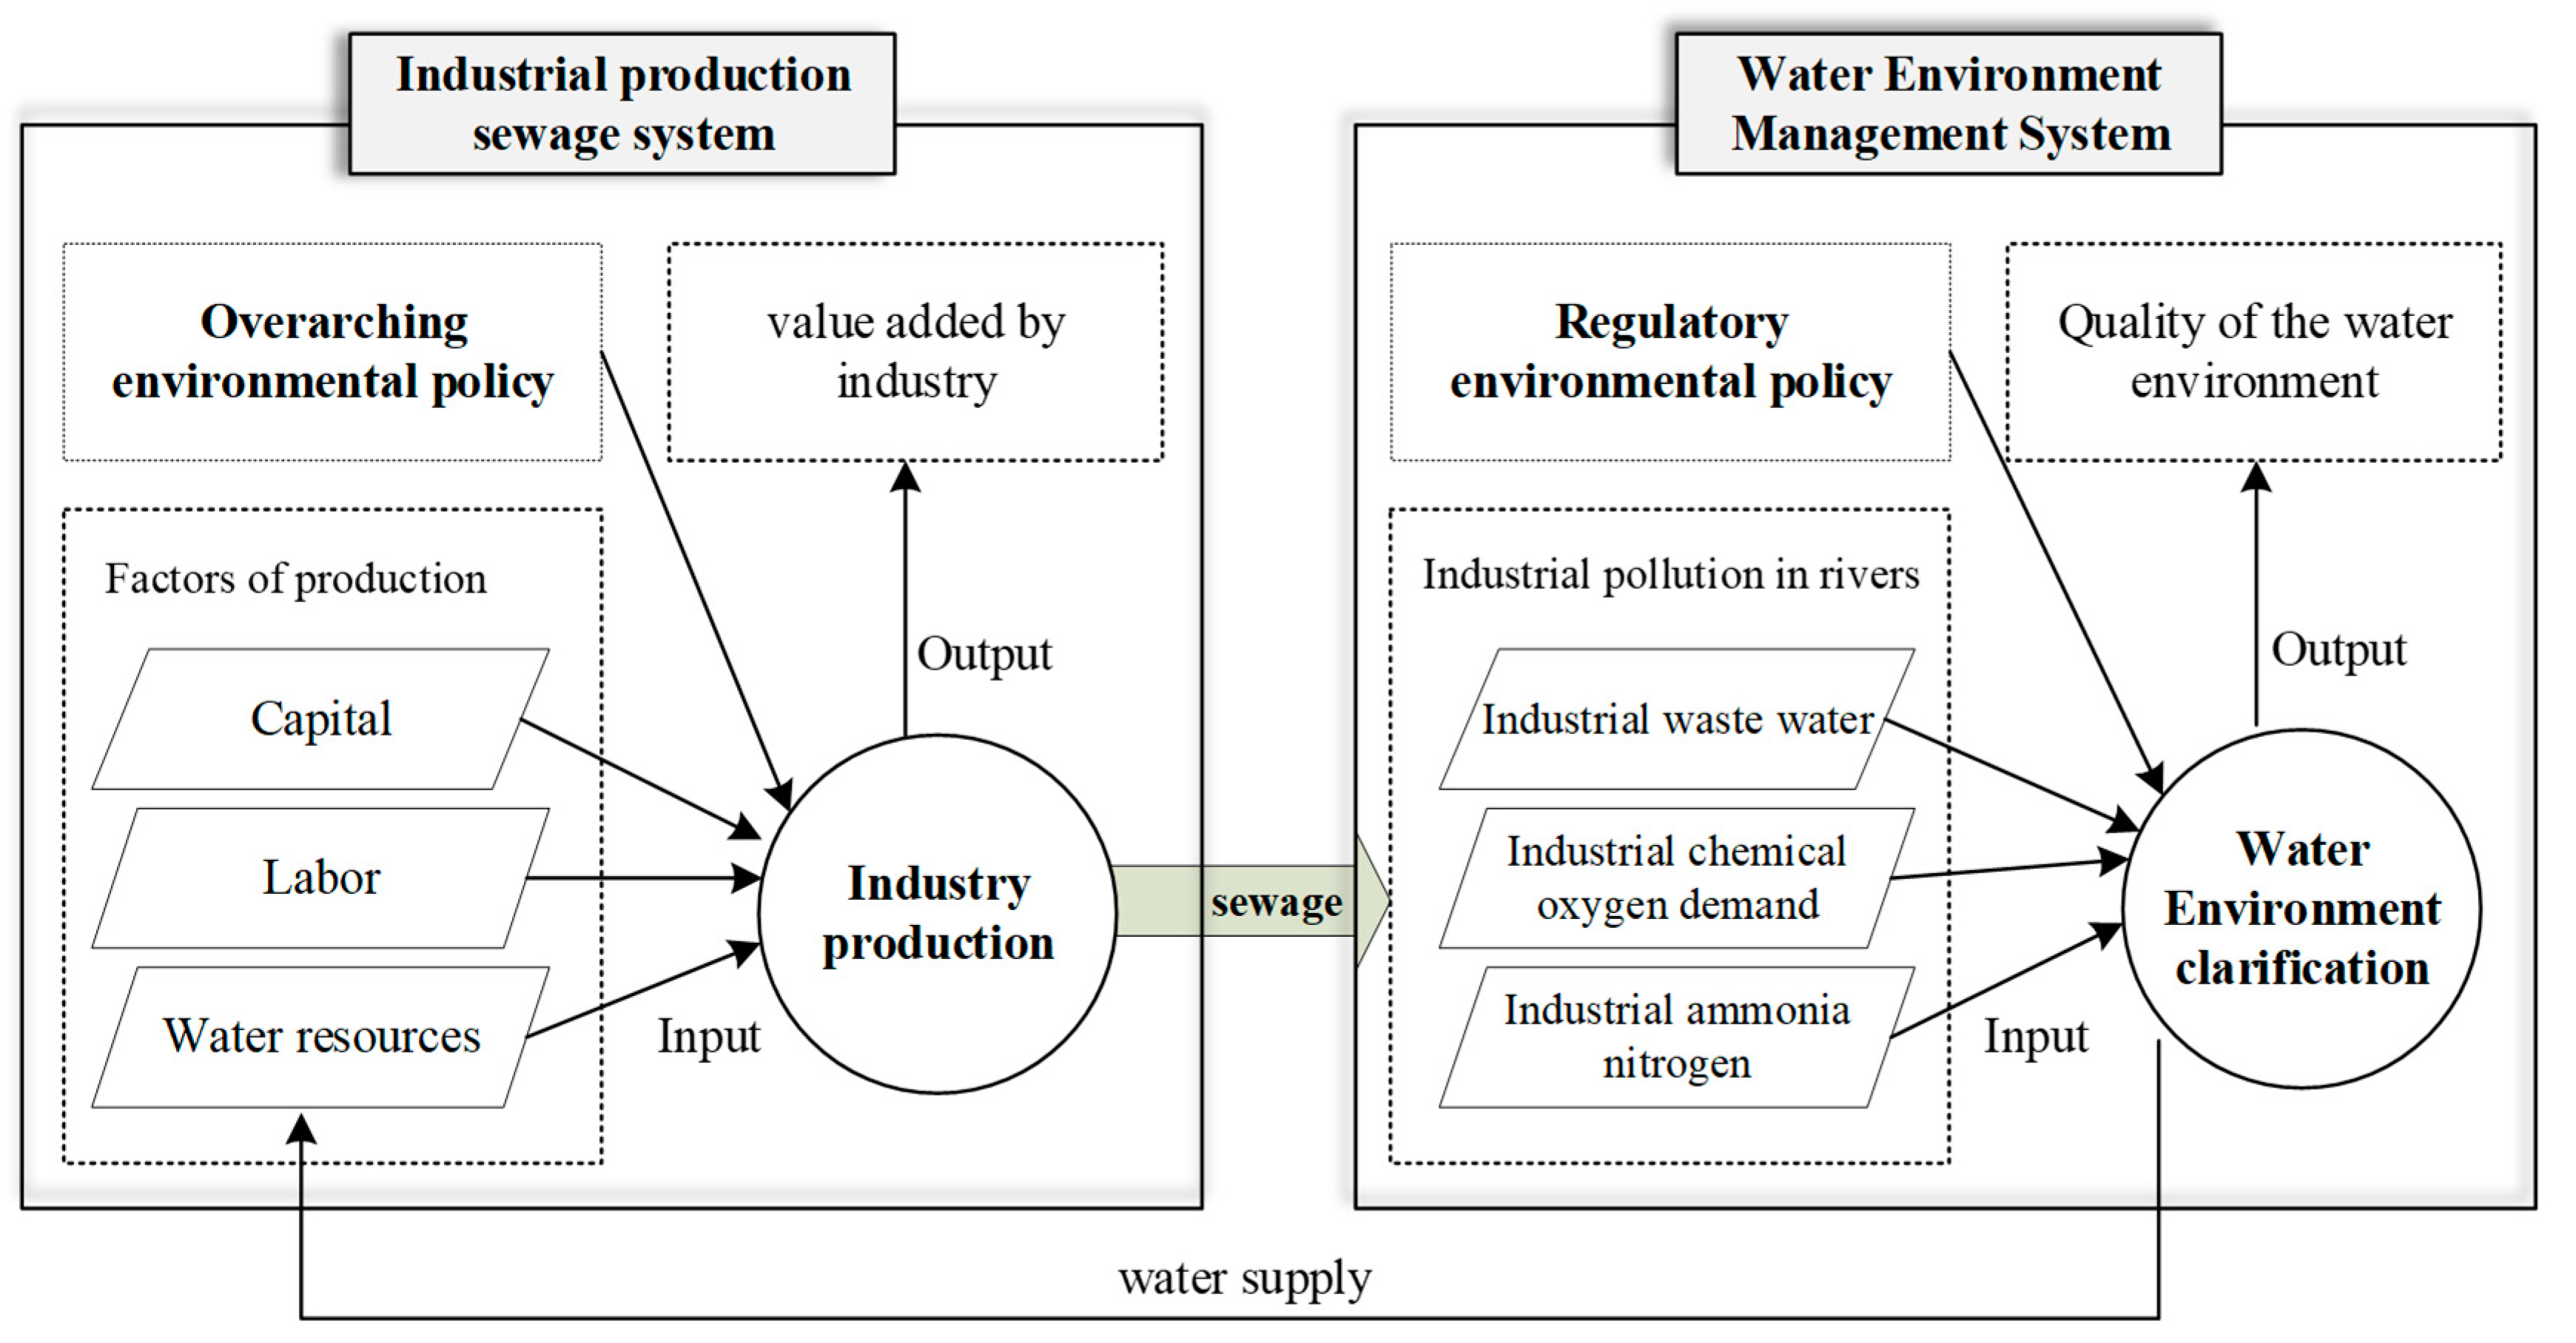
40], the industrial production system can be categorized into two subsystems: (pollutant) production and pollutant governance. These two subsystems engage in a game-like interaction, and the researchers have put forth a two-stage water recycling efficiency evaluation method grounded in addressing pollutant governance characteristics. From an environmental governance standpoint, conducting a comprehensive study on the systematic evaluation of the governance efficiency of water pollution in industrial production is valuable. This evaluation should be approached rationally, considering the execution of environmental regulations and procedures. Hence, by integrating factors such as the treatability of pollutants and the consideration of environmental regulations, the water pollution system in the industrial sector is divided into two subsystems: the industrial production sewage system and the water environmental governance system. The diagram in
Figure 1 illustrates these two subsystems’ fundamental structure and elemental flow status. One of the critical areas of focus is regulating industrial production sewage systems. This pertains to the policies implemented to control the overall volume of industrial pollution released during production. Such regulations effectively limit the intensity of sewage discharge and can even reduce emissions. The water environment governance system is influenced by a different type of environmental regulation known as control type. This regulation corresponds to the governance process that occurs after the pollution is discharged, and it encompasses two main components: the governance of water pollutants that have been discharged and the monitoring of the water environment system. This particular form of environmental regulation pertains to the process of post-discharge governance, which encompasses the governance of contaminants in discharged water and the monitoring of the water environment system. These measures collectively aim to enhance the quality of the water environment.
Industrial wastewater is a significant contributor to water pollution in basin ecosystems, characterized by high volume discharges, extensive spatial distribution, diverse chemical compositions, and inherent challenges in purification processes. The movement of water pollutants across river basins is closely associated with the migratory patterns of industrial companies, which can be broadly categorized into two modes: overall transfer and local transfer. Regardless of the specific type of migration, it is commonly seen that such movements result in incremental transfer, wherein new investments in the region and the subsequent establishment of production capacity contribute to further pollution. Given the presence of regional protectionist measures, the frequency of enterprise transfers on a broader scale is reduced, leading to a more prevalent trend of localized migration. When polluting enterprises operate in regions characterized by stringent environmental regulations, particularly when they confront the prospect of closure and cessation of operations, they tend to relocate en masse to areas with lower production and environmental expenses. This relocation is mainly observed in sites that have already established favorable cooperative associations [
41]. In the case of the water environment protection of the Yangtze River, Xingfa Group, a prominent player in the fine phosphorus chemical industry, has spearheaded an effort to address the issue of outdated production capacity, promote clean production practices, and strengthen the construction capabilities related to ecological environment protection. This initiative has resulted in the coordinated evacuation, land governance, and shoreline clearance of 134 chemical enterprises in Yichang. These enterprises have undergone a shutdown, reform, relocation, and transfer process, thereby initiating chemical enterprises’ relocation, remediation, and transformation along the Yangtze River [
42]. Despite being costly and potentially detrimental to the sustainable development of enterprises, the overall transfer mode remains suitable for enterprises with substantial capital, specialized expertise, and robust social network capabilities. This mode facilitates the transition of water-polluting enterprises towards high-end, recycling-oriented, and environmentally friendly development while aiding in managing water environment pollution at relocation sites.
Localized transfer has become a prevalent method of relocating highly polluting activities, primarily through developing production bases and outsourcing industrial processes. The establishment of production bases can serve as an effective measure to prevent the unauthorized disclosure of vital information within enterprises. Additionally, it offers the opportunity to establish proximity to the source of raw materials, resulting in cost savings in transportation and transaction expenses. Furthermore, maintaining a connection with the local area enables the continuation of the industrial chain despite the potential challenges posed by the environmental system. This strategic approach aligns with market demands and enhances enterprises’ competitiveness [
43]. In addition to other considerations, conglomerates may be responsible for fulfilling supply contracts that necessitate delivering a predetermined number of items to the purchaser. This arrangement establishes a consistent demand for the conglomerate’s products [
44].
Consequently, conglomerates are inclined to embrace a strategy wherein they establish production bases within a specific sub-region. This involves the establishment of multiple subsidiaries or branch factories and relocating pollution-intensive aspects of the production process. Such relocation is facilitated by providing various resources, including capital, technology, and managerial personnel. The primary objectives of this approach are to secure subsidies for the new location and to mitigate cost-related losses [
45]. Based on statistical data, it was observed that, in 2005, Ji’an in Jiangxi Province housed a collective of 41 paper enterprises. Approximately 60% of these enterprises originated from Zhejiang and Fujian Provinces. Many of these enterprises hailed from the renowned small chemical aggregation in Quzhou City, Zhejiang Province. Furthermore, it was observed that most of these enterprises were situated in economically developed regions that explicitly prohibited water pollution activities. Indeed, it is worth noting that certain enterprises opt for mergers and acquisitions or acquisitions as a means of relocation. This behavior is typically observed among economically robust enterprises with ample production resources. This approach applies to green mergers and acquisitions prioritizing energy conservation and emission reduction technologies. Such endeavors are well-suited for facilitating the transition towards industries characterized by a low pollution and energy consumption [
46].
Moreover, outsourcing production processes overcome the resource constraints confronted by individual enterprises. This practice enhances specialized production, facilitates productivity and cost savings, and enables faster market entry and optimal resource allocation [
47]. Additionally, outsourcing transfers places the pollution burden onto other enterprises, reducing the costs associated with relocating or establishing a production base. It also allows for maintaining connections with the local industry, transforming the enterprise’s image, and enhancing its competitiveness [
48]. Hence, outsourcing production processes is deemed more appropriate for relocating contaminated production connections rather than essential sectors to mitigate concerns regarding product quality and asymmetric supply and demand information. The economic development in China’s eastern and western regions exhibits an imbalance, characterized by the eastern region being akin to a “cage for birds” while the central and western regions persistently foster investments. In response to enterprises’ water pollution challenges in the eastern region, partnerships are sought with counterparts in the central and western regions. Furthermore, the central and western regions are responsible for undertaking production activities associated with higher levels of pollution [
49]. For instance, the Jiangxi Province accommodates numerous plastic pellet processing factories supplying raw materials to companies along the coast. However, providing clean raw materials is limited to firms in the eastern region, while water environmental contamination persists in the central and western regions.
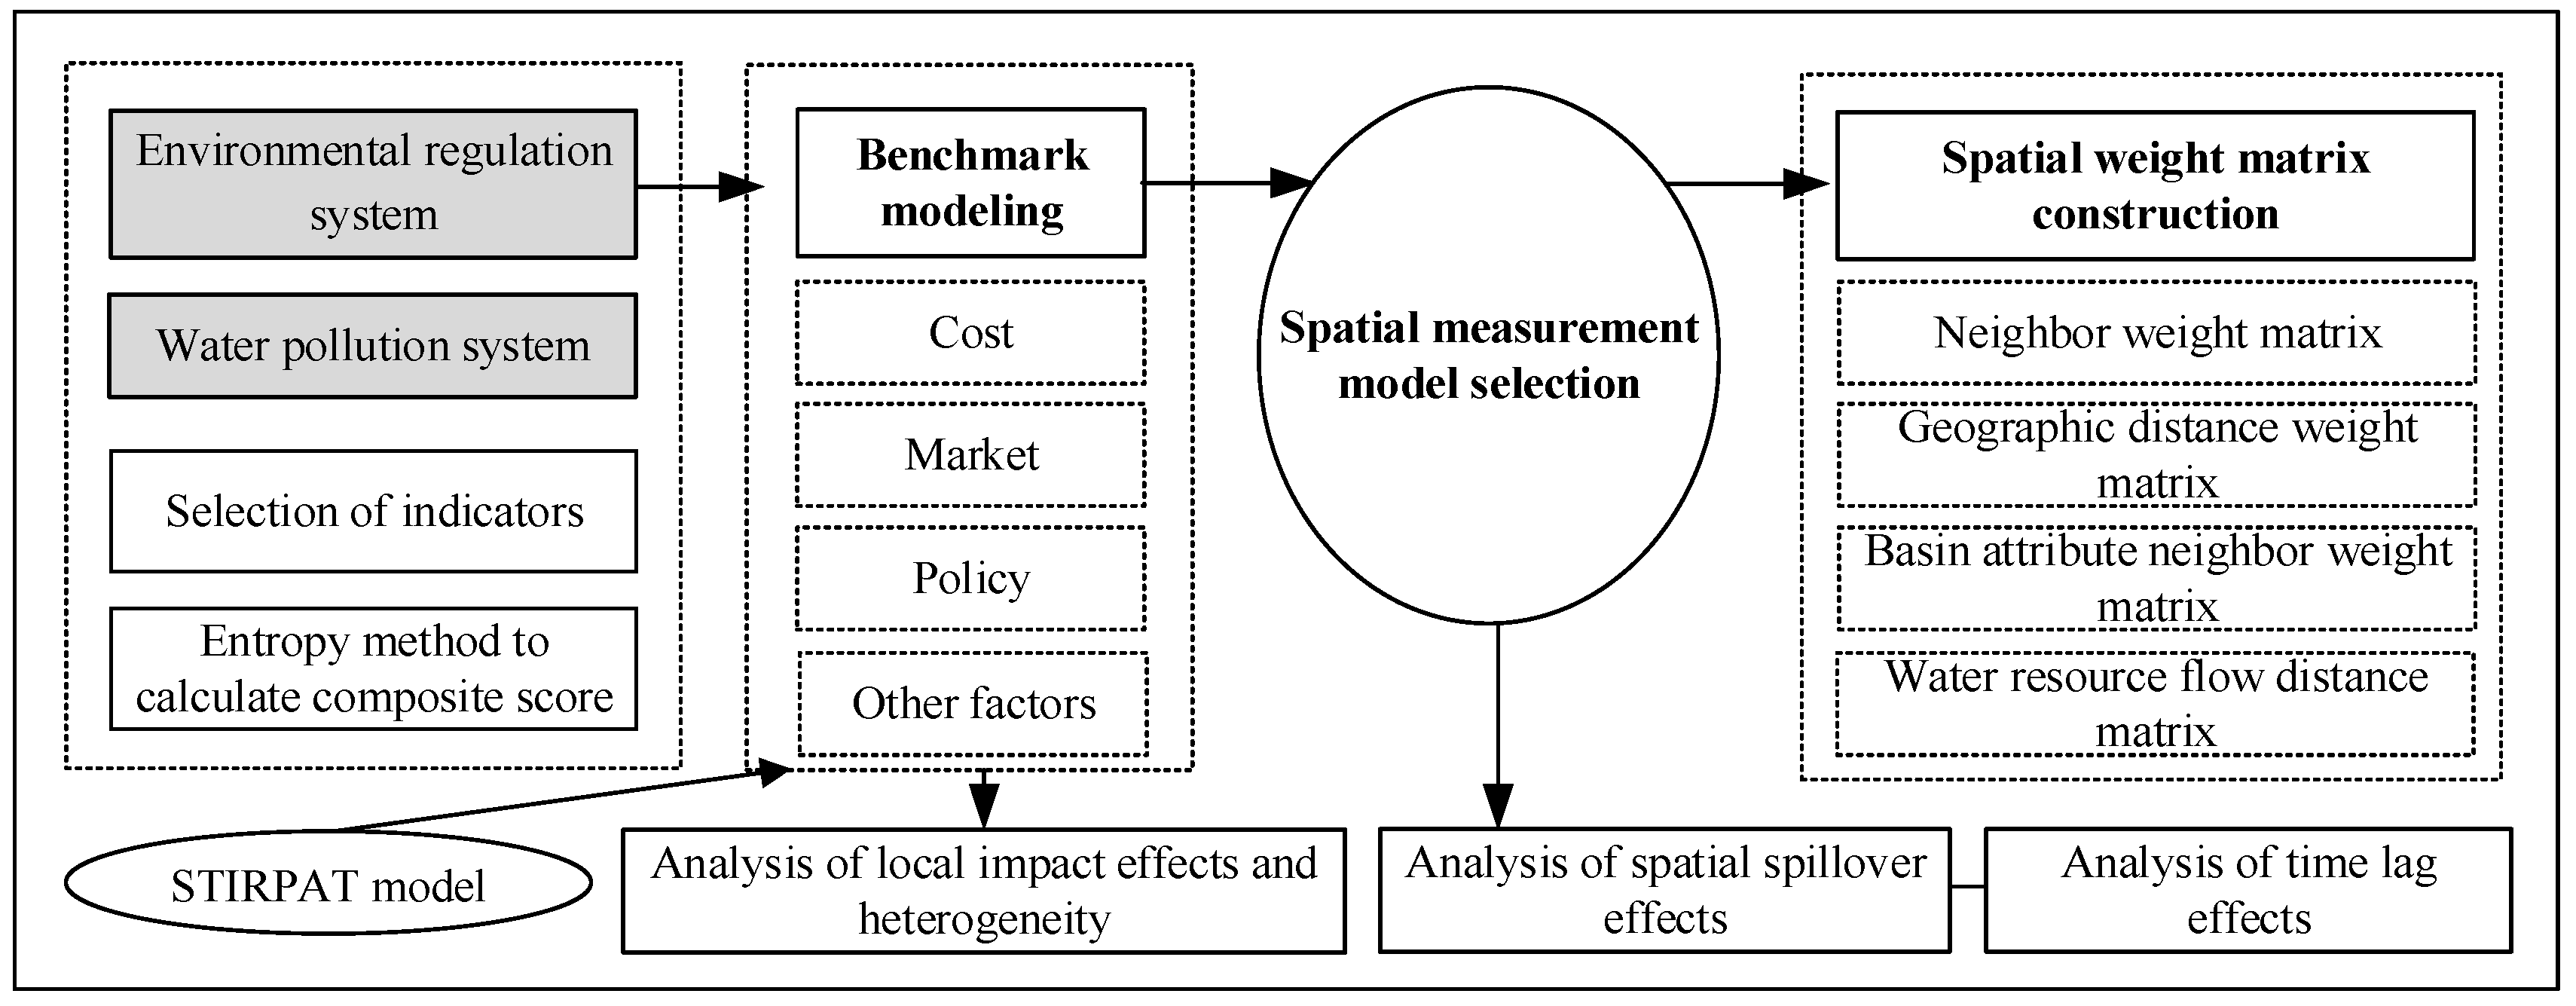
Based on the above background and theoretical mechanism, this research work firstly constructs the environmental regulation system and the water environment pollution system and calculates their composite indices. Secondly, it constructs the baseline model and the spatial measurement model. Finally, it analyzes the local impacts and heterogeneity, the spatial spillover effects, and the time lag effects of the environmental regulation, respectively. To facilitate readers’ understanding, this study provides a flowchart to demonstrate the analytical framework of this paper (
Figure 2).
2.2. Model Specification
China’s current environmental regulatory policies are mainly command-and-control [
50], with the government as the policy maker and implementer. In order to achieve the purpose of water pollution regulation in river basins, combined with the five-phase plan of China’s key river basins as sorted out by Xu et al. [
51], we must focus on the relevant policies to achieve the mandatory means of regulation to reduce the water environments pollution, the inputs in the process of regulation as the entry point, and determine the total amount (R
1), quality (R
2), project (R
3), and governance (R
4)— the four types of regulation categories—to achieve the goal of “four-in-one” whole-process prevention and control of water pollution in river basins. The four regulatory categories of overall amount (R
1), quality (R
2), project (R
3), and governance (R
4) were identified to realize the “four-in-one” technological route for the prevention and control of water pollution (
Table 1). In each phase of the primary river basin planning text, R
1 is expressed as the total amount of control target of the river basin decomposed to the relevant areas. R
2 is the supporting regulatory measure to realize the water quality target of the river basin section. R
3 is expressed as the environmental protection projects set up at different stages to implement the tasks of the river basin planning. R
4 is the investment and supporting facilities for implementing wastewater governance by the government and enterprises. Simultaneously, regarding the design principles of some existing water environment regulation indicators, the basin environmental regulation system was finalized, covering eight specific indicators (
Table 1), all of which are positive indicators, i.e., the higher the value indicates, the higher the intensity of regulation. The basin water environment pollution system (
Table 2) was established from the scale of water pollution and water environment quality level, including industrial wastewater discharge and six indicators.
Basin and water environmental pollution systems are two composite systems, consisting of
n and
m elements, respectively. It is assumed that
REG = f(
xit,1,
xit,2, …,
xit,j) and
WPS = f(
yit,1,
yit,2, …,
yit,k). It means that
xit,j denotes the value of ordinal covariates for the
jth indicator of the
ith region of environmental regulation in the year
t, and
yit,k denotes the value of ordinal covariates for the
kth indicator of the
ith region of water environment pollution in the year
t (
j = 1, …,
m;
k = 1, …,
n). The entropy weighting method is used to assign weights to the two types of indicator systems. Among them, the environmental regulation indicators are positive efficacy indicators, and the higher their values are, the higher the order of the system is. While the water pollution indicators are negative efficacy indicators, the higher their value, the lower the system order. Therefore, the above two indicators are standardized as positive efficacy indicators. For each of the two types of indicators, they are treated as follows:
The value of
c is set to 0.01, and, after processing, both types of indicators are positive efficacy indicators. The information entropy and redundancy of the
jth indicator of environmental regulation and the
kth indicator of water environment pollution are further measured, and the specific weights
wj and
wk are calculated according to the redundancy of information entropy. The multiple linear weighting method is used to integrate and obtain the comprehensive score of the orderliness of environmental regulation and water environment pollution system as follows:
Referring to the stochastic environmental impact assessment model (STIRPAT model) proposed by York et al. [
52], combined with the idea of environmental Kuznets, the squared term is introduced to reflect the nonlinear relationship with environmental pollution, and the model for the baseline regression model is obtained as follows:
where environmental regulation (
REG) is the primary explanatory variable.
αn is the coefficient of each parameter.
lnRit is the intensity of environmental regulation in region
i in year
t.
lnXit is the social and natural driver. Due to the dynamic evolution characteristics of water environment pollution, the time-lag terms
Ii,t−1, and
Iit are the indicators of water environment pollution, respectively.
Ait is the affluence level, generally expressed by GDP per capita.
μit is the random perturbation term.
This study’s spatial weight matrix (
Wij) includes the neighbor weight matrix (
W1), geographic distance weight matrix (
W2), basin attribute neighbor weight matrix (
W3), and water resource flow distance matrix (
W4). Among them,
W1 is used when there is a common boundary between areas
i and
j in the basin. Then,
wij takes the value of 1, and the absence of which takes the value of 0. The
W2 is the reciprocal of the distance (
dij) between the center locations of areas
i and
j within the basin.
dij was obtained using GeoDa 1.22 measurements based on electronic maps provided by the China National Geographic Information System website.
W3 is based on
W1, which treats the midstream and downstream provinces as one. There is no correlation between the midstream and downstream provinces (thus, it takes the value of 0), while the upstream provinces are judged to be spatially adjacent to the midstream and downstream provinces and take the value of 1.
W4 is based on the
W2, emphasizing the differences in water resource endowment and geographic location.
W4 is built around the primary form of the gravity model, in which the regional water resource endowment is expressed in terms of total water resources per capita (
PW) as follows:
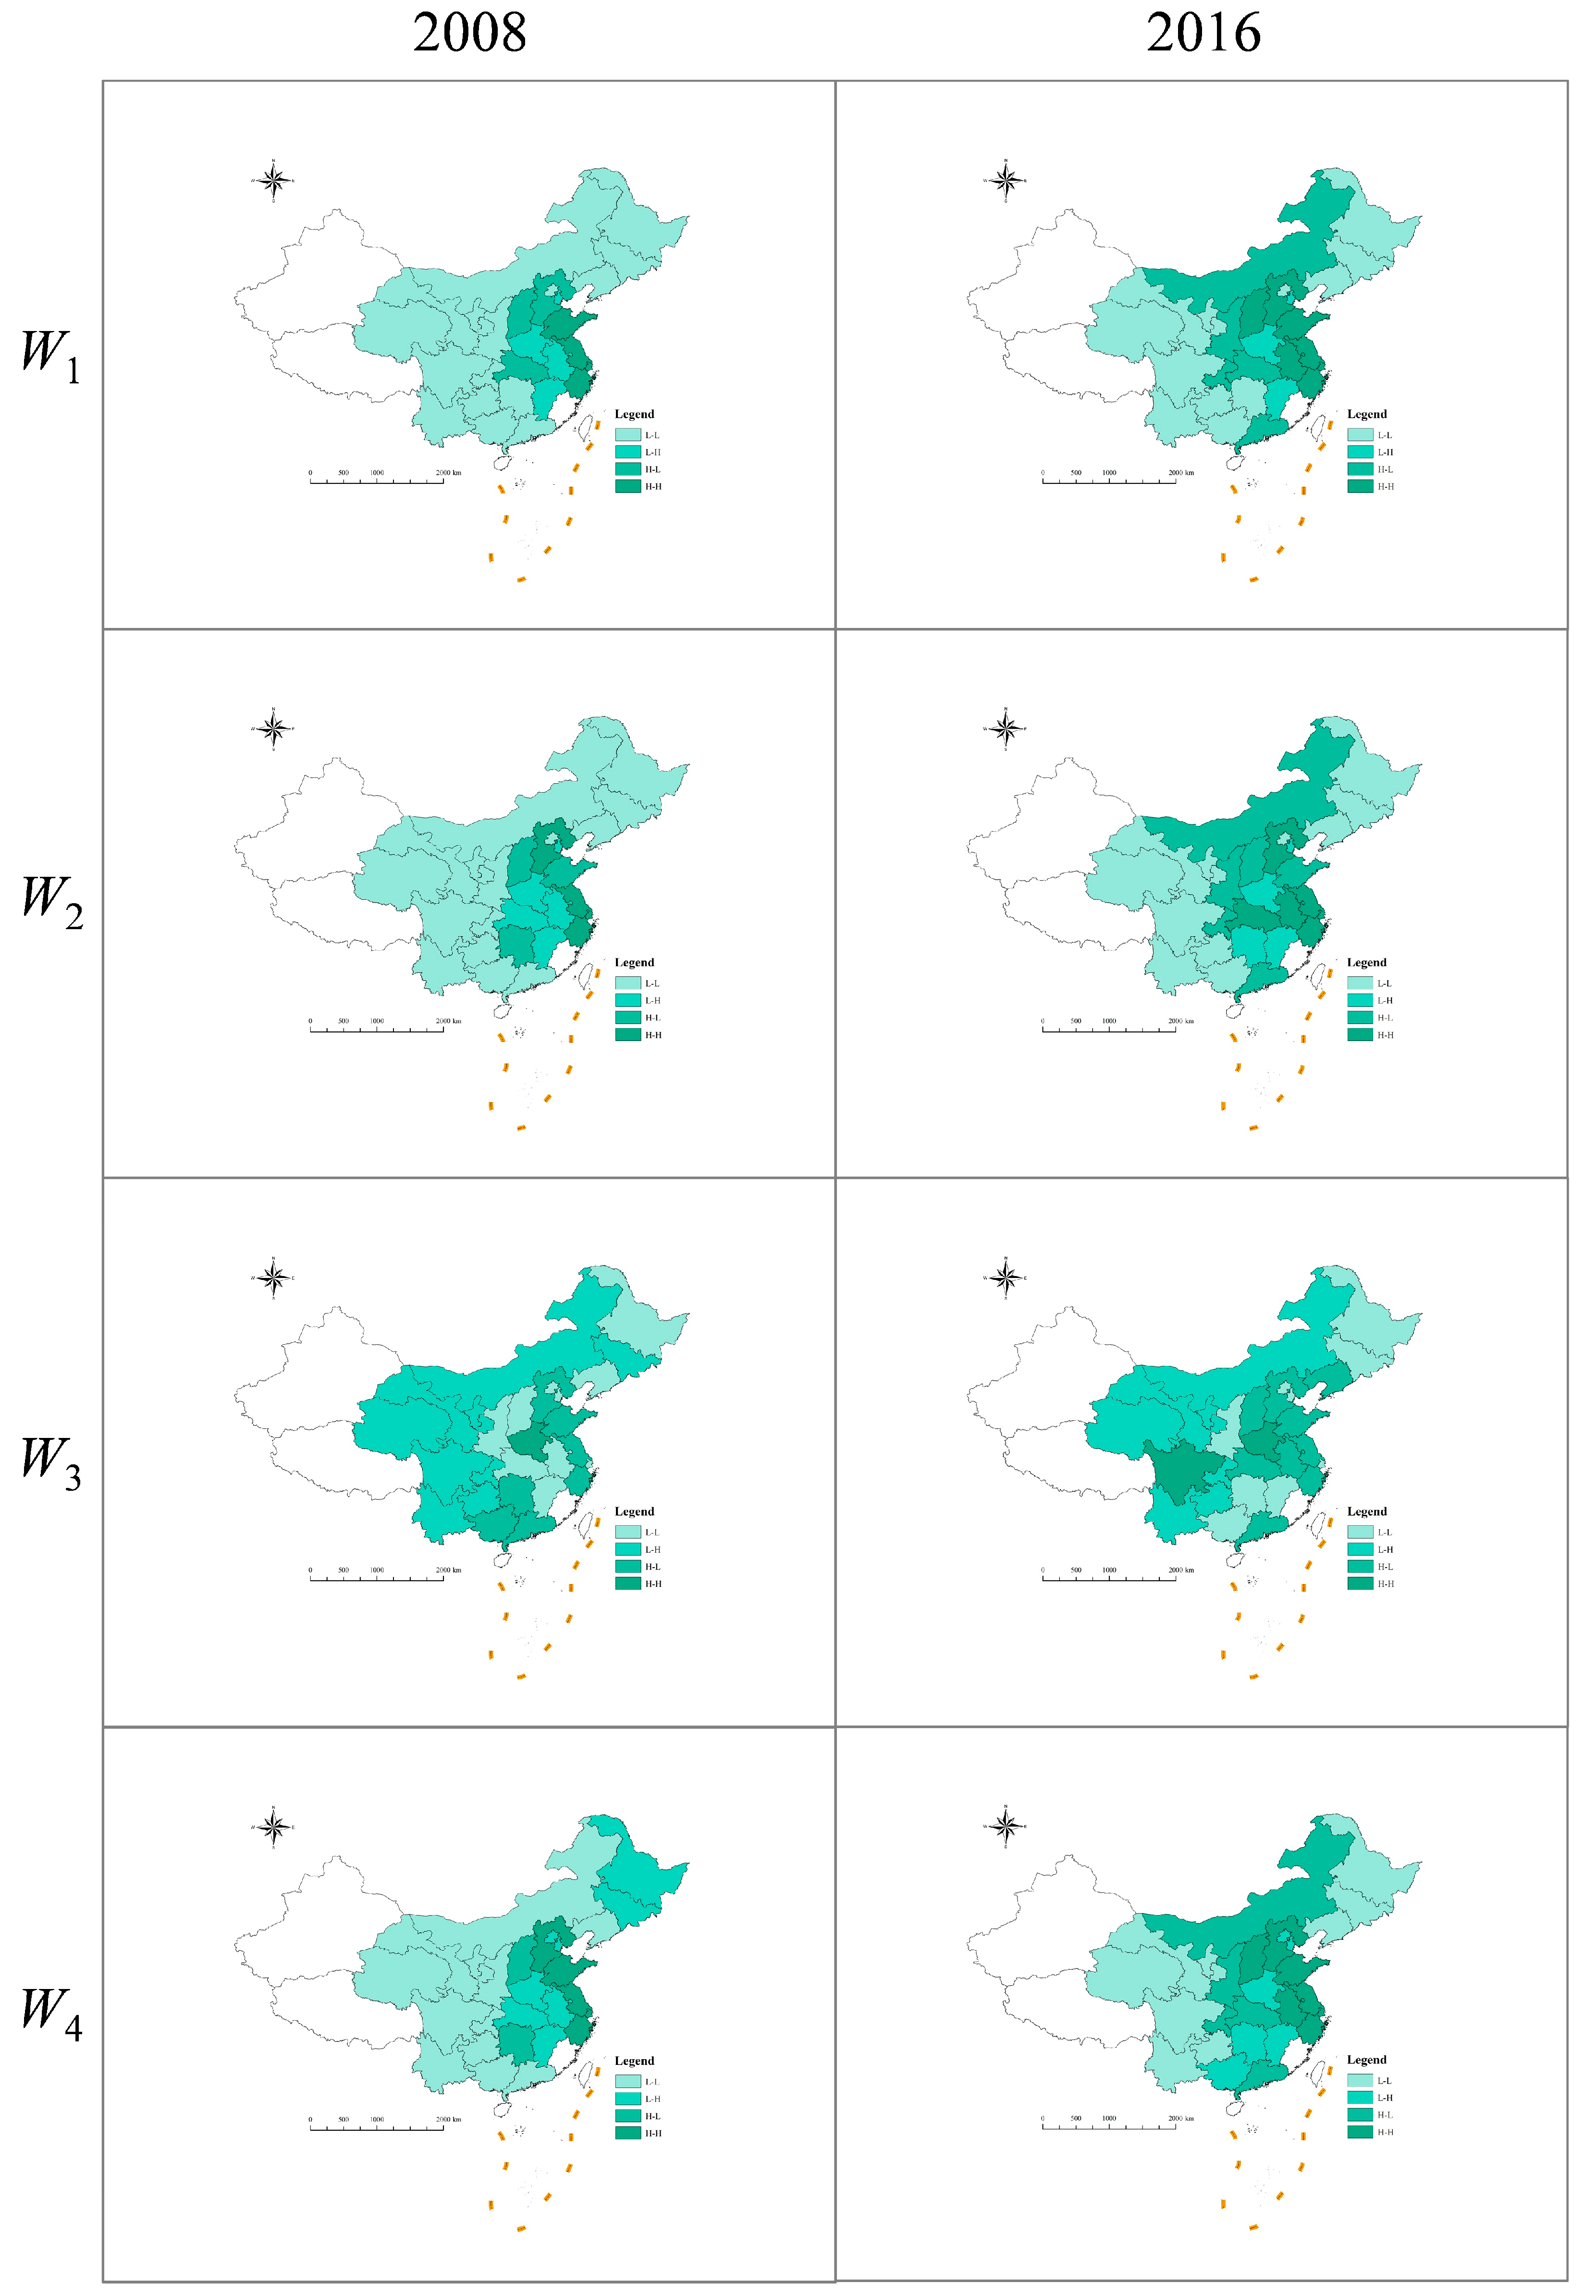
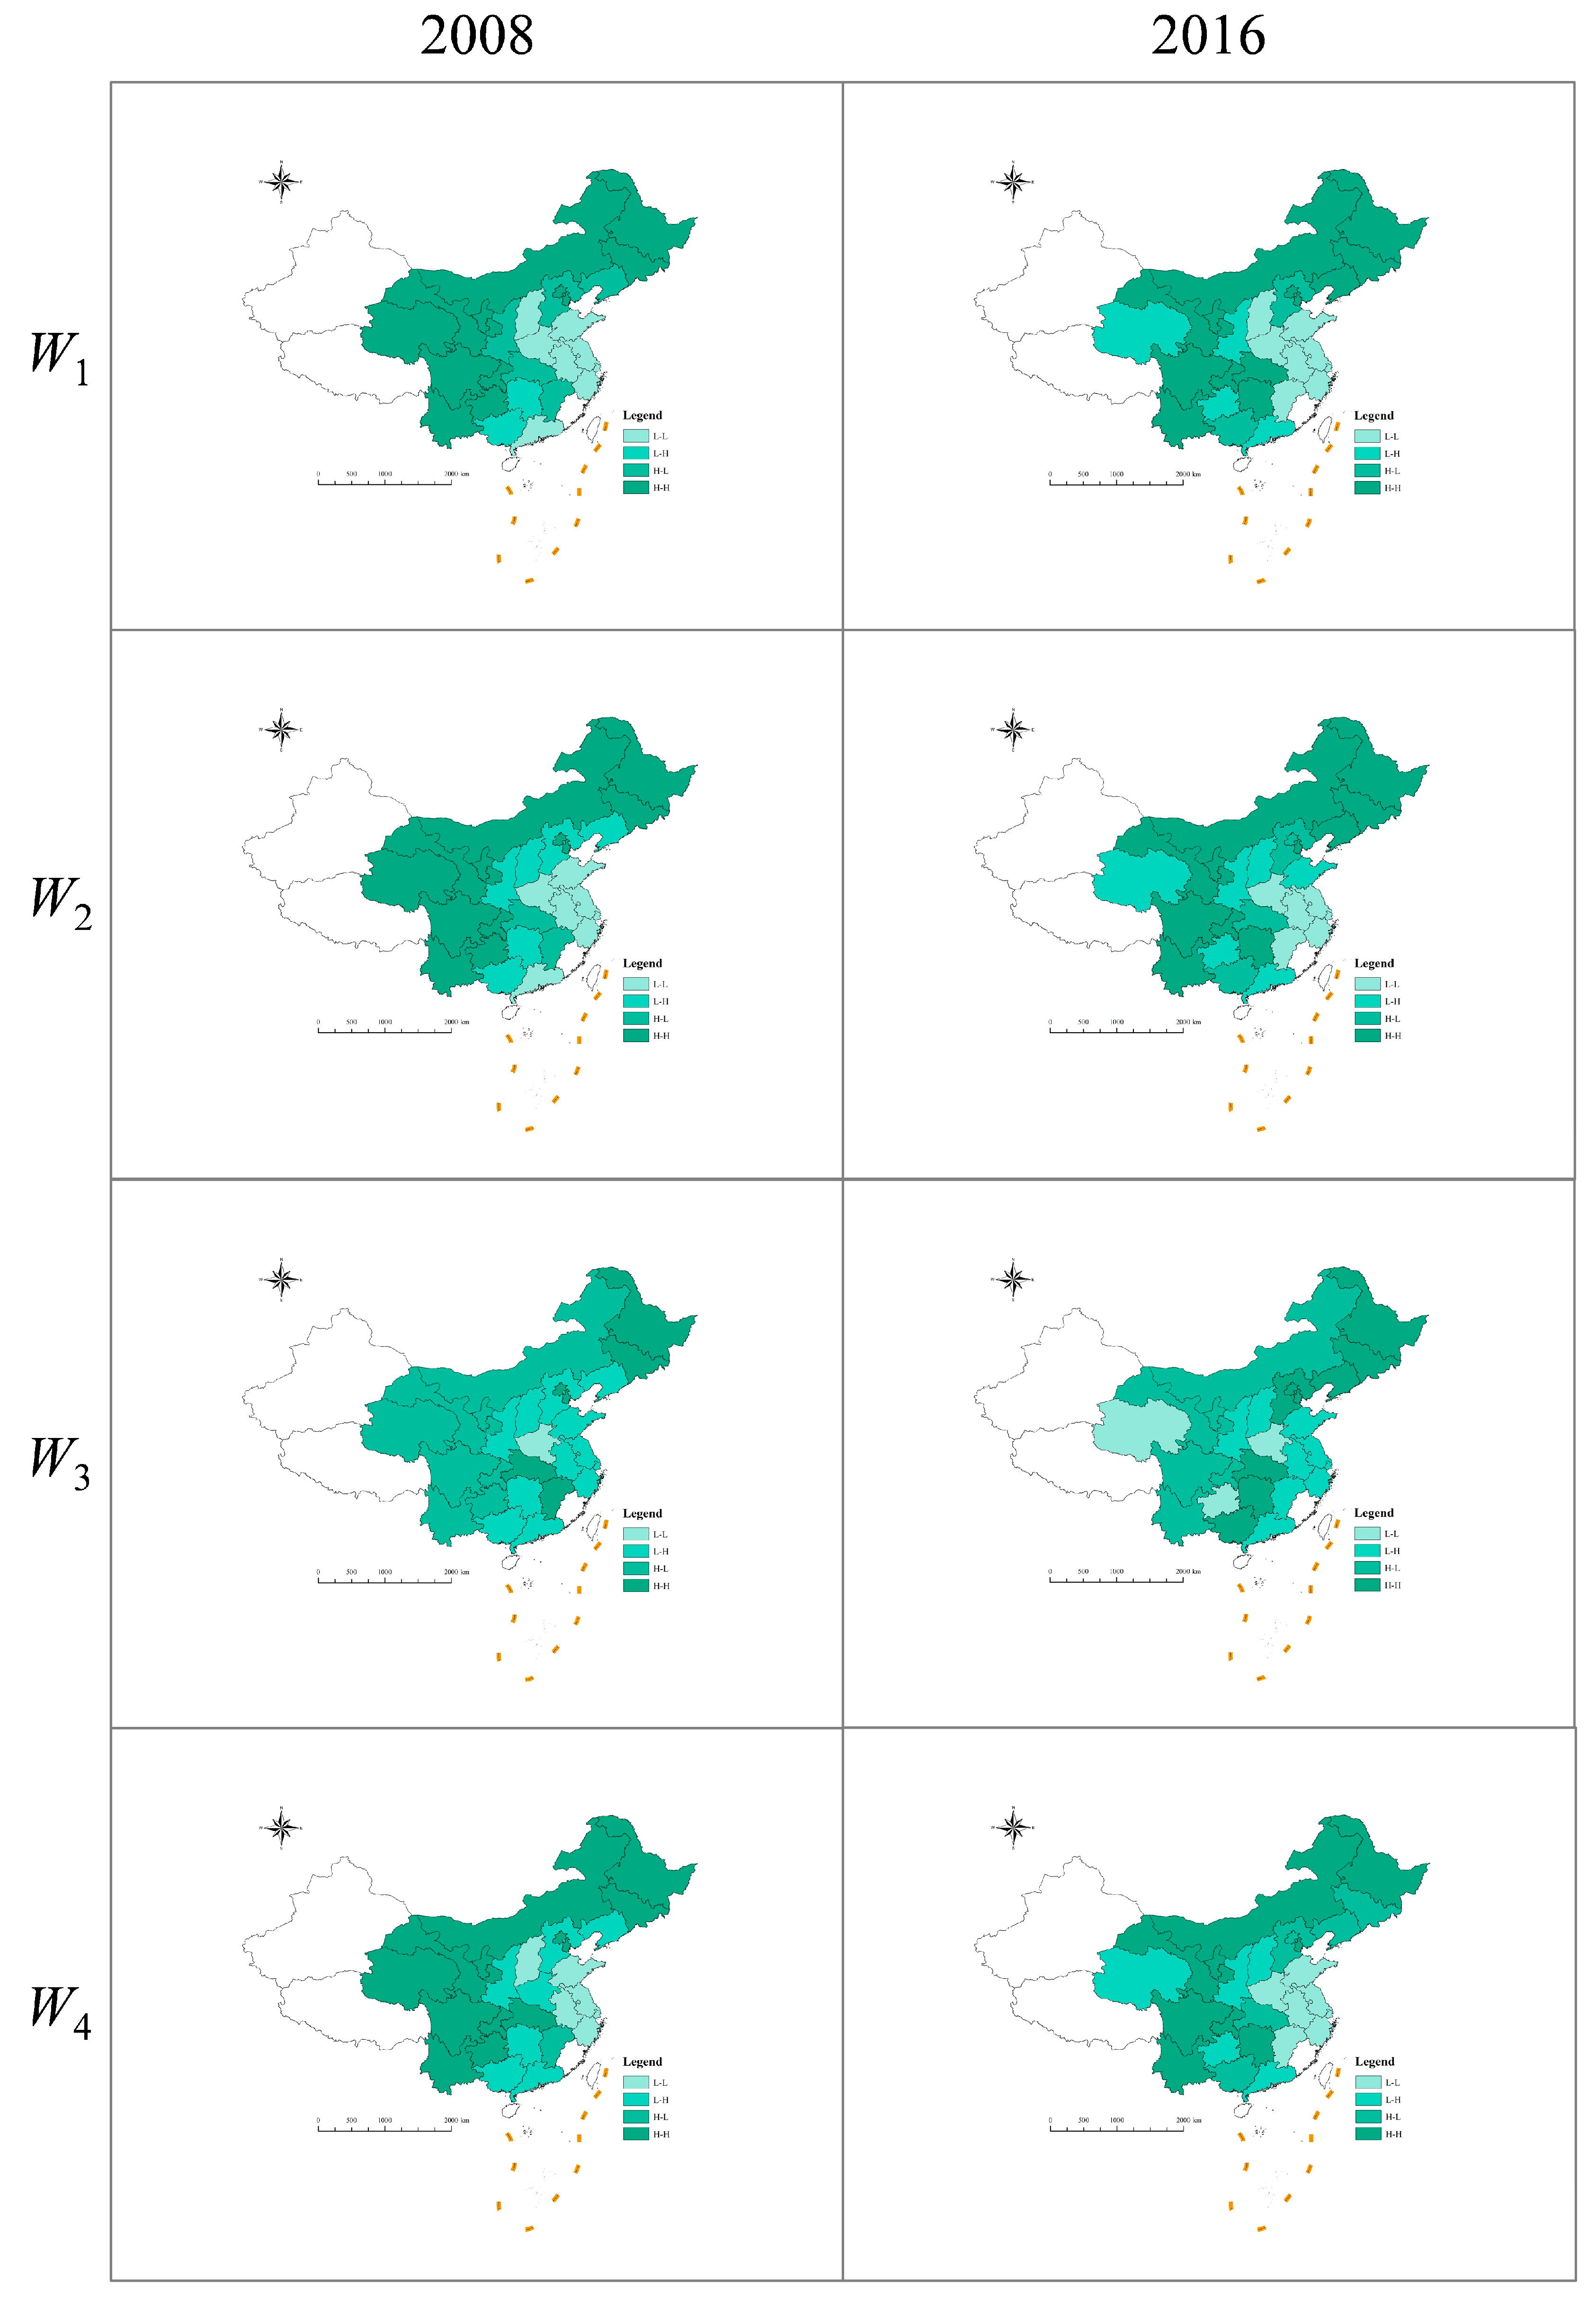
Due to the influence of spatial diffusion, the environmental regulations and water pollution data among basin regions are no longer independent. After selecting the appropriate spatial weight matrix, in order to better judge the degree of spatial correlation between regions, the global spatial autocorrelation (GSA) and local spatial autocorrelation (LSA) were used to quantitatively explore the spatial distribution characteristics of environmental regulations and water environmental pollution. According to the different ways of reflecting spatial effects, there are three forms of widely used spatial measurement models, namely the Spatial Autoregressive Model (SAR), Spatial Error Model (SEM), and Spatial Dubin Model (SDM). According to Anselin [
53], the SAR model is applicable when the spatial dependence between variables is critical to the model and leads to spatial correlation; the SEM model is mainly applied when the error terms of the model exhibit spatial correlation; and the SDM model, which is more explanatory, not only measures the effect of changes in the explanatory variables on the self but also performs better estimates on the direct and indirect effects on the neighboring areas. The SDM model can measure the effect of changes in the explanatory variables on itself and better estimate the direct and indirect effects on neighboring areas. The SAR, SEM, and SDM spatial spillover models corresponding to the environmental regulations on water pollution are as follows:
where
η is the impact of spatially correlated region’s water environment pollution on local water environment pollution.
λ is the impact of spatially correlated region’s error shock about water environment pollution on local water environment pollution.
θ is the impact of the spatially correlated region’s explanatory variables on local water environment pollution, and the rest of the indexes are the same as in Equation (5). All the above models calculate the spatial correlation from the entire domain, and (if the ordinary least squares method is still used for estimation) the results may be biased with endogeneity problems. Moreover, even if they are unbiased, they are not valid. In this case, the spatial panel excellent likelihood method proposed by Elhorst [
54] is used for estimation.
2.3. Study Area and Data Sources
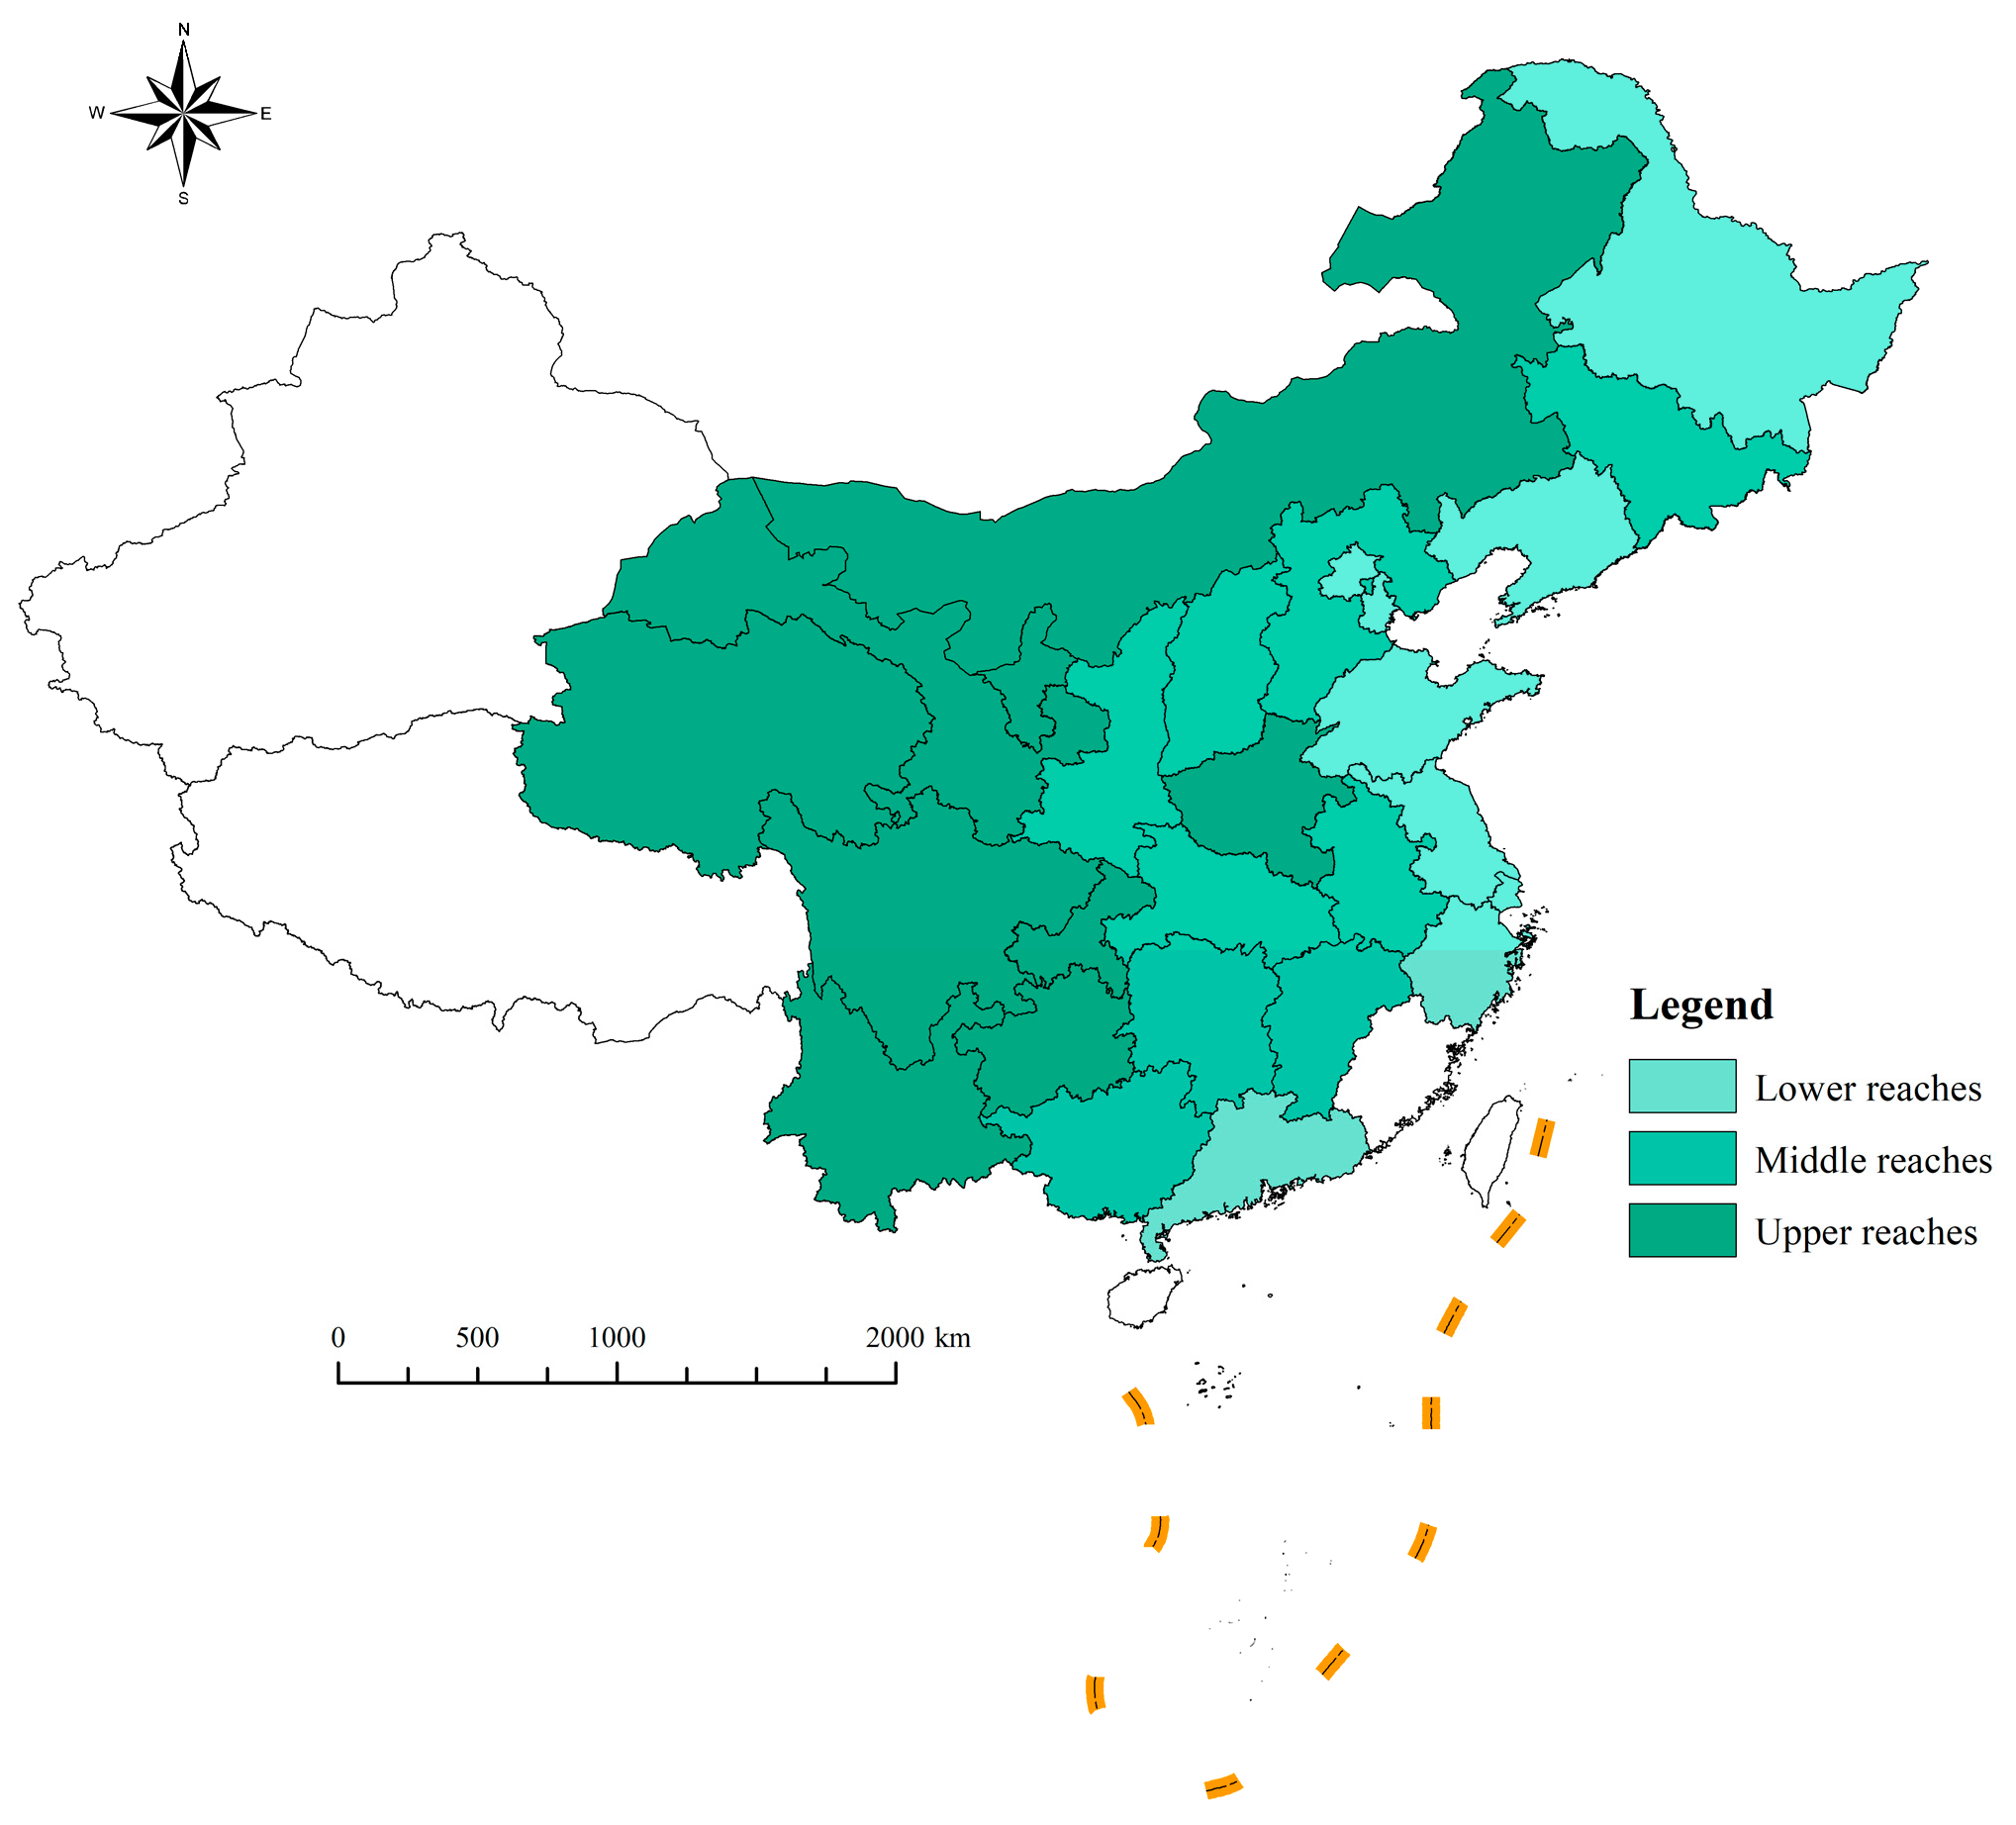
According to the comprehensive basin planning objects issued by the Ministry of Water Resources of China and the State Council, the key basins include the seven major basins of the Yangtze River, the Yellow River, the Pearl River, the Huaihe River, the Haihe River, the Liaohe River, and the Songhua River. These key basins constitute more than 4.4 million square kilometers of the basin area of China, span across 27 provinces and municipal administrative districts (
Figure 3), account for about 46% of China’s national land area, and contribute to China’s economy with a contribution of more than 55%. Thus, regarding geographic space, industrial structure, or economic development, the seven basins fulfill the requirements of representativeness and diversity for sample screening.
According to the data provided by the China Environmental Yearbook on industrial wastewater discharges in the basins in 2004 and based on Zeng’s [
55] study, the absolute and relative discharges of different provinces are measured separately. The proportion of absolute discharges refers to the proportion of wastewater discharges of a province in the basin: it belongs to the proportion of the total discharges of the province. In contrast, the relative discharges refer to the proportion of the total discharges of the basin: it belongs to the proportion of provinces. Thus, the proportion of absolute and relative discharges will be calculated. Provinces with absolute and relative discharge shares above 1% are considered typical discharging provinces in the basin.
Table 3 provides the typical discharging provinces in the seven major basins. The actual areas covered by the basins are more than the listed provinces; however, they are not included in the statistics because of their lower discharge values in the specified basins.
The emissions’ data of pollution sources discussed in this research have been sourced from the China Environmental Statistics Yearbook during the study period. These data encompass three indicators: industrial wastewater, industrial chemical oxygen demand, and industrial ammonia nitrogen emissions. The water quality data obtained from the Ministry of Ecology and Environment, as reported in the National Weekly Report on Automatic Water Quality Monitoring of Key Cross Sections in Major River Basins, was utilized to calculate the annual average values of water quality categories, specifically the permanganate index and ammonia nitrogen index, for the surface water monitoring sections across different regions within the basin. These calculations followed China’s “Environmental Quality Standards for Surface Waters” (GB 3838-2002) [
56], and by using a single-factor approach to determine the water quality category. The water quality category is represented by a cross section ranging from Ⅰ to V, with V indicating poor water quality. The numerical values 1–6 correspond to the water quality categories, with higher values indicating worse environmental water quality. The industrial value-added data in “China’s Industrial Statistics Yearbook” encompass the above-scale industrial enterprises. The term “above-scale” refers to industrial enterprises with an annual income from their main business of CNY 5 million or more, starting from 2007. However, as of 2011, the threshold for above-scale enterprises was increased to CNY 20 million. The gross regional product and total regional population data are sourced from the China Statistical Yearbook of the preceding years.
The data on environmental regulation indicators are derived from various policy documents. For instance, the total emission control of chemical oxygen demand and ammonia nitrogen is obtained from the Approval of the National Plan for the Control of the Total Emission of Major Pollutants during the 11th Five-Year Plan Period. Additionally, the Circular on the Issuance of a Comprehensive Work Program for Energy Conservation and Emission Reduction during the 12th Five-Year Plan, as well as the Circular on the Issuance of a Comprehensive Work Program for Energy Conservation and Emission Reduction during the 13th Five-Year Plan, also contribute to the collection of the relevant data. The evaluation of these indicators aligns with the Five-Year Plan, wherein a goal value for assessment is upheld every five years. The assessment targets of Qinghai Province during the Eleventh and Twelfth Five-Year Plan periods were deemed unsatisfactory in terms of meeting the fundamental criteria of input indicators. Consequently, these assessment targets did not exhibit positive outcomes. Hence, the updated estimation for the aggregate control targets in Qinghai Province during the “11th Five-Year Plan” and “12th Five-Year Plan” is 0.001 million tons. The data of additional indicators of environmental regulation are sourced from diverse statistical yearbooks. For instance, the surface water environmental monitoring sections of the China Environmental Yearbook provide information on this aspect. Furthermore, the China Environmental Statistical Yearbook offers data on the number of industrial wastewater governance facilities and the corresponding investment in industrial wastewater governance projects. The water resource components utilized in this study are derived from the China Environmental Statistics Yearbook. These components encompass industrial water consumption and the aggregate volume of water resources available.
The count of primary monitoring enterprises in the water environment is determined by referencing the roster of national primary monitoring enterprises released by the former Ministry of Environmental Protection. Additionally, it incorporates fundamental data on primary pollution sources furnished by regional ecological and environmental protection agencies. The data regarding the investment in environmental protection for projects subject to the environmental impact assessment system and the investment in environmental protection works for projects implementing the “Three Simultaneities” policy were sourced from previous editions of the China Environmental Yearbook. The above section demonstrates that other environmental control elements and water contamination indicators align with the earlier findings. This study’s average annual rainfall and average temperature data were sourced from reputable publications, namely the China Water Conservancy Statistical Yearbook and the China Meteorological Yearbook. Additionally, supplementary data of other influencing elements were obtained from the China Statistical Yearbook and the statistical yearbooks specific to each province. Foreign capital invested in the region is changed to Chinese CNY using the annual average exchange rate. Similarly, the regional GDP is converted to constant prices using the deflator, with the base period being 2000.
