Article

Spatial Spillover Effect of Water Environment Pollution Control in Basins—Based on Environmental Regulations

1
Business School, Hohai University, Nanjing 210098, China
2
School of Water Resources and Hydropower Engineering, Wuhan University, Wuhan 430072, China
*
Author to whom correspondence should be addressed.
Water 2023, 15(21), 3745; https://doi.org/10.3390/w15213745
Submission received: 6 October 2023 / Revised: 23 October 2023 / Accepted: 25 October 2023 / Published: 26 October 2023

Abstract

:
The basin economy is essential in China’s high-quality development, which brings prodigious economic and social benefits. However, high industrialization and urbanization led to a significant escalation in water pollution within basins. The achievement of synergistic control of water environment pollution at the basin scale has emerged as a primary goal for governmental departments in developing environmental policies. This study constructs a “four-in-one” basin’s water environment regulation system comprising four categories: total, quality, project, and governance. Further, the spatial spillover effects of water environment pollution control in 27 Chinese provincial-level administrative regions spanning key river basins were analyzed. This study aims to provide evidence from China on the transfer of water pollution in basins worldwide. The results indicate the following conclusions: (1) A consistent upward trend in the environmental regulations and water environment pollution indexes across all provinces in the basin. Compared to 2006, in 2018, the mean value of the basin environmental regulation index was 0.21, which is an increase of 23.5%, and the mean value of the water environmental pollution index was 0.83, which is an increase of 29.7%. (2) Whether in the basin’s upper, middle, or lower reaches, the relationship between environmental regulations and water pollution follows a “U”-shaped pattern, with thresholds of 0.318, 0.331, and 0.390, respectively. (3) Under the neighbor weight matrix and water flow distance weight matrix, the impact coefficient of the water environment pollution index on the surrounding areas is significantly positive, implying that the implementation of local environmental policies will radiate to the neighboring areas in the short term and bring positive governance effects. (4) Regarding the time-lag effect, it is observed that the lag term associated with the water environment pollution index exhibits a statistically significant positive relationship. This finding suggests that the pollution of the water environment within the basin follows a cumulative and continuous pattern. (5) It is noted that long-term environmental regulation measures do not contribute favorably to the amelioration of water pollution in the neighboring regions. This implies the presence of a characteristic neighboring avoidance effect.

1. Introduction

Environmental policy is China’s significant basic state policy integrating various government regulatory measures, such as prohibition, taxation, and penalties. This public policy leverages tax policy, welfare policy, and other mechanisms to enhance the efficient allocation of resources and mitigate the substantial transaction costs resulting from market failures. Environmental policy aims to address environmental issues and achieve Pareto improvement through these means. To effectively address water pollution and ensure comprehensive management of the water environment, the regulation of the water environment has evolved with different objectives through various stages of economic development. For example, the point source-based water pollution prevention and control system was established during the initial phase of China’s reform and origin. Furthermore, related regulatory measures (e.g., the Water Pollution Prevention and Control Law) were introduced, providing a framework for addressing water pollution. Due to the growing pressure on the water environment from establishing heavy chemical industry projects along rivers, these measures were essential to address river basin pollution through initiatives.
The Chinese government has implemented environmental policies to address water pollution management. The implementation of the “Action Plan for the Prevention and Control of Water Pollution” (“Water Ten”) in 2015 marked the commencement of a comprehensive and systematic approach towards pollution control [1]. Subsequently, the “Yangtze River Protection Law” was enacted in 2020 to enhance the effectiveness of complete point-to-point control measures [2]. However, managing this issue is challenging due to the intricate nature of the causes of structural water pollution [3]. Challenges include outdated equipment, improper infrastructure layout, difficulties in environmental supervision, etc. [4]. Thus, achieving a balanced state between these policies and managing water pollution is a complex task.
Transboundary contamination represents a significant issue in China’s river basin water pollution dilemma. In instances where regions are situated within the same river basin and rely on shared water resources, there exists significant variation in the development and utilization of these resources, as well as in the requirements for water pollution discharge [5]. Notably, downstream regions tend to exhibit higher levels of economic development and enforce more stringent environmental regulations than their upstream counterparts within the basin [6,7]. Enterprises often relocate from regions with stringent environmental laws to regions with fewer rules to maximize economic profits. This relocation process might result in a “public tragedy” characterized by the degradation of the aquatic environment in the basin [8]. While water environment quality improves due to long-term basin pollution control efforts, a significant challenge remains in managing transboundary basin pollution through coordinated governmental actions. Thus, addressing this challenge necessitates an examination of the underlying motivations driving transboundary pollution in basins [9].
Many studies have been employed on the spatiotemporal impacts of environmental regulations on the transfer of environmental pollution. Based on the theoretical framework of the “pollution refuge” hypothesis, Markusen [10] argued that a large country’s welfare-maximizing policies could influence pollution levels in other nations. Copeland and Taylor [11] found that trade liberalization has a dual impact on environmental pollution, with developed countries experiencing a reduction in pollution levels while developing countries observe an exacerbation of environmental degradation. This hypothesis places significant emphasis on the notion that the adverse external impact of cross-border pollution has the potential to give rise to severe conflicts between different regions [12]. It suggests that implementing stringent environmental regulations may prompt developed regions to relocate highly polluting industries to less developed regions with less stringent environmental regulations, resulting in a negative spillover effect of such regulations [13,14]. Smarzynska and Wei [15] add the level of host country corruption to FDI, demonstrating the existence of pollution havens through data on multinational firms in 24 countries. Focusing on the California electricity sector, Fowlie [16] suggests that when regulated producers are less polluting than unregulated producers, total emission levels under incomplete regulation may exceed the levels without regulation. Kheder and Zugravu [17] used an economic geography model to analyze the impact of environmental regulation and showed that a subset of countries exhibits a pollution haven effect while receiving French investments.
With the rapid development of the global economy, inter-regional economic differentiation has ensued [18], and pollution spillovers caused by inter-administrative transfers from the same country may be more prevalent [19], which leads to substantial environmental costs for the regions that take over polluting industries in the long run [20]. Some studies focused on pollution transfer within China, finding that environmental regulations and the industrial transfers they promote have not mitigated China’s overall environmental pollution agglomeration [21,22,23,24,25,26,27]. Porter and Lind proposed the role of environmental regulation in promoting the upgrading of green technology for resource development and utilization in developed regions [28]. The technological progress will gradually be transmitted to the less developed regions so that society as a whole can maintain the synchronization of economic growth and the reduction of environmental pollution agglomeration [29], and thus achieve a win–win situation for economic growth and environmental protection, i.e., to test the positive spillover effect of environmental regulation [30,31,32,33,34,35,36]. The scholarly examinations of the pollution haven theory and the Porter effect have yielded somewhat incongruous findings. The behavior of firms can be seen as a means through which environmental pollution is transferred. Environmental regulations incentivize firms to develop clean technologies, leading to notable advancements in reducing environmental pollution. Additionally, firms may relocate to lower the costs associated with environmental remediation. However, this relocation can result in the spatial agglomeration of firms, which generates externalities and leads to a more extensive transfer of pollution to specific areas within the region. Given the fact that the strategic interplay of environmental regulation is a characteristic competitive conduct exhibited by local governments, which operate within the competitive framework of either a race to the bottom, a race to the top, or a coexistence of both races, variations arise in the outcomes on the transfer of environmental pollution impacts. Hence, it is imperative to elucidate the causal correlation between environmental regulation and the transfer of pollution within basins. This is crucial to validate diverse theories and engage in comprehensive discussions regarding environmental regulations’ temporal and spatial ramifications.
The purpose of this study is to provide the theoretical basis of the “pollution refuge” hypothesis under environmental regulations, to discuss the mechanism of environmental regulations on local and neighboring water pollution, and to empirically analyze the spatial effect of environmental regulations on water pollution control in China.

2. Methodology and Materials

2.1. Background and Analytical Framework

Decision makers in the industrial sector typically aim to achieve optimal outputs and minimize inputs while utilizing water resources and emissions of wastewater. Consequently, evaluating water systems’ efficiency in industrial production necessitates considering minimizing inputs and maximizing outputs. Generating economic benefits within the industrial sector involves utilizing water resources and releasing pollutants. It is necessary to decrease the discharge of pollutants, which may potentially result in a reduction in economic outputs or the incorporation of additional input elements [37]. Environmental regulations refer to the governmental implementations of environmental standards and other mechanisms to address the adverse effects of industrial production and water usage practices, such as negative externalities and market imperfections [38]. Its objective is to transform the discharge of industrial wastewater and the impact on water environments from being merely guided by “soft constraints” to being strictly enforced as “hard constraints”. In the context of industrial production, implementing rigorous and suitable regulations can effectively steer technical advancements and perhaps improve the economic performance of firms. Consequently, it becomes imperative to incorporate environmental regulatory components into water pollution management to explore their impact in greater detail.
According to Bian [39] and Wang et al. [
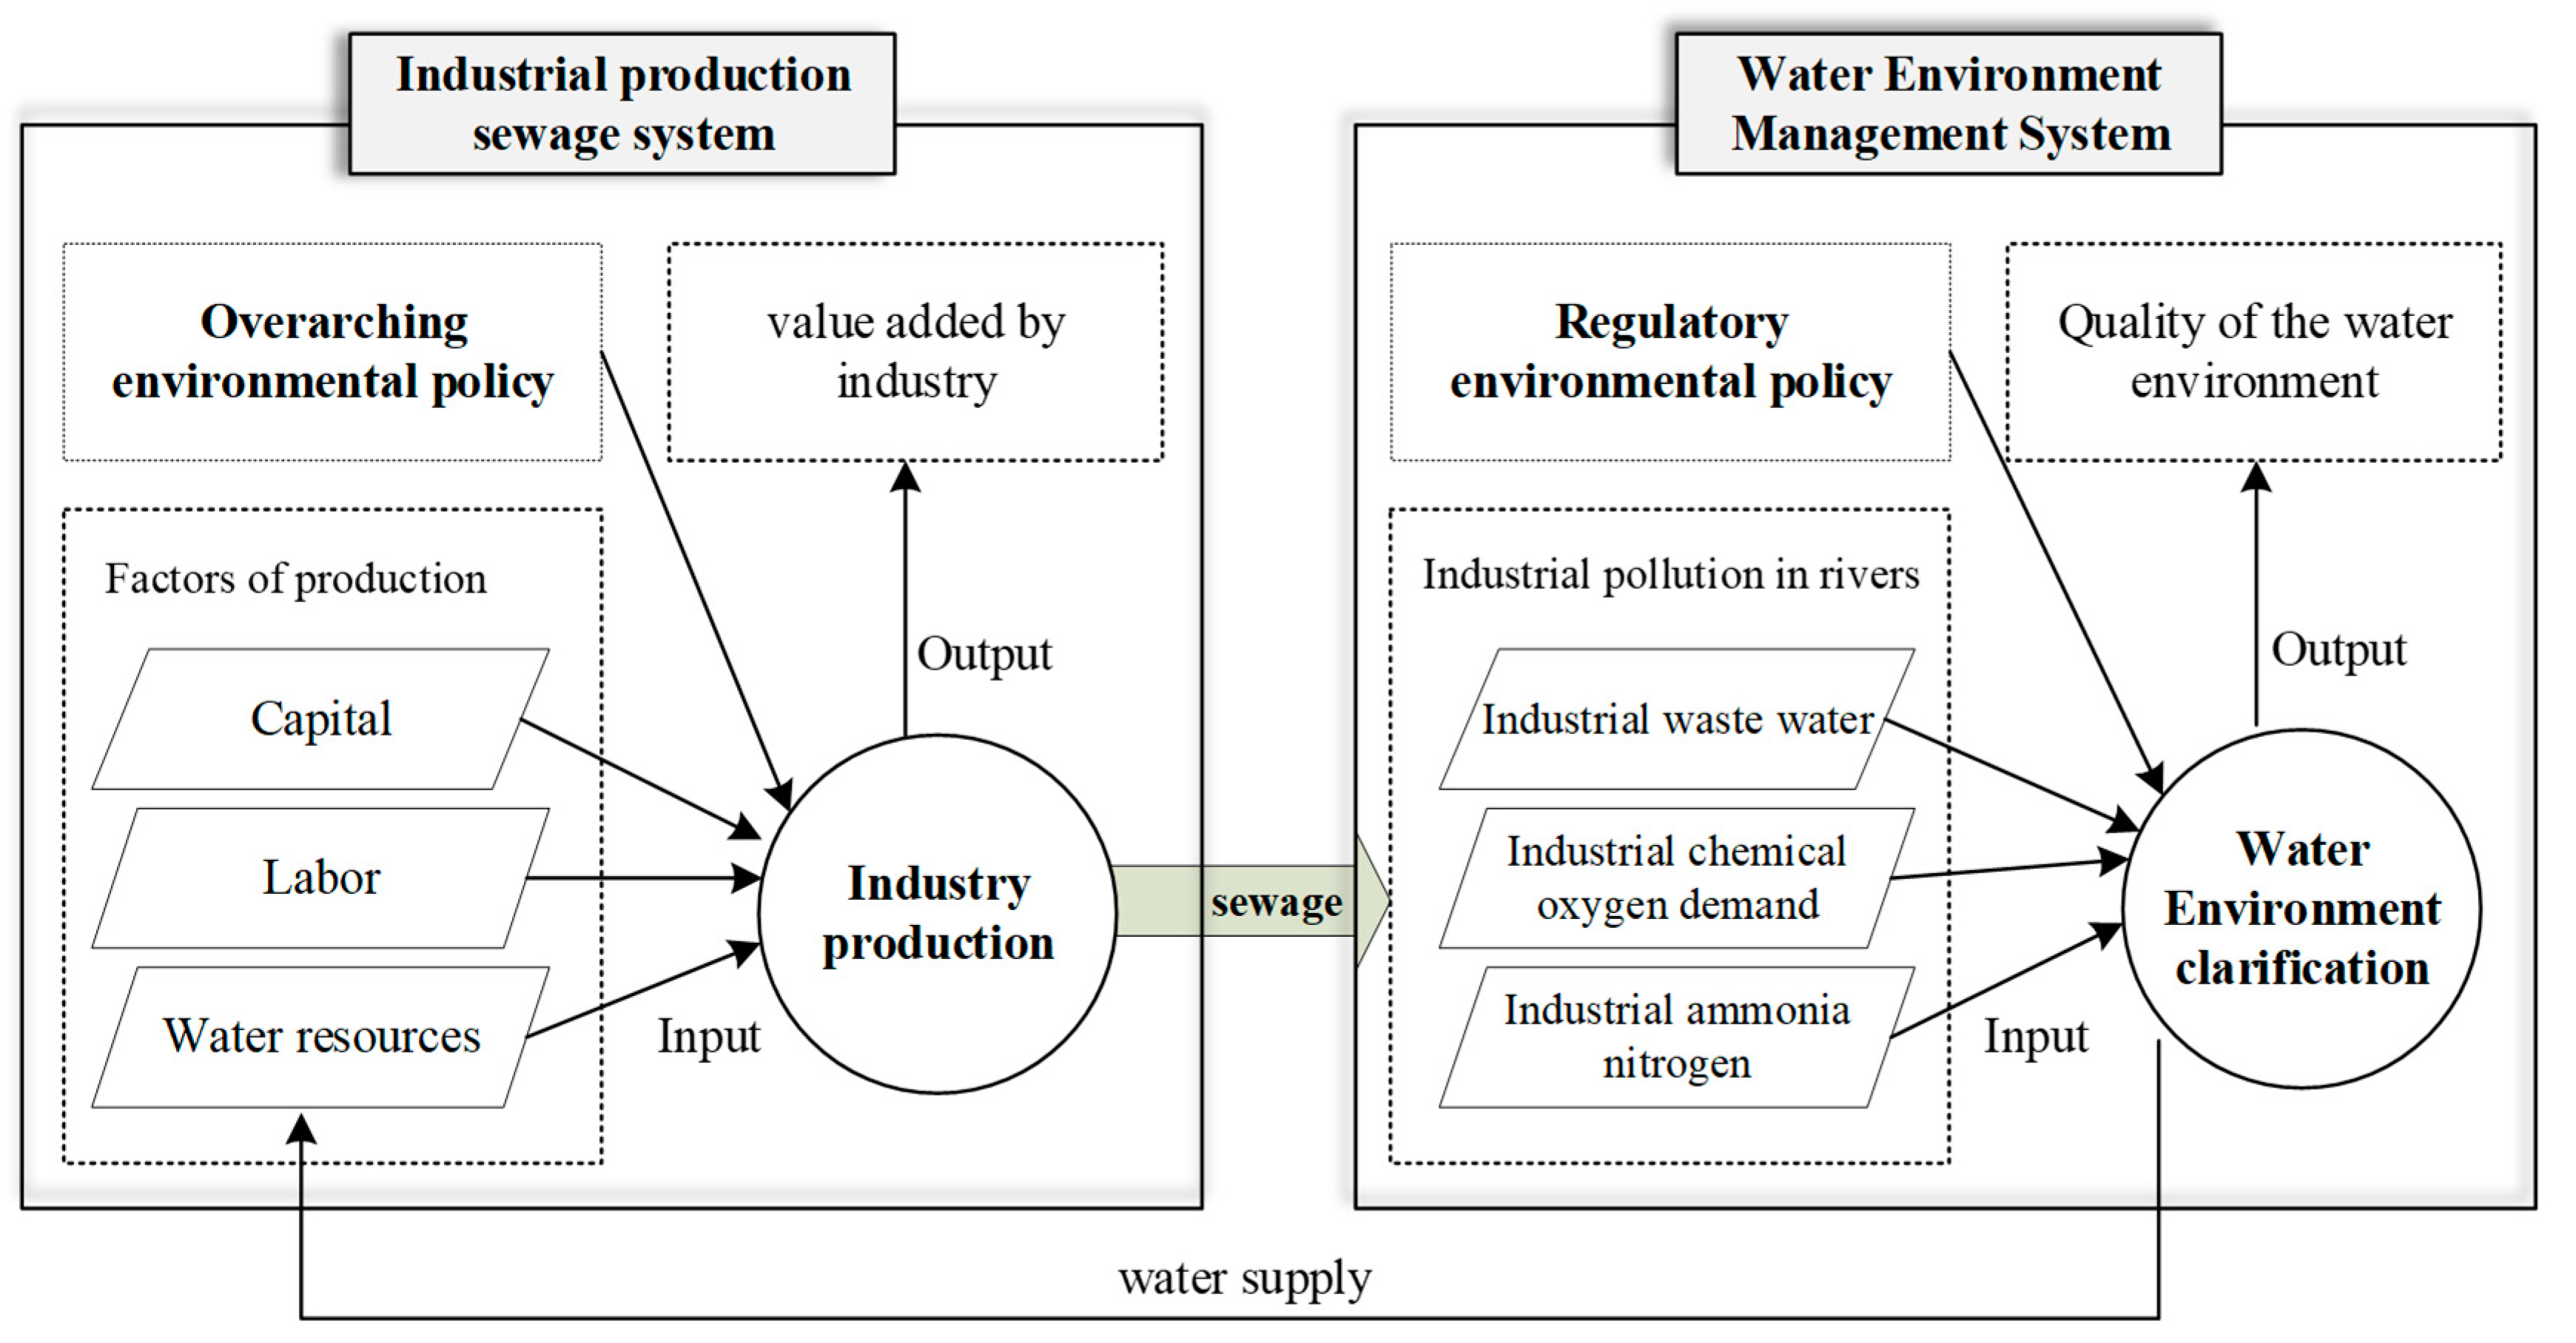
40], the industrial production system can be categorized into two subsystems: (pollutant) production and pollutant governance. These two subsystems engage in a game-like interaction, and the researchers have put forth a two-stage water recycling efficiency evaluation method grounded in addressing pollutant governance characteristics. From an environmental governance standpoint, conducting a comprehensive study on the systematic evaluation of the governance efficiency of water pollution in industrial production is valuable. This evaluation should be approached rationally, considering the execution of environmental regulations and procedures. Hence, by integrating factors such as the treatability of pollutants and the consideration of environmental regulations, the water pollution system in the industrial sector is divided into two subsystems: the industrial production sewage system and the water environmental governance system. The diagram in Figure 1 illustrates these two subsystems’ fundamental structure and elemental flow status. One of the critical areas of focus is regulating industrial production sewage systems. This pertains to the policies implemented to control the overall volume of industrial pollution released during production. Such regulations effectively limit the intensity of sewage discharge and can even reduce emissions. The water environment governance system is influenced by a different type of environmental regulation known as control type. This regulation corresponds to the governance process that occurs after the pollution is discharged, and it encompasses two main components: the governance of water pollutants that have been discharged and the monitoring of the water environment system. This particular form of environmental regulation pertains to the process of post-discharge governance, which encompasses the governance of contaminants in discharged water and the monitoring of the water environment system. These measures collectively aim to enhance the quality of the water environment.
Industrial wastewater is a significant contributor to water pollution in basin ecosystems, characterized by high volume discharges, extensive spatial distribution, diverse chemical compositions, and inherent challenges in purification processes. The movement of water pollutants across river basins is closely associated with the migratory patterns of industrial companies, which can be broadly categorized into two modes: overall transfer and local transfer. Regardless of the specific type of migration, it is commonly seen that such movements result in incremental transfer, wherein new investments in the region and the subsequent establishment of production capacity contribute to further pollution. Given the presence of regional protectionist measures, the frequency of enterprise transfers on a broader scale is reduced, leading to a more prevalent trend of localized migration. When polluting enterprises operate in regions characterized by stringent environmental regulations, particularly when they confront the prospect of closure and cessation of operations, they tend to relocate en masse to areas with lower production and environmental expenses. This relocation is mainly observed in sites that have already established favorable cooperative associations [41]. In the case of the water environment protection of the Yangtze River, Xingfa Group, a prominent player in the fine phosphorus chemical industry, has spearheaded an effort to address the issue of outdated production capacity, promote clean production practices, and strengthen the construction capabilities related to ecological environment protection. This initiative has resulted in the coordinated evacuation, land governance, and shoreline clearance of 134 chemical enterprises in Yichang. These enterprises have undergone a shutdown, reform, relocation, and transfer process, thereby initiating chemical enterprises’ relocation, remediation, and transformation along the Yangtze River [42]. Despite being costly and potentially detrimental to the sustainable development of enterprises, the overall transfer mode remains suitable for enterprises with substantial capital, specialized expertise, and robust social network capabilities. This mode facilitates the transition of water-polluting enterprises towards high-end, recycling-oriented, and environmentally friendly development while aiding in managing water environment pollution at relocation sites.
Localized transfer has become a prevalent method of relocating highly polluting activities, primarily through developing production bases and outsourcing industrial processes. The establishment of production bases can serve as an effective measure to prevent the unauthorized disclosure of vital information within enterprises. Additionally, it offers the opportunity to establish proximity to the source of raw materials, resulting in cost savings in transportation and transaction expenses. Furthermore, maintaining a connection with the local area enables the continuation of the industrial chain despite the potential challenges posed by the environmental system. This strategic approach aligns with market demands and enhances enterprises’ competitiveness [43]. In addition to other considerations, conglomerates may be responsible for fulfilling supply contracts that necessitate delivering a predetermined number of items to the purchaser. This arrangement establishes a consistent demand for the conglomerate’s products [44].
Consequently, conglomerates are inclined to embrace a strategy wherein they establish production bases within a specific sub-region. This involves the establishment of multiple subsidiaries or branch factories and relocating pollution-intensive aspects of the production process. Such relocation is facilitated by providing various resources, including capital, technology, and managerial personnel. The primary objectives of this approach are to secure subsidies for the new location and to mitigate cost-related losses [45]. Based on statistical data, it was observed that, in 2005, Ji’an in Jiangxi Province housed a collective of 41 paper enterprises. Approximately 60% of these enterprises originated from Zhejiang and Fujian Provinces. Many of these enterprises hailed from the renowned small chemical aggregation in Quzhou City, Zhejiang Province. Furthermore, it was observed that most of these enterprises were situated in economically developed regions that explicitly prohibited water pollution activities. Indeed, it is worth noting that certain enterprises opt for mergers and acquisitions or acquisitions as a means of relocation. This behavior is typically observed among economically robust enterprises with ample production resources. This approach applies to green mergers and acquisitions prioritizing energy conservation and emission reduction technologies. Such endeavors are well-suited for facilitating the transition towards industries characterized by a low pollution and energy consumption [46].
Moreover, outsourcing production processes overcome the resource constraints confronted by individual enterprises. This practice enhances specialized production, facilitates productivity and cost savings, and enables faster market entry and optimal resource allocation [47]. Additionally, outsourcing transfers places the pollution burden onto other enterprises, reducing the costs associated with relocating or establishing a production base. It also allows for maintaining connections with the local industry, transforming the enterprise’s image, and enhancing its competitiveness [48]. Hence, outsourcing production processes is deemed more appropriate for relocating contaminated production connections rather than essential sectors to mitigate concerns regarding product quality and asymmetric supply and demand information. The economic development in China’s eastern and western regions exhibits an imbalance, characterized by the eastern region being akin to a “cage for birds” while the central and western regions persistently foster investments. In response to enterprises’ water pollution challenges in the eastern region, partnerships are sought with counterparts in the central and western regions. Furthermore, the central and western regions are responsible for undertaking production activities associated with higher levels of pollution [49]. For instance, the Jiangxi Province accommodates numerous plastic pellet processing factories supplying raw materials to companies along the coast. However, providing clean raw materials is limited to firms in the eastern region, while water environmental contamination persists in the central and western regions.
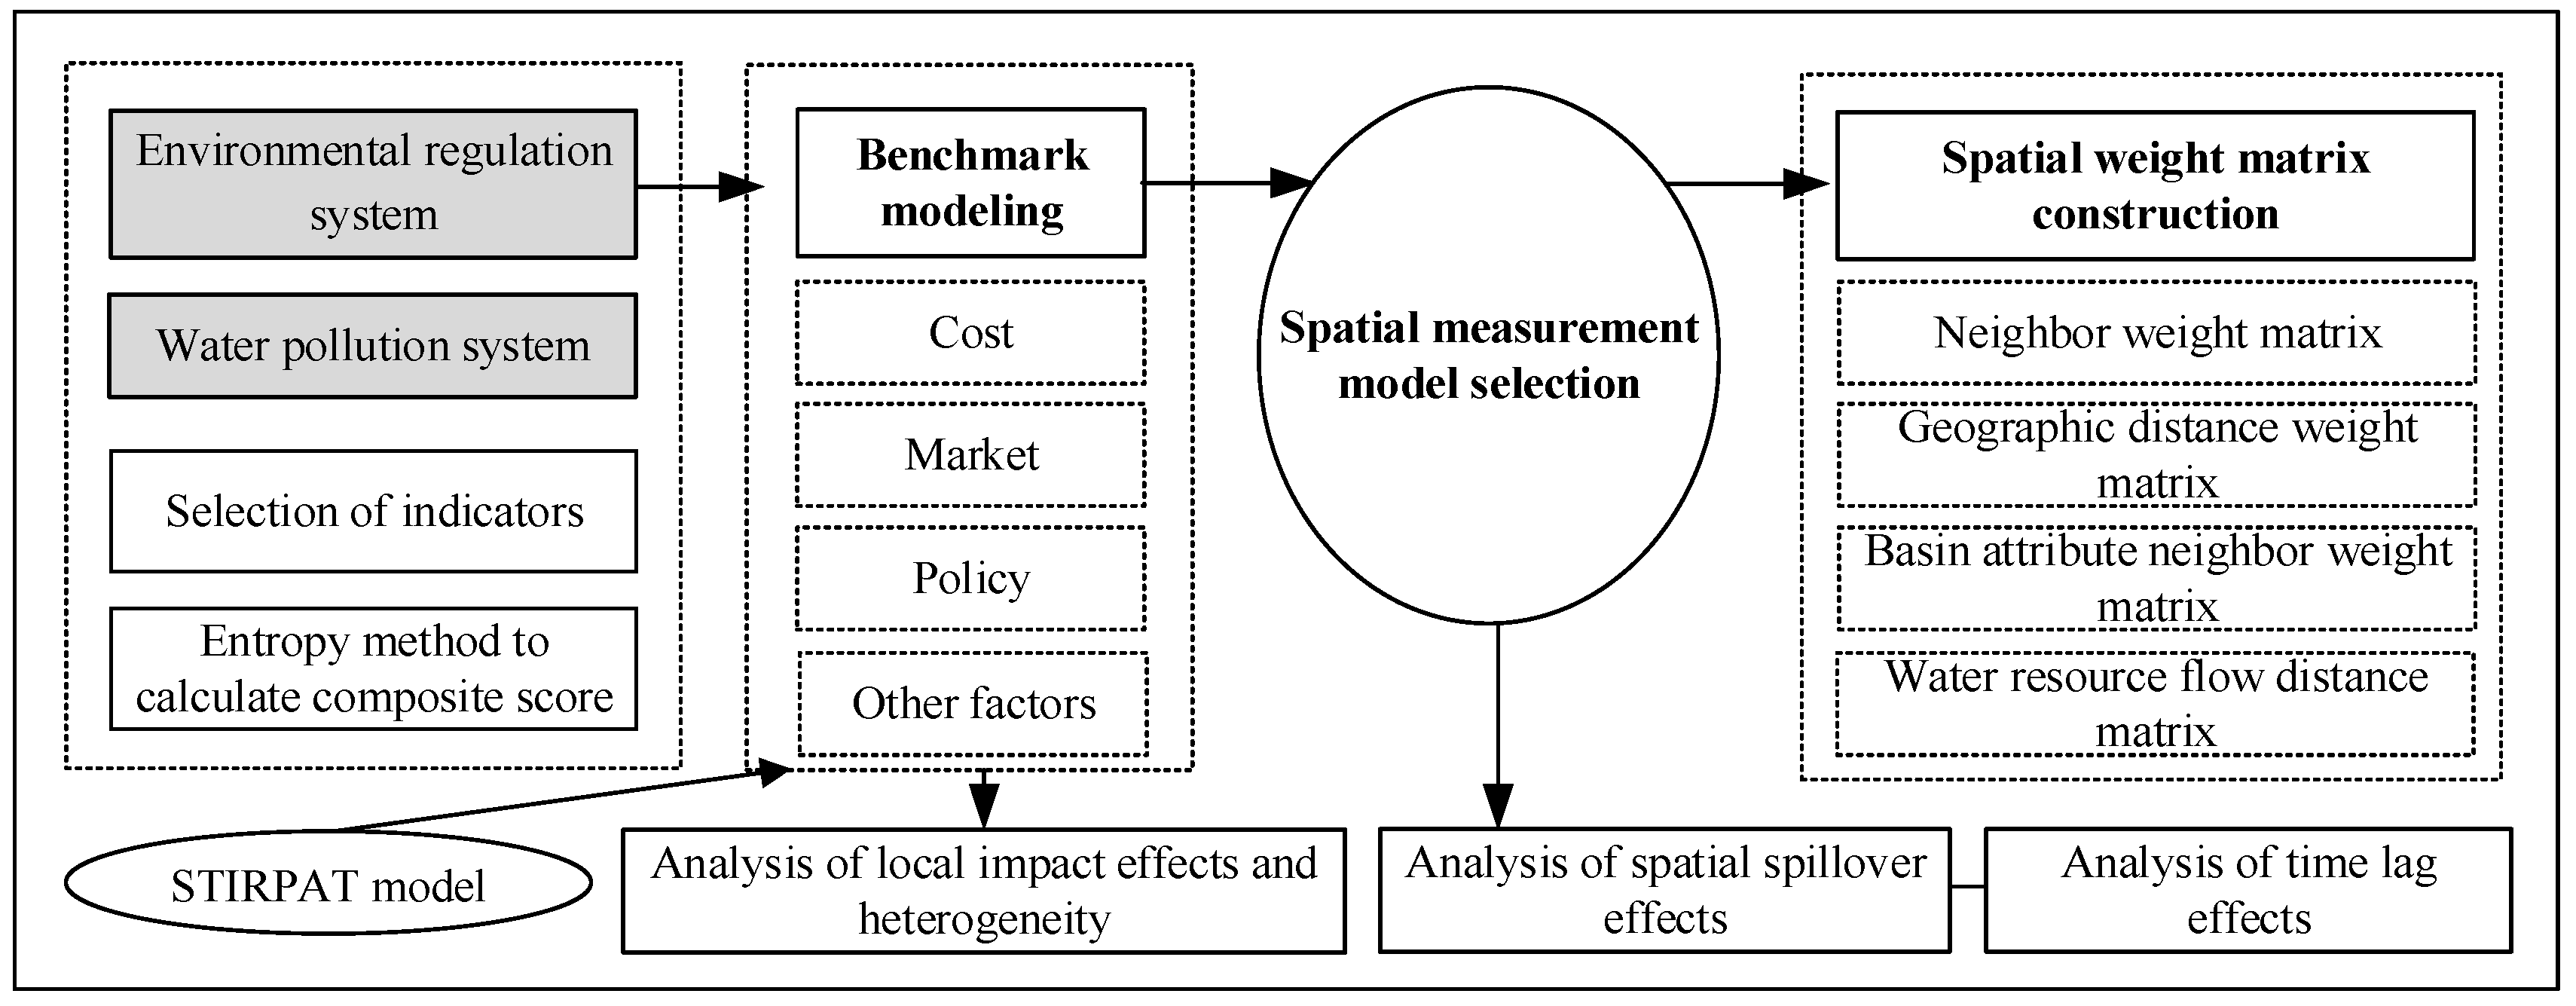
Based on the above background and theoretical mechanism, this research work firstly constructs the environmental regulation system and the water environment pollution system and calculates their composite indices. Secondly, it constructs the baseline model and the spatial measurement model. Finally, it analyzes the local impacts and heterogeneity, the spatial spillover effects, and the time lag effects of the environmental regulation, respectively. To facilitate readers’ understanding, this study provides a flowchart to demonstrate the analytical framework of this paper (Figure 2).

2.2. Model Specification

China’s current environmental regulatory policies are mainly command-and-control [50], with the government as the policy maker and implementer. In order to achieve the purpose of water pollution regulation in river basins, combined with the five-phase plan of China’s key river basins as sorted out by Xu et al. [51], we must focus on the relevant policies to achieve the mandatory means of regulation to reduce the water environments pollution, the inputs in the process of regulation as the entry point, and determine the total amount (R1), quality (R2), project (R3), and governance (R4)— the four types of regulation categories—to achieve the goal of “four-in-one” whole-process prevention and control of water pollution in river basins. The four regulatory categories of overall amount (R1), quality (R2), project (R3), and governance (R4) were identified to realize the “four-in-one” technological route for the prevention and control of water pollution (Table 1). In each phase of the primary river basin planning text, R1 is expressed as the total amount of control target of the river basin decomposed to the relevant areas. R2 is the supporting regulatory measure to realize the water quality target of the river basin section. R3 is expressed as the environmental protection projects set up at different stages to implement the tasks of the river basin planning. R4 is the investment and supporting facilities for implementing wastewater governance by the government and enterprises. Simultaneously, regarding the design principles of some existing water environment regulation indicators, the basin environmental regulation system was finalized, covering eight specific indicators (Table 1), all of which are positive indicators, i.e., the higher the value indicates, the higher the intensity of regulation. The basin water environment pollution system (Table 2) was established from the scale of water pollution and water environment quality level, including industrial wastewater discharge and six indicators.
Basin and water environmental pollution systems are two composite systems, consisting of n and m elements, respectively. It is assumed that REG = f(xit,1, xit,2, …, xit,j) and WPS = f(yit,1, yit,2, …, yit,k). It means that xit,j denotes the value of ordinal covariates for the jth indicator of the ith region of environmental regulation in the year t, and yit,k denotes the value of ordinal covariates for the kth indicator of the ith region of water environment pollution in the year t (j = 1, …, m; k = 1, …, n). The entropy weighting method is used to assign weights to the two types of indicator systems. Among them, the environmental regulation indicators are positive efficacy indicators, and the higher their values are, the higher the order of the system is. While the water pollution indicators are negative efficacy indicators, the higher their value, the lower the system order. Therefore, the above two indicators are standardized as positive efficacy indicators. For each of the two types of indicators, they are treated as follows:
x ˜ i t , j = x i t , j min j { x i t , j } max j { x i t , j } min j { x i t , j } + c
y ˜ i t , k = max k { y i t , k } y i t , k max k { y i t , k } min k { y i t , k } + c
The value of c is set to 0.01, and, after processing, both types of indicators are positive efficacy indicators. The information entropy and redundancy of the jth indicator of environmental regulation and the kth indicator of water environment pollution are further measured, and the specific weights wj and wk are calculated according to the redundancy of information entropy. The multiple linear weighting method is used to integrate and obtain the comprehensive score of the orderliness of environmental regulation and water environment pollution system as follows:
R E G i t = j = 1 m w j x ˜ i t , j
W P S i t = k = 1 n w k y ˜ i t , k
Referring to the stochastic environmental impact assessment model (STIRPAT model) proposed by York et al. [52], combined with the idea of environmental Kuznets, the squared term is introduced to reflect the nonlinear relationship with environmental pollution, and the model for the baseline regression model is obtained as follows:
ln I i t = α 1 ln I i , t - 1 + α 2 ln R E G i t 2 + α 3 ln R E G i t + α 4 ln A i t 2 + α 5 ln A i t + α 6 ln X i t + μ i t
where environmental regulation (REG) is the primary explanatory variable. αn is the coefficient of each parameter. lnRit is the intensity of environmental regulation in region i in year t. lnXit is the social and natural driver. Due to the dynamic evolution characteristics of water environment pollution, the time-lag terms Ii,t−1, and Iit are the indicators of water environment pollution, respectively. Ait is the affluence level, generally expressed by GDP per capita. μit is the random perturbation term.
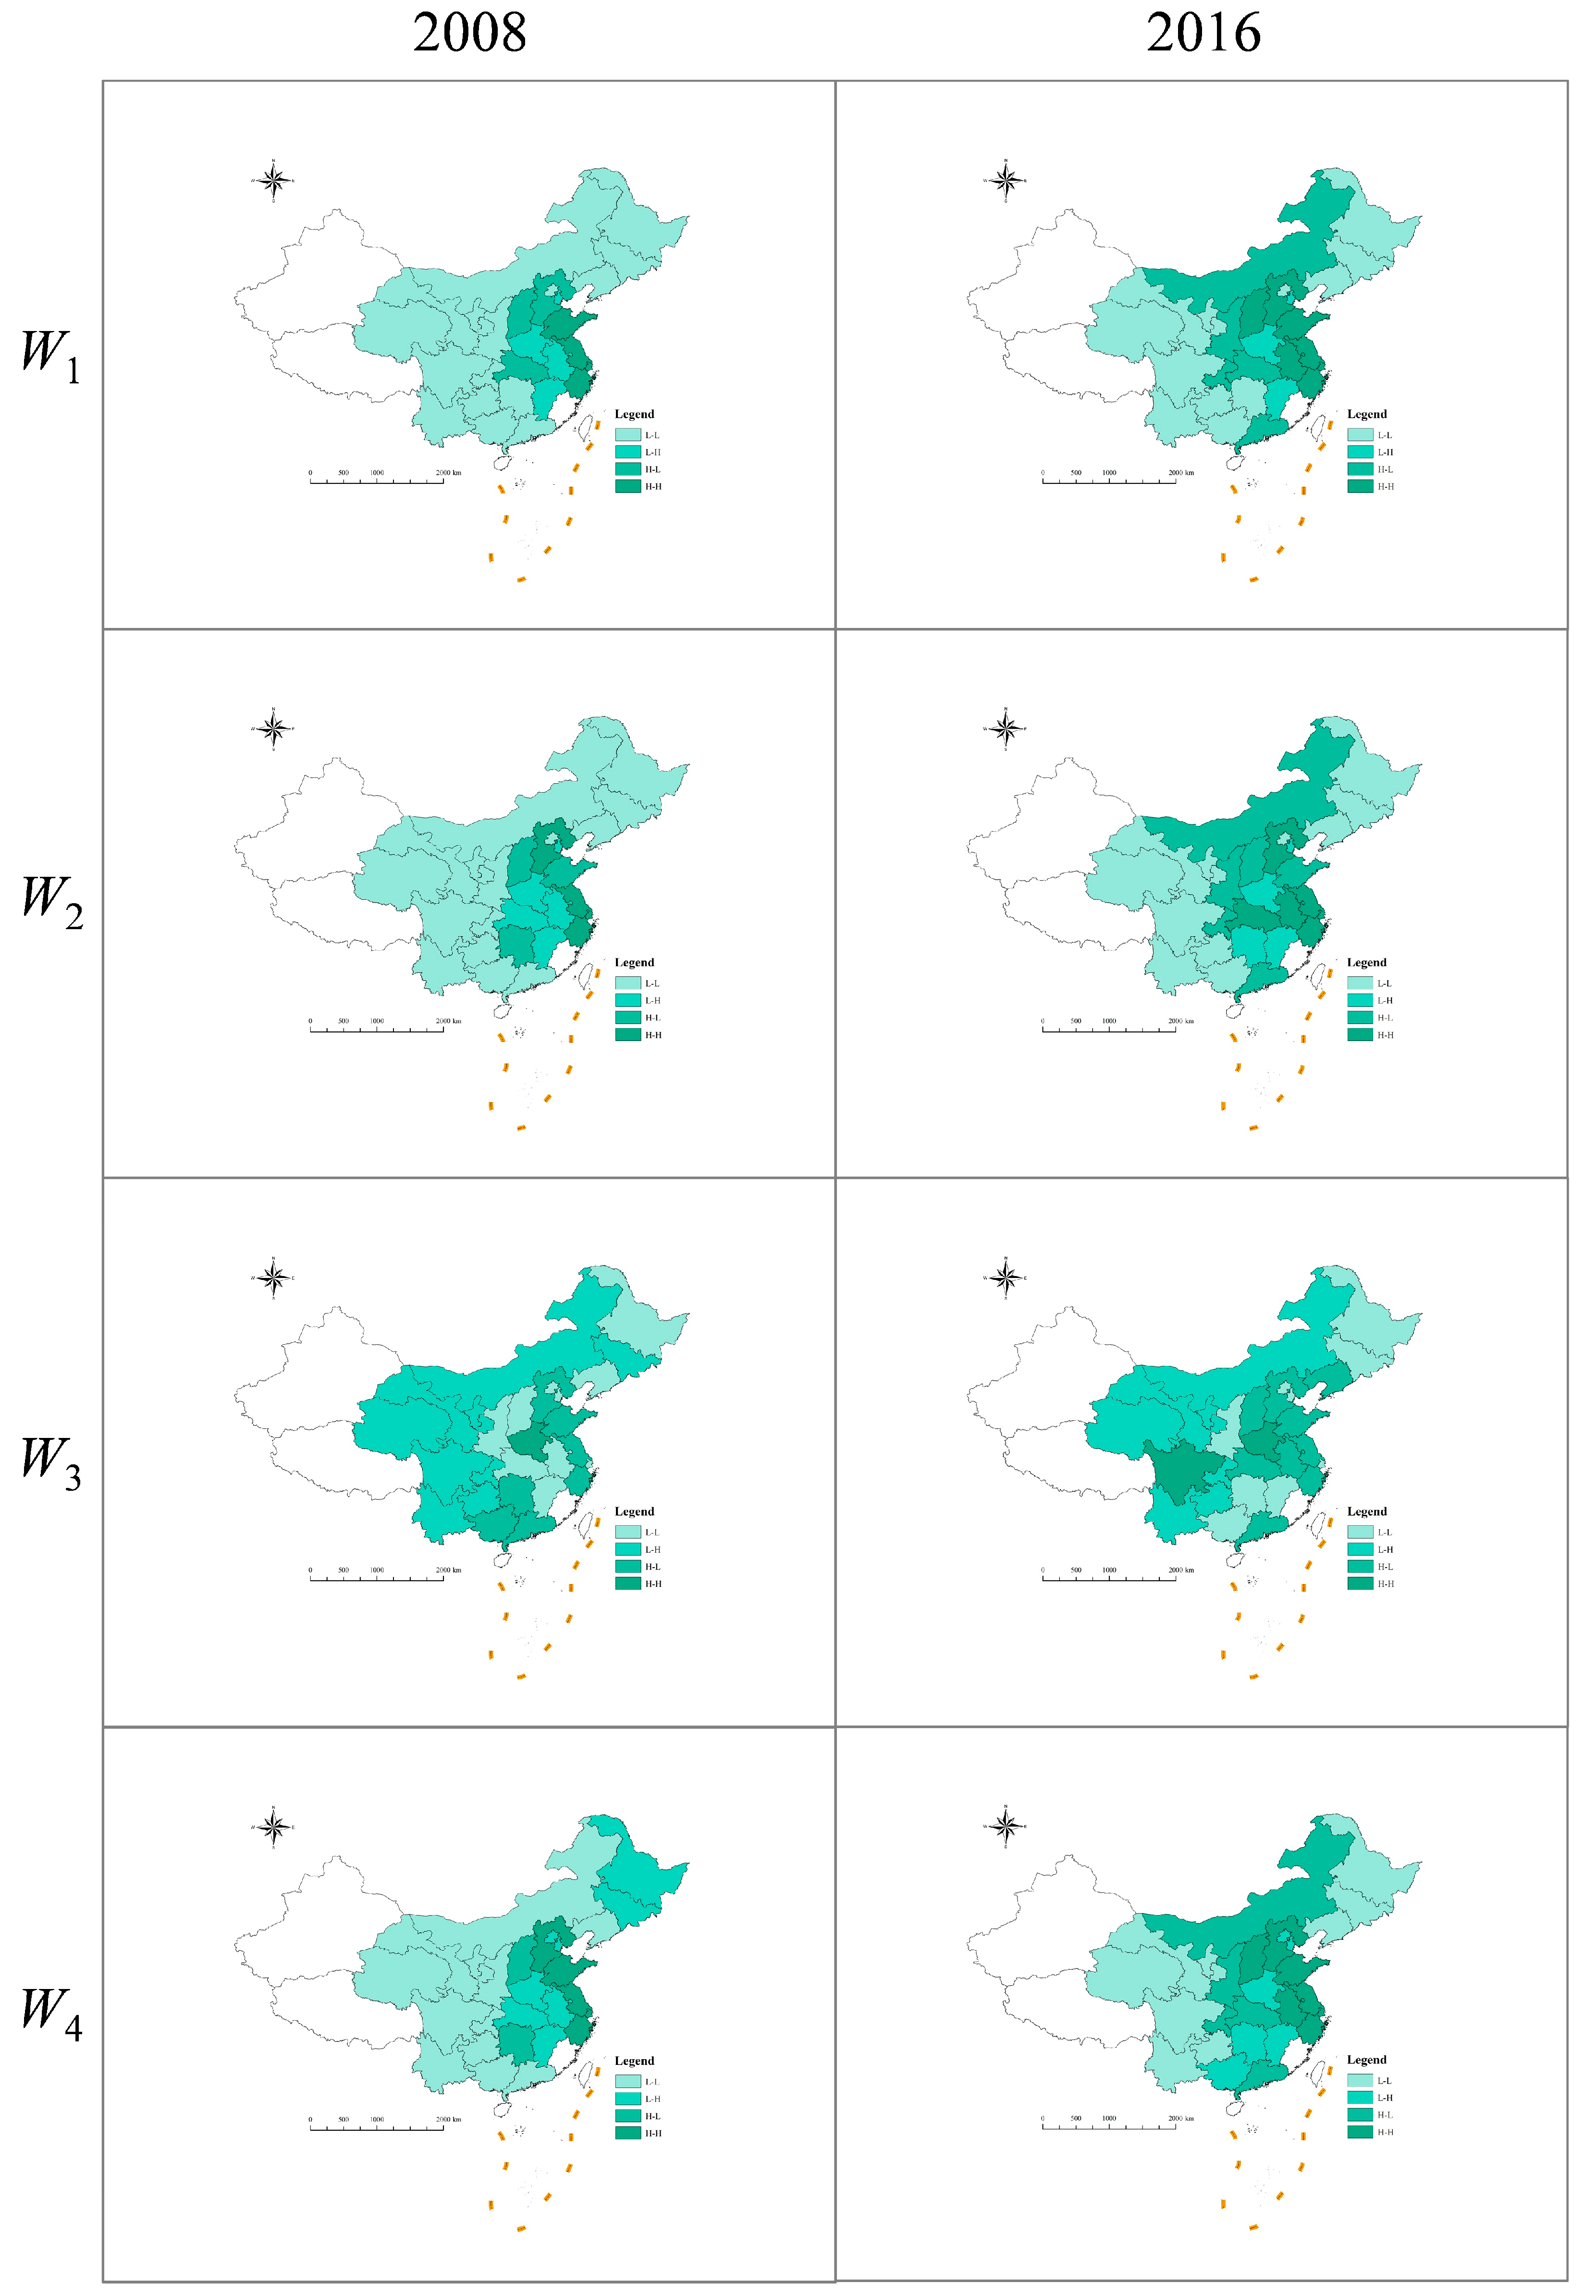
This study’s spatial weight matrix (Wij) includes the neighbor weight matrix (W1), geographic distance weight matrix (W2), basin attribute neighbor weight matrix (W3), and water resource flow distance matrix (W4). Among them, W1 is used when there is a common boundary between areas i and j in the basin. Then, wij takes the value of 1, and the absence of which takes the value of 0. The W2 is the reciprocal of the distance (dij) between the center locations of areas i and j within the basin. dij was obtained using GeoDa 1.22 measurements based on electronic maps provided by the China National Geographic Information System website. W3 is based on W1, which treats the midstream and downstream provinces as one. There is no correlation between the midstream and downstream provinces (thus, it takes the value of 0), while the upstream provinces are judged to be spatially adjacent to the midstream and downstream provinces and take the value of 1. W4 is based on the W2, emphasizing the differences in water resource endowment and geographic location. W4 is built around the primary form of the gravity model, in which the regional water resource endowment is expressed in terms of total water resources per capita (PW) as follows:
w i j = { P W i × P W j d i j i j 0 i = j
Due to the influence of spatial diffusion, the environmental regulations and water pollution data among basin regions are no longer independent. After selecting the appropriate spatial weight matrix, in order to better judge the degree of spatial correlation between regions, the global spatial autocorrelation (GSA) and local spatial autocorrelation (LSA) were used to quantitatively explore the spatial distribution characteristics of environmental regulations and water environmental pollution. According to the different ways of reflecting spatial effects, there are three forms of widely used spatial measurement models, namely the Spatial Autoregressive Model (SAR), Spatial Error Model (SEM), and Spatial Dubin Model (SDM). According to Anselin [53], the SAR model is applicable when the spatial dependence between variables is critical to the model and leads to spatial correlation; the SEM model is mainly applied when the error terms of the model exhibit spatial correlation; and the SDM model, which is more explanatory, not only measures the effect of changes in the explanatory variables on the self but also performs better estimates on the direct and indirect effects on the neighboring areas. The SDM model can measure the effect of changes in the explanatory variables on itself and better estimate the direct and indirect effects on neighboring areas. The SAR, SEM, and SDM spatial spillover models corresponding to the environmental regulations on water pollution are as follows:
ln I i t = β ln I i , t 1 + η w i t ln I i t + α 1 ln R E G i t 2 + α 2 ln R E G i t + α 3 ln A i t 2 + α 4 ln A i t + α 5 ln X i t + μ i t
ln I i t = β ln I i , t 1 + λ w i t μ i t + α 1 ln R E G i t 2 + α 2 ln R E G i t + α 3 ln A i t 2 + α 4 ln A i t + α 5 ln X i t + ε i t
ln I i t = β ln I i , t 1 + η w i t ln I j t + α 1 ln R E G i t 2 + α 2 ln R E G i t + α 3 ln A i t 2 + α 4 ln A i t + α 5 ln X i t + θ 1 w i j ln R E G i j + θ 2 w i j ln A i j + θ 3 w i j ln X i j + μ i + λ t + ε i t
where η is the impact of spatially correlated region’s water environment pollution on local water environment pollution. λ is the impact of spatially correlated region’s error shock about water environment pollution on local water environment pollution. θ is the impact of the spatially correlated region’s explanatory variables on local water environment pollution, and the rest of the indexes are the same as in Equation (5). All the above models calculate the spatial correlation from the entire domain, and (if the ordinary least squares method is still used for estimation) the results may be biased with endogeneity problems. Moreover, even if they are unbiased, they are not valid. In this case, the spatial panel excellent likelihood method proposed by Elhorst [54] is used for estimation.

2.3. Study Area and Data Sources

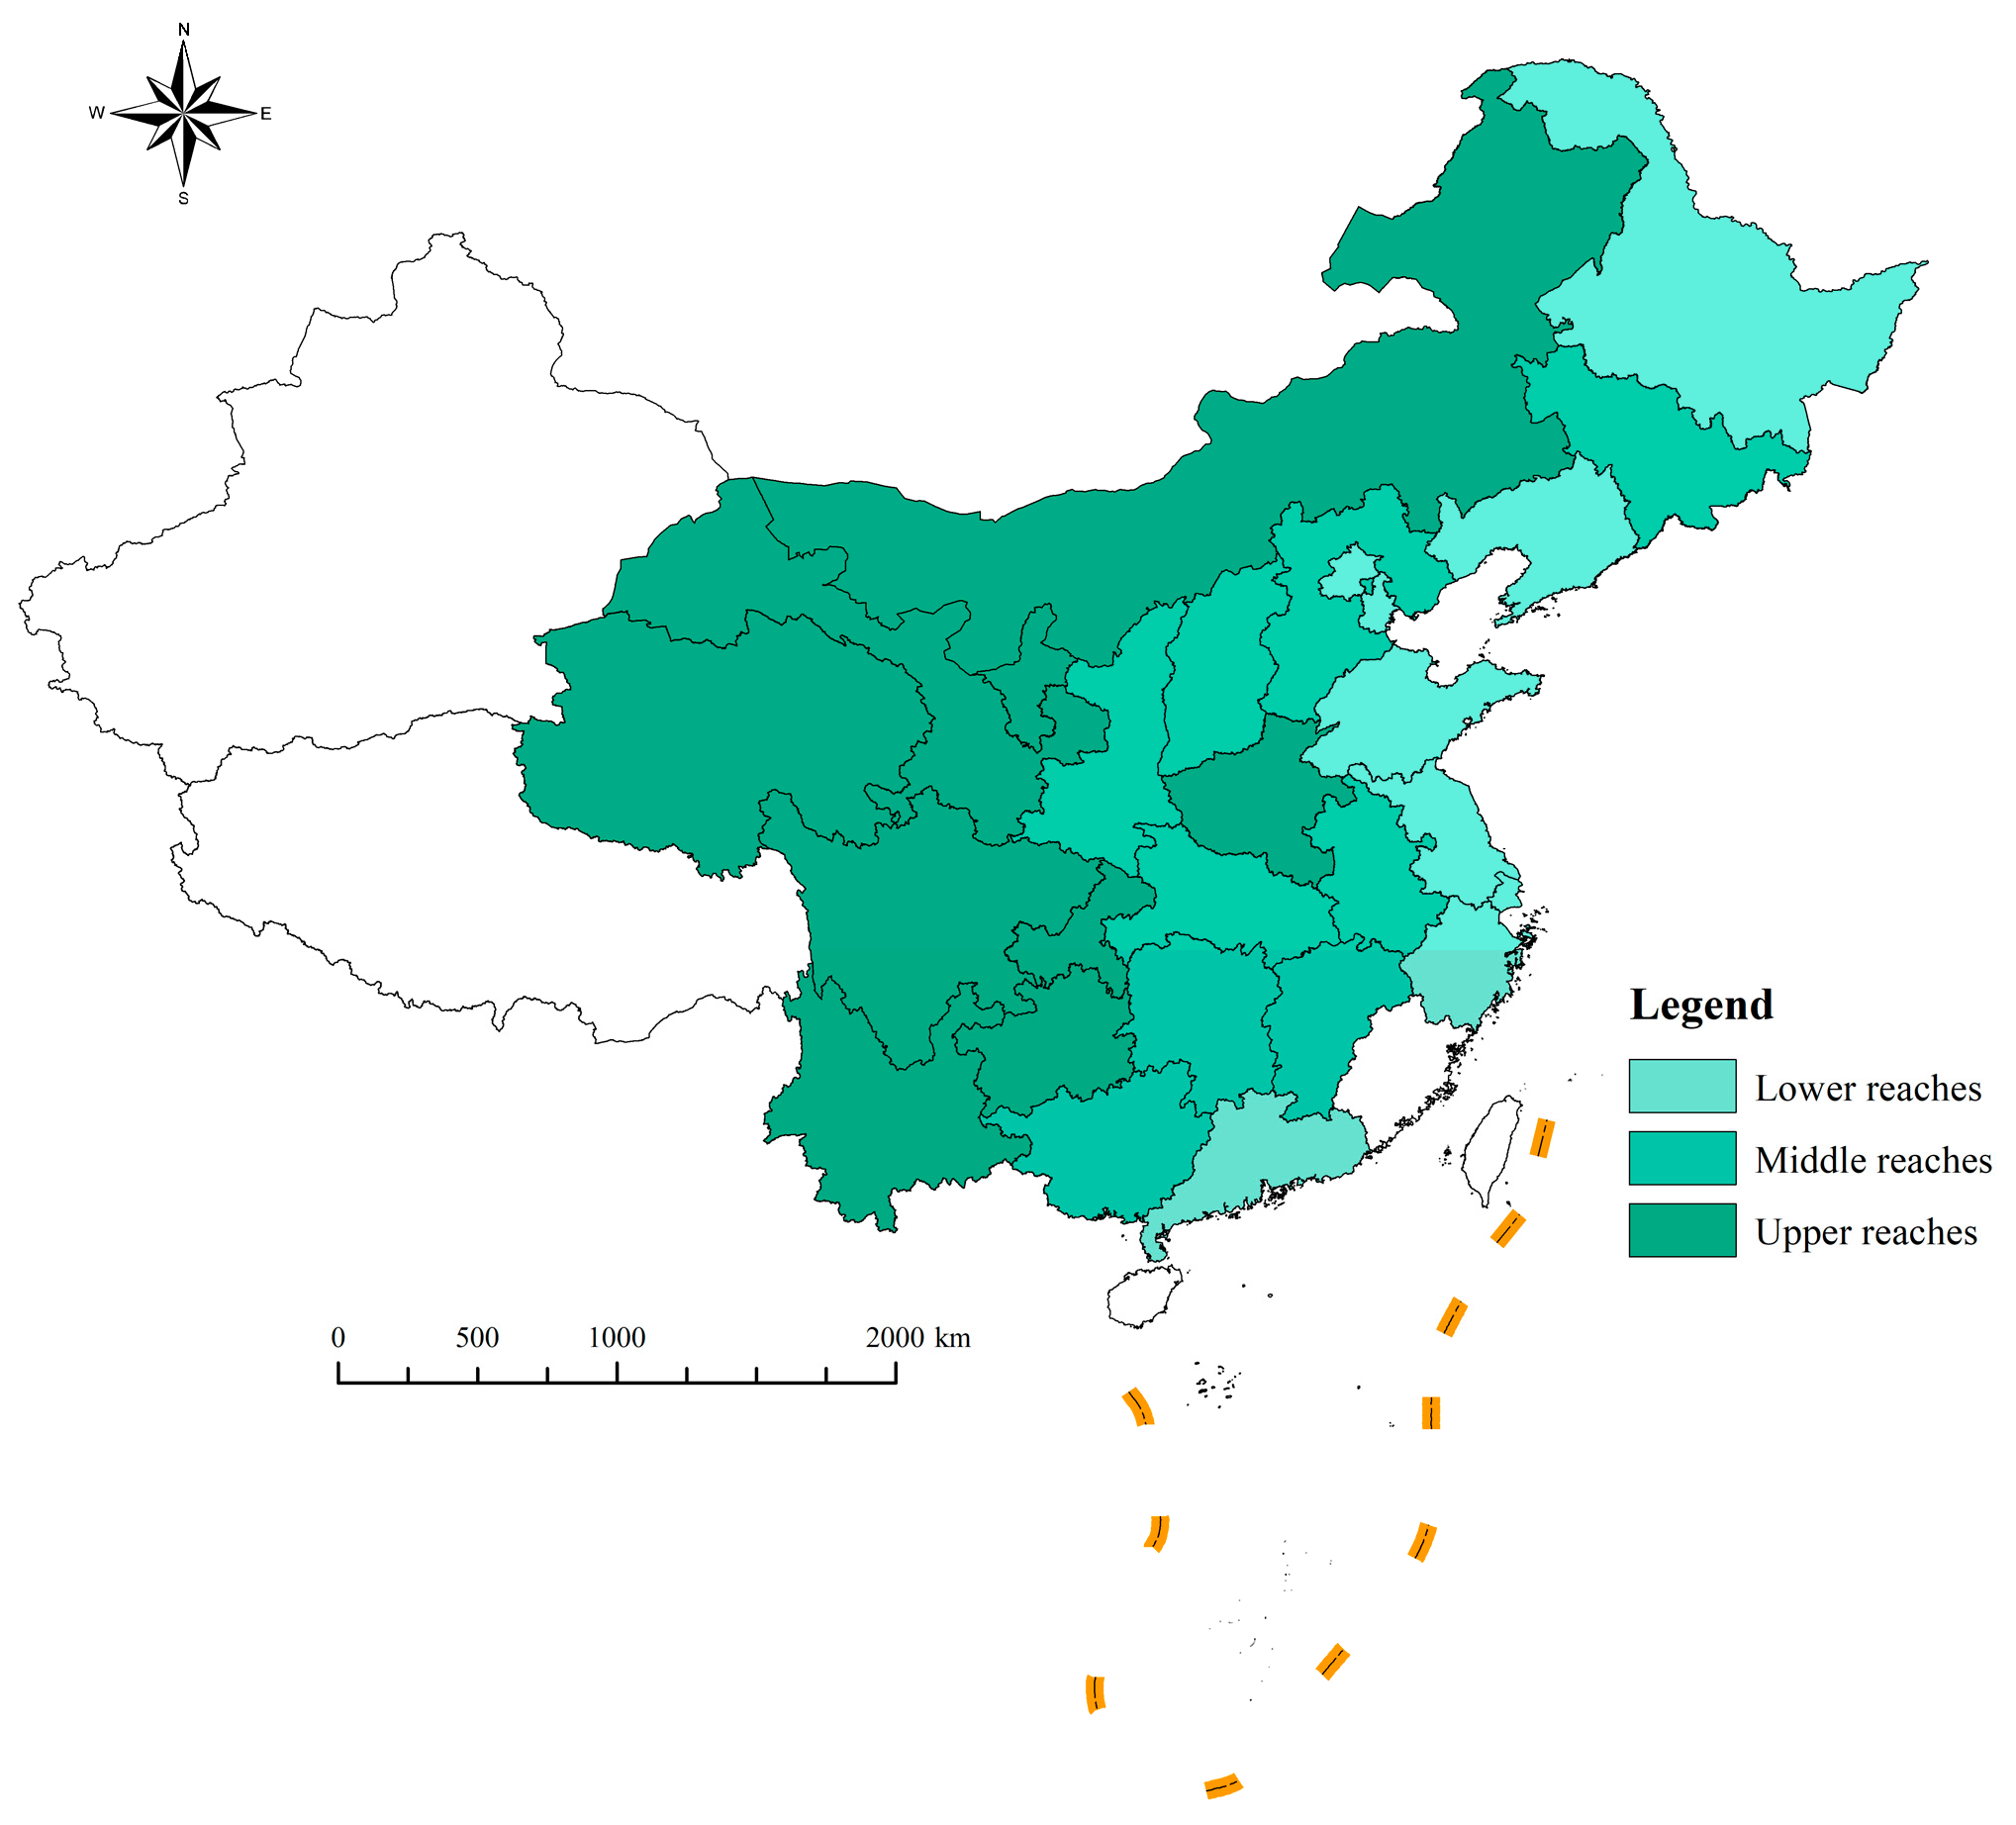
According to the comprehensive basin planning objects issued by the Ministry of Water Resources of China and the State Council, the key basins include the seven major basins of the Yangtze River, the Yellow River, the Pearl River, the Huaihe River, the Haihe River, the Liaohe River, and the Songhua River. These key basins constitute more than 4.4 million square kilometers of the basin area of China, span across 27 provinces and municipal administrative districts (Figure 3), account for about 46% of China’s national land area, and contribute to China’s economy with a contribution of more than 55%. Thus, regarding geographic space, industrial structure, or economic development, the seven basins fulfill the requirements of representativeness and diversity for sample screening.
According to the data provided by the China Environmental Yearbook on industrial wastewater discharges in the basins in 2004 and based on Zeng’s [55] study, the absolute and relative discharges of different provinces are measured separately. The proportion of absolute discharges refers to the proportion of wastewater discharges of a province in the basin: it belongs to the proportion of the total discharges of the province. In contrast, the relative discharges refer to the proportion of the total discharges of the basin: it belongs to the proportion of provinces. Thus, the proportion of absolute and relative discharges will be calculated. Provinces with absolute and relative discharge shares above 1% are considered typical discharging provinces in the basin. Table 3 provides the typical discharging provinces in the seven major basins. The actual areas covered by the basins are more than the listed provinces; however, they are not included in the statistics because of their lower discharge values in the specified basins.
The emissions’ data of pollution sources discussed in this research have been sourced from the China Environmental Statistics Yearbook during the study period. These data encompass three indicators: industrial wastewater, industrial chemical oxygen demand, and industrial ammonia nitrogen emissions. The water quality data obtained from the Ministry of Ecology and Environment, as reported in the National Weekly Report on Automatic Water Quality Monitoring of Key Cross Sections in Major River Basins, was utilized to calculate the annual average values of water quality categories, specifically the permanganate index and ammonia nitrogen index, for the surface water monitoring sections across different regions within the basin. These calculations followed China’s “Environmental Quality Standards for Surface Waters” (GB 3838-2002) [56], and by using a single-factor approach to determine the water quality category. The water quality category is represented by a cross section ranging from Ⅰ to V, with V indicating poor water quality. The numerical values 1–6 correspond to the water quality categories, with higher values indicating worse environmental water quality. The industrial value-added data in “China’s Industrial Statistics Yearbook” encompass the above-scale industrial enterprises. The term “above-scale” refers to industrial enterprises with an annual income from their main business of CNY 5 million or more, starting from 2007. However, as of 2011, the threshold for above-scale enterprises was increased to CNY 20 million. The gross regional product and total regional population data are sourced from the China Statistical Yearbook of the preceding years.
The data on environmental regulation indicators are derived from various policy documents. For instance, the total emission control of chemical oxygen demand and ammonia nitrogen is obtained from the Approval of the National Plan for the Control of the Total Emission of Major Pollutants during the 11th Five-Year Plan Period. Additionally, the Circular on the Issuance of a Comprehensive Work Program for Energy Conservation and Emission Reduction during the 12th Five-Year Plan, as well as the Circular on the Issuance of a Comprehensive Work Program for Energy Conservation and Emission Reduction during the 13th Five-Year Plan, also contribute to the collection of the relevant data. The evaluation of these indicators aligns with the Five-Year Plan, wherein a goal value for assessment is upheld every five years. The assessment targets of Qinghai Province during the Eleventh and Twelfth Five-Year Plan periods were deemed unsatisfactory in terms of meeting the fundamental criteria of input indicators. Consequently, these assessment targets did not exhibit positive outcomes. Hence, the updated estimation for the aggregate control targets in Qinghai Province during the “11th Five-Year Plan” and “12th Five-Year Plan” is 0.001 million tons. The data of additional indicators of environmental regulation are sourced from diverse statistical yearbooks. For instance, the surface water environmental monitoring sections of the China Environmental Yearbook provide information on this aspect. Furthermore, the China Environmental Statistical Yearbook offers data on the number of industrial wastewater governance facilities and the corresponding investment in industrial wastewater governance projects. The water resource components utilized in this study are derived from the China Environmental Statistics Yearbook. These components encompass industrial water consumption and the aggregate volume of water resources available.
The count of primary monitoring enterprises in the water environment is determined by referencing the roster of national primary monitoring enterprises released by the former Ministry of Environmental Protection. Additionally, it incorporates fundamental data on primary pollution sources furnished by regional ecological and environmental protection agencies. The data regarding the investment in environmental protection for projects subject to the environmental impact assessment system and the investment in environmental protection works for projects implementing the “Three Simultaneities” policy were sourced from previous editions of the China Environmental Yearbook. The above section demonstrates that other environmental control elements and water contamination indicators align with the earlier findings. This study’s average annual rainfall and average temperature data were sourced from reputable publications, namely the China Water Conservancy Statistical Yearbook and the China Meteorological Yearbook. Additionally, supplementary data of other influencing elements were obtained from the China Statistical Yearbook and the statistical yearbooks specific to each province. Foreign capital invested in the region is changed to Chinese CNY using the annual average exchange rate. Similarly, the regional GDP is converted to constant prices using the deflator, with the base period being 2000.

3. Results and Analysis

3.1. Measurement Results of Environmental Regulation and Water Pollution in Basins

Table 4 presents the overall ratings of the orderliness of environmental regulation and water pollution systems throughout the several provinces within the basin. The level of organization in the environmental regulation and water pollution systems in the provinces within the basin has shown a consistent upward trend during the study period. This indicates that enforcing environmental regulations and managing water pollution have yielded increasingly noticeable outcomes. From an environmental regulatory standpoint, the regulation of the entire basin exhibits a fluctuating increasing trajectory through time, with the index findings indicating a pattern of “downstream > midstream > upstream”. Despite having a smaller index in the upper basin compared to the middle and lower reaches, the growth rate in the upper basin surpasses that of the middle and lower reaches. In 2018, the environmental regulation index in the upper basin was 0.16, exhibiting a substantial growth rate of 45.5% compared to 2006. In contrast, the middle reaches experienced a 25% increase in the environmental regulation index, while the lower reaches saw a 12% increase. The upper basin has historically implemented lenient environmental regulations to promote economic growth, attract firms, and facilitate economic development. To promote their economic growth, the upper regions of the basin have historically adopted lenient environmental regulations to attract businesses to establish operations. Over time, they have come to recognize the significance of the ecological environment in economic development, leading to a continuous enhancement of environmental measures. The environmental regulation indexes of Henan in the upstream region, Hebei in the midstream region as well as Jiangsu, Shandong, and Guangdong in the downstream region all exceed 0.45. This suggests that the respective local governments have been intensifying their efforts to comply with environmental regulations, considering their unique development circumstances. They aim to achieve a harmonious and integrated approach to economic development objectives and environmental protection mandates.
Implementing environmental regulation laws has benefitted the basin’s water environmental pollution management. As a result, the orderliness score of the water environmental pollution system is generally more significant compared to the environmental regulation system. The water environment pollution index exhibits a rising trajectory over time in various basin regions, including the upper, middle, and lower reaches. Specifically, in 2018, the index surpassed 0.9 in Chongqing, Gansu, and Ningxia in the upper basin area, Guangxi in the middle, and Beijing and Tianjin in the lower reaches. In contrast to the outcomes of the environmental regulatory framework, the water environment pollution index exhibits a spatial pattern characterized by “upstream > midstream > downstream”. For instance, in 2018, the indices for the basin’s upstream, midstream, and downstream areas were recorded as 0.85, 0.84, and 0.81, respectively. This indicates that water environment pollution remains predominantly concentrated in the middle and lower sections of the basin, while the upper basin exhibits the highest environmental quality. The upper basin exhibits the highest level of performance, followed by the middle basin, while the lower basin demonstrates comparatively weaker performance. However, the disparity between these three basins has been diminishing over time. For instance, in 2006, the discrepancy in terms of orderliness between the upper and lower basins was 0.15, which was subsequently reduced to 0.04 in 2018. This trend suggests that the downstream regions increasingly prioritize water pollution prevention and control, thereby gradually closing the gap between the upper and middle basins.

3.2. Spatial Correlation Test Results

The basin traverses various provinces, and a geographical interdependence exists between environmental regulation and water environmental contamination systems. By comparing global spatial correlation outcomes between water environmental pollution and the environmental regulation system within the basin under various matrices, it is evident that Moran’s I index for both variables exhibits similar patterns. Specifically, positive correlations are observed under W1, W2, and W4. Moreover, a significance level of 1% is surpassed in most years throughout the study period. Notably, a trend of initial increase followed by subsequent decrease is observed. An analysis was conducted using LISA agglomeration maps to further examine the environmental regulation system’s local spatial autocorrelation properties. These maps illustrate the degree of agglomeration for the environmental regulation index and the water environmental pollution index across four different matrices in 2008 and 2016, as depicted in Figure 4 and Figure 5. The findings indicate that environmental regulation and water pollution are pronounced basin attributes. Environmental regulation tends to concentrate in downstream areas, whereas water pollution tends to concentrate in upstream areas.

3.3. Benchmark Model Regression Results

This study conducts a static and dynamic panel regression analysis to examine the relationship between environmental regulation and water pollution in basins. The findings of this analysis are presented in Table 5. In general, static and dynamic models of the environmental regulations demonstrate a “U”-shaped relationship, which implies a specific threshold value for the impact of environmental regulation on water pollution. When the intensity of environmental regulation surpasses this threshold value, it leads to a positive effect on reducing water pollution. However, it is worth noting that only a few provinces and municipalities have exceeded this threshold value.

3.4. Spatial Spillover Effects

Spatial and temporal spillover effects refer to the phenomenon where the impacts or influences of a particular event, policy, or phenomenon extend beyond its immediate spatial and temporal boundaries. This study examines the impact of environmental regulation on water pollution within a specific basin. Specifically, we aim to evaluate environmental regulation’s static spatial spillover effect on water pollution within this basin. The SAR, SEM, and SDM models were selected for sequential measurements. These models are chosen because they all exhibit the spatial interdependence of variables and their spatial restrictions and evolution. Consequently, it is necessary to subject them to testing. The LM test clarifies the imperative nature of employing spatial econometric models. In this context, the SAR model is more favorable than the SEM model.
Additionally, the Hausman test leads to the adoption of a fixed effects model. The models were compared based on their r2, log-L, and AIC values. Additionally, the Chi2 statistic of the chi-squared test was used to determine whether the SDM model degenerated into the SAR or SEM model. As a result, the time-fixed model of the SDM model was ultimately chosen to analyze the spillover effect. The measurement findings of both the SAR and SDM models are shown in Table 6.

3.5. Time-Lag Effects in Spatial Spillover Models

Given the dynamic nature of water environment pollution in basins, it is imperative to incorporate a time-lag term (LS) into the water environment pollution index. This inclusion allows for a more comprehensive examination of the dynamic spatial spillover effect of water environment pollution in basins, particularly in the context of environmental regulations. We can obtain empirical findings that align closely with the situation and possess enhanced reliability. The study employs the SDM model with time-fixed effects and presents the measurement outcomes for various spatial matrices in Table 7. The results indicate that W2 demonstrates a more pronounced influence in the time-lagged effect model. The lagged terms of the water environment pollution index exhibited positive values and demonstrated statistical significance at 1%. This suggests a positive relationship between initial pollution intensity and subsequent pollution severity, indicating that water environment pollution is a cumulative and ongoing phenomenon.

4. Discussion

4.1. Heterogeneity of Environmental Regulations on Basin Water Pollution

The potential impact of environmental management regulations on water pollution within a basin may vary due to the diverse standards throughout different locations. Consequently, a reassessment of the impacts of environmental control at the local level was conducted, considering the characteristics of the basin both upstream and downstream. The findings of this assessment are presented in Table 8. The relationship between environmental regulations and water environment pollution exhibits a “U”-shaped pattern across the upstream (U), midstream (M), and downstream (D) regions. The respective thresholds for this relationship are 0.318, 0.331, and 0.390. This suggests that the impact of intensified environmental regulations on the mitigation of water environment pollution is most pronounced in the upstream area of the basin, followed by the midstream area. However, the effects on water environment quality in downstream areas may vary, indicating potential heterogeneity. The downstream region has the greatest need for increased local control intensity to enhance the quality of the water environment. In the upper and middle reaches of the basin, the regression coefficients for environmental regulations and their squared term demonstrate statistical significance at 1%.
The regression coefficients are relatively small in the lower reaches and only exhibit statistical significance at 10%. This suggests that the impact of environmental regulations is more pronounced in the upper and middle reaches of the basin. In contrast to the upper and middle reaches of the basin, the downstream region exhibits notable economic growth, a clustering of large-scale enterprises, heightened water consumption and sewage discharge during production, and intricate interconnections among industrial chain entities. Consequently, the local government’s formulation of environmental regulatory measures becomes more challenging in this context.
Additional analysis of the effects of various subsystems of environmental regulations both upstream and downstream of the basin revealed that only the aggregate and governance subsystems exhibited statistical significance. In light of spatial limitations, this study exclusively presents the findings of these two subsystems of environmental regulations. From the standpoint of the comprehensive environmental regulation (R1), the influence on the water pollution index of the basin exhibits a “U”-shaped relationship. However, only the upper and middle sections of the basin demonstrate statistically significant coefficients of 10% or higher. This suggests that the comprehensive approach to regulation is more suitable for the upper and middle sections of the basin. Opening up to external influences and decentralizing local finances are negatively correlated, hindering the basin’s development. The presence of a negative association is not helpful to the enhancement of the quality of the water environment. From a governance perspective, there is a weak “U”-shaped relationship between water pollution and the environmental regulations in the downstream area of the river basin. This can be attributed to the consistent flow pattern of the river, which moves from the west to the east. Consequently, water pollutants originating from the upstream areas are transferred downstream, thereby diminishing the impact of local environmental regulation efforts in the downstream region of the basin. The efficacy of such environmental restrictions is diminished due to the diminished local authority in the lower section of the basin. In the industrial production process, the downstream areas of the basin typically employ more sophisticated wastewater governance technology. Additionally, the punishment measures for pollution prevention in these areas are more stringent. The escalating environmental regulation within the governance category signifies a heightened focus from local governments on pollution prevention and control. When the intensity of environmental regulations surpasses a certain threshold, their impact on improving water pollution downstream of the basin becomes evident in terms of effectiveness.

4.2. Differences in Spatial Effects between Local and Neighboring Perspectives

From a local perspective, when comparing the outcomes of the four spatial matrices, it is observed that the regression coefficient for environmental regulations on local water pollution is negative. However, the regression coefficient for the square term of the environmental regulations is positive. This suggests that exceeding a certain threshold of environmental regulations’ intensity has a positive effect and improves local water pollution. Additional analysis of the model outcomes reveals that the thresholds of environmental regulations across the four matrices are 0.376, 0.332, 0.413, and 0.319. This indicates that the initial impact of enhancing the intensity of environmental regulations is most pronounced under W4. The observed spatial distribution pattern of industrial water environmental pollution is primarily attributed to disparities in water resources among provinces within the basin and the migration cost associated with geographical distance. Overall, augmenting the intensity of environmental regulations tends to yield positive effects on mitigating local water environmental pollution, particularly when considering the influence of geographical distance. In a broad sense, it can be observed that as the stringency of local environmental regulations escalates, nearby regions characterized by proximity and ample water resources tend to attract polluting industries as their preferred location. Consequently, the implementation of environmental regulations yields a favorable outcome in terms of mitigating local water pollution.
From a neighborhood effect perspective, implementing environmental regulations in various spatial contexts can be understood as reflecting the presence of heterogeneity. This heterogeneity is captured using W1 and W4. The coefficient of influence on the water environment pollution index of neighboring areas is 0.18 and 0.82, respectively, and these coefficients were determined to be statistically significant at the levels of 5% and 10%. This suggests that the predominant environmental regulatory system is characterized by government-led command-type measures, particularly regulations that focus on the total quantity and quality. These regulations are designed to account for the unique characteristics of regional differentiated development. This phenomenon can be attributed to the dominance of government-led command-based regulatory measures within the environmental regulatory system. Specifically, these measures encompass total quantity and quality regulations designed at the top level to consider the characteristics of regional differentiated development. In regions with similar or neighboring water resources endowment, where high water pollution damage is prevalent, a “do not be in my backyard” strategy may emerge. For instance, downstream areas of the basin may adopt synchronized planning of environmental standards to maintain consistency. Additionally, the implementation of local environmental regulatory policies can have a radiating effect on the local environment, enabling the enforcement of local environmental policies. The enforcement of local environmental regulations can have an impact on the industrial chain enterprises in neighboring areas, leading to a reduction in their ability to transfer and reduce governance costs.
Additionally, the negative coefficients in W2 and W3 suggest the possibility of pollution transfer between upstream and downstream areas of the basin. It should be mentioned that the ongoing relocation of industries from central and western regions has altered the distribution of water pollution. According to W2, W3, and W4, the coefficients representing the impact of foreign openness and local financial decentralization on the water environment pollution index in the peripheral region are negative. These coefficients were tested and are statistically significant at 1%. In other words, increasing these two indexes worsens the water environment pollution in the peripheral region. In a broad sense, multinational corporations can relocate certain environmentally detrimental stages of production to developing nations through outward foreign direct investments (OFDIs). Consequently, the water pollutants generated during these production stages can contaminate the local water environment and potentially spread to adjacent regions along river systems, compromising the water environment in those areas. Likewise, the investment in local industrial fixed assets can adversely affect water pollution in nearby regions. This can be observed through W2, where a 1% rise in the proportion of regional industrial fixed assets in the overall assets leads to a corresponding 1.64% increase in the severity of water environment pollution in neighboring areas.

4.3. Neighbor Avoidance Effect

The link between the local water pollution index and environmental regulation exhibits a “U”-shaped pattern, albeit statistically significant at 10%. This outcome is likely attributed to the temporal lag between creating and implementing environmental control legislations. It is worth mentioning that the impact of environmental regulations on the water pollution index of nearby areas is notably negative. This is evident from the coefficients of −0.38 and −0.43 obtained from W2 and W3, respectively. These coefficients align with the static spatial spillover effect’s findings and demonstrate statistical significance at 5%. In other words, when accounting for the time-lag effect, the relationship between environmental regulations and water pollution exhibits a “U”-shaped pattern, albeit statistically significant at 10%. After considering the time-lag effect, a common occurrence in the water pollution pattern under regulation is the presence of neighbor avoidance. This phenomenon can be attributed to two main factors.
When a region increases its level of environmental regulations, there is a noticeable economic disparity among regions with different basin attributes. Consequently, local governments in other regions may engage in a strategic behavior known as “competition at the bottom.” This involves setting relatively lower environmental regulation standards to attract businesses to relocate to their area. However, it is essential to note that neighboring regions may employ a strategy commonly known as “not in my backyard” despite having similar water resource endowments and proximity. This strategy involves raising polluting industry standards to encourage the transition towards a cleaner industrial structure.
Nevertheless, if this heightened environmental regulation fails to stimulate advancements in pollution control technology within enterprises’ production processes, the long-term impact on pollution reduction may prove unsatisfactory.

5. Conclusions and Policy Implications

The presence of stringent environmental regulations beyond a specific threshold fosters the enhancement of the local water environment. These regulations first impact the upstream region of the basin, demonstrating a characteristic pattern of neighbor avoidance over an extended period. Therefore, this study examines the regional spillover impacts of river basin environmental rules on water pollution’s spatial and temporal aspects, using the mandatory regulations implemented in China’s essential river basins as the framework. Furthermore, this study establishes a comprehensive basin environmental regulation system called the “four-in-one” system, which encompasses total quantity, quality, project, and governance aspects. The system’s organization is assessed, and its spatial correlation is examined. Four matrices are constructed to analyze the environmental regulations of water pollution control within basins and investigate the regulations mentioned above.
The findings of the orderliness measure reveal a consistent improvement in the orderliness of the environmental regulations of basins and water environment pollution systems across each province in the basin over the years. This suggests that implementing environmental regulation policies and controlling water environment pollution have yielded increasingly noticeable outcomes in recent times. Furthermore, it is noteworthy that the orderliness score of the water environment pollution system surpasses that of the environmental regulation system overall, indicating a more pronounced enhancement in addressing water environment pollution. The findings of the spatial correlation analysis indicate a positive relationship between the environmental control of the basin and the water environment pollution index across the neighbor weight matrix (W1), geographic distance weight matrix (W2), and water resources flow distance weight matrix (W4).
The examination of the spatial spillover impact of environmental regulations on water environment management reveals that, in terms of the “local effect”, when the intensity of environmental regulations surpasses a specific threshold, it yields a favorable influence on the water environment. This is advantageous for ameliorating the local water pollution situation. The enhancement effect is most pronounced in the upstream areas of the basin, followed by the middle reaches of the region. The downstream areas exhibit the highest requirements for local regulation intensity to enhance the water environment’s quality. From the “neighborhood effect,” the influence coefficients of environmental regulation on the water pollution index in neighboring regions are determined to be 0.18 and 0.82, respectively, based on W1 and W4. These coefficients have been subjected to significance level tests at 5% and 10%, respectively. The results indicate that implementing local environmental policies can positively impact the surrounding areas’ water pollution situation. Adopting this initiative is expected to have a spillover effect on the surrounding regions, resulting in immediate favorable outcomes in terms of governance.
This study examines the time-lag effect of controlling basin water environment pollution under environmental regulations, and considers this issue’s dynamic and evolving nature. Upon inclusion of the lag factors of the water environment pollution index, it was observed that the coefficients associated with these lag terms exhibited positive values and successfully surpassed the threshold of statistical significance at 1%. This implies that water environment pollution within basins is an ongoing and cumulative process. The time-lag effect under W2 exhibits the highest level of significance when compared to other matrices. Over time, the impact of basin environmental control on water pollution exhibits a “U”-shaped relationship in terms of the local effect. However, this relationship demonstrates statistical significance at 10%. Additionally, the adjacent effect displays a coefficient with the same sign as the local effect. The influence coefficient of the “neighborhood effect” exhibits a statistically significant negative value. Specifically, the coefficient values are −0.38 and −0.43 when considering W2 and W3, respectively. These findings indicate that increasing the intensity of environmental regulations does not lead to long-term improvements in the water environment of neighboring areas. Consequently, these results support the validity of the “pollution refuge” hypothesis. Thus, these findings provide evidence supporting the idea of a “pollution refuge.”

Author Contributions

Conceptualization, M.L. and S.Z.; data curation, S.Z. and M.L.; writing—original draft preparation, M.L. and S.Z.; writing—review and editing, P.J. and M.L.; funding acquisition, M.L.; methodology, P.J. All authors have read and agreed to the published version of the manuscript.

Funding

This research received no external funding.

Data Availability Statement

The data presented in this study are available in this published article. Research on the spatial spillover effect of water environment pollution control in basins based on environmental regulation”.

Conflicts of Interest

The authors declare no conflict of interest.

References

  1. Ministry of Ecology and Environment of the People’s Republic of China. Water Pollution Control Action Plan (WPCAP). Available online: https://www.mee.gov.cn/gkml/sthjbgw/qt/201504/t20150416_299173.htm (accessed on 16 April 2015).
  2. Ministry of Agriculture and Rural Affairs of the People’s Republic of China. Law of the People’s Republic of China on the Protection of the Yangtze River. Available online: http://www.zfs.moa.gov.cn/flfg/202104/t20210425_6366540.htm (accessed on 26 December 2020).
  3. Jing, P.R.; Sheng, J.B.; Hu, T.S.; Mahmoud, A.; Guo, L.D.; Liu, Y.; Wu, Y.T. Spatiotemporal evolution of sustainable utilization of water resources in the Yangtze River Economic Belt based on an integrated water ecological footprint model. J. Clean. Prod. 2022, 358, 132035. [Google Scholar] [CrossRef]
  4. Wang, B.B.; Li, X.Y. Regional Transboundary Pollution Management in China: Institutional Framework and Progress of Change. Soc. Sci. Res. 2023, 2, 97–108. [Google Scholar]
  5. Jin, G.; Shen, K.R.; Li, J. The Transboundry Pollution Consequences of Land-Driven Development Mode. China Ind. Econ. 2022, 3, 95–113. [Google Scholar]
  6. Xu, R.W. Study on Governance Mechanism of Transboundary Water Pollution in River Basins: Analysis Based on Differential Game Theory; Wuhan University: Wuhan, China, 2021. [Google Scholar]
  7. Jing, P.R.; Hu, T.S.; Sheng, J.B.; Mahmoud, A.; Liu, Y.; Yang, D.W.; Guo, L.D.; Li, M.X.; Wu, Y.T. Coupling coordination and spatiotemporal dynamic evolution of the water-energy-food-land (WEFL) nexus in the Yangtze River Economic Belt, China. Environment. Environ. Sci. Pollut. Res. 2023, 30, 34978–34995. [Google Scholar] [CrossRef]
  8. Li, G.P.; Wang, Y.Q. Tragedy of the Commons’ Theory and Empirical Study in the Transboundry Water Pollution Treatment. Soft Sci. 2016, 30, 24–28. [Google Scholar]
  9. Jiang, K.; You, D.M. Study on differential game of transboundry pollution control under regional ecological compensation. China Popul. Resour. Environ. 2019, 29, 135–143. [Google Scholar]
  10. Markusen, J.R. International Externalities and Optimal Tax Structures. J. Int. Econ. 1975, 5, 15–29. [Google Scholar] [CrossRef]
  11. Copeland, B.R.; Scott, T.M. North-South Trade and the Environment. Q. J. Econ. 1994, 109, 755–787. [Google Scholar] [CrossRef]
  12. List, J.A.; Millimet, D.L.; Fredriksson, P.G.; McHone, W.W. Effects of Environmental Regulations on Manufacturing Plant Births: Evidence from a Propensity Score Matching Estimator. Rev. Econ. Stat. 2003, 85, 944–952. [Google Scholar] [CrossRef]
  13. Hanna, R. US Environmental Regulation and FDI: Evidence from a Panel of US-based Multinational Firms. Am. Econ. J. Appl. Econ. 2010, 2, 158–189. [Google Scholar] [CrossRef]
  14. Davis, L.W.; Kahn, M.E. International Trade in Used Vehicles: The Environmental Consequences of NAFTA. Am. Econ. J. Econ. Policy 2010, 2, 54–82. [Google Scholar] [CrossRef]
  15. Smarzynska, B.K.; Wei, S.J. Pollution Havens and Foreign Direct Investment: Dirty Secret or Popular Myth? BE J. Econ. Anal. Policy 2005, 3, 1244. [Google Scholar]
  16. Fowlie, M.L. Incomplete Environmental Regulation, Imperfect Competition, and Emissions Leakage. Am. Econ. J. Econ. Policy 2009, 1, 72–112. [Google Scholar] [CrossRef]
  17. Kheder, S.B.; Zugravu, N. Environmental Regulation and French Firms Location Abroad: An Economic Geography Model in an International Comparative Study. Ecol. Econ. 2012, 77, 48–61. [Google Scholar] [CrossRef]
  18. Karkalakos, S. Capital Heterogeneity, Industrial Clusters and Environmental Consciousness. J. Econ. Integr. 2010, 25, 353–375. [Google Scholar] [CrossRef]
  19. Li, Y.G.; Zhang, P. Have Industrial Agglomeration Aggravated Regional Environmental Pollution—Chinese Provincial Level Empirical Evidence. J. Huazhong Univ. Sci. Technol. 2013, 27, 97–106. [Google Scholar]
  20. Zeng, D.Z.; Zhao, L.X. Pollution Havens and Industrial Agglomeration. J. Environ. Econ. Manag. 2009, 58, 141–153. [Google Scholar] [CrossRef]
  21. Chen, J.J.; Hu, C.G. Agglomeration Effect of Industrial Clustering—Theoretical and Empirical Analysis on the Case of Yangtze River Delta Subregion. J. Manag. World 2008, 6, 68–83. [Google Scholar] [CrossRef]
  22. Qin, B.T.; Ge, L.M. Relative environmental regulations, pollution-intensive industry transfer and pollution agglomeration in China. China Popul. Resour. Environ. 2018, 28, 52–62. [Google Scholar]
  23. Xia, Y.F. Research on the Status Quo, Consequences and Countermeasures of Foreign Investment in China’s Pollution-intensive Industries. J. Manag. World 1999, 3, 109–123. [Google Scholar]
  24. Dou, J.M.; Shen, Y.B. On the Influence of the Industrial Transfer on the Environment in the Central Region of China. China Popul. Resour. Environ. 2014, 24, 96–102. [Google Scholar]
  25. Shen, Y.; Ren, Y.X. Spatial spillover effect of environmental regulations and inter-provincial industrial transfer on pollution migration. China Popul. Resour. Environ. 2021, 31, 52–60. [Google Scholar]
  26. Zhang, C.Y.; Guo, C.Y.; Guo, Y.Q. Can Pollution-intensive Industry Transfer Achieve Win-win Development in Economy and Environment? From the Perspective of Environmental Regulation. J. Financ. Econ. 2015, 41, 96–108. [Google Scholar]
  27. Wang, R.X.; Guo, L.B. Environment Regulation and Transfer of Pollution-intensive Industries—An Empirical Research Based on Central China. J. Cent. South Univ. For. Technol. 2018, 12, 33–38. [Google Scholar]
  28. Porter, M.E.; Vander, L.C. Toward a New Conception of the Environment Competitiveness Relationship. J. Econ. Perspect. 1995, 9, 97–118. [Google Scholar] [CrossRef]
  29. Yang, F.X.; Nie, H.L.; Yang, M. Study on the Environmental Effect by China’s Economic Development: Empirical Analysis Based on GIRF. J. Financ. Econ. 2010, 36, 133–143. [Google Scholar]
  30. Huang, J.; Wang, M.J. Technological Innovation, Industrial Agglomeration and Environmental Pollution. J. Shanxi Univ. Financ. Econ. 2016, 38, 50–61. [Google Scholar]
  31. Wang, L.J.; Lv, J.J. Analysis of social welfare effect of environment regulation policy based on market structure perspective. China Popul. Resour. Environ. 2020, 30, 81–89. [Google Scholar]
  32. Xie, R.H. Green Technology Progress, Positive Externality and Environment Pollution Control of China. Manag. Rev. 2021, 33, 111–121. [Google Scholar]
  33. Tian, D.W.; Jiao, Y. Analysis on How Factors Determines Foreign Investment Distribution in Pollution-intensive Industries of China. J. Int. Trade 2006, 91, 120–124. [Google Scholar]
  34. Fu, J.Y.; Li, L.S. A Case Study on the Environmental Regulation, the Factor Endowment and the International Competitiveness in Industries. J. Manag. World 2010, 10, 87–98. [Google Scholar]
  35. Liu, L.R. Spillover Effects across Environmental Programs: The Case of Hazardous Waste Regulation in Michigan. Environ. Econ. 2012, 3, 35–43. [Google Scholar]
  36. Jiang, L.L.; Sen, M.; Zhu, Y. The Effect of Environmental Regulation on Industrial Pollution and Industrial Activities: Evidence from China. Work. Pap. SSRN 2013. [Google Scholar] [CrossRef]
  37. Färe, R.; Grosskopf, S. Modeling Undesirable Factors in Efficiency Evaluation: Comment. Eur. J. Oper. Res. 2004, 157, 242–245. [Google Scholar] [CrossRef]
  38. Crafts, N. Regulation and Productivity Performance. Oxf. Rev. Econ. Policy 2006, 22, 186–202. [Google Scholar] [CrossRef]
  39. Bian, Y.W. Eco-efficiency evaluation of non-cooperative game two-stage production system. J. Manag. Sci. China 2012, 15, 11–19. [Google Scholar]
  40. Wang, Y.S.; Xu, H.; Bian, Y.W. Industrial Water Use System Efficiency Evaluation: A Two-stage DEA Model Considering Pollutants Disposability. Chin. J. Manag. Sci. 2016, 24, 169–176. [Google Scholar]
  41. Li, W.M.; Zhu, S.; Wang, C.B. Investigation on the Phenomenon of Migration and Expansion of Private Enterprises–Taking Yueqing, Zhejiang Province as an Example. Econ. Probl. 2004, 9, 30–32. [Google Scholar] [CrossRef]
  42. Zhang, L. Yichang: From “Chemical Surrounding the River” to “Porpoise Surfing the Waves”. China Environment News, 12 October 2022. [Google Scholar]
  43. Shen, J.; Wei, C. Relocation Mechanisms of the Ceramics Industry Impact by the Environmental Regulations in Foshan City. Acta Geogr. Sin. 2012, 67, 467–478. [Google Scholar]
  44. Costello, A.M. Mitigating Incentive Conflicts in Inter-firm Relationships: Evidence from Long-term Supply Contracts. J. Account. Econ. 2013, 56, 19–39. [Google Scholar] [CrossRef]
  45. Tang, X.B.; Liu, C.G. Study on the Exit and Compensation Mechanism for Heavily Polluting Enterprises in Xiangjiang River Basin. Econ. Rev. J. 2010, 7, 107–110. [Google Scholar]
  46. Qiu, J.L.; Pan, A.L.; Zhang, G.Z. Formal Environmental Regulation, Informal Environmental Regulation and Green Mergers and Acquisitions by Heavy Polluters. Soc. Sci. Guangdong 2018, 2, 51–59. [Google Scholar]
  47. Bettis, R.A.; Bradley, S.P.; Hamel, G. Outsourcing and Industrial Decline. Acad. Manag. 1992, 6, 7–22. [Google Scholar] [CrossRef]
  48. Shen, J.; Xiang, C.; Liu, Y.Y. The mechanism of pollution-intensive industry relocation in Guangdong Province, 2000~2009. Geogr. Res. 2012, 31, 357–368. [Google Scholar]
  49. Guo, Y.M.; Liu, H. The reality of the depth of the pain of pollution control: The transfer of polluting enterprises “east pollution west”. China News, 28 August 2007. [Google Scholar]
  50. Wang, C.; Yang, Y.; Zhang, J.J. China’s Sectoral Strategies in Energy Conservation and Carbon Mitigation. Clim. Policy 2015, 15, 60–80. [Google Scholar] [CrossRef]
  51. Xu, M.; Zhang, T.; Wang, D.; Zhao, Y.; Xie, Y.C.; Ma, L.K. Review and Prospect of Water Pollution Prevention and Control of China in the Forty Years of Reform and Opening-up. Chin. J. Environ. Manag. 2019, 11, 65–71. [Google Scholar]
  52. York, R.; Rosa, E.A.; Dietz, T. STIRPAT, IPAT and ImPACT: Analytic Tools for Unpacking the Driving Forces of Environmental Impacts. Ecol. Econ. 2003, 46, 351–365. [Google Scholar] [CrossRef]
  53. Anselin, L. Spatial Econometrics: Methods and Models; Kluwer Academic: Dordrecht, The Netherlands, 1988. [Google Scholar] [CrossRef]
  54. Elhorst, J.P. Specification and Estimation of Spatial Panel Data Models. Int. Reg. Sci. Rev. 2003, 26, 244–268. [Google Scholar] [CrossRef]
  55. Zeng, W.H. Regulation on Trans-boundary Water Pollution: A Study on Inter-judiciary River-basin Pollution in China. China Econ. Q. 2008, 7, 447–464. [Google Scholar]
  56. ISO 13503-2; Environmental Quality Standards for Surface Water. Available online: https://cjjg.mee.gov.cn/zsyd/kjbz/202303/t20230308_1018891.html (accessed on 22 October 2023).
Figure 1. Schematic diagram of the flow of elements of the basin industrial production and discharge system and the water environment management system.
Water 15 03745 g001
Figure 2. The analytical framework of this study.
Water 15 03745 g002
Figure 3. Classification of provinces based on basin attributes.
Water 15 03745 g003
Figure 4. LISA clustering of environmental regulation indices in 2008 and 2016.
Water 15 03745 g004
Figure 5. LISA clustering of water environmental pollution indices in 2008 and 2016.
Water 15 03745 g005
Table 1. Environmental Regulation Indicator System.
Criterion LayerEvaluation IndexUnit
R1: Overall amountRc: Total chemical oxygen demand reduction 10,000 tons
Rn: Total ammonia nitrogen emission reduction10,000 tons
R2: QualityRg: Number of surface water environmental monitoring sections10,000 tons
Rm: Number of key monitoring enterprises in the water environment/
R3: ProjectRh: Amount of investment in Environmental Impact Assessment System Declaration Project CNY 100 million
Rs: Investment in environmental protection works for “three simultaneous” projectsCNY 100 million
R4: GovernanceRt: Number of industrial wastewater governance facilities/
Ri: Investment in industrial wastewater governanceCNY 100 million
Note: CNY denotes Chinese Yuan.
Table 2. Basin Water Environment Pollution Indicator System.
Criterion LayerEvaluation IndexUnit
Scale of water pollutionWP1: Industrial wastewater discharge100 million tons
WP2: Industrial COD emissions10,000 tons
WP3: Industrial ammonia emissions10,000 tons
Quality of the water environmentWQ1: Type of water quality/
WQ2: Permanganate levelmg/L
WQ3: Ammonia nitrogen levelmg/L
Table 3. Typical discharge provinces in the major basins.
BasinsTypical Discharge Provinces
Yangtze River BasinYunnan, Guizhou, Sichuan, Chongqing, Hunan, Hubei, Jiangxi, Anhui, Zhejiang, Jiangsu, Shanghai
Yellow River BasinNingxia, Sichuan, Qinghai, Gansu, Shanxi, Shaanxi, Henan, Shandong, Neimenggu
Pearl River BasinYunnan, Guangxi, Guangdong
Huaihe River BasinHenan, Shandong, Anhui, Jiangsu
Haihe River BasinHenan, Shandong, Shanxi, Hebei, Tianjin, Beijing
Liao River BasinLiaoning, Neimenggu
Songhua River BasinHeilongjiang, Jilin, Neimenggu
Table 4. Orderliness results of the basin environmental regulation and water pollution system from 2006 to 2018.
Year2006201020142018
IndexRSRSRSRS
Neimenggu0.090.750.110.770.070.760.190.83
Henan0.330.450.350.570.290.670.470.82
Chongqing0.090.790.110.860.050.890.100.90
Sichuan0.160.640.160.740.160.840.270.89
Guizhou0.060.800.060.810.060.770.090.80
Yunnan0.100.940.140.750.120.770.170.85
Gansu0.070.800.080.880.370.830.080.91
Qinghai0.010.770.020.790.130.750.030.77
Ningxia0.050.740.060.870.350.860.020.90
Hebei0.400.400.460.580.340.740.570.84
Shanxi0.160.520.200.610.090.700.200.78
Jilin0.090.680.110.770.080.790.060.84
Anhui0.090.590.100.670.110.720.240.81
Jiangxi0.090.770.100.780.080.800.140.84
Hubei0.160.740.160.770.150.810.230.89
Hu ’nan0.160.600.200.720.130.740.190.87
Guangxi0.210.530.290.630.090.830.090.90
Shaanxi0.080.610.190.600.370.670.090.83
Beijing0.070.780.080.930.030.940.040.92
Tianjin0.050.730.080.850.060.840.060.90
Liaoning0.200.500.160.710.280.760.220.83
Heilongjiang0.160.670.190.770.220.770.160.84
Shanghai0.130.730.100.700.120.790.140.85
Jiangsu0.440.390.470.500.250.570.530.69
Zhejiang0.310.500.370.520.240.610.330.74
Shandong0.330.470.430.520.310.600.520.73
Guangdong0.530.550.540.600.300.600.480.75
Mean0.170.640.200.710.180.760.210.83
Standard Deviation0.130.140.140.120.110.090.160.06
Note: R and S represent the overall ratings of the orderliness of environmental regulation and water pollution system, respectively.
Table 5. Regression results of the static and dynamic model of environmental regulations on water pollution in the basin.
VariableStaticDynamicR1R2R3R4
L.S 0.55 ***
REG21.03 ***0.42 ***0.16 ***1.11 ***−0.020.17 **
REG−0.62 ***−0.26 ***−0.18 ***−0.69 ***0.02 *−0.21 ***
Constant−0.57−0.471.08−0.260.730.98
r20.660.770.630.650.620.63
Note: *** p < 0.01, ** p < 0.05, * p < 0.1.
Table 6. Test results of the spatial spillover effect of environmental regulations on water pollution in the basin.
VariableW1W2W3W4VariableW1W2W3
SARSDMSARSDM SARSDMSAR
REG21 ***1.05 ***0.99 ***1.04 ***REG21 ***1.05 ***0.99 ***
REG−0.6 ***−0.79 ***−0.6 ***−0.69 ***REG−0.6 ***−0.79 ***−0.6 ***
W×REG 0.18 ** −0.21W×REG 0.18 **
r20.350.750.340.74r20.350.750.34
Log-L615.82652.95621.53652.95Log-L615.82652.95621.53
AIC−1199.65−1249.90−1211.07−1249.90AIC−1199.65−1249.90−1211.07
Note: *** p < 0.01, ** p < 0.05.
Table 7. Test results of the time-lag effect of water pollution in basins under environmental regulations.
VariableW1W2W3W4
L.S0.82 ***0.79 ***0.87 ***0.82 ***
REG20.110.140.060.16
REG−0.09 *−0.11 *−0.06 *−0.12 **
W*REG−0.09 **−0.38 ***−0.43 **−0.22 *
r20.900.550.530.65
Log-L624.64669.58651.72662.61
AIC−1272.14−1281.17−1245.45−1267.23
Note: *** p < 0.01, ** p < 0.05, * p < 0.1.
Table 8. Results of environmental regulations based on basin attributes on water pollution in the basin.
VariableUMDU-R1M-R1D-R1U-R4M-R4D-R4
REG21.18 ***1.18 ***0.41 *0.24 *0.21 ***−0.02−1.62 ***0.420.13
REG−0.75 ***−0.78 ***−0.32 *-0.19 *−0.21 **−0.020.69 **−0.4−0.17 *
Constant−0.25−1.81−3.4 ***0.93−0.1−4.3 ***1.120.68−2.96 **
r20.690.830.910.640.800.910.670.800.91
Note: *** p < 0.01, ** p < 0.05, * p < 0.1.
Disclaimer/Publisher’s Note: The statements, opinions and data contained in all publications are solely those of the individual author(s) and contributor(s) and not of MDPI and/or the editor(s). MDPI and/or the editor(s) disclaim responsibility for any injury to people or property resulting from any ideas, methods, instructions or products referred to in the content.

